Embed Size (px)
DESCRIPTION
basic creep
Citation preview
Z. P. BAZANT - L. PANULA
Part II: Basic creep
The double power law, which was previously shown to be capable ofrepresenting test data quite closely, is here developed as a model for practical prediction of creep at constant humidity and temperaturefrom the composition of concrete mix, strength, age at loading and load duration. Extensive supporting comparisons with test data from the literature are given.
INTRODUCTION
Time-dependent deformations of concrete at constant temperature may be subdivided into a loadindependent part, called shrinkage, and a loaddependent part, called creep. Prediction formulas for shrinkage have been dealt with in Part I, and the prediction formulas for creep at constant humidity and temperature, called basic creep, will now be the object of our attention.
In setting up a prediction model for creep, two levels of sophistication and complexity may be distinguished, depending on the treatment of humidity and size effects:
(a) the most simple model is obtained when the time shape of the creep curves is considered to be the same for basic creep and drying creep, in which case the effects of humidity and size are introduced merely by multiplicative correction factors which scale the creep curve vertically;
(b) physically more correct, but also less simple, is to recognize that the time-shape of the drying creep curves and the basic creep curves is different. This is 'because a drying creep curve is roughly a superposition of the basic creep curve, which is independent of size, and the shrinkage curve, which is strongly dependent on size and also has an entirely different shape and humidity dependence.
All code formulations have thus far taken approach (a), and the best practical model that can be achieved with this approach is probably that of Branson ([35],[35 a)) e), adopted by ACI Committee 209 [35 b]. The time shape in these formulations is a compromise between the shapes of basic and drying creep curves, and thus it gives inevitably some flattening of the creep curve near the end of the log-time scale, which is not true for the basic creep and causes underestimation of the long-time basic creep (mass concrete). Moreover, since the additional drying creep term behaves like shrinkage, the size effect consists in shifting the curve of this additional term left or right in the log-time scale, rather than in scaling the curve of this term vertically. Consequently, the compromise approach (a) inevitably overestimates the long-time drying creep of thick specimens, and underestimates the long-time drying creep of thin specimens. Therefore, approach (b) which was proposed in [4] (and is similar to a proposal made by Wittmann; cf [4)) is adopted herein, even though it cannot be as simple as the compromise approach (a).
Among the existing creep formulations, one may basically distinguish those which try to separate the
(1) Reference numbers not listed at the end of this part are found in the preceding part.
total creep strain in a reversible (delayed elastic) part and an irreversible part (flow), and those which do not. In the latter case a product of a function of age and a function of load duration is usually adopted, which is well supported by tests. The formulation in the new C.E.B. Model Code (1978) is of the former type, while Branson's model (ACI 209) belongs to the latter type, and so does the formulation in the sequel, which may be regarded as a logical refinement of Branson's model once the decision to distinguish between the time shapes of basic creep and drying creep and their disparate humidity and size dependences is made.
FORMULAS FOR BASIC CREEP
Our considerations will now be restricted to linear creep models which follow the principle of superposition in time [5] e). Among various possible simple formulas, the creep function for basic creep can be best approximated by the double power law which was proposed in reference [5] and verified by test data in references [2], [6]. We will introduce here the double power law in the form
J(t, t')= ;0 +Co(t, t'), )
Co(t, t')= f: (t,-m+IX)(t- t')n, )
(11)
which represents a slight generalization of the previously used form,' consisting in the addition of parameter IX that indicates the (theoretical) creep for intinite age at loading; J (t, t') = creep function = strain at time t caused by a unit sustained uniaxial stress acting since time t'; Co(t, t') = specific creep; Eo, CPl, IX, m, n are material parameters. The mean values of exponents m and n are about 1/3 and 1/8.
It is characteristic of the power-type creep law that there exists no final value of creep. Indeed, the test data for basic creep normally rise at constant or increasing slope in . log-time as far as the measurements go. (A decrease in slope near the end of creep curves may be observed in drying creep, but this is due to the superposition of shrinkage curve; see Part Ill) Formulas for basic creep which imply that creep reaches a tinal value have no experimental justification. Moreover, such formulas are generally more complicated. However, although some designers might feel more comfortable if a final creep value were given, the question is largely academic, for the difference between the 50 and 100 year J-values according to equation (11)
317
VOL. 11 - No 65 - MAT~RIAUX ET CONSTRUCTIONS
is only about 8 %. For practical purposes, the 50 year creep value may be called the final one. . Power functions of t - t' as well as t' had been used for the creep function before the double power law was introduced. A strong argument for the power function of t - t' is presented by the activation energy model of Wittmann (cf (4} and (49}). A stochastic process model of creep based on creep mechanism also logically leads to a power function of t- t' 13]. Normally, the power functions of t - t' were fitted to test data only after a certain measured initial strain, corresponding to anywhere between 1 min. and 3 hour load duration, was subtracted from the measured total strains. It appears, however, that the optimum values of m and n are extremely sensitive to the value of the initial strain that is subtracted, and the initial strain lacks, unfortunately, an unambiguous definition. Taking the initial strain as the strain for some load duration between I minute and several hours is illogical because creep curves in log-time are smoothly inclined beginning with extremely short load durations (0.001 second). This also yields a too high value for n (around 1/3 which leads to overprediction oflong time creep by the power curve, as noted in [12].
In introducing the double power law, the basic idea was to exploit the smoothness of the complete creep curves in log-time and to use a formula which would hold not only for the long-time loads (beyond 1 day) but all the way to the shortest load durations. Surprisingly, the increased time range did not require a more complicated formula. By virtue of making Eo much higher than the actual elastic modulus, it allowed the power dependence to be used simultaneously for t - t' and t', and it even caused the creep formula to become simpler, making it possible to do away with a separate formula for the age dependence of initial strain or elastic modulus.
Thus, the conventional static modulus as well as dynamic modulus as functions of age may be expressed also from the double power law, setting t- t' =0.1 day or t- t' = 1O- i day, respectively, in equation (11); ie.
1 1 (' 0 ' -E ') = -E (') =J t + .1. t) (t stat t
Experimentally, from [36]. the ratio Edvn ,' E was found to be about 1.20 and E probably corresponded to t - t' ~ 0.001 day. From the double power law fitted to the data from [36], [9]. [37], [38] .one gets J (28 +0.001. 28)/ J (28 + 10- i, 28) = 1.27. 1.28, 1.28 respectively, which is close enougli and confirms equation (13). The toad duration of t-t'=O.OOI day might be more typical of the duration that corresponds to normally measured initial strains. but 0.1 day gives values which roughly agree with ACI and CEB recommendations; see the curves in figure 13, compared with data points indicating the measured
318
1/ E-values at 28 days of age as reported in the creep data sets used herein.
The standard creep coefficient is obtained from equations (12) and (11) as <p (t, t')=E(t')J(t, t')-1.
It must be emphasized that Eo, called the asymptotic modulus, does not represent an actual modulus for any load duration measured; it represents merely the leftside asymptote of the creep curve in log-time. It seems to be because of this fact that the power laws in t - t' and t' acquire their broad applicability.
The addition of parameter ~ was instrumental for achieving more consistent values of material parameters for various concretes, as compared to the previously used form [6]. Introduction of:l is, of course, not only opportune but also logical because an infinitely old concrete (t' -+ x) should still exhibit creep. However, this is chiefly a theoretical argument for(t,)-m alone (without l:) becomes negligible only well beyond the range of interest.
It is an important property of the double power law that the effect of ageing (i.e. of t') can be controlled independently ofthe shape of the creep function in t - t'. This contrasts with another traditional formulation still in use -the rate-of-creep (or Dischinger) method and its improved versions, in which the elastic modulus is replaced by effective modulus treatment of the so-called reversible creep component ([14]. [39]. [6]). In this formulation. J (t. t') is assumed to be a sum of functions of one variable. which severely limits its capability to fit test data; in particular, the effect of aging (i. e. of t') and the shape of creep curve are tacitly assumed to be described by one and the same function oftime. which is far from the truth. Furthermore, unlike the double power law, this formulation forces J (t, t') to be separated into the so-called reversible (delayed elastic) creep and irreversible creep (flow). This is neither thermodynamically justified in case of an aging material, nor is it supported by test data on creep recovery [40}. And it is not needed for keeping structural creep calculations simple. As far as the fits of the basic creep curves are concerned, this traditional formulation gives a much poorer agreement with test data than the present model (compare the fits in the sequel with those in [41]).
As is well-known from chemical thermodynamics and thermodynamics of mixtures, a time-variable reacting system must be decomposed i.nto i.ts timeinvariable reacting components. Thus. the only correct treatment of reversibility and thermodynamics of aging creep must be based on modeling hydration as volume growth of. or bond formation between. time-invariable components [42].
PROPOSED DEPE~DE~CE ON COMPOSITION Ai~D STRF~GTH
It appeared that not all five material parameters need be considered independently as functions of compositiQn. ~amely. it seems that approximately
1 2 1 2 , - ~~ - =~J( c1 , cd. Eo "E 1 "
(14)
Z. P. BAZANT - l. PANULA
o optimized value l/Eo
.. • 0 0.2
• calculated value l/Eo • assuming that experimental value lIE=J(t,t') at 0.1 GOy a
1/1 Q.
",
'0 .... c:
·-co . uf'
0.4
0.3
0.2
.... 0.4
0.3
0.2
~
e5 2/#
14~ 83
15
Kf" I~ el
~ 0.1 (0)
3.0 4.0 5.0 6.0 7.0 Z.
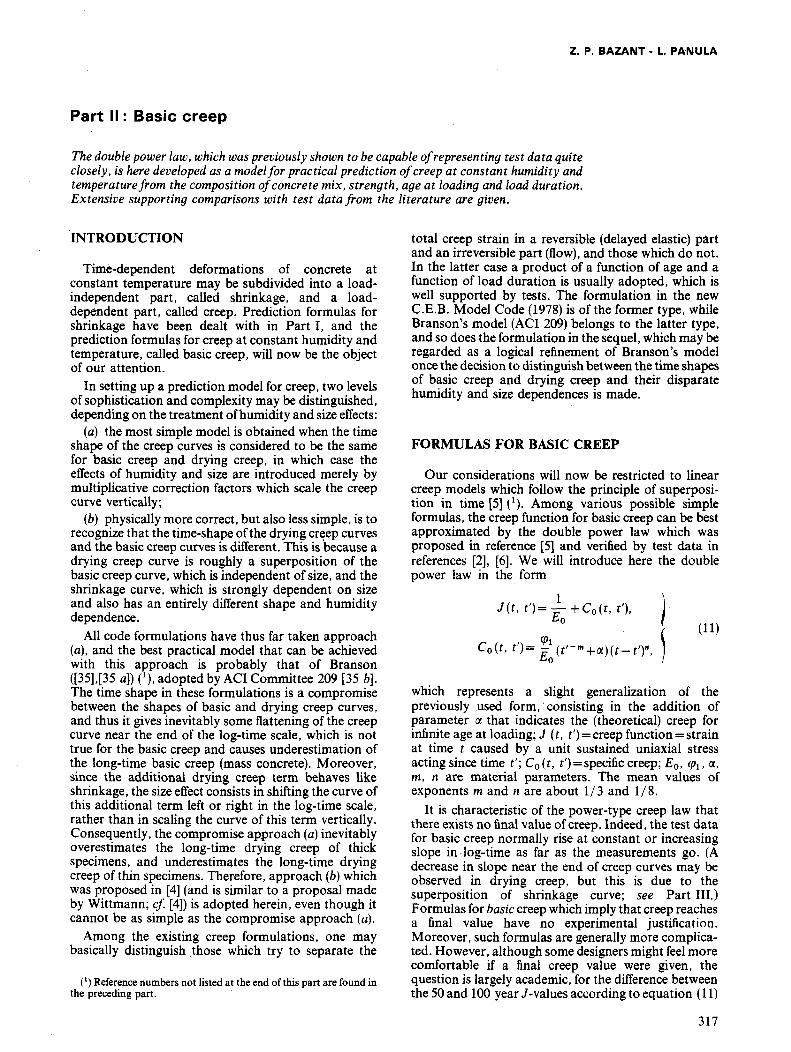
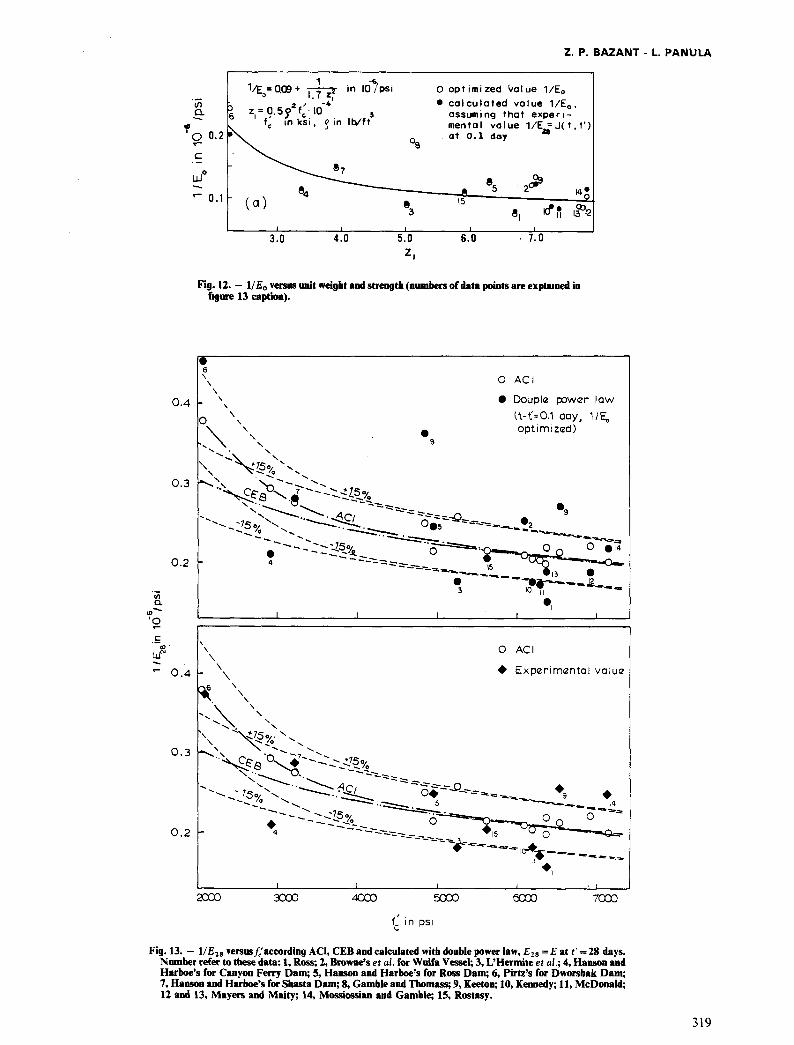
Fig. 12. - 1/ Eo venus UBit weigbt and strengtb (numbers of data points are explained in figure 13 caption).
I J
• 8
( in psi
I
o ACI
• DoupllZ jXlWer law
(t-t' =0.1 day. 11 E" optimized)
o ACI
• ExplZrimlZntal value
Fig. 13. - 11 E28 versush'according ACI, CEB and calculated with double power law, E28 =E at t' =28 days. Number refer to these data: I, Ross; 2, Browne's et al. for Wulfa Vessel; 3, L'Hermite et al.; 4, Hanson and Harboe's for Canyon Ferry Dam; S, Hanson and Harboe's for Ross Dam; 6, Pirtz's for Dworsbak Dam; 7, Hanson and Harboe's for Shasta Dam; 8, Gamble and Thomass; 9, Keeton; 10, Kennedy; 11, McDonald; 12 and 13, Mayers and Maity; 14, Mossiossian and Gamble; IS, Rostasy.
319
VOL. 11 • N° 65 • MATeRIAUX ET CONSTRUCTIONS
CII a. ~-'0 .... c
-.... ...: ---,
I.'Mer,.it., ~i lion, 'Lefevre 1965, 1971, AM. 100%
0.45 - 1!Eo= O.09I·IO·~i
'fr 0.5'10:10
.. 28 '\ "' ; 3.113
0.40 m a 0.28 \1;';2" 0.316
n .. 0.12 + O.07(y·")' ,. 0.132 513) + (y''')'
0.35 cI " (4) .vcr' .. O.CI5I 0;. " 0.Q!12
0.30 -- 1/E.= 0.094 I 0", PS' 0
0.2'5
0
0.20
0.15 !I
" 0.10 0.01 0 to 100
Shasto aa. 1953, 1958, seoled
0.& -VEe." 0.14HO";p.i 1, = 3.6If1 m .. 0.37& n .. 0.127
0.5 cI. .. 0.043 .;" .. 0.078
0.4 0
0.3
02
1.8
1.&
1.4
t.2
1.0
0.8
0.&
0.4
II -.. 100
Oworshal< 0cIn 1968, sealed
o
_1 lEo" O.242·IO·""'i 1, "5.C152 m "0.511 n • 0.13) 0( .. 0.0415 ~ ... 0.093
, IE • • O.:;no·IO~i o
o ° o °
ocP ~O~----------------------,
mi" B Meyers ond Melity 1970,sealed °
DAO VE,,- 0.CB7 'IO'~i ~.. cP°6' :II" ".393 1.~ 00 .... O.~:II ,~ Q
~d"ao.OOB
(130
o 0 n • 0.181 ..... 0.029
(120
~O~================~ !Wi" A
Meyers and Meli ty 1970, seated
DAD
(130
1IEo· O.OII)·IC11'''li '1, • 4.111 !W .. 0.305 n .. 0.189 C( .. 0.029 J,.·0.036
°
tOOO to 100
Conyon Ferry 0cIn , 1958 .. .. "0 I ecI .. .. 0.1 -1 lEo. 0.1I0·10·';p.i
~I • 3.862 !W "0.3f1T
..
0.&
0.5
0.4
0.3
0.2
0.1 10 tOO
1.0 00
Ros. aa. 1953, 1958, seoted o
0.9 -1 lEo. O.I28·IO"/PSi '1. • 3·11"
o o o
0.8
0.1
o
0.3
m .0.33) n .. 0.128 cI .. 0.0415 J.. a O.CB)
o
..<:"",-:
1J$It. ",,"" C 1.1?> A C \$ ...-!......:..'.: 0 0
..,.-::.-0".: 0 0 ....-!:
.--........::--- 's9IJdO"1~~~ ~--- ~~-'..-:
o ~~ d~"
• ~.~ --~~
A A --, / .. O.I2!HO~i
0.2 ~,:,!-,"""'~-::,-""""~~"""'":",::-,-"""',,,,!-_~~:-,," ......... ~=-,,"~~ 0.2 ':--................................. "'!::---'--'o~ ....... ~:--"'--~ .......... ~::-I 0.0001 0.001 0.01 O. t to 100 1000 1 10 100 1000
t- t' in days
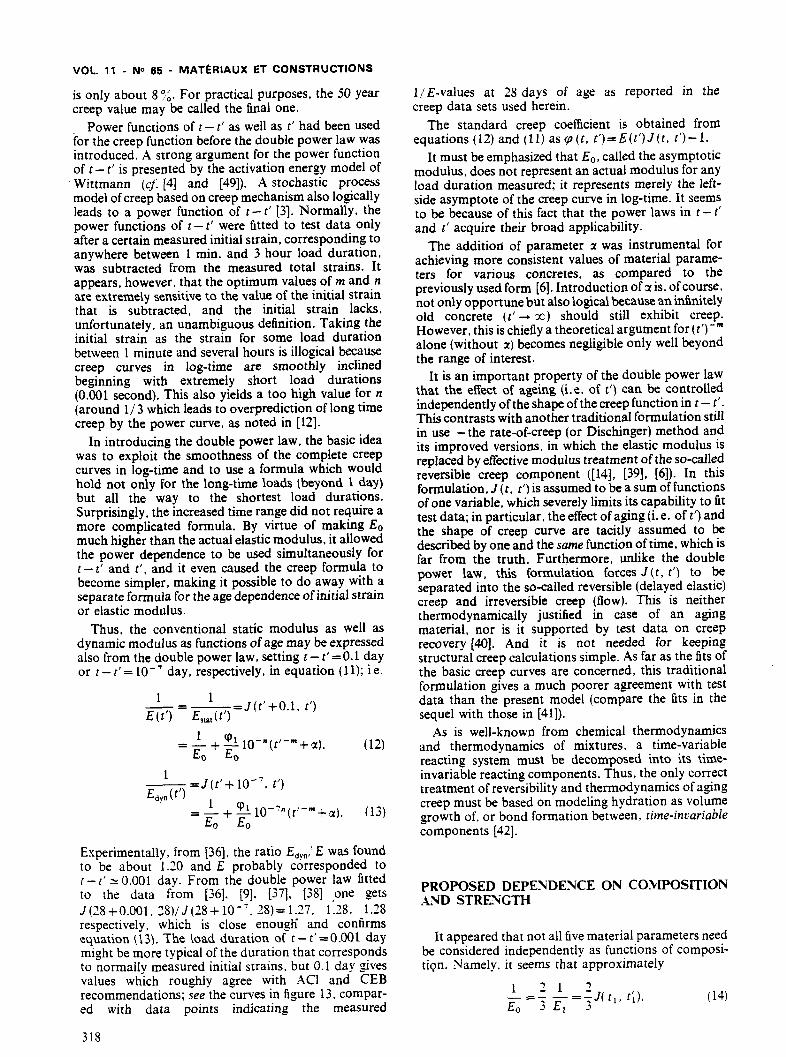
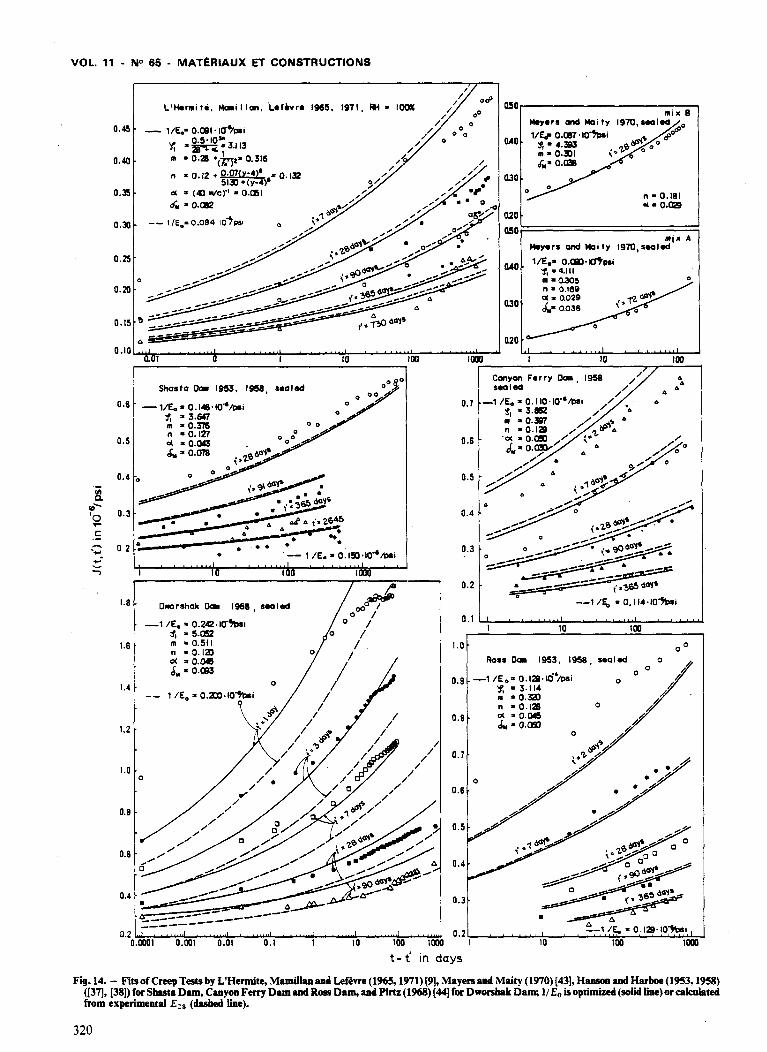
Fig. 14. - Fits of Creep Tests by L'Hermite, Mamillan and Lefevre (1965, 1971) [9], Mayers and Maity (1970)[43], Hanson and Harboe (1953,1958) ([37]. [38J) for Shasta Dam. Canyon Ferry Dam and Ross Dam. and Pinz (1968) [44] for Dworshak Dam; 1/ Eo is optimized (solid line) or calculated from experimental EZ8 (dashed line).
320
in which tJ. =28 days, t1 - tJ. =0.001 day, and substitution in equation (11) then yields
103n
qJ1 = 2 (28 In + a) . (15)
By optimization of data fits, performed similarly as described for shrinkage, the following empirical formulas have been identified:
1 IX=--
- 4Owle' 1
m=0.28+ (/;)2 '
for x> 0: n=0.12+ 5130+x6 ; 0.07 x
6 l for x~ 0: n=0.12,
(16)
(17)
~ ale (w )1/3 (a )2'~ x=[.l (sle)1.4 +0.1 (fc)1.S C 9 Ja 1 -4, (18)
where I; must be in ksi (1 ksi = 1,000 psi = 6.895 MN/m2) and a1 is a coefficient taken as 1.00 for ordinary cements of ASTM types I and II, 0,93 for cements of type III (rapid hardening) and 1.05 for cements of type IV (low heat).
When a measured value of the conventional elastic modulus E (static modulus for t - t' = 0.1 day) for the given concrete is available, 11 Eo may be readily calculated from equation (12). If J (t, t') for t' = 28 days and t - t' = 0.001 day is known, then 11 Eo is 2/3 of J (t, t'); equation (14). When a directly measured value of E is unavailable, one might think of using the well-known ACI formula (57,OOOj7;) or the analogous CEB formula. However, these formulas did not appear to be sufficiently accurate in the context of characterizing creep at various ages and compositions. Therefore, an explicit empirical formula for Eo has been developed (fig. 12) as well:
1 1 -E =0.09+ -17 2'
o . Z1
in which p = unit mass of concrete in Ib/ft3
(= 16.03 kgl m3),f; is the 28 day cylinder strength in ksi (=6.895 N/mm2) and 11 Eo is in 1O- 6 /psi (=145.0x10- 6 per N/mm2). When substituted in equation (12), this formula can be also used to calculate E (t'). The resulting values are in good correlation with the familiar AClformula (57,000 j7;); see figure 13.
According to equation (16), the ratio of creep of concrete loaded when old to creep of concrete loaded when young decreases as the strength increases. Creep of concrete loaded at high age also increases as the water-cement ratio increases. Furthermore, according to equation (18), the ratio of creep to elastic deformation and the ratio of long-time to short-time creep increase with the cement content at a fixed aggregate content and a fixed water-cement ratio. They also increase with the water-cement ratio, and this effect is more pronounced at a higher water-cement ratio and a higher sand-gravel ratio. The influence of aggregatecement ratio and sand-gravel ratio according to equation (18) is rather complicated and cannot be easily
Z. P. BAZANT - L. PANULA
described; these aspects of equation (18) are concoctions of the machine - they were hatched from the optimization program. Nevertheless, inclusion of al e, sl e and al g in equation (18) significantly improves data fits; the formula works. The creep curves are highly sensitive to changes in n, even as small as 0.005. The values of n generally lie between 0.10 and 0.17, and usually they are between 0.125 and 0.145.
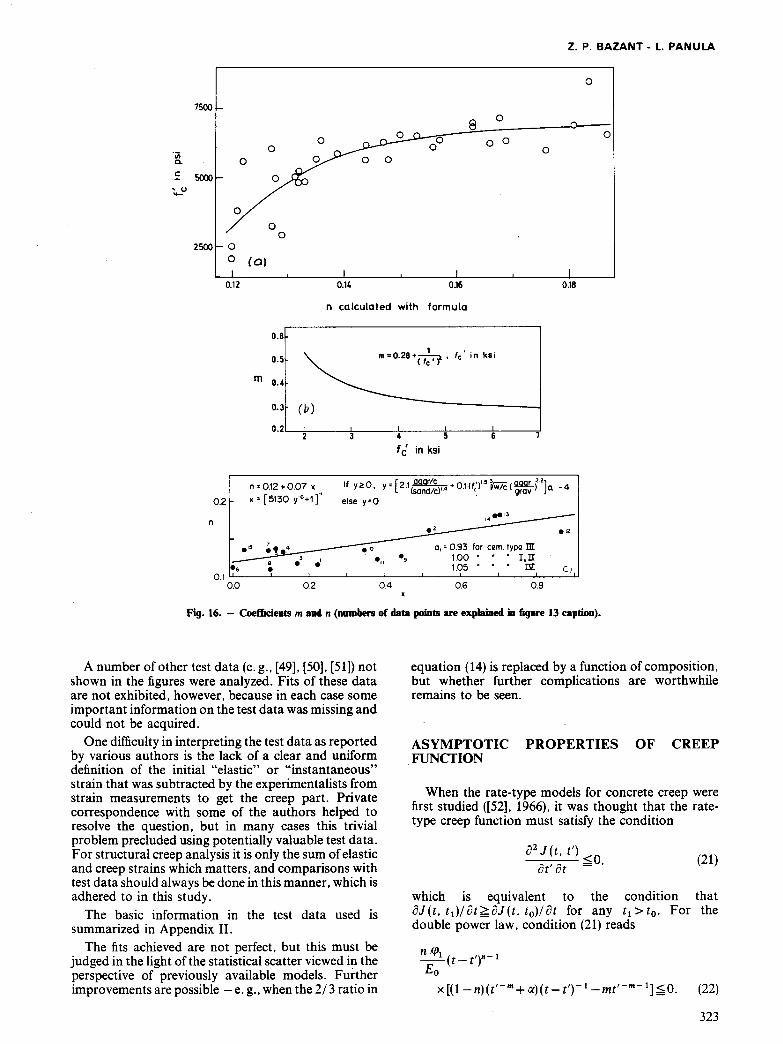
For illustration, the values of n have been calculated from equations (17) and (18) for all mixtures considered for basic creep in the sequel (figs. 14, 15) as well as all mixtures in Part II~ that will deal with drying cree~. These n-values are plotted in figure 16 a which demonstrates that strength alone does not suffice for predicting exponent n.
COMPARISON WITH CREEP TEST DATA
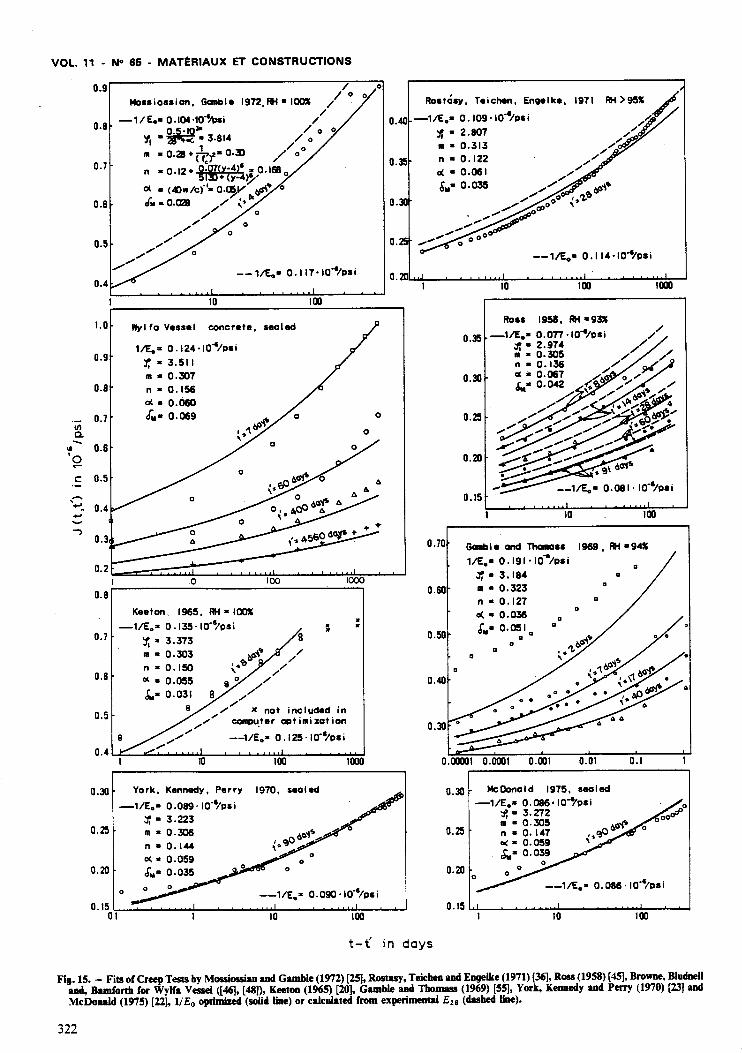
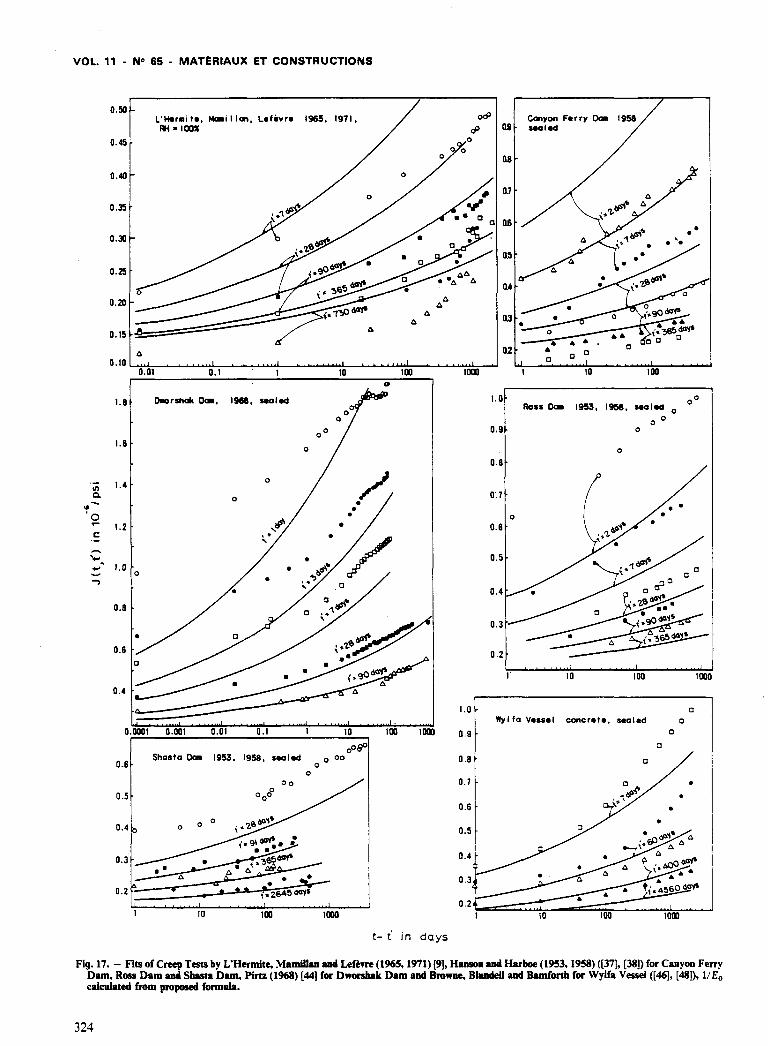
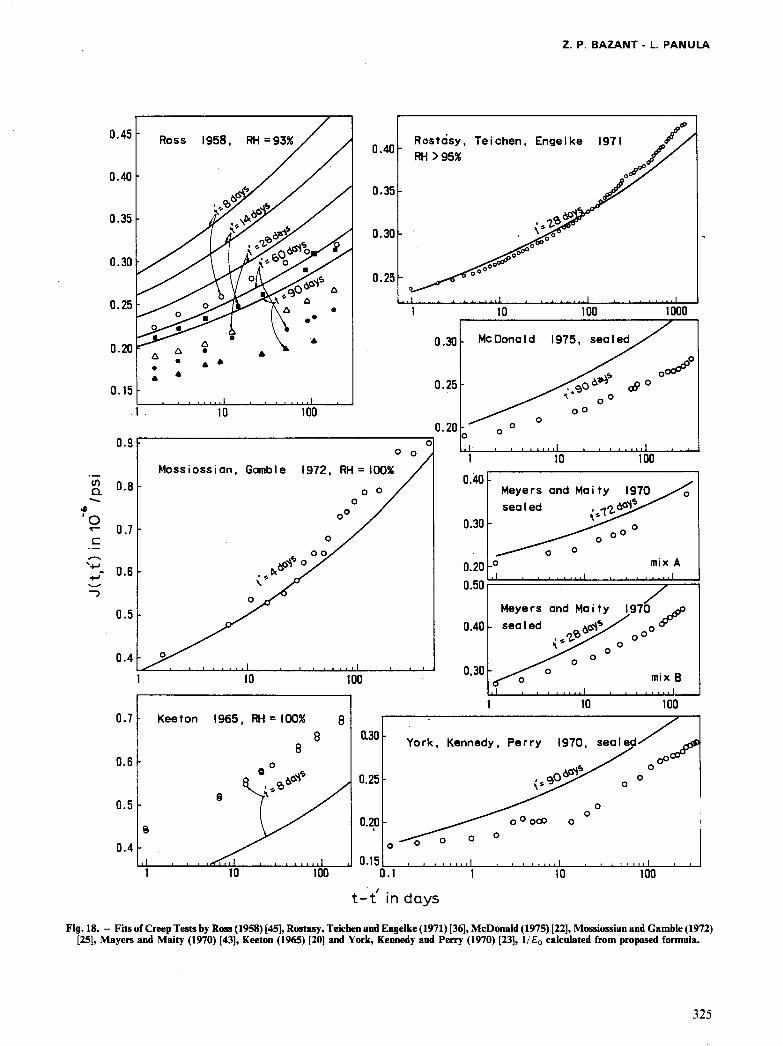
The method of optimizing the data fits was the same as described for shrinkage. Fits of fourteen different comprehensive data sets on creep under uniaxial compression ([9], [43], [37], [38], [44], [25], [36], [45], [46], [47], [48], [20). [22], [23). [55]) are exhibited in figures 14, 15, 17, 18. Three types of fits are shown.
The solid lines in figures 14 and 15 represent the fits when all parameters are calculated from equations (16)(18) except that 1/Eo is optimized individually for each data set. These fits indicate how good the prediction formulas for creep parameters are when the error in the elastic modulus is minimized.
The dashed lines in figures 14 and 15 represent the fits when 11 Eo is determined from the measured 28 day elastic modulus using equation (12). These fits show how good the formulas are when there is no error in the elastic modulus.
Finally, figures 17 and 18 show the optimum fits when all parameters, including 11 Eo, are determined from the strength and the composition of concrete mix.
The figures also show the values of the relative rootmean square deviation from (hand-smoothed) measured creep curves, which is defined as
15M = - L AT - L Jr (1M )1;2 (1 M )1/2 Al i =1 Al i =1
(20)
in which J i are the points of the experimental (handsmoothed) creep curves, spaced uniformly in log-time except for being crowded more near the end of each curve to give a higher weight to the final values; Ai are the deviations from these experimental points.
The fits are quite satisfactory, as compared to previous models. A very substantial improvement is achieved when the elastic modulus is known. In fact, much of the disagreement in figures 17 and 18 is due to the poor prediction of elastic modulus, E. In Dworshak Dam data (fig. 14) the beginning of early age creep curves is fitted poorly because pozzolan caused slower than usual strength development (especially at t' = 1 day and t' = 3 days).
An idea of the accuracy of the formulas (17) and (18) for the prediction of n may be gained from figure 16 e. The variation of m is plotted in figure 16 b.
321
VOL. 11 • N° 65 • MAT~RIAUX ET CONSTRUCTIONS
III a. -" '0 .... c:
...... ' ..... .... . ..,
0.9 / Mo •• iosaian, Gallbl. 1972,RH a l0ClX //00
-11 Eo. 0.104·101'Psi // 0.8 ~1030 / 0 0
1, a -c. a 3.814 / 0
1/0
0.7
O.B
0.5
1.0
0.9
0.8
0.7
0.6
0.5
0.4
0.3
I
0.8
0.7
O.B
0.5
0.4
0.30
0.25
0.20
III • 0.28 + n:.,. 0.31 ,/ 0
n a 0.12+ 2·iY• 4S a 0.168 I + (y )" 0 ... ., 7' ,.. .... (Clw/c) .0'0/ /1>'" ,{ .... 0.028 ./ ,~Do
///.//
",/
//
,./'/ --llEo" 0 .117 ·IO"'1p.i
10 100
IIy I fa V •••• I concr.t., s.oled
llEo" 0 .124 ·IO·I/p.i
1. • 3.511 III· 0.307 n '" 0.156 01. .. 0.6&0 I .. '" 0.069
10 100 1000
Keeton 1965, RH .. IOCIX
-lIE ... 0.135·10"'1psi " " " " 'f, a 3.373 III .. 0.303 n .. 0.150 ~ a 0.055 J.. .. 0.031
lC not includ.d in COIIIPu.t.r opt illli zot ion
--1IEo• 0.125 ·IO"'1p.i
100 1000
York, K.nnedy, P.rry 1970, sealed
-1IE.'" 0.089·10"'1psi :ft '" 3.223 III .. 0.306
o
0
Ro.ta.y, rei chen. Env.lk., 1971
0.40 -1IE.'" 0.109·10"'1p.i
:r. '" 2.807 III '" 0.313
O. naO.122
O.
c( '" 0.061 S .. '" 0.03!5
0.70
0.60
0.50
0.40
0.30
0.25
0.20
Ro.. 1958, RH '"93X
0.35
0.30
0.25
• g\ oO'l~ ~--
0.20
0.15 --11E.'" O.08I·IO"I/psi
~1--~~~~1~0--~"""",-u~1~00-~
Galble and ThaIIass 1IE.a 0.191·I0"6/psi
:f, '" 3.184
1969, RH ·941
III '" 0.323 n '" 0.127 0( '" 0.036 or .. '" 0.051
a a a
a a
a
0.01 0.1
McOonoid 1975, sealed -llE.a 0.086,IO·'1p.i
~a 3.272 III '" 0.305 n '" 0.147 a( '" 0.059 ;..'" 0.039
o
O. 15 ,';---'---'-................ '"'-!---'--................. ~~--o.--'-................ .I..o.l:-,...-..-'--....-J 01 10 100
0.15 1.o.I.. __ ................................. ..L.....-..o.-..o. ............ .....J.._-'-......... 10 100
t-t' in days
Fig. 15. - Fits of Creep Tests by Mossiossian and Gamble (1972) [25]. Rostasy, Teicheu and Engelke (1971) [36], Ross (1958) [45], Browne. Bludnell and, Bamfonb for Wylfa Vessel ([46], [48]), Keeton (1965) [20], Gamble and Tbomass (1969) [55]. York, Kennedy and Perry (1970) (23) and :vtcDonaid (1975) [22], 11 Eo optimized (solid Hne) or calc:ulated from experimental EZ8 (dashed Hne).
322
Z. P. BAZANT - L. PANULA
o
7500
8 o
'iii 0 a.
o o 0 o
c 5000 , u "-
0
0 0
2500 0 0 CO)
0.12 0.14 0.16 0.18
n calculated with formula
0.6
0.5 m = 0.28 + (f~ , f' 'e' inks i
m 0.4
0.3 (b)
0.2L-+----+---+4-----J5,----.J.------"l7
fc in ksi
n = 0.12 + 0.07 x If y2:0, Y = [2.1(:n':~)'4 + O.W;)" Wc (=->2]0, -4
0.2 x = [5130 y-6+1 r' else y=O
n .'2
0, = 0.93 for c~m. typo m 1.00 I,n
·0 1.05 :nz: C) O.I~_~ __ _L __ L-_ _L __ L-_~ __ ~_~~ _ _u
0.0 0.2 0.4 0.6 0.8
Fig. 16. - Coefficients m aud n (Dumbers of data points are explained in figure 13 caption).
A number of other test data (e. g., [49], [50). [51]) not shown in the figures were analyzed. Fits of these data are not exhibited, however, because in each case some important information on the test data was missing and could not be acquired.
One difficulty in interpreting the test data as reported by various authors is the lack of a clear and uniform definition of the initial "elastic" or "instantaneous" strain that was subtracted by the experimentalists from strain measurements to get the creep part. Private correspondence with some of the authors helped to resolve the question, but in many cases this trivial problem precluded using potentially valuable test data. F or structural creep analysis it is only the sum of elastic and creep strains which matters, and comparisons with test data should always be done in this manner, which is adhered to in this study.
The basic information in the test data used is summarized in Appendix II.
The f1ts achieved are not perfect, but this must be judged in the light of the statistical scatter viewed in the perspective of previously available models. Further improvements are possible - e. g., when the 2/ 3 ratio in
equation (14) is replaced by a function of composition, but whether further complications are worthwhile remains to be seen.
ASYMPTOTIC PROPERTIES OF CREEP FUNCTION
When the rate-type models for concrete creep were first studied ([52], 1966), it was thought that the ratetype creep function must satisfy the condition
02 J(t t') -"""::""':""""':'<0
at' at =, (21)
which is equivalent to the condition that oJ(t, t 1 )/ at?;oJ(t, to)/ at for any t1 > to. For the double power law, condition (21) reads
n CPl --(t- t')"-1 Eo
x [(1- n)(t,-m+ a)(t- tT 1 _mt,-m-1] ~O. (22)
323
VOL. 11 - N° 65 - MAT~RIAUX ET CONSTRUCTIONS
1.4 0 // en
Q. 0 .. - • • '0 • .- 1.2
c:
--... . 1.0 ...
0 -,
0.8
0.6
0.4
0.0001 0.001 0.01 0.1 10 1111
gO€? 0.6
Shasta 0aII 1953. 1958. sealed 00
00
0
10 1111 1000
t- t'
l> l>
l> l>
1111
IOIXI
in days
0<9 Canyon Ferry 0aI 1958 OJ sealed
OJ
D.5
02
101X1
1.0 Ross 0aI
0.9
0.8
r
1.0 lIy I fa Vessel
0.9
0.8
0.7
0.6
0.5
0.4
0.3
0.2
0
10
0
10 100
00 1953, 1958. sealed 0
o 0 o
o
100 1000
0
concrete. sealed 0
0
0
0
• •
• •
Fig. 17. - Fits of Creep Tests by L'Hermite. ~ami.Uan and LefeYre (1965,1971) [9], HlUIIOn and Harboe (1953. 19!8) ([37], [38]) for Canyon Ferry Dam, Ross Dam and Shasta Dam, Pirtz (1968) [44] for Dwonbak Dam and Browne, BluodeH and Bamfortb for Wylfa Vessel ([46], [48]), 1/ Eo calculated from proposed formula.
324
0.7 Keeton 1965, RH = 100% 8 8
8 O.S
0.5
0.4
0.40
0.35
0.30
0.25
o
Z. P. BAZANT • L. PANULA
Rostasy, Teiehen, Engelke RH >95%
10 100
0.30 Me Donald 1975,
0.25
00 0
0 0
10
Meyers and sealed
0.30
0.20 0
1000
09 0
100
mix A
o .50 ~===========!:::=:==:::::::::=:~====:
Meyers 0.40 seal ed
10
York, Kennedy, Perry 1970, sealed
o o o
o o
o
mix 8
100
, , . t-t In days
Fig. 18. - Fits of Creep Tests by Ross (1958) [45], Rostasy, Teicben and Engelke (1971) [36], McDonald (1975) [22], Mossiossian and Gamble (1972) [25], Mayers and Maity (1970) [43], Keeton (1965) [20] and York, Kennedy and Perry (1970) [23], 1/ Eo calculated from proposed formula.
325
VOL. 11 - N° 65 - MATeRIAUX ET CONSTRUCTIONS
1.6 Dworshak Dam concrete, 1968
600
0.8 Wylfa Vessel concrete
'1 ~ 0.6
.S
:: 0.4
...,
0.2 ~~~::;t;.;::=:~::::::::J o 500 1000 1500 2000
0.8 Ross Dam concrete, 1953,1958
0.6
I 0.4
0.2 l7 ,~
o 2~0 ~OO 7~0
t in days
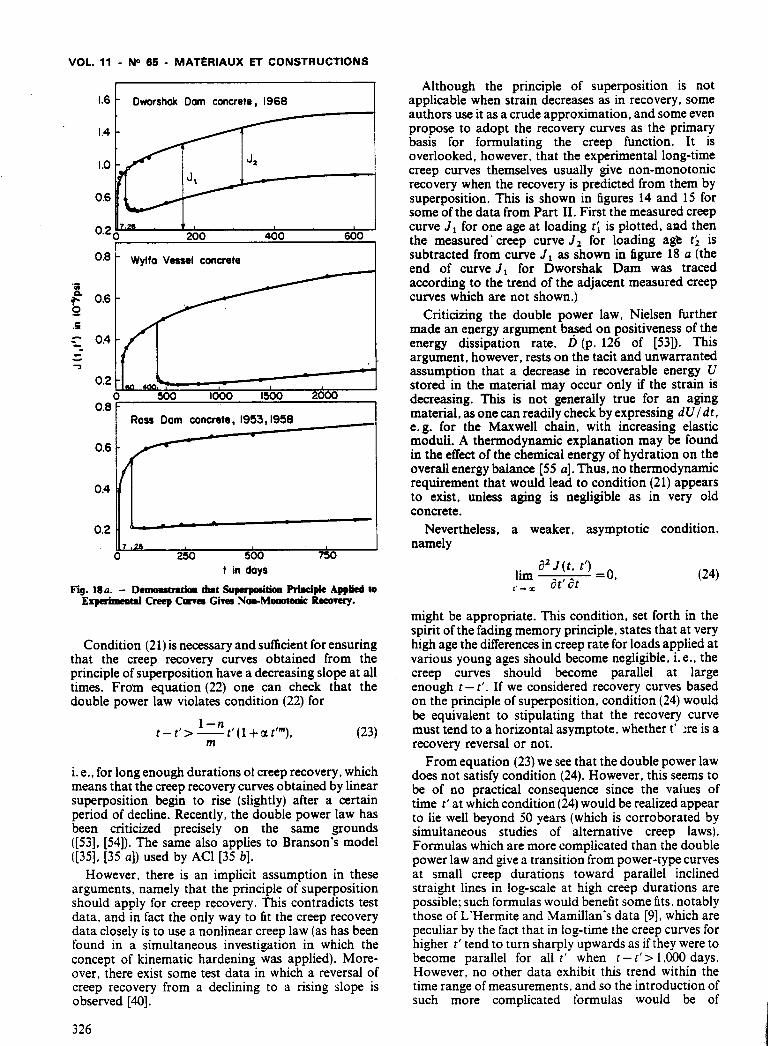
Fig. 18 a. - Demonstratioa tbat Superpositioa PriDcipie Applied to Experimental Creep Clmes Gi~es Noa-MODOtoaic R-err.
Condition (21) is necessary and sufficient for ensuring that the creep recovery curves obtained from the principle of superposition have a decreasing slope at all times. From equation (22) one can check that the double power law violates condition (22) for
I-n t- t'> -t' (1 +a t /'''). (23)
m
i. e .• for long enough durations ot creep recovery. which means that the creep recovery curves obtained by linear superposition begin to rise (slightly) after a certain period of decline. Recently. the double power law has been criticized precisely on the same grounds ([53]. [54]). The same also applies to Branson's model ([35]. [35 a]) used by ACI [35 b].
However. there is an implicit assumption in these arguments. namely that the principle of superposition should apply for creep recovery. This contradicts test data. and in fact the only way to fit the creep recovery data closely is to use a nonlinear creep law (as has been found in a simultaneous investigation in which the concept of kinematic hardening was applied). Moreover. there exist some test data in which a reversal of creep recovery from a declining to a rising slope is observed [40].
326
Although the principle of SUperposltlon is not applicable when strain decreases as in recovery. some authors use it as a crude approximation. and some even propose to adopt the recovery curves as the primary basis for formulating the creep function. It is overlooked. however. that the experimental long-time creep curves themselves usually give non-monotonic recovery when the recovery is predicted from them by superposition. This is shown in figures 14 and 15 for some of the data from Part II. First the measured creep curve J 1 for one age at loading t;' is plotted. aRd then the measured' creep curve J 2 for loading agtl t2 is subtracted from curve J 1 as shown in figure 18 a (the end of curve J 1 for Dworshak Dam was traced according to the trend of the adjacent measured creep curves which are not shown.)
Criticizing the double power law. Nielsen further made an energy argument b~d on positiveness of the energy dissipation rate. D (p. 126 of [53]). This argument. however. rests on the tacit and unwarranted assumption that a decrease in recoverable energy U stored in the material may occur only if the strain is decreasing. This is not generally true for an aging material. as one can readily check by expressing dU / dt. e. g. for the Maxwell chain. with increasing elastic moduli. A thermodynamic explanation may be found in the effect of the chemical energy of hydration on the overall energy balance [55 a]. Thus. no thermodynamic requirement that would lead to condition (21) appears to exist. unless aging is negligible as in very old concrete.
Nevertheless. a weaker. asymptotic condition. namely
. o2J(t.t') hm 0 I ~ =0. ,'_", t ot
(24)
might be appropriate. This condition. set forth in the spirit of the fading memory principle. states that at very high age the differences in creep rate for loads applied at various young ages should become negligible. i. e .• the creep curves should become parallel at large enough t - t'. If we considered recovery curves based on the principle of superposition. condition (24) would be equivalent to stipulating that the recovery curve must tend to a horizontal asymptote. whether l' ~re is a recovery reversal or not.
From equation (23) we see that the double power law does not satisfy condition (24). However. this seems to be of no practical consequence since the values of time t ' at which condition (24) would be realized appear to lie well beyond 50 years (which is corroborated by simultaneous studies of alternative creep laws). Formulas which are more complicated than the double power law and give a transition from power-type curves at small creep durations toward parallel inclined straight lines in log-scale at high creep durations are possible; such formulas would benefit some fits. notably those ofL'Hermite and Mamillan's data [9]. which are peculiar by the fact that in log-time the creep curves for higher t ' tend to turn sharply upwards as if they were to become parallel for all t' when t - t ' > 1.000 days. However. no other data exhibit this trend within the time range of measurements. and so the introduction of such more complicated formulas would be of
questionable usefulness. Therefore, it seems to be appropriate to stick to the simpler double power law.
Many other possible formulas for the creep function have been also analyzed, in addition to those listed in [2}.
APPENDIX II
Basic Information on Creep Data Used
L'Hermite and MamiUan and Lefevre's Creep Tests (1965, 1971) [9]. - Prisms 7 x 7 x 28 em, in water, 28 day strength 370 kp/cm2 (36.3 N/mm2); room temperature; concrete French type 400/800; cement content 350 kg/m3
•
Stress = 1/4 strength; water-cement-sand-gravel ratio 0.49 : 1 : 1.75 : 3.07. Seine gravel (silicous calcite).
Haosoo and Harboe's Creep Tests for Shasta Dam (1953, 1958) ([37], [38]). - Cylinders 6 x 26 inch (152 x 660 mm) sealed at 70°F (21°C). 28 day cylinder strength = 3,230 psi (22.3 N/mm2); cementtype IV; max. size of aggregate 0.75 to 1.5 inch (19-38 mm). Water-cement-sand-gravel ratio=0.58 : 1 : 2.5 : 7.1 by weight. Also measured was shorttime creep for t' =2 days [J (t, t')= 1.362, 1.386 x 10- 6 /psi, at t-t'=12.7 and 19 days] and t'=7 days (J(t, t')=0.712, 0.718, 0.783, 0.735, 0.798, 0.754, 0.810, 0.824, 0.843, 0.819 x 10- 6 /psi at t - t' = 2.8,17.5, 18,25,27,30,42,52,67, 79 days respectively. These were not fitted because the early strength development was unusually slow (cement type IV).
Pirtz's Creep Tests for Dworsbak Dam (1968) [44]. -Cylinders 6 x 18 inch (152 x457 mm) sealed, 70°F (21°C); 28 day cylinder strength 2,080 psi (14.33 N/mm2). Stress~ 1/3 strength. The mix contained 196.7 kg of type II cement per m3 and 68 kg ofpozzolan per m3
• Ratio of water(cement + pozzolan)-sand-gravel =0.56 : 1 : 2.79 : 4.42. Granite-gneiss aggregate with max. size 1.5 inch (38 mm).
Meyers and Maity's Creep Tests (1970) [43]. - Mix A: Prisms 14 x 3.5 x 3.5 inch (356 x 89 x 89 mm) sealed, 70°F (21°C). 13 day prism strength 4,350 psi (30 N/mm2). Portland cement of type III. Applied load - 40 % of ultimate prism strength. Water-cement-sand-gravel ratio 0.85 : 1 : 3.81 : 3.81 by weight. Crushed limestone aggregate; local quartz sand (from different batches for mixes A and B). Mix B: same as mix A except: 12 day cyl. strength 5,200 psi (35.9 N/mm2). Applied load - 35 % of ultimate cyl. strength.
Hanson and Harboe's Creep Tests for Canyon Ferry Dam (1958) ([37], [38]). - Cylinders 6 x 16 inch (152 x 406 mm), sealed, 70°F (21°C); 28 day cyl. strength = 2,920 psi (20.1 N/mm2); stress~1/3 strength; cement type II; max. size of aggregate=0.75 to 1.5 inch (19-38 mm). Watercement-sand-gravel ratio =0.5 : 1 : 2.87 : 10.37 by weight.
Hanson and Harboe's Creep Tests for Ross Dam (1953, 1958) ([37], [38]). - Cylinders 6 x 16 inch (152 x 406 mm) sealed, 70°F (21°C); 28 day cylinder strength 4,970 psi (34.3 N/mm2). Cement type II; max. size of aggregate 1.5 inch (3.8 em). Water-cement-sand-gravel ratio 0.56 : 1 : 2.73 : 7.14.
Mossiossian and Gamble's Creep Tests (1972) [25]. -Cylinders 6 x 12 inch (152 x 305 mm). At 100% relative humidity, 70°F (21°C); 29 day cylinder strength 7.160 psi (49.4 N/mm2). Cement type III. Max. size of aggregate 1 inch (2.54 cm). Water-cement-sand-gravel ratio 0.49 : 1 : 1.35 : 2.98.
Browne, BlundeD and Bamfortb's Creep Tests for Wylfa Vessel Concrete (1969, 1971. 1975) ([46], [47], [48]). -Cylinders 6 x 12 inch (152 x 305 mm), sealed. 20°C; watercement-sand-gravel ratio 0.42: 1 : 1.45 : 2.95. Ordinary
Z. P. BAZANT - L. PANULA
portland cement and crushed limestone aggregate of max. size 1.5 inch (38 mm); 28 day average (6 inch, 152 mm) cube strength 7.250 psi (50 N/mm2). Measured were also creep curves for t'=28 and 180 days which were excluded from analysis because they exhibit an increase rather than a decrease of creep with increasing t'.
Keeton's Creep Tests (1965) [20]. - Cylinders 3 x 9 inch (76 x 229 mm) and 6 x 18 inch (152 x 457 mm) at 100 % reI. humidity, 73°F (23°C); 28 day cyl. strength 6,550 psi (45.2 N/mm2). Portland cement of type III. Applied stress 30 % of the ultimate compressive strength of the specimens. Max. aggregate size 3/4 inch (19 mm). Water-cement-sandgravel ratio 0.457 : 1 : 1.66 : 2.07. Each creep curve appears to have been hand-smoothed in the actual time scale. '
York, Kennedy and Perry's Creep Tests (1970) [23]. -Cylinders 6 x 16 inch (152 x 406 mm), sealed, 75°F (24°C). 28 day average cyl. strength 6,200 psi (42.8 N/mm2); Portland cement of type II. Applied axial stress 2,400 psi (16.6 N/mm2). Max. size of limestone aggregate 0.75 inch (19 mm). Water-cement-sand-gravel ratio 0.425 : 1 : 2.03 : 2.62.
Rostasy, Teicben and Engelke's Creep Tests (1971) [36]. -Cylinders 20 x 140 em at relative humidity ~ 95 %. 20°C temperature. 28 day cube strength 455 kp/ em2
(44.6 N/mm2). Applied axial stress 94.7 kp/cm2 (9.3 N/mm2). Aggregate Rhine gravel and sand. max. size 30 mm. Water-cement-sand-gravel ratio 0.41 : 1 : 2.43 : 3.15.
Ross' Creep Tests (1958) [45]. - Cylinders 4.63 x 12 inch (118 x 305 mm) stored at 93 % relative humidity and 17°C. 28 day strength 6.400 psi (44.1 N/mm2). Rapid hardening Portland cement. Water-cement-sand-gravel ratio 0.375 : 1 : 1.6 : 2.8.
Gamble and Tbomass' Creep Tests (1969) [55]. - Cylinders 4 x 10 inch (102 x 254 mm) tested at 94 % relative humidity, 75°F (24°C). Cement type I. crushed greywacke aggregate and beach sand, max. size 3/16 inch (4.76 mm). Stressstrength ratio 0.36. 28 day cylinder strength 4,850 psi (33.4 N/mm2). Water-cement-sand-gravel ratio 0.7 : 1 : 2.04 : 3.06.
McDonald's Creep Tests (1975) [22]. - Cylinders 6 x 16 inch (152 x 406 mm), sealed, 73°F (23°C); 28 day average cyl. strength 6,300 psi (43.4 N/mm2). Applied axial stress 2,400 psi (16.6 N/mm2). Cement type II, limestone aggregate max. size 3/4 inch (19 mm). Water-cement-sandgravel ratio 0.425 : 1 : 2.03 : 2.62.
REFERENCES
[36] ROSTASY F. S., TEICHEN K.-Th., ENGELKE H. - Beitrag zur Kliirung der Zusammenhanges von Kriechen und Relaxation bei Normal-beton. Amtliche Forschungs-und Materialpriifungsanstalt fiir das Bauwesen. Otto-GrafInstitut, Universitiit Stuttgart, Strassenbau und Strassenverkchrstechnik, Heft 139, 1972.
[37] HANSON J. A. - A ten-year study of creep properties of concrete. Concrete Laboratory, Report No. Sp-38, U.S. Department of the Interior, Bureau of Reclamation. Denver, Colorado, July 1953.
[38] HARBOE E. M: et al. - A comparison of the instantaneous and the sustained modulus of elasticity of concrete. Concrete Laboratory Report No. C-854, Div. of Engng. Laboratories, U.S. Dept. of the Interior, Bureau of Reclamation, Denver, Colorado, March 1958.
[39] C.E.B. (Comite Europeen du Beton), 3rd Draft of Model Code for Concrete Structures, Bulletin d'Injormation No. 117-F. Paris, Dec. 1976. See also C.E.B.-F.I.P. Model Code, Congress ofF.I.P. in London, May 1978.
327
VOL. 11 - N° 65 - MATeRIAUX ET CONSTRUCTIONS
[40] BAUNT Z. P .. OSMAN E. - Reply to Riisch. Jungwirth. and Hilsdorf's Second Discussion of the Paper "On the Choice of Creep Function for Standard Recommendations on Practical Analysis of Structures". Cement and Concrete Research. Vol. 7.1977. p.119-130.
[41] BAUNT Z. P .. PANULA L. - A note on amelioration of the creep function for improved Dischinger method. Cement and Concrete Research. Vol. 8. 1978. No.3.
[42] BAUNT Z. P. - Viscoelasticity of porous solidifying material- Concrete. Proc. Am. Soc. of Civil Engrs .. J. of the Engng. Mech. Division. Vol. 103. 1977. p. 1049-1067.
[43] MAITY K., MEYERS B. L. - The effect of loading history on the creep and creep recovery of sealed and unsealed plain concrete specimens. Report No. 70-7 prepared under National Science Foundation Grant GK-3066. Dept. of Civil Engng .. University of Iowa. Iowa City. September 1970.
[44] PIRTZ D. - Creep characteristics of mass concrete for Dworshak Dam. Report No. 65-2. Structural Engineering Laboratory. University of California. Berkeley. October 1968.
[45] Ross A. D. - Creep of concrete under variable stress. American Concrete Institute Journal. Vol. 54. 1958. p.739-758.
[46] BROWNE R. D .• BLUNDELL R. - The influence of loading age and temperature on the long term creep behaviour of concrete in a sealed. moisture stable state. Materials and Structures (RILEM. Paris). Vol. 2. 1969. p. 133-143.
[47] BROWNE R. D .• BURROW R. E. D. - Utilization of the complex multiphase material behavior in engineering design. in "Structure. Solid Mechanics and Engineering Design". Civil Engng. Materials Conf. held in
Un modele de prevision pratique des deformations du beton en Condion du temps. I. Retrait. - On propose un modele de prevision pratique du fluage et du retrait du beton a partir de la composition du melange. de la resistance. de I'age au chargement. des conditions d'ambiance. des dimensions et formes. etc. Les principales caracteristiques sont : la loi de double puissance pour Ie fluage de base. la loi hyperbolique quadratique pour Ie retrait. I'effet d'echelle du type « diffusion de l'humidite ». un terme ajoute de fluage de sechage lie au retrait et la prise en compte des effets thermiques par l'energie d'activation. On s'est servi des techniques
328
Southampton 1969. Ed. by M. Te·eni. Wiley Interscience. 1971. p. 1343-1378.
[48] BROWNE R. D .. BAMFORTH P. P. - The long term creep of the Wylfa P. V. concrete for loading ages up to 12 1/2 Years. 3rd Int. Conf. on Struct. Mech. in Reactor Technology. Paper H 1/8. London. September 1975.
[49] WITTMANN F. H. - Vergleich einiger Kriechfunktionen mit Versuchsergebnissen. Cement and Concrete Research. Vol. 1. No.7. 1971. p. 679-690.
[50] BROOKS J. J .. NEVILLE A. M. - Estimating long-term creep and shrinkage from short-term tests. Magazine of Concrete Research. Vol. 27. No. 90. March 19;'5. p. 3-12.
[51] JORDAAN 1. J .. ILLSTON J. M. - Time-dependent strains in sealed concrete under systems of variable multiaxial stress. Magazine of Concrete Research. Vol. 23. No. 75-76. June-September 1971. p. 79-88.
[52] BAUNT Z. P. - Phenomenological theories/or creep of concrete based on rheological models. Acta Technica CSAV (Prague). Vol. 11. 1966. p. 82-109.
[53] NIELSEN L. F. - Reply to Batant's and Jordaan's Discussions of the Paper "On the Applicability of Modifted Dischinger Equations". Cement and Concrete Research. Vol. 8. 1978. p. 123-128.
[54] RUSCH H .• JUNGWIRTH D .. HILSOORF H. K. - Second Discussion of the Paper "On the Choice of Creep Function for Standard Recommendations on Practical Analysis of Structures" . Cement and Concrete Research. Vol. 7.1977, p. 111-118.
[55a] BAUNT Z. P .• KIM F. S. - Can the creep curves for different ages at loading diverge? Cement and Concrete Research. Vol. 8. No.5, September 1978.
d' optimisation afin de jaire concorder les nombreux resultats d'essai publies. Ce travail est la continuation d'etudes anterieures et se divise en plusieurs parties. La premiere partie traite du retrait.
n. Fluage de base. - La loi de double puissance que l'on a precedemment montree comme etant apte a traduire avec une tres bonne approximation les resultats d'essai est developpee ici en tant que modele de prevision pratique dufluage a humidite et temperature constantes a partir de la composition du melange. de la resistance. de ['age au chargement et de la duree de celui-ci On donne a l'appui des comparaisons que I'on developpe avec les resultats d'essai pUblies.