Embed Size (px)
Citation preview

Bo(Lwtr(
FNBaGM
2
Journal of the American College of Cardiology Vol. 51, No. 20, 2008© 2008 by the American College of Cardiology Foundation ISSN 0735-1097/08/$34.00P
Cardiac Imaging
Assessment of Left VentricularDyssynchrony by Speckle Tracking Strain ImagingComparison Between Longitudinal, Circumferential,and Radial Strain in Cardiac Resynchronization Therapy
Victoria Delgado, MD, Claudia Ypenburg, MD, Rutger J. van Bommel, MD, Laurens F. Tops, MD,Sjoerd A. Mollema, MD, Nina Ajmone Marsan, MD, Gabe B. Bleeker, MD, PHD,Martin J. Schalij, MD, PHD, Jeroen J. Bax, MD, PHD
Leiden, the Netherlands
Objectives The objective of this study was to assess the usefulness of each type of strain for left ventricular (LV) dyssyn-chrony assessment and its predictive value for a positive response after cardiac resynchronization therapy (CRT).Furthermore, changes in extent of LV dyssynchrony for each type of strain were evaluated during follow-up.
Background Different echocardiographic techniques have been proposed for assessment of LV dyssynchrony. The novel2-dimensional (2D) speckle tracking strain analysis technique can provide information on radial strain (RS), cir-cumferential strain (CS), and longitudinal strain (LS).
Methods In 161 patients, 2D echocardiography was performed at baseline and after 6 months of CRT. Extent of LV dys-synchrony was calculated for each type of strain. Response to CRT was defined as a decrease in LV end-systolicvolume �15% at follow-up.
Results At follow-up, 88 patients (55%) were classified as responders. Differences in baseline LV dyssynchrony be-tween responders and nonresponders were noted only for RS (251 � 138 ms vs. 94 � 65 ms; p � 0.001),whereas no differences were noted for CS and LS. A cut-off value of radial dyssynchrony �130 ms was ableto predict response to CRT with a sensitivity of 83% and a specificity of 80%. In addition, a significant de-crease in extent of LV dyssynchrony measured with RS (from 251 � 138 ms to 98 � 92 ms; p � 0.001)was demonstrated only in responders.
Conclusions Speckle tracking radial strain analysis constitutes the best method to identify potential responders to CRT. Re-duction in LV dyssynchrony after CRT was only noted in responders. (J Am Coll Cardiol 2008;51:1944–52)© 2008 by the American College of Cardiology Foundation
ublished by Elsevier Inc. doi:10.1016/j.jacc.2008.02.040
Lf
ttmde(ste
gsa
y stimulating the right ventricle and the posterolateral wallf the left ventricle (LV), cardiac resynchronization therapyCRT) has been shown to decrease LV volumes, increaseV systolic function and improve clinical status in patientsith end-stage heart failure (1). However, in earlier studies,
he percentage of nonresponders is more than 30% whenesponse to CRT is defined by echocardiographic criteriae.g., LV reverse remodeling) (2). The lack of mechanical
rom the Department of Cardiology, Leiden University Medical Center, Leiden, theetherlands. Dr. Bax has received research grants from GE, BMS Medical Imaging,oston Scientific, Medtronic, and St. Jude. Dr. Delgado is supported in part bywards from the Spanish Society of Cardiology (post-residency grant) and fromeneralitat de Catalunya (RECERCAT BE-2 2006 00013). Randall C. Sterling,D, MPH, FACC, served as Guest Editor for this article.
mManuscript received September 17, 2007; revised manuscript received January 30,
008, accepted February 4, 2008.
V dyssynchrony has been suggested as one of the reasonsor nonresponse to CRT (3).
In recent years various imaging techniques have beenested for their ability to quantify LV dyssynchrony and forheir predictive value for response to CRT, includingagnetic resonance imaging, nuclear imaging, and echocar-
iography (3–7). Most experience has been obtained withchocardiography using color-coded tissue Doppler imagingTDI) by measuring peak-systolic velocities in differentegments of the LV. Several studies in CRT patients provedhat TDI was highly predictive for response to CRT andvent-free survival at 1-year follow-up (3,5,8,9).
Speckle tracking strain analysis is a novel method based onrayscale 2-dimensional (2D) images, which permits the as-essment of myocardial deformation in 2 dimensions. Usingpical and parasternal short-axis views, 3 different patterns of
yocardial deformation can be assessed: radial strain (RS)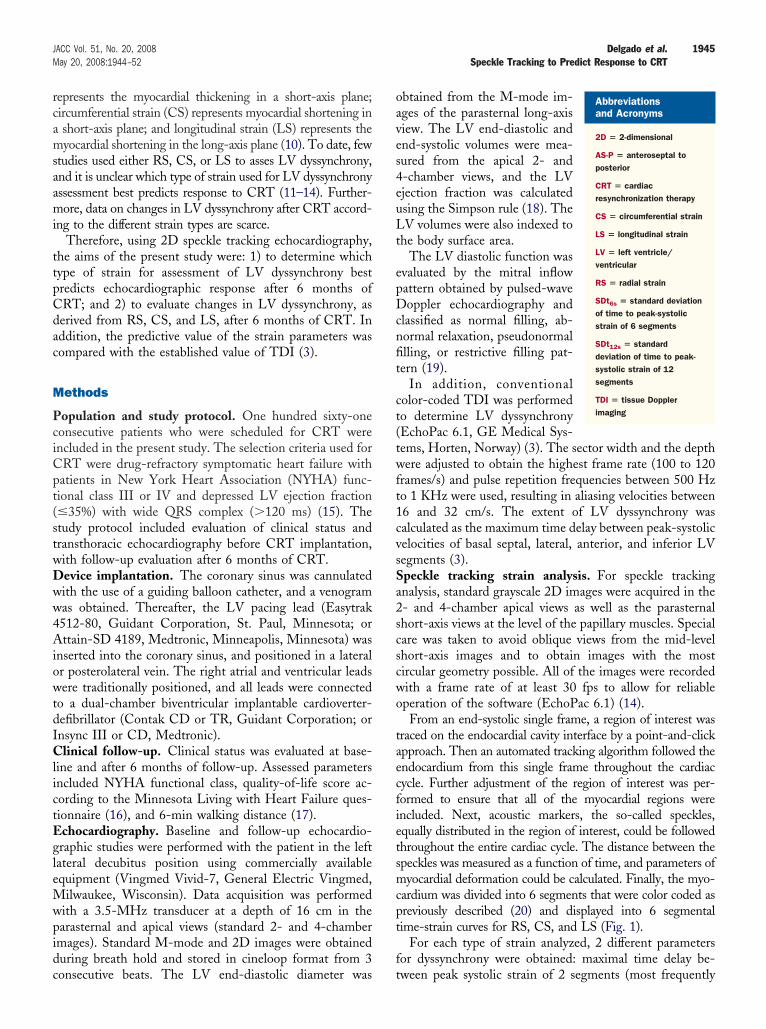
rcamsaami
ttpCdac
M
PciCpt(stwDww4AiowtdIClictEgleMwpidc
oaves4euLt
epDcnfit
ct(twft1cvsSa2scscwo
taecfietsmcpt
f
1945JACC Vol. 51, No. 20, 2008 Delgado et al.May 20, 2008:1944–52 Speckle Tracking to Predict Response to CRT
epresents the myocardial thickening in a short-axis plane;ircumferential strain (CS) represents myocardial shortening inshort-axis plane; and longitudinal strain (LS) represents theyocardial shortening in the long-axis plane (10). To date, few
tudies used either RS, CS, or LS to asses LV dyssynchrony,nd it is unclear which type of strain used for LV dyssynchronyssessment best predicts response to CRT (11–14). Further-ore, data on changes in LV dyssynchrony after CRT accord-
ng to the different strain types are scarce.Therefore, using 2D speckle tracking echocardiography,
he aims of the present study were: 1) to determine whichype of strain for assessment of LV dyssynchrony bestredicts echocardiographic response after 6 months ofRT; and 2) to evaluate changes in LV dyssynchrony, aserived from RS, CS, and LS, after 6 months of CRT. Inddition, the predictive value of the strain parameters wasompared with the established value of TDI (3).
ethods
opulation and study protocol. One hundred sixty-oneonsecutive patients who were scheduled for CRT werencluded in the present study. The selection criteria used forRT were drug-refractory symptomatic heart failure withatients in New York Heart Association (NYHA) func-ional class III or IV and depressed LV ejection fraction�35%) with wide QRS complex (�120 ms) (15). Thetudy protocol included evaluation of clinical status andransthoracic echocardiography before CRT implantation,ith follow-up evaluation after 6 months of CRT.evice implantation. The coronary sinus was cannulatedith the use of a guiding balloon catheter, and a venogramas obtained. Thereafter, the LV pacing lead (Easytrak512-80, Guidant Corporation, St. Paul, Minnesota; orttain-SD 4189, Medtronic, Minneapolis, Minnesota) was
nserted into the coronary sinus, and positioned in a lateralr posterolateral vein. The right atrial and ventricular leadsere traditionally positioned, and all leads were connected
o a dual-chamber biventricular implantable cardioverter-efibrillator (Contak CD or TR, Guidant Corporation; ornsync III or CD, Medtronic).linical follow-up. Clinical status was evaluated at base-
ine and after 6 months of follow-up. Assessed parametersncluded NYHA functional class, quality-of-life score ac-ording to the Minnesota Living with Heart Failure ques-ionnaire (16), and 6-min walking distance (17).chocardiography. Baseline and follow-up echocardio-raphic studies were performed with the patient in the leftateral decubitus position using commercially availablequipment (Vingmed Vivid-7, General Electric Vingmed,
ilwaukee, Wisconsin). Data acquisition was performedith a 3.5-MHz transducer at a depth of 16 cm in thearasternal and apical views (standard 2- and 4-chambermages). Standard M-mode and 2D images were obtaineduring breath hold and stored in cineloop format from 3
onsecutive beats. The LV end-diastolic diameter was tbtained from the M-mode im-ges of the parasternal long-axisiew. The LV end-diastolic andnd-systolic volumes were mea-ured from the apical 2- and-chamber views, and the LVjection fraction was calculatedsing the Simpson rule (18). TheV volumes were also indexed to
he body surface area.The LV diastolic function was
valuated by the mitral inflowattern obtained by pulsed-waveoppler echocardiography and
lassified as normal filling, ab-ormal relaxation, pseudonormallling, or restrictive filling pat-ern (19).
In addition, conventionalolor-coded TDI was performedo determine LV dyssynchronyEchoPac 6.1, GE Medical Sys-ems, Horten, Norway) (3). The sector width and the depthere adjusted to obtain the highest frame rate (100 to 120
rames/s) and pulse repetition frequencies between 500 Hzo 1 KHz were used, resulting in aliasing velocities between6 and 32 cm/s. The extent of LV dyssynchrony wasalculated as the maximum time delay between peak-systolicelocities of basal septal, lateral, anterior, and inferior LVegments (3).peckle tracking strain analysis. For speckle trackingnalysis, standard grayscale 2D images were acquired in the- and 4-chamber apical views as well as the parasternalhort-axis views at the level of the papillary muscles. Specialare was taken to avoid oblique views from the mid-levelhort-axis images and to obtain images with the mostircular geometry possible. All of the images were recordedith a frame rate of at least 30 fps to allow for reliableperation of the software (EchoPac 6.1) (14).From an end-systolic single frame, a region of interest was
raced on the endocardial cavity interface by a point-and-clickpproach. Then an automated tracking algorithm followed thendocardium from this single frame throughout the cardiacycle. Further adjustment of the region of interest was per-ormed to ensure that all of the myocardial regions werencluded. Next, acoustic markers, the so-called speckles,qually distributed in the region of interest, could be followedhroughout the entire cardiac cycle. The distance between thepeckles was measured as a function of time, and parameters ofyocardial deformation could be calculated. Finally, the myo-
ardium was divided into 6 segments that were color coded asreviously described (20) and displayed into 6 segmentalime-strain curves for RS, CS, and LS (Fig. 1).
For each type of strain analyzed, 2 different parametersor dyssynchrony were obtained: maximal time delay be-
Abbreviationsand Acronyms
2D � 2-dimensional
AS-P � anteroseptal toposterior
CRT � cardiacresynchronization therapy
CS � circumferential strain
LS � longitudinal strain
LV � left ventricle/ventricular
RS � radial strain
SDt6s � standard deviationof time to peak-systolicstrain of 6 segments
SDt12s � standarddeviation of time to peak-systolic strain of 12segments
TDI � tissue Dopplerimaging
ween peak systolic strain of 2 seg
ments (most frequently
owt
sdf4
tLtDdsd
1946 Delgado et al. JACC Vol. 51, No. 20, 2008Speckle Tracking to Predict Response to CRT May 20, 2008:1944–52
bserved between the [antero]septum and [postero]lateralall) as well as an asynchrony index of the LV by calculating
he standard deviation of time to peak-systolic strain.For RS and CS, difference between time to peak-systolic
train of the (antero)septal and posterior segments (AS-Pelay) and the standard deviation of time to peak-systolic strainor all 6 segments (SDt6S) were measured. For LS, the 2- and
Figure 1 Two-Dimensional Strain Imaging
In the left panels, the 2-dimensional strain images are represented. The arrows detial shortening (B), and longitudinal shortening (C). The middle and right panels ddyssynchronous (right panels) left ventricle for each view. Time differences in peaview, and between basal-septal (BS) and basal-lateral (BL) segments, in 4-chambe
-chamber views were used to calculate the difference between h
ime to peak-systolic strain of the basal-septal and basal-lateralV segment (BS-BL delay) as well as the standard deviation of
ime to peak-systolic strain for 12 LV segments (SDt12S).efinition of response to CRT. Response to CRT was
efined as displaying a reduction of �15% in LV end-ystolic volume at 6-month follow-up (2). Patients whoied within the 6-month follow-up period or underwent
e type of deformation assessed in each view: radial thickening (A), circumferen-trate the segmental time-strain curves for a synchronous (middle panels) andlic strain (t) between anteroseptal (AS) and posterior (P) segments, in short-axiscan be obtained from these curves.
pict themonsk-systor view,
eart transplantation were classified as nonresponders.
SmpnLrblcwafmtcy�
R
PtiA
hsadpar(daSpussoLsawwmb
1947JACC Vol. 51, No. 20, 2008 Delgado et al.May 20, 2008:1944–52 Speckle Tracking to Predict Response to CRT
tatistical analysis. Continuous variables are presented asean � SD and compared using 2-tailed Student t test for
aired and unpaired data. Categorical data are presented asumber and percentage and compared using chi-square test.inear regression analysis was performed to assess the
elation between the changes in LV end-systolic volume andaseline LV dyssynchrony. In addition, the extent of base-ine LV dyssynchrony, as assessed with the different echo-ardiographic methods, needed to predict response to CRTas determined by receiver operator characteristic curve
nalysis. The optimal cut-off value was defined as the valueor which the sum of sensitivity and specificity was maxi-ized. Finally, 20 patients were randomly selected to test
he intra- and interobserver variability for the LV dyssyn-hrony measurements. Subsequently, linear regression anal-sis and Bland-Altman analysis were performed. A p value0.05 was considered to be statistically significant.
esults
atient baseline characteristics. The baseline characteris-ics of the 161 patients (mean age 66 � 11 years, 125 men)ncluded in the present study are summarized in Table 1.ccording to the inclusion criteria, all patients had severe
Baseline Characteristics of the Study Populatio
Table 1 Baseline Characteristics of the Stu
All Patient(n � 161)
Age (yrs) 66 � 11
Male gender, n (%) 125 (78%)
Body surface area (m2) 1.9 � 0.2
Ischemic etiology, n (%) 92 (57%)
QRS duration (ms) 164 � 32
Sinus rhythm, n (%) 123 (76%)
NYHA functional class 3.0 � 0.5
Quality-of-life score 41 � 16
6-min walking distance (m) 279 � 132
LV end-diastolic diameter (mm) 70 � 11
LV end-diastolic volume (ml) 245 � 89
LV end-diastolic volume index (ml/m2) 126 � 48
LV end-systolic volume (ml) 191 � 82
LV end-systolic volume index (ml/m2) 99 � 44
LV ejection fraction, (%) 23 � 7
Diastolic function, n (%)
Normal filling pattern 11 (7%)
Abnormal relaxation pattern 59 (37%)
Pseudonormal filling pattern 36 (22%)
Restrictive filling pattern 55 (34%)
LV dyssynchrony by TDI (ms) 84 � 55
AS-P delay by RS (ms) 180 � 135
SDt6S by RS (ms) 107 � 71
AS-P delay by CS (ms) 162 � 128
SDt6S by CS (ms) 128 � 69
BS-BL delay by LS (ms) 136 � 101
SDt12S by LS (ms) 115 � 42
AS-P delay � difference between time to peak systolic strain of the anto peak systolic strain of the basal-septal and basal-lateral segments
NYHA � New York Heart Association; RS � radial strain; SDt6S � standard dstandard deviation of the time to peak systolic strain of 12 segments; TDI �eart failure (mean NYHA functional class 3.0 � 0.5), withevere LV dysfunction (mean LV ejection fraction 23 � 7%)nd wide QRS complex (mean 164 � 32 ms). Mean LVyssynchrony as assessed with TDI was 84 � 55 ms. Allatients had optimized medical therapy, includingngiotensin-converting enzyme inhibitors or angiotensin-eceptor antagonists (85%), beta-blockers (62%), diuretics85%), and spironolactone (40%), at maximum toleratedosages. Device implantation was successful in all patients,nd no complications were observed.peckle tracking strain analysis and LV dyssynchrony. Allatients were analyzed at baseline and at 6-month follow-p. In the midventricular short-axis images, RS bypeckle tracking was possible in 90% of 1,896 attemptedegments. Reliable CS-time curves were obtained in 85%f the same 1,896 attempted segments. The feasibility forS in 2- and 4-chamber views was 79%; only 2,990
egments from 3,792 attempted segments could be reli-bly evaluated. The lesser feasibility for assessment of LSas due to nonvalid tracking at the apical segments,here 30% of the segments had to be discarded. Further-ore, reproducibility for the different time delays was
etter when 2D RS was used (Table 2).
pulation
Responders(n � 88)
Nonresponders(n � 73) p Value
67 � 10 66 � 12 0.4
64 (73%) 61 (84%) 0.1
1.9 � 0.2 2.0 � 0.2 0.2
48 (55%) 44 (60%) 0.3
171 � 31 155 � 32 0.002
64 (73%) 59 (81%) 0.4
3.0 � 0.5 3.0 � 0.5 0.2
39 � 16 44 � 16 0.1
294 � 122 263 � 142 0.2
71 � 11 69 � 11 0.2
260 � 90 226 � 86 0.01
136 � 50 114 � 42 0.005
208 � 85 171 � 75 0.004
108 � 47 86 � 37 0.001
21 � 6 25 � 8 0.001
0.1
3 (11%) 8 (3%)
37 (30%) 22 (42%)
20 (22%) 16 (23%)
28 (37%) 27 (32%)
106 � 54 58 � 44 �0.001
251 � 138 94 � 65 �0.001
130 � 67 79 � 65 �0.001
204 � 143 162 � 128 0.1
145 � 59 128 � 69 0.1
170 � 134 136 � 101 0.1
121 � 42 109 � 41 0.1
ptal and posterior segments; BS-BL delay � difference between timecircumferential strain; LS � longitudinal strain; LV � left ventricular;
n
dy Po
s
terose; CS �
eviation of the time to peak systolic strain of 6 segments; SDt12S �
tissue Doppler imaging.
cpw(wRafsr0461
ss8vo
aAscSasSRfCLpw6
epmi6
s8it(f
tfssa
wSs9[ee(ba(a3sa
abnsPacRcc
t1t
If
*
La
A
1948 Delgado et al. JACC Vol. 51, No. 20, 2008Speckle Tracking to Predict Response to CRT May 20, 2008:1944–52
In the overall population, substantial baseline dyssyn-hrony was present, as indicated by long time delays ineak-systolic strain between the anteroseptal and posteriorall, as well as high standard deviations by RS and CS
Table 1). Also, an important BS-BL delay was observedith longitudinal strain, as well as an important SDt12S.esponse to CRT. Before the 6-month follow-up evalu-
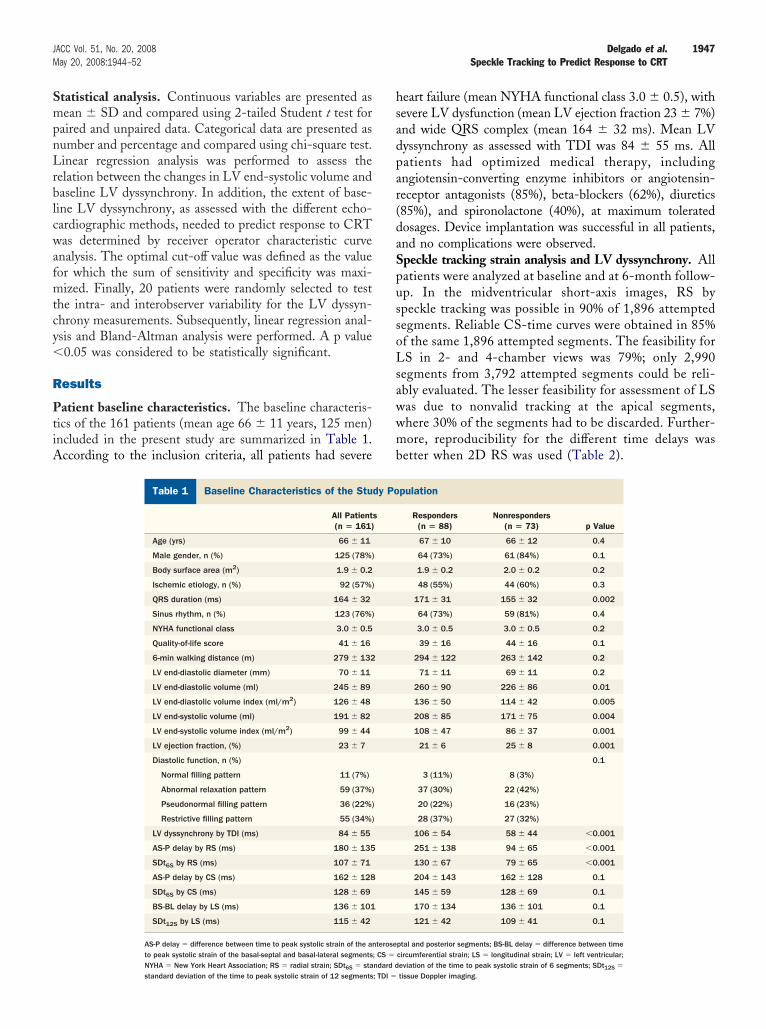
tion, 2 patients underwent heart transplantation and 4 diedrom worsening heart failure. In the entire patient group, aignificant improvement in clinical status was noted, with aeduction in NYHA functional class (from 3.0 � 0.5 to 2.1 �.7; p � 0.001), a reduction in quality-of-life score (from1 � 16 to 27 � 19; p � 0.001), and an increase in-minute walking distance (from 279 � 132 m to 377 �39 m; p � 0.001).On echocardiography, LV ejection fraction improved
ignificantly, from 23 � 7% to 30 � 9% (p � 0.001), andignificant reductions in LV end-diastolic volume (245 �9 ml to 215 � 81 ml; p � 0.001) and LV end-systolicolume (191 � 82 ml to 155 � 71 ml; p � 0.001) werebserved.In Table 3, the different parameters for LV dyssynchrony
re reported at baseline and at 6-month follow-up. Both theS-P delay and SDt6s as assessed with RS, showed a
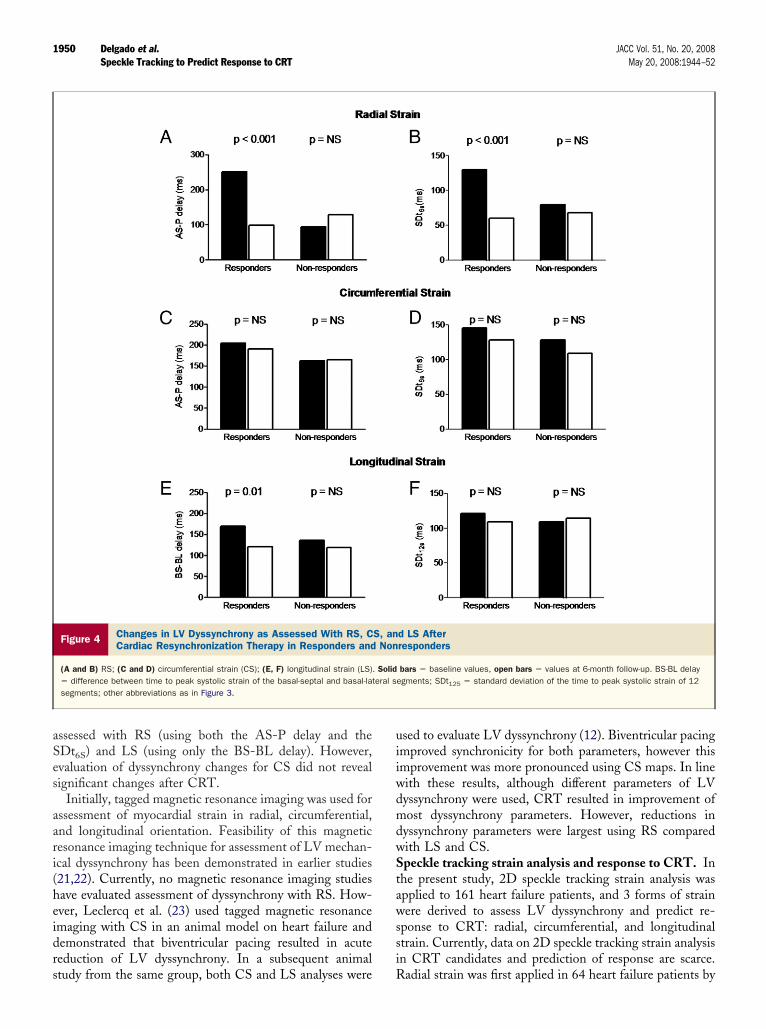
ignificant reduction in time delay at 6-month follow-up. Inontrast, for the same parameters assessed with CS, only theDt6s demonstrated a significant reduction after CRT. Inddition, BS-BL delay as assessed by LS also showed aignificant reduction at 6-month follow-up, whereas theDt12s remained unchanged.esponders versus nonresponders to CRT. At 6-month
ollow-up, 88 patients (55%) were classified as responders toRT, according to the predefined criterion of a reduction inV end-systolic volume by more than 15%. Conversely, 73atients (45%) were nonresponders, including the 6 patientsho died or underwent heart transplantation before the-month follow-up.Responders showed (by definition) a reduction in LV
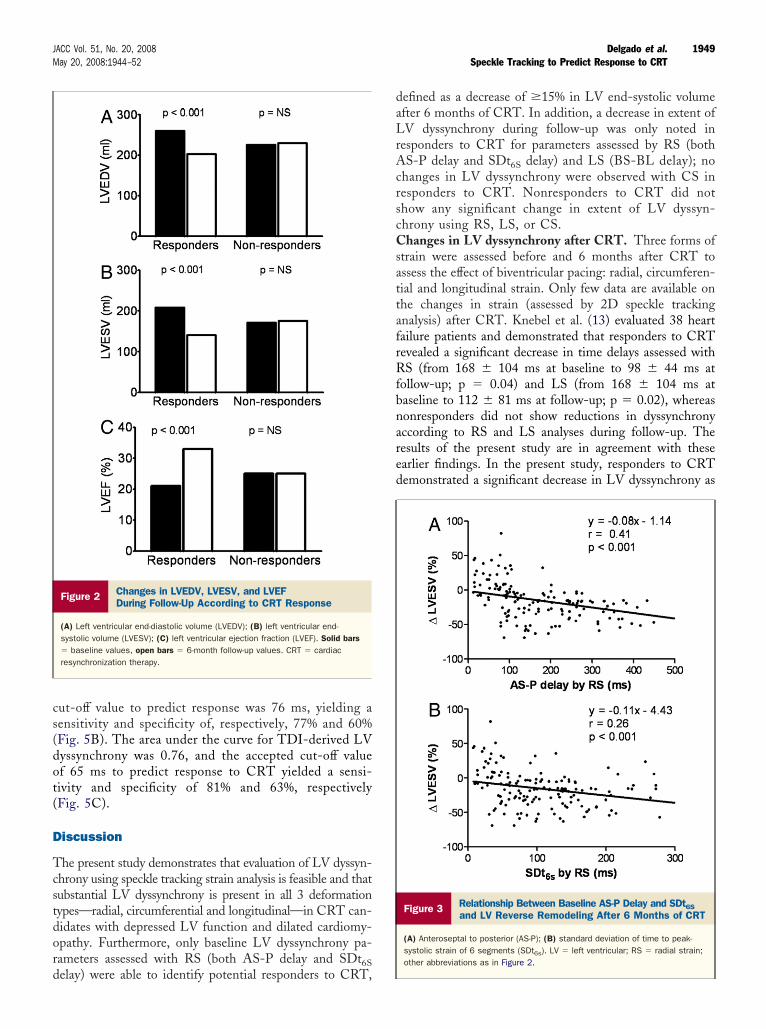
nd-systolic volume (from 208 � 85 ml to 140 � 72 ml;� 0.001) and in LV end-diastolic volume (from 260 � 90l to 203 � 82 ml; p � 0.001) (Fig. 2). Furthermore, an
mprovement in LV ejection fraction was noted (from 21 �% to 33 � 9%; p � 0.001). In contrast, nonresponders
ntraobserver and Interobserver Variabilityor the Different LV Dyssynchrony Parameters
Table 2 Intraobserver and Interobserver Variabilityfor the Different LV Dyssynchrony Parameters
Intraobserver Interobserver
Difference r Difference r
AS-P delay by RS (ms) �3 � 23 0.98* 0.3 � 24 0.97*
SDt6S by RS (ms) �5 � 29 0.88* 3 � 28 0.88*
AS-P delay by CS (ms) 11 � 53 0.91* �10 � 55 0.80*
SDt6S by CS (ms) 6 � 36 0.66† �6 � 27 0.70†
BS-BL delay by LS (ms) �17 � 36 0.93* 4 � 22 0.92*
SDt12S by LS (ms) 7 � 22 0.72* �7 � 13 0.88*
up � 0.001; †p � 0.05.Abbreviations as in Table 1.
howed no improvement in LV ejection fraction (from 25 �% to 25 � 7%; p � NS) and showed a trend toward anncrease in both LV end-systolic volume (from 171 � 75 mlo 175 � 66 ml; p � 0.05) and LV end-diastolic volumefrom 226 � 86 ml to 230 � 77 ml; p � NS) at 6-monthollow-up (Fig. 2).
Baseline clinical and echocardiographic parameters be-ween responders and nonresponders were similar, exceptor smaller LV volumes, higher LV ejection fraction, andhorter QRS duration in nonresponders. Furthermore, re-ponders exhibited more baseline LV dyssynchrony asssessed with TDI compared with nonresponders (Table 1).
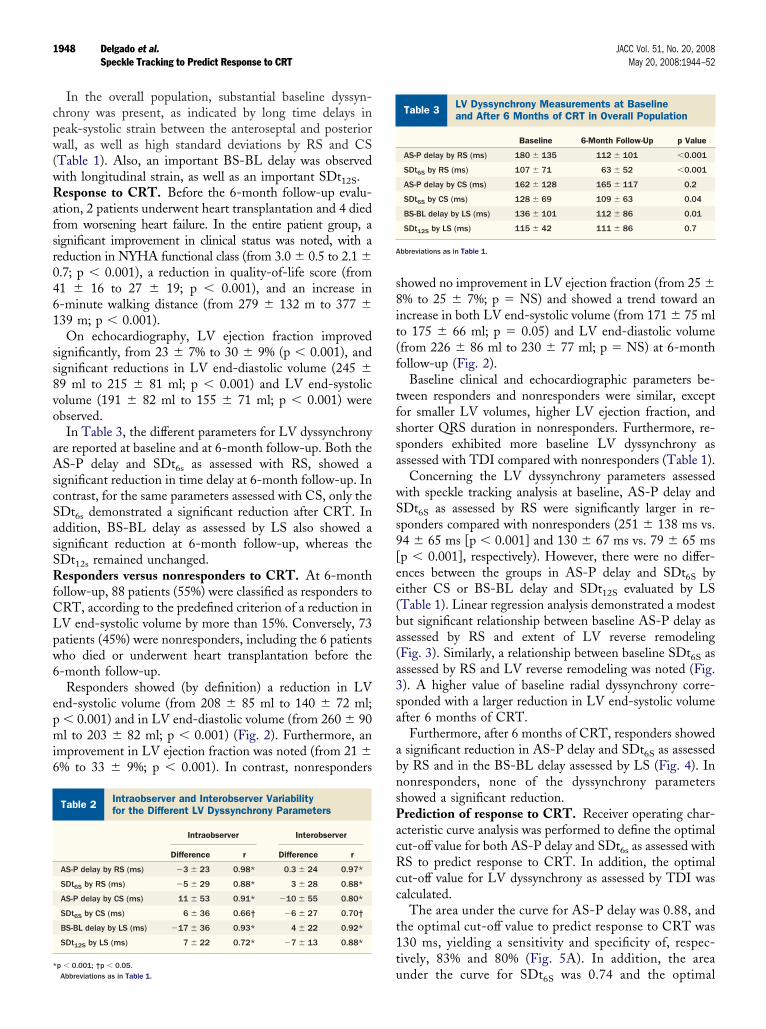
Concerning the LV dyssynchrony parameters assessedith speckle tracking analysis at baseline, AS-P delay andDt6S as assessed by RS were significantly larger in re-ponders compared with nonresponders (251 � 138 ms vs.4 � 65 ms [p � 0.001] and 130 � 67 ms vs. 79 � 65 msp � 0.001], respectively). However, there were no differ-nces between the groups in AS-P delay and SDt6S byither CS or BS-BL delay and SDt12S evaluated by LSTable 1). Linear regression analysis demonstrated a modestut significant relationship between baseline AS-P delay asssessed by RS and extent of LV reverse remodelingFig. 3). Similarly, a relationship between baseline SDt6S asssessed by RS and LV reverse remodeling was noted (Fig.). A higher value of baseline radial dyssynchrony corre-ponded with a larger reduction in LV end-systolic volumefter 6 months of CRT.
Furthermore, after 6 months of CRT, responders showedsignificant reduction in AS-P delay and SDt6S as assessedy RS and in the BS-BL delay assessed by LS (Fig. 4). Inonresponders, none of the dyssynchrony parametershowed a significant reduction.rediction of response to CRT. Receiver operating char-cteristic curve analysis was performed to define the optimalut-off value for both AS-P delay and SDt6s as assessed withS to predict response to CRT. In addition, the optimal
ut-off value for LV dyssynchrony as assessed by TDI wasalculated.
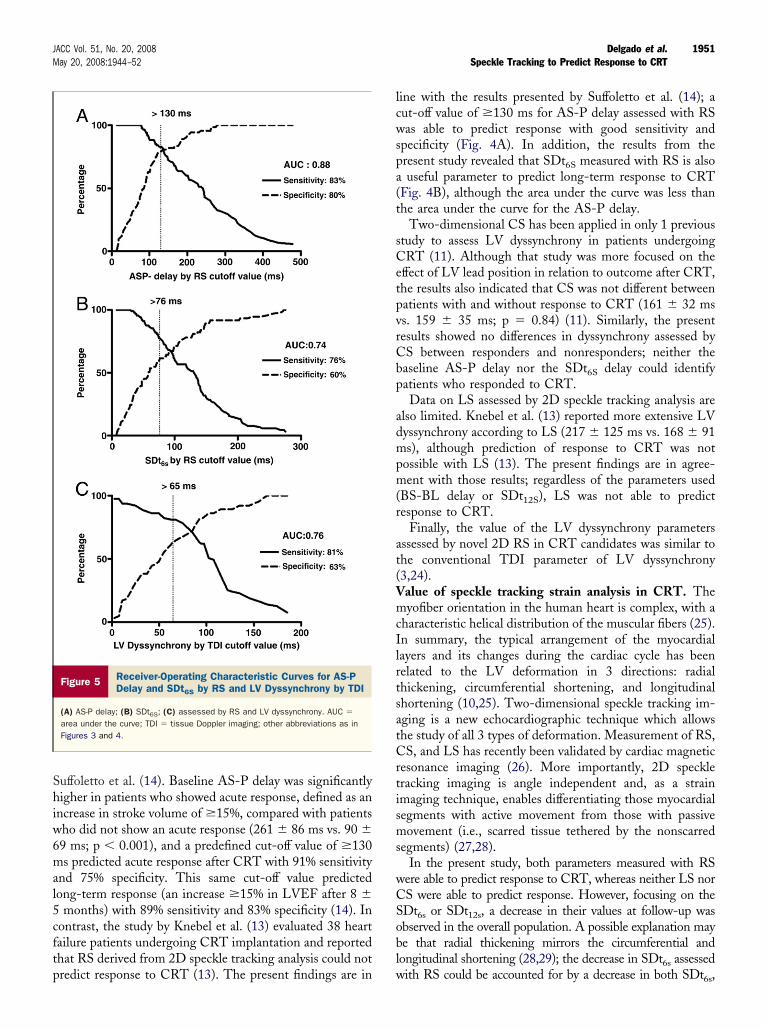
The area under the curve for AS-P delay was 0.88, andhe optimal cut-off value to predict response to CRT was30 ms, yielding a sensitivity and specificity of, respec-ively, 83% and 80% (Fig. 5A). In addition, the area
V Dyssynchrony Measurements at Baselinend After 6 Months of CRT in Overall Population
Table 3 LV Dyssynchrony Measurements at Baselineand After 6 Months of CRT in Overall Population
Baseline 6-Month Follow-Up p Value
AS-P delay by RS (ms) 180 � 135 112 � 101 �0.001
SDt6S by RS (ms) 107 � 71 63 � 52 �0.001
AS-P delay by CS (ms) 162 � 128 165 � 117 0.2
SDt6S by CS (ms) 128 � 69 109 � 63 0.04
BS-BL delay by LS (ms) 136 � 101 112 � 86 0.01
SDt12S by LS (ms) 115 � 42 111 � 86 0.7
bbreviations as in Table 1.
nder the curve for SDt6S was 0.74 and the optimal
cs(dot(
D
Tcstdord
daLrAcrscCsattafrRfbnared
1949JACC Vol. 51, No. 20, 2008 Delgado et al.May 20, 2008:1944–52 Speckle Tracking to Predict Response to CRT
ut-off value to predict response was 76 ms, yielding aensitivity and specificity of, respectively, 77% and 60%Fig. 5B). The area under the curve for TDI-derived LVyssynchrony was 0.76, and the accepted cut-off valuef 65 ms to predict response to CRT yielded a sensi-ivity and specificity of 81% and 63%, respectivelyFig. 5C).
iscussion
he present study demonstrates that evaluation of LV dyssyn-hrony using speckle tracking strain analysis is feasible and thatubstantial LV dyssynchrony is present in all 3 deformationypes—radial, circumferential and longitudinal—in CRT can-idates with depressed LV function and dilated cardiomy-pathy. Furthermore, only baseline LV dyssynchrony pa-ameters assessed with RS (both AS-P delay and SDt6S
Figure 2 Changes in LVEDV, LVESV, and LVEFDuring Follow-Up According to CRT Response
(A) Left ventricular end-diastolic volume (LVEDV); (B) left ventricular end-systolic volume (LVESV); (C) left ventricular ejection fraction (LVEF). Solid bars� baseline values, open bars � 6-month follow-up values. CRT � cardiacresynchronization therapy.
elay) were able to identify potential responders to CRT,
efined as a decrease of �15% in LV end-systolic volumefter 6 months of CRT. In addition, a decrease in extent ofV dyssynchrony during follow-up was only noted in
esponders to CRT for parameters assessed by RS (bothS-P delay and SDt6S delay) and LS (BS-BL delay); no
hanges in LV dyssynchrony were observed with CS inesponders to CRT. Nonresponders to CRT did nothow any significant change in extent of LV dyssyn-hrony using RS, LS, or CS.hanges in LV dyssynchrony after CRT. Three forms of
train were assessed before and 6 months after CRT tossess the effect of biventricular pacing: radial, circumferen-ial and longitudinal strain. Only few data are available onhe changes in strain (assessed by 2D speckle trackingnalysis) after CRT. Knebel et al. (13) evaluated 38 heartailure patients and demonstrated that responders to CRTevealed a significant decrease in time delays assessed withS (from 168 � 104 ms at baseline to 98 � 44 ms at
ollow-up; p � 0.04) and LS (from 168 � 104 ms ataseline to 112 � 81 ms at follow-up; p � 0.02), whereasonresponders did not show reductions in dyssynchronyccording to RS and LS analyses during follow-up. Theesults of the present study are in agreement with thesearlier findings. In the present study, responders to CRTemonstrated a significant decrease in LV dyssynchrony as
Figure 3 Relationship Between Baseline AS-P Delay and SDt6Sand LV Reverse Remodeling After 6 Months of CRT
(A) Anteroseptal to posterior (AS-P); (B) standard deviation of time to peak-systolic strain of 6 segments (SDt6s). LV � left ventricular; RS � radial strain;other abbreviations as in Figure 2.
aSes
aari(heidrs
uiiwdmdwStawssi
1950 Delgado et al. JACC Vol. 51, No. 20, 2008Speckle Tracking to Predict Response to CRT May 20, 2008:1944–52
ssessed with RS (using both the AS-P delay and theDt6S) and LS (using only the BS-BL delay). However,valuation of dyssynchrony changes for CS did not revealignificant changes after CRT.
Initially, tagged magnetic resonance imaging was used forssessment of myocardial strain in radial, circumferential,nd longitudinal orientation. Feasibility of this magneticesonance imaging technique for assessment of LV mechan-cal dyssynchrony has been demonstrated in earlier studies21,22). Currently, no magnetic resonance imaging studiesave evaluated assessment of dyssynchrony with RS. How-ver, Leclercq et al. (23) used tagged magnetic resonancemaging with CS in an animal model on heart failure andemonstrated that biventricular pacing resulted in acuteeduction of LV dyssynchrony. In a subsequent animal
Figure 4 Changes in LV Dyssynchrony as Assessed With RS, CCardiac Resynchronization Therapy in Responders and
(A and B) RS; (C and D) circumferential strain (CS); (E, F) longitudinal strain (LS)� difference between time to peak systolic strain of the basal-septal and basal-latsegments; other abbreviations as in Figure 3.
tudy from the same group, both CS and LS analyses were R
sed to evaluate LV dyssynchrony (12). Biventricular pacingmproved synchronicity for both parameters, however thismprovement was more pronounced using CS maps. In lineith these results, although different parameters of LVyssynchrony were used, CRT resulted in improvement ofost dyssynchrony parameters. However, reductions in
yssynchrony parameters were largest using RS comparedith LS and CS.peckle tracking strain analysis and response to CRT. In
he present study, 2D speckle tracking strain analysis waspplied to 161 heart failure patients, and 3 forms of strainere derived to assess LV dyssynchrony and predict re-
ponse to CRT: radial, circumferential, and longitudinaltrain. Currently, data on 2D speckle tracking strain analysisn CRT candidates and prediction of response are scarce.
d LS Afterresponders
bars � baseline values, open bars � values at 6-month follow-up. BS-BL delayegments; SDt125 � standard deviation of the time to peak systolic strain of 12
S, anNon
. Solideral s
adial strain was first applied in 64 heart failure patients by
Shiw6mal5cftp
lcwspa(t
sCetpvrCbp
admpm(r
at(VmcIlrtsatCrtisms
wCSobl
1951JACC Vol. 51, No. 20, 2008 Delgado et al.May 20, 2008:1944–52 Speckle Tracking to Predict Response to CRT
uffoletto et al. (14). Baseline AS-P delay was significantlyigher in patients who showed acute response, defined as an
ncrease in stroke volume of �15%, compared with patientsho did not show an acute response (261 � 86 ms vs. 90 �9 ms; p � 0.001), and a predefined cut-off value of �130s predicted acute response after CRT with 91% sensitivity
nd 75% specificity. This same cut-off value predictedong-term response (an increase �15% in LVEF after 8 �
months) with 89% sensitivity and 83% specificity (14). Inontrast, the study by Knebel et al. (13) evaluated 38 heartailure patients undergoing CRT implantation and reportedhat RS derived from 2D speckle tracking analysis could not
Figure 5 Receiver-Operating Characteristic Curves for AS-PDelay and SDt6S by RS and LV Dyssynchrony by TDI
(A) AS-P delay; (B) SDt6S; (C) assessed by RS and LV dyssynchrony. AUC �
area under the curve; TDI � tissue Doppler imaging; other abbreviations as inFigures 3 and 4.
redict response to CRT (13). The present findings are in w
ine with the results presented by Suffoletto et al. (14); aut-off value of �130 ms for AS-P delay assessed with RSas able to predict response with good sensitivity and
pecificity (Fig. 4A). In addition, the results from theresent study revealed that SDt6S measured with RS is alsouseful parameter to predict long-term response to CRT
Fig. 4B), although the area under the curve was less thanhe area under the curve for the AS-P delay.
Two-dimensional CS has been applied in only 1 previoustudy to assess LV dyssynchrony in patients undergoingRT (11). Although that study was more focused on the
ffect of LV lead position in relation to outcome after CRT,he results also indicated that CS was not different betweenatients with and without response to CRT (161 � 32 mss. 159 � 35 ms; p � 0.84) (11). Similarly, the presentesults showed no differences in dyssynchrony assessed byS between responders and nonresponders; neither theaseline AS-P delay nor the SDt6S delay could identifyatients who responded to CRT.Data on LS assessed by 2D speckle tracking analysis are
lso limited. Knebel et al. (13) reported more extensive LVyssynchrony according to LS (217 � 125 ms vs. 168 � 91s), although prediction of response to CRT was not
ossible with LS (13). The present findings are in agree-ent with those results; regardless of the parameters used
BS-BL delay or SDt12S), LS was not able to predictesponse to CRT.
Finally, the value of the LV dyssynchrony parametersssessed by novel 2D RS in CRT candidates was similar tohe conventional TDI parameter of LV dyssynchrony3,24).alue of speckle tracking strain analysis in CRT. Theyofiber orientation in the human heart is complex, with a
haracteristic helical distribution of the muscular fibers (25).n summary, the typical arrangement of the myocardialayers and its changes during the cardiac cycle has beenelated to the LV deformation in 3 directions: radialhickening, circumferential shortening, and longitudinalhortening (10,25). Two-dimensional speckle tracking im-ging is a new echocardiographic technique which allowshe study of all 3 types of deformation. Measurement of RS,S, and LS has recently been validated by cardiac magnetic
esonance imaging (26). More importantly, 2D speckleracking imaging is angle independent and, as a strainmaging technique, enables differentiating those myocardialegments with active movement from those with passiveovement (i.e., scarred tissue tethered by the nonscarred
egments) (27,28).In the present study, both parameters measured with RS
ere able to predict response to CRT, whereas neither LS norS were able to predict response. However, focusing on theDt6s or SDt12s, a decrease in their values at follow-up wasbserved in the overall population. A possible explanation maye that radial thickening mirrors the circumferential andongitudinal shortening (28,29); the decrease in SDt6s assessed
ith RS could be accounted for by a decrease in both SDt6s,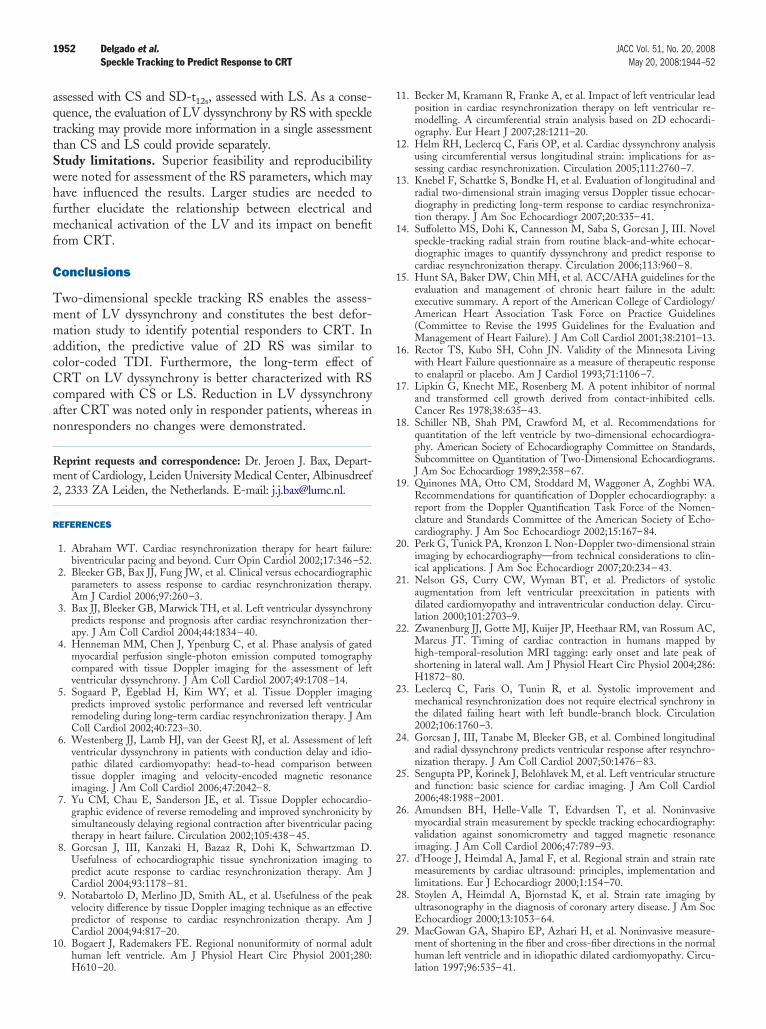
aqttSwhfmf
C
TmmacCcan
Rm2
R
1
1
1
1
1
1
1
1
1
1
2
2
2
2
2
2
2
2
2
2
1952 Delgado et al. JACC Vol. 51, No. 20, 2008Speckle Tracking to Predict Response to CRT May 20, 2008:1944–52
ssessed with CS and SD-t12s, assessed with LS. As a conse-uence, the evaluation of LV dyssynchrony by RS with speckleracking may provide more information in a single assessmenthan CS and LS could provide separately.tudy limitations. Superior feasibility and reproducibilityere noted for assessment of the RS parameters, which mayave influenced the results. Larger studies are needed tourther elucidate the relationship between electrical andechanical activation of the LV and its impact on benefit
rom CRT.
onclusions
wo-dimensional speckle tracking RS enables the assess-ent of LV dyssynchrony and constitutes the best defor-ation study to identify potential responders to CRT. In
ddition, the predictive value of 2D RS was similar toolor-coded TDI. Furthermore, the long-term effect ofRT on LV dyssynchrony is better characterized with RS
ompared with CS or LS. Reduction in LV dyssynchronyfter CRT was noted only in responder patients, whereas inonresponders no changes were demonstrated.
eprint requests and correspondence: Dr. Jeroen J. Bax, Depart-ent of Cardiology, Leiden University Medical Center, Albinusdreef
, 2333 ZA Leiden, the Netherlands. E-mail: [email protected].
EFERENCES
1. Abraham WT. Cardiac resynchronization therapy for heart failure:biventricular pacing and beyond. Curr Opin Cardiol 2002;17:346–52.
2. Bleeker GB, Bax JJ, Fung JW, et al. Clinical versus echocardiographicparameters to assess response to cardiac resynchronization therapy.Am J Cardiol 2006;97:260–3.
3. Bax JJ, Bleeker GB, Marwick TH, et al. Left ventricular dyssynchronypredicts response and prognosis after cardiac resynchronization ther-apy. J Am Coll Cardiol 2004;44:1834–40.
4. Henneman MM, Chen J, Ypenburg C, et al. Phase analysis of gatedmyocardial perfusion single-photon emission computed tomographycompared with tissue Doppler imaging for the assessment of leftventricular dyssynchrony. J Am Coll Cardiol 2007;49:1708–14.
5. Sogaard P, Egeblad H, Kim WY, et al. Tissue Doppler imagingpredicts improved systolic performance and reversed left ventricularremodeling during long-term cardiac resynchronization therapy. J AmColl Cardiol 2002;40:723–30.
6. Westenberg JJ, Lamb HJ, van der Geest RJ, et al. Assessment of leftventricular dyssynchrony in patients with conduction delay and idio-pathic dilated cardiomyopathy: head-to-head comparison betweentissue doppler imaging and velocity-encoded magnetic resonanceimaging. J Am Coll Cardiol 2006;47:2042–8.
7. Yu CM, Chau E, Sanderson JE, et al. Tissue Doppler echocardio-graphic evidence of reverse remodeling and improved synchronicity bysimultaneously delaying regional contraction after biventricular pacingtherapy in heart failure. Circulation 2002;105:438–45.
8. Gorcsan J, III, Kanzaki H, Bazaz R, Dohi K, Schwartzman D.Usefulness of echocardiographic tissue synchronization imaging topredict acute response to cardiac resynchronization therapy. Am JCardiol 2004;93:1178–81.
9. Notabartolo D, Merlino JD, Smith AL, et al. Usefulness of the peakvelocity difference by tissue Doppler imaging technique as an effectivepredictor of response to cardiac resynchronization therapy. Am JCardiol 2004;94:817–20.
0. Bogaert J, Rademakers FE. Regional nonuniformity of normal adult
human left ventricle. Am J Physiol Heart Circ Physiol 2001;280:H610–20.1. Becker M, Kramann R, Franke A, et al. Impact of left ventricular leadposition in cardiac resynchronization therapy on left ventricular re-modelling. A circumferential strain analysis based on 2D echocardi-ography. Eur Heart J 2007;28:1211–20.
2. Helm RH, Leclercq C, Faris OP, et al. Cardiac dyssynchrony analysisusing circumferential versus longitudinal strain: implications for as-sessing cardiac resynchronization. Circulation 2005;111:2760–7.
3. Knebel F, Schattke S, Bondke H, et al. Evaluation of longitudinal andradial two-dimensional strain imaging versus Doppler tissue echocar-diography in predicting long-term response to cardiac resynchroniza-tion therapy. J Am Soc Echocardiogr 2007;20:335–41.
4. Suffoletto MS, Dohi K, Cannesson M, Saba S, Gorcsan J, III. Novelspeckle-tracking radial strain from routine black-and-white echocar-diographic images to quantify dyssynchrony and predict response tocardiac resynchronization therapy. Circulation 2006;113:960–8.
5. Hunt SA, Baker DW, Chin MH, et al. ACC/AHA guidelines for theevaluation and management of chronic heart failure in the adult:executive summary. A report of the American College of Cardiology/American Heart Association Task Force on Practice Guidelines(Committee to Revise the 1995 Guidelines for the Evaluation andManagement of Heart Failure). J Am Coll Cardiol 2001;38:2101–13.
6. Rector TS, Kubo SH, Cohn JN. Validity of the Minnesota Livingwith Heart Failure questionnaire as a measure of therapeutic responseto enalapril or placebo. Am J Cardiol 1993;71:1106–7.
7. Lipkin G, Knecht ME, Rosenberg M. A potent inhibitor of normaland transformed cell growth derived from contact-inhibited cells.Cancer Res 1978;38:635–43.
8. Schiller NB, Shah PM, Crawford M, et al. Recommendations forquantitation of the left ventricle by two-dimensional echocardiogra-phy. American Society of Echocardiography Committee on Standards,Subcommittee on Quantitation of Two-Dimensional Echocardiograms.J Am Soc Echocardiogr 1989;2:358–67.
9. Quinones MA, Otto CM, Stoddard M, Waggoner A, Zoghbi WA.Recommendations for quantification of Doppler echocardiography: areport from the Doppler Quantification Task Force of the Nomen-clature and Standards Committee of the American Society of Echo-cardiography. J Am Soc Echocardiogr 2002;15:167–84.
0. Perk G, Tunick PA, Kronzon I. Non-Doppler two-dimensional strainimaging by echocardiography—from technical considerations to clin-ical applications. J Am Soc Echocardiogr 2007;20:234–43.
1. Nelson GS, Curry CW, Wyman BT, et al. Predictors of systolicaugmentation from left ventricular preexcitation in patients withdilated cardiomyopathy and intraventricular conduction delay. Circu-lation 2000;101:2703–9.
2. Zwanenburg JJ, Gotte MJ, Kuijer JP, Heethaar RM, van Rossum AC,Marcus JT. Timing of cardiac contraction in humans mapped byhigh-temporal-resolution MRI tagging: early onset and late peak ofshortening in lateral wall. Am J Physiol Heart Circ Physiol 2004;286:H1872–80.
3. Leclercq C, Faris O, Tunin R, et al. Systolic improvement andmechanical resynchronization does not require electrical synchrony inthe dilated failing heart with left bundle-branch block. Circulation2002;106:1760–3.
4. Gorcsan J, III, Tanabe M, Bleeker GB, et al. Combined longitudinaland radial dyssynchrony predicts ventricular response after resynchro-nization therapy. J Am Coll Cardiol 2007;50:1476–83.
5. Sengupta PP, Korinek J, Belohlavek M, et al. Left ventricular structureand function: basic science for cardiac imaging. J Am Coll Cardiol2006;48:1988–2001.
6. Amundsen BH, Helle-Valle T, Edvardsen T, et al. Noninvasivemyocardial strain measurement by speckle tracking echocardiography:validation against sonomicrometry and tagged magnetic resonanceimaging. J Am Coll Cardiol 2006;47:789–93.
7. d’Hooge J, Heimdal A, Jamal F, et al. Regional strain and strain ratemeasurements by cardiac ultrasound: principles, implementation andlimitations. Eur J Echocardiogr 2000;1:154–70.
8. Stoylen A, Heimdal A, Bjornstad K, et al. Strain rate imaging byultrasonography in the diagnosis of coronary artery disease. J Am SocEchocardiogr 2000;13:1053–64.
9. MacGowan GA, Shapiro EP, Azhari H, et al. Noninvasive measure-ment of shortening in the fiber and cross-fiber directions in the normal
human left ventricle and in idiopathic dilated cardiomyopathy. Circu-lation 1997;96:535–41.