Embed Size (px)
Citation preview

. . . . . . . . . . . . . . . . . . . . . . . . . . . . . . . . . . . . . . . . . . . . . . . . . . . . . . . . . . . . . . . . . . . . . . . . . . . . . . . . . . . . . . . . . . . . . . . . . . . . . . . . . . . . . . . . . . . . . . . . . . . . . . . . . . . . . . . . . . . . . . . . . . . . . . . . . . . . . . . . . . . . . . . . . . . . . . . . . . . . .
. . . . . . . . . . . . . . . . . . . . . . . . . . . . . . . . . . . . . . . . . . . . . . . . . . . . . . . . . . . . . . . . . . . . . . . . . . . . . . . . . . . . . . . . . . . . . . . . . . . . . . . . . . . . . . . . . . . . . . . . . . . . . . . . . . . . . . . . . . . . . . . . . . . . . . . . . . . . . . . . . . . . . . . . . . . . . . . . . . . . .
Assessment of left ventricular systolic functionby deformation imaging derived from speckletracking: a comparison between 2D and 3Decho modalitiesMikhail Altman, Cyrille Bergerot, Alexandra Aussoleil, Einar S. Davidsen,Franck Sibellas, Michel Ovize, Eric Bonnefoy-Cudraz, Helene Thibault,and Genevieve Derumeaux*
Laboratoire d’Echocardiographie Hopital Louis Pradel, 28 Avenue Doyen Lepine BP Lyon, 69677 Bron Cedex, France
Received 6 January 2013; accepted after revision 8 May 2013; online publish-ahead-of-print 18 September 2013
Aims Deformation imaging is undergoingcontinuousdevelopmentwith theemergenceofnewtechnologies allowing theevalu-ation of the different components of strain simultaneously in three dimensions. Assessment of all global strain parametersin 2D and 3D modes and comparison with LVEF have been the focus of our study.
Methodsand results
Outof 166patients, 147wereevaluatedwith the useof both2D and3Dspeckle-tracking echocardiography (STE).Globalstrain parameters including longitudinal (GLS), circumferential (GCS), radial (GRS) and area strain (AS), as well as leftventricular volumes and ejection fraction were examined. Analysis of strain with 3D STE was faster than with 2D STE(7+2 vs. 24+4 min, P , 0.05). GLS values were similar between 2D and 3D modes (214+ 4 vs. 213+3, NS),while slight differences were observed for GCS (224+7 vs. 227+ 7, P , 0.05) and GRS (27+9 vs. 24+9,P , 0.05). All 2D and 3D strain parameters showed good accuracy in the identification of 2D-LVEF ,55% with AS dem-onstrating superiority over GCS and GRS but not GLS.
Conclusion Three-dimensional STE allows accurate and faster analysis of deformation when compared with 2D STE and might rep-resent a viable alternative in the evaluation of global LV function.
- - - - - - - - - - - - - - - - - - - - - - - - - - - - - - - - - - - - - - - - - - - - - - - - - - - - - - - - - - - - - - - - - - - - - - - - - - - - - - - - - - - - - - - - - - - - - - - - - - - - - - - - - - - - - - - - - - - - - - - - - - - - - - - - - - - - - - - - - - - - - - - - - - - - - - - - - - -Keywords Deformation imaging † Three-dimensional echocardiography † Speckle-tracking echocardiography † Global strain
† Area strain
IntroductionRecently, published EAE/ASE guidelines recommend the use of 3Dechocardiography in assessing LV volumes and ejection fraction asa more accurate and reliable modality.1 Latest advances in speckle-tracking echocardiography (STE) also allow us to track speckles inall three dimensions simultaneously in a full-volume data set.Whether 3D strain assessment is superior to 2D is not yet clear asevident from the conflicting reports about the level of correlationbetween 2D and 3D STE.2 –4
Moreover,3Dstrain offers unique opportunity toquantify the endo-cardial area change ratio by area strain (AS), which combines the ana-lysis of both longitudinal and circumferential deformations of the leftventricle.5 AS has been shown to accurately assess LVEF in patientswith and without heart failure but its accuracy has not been comparedwith all other strain parameters obtained by 2D and 3D STE.6
We aimed (i) to evaluate and compare global longitudinal, circum-ferential, and radial strains between2D and3D modes in a large seriesof patients, (ii) to compare the correlations of these deformationparameters with 2D and 3D-LVEF, (iii) to specifically assess potential
* Corresponding author. Tel: +33 472356907; Fax: +33 0472356910, Email: [email protected]
Published on behalf of the European Society of Cardiology. All rights reserved. & The Author 2013. For permissions please email: [email protected]
European Heart Journal – Cardiovascular Imaging (2014) 15, 316–323doi:10.1093/ehjci/jet103
superiority of AS over longitudinal, circumferential, and radialstrain components.
Methods
Study population and protocolThis study prospectively recruited 166 consecutive patients with ad-equate 2D acoustic window who were scheduled for routine evaluationin our echocardiography department. All the patients were evaluatedwith the use of 2D and 3D modes by a single operator (M.A.) with allthe analysis being performed offline.
Data acquisitionEchocardiography was performed with the use of Artida 4D (ToshibaMedical Systems). All the patients were scanned in the left lateral decubi-tus position with the use of both standard 2D transducer (PST-30SBT)and 2.5 MHz fully sampled 3D matrix array transducer (PST-25SX). Anaverage frame rate for 2D acquisition was 58+4 fps, whereas anaverage volume rate for the 3D mode was 24+3 vps. In the 2D mode,standard three parasternal short-axis views (basal, mid, and apicallevels) were obtained for the assessment of global radial (GRS) andglobal circumferential (GCS) strains and three apical views for the assess-ment of global longitudinal strain (GLS). Standard techniques were usedto obtain M-mode, 2D, and Doppler measurements in accordance withthe American Society of Echocardiography guidelines.7 End-diastolic(EDV) and end-systolic (ESV) volumes and LV ejection fraction (LVEF)were measured manually using the biplane Simpson’s method in the2D mode and were automatically calculated by the wall motion tracking(WMT) software in the 3D mode (Toshiba Medical Systems).
Strain analysisBoth 2D and 3D echocardiographic images were analysed using theWMT software. The best cardiac cycle was selected based on optimalendocardial definition and quality of ECG tracing with all the measure-ments performed by single operator. Endocardial border was manuallytraced at the end of diastole with papillary muscles included in LVcavity. The WMT software automatically tracked the endocardial andepicardial borders frame by frame throughout the whole cardiac cyclewith minimal adjustments made to the endocardial contours whennecessary to optimize the boundary position and tracking. Trackingquality was assessed by visual assessment of the adequacy betweenendocardial border and its delineation by the software. Anyone withmore than three inadequately tracked segments was excluded from thestudy.
In the 2D mode, GLS values were calculated as an average of strainvalues obtained from the three apical views, whereas GCS and GRSvalues were calculated as an average of strain values obtained from thebasal, mid, and apical parasternal short-axis views. In the 3D mode,GLS, GCS, and GRS as well as AS were measured automatically bythe software from the single full-volume acquisition. To ensurecomparable results between 2D and 3D modes, strain values wererecorded at the time of the aortic valve closure, which was manuallyentered.
Statistical analysisStatistical analysis was performed using SPSS for Windows version 15.0(SPSS, Inc., Chicago, IL, USA) and R version 2.15.2 (2012, the R Founda-tion for Statistical Computing). Continuous and normally distributedvariables were expressed as mean+ standard deviation, and variables
deviating from normality were expressed as median (inter-quartilerange).Categorical variableswereexpressed aspercentage.Correlationswere tested between 2D and 3D strains, and the Bland–Altman methodwas used to assess the agreements between different indices.8 Linearregressions were performed between (i) each component of 2D strainand 2D LVEF; (ii) each component of 3D strain including AS with both2D LVEF and 3D LVEF. Receiver-operating characteristic (ROC) curveswere constructed for each component of 2D and 3D strains for theproper identification of 2D LVEF and 3D LVEF ,55%. Area under thecurve (95% CI), sensitivity, specificity, and optimal cut-off value weregiven for each ROC curve. Formal paired comparisons of ROC curvesfor the prediction of 2D or 3D LVEF ,55% were performed using theDeLong method.9 Different logistic regression models were applied totest any difference between (i) each component of 2D strain, (ii) eachcomponent of 3D strain, (iii) 2D and 3D longitudinal, (iv) 2D and 3D cir-cumferential, (v) 2D and 3D radial strains. Finally, AS was added to themodel (2). Differences were considered to be statistically significantwhen P , 0.05.
Reproducibility analysisIntra- and inter-observer variability of both LVEF and strain measure-ments was evaluated in 10 randomly selected patients. To testintra-observer variability, the same primary operator analysed selecteddata sets twice at least 2 weeks apart. Operator was blinded to theresult of the previous measurements during second evaluation. To testinter-observer variability, a second experienced observer was givendata sets with no access to information regarding all prior measurements.Intra- and inter-observer variability was calculated as an absolute differ-ence between two measurements over the mean of those measurementsand presented as the mean percentage error.
ResultsOut of 166 patients prospectively enrolled in this study, 19 wereexcluded due to inadequate myocardial tracking (n ¼ 13 both in2D and 3D modes; n ¼ 3 only in the 3D mode) or rhythm distur-bances (n ¼ 3).
Among the remaining 147 examined subjects (mean age: 54+15years, 76% males), 70 patients were included with a diagnosis of is-chaemic cardiomyopathy, 23 with heart failure and preserved ejec-tion fraction, 11 with hypertrophic cardiomyopathy, 3 with Fabrydisease, 34 with hypertensive heart disease, and 6 healthy volunteerswith no previous cardiac history. Such mix of pathologies provided awide spectrum of LVEF (ranging between 21 and 72%).
The mean 2D-LVEF was slightly but significantly higher than themean 3D-LVEF (58+9 vs. 57+9%, P , 0.05). The correlation ofLVEF values obtained by two modes was good (r ¼ 0.9, P , 0.05).The mean EDV was higher in 2D than in the 3D mode (91+27 vs.85+23mL P , 0.05), whereas ESV was similar in both modes(38+17 vs. 37+ 16mL, P ¼ 0.07).
Average acquisition and analysis time was significantly shorter for3D STE (7+2 min) than 2D STE (24+ 4 min), which included GLS,GCS, and GRS analysis in six standard views (P , 0.05).
Comparison between 2D and 3D globalstrain values and their correlationsTable 1 presents the comparison between 2D and 3D strain values.Although GLS values were similar between 3D STE and 2D STE
Assessment of left ventricular systolic function by deformation imaging derived from speckle tracking 317

(213+ 3vs. 214+ 4%;P ¼ NS),GCS valueswereslightlyhigher in3D STE than in 2D STE and GRS values were lower in 3D STE than in2D STE. All strain parameters significantly correlated between 2Dand 3D modes (Figure 1).
Intra- and inter-observer variability is presented in Table 2. Al-though variability for GLS and GCS were comparable using 2D and3D STE, GRS variability was consistently improved by 3D STEwhen compared with 2D STE, approaching similar reproducibilityas GLS and GCS. AS had the lowest intra-observer variability(7.3%) and similar inter-observer variability as all other 3D STEstrain parameters (10.2%).
Figure 1 Linear regression and Bland–Altman analyses for global strain parameters between 2D and 3D modes. (A) global longitudinal strain,(B) global circumferential strain and panel (C) global radial strain.
. . . . . . . . . . . . . . . . . . . . . . . . . . . . . . . . . . . . . . . . . . . . . . . . . . . . . . . . . . . . . . . . . . . . . . . . . . . . . . . .
Table 1 Global strain values obtained by 2D and 3Dspeckle-tracking echocardiography
Deformation index 2D STE 3D STE
Global longitudinal strain % 214+4 213+3
Global circumferential strain % 224+7 227+7*
Global radial strain % 27+9 24+9*
Area strain % 239+8
*P , 0.05, 3D STE vs. 2D STE.
M. Altman et al.318

Correlation between LVEF anddeformation indices in 2D and 3D modesFigure 2 illustrates the correlations between LVEF and deformationindices in 2D and 3D modes.
In the 2D mode, all strain parameters significantly correlated with2D-LVEF with GCS presenting a higher coefficient of the correlationvalue (r ¼ 20.72, P , 0.05) than GLS (r ¼ 20.67, P , 0.05) or GRS(r ¼ 0.55, P , 0.05).
Similar findings were observed when 3D strain values were com-pared with 2D-LVEF [GCS (r ¼ 20.85, P , 0.05); GLS (r ¼ 20.68,P , 0.05); and GRS (r ¼ 0.57, P , 0.05)] and with 3D-LVEF [GCS(r ¼ 20.89, P , 0.05); GLS (r ¼ 20.69, P , 0.05); and GRS(r ¼ 0.65, P , 0.05)]. Among the different deformation parameters,3D GCS showed a higher correlation with LVEF than 2D GCS.However, when compared with 2D GCS, 3D GCS did not improvethe identification of patients with LVEF ,55% as demonstrated bysimilar AUC values by ROC curve analysis (Table 3).
Furthermore, AS, an exclusive 3D parameter, provided a highervalue of coefficient of correlation with both 2D-LVEF (r ¼ 20.87)and 3D-LVEF (r ¼ 20.91), when compared with GLS, GCS, andGRS (Figure 3). ROC curve analysis demonstrated that for the identi-fication of 2D-LVEF ,55%AS [AUC ¼ 0.92 (0.87–0.97)] was super-ior to 3D GCS [AUC ¼ 0.89 (0.83–0.95), P , 0.008] and 3D GRS[AUC ¼ 0.83 (0.76–0.91), P , 0.007] but not 3D GLS [AUC ¼0.85 (0.79–0.92), P , 0.0187].
To identify 3D-LVEF ,55%, AS [AUC ¼ 0.95 (0.92–98)] was su-perior to 3D GLS [AUC ¼ 0.84 (0.78–90), P , 0.0001] and 3D GRS[AUC ¼ 0.86 (0.80–93), P , 0.007], but not 3D GCS [AUC ¼ 0.94(0.90–0.97), P , 0.06] (Figure 4).
DiscussionOur study has specifically focused on (i) the comparison of 2D and3D speckle tracking in assessing longitudinal, circumferential, andradial strains, (ii) the validation of the reproducibility and feasibilityof 3D strain parameters including AS across a wide range of LVEF,and (iii) the potential superiorityof AS overother strain components.
Our main results are: (i) GLS values were similar in 2D and 3Dmodes, while slight but significant differences were observed forGCS and GRS; (ii) none of the 3D strain indices (GLS, GCS, andGRS) was proved to be superior to the corresponding 2D strainindices in assessing LVEF; (iii) AS was accurate but not superior toGLS in identifying 2D-LVEF ,55%.
Our study has confirmed the feasibility of 3D STE in the evaluationof global systolic function. While AS, a new parameter combining lon-gitudinal and circumferential deformations appears to be of potentialinterest in our series it did not demonstrate clear advantage over 3DGLS in identification of decreased 2D LVEF.
There are ongoing arguments for the use of 3D deformationimaging and its ability to overcome well-known limitations of 2DSTE. Indeed, the 3D mode avoids foreshortening of apical views, con-sumes less time in acquisition and analysis, and is able to track motionof speckles in all three dimensions and therefore helps to eradicatethe problem of out-of-plane motion inheritably present in 2D modal-ity.2 However, this advantage comes at a cost of lower volume rate,which might alter the correlations with measurements obtained by2D STE.10
Since, wedidnotfirmlyestablish the superiorityof 3D STEover2DSTE for the evaluation of all three components of LV deformation(GLS, GCS, and GRS) we therefore agree that strain values are notinterchangeable between 2D and 3D modes due to the differencesin acquisition rates,10 problems of adequate tracking of the apical seg-ments and out-of-plane motion inherent to 2D acquisition.11 Whilewe observed similarity between 2D and 3D GLS values which in partmight be due to the fact that with this vendor’s algorithm both aremeasured predominantly in the endocardium, our results did notsupport previous observations demonstrating that 3D STE underes-timated longitudinal strain when compared with 2D STE.3,4,12 In add-ition, the feasibilityof 3D STE whencomparedwith 2D STE maybe anissue.10 Importantly, our data cannot be extended to other echomachines because of the high variability that exists between ultra-sound systems.12– 14 Indeed, Badano et al. have recently pointedout poor intervendor reproducibility by comparing the ArtidaTM
(Toshiba) with the Vivid 9 system (GE Vingmed Ultrasound AS).13
In our study, we also paid attention to measure strain values in bothmodes at the same time (i.e. aortic valve closure), which was manuallyentered. The importance to standardize the timing of the measure-ments is crucial, since 3D strain values are usually measured at thetime of the minimal systolic volume, which is automatically deter-mined by the software and is often observed just before the mitralvalve opening. As a consequence of such standardization, we didnot observe any significant difference in longitudinal strain valuesbetween 2D and 3D modes, but we reported slightly higher valuesof circumferential strain and lower radial strain values using 3DSTE. In addition, 3D STE improved the intra- and inter-observer re-producibility for GRS when compared with 2D STE. These resultsare not concordant with previous studies pointing out lower repro-ducibility of 3D radial strain values.15,16
Furthermore, we evaluated the interest of 3D STE in assessing AS,a new deformation parameter exploring the variation in the endocar-dial surface area during the cardiac cycle by combining the data fromlongitudinal and circumferential components. Accuracy of the AS inidentifying abnormal regional myocardial function has been previous-ly tested against sonomicrometry during acute experimental
. . . . . . . . . . . . . . . . . . . . . . . . . . . . . . . . . . . . . . . . . . . . . . . . . .
. . . . . . . . . . . . . . . . . . . . . . . . . . . . . . . . . . . . . . . . . . . . . . . . . . . . . . . . . . . . . . . . . . . . . . . . . . . . . . . .
Table 2 Intra- and inter-observer variability of 2Dand 3D LVEF and strain parameters
Parameter Intra-observervariability
Inter-observervariability
2D mode(%)
3D mode(%)
2D mode(%)
3D mode(%)
Left ventricularejection fraction
5.7 2.1 10.6 7.3
Global longitudinalstrain
8.7 11.0 11.9 10.9
Global circumferentialstrain
10.5 10.9 12.0 11.9
Global radial strain 14.9 11.2 21.2 13.2
Area strain – 7.3 – 10.2
Assessment of left ventricular systolic function by deformation imaging derived from speckle tracking 319

Figure 2 Linear regression analysis between global strain parameters and LVEF in 2D and 3D modes. Receiver-operating characteristic curves for global strain parameters in 2D and 3D modes. Upperpanel: global longitudinal strain. Mid panel: global circumferential strain. Lower panel: global radial strain.
M.A
ltman
etal.320

ischaemia studies5 and magnetic resonance imaging in patients withcoronary heart disease.17 Recent report provided a normal valueof global AS of—38.9+5.9% in a series of 60 healthy subjects thatwere close to our cut-off value of—36.7% to identify abnormalLVEF.18 Owing to its high reliability and reproducibility AS could beused to monitor changes in LV function in patients with chronic
heart failure and myocardial disease following therapeutic interven-tions including cardiac resynchronization therapy.19 Despite thefact that we agree with two previous studies establishing AS as apromising tool in characterization of LV systolic function, our datadid not firmly established this parameter as a superior index whencompared with GLS.6,15 Of note, these two studies established su-periority of AS when compared with all other components of de-formation on the sole interpretation of correlation coefficientsbetween LVEF and deformation indices but not on the ROC curveanalysis.6,15 In our study, we have deliberately constructed ROCcurves in order to test the accuracyof each of the 2D and 3D deform-ation indices in the evaluation of LVEF. We can therefore concludethat AS was superior to GCS and GRS but not GLS in identificationof 2D-LVEF ,55%.
Study limitationsDespite the fact thatwehada large cohortof patients inour study, thesample size could potentially benefit from a larger group of healthyvolunteers. Also, the relationship between 3D strain parametersand LVEF might have been better assessed by adding a referencemethod for comparison. Indeed, we have compared 3D strain para-meters to2DLVEF sincedifferent algorithmsareused tocalculate thevolumesand strain values. In additiona small subgroupofpatients alsounderwent cardiac MRI for the assessment of LV function. Despitethe small number of patients (n ¼ 9), we found good correlationbetween 2D LVEF, 3D LVEF, and MRI LVEF (r ¼ 0.85 and r ¼ 0.89,P , 0.05, respectively) and between 3D strain parameters and MRILVEF (AS: r ¼ 20.91, P , 0.05) (data not shown).
. . . . . . . . . . . . . . . . . . . . . . . . . . . . . . . . . . . . . . . . . . . . . . . . . . . . . . . . . . . . . . . . . . . . . . . . . . . . . . . .
Table 3 Area under the curve and confidence intervalvalues for 2D and 3D strain parameters in identificationof 2D and 3D LVEF <55%; P-values provided from thepaired comparison of ROC curves by the DeLongmethod
LVEF Strain index AUC 95% CI P-value
2D 2D GLS 0.87 0.81–0.93 0.463D GLS 0.85 0.79–0.922D GCS 0.88 0.82–0.94 0.813D GCS 0.89 0.83–0.952D GRS 0.82 0.74–0.90 0.593D GRS 0.83 0.76–0.91
3D 2D GLS 0.87 0.82–0.93 0.193D GLS 0.84 0.78–0.902D GCS 0.90 0.85–0.95 0.253D GCS 0.94 0.90–0.972D GRS 0.85 0.77–0.92 0.533D GRS 0.86 0.80–0.93
Figure 3 Linear regression analysis between area strain and 2D LVEF and 3D LVEF and receiver-operating characteristic curves.
Assessment of left ventricular systolic function by deformation imaging derived from speckle tracking 321

The presence of a large proportion of patients with a documentedhistory of ischaemic cardiomyopathy and patients with symptoms ofheart failure and preserved LVEF may potentially explain reducedvalue of GLS in particular and should be interpreted with cautionwhen extrapolated on other group of patients.
Global strain values in both modes were deliberately evaluated atthe same time (AVC), which was manually entered to allow somestandardization of the measured values. This step enables us to syn-chronise the timingof the measurements, and therefore tominimizedthe differences between 2D and 3D strain measurement. However,the absolute values of global strain might vary between 2D and 3Dmodes due to differences in the frame/volume rate. It might to acertain degree account for the differences that were observedbetween strain values obtained via different modes.
And finally, existing differences between vendors must be takeninto consideration when results of our study are being comparedwith the findings presented by others using different machines.
ConclusionThree-dimensional echocardiography is currently undergoing phaseof extensive evaluation and continues to remain an area of interestand controversy. Indeed, it is the only modality that allows
simultaneous assessment of LV volumes, LVEF and all multidirection-al components of strain. We have demonstrated that 3D STE pro-vides faster and more reproducible data in the evaluation of LVfunction when compared with 2D STE. However, further improve-ments are needed to firmly establish this technology as superior to2D in the assessment of deformation.
AcknowledgementsEquipment grant from Toshiba Medical Systems.
Conflict of interest: none declared.
FundingNo funding was received for this study.
References1. Lang RM, Badano LP, Tsang W, Adams DH, Agricola E, Buck Tet al. EAE/ASE Recom-
mendations for Image Acquisition and Display Using Three-Dimensional Echocardi-ography. EHJ Cardiovasc Imaging 2012;13:1–46.
2. Perez de Isla L, Balcones DV, Fernandez-Golfın C, Marcos-Alberca P, Almerıa C,Rodrigo JL et al. Three-dimensional-wall motion tracking: a new and faster tool formyocardial strain assessment: comparison with two-dimensional-wall motion
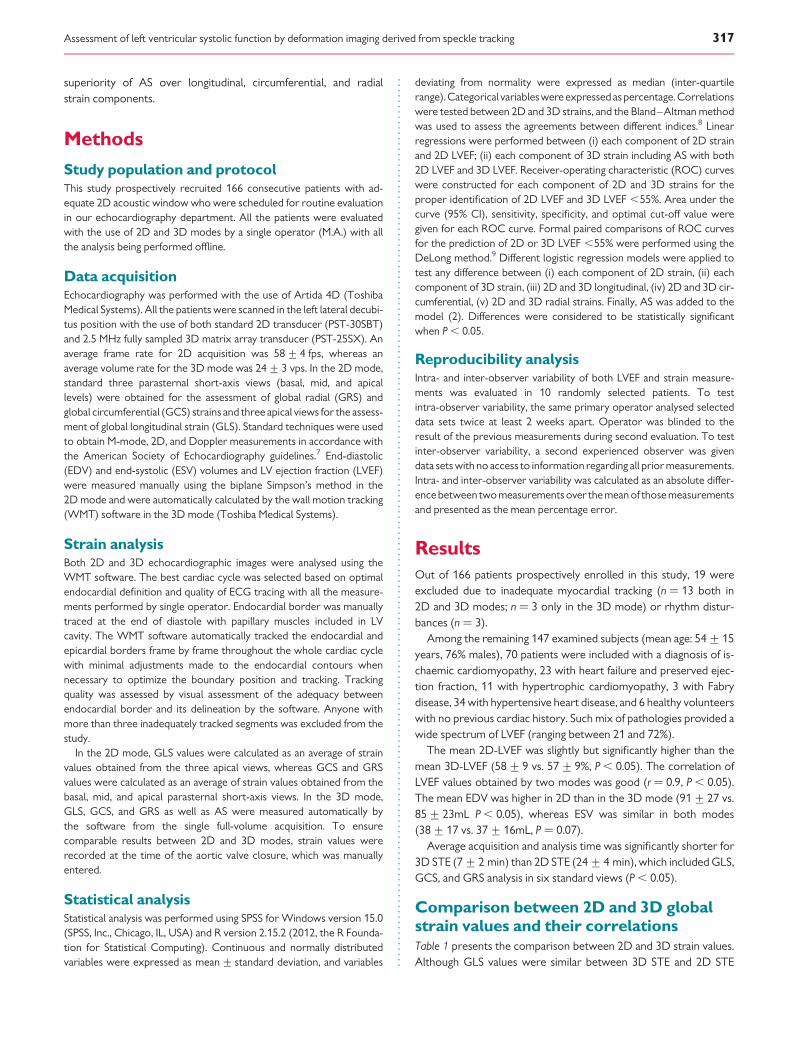
Figure4 Measurements of the left ventricular volumes, ejection fraction and deformation parameterarea strain, using three-dimensional speckle-tracking echocardiography. Visual information on area strain is shown in colour overlay superimposed on grey-scale image. (A) normal subject.(B) patient with ischaemic cardiomyopathy following inferior myocardial infarction.
M. Altman et al.322

tracking. J Am Soc Echocardiogr 2009;22:325–30. Erratum in: J Am Soc Echocardiogr.2009;22:745-e1.
3. Saito K, Okura H, Watanabe N, Hayashida A, Obase K, Imai K et al. Comprehensiveevaluation of left ventricular strain using speckle tracking echocardiography innormal adults: comparison of three-dimensional and two-dimensional approaches.J Am Soc Echocardiogr 2009;22:1025–30.
4. Maffessanti F, Nesser HJ, Weinert L, Steringer-Mascherbauer R, Niel J, Gorissen Wet al. Quantitative evaluation of regional left ventricular function using three-dimensional speckle tracking echocardiography in patients with and without heartdisease. Am J Cardiol 2009;104:1755–62.
5. Seo Y, Ishizu T, Enomoto Y, Sugimori H, Aonuma K. Endocardial surfacearea trackingfor assessment of regional LV wall deformation with 3D speckle tracking imaging.JACC Cardiovasc Imaging 2011;4:358–65.
6. Wen H, Liang Z, Zhao Y, Yang K. Feasibility of detecting early left ventricular systolicdysfunction using global area strain: a novel index derived from three-dimensionalspeckle-tracking echocardiography. Eur J Echocardiogr 2011;12:910–6. Epub 6 Sep-tember 2011.
7. Lang RM, Bierig M, Devereux RB, Flachskampf FA, Foster E, Pellikka PA et al. Recom-mendations for chamber quantification. Eur J Echocardiogr 2006;7:79–108.
8. Bland J, Altman D. Statistical methods for assessing agreement between twomethods of clinical measurement. Lancet 1986;1:307–10.
9. DeLong E, DeLong D, Clarke-Pearson D. Comparing the areas under two or morecorrelated receiver operating characteristic curves: a nonparametric approach. Bio-metrics 1988;44:837–45.
10. Negishi K, Negishi T, Agler DA, Plana JC, Marwick TH. Roleof temporal resolution inselection of the appropriate strain technique for evaluation of subclinical myocardialdysfunction. Echocardiography 2012;29:334–9.
11. Bijnens BH, CikesM,Claus P, Sutherland GR.Velocity and deformation imaging for theassessment of myocardial dysfunction. Eur J Echocardiogr 2009;10:216–26.
12. GayatE, AhmadH,Weinert L, LangRM, Mor-Avi V. Reproducibility and inter-vendorvariability of left ventricular deformation measurements by three-dimensionalspeckle-tracking echocardiography. J Am Soc Echocardiogr 2011;24:878–85.
13. Badano L, Cucchini U, Muraru D, Al Nono O, Sarais C, Iliceto S. Use ofthree-dimensional speckle tracking to assess left ventricular myocardial mechanics:inter-vendor consistency and reproducibility of strain meauserements. Eur Heart JCardiovasc Imaging 2013;14:285–93.
14. Voigt JU. Making a black box transparent. Eur Heart J Cardiovasc Imaging 2013;14:201–2.
15. Reant P, Barbot L, Touche C, Dijos M, Arsac F, Pillois X et al. Evaluation of global leftventricular systolic function using three-dimensional echocardio-graphy speckle-tracking strain parameters. J Am Soc Echocardiogr 2012;25:68–79.
16. Kleijn SA, Aly MF, Terwee CB, van Rossum AC, Kamp O. Reliability of left ventricularvolumes and function measurements using three-dimensional speckle trackingechocardiography. EHJ Cardiovasc Imaging 2012;13:159–68.
17. Hayat D, Kloeckner M, Nahum J, Ecochard-Dugelay E, Dubois-Rande JL, Deux JFet al. Comparison of real-time three-dimensional speckle tracking to magnetic res-onance imaging in patients with coronary heart disease. Am J Cardiol 2012;109:180–86.
18. Perez de Isla L, Millan M, Lennie V, Quezada M, Guinea J, Macaya C et al. Area strain:normal values for a new parameter in healthy people. Rev Esp Cardiol 2011;64:1194–97.
19. Tatsumi K, Tanaka H, Tsuji T, Kaneko A, Ryo K, Omar AMS et al. Strain dyssynchronyindex determined by three-dimensional speckle area tracking can predict responseto cardiac resynchronization therapy. Cardiovasc Ultrasound 2011;9:11.
Assessment of left ventricular systolic function by deformation imaging derived from speckle tracking 323