Embed Size (px)
Citation preview
7/27/2019 Ascensiune Ue Cehia
http://slidepdf.com/reader/full/ascensiune-ue-cehia 1/12

7/27/2019 Ascensiune Ue Cehia
http://slidepdf.com/reader/full/ascensiune-ue-cehia 2/12
GIS for Water Management in Europe
26 I n May 2004, 10 countries on the European continent
were slated to become full members of the European
Union. The event was noteworthy not only because
it was the largest single expansion of the EU, but also
because it included eight countries previously concealed
behind the Iron Curtain.
For these new EU member countries, the EU expan-
sion required them to meet the Copenhagen criteria, a
set of standards to bring their government operations
and administrative systems into compliance with EU
standards. For many of the acceding countries, as they
were known, doing so meant making major changes to
their systems of taxation, customs, corporate law, indus-
trial standards, transport, energy, agriculture, social policy,
consumer protection and environmental protection.
One acceding country, the Czech Republic, used GIS to
plan for the changes it had to make to meet the water-
related environmental requirements of the EU’s Water
Framework Directive (WFD) — specifically, those of the
Urban Waste Water Directive and the Directive for Qual-
ity of Fresh Water.

7/27/2019 Ascensiune Ue Cehia
http://slidepdf.com/reader/full/ascensiune-ue-cehia 3/12
Chapter 3 Czech Republic: Preparing for EU membership
27
In the language of the WFD, its purpose — and thus, the
mandate to the Czech Republic — was to establish a frame-
work for the protection of inland surface waters, transi-
tional waters, coastal waters and groundwater, a frame-
work that would, in its words:
• prevent further deterioration, and protect and enhance
the status of aquatic ecosystems, terrestrial ecosystems
and wetlands directly depending on the aquatic eco-
systems;
• promote sustainable water use based on long-term
protection of available water resources;
• enhance protection and improvement of the aquaticenvironment through specific measures for the pro-
gressive reduction of discharges, emissions and losses
of priority substances and their cessation or phasing-
out;
• ensure the progressive reduction of pollution of
groundwater and prevent further pollution;
• contribute to mitigating the effects of floods and
droughts.Like previous European water legislation, some of these
aims are specific to particular categories of water. How-
ever, the emphasis of the new WFD, which came into force
in December 2000, is quite different. The old legislation
concentrated on regulating discharges and placed con-
straints only on the water quality in designated areas. The
WFD tackles water quality at the river basin level and
requires that all water bodies meet certain environmentalstandards. Like all existing EU nations, the Czech Republic
was required to bring into force the laws, regulations and
administrative provisions necessary to comply with this
directive by December 2003.
The Czech perspective
Water management planning in the Czech Republic is
carried out by Water Boards under the umbrella of the
Ministry of Agriculture. Although their overall mandate
was broad, an important part of their planning process was
to formulate ways to meet the WFD standards. To do so,
they created a Decision Support System (DSS) with which
to assess policies and to select the most cost-effective way
of meeting WFD requirements. The DSS includes data andmodeling tools to
• provide an overview of pollution sources, river sys-
tems, water quality conditions, existing water supply
and wastewater treatment facilities, as well as techni-
cal options for making improvements and tools for
calculating associated costs;
• assess the changes to water quality that would result
from implementing the various strategies, and esti-mate the corresponding investment as well as opera-
tions and maintenance costs;
• identify the lowest-cost strategies for meeting the legal
requirements of the directives for water supply and
wastewater treatment;
• estimate the economic and financial implications of
accession to the EU, including the effect on investment
programmes, recurrent costs and financing options.The DSS provided access to various databases and mod-
eling tools through a GIS interface, which in turn offered
a user-friendly method of specifying various scenarios

7/27/2019 Ascensiune Ue Cehia
http://slidepdf.com/reader/full/ascensiune-ue-cehia 4/12
GIS for Water Management in Europe
28
‘With regard to pollution prevention and control, Community water policyshould be based on a combined approach using control of pollution atsource through the setting of emission limit values and of environmentalquality standards’, states the EU’s Water Framework Directive.

7/27/2019 Ascensiune Ue Cehia
http://slidepdf.com/reader/full/ascensiune-ue-cehia 5/12
Chapter 3 Czech Republic: Preparing for EU membership
29
and an easy way of retrieving the results. The user could
explore the range of options offered by different interpreta-
tions of the ultimate EU directives, as well as alternative
technical strategies, specification of intermediate compli-ance targets and final time frame for meeting the require-
ments. An optimisation tool was used to identify the least
costly strategies for meeting specified ambient water qual-
ity objectives.
GIS facilitates access and use ofrelevant environmental information inthe environmental planning process.

7/27/2019 Ascensiune Ue Cehia
http://slidepdf.com/reader/full/ascensiune-ue-cehia 6/12
GIS for Water Management in Europe
30
Introducing MIKE BASIN
A key component of the DSS was the Danish Hydrological
Institute (DHI) Water and Environment’s MIKE BASIN,
a software tool that combines the GIS functionality of ArcView with a hydrologic modeling capability. As the
name suggests, this package operates at the river basin
level, making it ideally suited for work associated with the
WFD. MIKE BASIN was designed around a simple model
for ease of use and to minimise the data requirements. Its
sophistication is mainly in its visualisation tools, which
permit the simulation results to be viewed both spatially
and temporally. According to the DHI, this makes it idealfor building understanding and consensus.
MIKE BASIN models a river basin as a network in which
branches represent individual river sections and the nodes
represent confluences, diversions, reservoirs and water
users. ArcView is used for editing the model and the inter-
face was expanded to allow network elements to be edited
simply by right-clicking.
Of particular importance to the Czech Decision SupportSystem was MIKE BASIN’s Water Quality (WQ) module,
which simulates the transport and chemical reactions of
the most important substances that affect water quality.
Chemical reaction assessment includes an evaluation of the
natural breakdown of individual substances as well as the
chemical reactions that occur among them. Many of these
reactions are defined as first-order differential equations for
which the user can either supply the constants or use defaultvalues. Included in these evaluations are levels of ammonia,
nitrate, oxygen, total phosphorus, E. coli, chemical oxygen
demand (COD), and biological oxygen demand (BOD), as
Components of the Decision Support System, which comprisesdatabases and models, and which functions as an integratedand user-friendly tool, allowing for evaluation of alternativeoptions for compliance with standards. It takes into considerationdiverse elements such as legislative mandates, technical options,environmental impacts and economic implications.
7/27/2019 Ascensiune Ue Cehia
http://slidepdf.com/reader/full/ascensiune-ue-cehia 7/12
Chapter 3 Czech Republic: Preparing for EU membership
31�
�
�
�
�
�������������
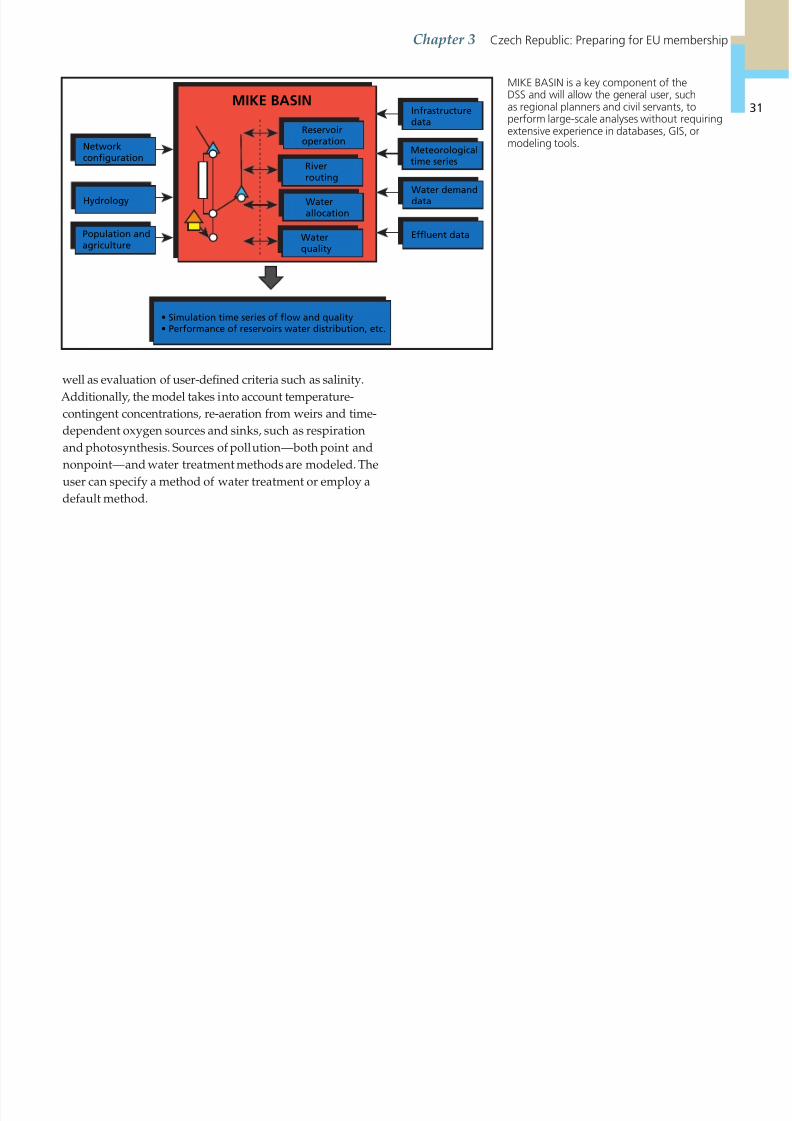
well as evaluation of user-defined criteria such as salinity.
Additionally, the model takes into account temperature-
contingent concentrations, re-aeration from weirs and time-dependent oxygen sources and sinks, such as respiration
and photosynthesis. Sources of pollution — both point and
nonpoint — and water treatment methods are modeled. The
user can specify a method of water treatment or employ a
default method.
MIKE BASIN is a key component of theDSS and will allow the general user, suchas regional planners and civil servants, toperform large-scale analyses without requiringextensive experience in databases, GIS, ormodeling tools.

7/27/2019 Ascensiune Ue Cehia
http://slidepdf.com/reader/full/ascensiune-ue-cehia 8/12
GIS for Water Management in Europe
32
Varied scenarios
The project to meet the European Water Framework
required evaluating how the DSS would model three
scenarios, since the exact criteria had not been clarified atthe time. Two scenarios applied to the country as a whole,
while the third included only sensitive areas. The latter
were defined as all river basins where drinking water sup-
plies and recreation-designated reservoirs were located.
The catchment areas of all river reaches were used as a
source for water supply exceeding 500 000 cubic metres per
year. According to this scenario, the sensitive area would
encompass 61 percent of the whole country.
For each scenario, various strategies were modeled.
Some strategies involved building new water treatmentplants, while others meant upgrading existing plants. Strat-
egies also differed in the method of sludge disposal (land-
fill or incineration), on the question of whether each town
should have its own water sanitation plant or should share
a regional facility, and on whether Czech or EU standards
were to be adopted for new sewer connections.
All major rivers, water usagesand point and nonpoint sourcedischarges in the Czech Republicare included in the water qualityanalysis of the DSS.
7/27/2019 Ascensiune Ue Cehia
http://slidepdf.com/reader/full/ascensiune-ue-cehia 9/12
Chapter 3 Czech Republic: Preparing for EU membership
33
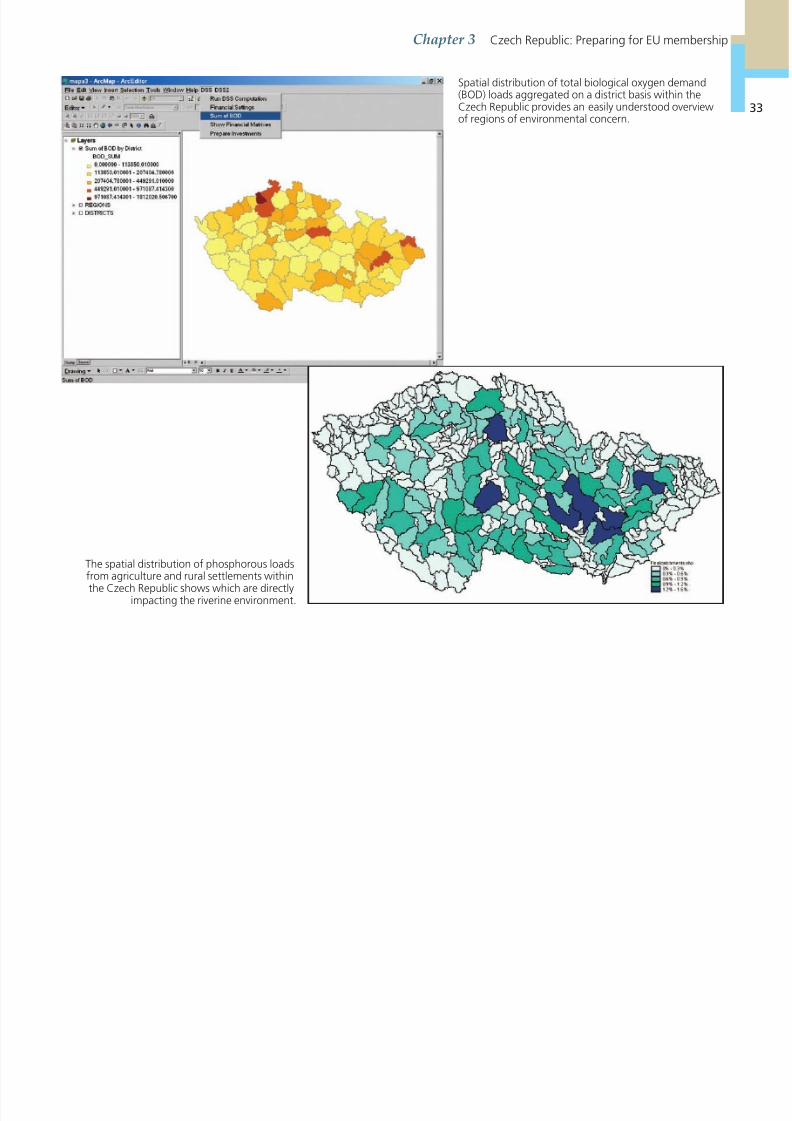
Spatial distribution of total biological oxygen demand(BOD) loads aggregated on a district basis within theCzech Republic provides an easily understood overviewof regions of environmental concern.
The spatial distribution of phosphorous loadsfrom agriculture and rural settlements withinthe Czech Republic shows which are directly
impacting the riverine environment.
7/27/2019 Ascensiune Ue Cehia
http://slidepdf.com/reader/full/ascensiune-ue-cehia 10/12
GIS for Water Management in Europe
34
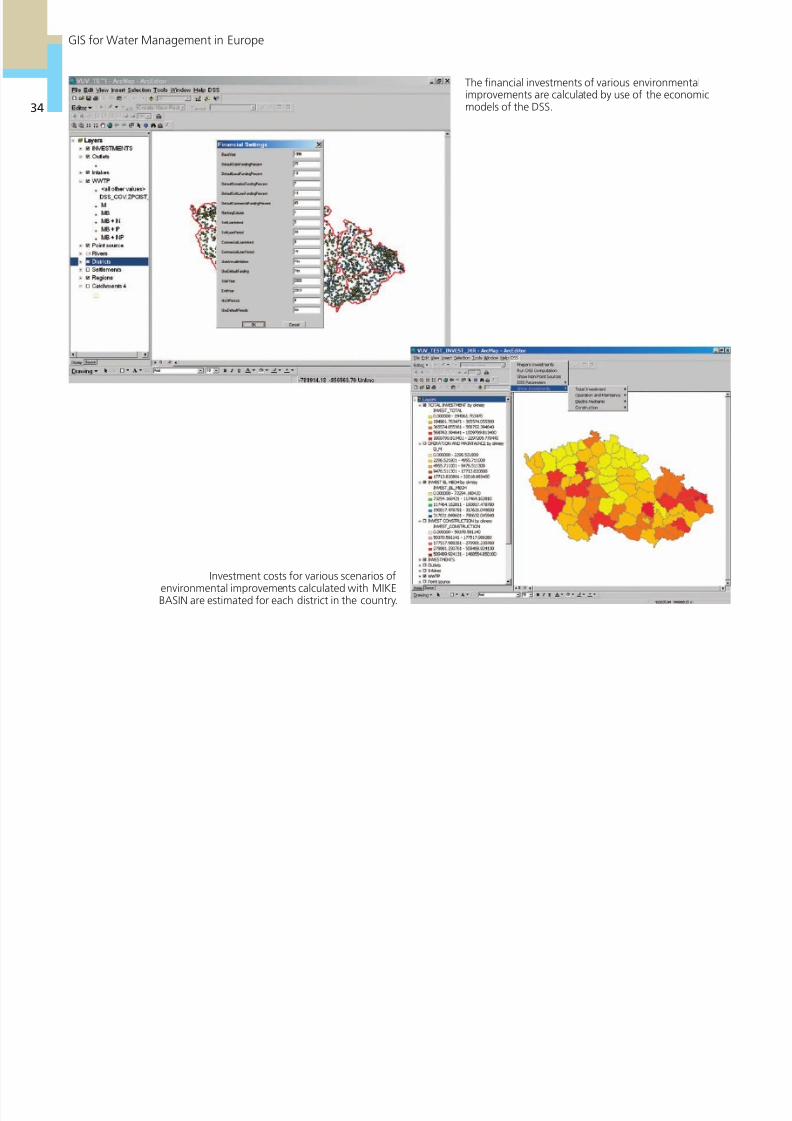
The financial investments of various environmentalimprovements are calculated by use of the economicmodels of the DSS.
Investment costs for various scenarios ofenvironmental improvements calculated with MIKEBASIN are estimated for each district in the country.

7/27/2019 Ascensiune Ue Cehia
http://slidepdf.com/reader/full/ascensiune-ue-cehia 11/12
Chapter 3 Czech Republic: Preparing for EU membership
35
Presenting the results
The lowest-cost strategies for meeting an intermedi-
ate compliance target were determined for each of the
three scenarios. The investment was not uniform acrossthe country — costs differed from one district to another
depending on the existing amount of pollution and the
effectiveness of existing water treatment facilities.
To present the environmental benefits of each intermedi-
ate investment program, the change of water quality in any
selected river branch over time can be displayed in what is
known as a reduction curve, which can display an assess-
ment of any water quality indicator in any part of the entireriver system. When displayed with financial performance,
the relationship between environmental benefits and total
investment can be shown.
In order to present environmental benefits of all scenar-
ios within the Czech Republic, the maps of water quality
for the entire river network were generated directly from
the DSS. All river branches were included and the water
quality as it relates to a selected pollutant was indicatedusing different colours.
BOD water quality maps of Czech rivers for the third scenario ofthe DSS. Top: the baseline status. Bottom: the quality attained afterimplementation of a specific set of investments.

7/27/2019 Ascensiune Ue Cehia
http://slidepdf.com/reader/full/ascensiune-ue-cehia 12/12
GIS for Water Management in Europe
36
Hardware
PCs with Microsoft Windows® 98, Windows 2000,
Windows NT, Windows XP operating systems. As a general
guideline, a minimum of 128 MB DRAM and 1 GB of freedisk space is recommended for MIKE BASIN. The simula-
tion times depend on the CPU; a 200-MHz Pentium® II is
the minimum recommended.
Software
The DSS was developed as a C++ extension on ArcGIS 8.3
and is based on a set of COM objects for the economic and
financial computations. The MIKE BASIN computationalengine is called from DSS once data is prepared. The results
are presented back in DSS using ArcGIS 8.3 routines.
Data
Data sets include pollution sources (municipal, industry
and nonpoint), receiving waters, existing water quality
and hydrological conditions, water supply and wastewatertreatment facilities, technical options for improvements,
basic statistical data and topographical data, stored in a
Microsoft Access 2000 database.
Acknowledgments
Thanks to Jan Krejcik, Stanislav Vanacek and Tomas
Metelka of DHI Hydroinform a.s., Prague.