Embed Size (px)
Citation preview
Journal of Basic Microbiology 2011, 51, 1–10 1
© 2011 WILEY-VCH Verlag GmbH & Co. KGaA, Weinheim www.jbm-journal.com
Research Paper
Application of response surface analysis for biodegradation of azo reactive textile dye using Aspergillus foetidus
Praveen Sharma and Lakhvinder Singh
Department of Environmental Science & Engineering, Guru Jambheshwar University of Science & Technology, Hisar (Haryana), India
This paper reports the application of experimental design methodology for the optimization of decolourization of azo reactive textile dye Remazol Red RR and reduction of chemical oxygen demand (COD) using fungal isolate Aspergillus foetidus. Response surface methodology (RSM), involving central composite design matrix in three most important input variables; tem-perature, pH and initial dye concentration was employed. A total of 20 experiments were conducted in the study towards the construction of a quadratic model. This demonstrated the benefits of approach in achieving excellent predictions, while minimizing the number of experiments required. Very high regression coefficient between the variables and the responses indicated excellent evaluation of experimental data. Under optimized conditions fungal isolate was capable to decolourize Remazol Red RR up to 86.21% and COD reduction up to 55.43% was achieved during the experimental setup. Enzymatic activity indicated excellent outcome under the optimal process conditions. The experimental values agreed with the predicted ones, indicating suitability of the model and success of RSM approach in optimizing the process.
Keywords: Bioremediation / Azo reactive dye / Central composite design / Chemical oxygen demand / Enzymatic activity
Received: February 17, 2011; accepted: April 02, 2011
DOI 10.1002/jobm.201100060
Introduction*
Textile industry effluent is generally highly coloured, contain high organic matter load, which results in high chemical oxygen demand (COD). Around 100,000 com-mercial dyestuffs are being used in the colouring indus-tries and approximately 15% of all dyestuff is directly lost to wastewater [1]. Amongst these, azo dyes repre-sent the largest and most versatile class of synthetic dyes [2]. Principally in case of azo dyes, the largest class of synthetic dyes, effluent treatment becomes a serious problem because of their negative impacts on terres-trial and aquatic ecosystems as well as on human health. Azo dyes are characterized by the presence of one or more azo bonds (–N=N–) in association with one or more aromatic structures. They are designed to ex-press high photolytic stability and resistance towards
Correspondence: Praveen Sharma, Department of Environmental Science & Engineering, Guru Jambheshwar University of Science & Technology, Hisar (Haryana)-125001, India E-mail: [email protected]
key oxidizing agents [3]. Moreover, some dyes are either toxic or mutagenic and carcinogenic due to the pres-ence of metals in their structures [4–7]. The new envi-ronment regulations concerning textile products have banned the discharge of coloured wastewater in natural water bodies [8]. Conventional treatments of textile effluents are either ineffective, costly and complicated or have sludge disposal problems [9]. Not all dyes cur-rently used could be degraded and removed by physical and chemical processes, and sometimes the degrada-tion products are more toxic [10]. Although several physical-chemical methods have been used to eliminate the coloured effluents in wastewater, they are generally expensive, of limited applicability and produce large amounts of sludge. Interest is therefore nowadays fo-cused on the microbial decolourization of dyes as a better alternative [11, 12]. Furthermore, dyestuffs can-not be converted to CO2 by physical and chemical methods. Complete degradation of dyestuff can only be accomplished by biological oxidation [13]. Some micro-organisms, including bacteria, fungi and algae, can
2 P. Sharma and L. Singh Journal of Basic Microbiology 2011, 51, 1–10
© 2011 WILEY-VCH Verlag GmbH & Co. KGaA, Weinheim www.jbm-journal.com
degrade or absorb a wide range of synthetic textile dyes [14]. Microbiological decolourization and degradation is an environmental-friendly and cost-competitive alter-native as compared to chemical decomposition process [15, 16]. Under optimized conditions the bacterial strain B. subtilis was able to decolourize synthetic dye DY 211 up to 80%. [17]. Textile wastewaters, in addition to colour and high COD, exhibit several problems primarily due to toxicity and recalcitrance of dyestuffs. Innovative technologies successful in removing dyes from large volumes of effluents at low cost and in a timely approach are needed. Fungi are amongst the most promising organ-isms for dye biodegradation. Decolourization of azo, anthraquinone, heterocyclic, triphenylmethane and polymeric dyes by Phanerochaete chrysosporium have been reported [18, 19]. There are some other reports related to degradation of textile dye Reactive blue-25 by fungus Aspergillus ochraceus. This strain can tolerate very high dye concentrations in distilled water. One of the most important factors that affect fungal decolourization is that dye molecules have different chemical structures. For living fungal cells, the major mechanism for decol-ourization and COD reduction from textile effluents is biodegradation because they can produce the lignin modifying extracellular enzymes and mineralize syn-thetic lignin or dyes and other organic matter present in dyeing effluents [20, 21]. Fungal biomass showed excellent sorption capability giving rise to decolouriza-tion up to 94% and decrease in COD up to 58% [22]. Decolourization of AR 151 was also observed under shaking conditions by the fungal strain Aspergillus niger SA1 [23]. Ability of fungal strains for decolourization of industrial effluents have opened new prospectus for the development of biotechnological processes aimed at the degradation of xenobiotic compounds and effluent decolourization [24, 25]. Toxic effects of the textile dyes on organisms suggest the need for remediation of dyes before discharging them into the environment [26]. The objective of this study was to investigate the decolourization of commercial textile dye Remazol Red RR and COD reduction by isolated fungal strain Aspergil-lus foetidus from simulated aqueous dye solution. We used indigenous strain A. foetidus isolated from the soil of dye contaminated site, so there was some inherent supremacy in the fungal isolate to decolourize azo reac-tive textile dye like Remazol Red RR. There were some vital factors that might significantly influence the deg-radation practice, such as temperature, pH and initial dye concentration. In the present investigation maxi-mum dye decolourization ability of the fungus was studied adopting a full range of response surface meth-
odology using central composite design (CCD) model to analyze the effectivity of the system under different conditions. Design experiment had also been used for optimization of treatment for colour and COD removal of acid dye effluent [26, 27]. The regression model pro-vided an excellent explanation of the relationship be-tween the independent variables and the responses.
Materials and methods
Microorganism and culture conditions The fungal strain was isolated from dye-contaminated soil, collected from within the premises of a textile industry and it was designated as Aspergillus foetidus MTCC 8796 by the Institute of Microbial Technology (IMTECH) Chandigarh, India. The fungal strain was maintained on potato dextrose agar plates through fortnightly sub-culturing. Further the strain was main-tained on PDA slants at 4 °C prior to use. The culture used for inoculation into liquid system was incubated on agar plates for a week under static conditions at 30 °C prior to inoculation into liquid system. Potato dextrose broth media was used for further decolouriza-tion studies. For enzymatic activity tests Remazol Red RR (10 mgl–1) was added as an inducer for the MnP ac-tivity into the culture broth, and the culture flasks were incubated (27.5 °C; pH 5.5) in an incubator shaker (150 rpm) for the period of 8 d. Enzymatic (MnP) activ-ity was monitored at regular intervals of 24 h.
Experimental methods for decolourization and COD reduction studies Simulated dye solution of Remazol Red RR was pre-pared in stock and preferred concentrations of the dye solution were obtained by further dilutions. Seven days fresh cultures were used for dye degradation studies. Experiments were performed at different values of variables as designed by the model. Erlenmeyer flasks containing 100 ml of sterilized liquid dye containing medium each, were inoculated with 10 mm agar plugs taken from fungal colony growing on potato dextrose agar plate and incubated under aerobic condition in an incubator shaker at 150 rpm for the pre determined time period of 5 d. Dye degradation experiments were performed by varying the temperature (20–35 °C), pH (3–8) and dye concentration (100–250 mgl–1). pH of the aqueous dye solution was adjusted using 0.1 M HCl and 0.1 M NaOH. Batch experiments were performed to determine maximum dye decolourization and COD removal. Samples were withdrawn at fixed time inter-val from the flasks, centrifuged and supernatant was
Journal of Basic Microbiology 2011, 51, 1–10 Application of response surface analysis 3
© 2011 WILEY-VCH Verlag GmbH & Co. KGaA, Weinheim www.jbm-journal.com
analyzed spectrophotometrically for residual dye con-centration in the aqueous solution using Systronics Spectrophotometer-106 at 520 nm (λmax). All experi-ments were performed in triplicates and their mean values are reported in the results and discussions part. The maximum deviation was found to be ±2%. Controls were maintained without fungal culture. The decrease in the absorption spectra of the dye solution was monitored at regular intervals of time. The following formula was used to calculate the percentage decolourization:
Decolourization (%) = ( )- eC C
C0
0
× 100 (1)
where, C0 is the initial concentration of dye (mg l–1) and Ce is the residual dye concentration (mg l–1) at the equi-librium time period. Chemical oxygen demand (COD) was analyzed by standard dichromate reflux method [34].
Response surface methodology (RSM) Response surface methodology (RSM) is an experimen-tal technique invented to find the optimal response within the specified range of the factors. The most admired response surface method design is the central composite design (CCD). Central composite design has three groups of design points viz. two-level factorial or fractional factorial design points; axial points; center points. Response surface methodology is a collection of mathematical and numerical techniques that are useful for modeling and analysis of the problems having nu-merous variables influencing the response and the objective is to optimize the response. These designs are capable of fitting a second-order prediction equation for the response. RSM is a statistical-based procedure and is a powerful experimental design tool to recognize the performance of composite systems [28–30]. The most extensive application of response surface method-ology can be found in the industrial world, in situations where a number of input variables influence some performance measure, called the response, in a way that is not easy or unfeasible to depict with a rigorous mathematical formulation. In these situations, it might be possible to derive an expression for the performance measure based on the response values obtained from experiments at some particular combination of the input variables [31]. The Quadratic models were pre-dicted by Ahmdi et al. for the response variables, i.e. pollutant elimination and the highest values predicted were 64%, 88%, 48% and 39% for COD, total phenol, colour and aromaticity respectively [32]. In the present investigation, the mutual effect of temperature, pH, and initial dye dosage on colour re-
moval and COD reduction from simulated dye solution by fungal strain A. foetidus had been studied using cen-tral composite design (CCD) in response surface meth-odology. RSM makes it possible to represent independ-ent process parameters in quantitative form as:
( . . . , ) e= nY f X X X X21 3, , , ± (2)
where, Y is the response, f is the response function, e is the experimental error, and . . . , nX X X X21 3, , , are in-dependent parameters. A polynomial model where interaction terms have been fitted to the experimental data obtained from the central composite design model experiment can be stated in the form of the following equation:
d e= =
= + +Â Ân n
i n i ii i
Y C C X X 20
1 1
± (3)
Optimization of the process can be done by carefully studying the response surface model through different combination of factors for the best response. The main objective of RSM is to determine the optimum opera-tional conditions of the process or to determine a re-gion that satisfies the operating specifications [33]. To sum up, central composite design matrix involves 5 levels of each variable: –Alpha, –1, 0, 1, and +Alpha. One of the creditable elements of the central composite design is that their arrangement provides itself in order experimentation.
Biodegradation assay and central composite design (CCD) To find optimum conditions for three variables (tem-perature, pH, and initial dye concentration), central composite design model was used as experimental design model. In the experimental setup, temperature (20–35 °C), pH (3–8) and initial dye concentration (100–250 mg l–1) were taken as key input variables. In the experimental design two responses viz. deocolouri-zation % (YColour) and % COD reduction (YCOD) were de-termined. Experiments were performed towards the construction of quadratic model. All point explanations are in terms of coded values of the variables. Center points, as implied by the name, are points with every level set to coded level 0 the middle point of each factor series. Center points are generally repeated 4–6 times to get a fine approximation of experimental error. The two-level factorial fraction of the design consists of all potential combinations of the +1 and –1 levels of the factors. For the two factor case there are four design points: (–1, –1) (+1, –1) (–1, +1) (+1, +1); Axial Points have all of the factors set to 0, the middle point, apart from one factor, which has the value ± Alpha. Three factors were studied and their low and high levels are
4 P. Sharma and L. Singh Journal of Basic Microbiology 2011, 51, 1–10
© 2011 WILEY-VCH Verlag GmbH & Co. KGaA, Weinheim www.jbm-journal.com
given in Table 1. All the experiments were conducted in triplicates and mean values were used to estimate data. Experimental data obtained from CCD model experi-mentation can be established in the shape of the fol-lowing equation:
2α α α αx x e-
= = = 2 =
= + + +Â Â Â Âk k 1 k k
i i i j i j ii ii i i i
Y x x01 1 1
± (4)
The optimal values of the selected variables were obtained by solving the regression equation and by analyzing the response surface plots. The inconsistency in dependent variables was explained by the multiple coefficient of determination, R2 and the model equation was used to forecast the optimum value and afterward to elucidate the interaction involving the variables within the particular range [35]. The responses were analyzed using various tools of the designed model. The optimum region was identified based on the main pa-rameters in the overlay plot.
Enzyme assay MnP activity was performed according to the method of Glenn and Gold [36]. For the preparation of inocula, the fungus was grown on potato dextrose agar plates. Er-lenmeyer flasks having liquid media were inoculated with mycelial plugs (cut from the edge of actively grow-ing colony). The cultures were incubated at 25 °C for seven days in an incubator shaker (150 rpm) and cul-ture was filtered through Whatman filter paper No. 1. Filtrate was centrifuged at 7500 rpm for 10 min at 4 °C to obtain the crude enzyme.
Results
In our research work, experiments were planned to achieve a quadratic model consisting of 14 trial plus 6 centre points. The range and levels of three independ-ent variables, viz. temperature, pH and initial dye con-centration are presented in Table 1. The experimental design matrix of the variables is given in Table 2 along with the predicted and experimental values of re-sponse. A systematic study was done to monitor the dye decolourization and reduction in chemical oxygen de- Table 1. Experimental range and level of Central composite design for independent input variables in coded terms.
Variables Range and level (coded)
–1.682 –1 0 +1 +1.682
Temp. (°C) A 14.9 20 27.5 35 40.1 pH B 1.3 3.0 5.5 8.0 9.7 Dye conc. (mg l–1) C 48.9 100 150 250 301.1
mand by altering the dye concentration, pH and tem-perature as designed by the CCD. Each run was per-formed in triplicate and mean values for biodegrada-tion are presented in the Table 2, while the predicted values of responses were obtained from quadratic model fitting techniques using the model design. In using the RSM approach, the batch runs were conducted in central composite design experiments to visualize the effects of independent factors on the re-sponses and the results along with the experimental conditions. The experimental results were evaluated and approximating function of biodegradation percent obtained according to following equations:
YColour (% decolourization) = +73.80 – 0.74 ⋅ A + 4.82 ⋅ B – 5.68 ⋅ C – 8.46 ⋅ A2 – 12.65 ⋅ B2 + 0.31 ⋅ C2 + 0.76 ⋅ A ⋅ B + 0.056 ⋅ A ⋅ C – 0.34 ⋅ B ⋅ C (5)
YCOD (% COD reduction) = +47.57 – 0.23 ⋅ A + 2.77 ⋅ B – 2.52 ⋅ C – 7.92 ⋅ A2 – 7.56 ⋅ B2 + 0.87 ⋅ C2 + 0.59 ⋅ A ⋅ B + 0.66 ⋅ A ⋅ C + 1.85 ⋅ B ⋅ C (6)
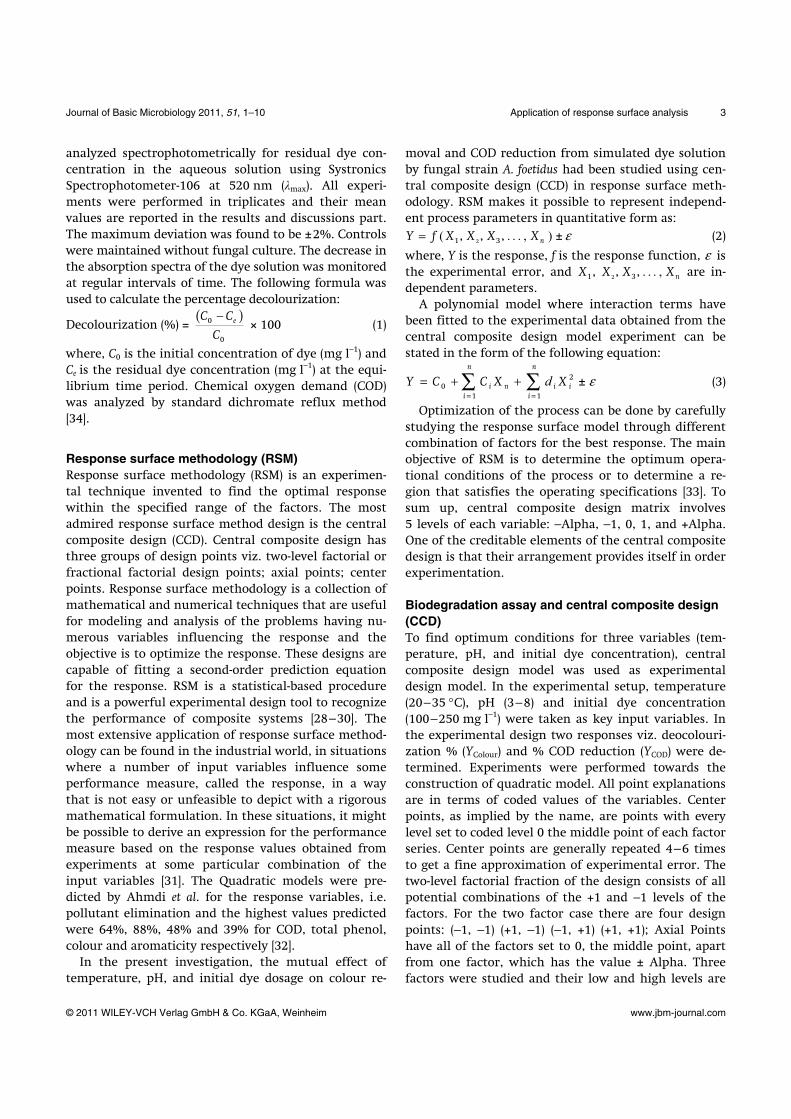
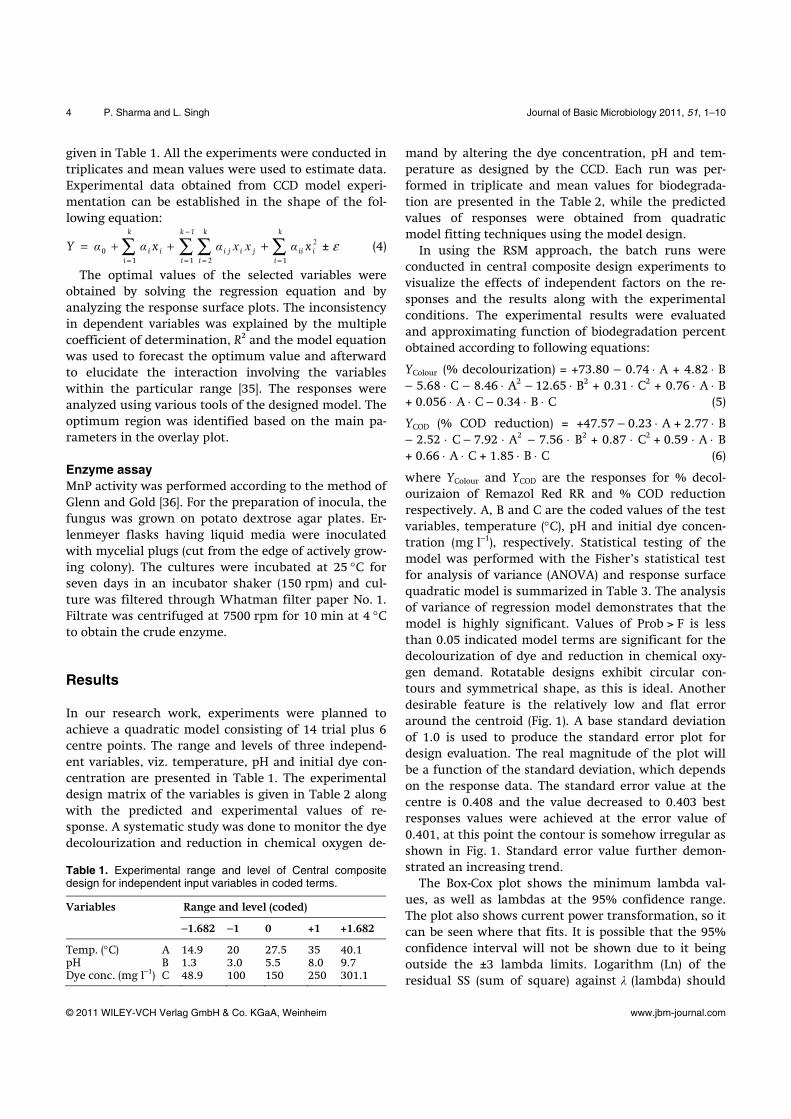
where YColour and YCOD are the responses for % decol-ourizaion of Remazol Red RR and % COD reduction respectively. A, B and C are the coded values of the test variables, temperature (°C), pH and initial dye concen-tration (mg l–1), respectively. Statistical testing of the model was performed with the Fisher’s statistical test for analysis of variance (ANOVA) and response surface quadratic model is summarized in Table 3. The analysis of variance of regression model demonstrates that the model is highly significant. Values of Prob > F is less than 0.05 indicated model terms are significant for the decolourization of dye and reduction in chemical oxy-gen demand. Rotatable designs exhibit circular con-tours and symmetrical shape, as this is ideal. Another desirable feature is the relatively low and flat error around the centroid (Fig. 1). A base standard deviation of 1.0 is used to produce the standard error plot for design evaluation. The real magnitude of the plot will be a function of the standard deviation, which depends on the response data. The standard error value at the centre is 0.408 and the value decreased to 0.403 best responses values were achieved at the error value of 0.401, at this point the contour is somehow irregular as shown in Fig. 1. Standard error value further demon-strated an increasing trend. The Box-Cox plot shows the minimum lambda val-ues, as well as lambdas at the 95% confidence range. The plot also shows current power transformation, so it can be seen where that fits. It is possible that the 95% confidence interval will not be shown due to it being outside the ±3 lambda limits. Logarithm (Ln) of the residual SS (sum of square) against λ (lambda) should
Journal of Basic Microbiology 2011, 51, 1–10 5
© 2011 WILEY-VCH Verlag GmbH & Co. KGaA, Weinheim www.jbm-journal.com
Table 2. Central composite design matrix for % decolourization and % COD reduction from simulated dye solution along with actual and predicted responses.
Coded values of variables Decolourization (%), YColour COD reduction (%), YCOD Std. Order
Temp. (A)
pH (B)
Initial dye conc. (C)
Actual (Y%)
Predicted (Y1%)
Actual (Y%)
Predicted (Y1%)
1 –1 –1 –1 54.6 55.1 35.6 36.1 2 1 –1 –1 51.3 51.9 32.7 33.1 3 –1 1 –1 64.0 63.9 35.6 36.7 4 1 1 –1 62.5 63.8 35.6 36.1 5 –1 –1 1 46.9 44.3 25.9 26.0 6 1 –1 1 42.5 41.4 26.2 25.7 7 –1 1 1 53.6 51.7 33.8 34.1 8 1 1 1 53.6 51.9 36.1 36.1 9 –1.682 0 0 49.2 51.1 26.4 25.6 10 1.682 0 0 48.7 48.6 24.7 24.8 11 0 –1.682 0 28.9 29.9 21.5 21.5 12 0 1.682 0 45.3 46.1 31.7 30.9 13 0 0 –1.682 86.2 84.2 55.4 54.3 14 0 0 1.682 61.4 65.1 45.4 45.8 15 0 0 0 74.5 73.8 49.7 47.6 16 0 0 0 73.5 73.8 47.9 47.6 17 0 0 0 75.7 73.8 46.6 47.6 18 0 0 0 73.5 73.8 48.0 47.6 19 0 0 0 74.5 73.8 45.6 47.6 20 0 0 0 71.3 73.8 47.5 47.6 Table 3. (a) Analysis of variance (ANOVA), results for decolourization of Remazol Red RR by A. foetidus.
Source Sum of squares DF Mean square F value Prob > F
Model 3906.351 9 434.039 85.5383 <0.0001 Significant Residual 50.74207 10 5.074207 Lack of fit 39.84178 5 7.968357 3.655114 0.0906 Not significant Pure error 10.90028 5 2.180057 Cor total 3957.09 19
R2 = 0.9872; Pred. R2 = 0.9193; Adj-R2 = 0.9756; C.V. = 3.78
Figure 1. Srandard Error plot for decolourization of Remazol Red RR and COD reduction by A. foetidus. Note: Irregular contour (0.401), roughly in close proximity to the center shows the region of maximum responses.
dip fairly steeply with a minimum in the region of the best possible value [37]. The plot shows the current power by the dotted line at 1 on the X-axis. This repre-sented no transformation of the response data [38]. Typically, most of the parameters estimate might ap-pear to be significant outside the province of the opti-mum λ, but near it only a few will be highly significant. The design explained the minimum confidence interval value in case of response YColour was 0.23 and maximum value was 1.49 (Fig. 2a). The current point of confidence interval (λ = 1) placed very close to model designed value of 0.83. Almost similar trend was observed in case of second response i.e. YCOD, low and high C.I. values were 0.03 and 1.04 respectively (Fig. 2b). The current point of confidence interval (λ = 1) positioned in close proximity to model designed value of 0.53, which came in the specified model range and model was considered to be accurate and consistent. So no model transforma-tion was required The Normal % probability and stu-
6 P. Sharma and L. Singh Journal of Basic Microbiology 2011, 51, 1–10
© 2011 WILEY-VCH Verlag GmbH & Co. KGaA, Weinheim www.jbm-journal.com
Figure 2. (a) Box-Cox plot for % decolourization of Remazol Red RR by A. foetidus. (b) Box-Cox plot for % COD reduction by A. foetidus.
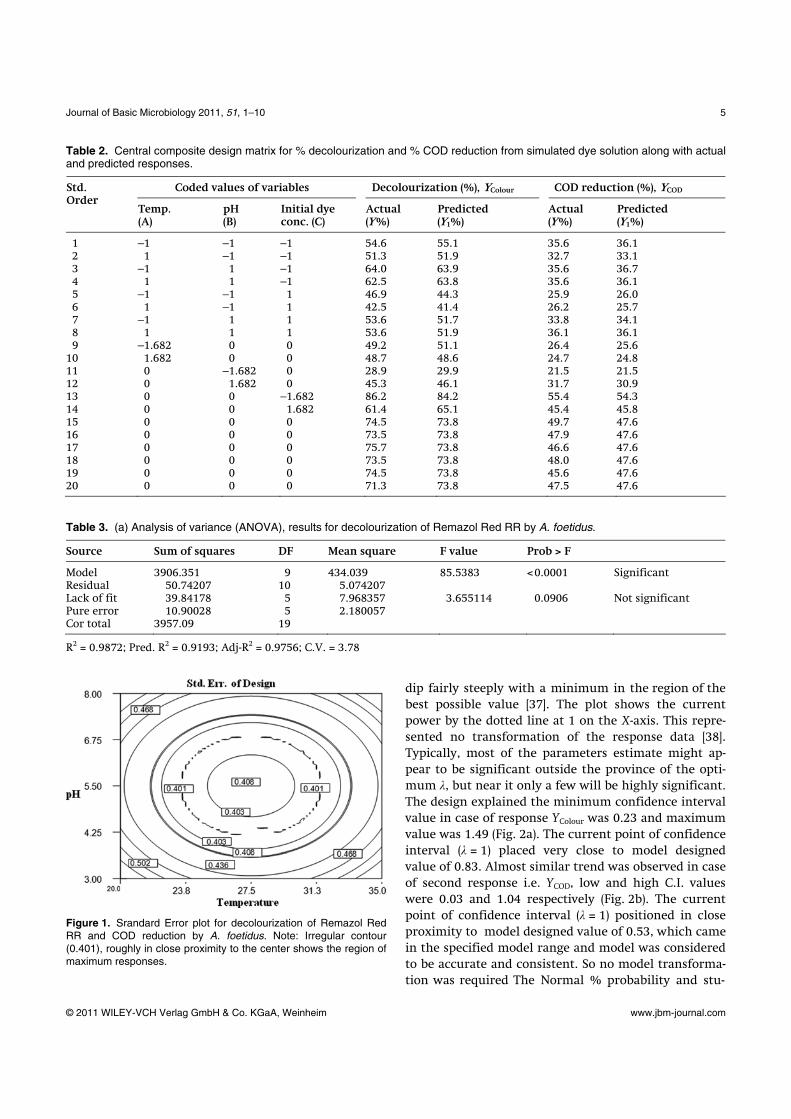
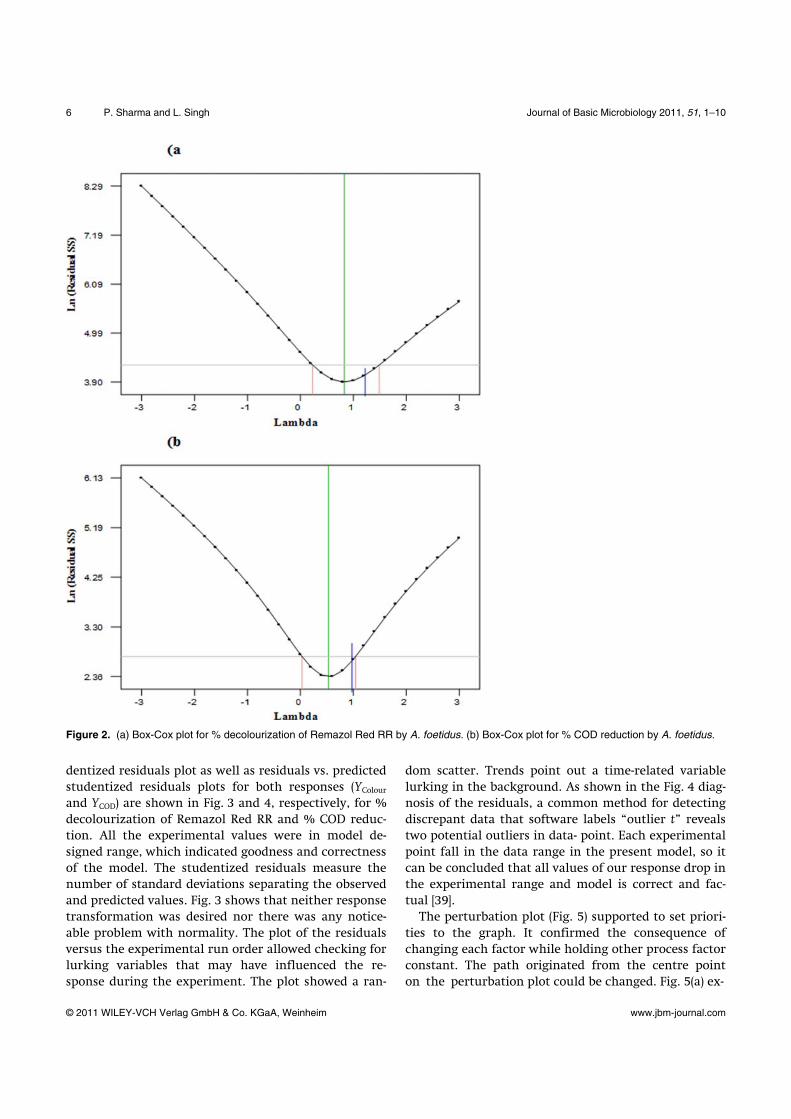
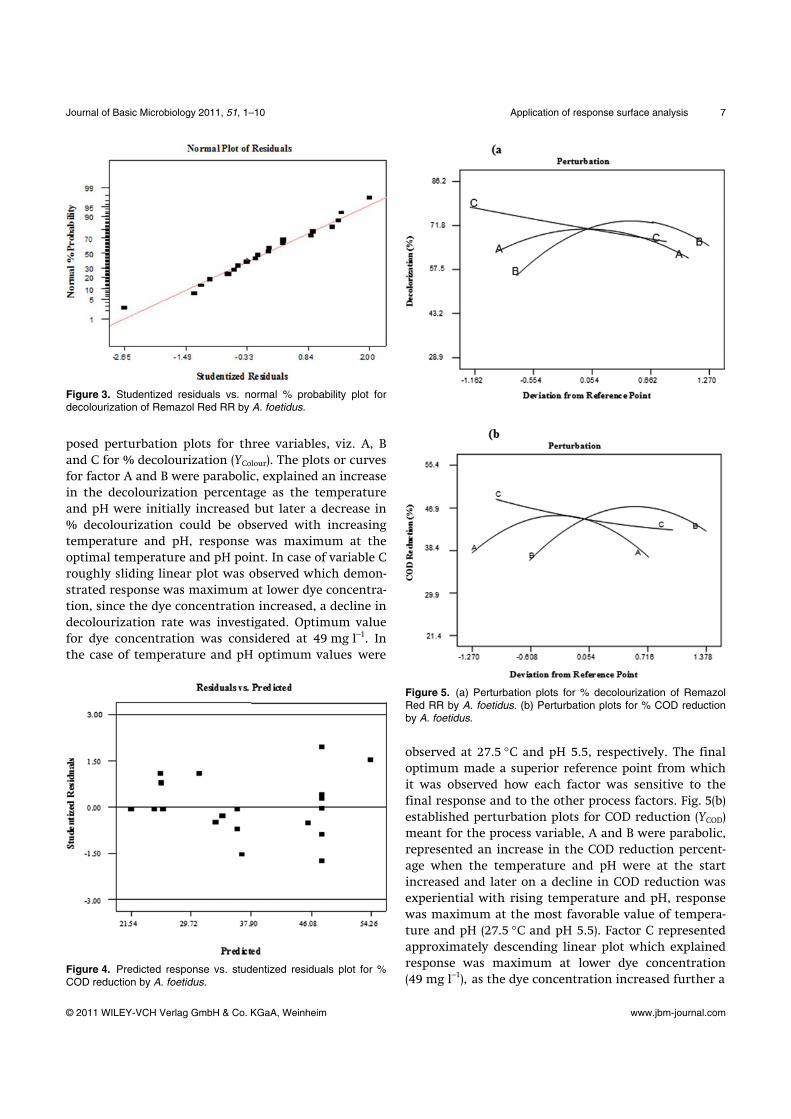
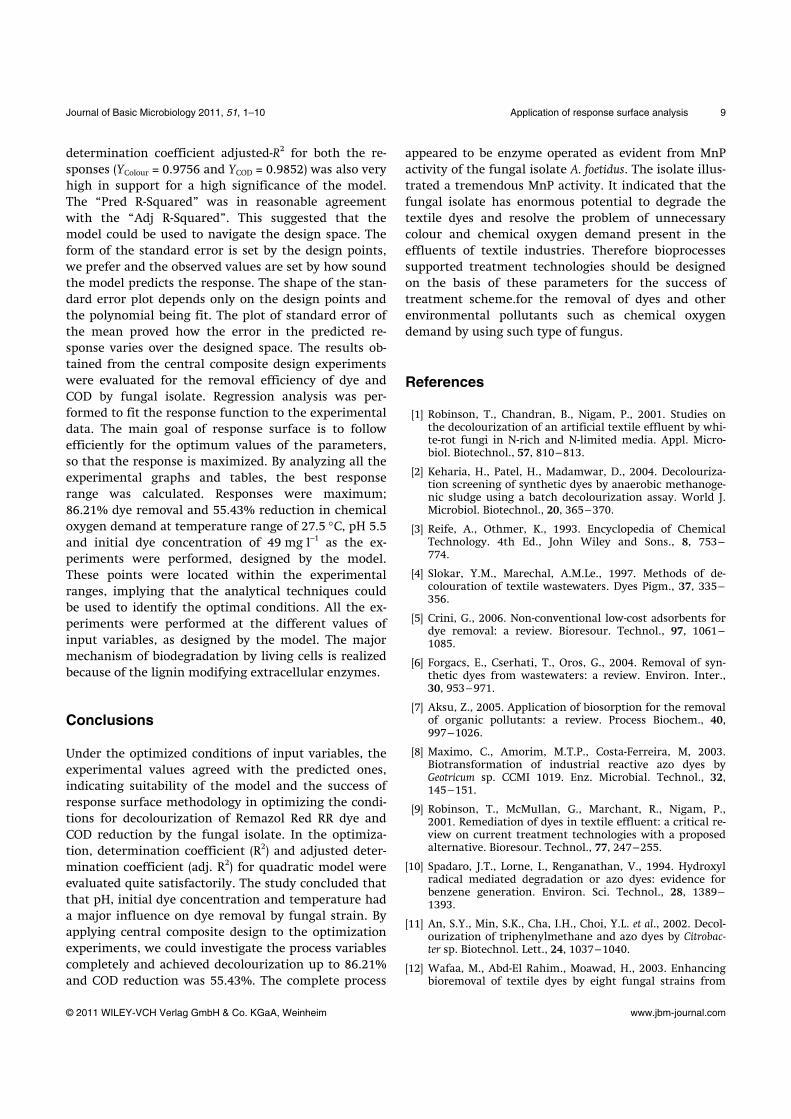
dentized residuals plot as well as residuals vs. predicted studentized residuals plots for both responses (YColour and YCOD) are shown in Fig. 3 and 4, respectively, for % decolourization of Remazol Red RR and % COD reduc-tion. All the experimental values were in model de-signed range, which indicated goodness and correctness of the model. The studentized residuals measure the number of standard deviations separating the observed and predicted values. Fig. 3 shows that neither response transformation was desired nor there was any notice-able problem with normality. The plot of the residuals versus the experimental run order allowed checking for lurking variables that may have influenced the re-sponse during the experiment. The plot showed a ran-
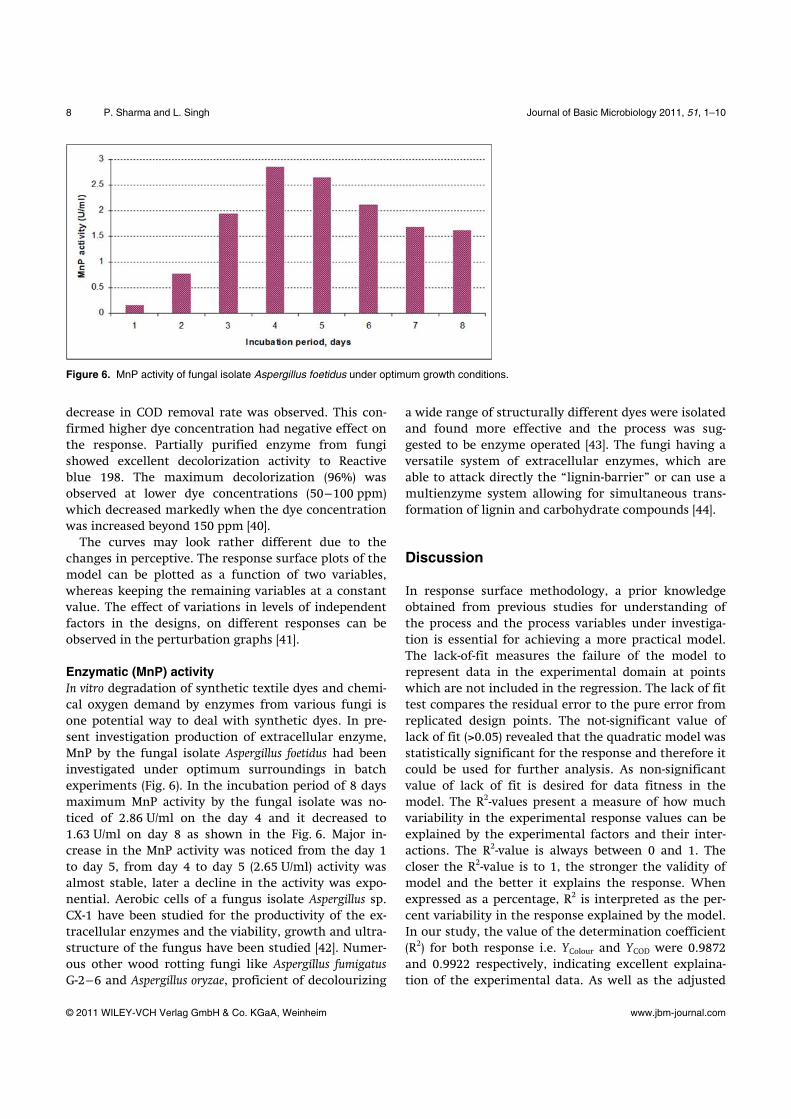
dom scatter. Trends point out a time-related variable lurking in the background. As shown in the Fig. 4 diag-nosis of the residuals, a common method for detecting discrepant data that software labels “outlier t” reveals two potential outliers in data- point. Each experimental point fall in the data range in the present model, so it can be concluded that all values of our response drop in the experimental range and model is correct and fac-tual [39]. The perturbation plot (Fig. 5) supported to set priori-ties to the graph. It confirmed the consequence of changing each factor while holding other process factor constant. The path originated from the centre point on the perturbation plot could be changed. Fig. 5(a) ex-
Journal of Basic Microbiology 2011, 51, 1–10 Application of response surface analysis 7
© 2011 WILEY-VCH Verlag GmbH & Co. KGaA, Weinheim www.jbm-journal.com
Figure 3. Studentized residuals vs. normal % probability plot for decolourization of Remazol Red RR by A. foetidus.
posed perturbation plots for three variables, viz. A, B and C for % decolourization (YColour). The plots or curves for factor A and B were parabolic, explained an increase in the decolourization percentage as the temperature and pH were initially increased but later a decrease in % decolourization could be observed with increasing temperature and pH, response was maximum at the optimal temperature and pH point. In case of variable C roughly sliding linear plot was observed which demon-strated response was maximum at lower dye concentra-tion, since the dye concentration increased, a decline in decolourization rate was investigated. Optimum value for dye concentration was considered at 49 mg l–1. In the case of temperature and pH optimum values were
Figure 4. Predicted response vs. studentized residuals plot for % COD reduction by A. foetidus.
Figure 5. (a) Perturbation plots for % decolourization of Remazol Red RR by A. foetidus. (b) Perturbation plots for % COD reduction by A. foetidus.
observed at 27.5 °C and pH 5.5, respectively. The final optimum made a superior reference point from which it was observed how each factor was sensitive to the final response and to the other process factors. Fig. 5(b) established perturbation plots for COD reduction (YCOD) meant for the process variable, A and B were parabolic, represented an increase in the COD reduction percent-age when the temperature and pH were at the start increased and later on a decline in COD reduction was experiential with rising temperature and pH, response was maximum at the most favorable value of tempera-ture and pH (27.5 °C and pH 5.5). Factor C represented approximately descending linear plot which explained response was maximum at lower dye concentration (49 mg l–1), as the dye concentration increased further a
8 P. Sharma and L. Singh Journal of Basic Microbiology 2011, 51, 1–10
© 2011 WILEY-VCH Verlag GmbH & Co. KGaA, Weinheim www.jbm-journal.com
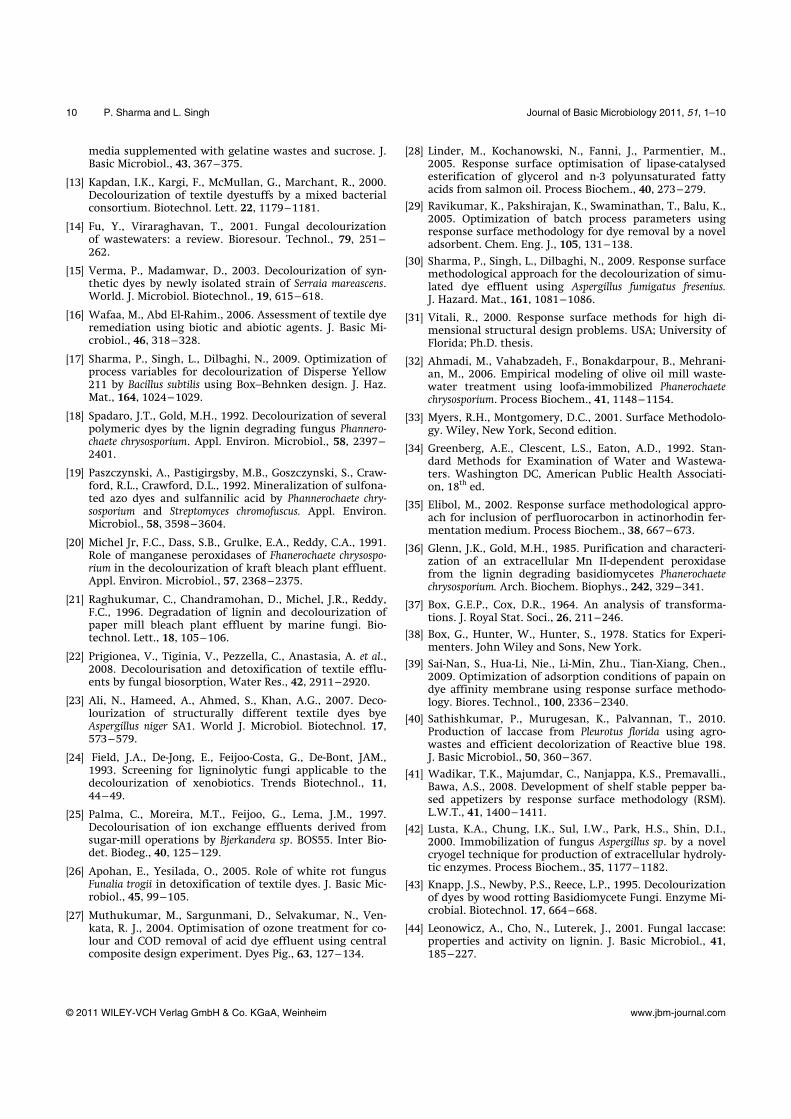
Figure 6. MnP activity of fungal isolate Aspergillus foetidus under optimum growth conditions.
decrease in COD removal rate was observed. This con-firmed higher dye concentration had negative effect on the response. Partially purified enzyme from fungi showed excellent decolorization activity to Reactive blue 198. The maximum decolorization (96%) was observed at lower dye concentrations (50–100 ppm) which decreased markedly when the dye concentration was increased beyond 150 ppm [40]. The curves may look rather different due to the changes in perceptive. The response surface plots of the model can be plotted as a function of two variables, whereas keeping the remaining variables at a constant value. The effect of variations in levels of independent factors in the designs, on different responses can be observed in the perturbation graphs [41].
Enzymatic (MnP) activity In vitro degradation of synthetic textile dyes and chemi-cal oxygen demand by enzymes from various fungi is one potential way to deal with synthetic dyes. In pre-sent investigation production of extracellular enzyme, MnP by the fungal isolate Aspergillus foetidus had been investigated under optimum surroundings in batch experiments (Fig. 6). In the incubation period of 8 days maximum MnP activity by the fungal isolate was no-ticed of 2.86 U/ml on the day 4 and it decreased to 1.63 U/ml on day 8 as shown in the Fig. 6. Major in-crease in the MnP activity was noticed from the day 1 to day 5, from day 4 to day 5 (2.65 U/ml) activity was almost stable, later a decline in the activity was expo-nential. Aerobic cells of a fungus isolate Aspergillus sp. CX-1 have been studied for the productivity of the ex-tracellular enzymes and the viability, growth and ultra-structure of the fungus have been studied [42]. Numer-ous other wood rotting fungi like Aspergillus fumigatus G-2–6 and Aspergillus oryzae, proficient of decolourizing
a wide range of structurally different dyes were isolated and found more effective and the process was sug-gested to be enzyme operated [43]. The fungi having a versatile system of extracellular enzymes, which are able to attack directly the “lignin-barrier” or can use a multienzyme system allowing for simultaneous trans-formation of lignin and carbohydrate compounds [44].
Discussion
In response surface methodology, a prior knowledge obtained from previous studies for understanding of the process and the process variables under investiga-tion is essential for achieving a more practical model. The lack-of-fit measures the failure of the model to represent data in the experimental domain at points which are not included in the regression. The lack of fit test compares the residual error to the pure error from replicated design points. The not-significant value of lack of fit (>0.05) revealed that the quadratic model was statistically significant for the response and therefore it could be used for further analysis. As non-significant value of lack of fit is desired for data fitness in the model. The R2-values present a measure of how much variability in the experimental response values can be explained by the experimental factors and their inter-actions. The R2-value is always between 0 and 1. The closer the R2-value is to 1, the stronger the validity of model and the better it explains the response. When expressed as a percentage, R2 is interpreted as the per-cent variability in the response explained by the model. In our study, the value of the determination coefficient (R2) for both response i.e. YColour and YCOD were 0.9872 and 0.9922 respectively, indicating excellent explaina-tion of the experimental data. As well as the adjusted
Journal of Basic Microbiology 2011, 51, 1–10 Application of response surface analysis 9
© 2011 WILEY-VCH Verlag GmbH & Co. KGaA, Weinheim www.jbm-journal.com
determination coefficient adjusted-R2 for both the re-sponses (YColour = 0.9756 and YCOD = 0.9852) was also very high in support for a high significance of the model. The “Pred R-Squared” was in reasonable agreement with the “Adj R-Squared”. This suggested that the model could be used to navigate the design space. The form of the standard error is set by the design points, we prefer and the observed values are set by how sound the model predicts the response. The shape of the stan-dard error plot depends only on the design points and the polynomial being fit. The plot of standard error of the mean proved how the error in the predicted re-sponse varies over the designed space. The results ob-tained from the central composite design experiments were evaluated for the removal efficiency of dye and COD by fungal isolate. Regression analysis was per-formed to fit the response function to the experimental data. The main goal of response surface is to follow efficiently for the optimum values of the parameters, so that the response is maximized. By analyzing all the experimental graphs and tables, the best response range was calculated. Responses were maximum; 86.21% dye removal and 55.43% reduction in chemical oxygen demand at temperature range of 27.5 °C, pH 5.5 and initial dye concentration of 49 mg l–1 as the ex-periments were performed, designed by the model. These points were located within the experimental ranges, implying that the analytical techniques could be used to identify the optimal conditions. All the ex-periments were performed at the different values of input variables, as designed by the model. The major mechanism of biodegradation by living cells is realized because of the lignin modifying extracellular enzymes.
Conclusions
Under the optimized conditions of input variables, the experimental values agreed with the predicted ones, indicating suitability of the model and the success of response surface methodology in optimizing the condi-tions for decolourization of Remazol Red RR dye and COD reduction by the fungal isolate. In the optimiza-tion, determination coefficient (R2) and adjusted deter-mination coefficient (adj. R2) for quadratic model were evaluated quite satisfactorily. The study concluded that that pH, initial dye concentration and temperature had a major influence on dye removal by fungal strain. By applying central composite design to the optimization experiments, we could investigate the process variables completely and achieved decolourization up to 86.21% and COD reduction was 55.43%. The complete process
appeared to be enzyme operated as evident from MnP activity of the fungal isolate A. foetidus. The isolate illus-trated a tremendous MnP activity. It indicated that the fungal isolate has enormous potential to degrade the textile dyes and resolve the problem of unnecessary colour and chemical oxygen demand present in the effluents of textile industries. Therefore bioprocesses supported treatment technologies should be designed on the basis of these parameters for the success of treatment scheme.for the removal of dyes and other environmental pollutants such as chemical oxygen demand by using such type of fungus.
References
[1] Robinson, T., Chandran, B., Nigam, P., 2001. Studies on the decolourization of an artificial textile effluent by whi-te-rot fungi in N-rich and N-limited media. Appl. Micro-biol. Biotechnol., 57, 810–813.
[2] Keharia, H., Patel, H., Madamwar, D., 2004. Decolouriza-tion screening of synthetic dyes by anaerobic methanoge-nic sludge using a batch decolourization assay. World J. Microbiol. Biotechnol., 20, 365–370.
[3] Reife, A., Othmer, K., 1993. Encyclopedia of Chemical Technology. 4th Ed., John Wiley and Sons., 8, 753– 774.
[4] Slokar, Y.M., Marechal, A.M.Le., 1997. Methods of de- colouration of textile wastewaters. Dyes Pigm., 37, 335–356.
[5] Crini, G., 2006. Non-conventional low-cost adsorbents for dye removal: a review. Bioresour. Technol., 97, 1061–1085.
[6] Forgacs, E., Cserhati, T., Oros, G., 2004. Removal of syn-thetic dyes from wastewaters: a review. Environ. Inter., 30, 953–971.
[7] Aksu, Z., 2005. Application of biosorption for the removal of organic pollutants: a review. Process Biochem., 40, 997–1026.
[8] Maximo, C., Amorim, M.T.P., Costa-Ferreira, M, 2003. Biotransformation of industrial reactive azo dyes by Geotricum sp. CCMI 1019. Enz. Microbial. Technol., 32, 145–151.
[9] Robinson, T., McMullan, G., Marchant, R., Nigam, P., 2001. Remediation of dyes in textile effluent: a critical re-view on current treatment technologies with a proposed alternative. Bioresour. Technol., 77, 247–255.
[10] Spadaro, J.T., Lorne, I., Renganathan, V., 1994. Hydroxyl radical mediated degradation or azo dyes: evidence for benzene generation. Environ. Sci. Technol., 28, 1389–1393.
[11] An, S.Y., Min, S.K., Cha, I.H., Choi, Y.L. et al., 2002. Decol-ourization of triphenylmethane and azo dyes by Citrobac-ter sp. Biotechnol. Lett., 24, 1037–1040.
[12] Wafaa, M., Abd-El Rahim., Moawad, H., 2003. Enhancing bioremoval of textile dyes by eight fungal strains from
10 P. Sharma and L. Singh Journal of Basic Microbiology 2011, 51, 1–10
© 2011 WILEY-VCH Verlag GmbH & Co. KGaA, Weinheim www.jbm-journal.com
media supplemented with gelatine wastes and sucrose. J. Basic Microbiol., 43, 367–375.
[13] Kapdan, I.K., Kargi, F., McMullan, G., Marchant, R., 2000. Decolourization of textile dyestuffs by a mixed bacterial consortium. Biotechnol. Lett. 22, 1179–1181.
[14] Fu, Y., Viraraghavan, T., 2001. Fungal decolourization of wastewaters: a review. Bioresour. Technol., 79, 251– 262.
[15] Verma, P., Madamwar, D., 2003. Decolourization of syn-thetic dyes by newly isolated strain of Serraia mareascens. World. J. Microbiol. Biotechnol., 19, 615–618.
[16] Wafaa, M., Abd El-Rahim., 2006. Assessment of textile dye remediation using biotic and abiotic agents. J. Basic Mi-crobiol., 46, 318–328.
[17] Sharma, P., Singh, L., Dilbaghi, N., 2009. Optimization of process variables for decolourization of Disperse Yellow 211 by Bacillus subtilis using Box–Behnken design. J. Haz. Mat., 164, 1024–1029.
[18] Spadaro, J.T., Gold, M.H., 1992. Decolourization of several polymeric dyes by the lignin degrading fungus Phannero-chaete chrysosporium. Appl. Environ. Microbiol., 58, 2397–2401.
[19] Paszczynski, A., Pastigirgsby, M.B., Goszczynski, S., Craw-ford, R.L., Crawford, D.L., 1992. Mineralization of sulfona-ted azo dyes and sulfannilic acid by Phannerochaete chry-sosporium and Streptomyces chromofuscus. Appl. Environ. Microbiol., 58, 3598–3604.
[20] Michel Jr, F.C., Dass, S.B., Grulke, E.A., Reddy, C.A., 1991. Role of manganese peroxidases of Fhanerochaete chrysospo-rium in the decolourization of kraft bleach plant effluent. Appl. Environ. Microbiol., 57, 2368–2375.
[21] Raghukumar, C., Chandramohan, D., Michel, J.R., Reddy, F.C., 1996. Degradation of lignin and decolourization of paper mill bleach plant effluent by marine fungi. Bio-technol. Lett., 18, 105–106.
[22] Prigionea, V., Tiginia, V., Pezzella, C., Anastasia, A. et al., 2008. Decolourisation and detoxification of textile efflu-ents by fungal biosorption, Water Res., 42, 2911–2920.
[23] Ali, N., Hameed, A., Ahmed, S., Khan, A.G., 2007. Deco-lourization of structurally different textile dyes bye Aspergillus niger SA1. World J. Microbiol. Biotechnol. 17, 573–579.
[24] Field, J.A., De-Jong, E., Feijoo-Costa, G., De-Bont, JAM., 1993. Screening for ligninolytic fungi applicable to the decolourization of xenobiotics. Trends Biotechnol., 11, 44–49.
[25] Palma, C., Moreira, M.T., Feijoo, G., Lema, J.M., 1997. Decolourisation of ion exchange effluents derived from sugar-mill operations by Bjerkandera sp. BOS55. Inter Bio-det. Biodeg., 40, 125–129.
[26] Apohan, E., Yesilada, O., 2005. Role of white rot fungus Funalia trogii in detoxification of textile dyes. J. Basic Mic-robiol., 45, 99–105.
[27] Muthukumar, M., Sargunmani, D., Selvakumar, N., Ven-kata, R. J., 2004. Optimisation of ozone treatment for co-lour and COD removal of acid dye effluent using central composite design experiment. Dyes Pig., 63, 127–134.
[28] Linder, M., Kochanowski, N., Fanni, J., Parmentier, M., 2005. Response surface optimisation of lipase-catalysed esterification of glycerol and n-3 polyunsaturated fatty acids from salmon oil. Process Biochem., 40, 273–279.
[29] Ravikumar, K., Pakshirajan, K., Swaminathan, T., Balu, K., 2005. Optimization of batch process parameters using response surface methodology for dye removal by a novel adsorbent. Chem. Eng. J., 105, 131–138.
[30] Sharma, P., Singh, L., Dilbaghi, N., 2009. Response surface methodological approach for the decolourization of simu-lated dye effluent using Aspergillus fumigatus fresenius. J. Hazard. Mat., 161, 1081–1086.
[31] Vitali, R., 2000. Response surface methods for high di-mensional structural design problems. USA; University of Florida; Ph.D. thesis.
[32] Ahmadi, M., Vahabzadeh, F., Bonakdarpour, B., Mehrani-an, M., 2006. Empirical modeling of olive oil mill waste-water treatment using loofa-immobilized Phanerochaete chrysosporium. Process Biochem., 41, 1148–1154.
[33] Myers, R.H., Montgomery, D.C., 2001. Surface Methodolo-gy. Wiley, New York, Second edition.
[34] Greenberg, A.E., Clescent, L.S., Eaton, A.D., 1992. Stan-dard Methods for Examination of Water and Wastewa-ters. Washington DC, American Public Health Associati-on, 18th ed.
[35] Elibol, M., 2002. Response surface methodological appro-ach for inclusion of perfluorocarbon in actinorhodin fer-mentation medium. Process Biochem., 38, 667–673.
[36] Glenn, J.K., Gold, M.H., 1985. Purification and characteri-zation of an extracellular Mn II-dependent peroxidase from the lignin degrading basidiomycetes Phanerochaete chrysosporium. Arch. Biochem. Biophys., 242, 329–341.
[37] Box, G.E.P., Cox, D.R., 1964. An analysis of transforma-tions. J. Royal Stat. Soci., 26, 211–246.
[38] Box, G., Hunter, W., Hunter, S., 1978. Statics for Experi-menters. John Wiley and Sons, New York.
[39] Sai-Nan, S., Hua-Li, Nie., Li-Min, Zhu., Tian-Xiang, Chen., 2009. Optimization of adsorption conditions of papain on dye affinity membrane using response surface methodo-logy. Biores. Technol., 100, 2336–2340.
[40] Sathishkumar, P., Murugesan, K., Palvannan, T., 2010. Production of laccase from Pleurotus florida using agro-wastes and efficient decolorization of Reactive blue 198. J. Basic Microbiol., 50, 360–367.
[41] Wadikar, T.K., Majumdar, C., Nanjappa, K.S., Premavalli., Bawa, A.S., 2008. Development of shelf stable pepper ba-sed appetizers by response surface methodology (RSM). L.W.T., 41, 1400–1411.
[42] Lusta, K.A., Chung, I.K., Sul, I.W., Park, H.S., Shin, D.I., 2000. Immobilization of fungus Aspergillus sp. by a novel cryogel technique for production of extracellular hydroly-tic enzymes. Process Biochem., 35, 1177–1182.
[43] Knapp, J.S., Newby, P.S., Reece, L.P., 1995. Decolourization of dyes by wood rotting Basidiomycete Fungi. Enzyme Mi-crobial. Biotechnol. 17, 664–668.
[44] Leonowicz, A., Cho, N., Luterek, J., 2001. Fungal laccase: properties and activity on lignin. J. Basic Microbiol., 41, 185–227.