Embed Size (px)
Citation preview

Chapter 12
ANALYZING CYBER-PHYSICALATTACKS ON NETWORKEDINDUSTRIAL CONTROL SYSTEMS
Bela Genge, Igor Nai Fovino, Christos Siaterlis and Marcelo Masera
Abstract Considerable research has focused on securing SCADA systems and pro-tocols, but an efficient approach for conducting experiments that mea-sure the impact of attacks on the cyber and physical components ofthe critical infrastructure is not yet available. This paper attempts toaddress the issue by presenting an innovative experimental frameworkthat incorporates cyber and physical systems. An emulation testbedbased on Emulab is used to model cyber components while a soft real-time simulator based on Simulink is used to model physical processes.The feasibility and performance of the prototype is evaluated througha series of experiments. The prototype supports experimentation withnetworked industrial control systems and helps understand and measurethe consequences of cyber attacks on physical processes.
Keywords: Industrial control systems, cyber attacks, simulation, testbed
1. Introduction
Modern critical infrastructures such as power plants and water supply sys-tems rely on information and communications technologies, which contribute toreduced costs as well as greater efficiency, flexibility and interoperability. How-ever, these technologies, which underlie networked industrial control systems,are exposed to significant cyber threats [7, 14]. The recent Stuxnet worm [8] isthe first malware that was specifically designed to attack networked industrialcontrol systems. Stuxnet’s ability to reprogram the logic of control hardwareand alter physical processes demonstrates the danger of modern cyber threats.Stuxnet has served as a wakeup call for the international security community,and has raised many questions. Above all, Stuxnet reminds us that an effi-cient approach for conducting experiments that measure the impact of attacks

168 CRITICAL INFRASTRUCTURE PROTECTION V
on the cyber and physical components of the critical infrastructure is not yetavailable.
The study of complex systems, whether cyber or physical, can be carried outby experimenting with real systems, software simulators or emulators. Experi-mentation with real production systems is hindered by the inability to controlthe environments adequately to obtain reproducible results. Furthermore, anystudy that attempts to analyze security or resilience raises serious concernsabout the potential faults and disruptions to mission-critical systems. Thealternative, a dedicated experimental infrastructure with real components, iscostly and the experiments can pose safety risks. Software-based simulationis generally considered to be an efficient approach to study physical systems,mainly because of its lower cost coupled with fast and accurate analysis. How-ever, it has limited applicability to cyber security because of the complexityand diversity of information and communications technologies. Moreover, whilesoftware simulators may effectively model normal operations, they fail to cap-ture the manner in which computer systems fail.
For these reasons, we have chosen to adopt a hybrid approach between thetwo extremes of experimentation with real components and pure software sim-ulation. Our proposed framework uses simulation for the physical componentsand an emulation testbed based on Emulab [9, 22] to recreate the cyber com-ponents of networked industrial control systems such as SCADA servers andcorporate networks. The models of the physical systems are developed usingMatlab Simulink, from which the corresponding C code is generated using Mat-lab Real Time Workshop. The generated code is executed in real time and caninteract with the real components in the emulation testbed.
The primary advantage of the framework is that it provides an experimenta-tion environment for understanding and measuring the consequences of cyberattacks to physical processes while using real cyber components and malwarein a safe manner. Furthermore, experimental evaluations of the frameworkdemonstrate that it can scale and accurately recreate large networked indus-trial control systems with up to 100 programmable logic controllers (PLCs).
2. Related Work
Analyzing the behavior of networked industrial control systems is challengingbecause they incorporate components that interact in the physical and cyberdomains. This section briefly describes the most relevant work on the subject.
Wang, et al. [21] employ an OPC (OLE for Process Control) server, thens-2 network simulator, and real PLCs and field devices to analyze networkedindustrial control systems. ns-2 is used to simulate the enterprise networkof a SCADA system. Calls from ns-2 are dispatched via software agents tothe OPC server, which sends Modbus messages to the physical PLCs. In thisapproach, the only simulated component is the enterprise network; all the othercomponents (servers, PLCs, etc.) are real. Because almost every componentis real, such a testbed can provide reliable experimental data, but it cannotsupport tests on large infrastructures such as chemical plants and gas pipelines.

Genge, Nai Fovino, Siaterlis & Masera 169
Nai Fovino, et al. [15] have also pursued a similar approach by developing aprotected environment for studying cyber vulnerabilities in power plant controlsystems. The core of their environment is a real industrial system that repro-duces the physical dynamics of a power plant. However, the high fidelity ofthis testing environment is counterbalanced by its poor flexibility with respectto handling new systems and its high maintenance costs.
Hiyama and Ueno [10] have used Simulink to model physical systems andthe Matlab Real Time Workshop to run the model in real time. A similarapproach has been used by Queiroz, et al. [18] to analyze the security of SCADAsystems. In their case, only the sensors and actuators are real physical devices;the remaining components (e.g., PLCs) and the communication protocols areimplemented as OMNeT++ modules.
Other researchers focus on simulating both SCADA and field devices. Forexample, Chabukswar, et al. [4] use the Command and Control WindTunnel(C2WindTunnel) [16] multi-model simulation environment, based on the High-Level Architecture (HLA) IEEE Standard 1.3 [3], to enable interactions betweenmultiple simulation engines. They use OMNeT++ to simulate the network andthe Matlab Simulink to build and run the physical plant model. C2WindTunnelprovides the global clock for OMNeT++ and Matlab Simulink. Nevertheless,analyzing the cyber-physical effects of malware is a challenging task, becauseit requires a detailed description of all the cyber components and detailedknowledge of the dynamics of malware, which is rarely available.
Davis, et al. [6] use PowerWorld [17], a high-voltage power system simulationand analysis package [17], to model an entire power grid and run it in realtime. The PowerWorld server is connected to a proxy that implements theModbus protocol and transmits Modbus messages to client applications. Clientapplications interact with the PowerWorld server via a visual interface thatallows them to introduce disturbances into the network and observe the effects.Our approach also uses simulation for the physical layer. However, unlike Davis,et al. [6], we also emulate typical components such as PLCs and master units.
3. Proposed Framework
This section presents the proposed experimentation framework that sup-ports the analysis of the physical impact of cyber threats against networkedindustrial control systems. Following a brief description of a typical networkedindustrial control system architecture, we present the proposed framework andits prototype implementation.
3.1 Control System Architecture
Modern industrial process control network architectures have two controllayers: (i) the physical layer, which comprises actuators, sensors and hardwaredevices that physically perform the actions on the system (e.g., open valves,measure voltages, etc.); and (ii) the cyber layer, which comprises all the infor-mation and communications devices and software that acquire data, elaborate
170 CRITICAL INFRASTRUCTURE PROTECTION V
HMI PC
HMI PC
3-Layer Switch
VLAN3
VLAN2VLAN1
802.11 WLAN
PLC
PLC
Temperature Sensor
Pump 1
Pump 2
TurbineGenerator
Pressure Sensor
Fuel
Condenser
VOUT
Temperature Sensor
Vessel
ControlRods
Physical LayerCyber Layer
PLC
PLC
Process Network
SCADA Svr.
SCADA Svr.
SCADA Svr.
HMI PC
Control Network
Control Network
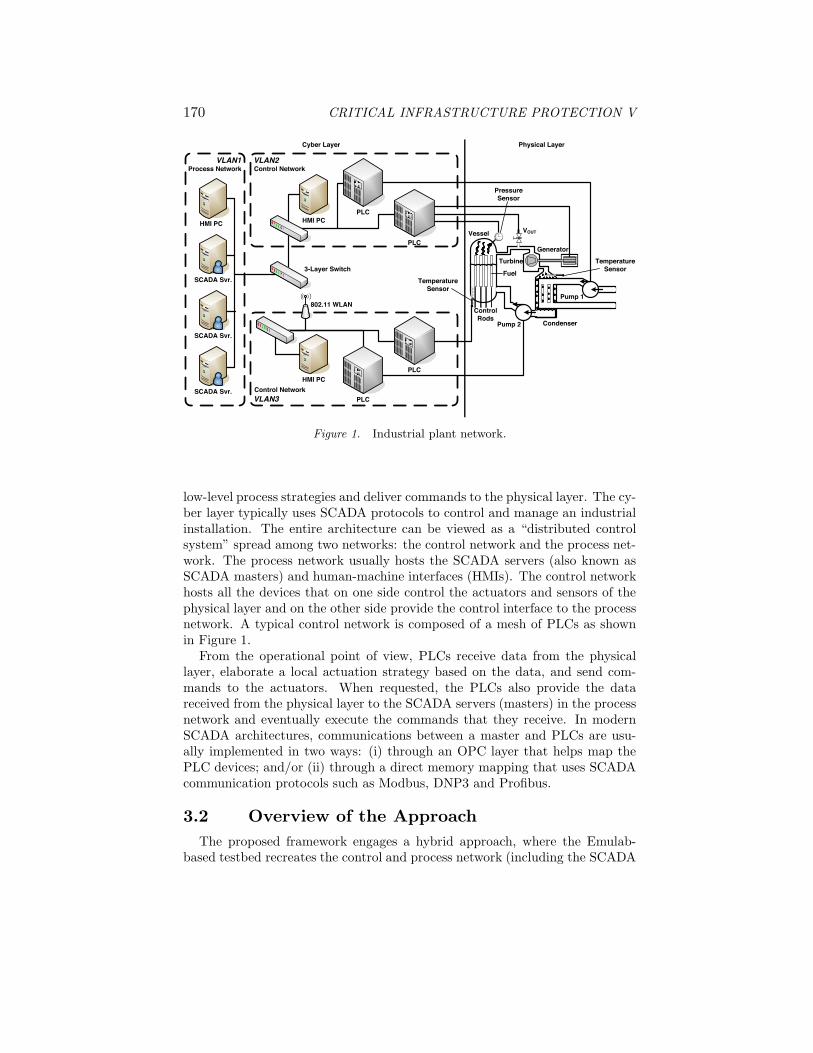
Figure 1. Industrial plant network.
low-level process strategies and deliver commands to the physical layer. The cy-ber layer typically uses SCADA protocols to control and manage an industrialinstallation. The entire architecture can be viewed as a “distributed controlsystem” spread among two networks: the control network and the process net-work. The process network usually hosts the SCADA servers (also known asSCADA masters) and human-machine interfaces (HMIs). The control networkhosts all the devices that on one side control the actuators and sensors of thephysical layer and on the other side provide the control interface to the processnetwork. A typical control network is composed of a mesh of PLCs as shownin Figure 1.
From the operational point of view, PLCs receive data from the physicallayer, elaborate a local actuation strategy based on the data, and send com-mands to the actuators. When requested, the PLCs also provide the datareceived from the physical layer to the SCADA servers (masters) in the processnetwork and eventually execute the commands that they receive. In modernSCADA architectures, communications between a master and PLCs are usu-ally implemented in two ways: (i) through an OPC layer that helps map thePLC devices; and/or (ii) through a direct memory mapping that uses SCADAcommunication protocols such as Modbus, DNP3 and Profibus.
3.2 Overview of the Approach
The proposed framework engages a hybrid approach, where the Emulab-based testbed recreates the control and process network (including the SCADA

Genge, Nai Fovino, Siaterlis & Masera 171
192.168.1.2
PLCMEM
Tight Coupling
PhysicalModels
PLCMEM
192.168.1.1
R-PLC Unit
Master Unit
MEMRead/Write
Physical LayerCyber-PhysicalLayer
Cyber Layer
SC Unit
Loose coupling
PLC Code
PLC Code
Tight Coupling
MEMRead/Write
R-PLC Unit
MEMRead/Write
Emulab Testbed
192.168.1.3
192.168.1.4
Figure 2. Overview of the framework.
servers and PLCs), and a software simulation reproduces the physical processes.Figure 2 shows a high-level view of the proposed framework. The principalargument for emulating the cyber components is that any study of the securityand resilience of a computer network requires the simulation of all the failure-related functions, behaviors and states, most of which are unknown. On theother hand, software simulation is a very reasonable approach for the physicallayer because of its low cost, the existence of accurate models and the abilityto conduct experiments safely.
The architecture presented in Figure 2 has three layers: the cyber layer,link layer and physical layer. The cyber layer incorporates the informationand communications devices used in SCADA systems, while the physical layerprovides the simulation of physical devices. The link layer serves as the gluefor the two layers through the use of a shared memory region.
The cyber layer is recreated by an emulation testbed that uses the Emulabarchitecture and software [22] to automatically and dynamically map physicalcomponents (e.g., servers and switches) to a virtual topology. In other words,the Emulab software configures the physical topology so that it emulates thevirtual topology as accurately as possible. Interested readers are referred to [9]for additional details.
Aside from the process network, the cyber layer also includes the controllogic code, which is implemented by PLCs in the real world. In our approach,the control code can be made to run sequentially or in parallel with the physical

172 CRITICAL INFRASTRUCTURE PROTECTION V
model. In the sequential case, we use tightly-coupled code, i.e., code that runsin the same memory space as the model. In the parallel case, we use loosely-coupled code, i.e., code that runs in another address space, possibly on anotherhost. The main advantage of tightly-coupled code is that it does not miss valuesgenerated by the model between executions. On the other hand, loosely-coupledcode supports the execution of PLC code remotely, the injection of maliciouscode without stopping the execution of the model and the operation of morecomplex PLC emulators.
The cyber-physical layer incorporates the PLC memory (usually a set ofregisters) and the communications interfaces that glue the other two layers.Memory registers provide the links to the inputs (e.g., valve positions) andoutputs (e.g. sensor values) of the physical model.
The physical layer provides the real-time execution of the physical model.The execution time of the model is strongly coupled to the timing serviceprovided by the operating system on which the model executes. Because amulti-tasking operating system is used, achieving hard real-time execution isa difficult task without using kernel drivers. However, soft real-time executioncan be achieved by allowing some deviations from the operating system clock.We further elaborate on this topic in the following sections.
The selection of a time step, i.e., the time between two executions of themodel, for a given setting is not a trivial task. Choosing a small value (inthe order of microseconds), increases the deviation of the execution from thesystem clock and the number of missed values by loosely-coupled code. Onthe other hand, choosing a larger value (in the order of seconds), may causecertain effects and attacks to be missed. At the same time, the selected timestep cannot be less than the execution time of the physical model. We use theterm “resolution” to denote the minimal value of the time step. When a systemincludes tightly-coupled code, because this code executes sequentially with themodel, the resolution cannot be less than the cumulative execution time of thePLC code and physical model.
3.3 Detailed Architectural Description
Figure 3 presents the modular structure of the framework. The frameworkhas three main units: the simulation core (SC), remote PLC (R-PLC) andSCADA master.
Simulation Core Unit: The main role of the simulation core unit is toprovide soft real-time execution of tightly-coupled code and the physicalmodel, synchronized with the operating system clock, providing at thesame time the glue between the cyber and physical layers. The mostimportant modules of the simulation core unit are: the local PLC (L-PLC), remoting handler and core. Communications between simulationcore and remote units are handled by .NET’s binary implementation ofRPC over TCP (called “remoting”). The local PLC module incorporatesthe PLC memory (e.g., coils, digital input registers, input registers and

Genge, Nai Fovino, Siaterlis & Masera 173
Figure 3. Modular architecture.
holding registers), which is used as the glue between the cyber and phys-ical layers and the code runner module. The remoting handler modulehandles the communications between the local PLC modules and the lo-cal RPC system. The core module ensures the exchange of data betweenmodules and the execution of the core timer. With the help of this timer,the simulation core unit provides soft real-time execution of the physicalmodel.
Remote PLC Unit: The main role of the remote PLC unit is to runloosely-coupled code and to provide an interface for master units to accessthe model. The main modules include: the remoting handler module,which implements communications with the simulation core; the coderunner module, which runs the loosely-coupled code; and the Modbushandler module, which implements the Modbus protocol.
Master Unit: The main role of the master unit is to implement a globaldecision based on the sensor values received from the remote PLC units.It includes a Modbus handler module for communicating with the remotePLC units and the decision algorithm module.
3.4 Implementation Details
The framework code was written in C#. The Mono platform was used toport the framework to a Unix system. Tightly-coupled code can be providedas C# source files or as binary DLLs, both of which are dynamically loadedat run time. C# source files are dynamically loaded, compiled and executedat run time using .NET support for dynamic code execution. Although C#source files have longer execution times, they provide the ability to implementPLC code without a development environment. At this time, loosely-coupledcode is written in C# and must be compiled with the rest of the unit.

174 CRITICAL INFRASTRUCTURE PROTECTION V
Matlab Simulink was used to simulate the physical layer because a wide vari-ety of plants (e.g., power plants, water purification plants and gas plants) haveto be covered. Matlab Simulink is a general design and simulation environ-ment for dynamic and embedded systems. It provides several toolboxes thatcontain pre-defined components for domains such as power systems, mechan-ics, hydraulics, electronics, etc. These toolboxes are enriched with every newrelease, providing powerful support for designers and effectively reducing thedesign time. C code corresponding to Simulink models are generated using theMatlab Real Time Workshop. The generated code is then integrated into theframework and its execution time is synchronized with the operating systemclock.
As mentioned above, communications between the simulation core and re-mote units are handled by .NET’s remoting feature. .NET remoting ensuresminimal overhead and the use of a well-established implementation. Currently,we use Modbus over TCP for communications between remote PLCs and mas-ter units. However, new protocols are easily added by substituting the Modbushandler module.
The synchronization of the model execution time with the system clock isimplemented within the simulation core unit using a synchronization algorithm.At first glance, such an algorithm seems to be trivial; however, an experimen-tal study has indicated the existence of several pitfalls. The main concern isthat the PLC memory is a shared resource between the simulation core unitand remote PLC units. This means that the PLC memory has to be protectedfrom simultaneous access, which introduces the problem of critical sections fromthe field of concurrent programming. Intuitively, a synchronization algorithmwould have to run the process model only once for each time step. However, ina multi-tasking environment such an approach introduces accumulated devia-tions because the operating system can stop and resume threads without anyintervention from the user space. Based on this observation, the implementedsynchronization algorithm includes a loop to run the process model multipletimes in each time step in order to reduce the deviation.
4. Performance Evaluation
This section focuses on the evaluation of the performance of the frameworkwith respect to scalability, resolution and deviation from the operating systemclock. The results show that the framework can support as many as 100 PLCswith code sizes ranging from a few if-instructions to 1,000 if-instructions.
4.1 Experimental Setup
The experiments were conducted on an Emulab testbed running the FreeBSDoperating system. Note, however, that the framework was also tested with theWindows 7, Fedora Core 8 and Ubuntu 10.10 operating systems. In all, eighthosts were used, one for running the simulation core unit, one for running the

Genge, Nai Fovino, Siaterlis & Masera 175
PhysicalModels
192.168.1.1
SC Unit
Master Unit
192.168.1.8
...
R-PLCUnit
192.168.1.3192.168.1.7
R-PLCUnit
R-PLCUnit
192.168.1.2
Model 1 Model 2 Model 3
{
T1 = u1R + u3O2 − u2O1,T2 = u2O1 − u3O2,
⎧
⎪
⎪
⎪
⎪
⎪
⎪
⎨
⎪
⎪
⎪
⎪
⎪
⎪
⎩
x1 = −0.0018u2x9/81 + 0.9u1 − 0.15u3,
x2 = (0.073u2 − 0.016)x9/81 − 0.1x2,
x3 = (141u3 − (1.1u2 − 0.19)x1)/85,y1 = x1,y2 = x2,y3 = 0.05(0.1307x3 + 100sq + er/9 − 67.975),
⎧
⎪
⎪
⎪
⎪
⎪
⎨
⎪
⎪
⎪
⎪
⎪
⎩
· · ·
Mw = Mc − u3Mo,Ts = Tmix − Ts,
Tcw = T ′
mix − Tcw + hA(Ts−Tcw)Mcw
,
Mc = hhfg
(Ts − Tcw)A,
Figure 4. Experimental setup and plant models.
master unit, and six for running up to 100 remote PLC units. Figure 4 presentsthe experimental setup and the plant models that were used.
Three plant models were constructed in Simulink, from which the corre-sponding C code was generated using the Matlab Real Time Workshop. Thefirst model (Model 1 in Figure 4) corresponds to a simplified version of a waterpurification plant with two water tanks. Model 2 corresponds to a 160 MW oil-fired electric power plant based on the Sydsvenska Kraft AB plant in Malmo,Sweden [2]; the model includes a boiler and turbine. Several power plant modelsare available in the literature [5, 12, 13, 19], however, this particular model wasselected because it includes estimated parameters from a real power plant andhas been used by other researchers [1, 20] to validate their proposals. Model 3extends the second model by incorporating a condenser; the equations for thecondenser are based on [11].
4.2 Plant Model Execution Time
We measured the execution times of the Simulink models for the three plantsmentioned above. The execution time of the first model was 19.2 µs. Thesecond model has four additional equations, including the equations for sq ander, which yielded an added execution time of 4 µs and a total execution timeof 23.2 µs. The third model also has four additional equations, which yieldedan added execution time of 4.7 µs and a total execution time of 27.9 µs. Basedon these measurements, the time step chosen for a system cannot be less thanthe execution time of the model.
4.3 PLC Code Execution Time
In the current implementation, tightly-coupled PLC code can be providedas a C# source file, a C# DLL or a native dynamic library. Since the loosely-

176 CRITICAL INFRASTRUCTURE PROTECTION V
! ! !
!!
!
Figure 5. Execution time of tightly-coupled PLC code.
coupled PLC code was included as a module in the remote PLC unit, it had tobe written in C# and compiled with the rest of the unit.
As shown in Figure 5, the execution time of PLC code varies with the type ofimplementation (e.g., C# source file, C# DLL or native dynamic library) andthe number of if-instructions (for each if-instruction, we also considered a PLCmemory write instruction). The C# source file had the longest execution timebecause the code was compiled at runtime, while the native dynamic libraryhad the shortest execution time because it was a binary that was compiled forthe target platform. However, the key advantage of using C# source files isthat they do not require the presence of development libraries, changes can bemade rapidly and experiments can be resumed quickly.
4.4 Measuring System Resolution
For tightly-coupled code, the resolution is a function of the execution timeof the model, the execution time of the tightly-coupled code and the addedoverhead of handling PLC code:
RES1 = tmodel +!
i
(tiplc + toh).
For this setting, the missed rate is zero because the PLC code was run sequen-tially with the model, i.e., Miss1 = 0.
For loosely-coupled code, the resolution is only a function of the modelexecution time:
RES2 = tmodel.

Genge, Nai Fovino, Siaterlis & Masera 177
! !! !! !! !
!
! !! !
!
Figure 6. System resolution.
However, the number of missed values is no longer zero because it depends onthe chosen time step and the number of PLCs, i.e., Miss2 = αN
st, where stis the chosen time step and N is the number of loosely-coupled PLCs. Thevalue of αN
st is determined empirically and can only be approximated becausea multi-tasking operating system is used.
For a mixed system, which includes loosely-coupled and tightly-coupled code,the resolution equals that for the tightly-coupled setting, i.e., RES3 = RES1,and the missed count equals that for the loosely-coupled setting, i.e., Miss3 =Miss2. Thus, the minimal value of the time step that can be chosen is equalto the system resolution.
For tightly-coupled code, we measured the resolution for up to 100 PLCsand code sizes ranging from 1 to 1,000 if-instruction sets. The results shownin Figure 6 correspond to Model 2 with an execution time of 23.3 µs andnative DLL-based PLC code. Of course, the resolution would automaticallyincrease when using other models with longer execution times or other PLCcode implementations. The resolution can also be increased by increasing thenumber of PLCs because more PLC code must be executed sequentially withthe model. For instance, in the case of a single PLC and PLC code with 100if-instructions, the resolution is 0.029 ms and increases up to 0.204 ms for 100PLCs. However, the values generated by the model were not missed and thePLCs were able to react to all model changes.
For loosely-coupled code, the resolution equals the model execution time.Naturally, for mixed systems the resolution equals the model execution timeplus the tightly-coupled code execution time (Figure 6). Unlike the tightly-coupled code scenario, it is necessary to consider that PLCs miss values gen-

178 CRITICAL INFRASTRUCTURE PROTECTION V
erated by the model because the execution time is not synchronized betweenunits, a multi-tasking operating system is used, and network communicationsintroduce additional delays. Thus, providing a low miss rate at resolutions of0.1 ms is difficult because of the multi-tasking operating system and the addedoverhead of network communications.
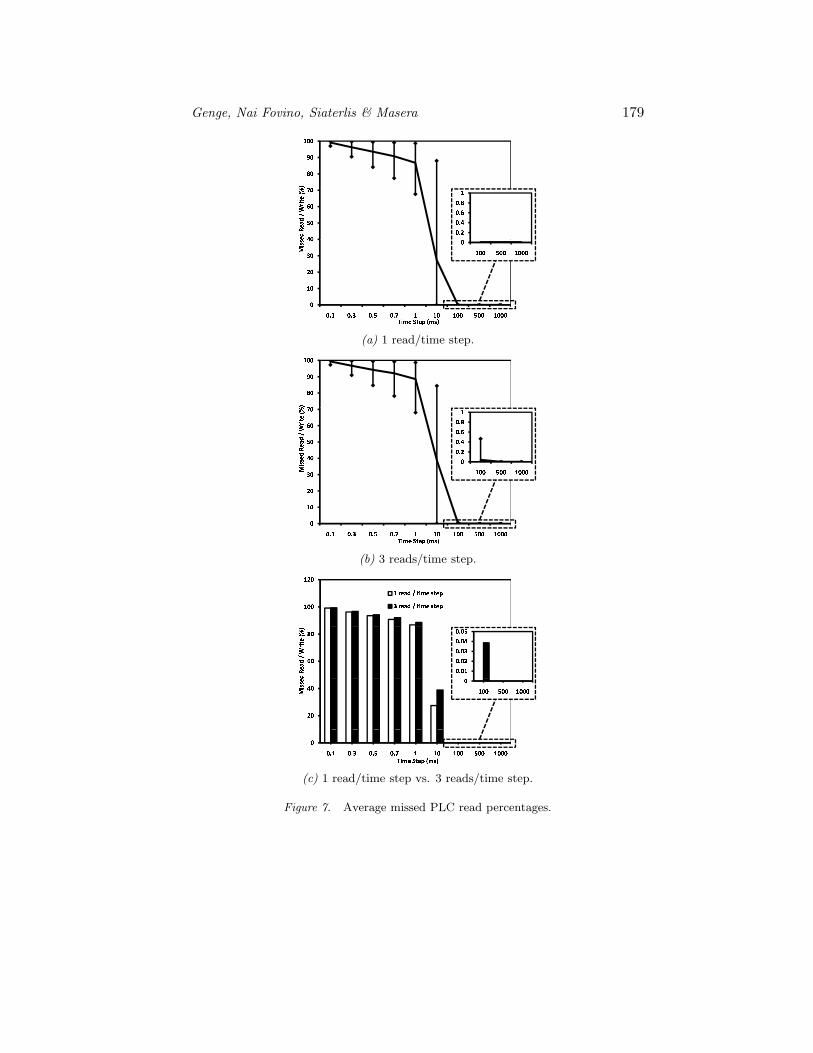
We chose nine time steps ranging from 0.1 ms to 1,000 ms and measuredthe average number of missed reads for each time step. In the experiment,each PLC read the remote memory, ran 100 if-instructions and then wrote theresults back to the remote memory. The number of missed reads is influencedby the number of PLCs and the read frequency. We considered up to 100 PLCsand two read frequencies (1 read/time step and 3 reads/time step).
Figures 7(a) and 7(b) show the average (for 1 to 100 PLCs) measured per-centages of missed reads for 1 read/time step and 3 reads/time step, respec-tively. For both settings, the average miss rate exceeds 50% for time stepssmaller than 1 ms, mainly due to network delays, for which we measured aminimum value of 0.25 ms. For time steps larger than 10 ms, the percentage ofmissed reads became zero (even for 100 PLCs). Comparing the average valuesfor the two settings (Figure 7(c)) shows a slight decrease in the value of themiss rate for a frequency of 1 read/time step. The reason is that reducing thenumber of reads decreases the number of simultaneous accesses to the synchro-nized PLC memory; thus, more PLCs can access the remote memory duringeach time step.
In summary, for the extreme case of 100 PLCs executing tightly-coupled codewith each PLC running 1,000 if-instructions, the proposed framework providesa resolution of 0.638 ms with a miss rate of zero. On the other hand, achievinga miss rate of zero for the loosely-coupled case is only possible with time stepsgreater than 100 ms.
4.5 Measuring System Deviation
The proposed framework maintains the execution time synchronized withthe operating system clock. Because of the multi-tasking environment usedto run the framework, synchronization is affected by the number of PLCs andthe chosen code coupling. The measured deviation for tightly-coupled code isshown in Figure 8. For a time step of 0.1 ms, the evolution of the deviationis shown as a dashed line. Note that when more than 20 PLCs are used, thedeviation increases gradually and exceeds 1 ms for 30 PLCs. This is becausethe cumulative PLC code execution time exceeds the 0.1 ms time step. On theother hand, the deviation is decreased by increasing the time step – for timesteps of 10 ms, 100 ms, 500 ms and 1 s, the deviation is maintained around2.2 µs even for 100 PLCs.
Figures 9(a) and 9(b) show the average measured deviations for loosely-coupled code with 1 read/time step and 3 reads/time step, respectively. Forboth time steps, the deviation increases starting with a 0.1 ms time step asmore PLCs access the remote PLC memory. Starting with a 100 ms time step,the average deviation is maintained around 0.002 ms for 1 read/time step and
Genge, Nai Fovino, Siaterlis & Masera 179
!!!
!
! !
(a) 1 read/time step.
!!!
!
! !
(b) 3 reads/time step.
! ! ! !
! ! ! !
!!!
!
! !
(c) 1 read/time step vs. 3 reads/time step.
Figure 7. Average missed PLC read percentages.

180 CRITICAL INFRASTRUCTURE PROTECTION V
!
!
Figure 8. Deviation for tightly-coupled PLC code.
0.1 ms for 3 reads/time step. Comparing the average values for the two settings(Figure 9(c)) shows that a larger read frequency introduces larger deviations,an expected result. More specifically, the value of the deviation increases up to50 times for a time step of 100 ms.
5. Conclusions
The framework for the security analysis of networked industrial control sys-tems represents an advancement over existing approaches that either use realphysical components combined with simulated/emulated components or a com-pletely simulated system. The hybrid architecture of the framework uses em-ulation for protocols and components such as SCADA servers and PLCs, andsimulation for the physical layer. This approach captures the complexity of in-formation and communications devices and efficiently handles the complexity ofthe physical layer. Another novel feature of the framework is that it supportsboth tightly-coupled and loosely-coupled code. Tightly-coupled code is usedwhen PLCs cannot afford to miss any events; loosely-coupled code permitsthe injection of new (malicious) code without stopping execution. Tightly-coupled code ensures lower resolution with a zero miss rate; on the other hand,loosely-coupled code permits the integration of complex PLC emulators withoutaffecting the architectures of the other units.
The models considered range from simple water purification plants to com-plex boiling water power plants. Experimental results demonstrate that theframework is capable of running complex models within tens of microseconds.With regard to parameters such as resolution, miss rate and deviation, tightly-

Genge, Nai Fovino, Siaterlis & Masera 181
!
! !
(a) 1 read/time step.
!
! !
(b) 3 reads/time step.
! ! ! !
! ! ! !
!
! !
(c) 1 read/time step vs. 3 reads/time step.
Figure 9. Average deviation for loosely-coupled PLC code.

182 CRITICAL INFRASTRUCTURE PROTECTION V
coupled code provides higher resolution values, but with lower miss rates anddeviations. On the other hand, loosely-coupled code yields lower resolutionvalues with higher miss rates and deviations.
Our future research will use the framework to study the propagation ofperturbations in cyber-physical environments, analyze the behavior of physicalplants and develop countermeasures. It will also analyze the physical impactof attacks using more complex models that include descriptions of the physicalcomponents.
References
[1] A. Abdennour and K. Lee, An autonomous control system for boiler-turbine units, IEEE Transactions on Energy Conversion, vol. 11(2), pp.401–406, 1996.
[2] R. Bell and K. Astrom, Dynamic Models for Boiler-Turbine AlternatorUnits: Data Logs and Parameter Estimation for a 160 MW Unit, TechnicalReport TFRT-3192, Department of Automatic Control, Lund Institute ofTechnology, Lund, Sweden, 1987.
[3] J. Calvin and R. Weatherly, An introduction to the high level architec-ture (HLA) runtime infrastructure (RTI), Proceedings of the FourteenthWorkshop on Standards for the Interoperability of Defense Simulations,pp. 705–715, 1996.
[4] R. Chabukswar, B. Sinopoli, G. Karsai, A. Giani, H. Neema and A. Davis,Simulation of network attacks on SCADA systems, presented at the FirstWorkshop on Secure Control Systems, 2010.
[5] P. Chawdhry and B. Hogg, Identification of boiler models, IEE Proceedingson Control Theory and Applications, vol. 136(5), pp. 261–271, 1989.
[6] C. Davis, J. Tate, H. Okhravi, C. Grier, T. Overbye and D. Nicol,SCADA cyber security testbed development, Proceedings of the Thirty-Eighth North American Power Symposium, pp. 483–488, 2006.
[7] S. East, J. Butts, M. Papa and S. Shenoi, A taxonomy of attacks on theDNP3 protocol, in Critical Infrastructure Protection III, C. Palmer and S.Shenoi (Eds.), Springer, Heidelberg, Germany, pp. 67–81, 2009.
[8] N. Falliere, L. O’Murchu and E. Chien, W32.Stuxnet Dossier, Symantec,Mountain View, California (www.symantec.com/content/en/us/enterprise/media/security response/whitepapers/w32 stuxnet dossier.pdf), 2011.
[9] M. Guglielmi, I. Nai Fovino, A. Perez-Garcia and C. Siaterlis, A prelimi-nary study of a wireless process control network using emulation testbeds,Proceedings of the Second International Conference on Mobile LightweightWireless Systems, pp. 268–279, 2010.
[10] T. Hiyama and A. Ueno, Development of a real time power system sim-ulator in Matlab/Simulink environment, Proceedings of the IEEE PowerEngineering Society Summer Meeting, vol. 4, pp. 2096–2100, 2000.

Genge, Nai Fovino, Siaterlis & Masera 183
[11] Y. Kim, M. Chung, J. Park and M. Chun, An experimental investigation ofdirect condensation of steam jet in subcooled water, Journal of the KoreanNuclear Society, vol. 29(1), pp. 45–57, 1997.
[12] A. Kumar, K. Sandhu, S. Jain and P. Kumar, Modeling and control of amicro-turbine-based distributed generation system, International Journalof Circuits, Systems and Signal Processing, vol. 3(2), pp. 65–72, 2009.
[13] J. McDonald and H. Kwatny, Design and analysis of boiler-turbine-generator controls using optimal linear regulator theory, IEEE Transac-tions on Automatic Control, vol. 18(3), pp. 202–209, 1973.
[14] I. Nai Fovino, A. Carcano, M. Masera and A. Trombetta, An experimentalinvestigation of malware attacks on SCADA systems, International Jour-nal of Critical Infrastructure Protection, vol. 2(4), pp. 139–145, 2009.
[15] I. Nai Fovino, M. Masera, L. Guidi and G. Carpi, An experimental platformfor assessing SCADA vulnerabilities and countermeasures in power plants,Proceedings of the Third Conference on Human System Interaction, pp.679–686, 2010.
[16] S. Neema, T. Bapty, X. Koutsoukos, H. Neema, J. Sztipanovits and G.Karsai, Model-based integration and experimentation of information fusionand C2 systems, Proceedings of the Twelfth International Conference onInformation Fusion, pp. 1958–1965, 2009.
[17] PowerWorld Corporation, Champaign, Illinois (www.powerworld.com).
[18] C. Queiroz, A. Mahmood, J. Hu, Z. Tari and X. Yu, Building a SCADAsecurity testbed, Proceedings of the Third International Conference on Net-work and System Security, pp. 357–364, 2009.
[19] H. Seifi and A. Seifi, An intelligent tutoring system for a power plantsimulator, Electric Power Systems Research, vol. 62(3), pp. 161–171, 2002.
[20] W. Tan, H. Marquez, T. Chen and J. Liu, Analysis and control of a nonlin-ear boiler-turbine unit, Journal of Process Control, vol. 15(8), pp. 883–891,2005.
[21] C. Wang, L. Fang and Y. Dai, A simulation environment for SCADA secu-rity analysis and assessment, Proceedings of the International Conferenceon Measuring Technology and Mechatronics Automation, vol. 1, pp. 342–347, 2010.
[22] B. White, J. Lepreau, L. Stoller, R. Ricci, S. Guruprasad, M. Newbold, M.Hibler, C. Barb and A. Joglekar, An integrated experimental environmentfor distributed systems and networks, Proceedings of the Fifth Symposiumon Operating Systems Design and Implementation, pp. 255–270, 2002.