Embed Size (px)
Citation preview
1
Analysis of Historical Pricing and Fundamentals Growth in the National Multifamily Market: Does Property Class and Market Type Matter?
Randy I Anderson University of Central Florida
College of Business Dr. P. Phillips School of Real Estate
Orlando, FL 32816 407-823-0761
Joshua A. Harris* University of Central Florida
College of Business Dr. P. Phillips School of Real Estate
Orlando, FL 32816 407-489-2443
*Contact Author
2
Analysis of Historical Pricing and Fundamentals Growth in the National Multifamily Market: Does Property Class and Market Type Matter?
Abstract
The price of a real estate asset is generally said to be equal to net operating income (NOI) divided by the market capitalization rate (cap rate). The cap rate is a function of the expected growth of the asset, the riskiness of the cash flows of the asset, and the opportunity costs of other potential investment opportunities. Conventional wisdom has suggested that Class A properties in primary markets should (at least partially) be priced more richly than Class B assets in tertiary markets due to superior growth rates and greater liquidity. In this study, we utilize ten years of data from CoStar to examine the voracity of these claims. The findings cast doubt on conventional wisdom. In fact, we find that the Class B market is larger than the Class A market and specifically, the Class B tertiary market had about the same number of transactions over the 10-year period as the Class A primary market in virtually all scenarios. Additionally, appreciation in the Class B tertiary markets was significant in all specifications. The specification(s) where we can find greater appreciation rates for primary Class A properties are largely when a small number of markets are analyzed. And, in many of these markets, it seems likely that the growth rate is already priced into the assets as reflected by their cap rates and spreads to the 10-year Treasury. Interestingly, current cap rate spreads for Class B properties in tertiary markets are relatively high compared to their long-term averages, while current cap rate spreads for Class A properties in primary markets are actually below their long-term averages. This suggests that in at least a historical context, Class B assets in tertiary markets are either undervalued or that Class A assets in primary markets are overvalued. In all, the study is the first to utilize a full 10-year national data set to analyze the very core assumptions of real estate asset pricing. The results suggest that investors are, in some cases, utilizing inappropriate assumptions as they relate to growth and risk in the pricing of real estate assets.

3
Executive Summary
Overview of Study
• Real estate finance theory suggests that the current price of a real estate asset can be expressed as follows: P = NOI/cap rate, where P is the current price of the asset, NOI is the asset’s net operating income and cap rate is the capitalization rate of the asset’s income. Determination of cap rate is said to be a function of three variables: expected growth, risk, and opportunity costs of other investment alternatives (Geltner and Miller, Clayton and Eichholtz, Second Edition, 2007).
• Conventional wisdom suggests that Class A properties in primary markets should be priced at premiums to Class B properties in tertiary markets. The main rationale is that the primary markets will experience higher growth in rental rates and therefore over time have higher levels of appreciation.
• We examine if growth in rental rates and vacancy levels are different between Class A and Class B properties to determine if a pricing premium is warranted.
• Further, we assess whether Class A rental rates are significantly higher than Class B rates. Higher rental rates imply greater sensitivity to economic downturns as those units would be less affordable.
• To assess differences in growth in rental rates, vacancy rates, and rental rate spreads we utilize REIS data with 19 years of history.
• REIS has been collecting market level data for many years and is widely accepted as one of the most reliable sources of market and sub-market fundamental data for the multifamily asset class. REIS data is used by appraisers, institutional investors, and real estate forecasters across the country.
• Additionally, Class A properties have received a pricing premium because conventional wisdom suggests that they are a more liquid asset, which in an asset pricing framework, suggests a lower level of risk i.e. higher prices and lower cap rates.
• However, this conventional wisdom is based on perceptions of market participants and not hard data. Data to validate these ideas has only recently become available with enough time series history for researchers to be able to start analyzing the validity of these asset pricing assumptions.

4
• In this portion of the study, we utilize CoStar Comps Analytics data with over 10 years of history.
• CoStar is widely recognized as maintaining the largest, most complete database of property level transactions in the United States and is widely used by REITs, investment funds, lenders, appraisers, and brokers. CoStar obtains information on transactions from a variety of sources including public records, news articles, property listing databases, as well as field reports from brokers and appraisers. When a sale is evidenced (most states require sales to made part of the public record), a CoStar researcher will actually make contact with an individual who was party to the sale or assisted therein to verify information and collect missing data items. (See Data Appendix for details of the data used in the study)
• The scope of our analysis requires us to define primary and tertiary markets as well as Class A and Class B assets. We define Class A multifamily assets to be those properties with at least 100 units that are no more than 10 years old; this means as annual data is retrieved, the year built is rolled forward (example, Class A for sale in 2000 are buildings constructed between 1990 and 1999, for 2001 the years built would be 1991 through 2000, etc.). We define Class B as those properties with at least 100 units that are older than 10 years but not more than 30 years at the time of sale (example, Class B for sales in 2000 are buildings constructed between 1970 and 1989, for 2001 the years built would be 1971 through 1990, etc.).
• We define primary markets as the top twenty markets based on media market rankings such as those issued by firms such as Nielson. These rankings are not stationary, thus we defined the top twenty by reviewing lists from multiple sources and generally believe these markets to be the top twenty in terms of economic activity and population and thus the primary markets for institutional real estate investors. Note that the actual geographies of the markets are defined by CoStar and generally include relevant suburban markets. Where CoStar breaks out a clear suburban market of the main market we have included it in our primary cut and noted below (adding Long Island back to New York City for example). Additionally, Cleveland, OH, routinely makes the top twenty lists of media markets while San Diego, CA, does not. We believe San Diego is far more commonly viewed as a top twenty institutional real estate market than is Cleveland, thus we switch these markets in defining our primary markets (see pages 24 and 25 for complete lists). Tertiary markets are all other markets in the US tracked by CoStar (see page 26 for a complete list). We also execute the analysis for the top 10 markets for robustness.

5
• Total number of transactions is reported both quarterly and in summation over the analysis window 2000Q1 through 2011Q2. Additionally, average appreciation is calculated as the average annualized return between the 2001Q1 starting point and the 2011Q2 ending point of average price per unit. Average price per unit is also presented quarterly over the analysis window 2000Q1 through 2011Q2.
• Further, we present the current cap rate and price per unit spreads (2011Q1) and the averages over the analysis window (2000Q1 – 2011Q2). We also calculate spreads, both average and current, for each market and class cut against the yield on ten year treasury bonds.
• Finally, we analyze the average cap rate compressions year over year and present the summary findings.
Major Findings:
Liquidity
• The B transaction market is larger than the A transaction market. As such, a liquidity premium for A properties appears unwarranted. (See pages 8 and 9 – points 1 and 2).
• The tertiary B transaction market is at least as large as the primary A transaction market, again casting doubt on the efficacy of price differentiation based on liquidity. (See page 10 – point 3). Fundamentals
• We find there does not exist a statistical difference between Class A and Class B rent growth or vacancy rates. This implies that any pricing premium applied to the Class A market on the basis of higher expected growth rates may be irrational. (See page 11 – point 4 and page 12 – point 5).
• The standard deviation on rent growth and vacancy are both lower for Class B, although the differences are not statistically different. (See page 11 – point 4 and page 12 – point 5).
• Further, Class A does have a significantly higher average rent level, meaning Class A is even less affordable than Class B. (See page 13 – point 6).
6
Appreciation
• Price appreciation in A properties is slightly higher than price appreciation in B properties, however this difference is not very significant. Combined with our previous analysis that shows no statistical difference in rent growth, this casts doubt on the pricing premium paid based on growth for A relative to B. (See page 13 – point 7).
• In primary markets, Class A appears to have had higher appreciation than Class B; however in tertiary markets, Class B actually beat Class A. Regardless, the assumption that B properties in tertiary markets are unable to achieve growth is not supported. (See page 14 – point 8).
• The only place in which we can find significantly higher growth rates was to shrink the primary markets down to the largest markets based on size (i.e. markets such as NYC, San Francisco, Chicago, LA, etc.) In those markets, growth rates do appear to be higher than in the rest of the market ranging from to 0.80% to 3.00% higher on average. However, the cap rates in these markets suggest that the growth may be priced into the assets. (See page 14 – point 8).
• The average annual change in cap rates is nearly indistinguishable between primary A and tertiary B markets; and tertiary B had nearly the same one year compression (opportunity for growth), and nearly the same one year decompression (chance of value declining). (See page 15 – point 9). Current Pricing
• Today’s price per unit is very favorable for Class B. Under both data scenarios, the current dollar spread between Class A and Class B properties are significantly higher than the long term average, suggesting that Class B is a good relative value based on historical norms. (See page 16 – point 10).
• Today’s pricing spreads, based on historical averages, are favorable for B relative to A and for tertiary B relative to top class A markets, meaning that today’s spreads are higher than the long term average, suggest favorable risk-adjusted opportunities in tertiary B. (See page 17 – point 11 and page 18 – point 12).
• Cap rates have averaged higher for tertiary B relative to top class A for most of the data analysis window. Today, spreads of cap rates on tertiary B over top A are nearly twice as high compared to the averages for the data analysis window. This implies tertiary B may
7
provide better yields and potential risk adjusted returns than primary A if purchased today. (See page 18 – point 12 and page 21 – point 14).
• In fact, all markets and class cuts are presently trading at cap rates below long term
averages (due to low debt rates); however primary A assets are trading at cap rates between 22% to 25% lower as opposed to tertiary B assets that are trading at cap rates only 12% to 14% lower. This means risk of cap rate decompression causing extreme value destruction is much higher for primary A than tertiary B. (See page 19 – point 13).
• Further, all primary market assets are presently trading at cap rate spreads over the ten year treasury that are lower than historical averages while all tertiary market assets are trading at spreads higher than historical averages to the ten year. First, this is in no way rational given the historically low nature of primary A cap rates and second, it implies primary A is far more at risk of value destruction if interest rates or inflation moves higher than tertiary B. (See page 19 – point 13). Conclusions
• So, if pricing is currently favorable and there is solid growth (appreciation) with a sufficient transactions market – you have a true opportunity outside of the conventional Class A primary market investment set.
• Combine all this information with the prior findings showing that there is no significant difference in rent growth and vacancy, finance theory would suggest that the B market is either underpriced or the A market is overpriced (we would argue that it is likely that primary A is overpriced given how low the current market cap rates are given their historical average). But, either way, the B market, and especially right now tertiary B, is priced and poised to earn the best risk-adjusted returns. This opportunity will likely dissipate over time which should provide additional appreciation in the B space.
8
Analytical Details
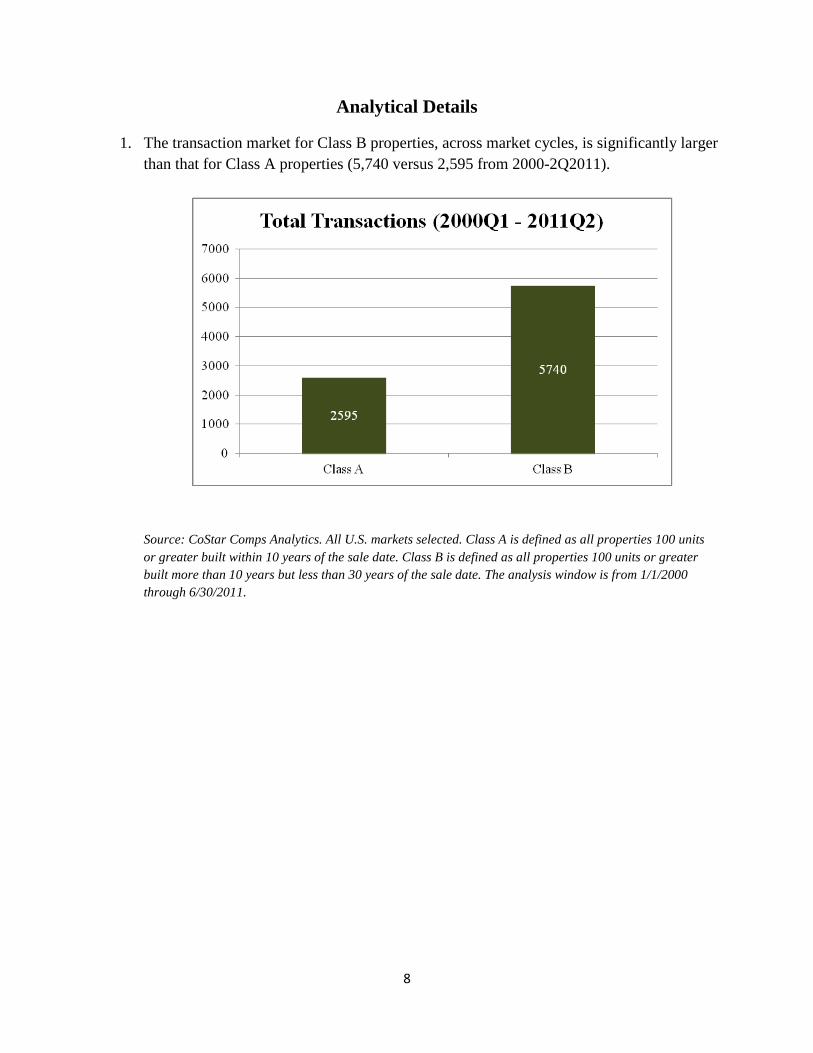
1. The transaction market for Class B properties, across market cycles, is significantly larger than that for Class A properties (5,740 versus 2,595 from 2000-2Q2011).
Source: CoStar Comps Analytics. All U.S. markets selected. Class A is defined as all properties 100 units or greater built within 10 years of the sale date. Class B is defined as all properties 100 units or greater built more than 10 years but less than 30 years of the sale date. The analysis window is from 1/1/2000 through 6/30/2011.
9
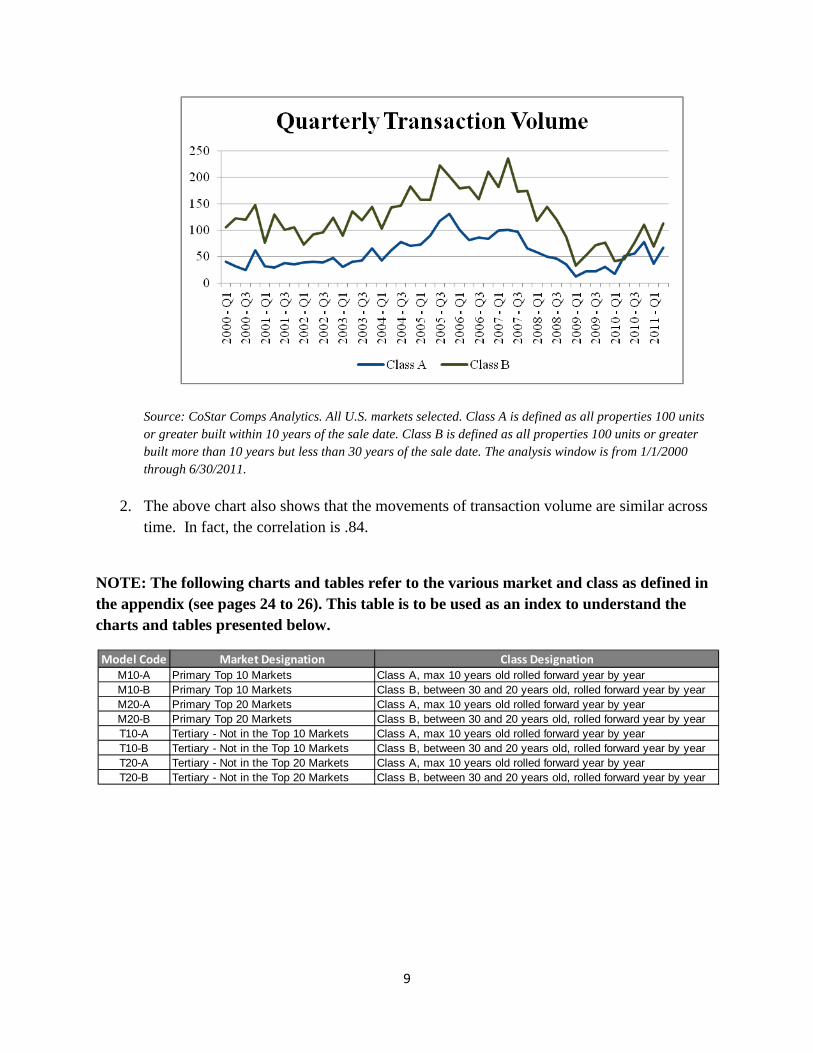
Source: CoStar Comps Analytics. All U.S. markets selected. Class A is defined as all properties 100 units or greater built within 10 years of the sale date. Class B is defined as all properties 100 units or greater built more than 10 years but less than 30 years of the sale date. The analysis window is from 1/1/2000 through 6/30/2011.
2. The above chart also shows that the movements of transaction volume are similar across time. In fact, the correlation is .84.
NOTE: The following charts and tables refer to the various market and class as defined in the appendix (see pages 24 to 26). This table is to be used as an index to understand the charts and tables presented below.
Model Code Market Designation Class DesignationM10-A Primary Top 10 Markets Class A, max 10 years old rolled forward year by yearM10-B Primary Top 10 Markets Class B, between 30 and 20 years old, rolled forward year by yearM20-A Primary Top 20 Markets Class A, max 10 years old rolled forward year by yearM20-B Primary Top 20 Markets Class B, between 30 and 20 years old, rolled forward year by yearT10-A Tertiary - Not in the Top 10 Markets Class A, max 10 years old rolled forward year by yearT10-B Tertiary - Not in the Top 10 Markets Class B, between 30 and 20 years old, rolled forward year by yearT20-A Tertiary - Not in the Top 20 Markets Class A, max 10 years old rolled forward year by yearT20-B Tertiary - Not in the Top 20 Markets Class B, between 30 and 20 years old, rolled forward year by year

10
3. We now add market and class cuts to the data. The table and chart below show the sum of transactions in each market and class category. When comparing transaction volume, a good measure of market liquidity and depth, it is apparent that Class B properties in tertiary markets have substantial liquidity (3,758 in non-top ten markets and 1,778 in non-top twenty markets). Thus, any fears of ability to effectively sell Class B assets, especially relative to Class A assets, should be alleviated.
Source: CoStar Comps Analytics. Markets are listed on Pages 24 through 26 in the appendix. Class A is defined as all properties 100 units or greater built within 10 years of the sale date. Class B is defined as all properties 100 units or greater built more than 10 years but less than 30 years of the sale date. The analysis window is from 1/1/2000 through 6/30/2011.
Source: CoStar Comps Analytics. Markets are listed on Pages 24 through 26 in the appendix. Class A is defined as all properties 100 units or greater built within 10 years of the sale date. Class B is defined as all properties 100 units or greater built more than 10 years but less than 30 years of the sale date. The analysis window is from 1/1/2000 through 6/30/2011.
Model Code Description Sum of Transactions
M10-A Primary Top 10 Markets - Class A (rolling 10) 960 M10-B Primary Top 10 Markets - Class B (rolling 20) 1,900 M20-A Primary Top 20 Markets - Class A (rolling 10) 1,790 M20-B Primary Top 20 Markets - Class B (rolling 20) 3,882 T10-A Tertiary (not Top 10) - Class A (rolling 10) 1,569 T10-B Tertiary (not Top 10) - Class B (rolling 20) 3,758 T20-A Tertiary (not Top 20) - Class A (rolling 10) 740 T20-B Tertiary (not Top 20) - Class B (rolling 20) 1,778
11
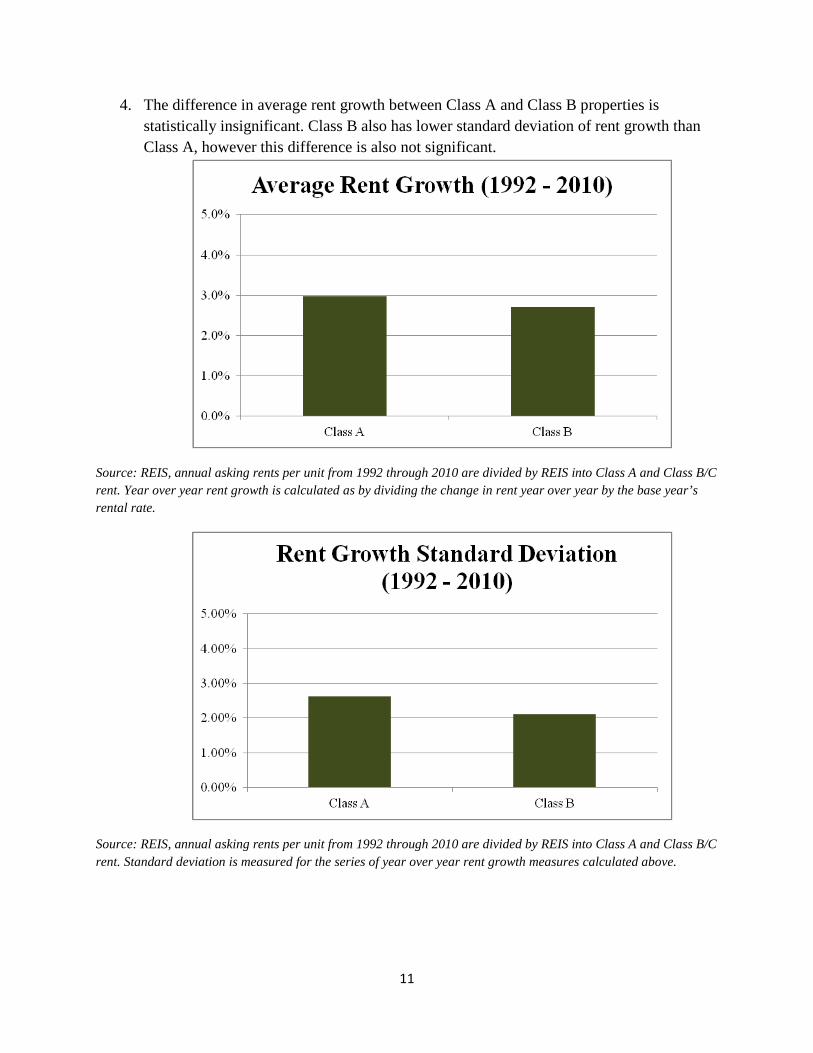
4. The difference in average rent growth between Class A and Class B properties is statistically insignificant. Class B also has lower standard deviation of rent growth than Class A, however this difference is also not significant.
Source: REIS, annual asking rents per unit from 1992 through 2010 are divided by REIS into Class A and Class B/C rent. Year over year rent growth is calculated as by dividing the change in rent year over year by the base year’s rental rate.
Source: REIS, annual asking rents per unit from 1992 through 2010 are divided by REIS into Class A and Class B/C rent. Standard deviation is measured for the series of year over year rent growth measures calculated above.
12
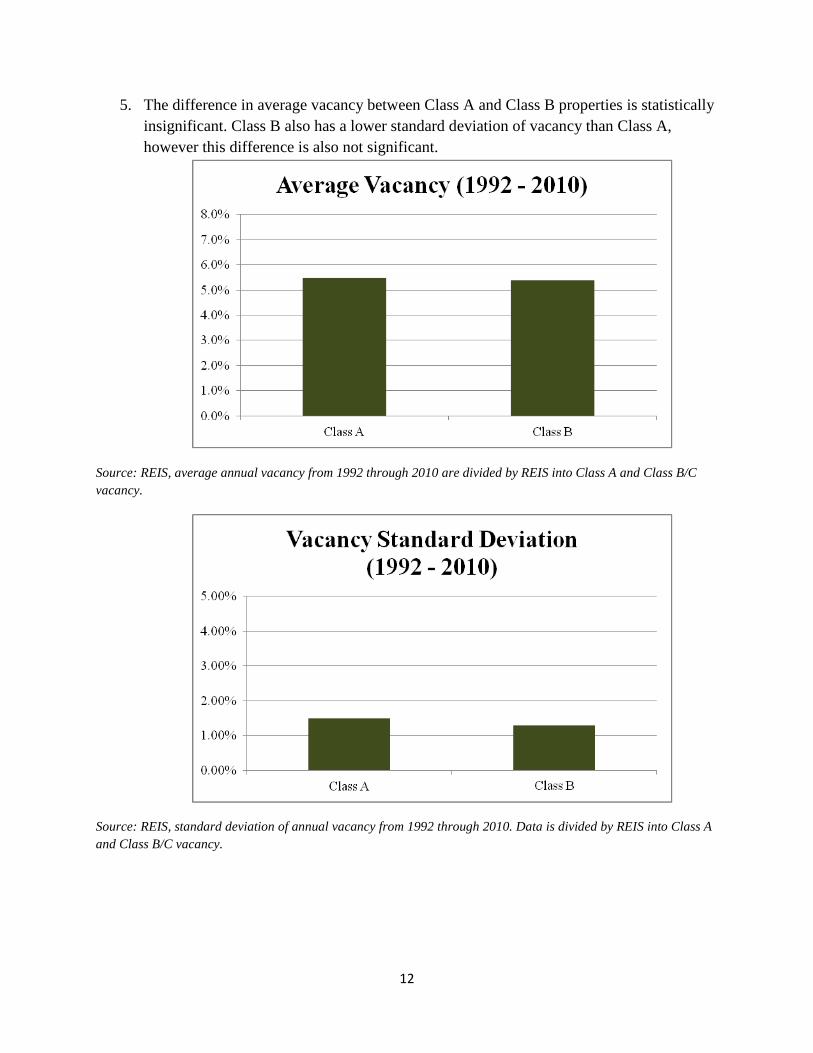
5. The difference in average vacancy between Class A and Class B properties is statistically insignificant. Class B also has a lower standard deviation of vacancy than Class A, however this difference is also not significant.
Source: REIS, average annual vacancy from 1992 through 2010 are divided by REIS into Class A and Class B/C vacancy.
Source: REIS, standard deviation of annual vacancy from 1992 through 2010. Data is divided by REIS into Class A and Class B/C vacancy.

13
6. Average rental rate per unit is significantly higher for Class A properties than Class B.
Source: REIS, annual asking rents per unit from 1992 through 2010 are divided by REIS into Class A and Class B/C rent.
7. Average price appreciation per unit was slightly higher for Class A – properties, however
they were statistically even (5.58% compared to 5.26% for the period 2000-2Q2011).
Source: CoStar Comps Analytics. All U.S. markets selected. Class A is defined as all properties 100 units or greater built within 10 years of the sale date. Class B is defined as all properties 100 units or greater built more than 10 years but less than 30 years of the sale date. The analysis window is from 1/1/2000 through 6/30/2011.
14
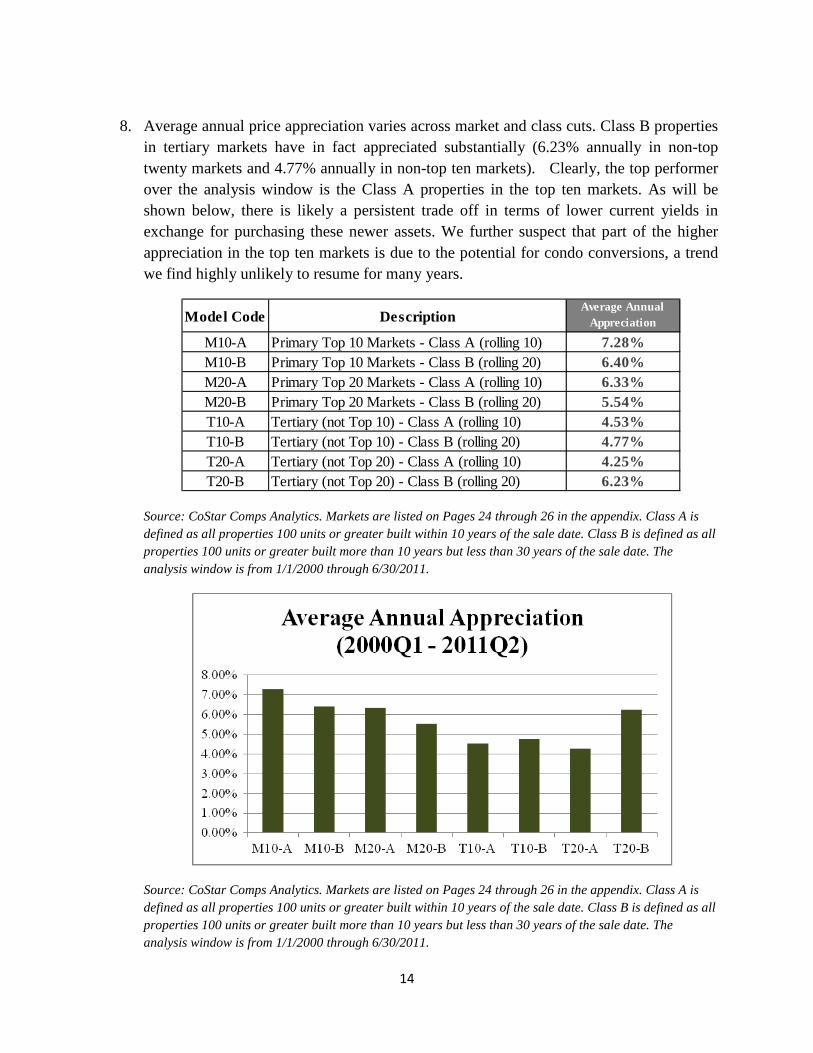
8. Average annual price appreciation varies across market and class cuts. Class B properties
in tertiary markets have in fact appreciated substantially (6.23% annually in non-top twenty markets and 4.77% annually in non-top ten markets). Clearly, the top performer over the analysis window is the Class A properties in the top ten markets. As will be shown below, there is likely a persistent trade off in terms of lower current yields in exchange for purchasing these newer assets. We further suspect that part of the higher appreciation in the top ten markets is due to the potential for condo conversions, a trend we find highly unlikely to resume for many years.
Source: CoStar Comps Analytics. Markets are listed on Pages 24 through 26 in the appendix. Class A is defined as all properties 100 units or greater built within 10 years of the sale date. Class B is defined as all properties 100 units or greater built more than 10 years but less than 30 years of the sale date. The analysis window is from 1/1/2000 through 6/30/2011.
Source: CoStar Comps Analytics. Markets are listed on Pages 24 through 26 in the appendix. Class A is defined as all properties 100 units or greater built within 10 years of the sale date. Class B is defined as all properties 100 units or greater built more than 10 years but less than 30 years of the sale date. The analysis window is from 1/1/2000 through 6/30/2011.
Model Code DescriptionAverage Annual
Appreciation
M10-A Primary Top 10 Markets - Class A (rolling 10) 7.28%M10-B Primary Top 10 Markets - Class B (rolling 20) 6.40%M20-A Primary Top 20 Markets - Class A (rolling 10) 6.33%M20-B Primary Top 20 Markets - Class B (rolling 20) 5.54%T10-A Tertiary (not Top 10) - Class A (rolling 10) 4.53%T10-B Tertiary (not Top 10) - Class B (rolling 20) 4.77%T20-A Tertiary (not Top 20) - Class A (rolling 10) 4.25%T20-B Tertiary (not Top 20) - Class B (rolling 20) 6.23%
15
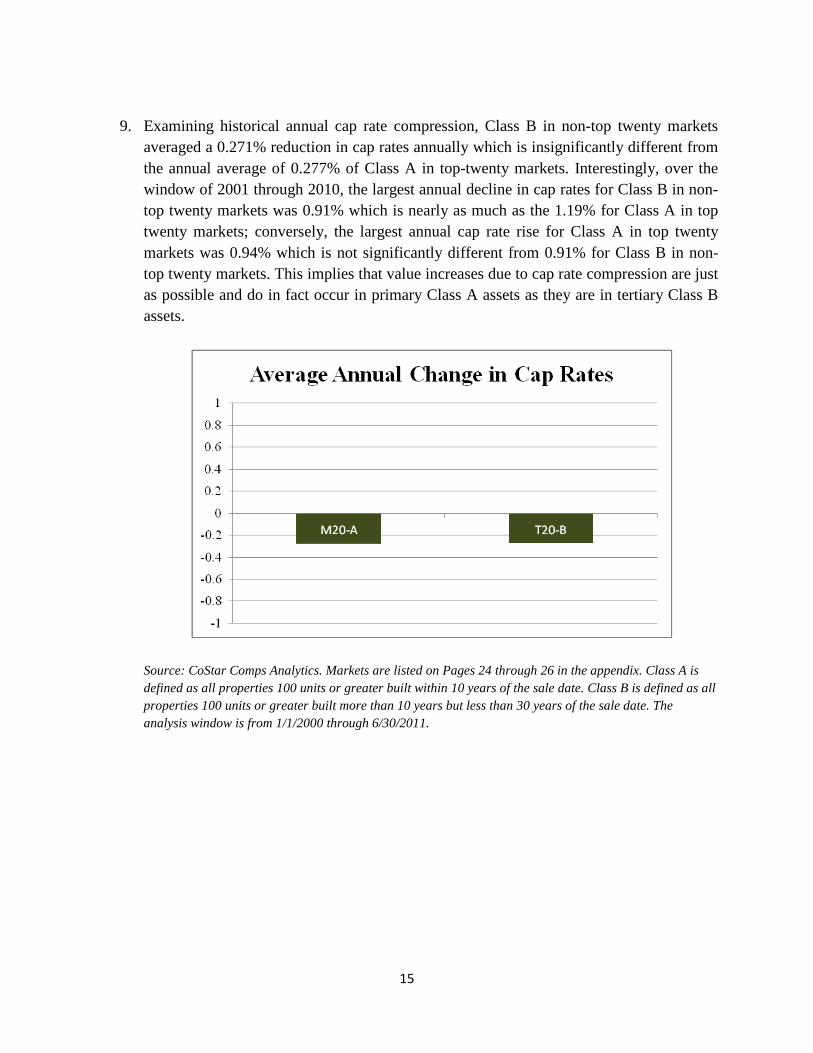
9. Examining historical annual cap rate compression, Class B in non-top twenty markets
averaged a 0.271% reduction in cap rates annually which is insignificantly different from the annual average of 0.277% of Class A in top-twenty markets. Interestingly, over the window of 2001 through 2010, the largest annual decline in cap rates for Class B in non-top twenty markets was 0.91% which is nearly as much as the 1.19% for Class A in top twenty markets; conversely, the largest annual cap rate rise for Class A in top twenty markets was 0.94% which is not significantly different from 0.91% for Class B in non-top twenty markets. This implies that value increases due to cap rate compression are just as possible and do in fact occur in primary Class A assets as they are in tertiary Class B assets.
Source: CoStar Comps Analytics. Markets are listed on Pages 24 through 26 in the appendix. Class A is defined as all properties 100 units or greater built within 10 years of the sale date. Class B is defined as all properties 100 units or greater built more than 10 years but less than 30 years of the sale date. The analysis window is from 1/1/2000 through 6/30/2011.

16
Source: CoStar Comps Analytics. Markets are listed on Pages 24 through 26 in the appendix. Class A is defined as all properties 100 units or greater built within 10 years of the sale date. Class B is defined as all properties 100 units or greater built more than 10 years but less than 30 years of the sale date. The analysis window is from 1/1/2000 through 6/30/2011.
10. Today’s pricing is very favorable for Class B. The average price per unit spread is about $46,000 per unit, while today the current spread is about $75,000.
Source: CoStar Comps Analytics. All U.S. markets selected. Class A is defined as all properties 100 units or greater built within 10 years of the sale date. Class B is defined as all properties 100 units or greater built more than 10 years but less than 30 years of the sale date. The analysis window is from 1/1/2000 through 6/30/2011.
17
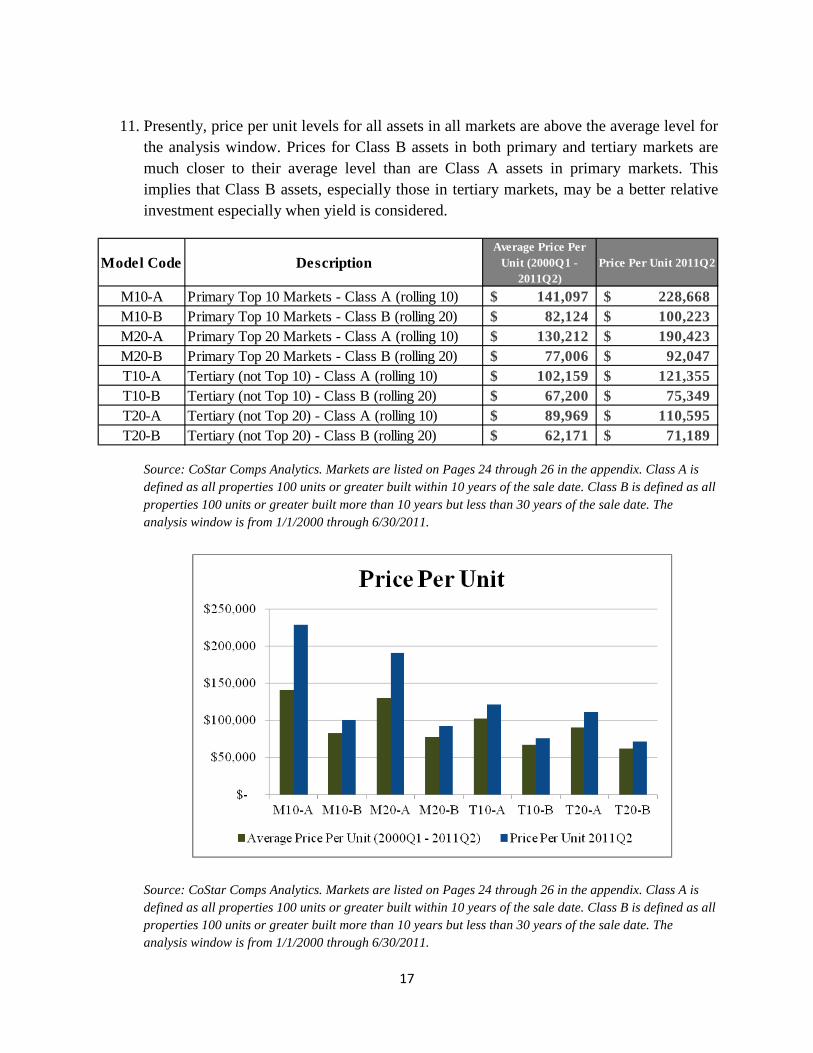
11. Presently, price per unit levels for all assets in all markets are above the average level for
the analysis window. Prices for Class B assets in both primary and tertiary markets are much closer to their average level than are Class A assets in primary markets. This implies that Class B assets, especially those in tertiary markets, may be a better relative investment especially when yield is considered.
Source: CoStar Comps Analytics. Markets are listed on Pages 24 through 26 in the appendix. Class A is defined as all properties 100 units or greater built within 10 years of the sale date. Class B is defined as all properties 100 units or greater built more than 10 years but less than 30 years of the sale date. The analysis window is from 1/1/2000 through 6/30/2011.
Source: CoStar Comps Analytics. Markets are listed on Pages 24 through 26 in the appendix. Class A is defined as all properties 100 units or greater built within 10 years of the sale date. Class B is defined as all properties 100 units or greater built more than 10 years but less than 30 years of the sale date. The analysis window is from 1/1/2000 through 6/30/2011.
Model Code DescriptionAverage Price Per
Unit (2000Q1 - 2011Q2)
Price Per Unit 2011Q2
M10-A Primary Top 10 Markets - Class A (rolling 10) 141,097$ 228,668$ M10-B Primary Top 10 Markets - Class B (rolling 20) 82,124$ 100,223$ M20-A Primary Top 20 Markets - Class A (rolling 10) 130,212$ 190,423$ M20-B Primary Top 20 Markets - Class B (rolling 20) 77,006$ 92,047$ T10-A Tertiary (not Top 10) - Class A (rolling 10) 102,159$ 121,355$ T10-B Tertiary (not Top 10) - Class B (rolling 20) 67,200$ 75,349$ T20-A Tertiary (not Top 20) - Class A (rolling 10) 89,969$ 110,595$ T20-B Tertiary (not Top 20) - Class B (rolling 20) 62,171$ 71,189$
18
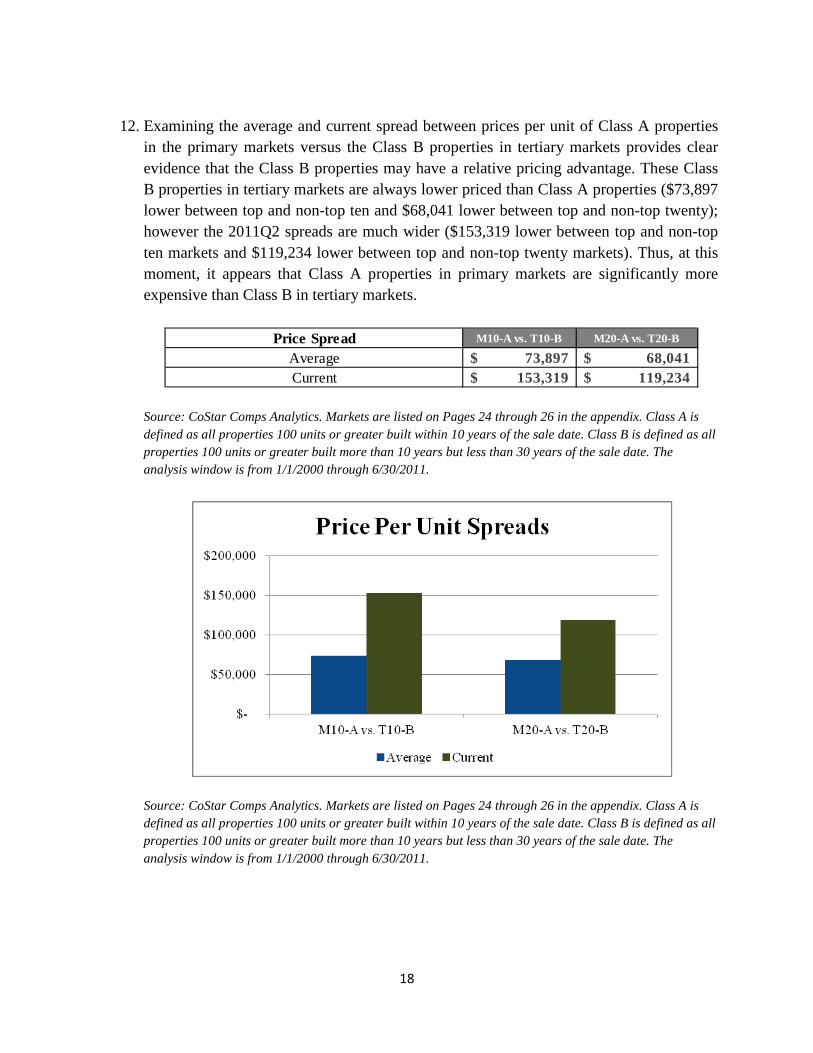
12. Examining the average and current spread between prices per unit of Class A properties
in the primary markets versus the Class B properties in tertiary markets provides clear evidence that the Class B properties may have a relative pricing advantage. These Class B properties in tertiary markets are always lower priced than Class A properties ($73,897 lower between top and non-top ten and $68,041 lower between top and non-top twenty); however the 2011Q2 spreads are much wider ($153,319 lower between top and non-top ten markets and $119,234 lower between top and non-top twenty markets). Thus, at this moment, it appears that Class A properties in primary markets are significantly more expensive than Class B in tertiary markets.
Source: CoStar Comps Analytics. Markets are listed on Pages 24 through 26 in the appendix. Class A is defined as all properties 100 units or greater built within 10 years of the sale date. Class B is defined as all properties 100 units or greater built more than 10 years but less than 30 years of the sale date. The analysis window is from 1/1/2000 through 6/30/2011.
Source: CoStar Comps Analytics. Markets are listed on Pages 24 through 26 in the appendix. Class A is defined as all properties 100 units or greater built within 10 years of the sale date. Class B is defined as all properties 100 units or greater built more than 10 years but less than 30 years of the sale date. The analysis window is from 1/1/2000 through 6/30/2011.
Price Spread M10-A vs. T10-B M20-A vs. T20-B
Average 73,897$ 68,041$ Current 153,319$ 119,234$
19
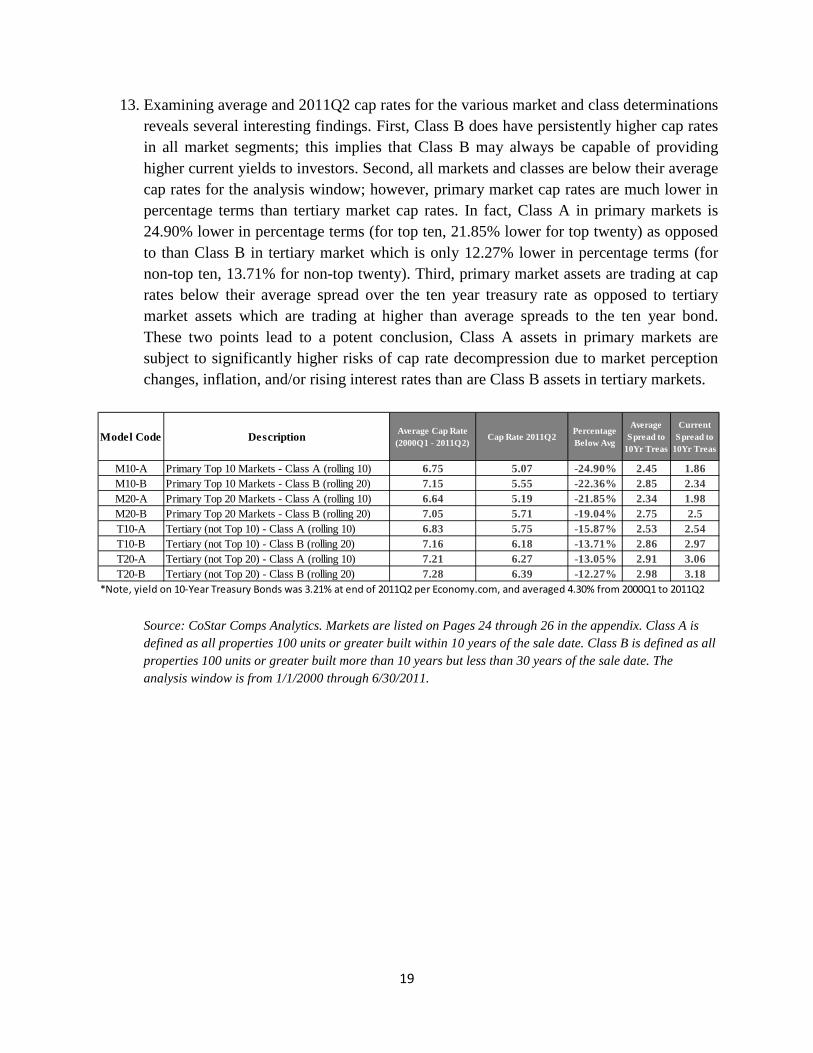
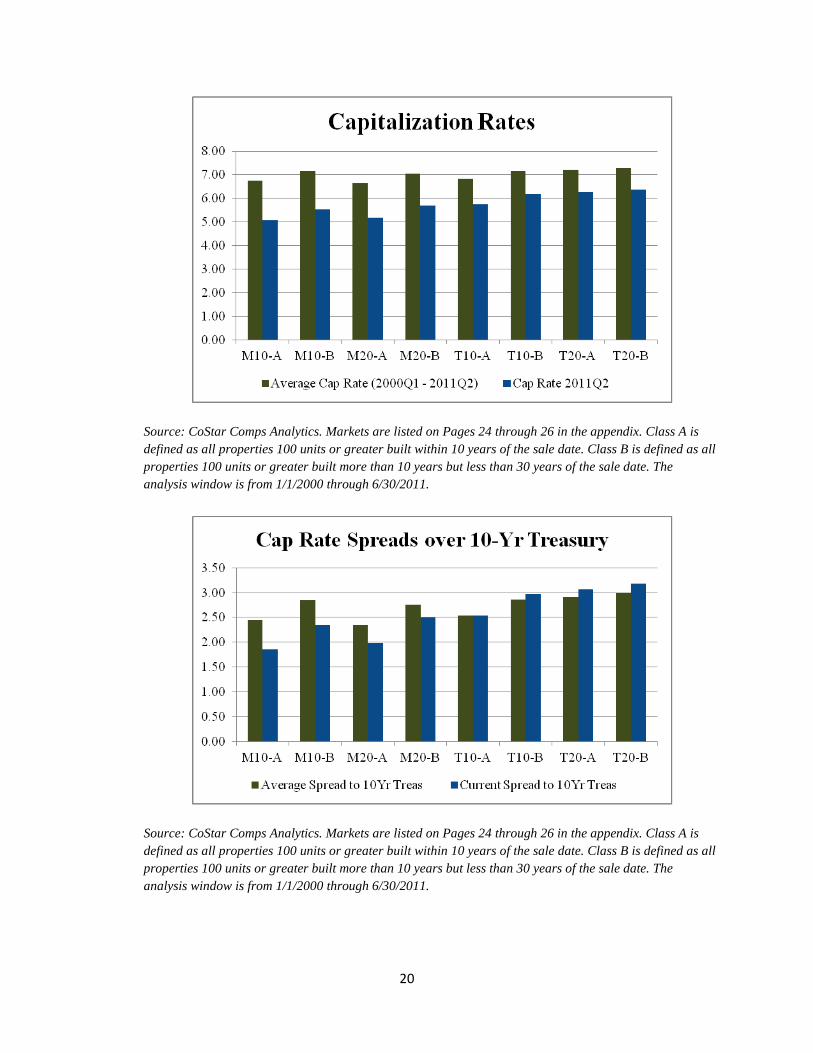
13. Examining average and 2011Q2 cap rates for the various market and class determinations reveals several interesting findings. First, Class B does have persistently higher cap rates in all market segments; this implies that Class B may always be capable of providing higher current yields to investors. Second, all markets and classes are below their average cap rates for the analysis window; however, primary market cap rates are much lower in percentage terms than tertiary market cap rates. In fact, Class A in primary markets is 24.90% lower in percentage terms (for top ten, 21.85% lower for top twenty) as opposed to than Class B in tertiary market which is only 12.27% lower in percentage terms (for non-top ten, 13.71% for non-top twenty). Third, primary market assets are trading at cap rates below their average spread over the ten year treasury rate as opposed to tertiary market assets which are trading at higher than average spreads to the ten year bond. These two points lead to a potent conclusion, Class A assets in primary markets are subject to significantly higher risks of cap rate decompression due to market perception changes, inflation, and/or rising interest rates than are Class B assets in tertiary markets.
Source: CoStar Comps Analytics. Markets are listed on Pages 24 through 26 in the appendix. Class A is defined as all properties 100 units or greater built within 10 years of the sale date. Class B is defined as all properties 100 units or greater built more than 10 years but less than 30 years of the sale date. The analysis window is from 1/1/2000 through 6/30/2011.
Model Code Description Average Cap Rate (2000Q1 - 2011Q2)
Cap Rate 2011Q2Percentage Below Avg
Average Spread to
10Yr Treas
Current Spread to
10Yr Treas
M10-A Primary Top 10 Markets - Class A (rolling 10) 6.75 5.07 -24.90% 2.45 1.86M10-B Primary Top 10 Markets - Class B (rolling 20) 7.15 5.55 -22.36% 2.85 2.34M20-A Primary Top 20 Markets - Class A (rolling 10) 6.64 5.19 -21.85% 2.34 1.98M20-B Primary Top 20 Markets - Class B (rolling 20) 7.05 5.71 -19.04% 2.75 2.5T10-A Tertiary (not Top 10) - Class A (rolling 10) 6.83 5.75 -15.87% 2.53 2.54T10-B Tertiary (not Top 10) - Class B (rolling 20) 7.16 6.18 -13.71% 2.86 2.97T20-A Tertiary (not Top 20) - Class A (rolling 10) 7.21 6.27 -13.05% 2.91 3.06T20-B Tertiary (not Top 20) - Class B (rolling 20) 7.28 6.39 -12.27% 2.98 3.18
*Note, yield on 10-Year Treasury Bonds was 3.21% at end of 2011Q2 per Economy.com, and averaged 4.30% from 2000Q1 to 2011Q2
20
Source: CoStar Comps Analytics. Markets are listed on Pages 24 through 26 in the appendix. Class A is defined as all properties 100 units or greater built within 10 years of the sale date. Class B is defined as all properties 100 units or greater built more than 10 years but less than 30 years of the sale date. The analysis window is from 1/1/2000 through 6/30/2011.
Source: CoStar Comps Analytics. Markets are listed on Pages 24 through 26 in the appendix. Class A is defined as all properties 100 units or greater built within 10 years of the sale date. Class B is defined as all properties 100 units or greater built more than 10 years but less than 30 years of the sale date. The analysis window is from 1/1/2000 through 6/30/2011.
21
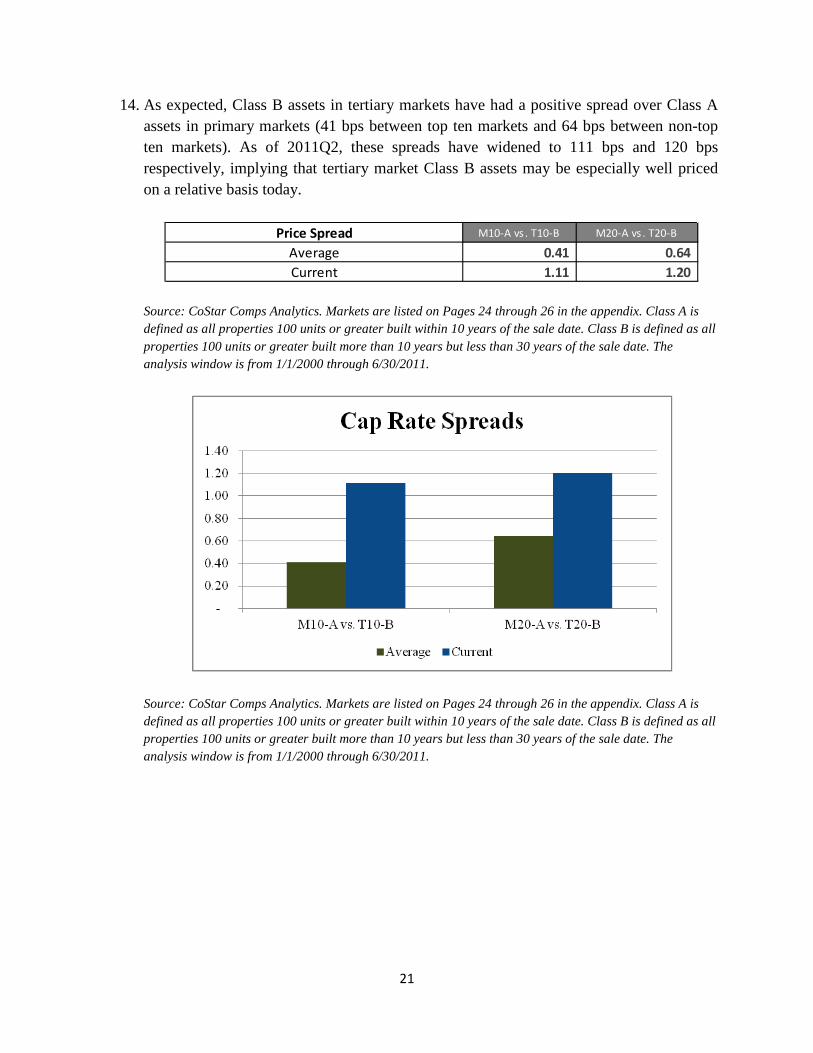
14. As expected, Class B assets in tertiary markets have had a positive spread over Class A assets in primary markets (41 bps between top ten markets and 64 bps between non-top ten markets). As of 2011Q2, these spreads have widened to 111 bps and 120 bps respectively, implying that tertiary market Class B assets may be especially well priced on a relative basis today.
Source: CoStar Comps Analytics. Markets are listed on Pages 24 through 26 in the appendix. Class A is defined as all properties 100 units or greater built within 10 years of the sale date. Class B is defined as all properties 100 units or greater built more than 10 years but less than 30 years of the sale date. The analysis window is from 1/1/2000 through 6/30/2011.
Source: CoStar Comps Analytics. Markets are listed on Pages 24 through 26 in the appendix. Class A is defined as all properties 100 units or greater built within 10 years of the sale date. Class B is defined as all properties 100 units or greater built more than 10 years but less than 30 years of the sale date. The analysis window is from 1/1/2000 through 6/30/2011.
Price Spread M10-A vs . T10-B M20-A vs . T20-B
Average 0.41 0.64 Current 1.11 1.20

22
Data Appendix
CoStar Data Methodology
CoStar Comps Analytics is the source of all data contained and analyzed herein.. CoStar is widely recognized as maintaining the largest most complete database of property level transactions in the United States and is widely used by REITs, investment funds, lenders, appraisers, and brokers. CoStar obtains information on transactions from a variety of sources including public records, news articles, property listing databases, as well as field reports from brokers and appraisers. When a sale is evidenced (most states require sales to be made part of the public record), a CoStar researcher will actually make contact with an individual who was party to the sale or assisted therein to verify information and collect missing data items. The following is from CoStar’s marketing collateral regarding their CoStar Comps product, the database used for this research.
Source: CoStar.com
23
Defining the Multifamily Universe
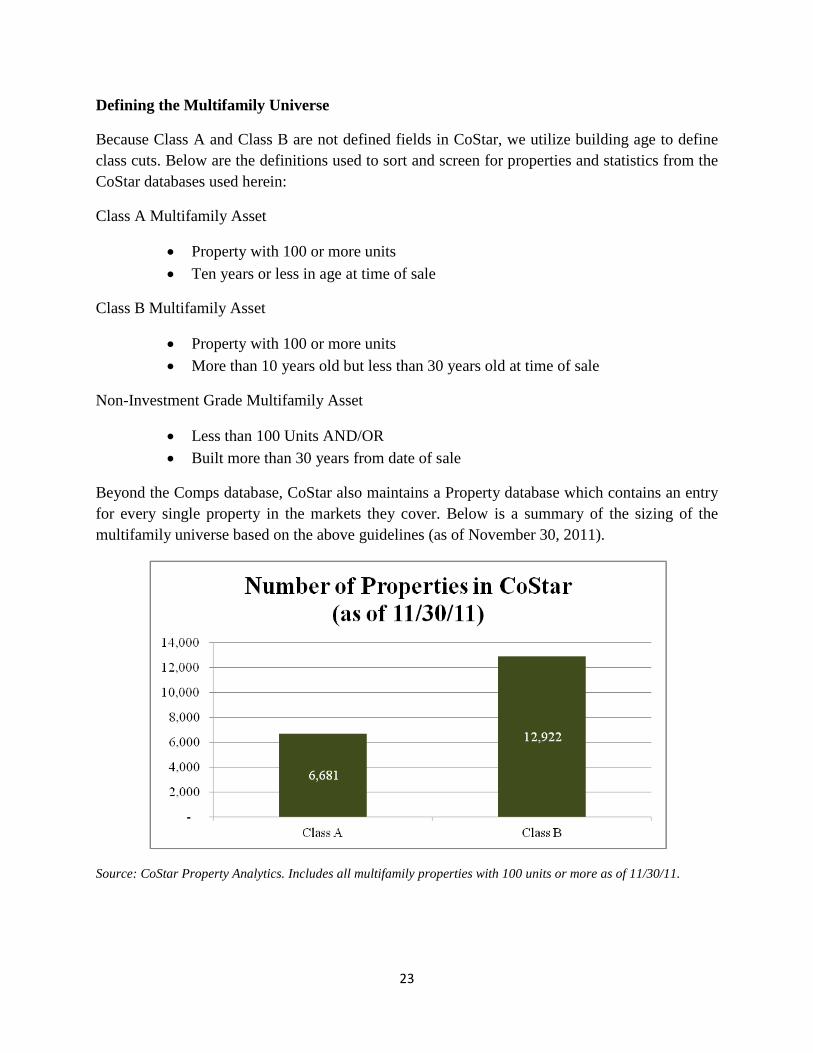
Because Class A and Class B are not defined fields in CoStar, we utilize building age to define class cuts. Below are the definitions used to sort and screen for properties and statistics from the CoStar databases used herein:
Class A Multifamily Asset
• Property with 100 or more units • Ten years or less in age at time of sale
Class B Multifamily Asset
• Property with 100 or more units • More than 10 years old but less than 30 years old at time of sale
Non-Investment Grade Multifamily Asset
• Less than 100 Units AND/OR • Built more than 30 years from date of sale
Beyond the Comps database, CoStar also maintains a Property database which contains an entry for every single property in the markets they cover. Below is a summary of the sizing of the multifamily universe based on the above guidelines (as of November 30, 2011).
Source: CoStar Property Analytics. Includes all multifamily properties with 100 units or more as of 11/30/11.
24
Defining the Primary Top Twenty versus Tertiary markets
Primary Top Twenty Market List (alphabetical order)
• Atlanta • Boston • Chicago • Dallas/Ft. Worth • Denver • Detroit • Houston • Los Angeles (includes Orange County) • Minneapolis/St. Paul • New York City (includes Long Island and Northern New Jersey) • Orlando (includes Deltona/Daytona Beach) • Philadelphia • Phoenix • Sacramento • San Diego • San Francisco/Oakland (includes East Bay, South Bay, San Jose, Marin, and Sonoma) • Seattle/Puget Sound • South Florida (includes Miami, Ft. Lauderdale, and West Palm Beach) • Tampa/St. Petersburg • Washington D.C.
25
Defining the Primary Top Ten versus Tertiary markets
Primary Top Ten Market List (alphabetical order)
• Atlanta • Boston • Chicago • Dallas/Ft. Worth • Houston • Los Angeles (includes Orange County) • New York City (includes Long Island and Northern New Jersey) • Philadelphia • San Francisco/Oakland (includes East Bay, South Bay, San Jose, Marin, and Sonoma) • Washington D.C.
Note: The markets removed from the top twenty list are added to the tertiary list for those analyses.
26
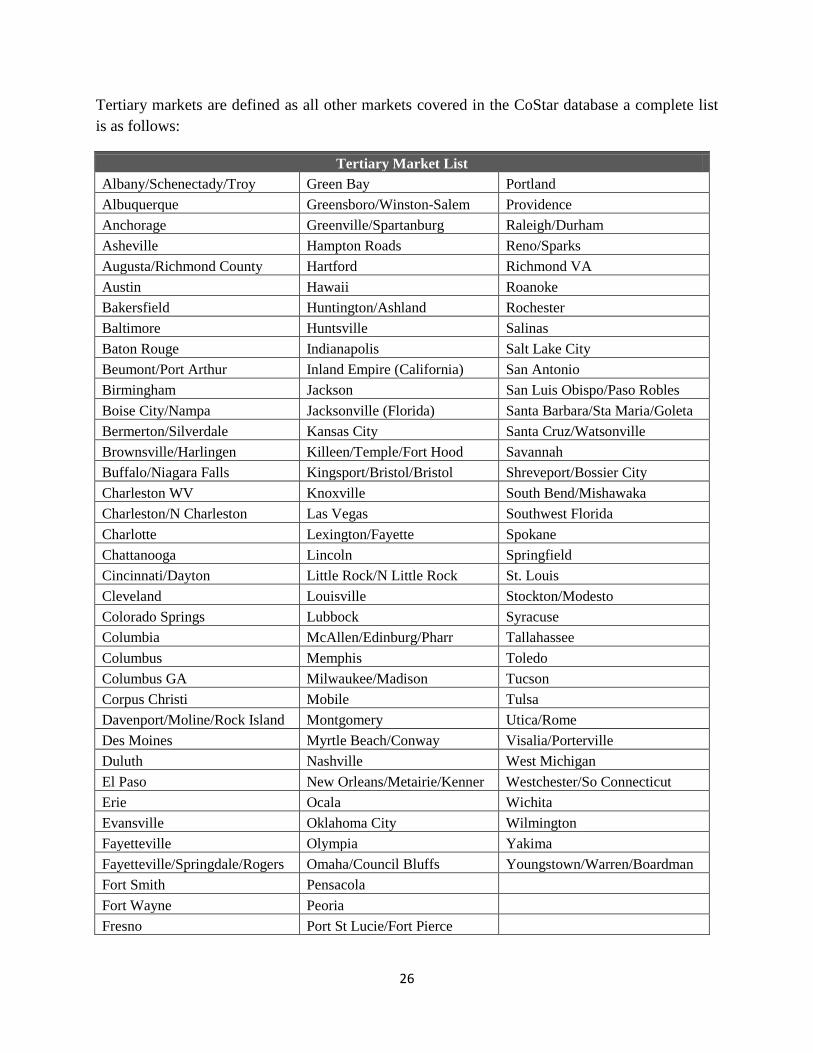
Tertiary markets are defined as all other markets covered in the CoStar database a complete list is as follows:
Tertiary Market List Albany/Schenectady/Troy Green Bay Portland Albuquerque Greensboro/Winston-Salem Providence Anchorage Greenville/Spartanburg Raleigh/Durham Asheville Hampton Roads Reno/Sparks Augusta/Richmond County Hartford Richmond VA Austin Hawaii Roanoke Bakersfield Huntington/Ashland Rochester Baltimore Huntsville Salinas Baton Rouge Indianapolis Salt Lake City Beumont/Port Arthur Inland Empire (California) San Antonio Birmingham Jackson San Luis Obispo/Paso Robles Boise City/Nampa Jacksonville (Florida) Santa Barbara/Sta Maria/Goleta Bermerton/Silverdale Kansas City Santa Cruz/Watsonville Brownsville/Harlingen Killeen/Temple/Fort Hood Savannah Buffalo/Niagara Falls Kingsport/Bristol/Bristol Shreveport/Bossier City Charleston WV Knoxville South Bend/Mishawaka Charleston/N Charleston Las Vegas Southwest Florida Charlotte Lexington/Fayette Spokane Chattanooga Lincoln Springfield Cincinnati/Dayton Little Rock/N Little Rock St. Louis Cleveland Louisville Stockton/Modesto Colorado Springs Lubbock Syracuse Columbia McAllen/Edinburg/Pharr Tallahassee Columbus Memphis Toledo Columbus GA Milwaukee/Madison Tucson Corpus Christi Mobile Tulsa Davenport/Moline/Rock Island Montgomery Utica/Rome Des Moines Myrtle Beach/Conway Visalia/Porterville Duluth Nashville West Michigan El Paso New Orleans/Metairie/Kenner Westchester/So Connecticut Erie Ocala Wichita Evansville Oklahoma City Wilmington Fayetteville Olympia Yakima Fayetteville/Springdale/Rogers Omaha/Council Bluffs Youngstown/Warren/Boardman Fort Smith Pensacola Fort Wayne Peoria Fresno Port St Lucie/Fort Pierce
27
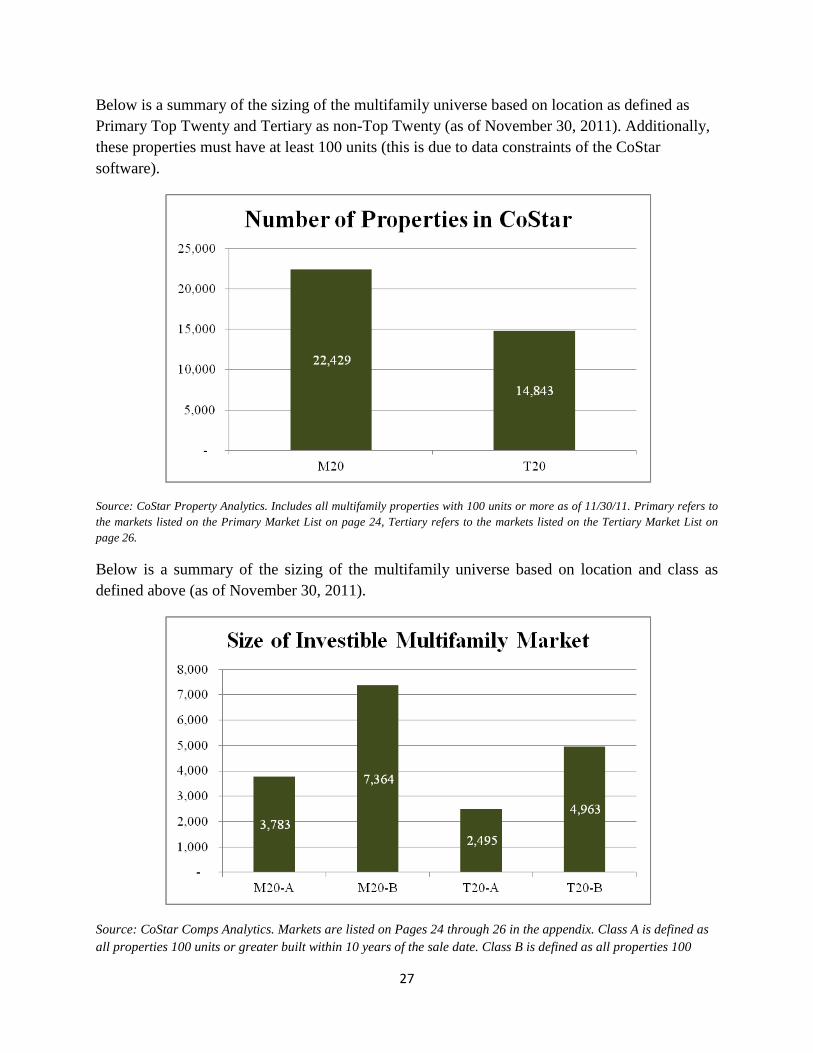
Below is a summary of the sizing of the multifamily universe based on location as defined as Primary Top Twenty and Tertiary as non-Top Twenty (as of November 30, 2011). Additionally, these properties must have at least 100 units (this is due to data constraints of the CoStar software).
Source: CoStar Property Analytics. Includes all multifamily properties with 100 units or more as of 11/30/11. Primary refers to the markets listed on the Primary Market List on page 24, Tertiary refers to the markets listed on the Tertiary Market List on page 26.
Below is a summary of the sizing of the multifamily universe based on location and class as defined above (as of November 30, 2011).
Source: CoStar Comps Analytics. Markets are listed on Pages 24 through 26 in the appendix. Class A is defined as all properties 100 units or greater built within 10 years of the sale date. Class B is defined as all properties 100

28
units or greater built more than 10 years but less than 30 years of the sale date. The analysis window is from 1/1/2000 through 6/30/2011.