Embed Size (px)
Citation preview

Journal of Thermal Engineering, Vol. 7, No. 2, Special Issue 13, pp. 162-173, February, 2021 Yildiz Technical University Press, Istanbul, Turkey
This paper was recommended for publication in revised form by Regional Editor Erman Aslan 1,2 Department of Electromechanical Engineering, University of Technology, Iraq-Baghdad.
*E-mail address: [email protected]; [email protected] Orcid id: 0000-0002-5608-7980; 0000-0001-5158-1827 Manuscript Received 10 May 2019 Accepted 01 August 2019
AN EXPERIMENTAL OPTIMIZATION STUDY OF A PHOTOVOLTAIC SOLAR PUMPING SYSTEM USED FOR SOLAR DOMESTIC HOT WATER SYSTEM UNDER
IRAQI CLIMATE
Mahmoud Maustafa Mahdi1, Ameer Abed Jaddoa2*
ABSTRACT
The performance of a photovoltaic solar water pumping system (PVSWPS) promising in a solar water
heating system has been studied experimentally. The design of a photovoltaic array configuration can affect the
performance of the (PVSWPS), the water pump characteristic, the flow rate of the water and the overall system
efficiency. The aim of the present work is to determine an optimum photovoltaic array configuration that can supply
a water pump with an optimal amount of energy. Three different photovoltaic array configurations have been tested
(4S, 2S ×2P and 4P). The experiments have been carried out in a sunny day, light hours under the conditions of Iraq
climate and for a constant head level of 6m. The results showed that the second photovoltaic array configuration (2P
× 2S) is suitable to provide an optimal energy. Also, the second photovoltaic array configuration (2P × 2S) that
powered the water pump delivered a maximum average water volume (2.298 m3) during the day among the three
different configurations.
Keywords: Photovoltaic pumping system, Photovoltaic configuration optimization, Outdoor testing, domestic hot water system
INTRODUCTION
A hot water production for house uses is produced through the years by using a device with the benefit of
using solar energy; this device is called a domestic solar water heating system (DSWHS). The hot water is circulated
within the system by two methods either a thermo syphon method or a force- circulation method. The latter need an
electrical energy and it cannot save it. A photovoltaic solar water pumping system was introduced in order to save the
electrical power that used to power the pump and to circulate the water. The photovoltaic solar pumping systems are
useful for intermediate and low applications like domestic hot water systems. Many researchers over the world
have been tested and studied the photovoltaic solar pumping systems[1,2]. The performance of the photovoltaic
pumping systems has been tested under solar insolation and different climate conditions using various types of pump
[3–5]. A hybrid system (powered by photovoltaic arrays and by wind generators) has been used in the world today.
These systems are cold solar powered systems [6–8]. Experimental and theoretical studies about the photovoltaic
solar pumping systems were fabricated in order to provide water for irrigation and drinking [9–13]. Studied the
performance of a photovoltaic solar water pumping system [14] . A diaphragm water pump was used [15] compared
the performance of a photovoltaic solar pumping system with a wind powered water pumping system. Also,
[16]studied the difference in performance of fixed photovoltaic panel’s one-axis tracking solar pumping system. The
results showed that the power increased for tracking system in comparison with the fixed system. Additionally, [17]
studied the impact of using a helical pump on the performance of a photovoltaic solar water pumping system. It was
concluded that the helical pumps standard (24 V) crystalline silicon photovoltaic cells will be more efficient than
crystalline with a high voltage, and they manifested that the helical pump improved the performance of the pumping
system significantly. Developed a new version of a SWHS coupled with solar water pumping system and found that
the circulated water varied from 15 to 65 L/day according to the discharge head and the isolation intensity [18]
Presented a solar heating system coupled with a solar water pumping system and concluded that the water pump can
work when the solar intensity is greater than 580 W/m2, 600 W/m2 and 630 W/m2 with a discharge head of 1m, 1.5 m
Journal of Thermal Engineering, Research Article, Vol. 7, No. 2, Special Issue 13, pp. 162-173, February, 2021
163
and 2 m respectively [19] . The photovoltaic system performance depends on the operating condition and the system
configuration.
The condition at which the system operates depends on the system location, which governs the radiation
intensity received, the outdoor temperature and other aspects that affect the performance of the system.
The system performance determines its economic and technical feasibility and whether the system
represents the best solution in term of electricity sources for any given application[20]. Designed a dynamic model to
estimate the performance of a solar water pumping system with energy storage. Two types of energy storage system
was performed the first type (i) electric energy with a battery band and the second type (ii) hydraulic energy of stored
water in a bit large tank of water. Anthers reported that a combination of both types economical and efficient
solution[21]. Proposed a simple model to contribute in photovoltaic (PV) water pumping systems studies. The
proposed model includes a non-linear relation between the solar power and the flow rate of the water. They found
that an increase in the power of the pump leads to an increase in flow rate of the water following the proposed model
[22].Investigated the performance of a photovoltaic solar water pumping system. The system consists of a PV arrays
a DC motor, sun-tracker. They founded that the system performance is improved when a sun-tracker is added to the
overall system [23].Presented a model of optimal sizing to optimize the different component sizes of photovoltaic
solar water pumping system for irrigation and drinking in Gharadaia, Algeria. They determine an optimal
configuration of the solar pumping system for different system requirements and life cycle cost [24]. In the current
research, the effect of array configuration of the photovoltaic panels that can supply energy with maximum rate was
selected. Therefore, it is necessary to design, test a different photovoltaic array configuration and then select a
suitable configuration that can provide an optimal performance evaluation of the photovoltaic pumping system used
in a domestic solar water heating system. In this study, a comparison was done in order to select the optimum
photovoltaic solar water pumping system configuration, this comparison is depending on the experimental results of
three different configurations. Flow rate during the day, the electrical energy of the photovoltaic array and the
hydraulic energy of the pump were determined. Also, the curves that represent the efficiency of the water pump and
the overall efficiency of the systems are plotted. The aim of present study is to select the photovoltaic solar water
pumping system configuration that gives an optimal performance which can work in term of load demanded.
EXPERIMENTAL SETUP
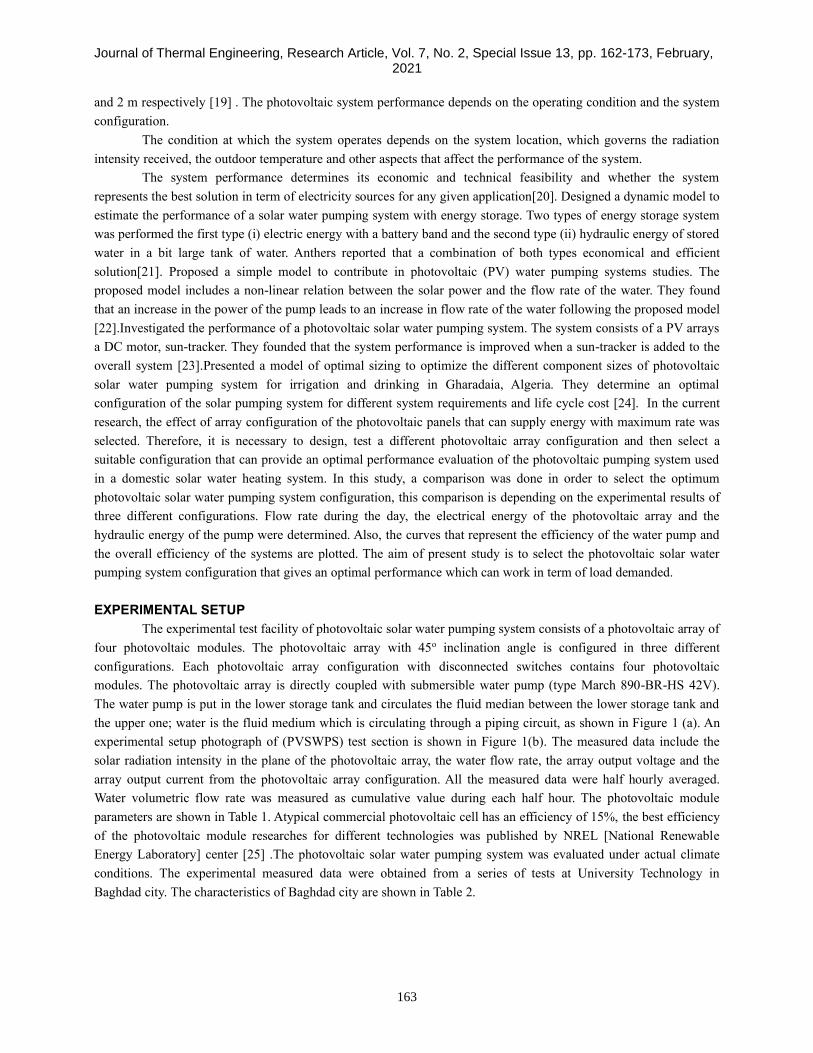
The experimental test facility of photovoltaic solar water pumping system consists of a photovoltaic array of
four photovoltaic modules. The photovoltaic array with 45o inclination angle is configured in three different
configurations. Each photovoltaic array configuration with disconnected switches contains four photovoltaic
modules. The photovoltaic array is directly coupled with submersible water pump (type March 890-BR-HS 42V).
The water pump is put in the lower storage tank and circulates the fluid median between the lower storage tank and
the upper one; water is the fluid medium which is circulating through a piping circuit, as shown in Figure 1 (a). An
experimental setup photograph of (PVSWPS) test section is shown in Figure 1(b). The measured data include the
solar radiation intensity in the plane of the photovoltaic array, the water flow rate, the array output voltage and the
array output current from the photovoltaic array configuration. All the measured data were half hourly averaged.
Water volumetric flow rate was measured as cumulative value during each half hour. The photovoltaic module
parameters are shown in Table 1. Atypical commercial photovoltaic cell has an efficiency of 15%, the best efficiency
of the photovoltaic module researches for different technologies was published by NREL [National Renewable
Energy Laboratory] center [25] .The photovoltaic solar water pumping system was evaluated under actual climate
conditions. The experimental measured data were obtained from a series of tests at University Technology in
Baghdad city. The characteristics of Baghdad city are shown in Table 2.
Journal of Thermal Engineering, Research Article, Vol. 7, No. 2, Special Issue 13, pp. 162-173, February, 2021
164
(a)
(b)
Figure 1. (a) Photovoltaic water pumping system 1-photovoltaic (300 W), 2- measurement system (V, J, W), 3-
Adjustable stand, 4- Water pump (type march 890 BR-HS 24 V), 5-water,
6-lower tank, 7- pipe line, 8- upper tank
(b) Photograph of (PVSWPS) test section
Table 1. Parameters of the photovoltaic module.
Table 2. Characteristic of Baghdad city
Photovoltaic module parameter Value
Open circuit voltage (Voc) 25.2V
Maximum power voltage (Vmax) 20 V
Short circuit current ( I sc) 4.15A
Maximum power current ( Ipm) 3.75A
Maximum power ( Pm) 75W
Latitude Longitude Daily light Ambient temperature Yearly insolation
33.34o 44.1o 10-12h 5 oC January
48 oC August 4.2-8.1 KWh/m2/day

Journal of Thermal Engineering, Research Article, Vol. 7, No. 2, Special Issue 13, pp. 162-173, February, 2021
165
CHARACTERISTIC OF A PHOTOVOLTAIC CONFIGURATION
In order to provide the required current (I) and voltage (V), a photovoltaic array, was connected in parallel,
in series-parallel combination, and in series. Based on the photovoltaic modules, a proposed design of the
photovoltaic array consisting of the three different configurations was selected. A 45o was selected as the
photovoltaic tilt angle and facing to south. The configuration of three different arrays, are namely C1 (4S), C2
(2C×2P) and C3 (4P) as shown in Figure 2 (a), (b), (c) which means:
1-) C1 (4S): 4 PV modules connected in series.
2-) C2 (2S×2P): 2 PV modules connected in two parallel rows with two serial PV modules in each.
3-) C3 (4P): 4 PV modules connected in parallel.
The aim of the above three different configurations is to reach the optimal performance of the water pump
under the three different photovoltaic array configurations tested individually. The photovoltaic arrays were put into
test under the condition of a sunny day at Baghdad city. The photovoltaic arrays were tilled during testing under the
outdoor conditions then the fill factors (FF) and the maximum photovoltaic array power point of, (MPP), pump
efficiency (ηp) and the overall efficiency of the system will be determined. Maximum power point (MPP) is
calculated by multiplying the maximum current and the maximum voltage that the photovoltaic array can provide at
irradiance level, each photovoltaic array performance is characterized by the curve quality of its (voltage and current)
sharpness. The photovoltaic energy rating has many models developed [26]. Then, the photovoltaic energy is
determined by fill factor:
𝐹𝐹 =𝑉𝑚 × 𝐼𝑚
𝑉𝑜𝑐 × 𝐼𝑠𝑐 (1)
The photovoltaic performance module can be calculated by measuring the efficiency of conversion from
sunlight to electric power. The photovoltaic efficiency is determined from the output power that produced from the
sun solar radiation. The photovoltaic standard measurement conditions are revered to the temperature, the area of the
photovoltaic and the radiation intensity [27–29]. By making a comparison between the output energy generated by
the photovoltaic array and the incident solar energy on it, the efficiency of the individual photovoltaic configuration
can be determined with following relation:
𝜂 =𝑉𝑚× 𝐼𝑚
𝐸 × 𝐴𝑝𝑣 (2)
(a) (b)
(c)
Figure 2. Photovoltaic array configurations
(a) C1: (4s) = 4 modules connected series, (b) C2: (2s × 2p) = 4 modules connected in
Two Parallels with two serial modules in each, (c) C3 (4p) = 4 modules connected in
Parallels
Journal of Thermal Engineering, Research Article, Vol. 7, No. 2, Special Issue 13, pp. 162-173, February, 2021
166
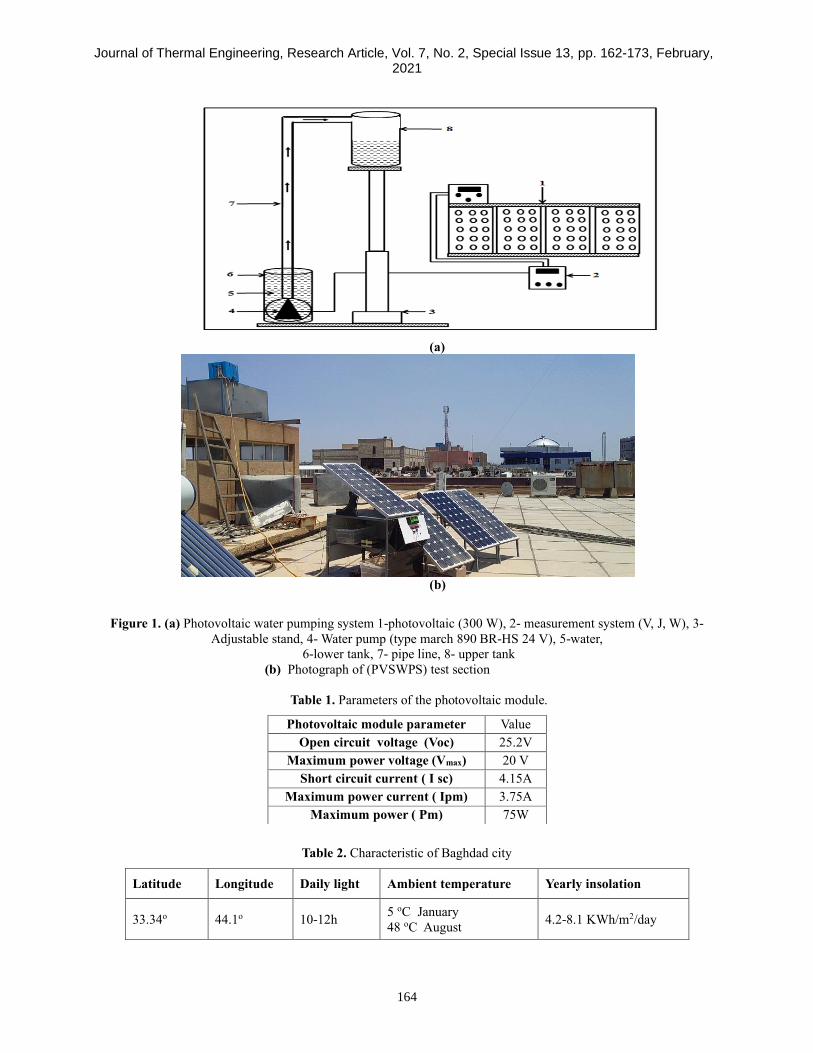
The characteristic of three different photovoltaic array configurations is shown in Table 3.
Table 3. Characteristic of three different photovoltaic array configurations.
Pv
configuration
Shunt
Isc (A)
Open voltage
Voc (v)
Power
(W) pm
Apv
m2
FF ηpv
%
C1
4 in series 4.15 100.8 300 4.34 70.1 14.4
C2
2 in parallel
2 in series 8.2 50.4 300 4.34 70.3 14
C3
4 in parallel 16.4 25.2 300 4.34 70.1 15.17
(a) (b)
(c)
Figure 3. (a), (b), (c). Characteristics curves of three different photovoltaic array
configurations.

Journal of Thermal Engineering, Research Article, Vol. 7, No. 2, Special Issue 13, pp. 162-173, February, 2021
167
The uncertainty of the various instrument and physical properties are given in Table 4.
Table 4. Uncertainties of the measuring instruments
METHODOLOGY
In the present work, the pump is powered by the photovoltaic array configuration. A fixed head of (6 m) was
chosen for the testing the water pump during the sunny days (April 2018). Each configuration was tested along three
days. The measured power output, the volumetric flow rate of the water, the current and the voltage of the circuit and
solar radiation intensity were measured, a typical solar intensity variation during the day is shown in Figure 4. For
each array configuration, the electrical energy, pumping hydraulic energy the energy received by the photovoltaic
surface area, pump efficiency and the overall efficiency of the system were determined. The pumping consumes a
daily electrical energy, which can be determined by the power integration (during the operating period 11.5 hr)
demanded by the water-pump. This integration is given by the following equation:
𝐸𝑒 = ∫ 𝑝. 𝑑𝑡ℎ𝑟=18
hr=6.5 (3)
The pump provides a hydraulic energy during the day, and it can be determined by the following equation:
𝐸ℎ = 𝐶ℎ × 𝐻 ∫ 𝑄. 𝑑𝑡ℎ𝑟=18
hr=6.5 (4)
The amount of the energy received by the photovoltaic array that incidents on the surface area of it and during the
daylight hours is calculated by the following equation:
𝐸𝑖 = 𝐴𝑝𝑟 ∫ 𝐸. 𝑑𝑡ℎ𝑟=18
hr=6.5 (5)
The efficiency of the water pump is obtained by dividing the pump hydraulic energy equation (4) by the photovoltaic
electrical energy equation (3). This is given by the following equation:
𝜂 =𝐸ℎ
𝐸𝑒 (6)
While, the overall efficiency of the system is determined by dividing the hydraulic energy of the pump equation (4)
by the incident radiation energy on the surface area of the photovoltaic during the operating time and it is given by
the following equation:
𝜂𝑜𝑣𝑒𝑟𝑎𝑙𝑙 =𝐸ℎ
𝐸𝑖 (7)
No Rang Instruments Frequency uncertainty
1 [0-150] V Digital voltmeter 50 ± 0.06 V
2 [0.1-20] A Digital Ammeter 50 ± 31 × 10-3
3 [5-25] L Small volume proverb - ± 0.15%
4 0-1100W/m2 CM11 Pyrometer - ± 0.6%

Journal of Thermal Engineering, Research Article, Vol. 7, No. 2, Special Issue 13, pp. 162-173, February, 2021
168
This optimal configuration can reach the maximum volumetric flow rate of water.
RESULTS AND DISCUSSION
Experiments were conducted with the aim of evaluating the behavior of a photovoltaic solar water pumping
system (PVSWPS). The photovoltaic array system with three different configurations was tested. From the results of
experimental data of the three different (PVSWPS) configurations, a comparison analysis is first carried out to obtain
the overall performance of each configuration. The next step is to select the appropriate optimal design among
photovoltaic array configurations.
Table 4 displays the results of the three different (PVSWPS) configurations, (PVSWPS1), (PVSWPS2) and
(PVSWPS). The average volume of the water during the day was between (1.7 m3 and 2.3 m3), for different
configurations (C1, C2, and C3).
Table 4. Performance of the photovoltaic solar-water pumping system.
From the obtained results of the performance of the system and through the three different configurations
comparison, there is an attempt trying to select the most optimal system configuration. This optimal configuration
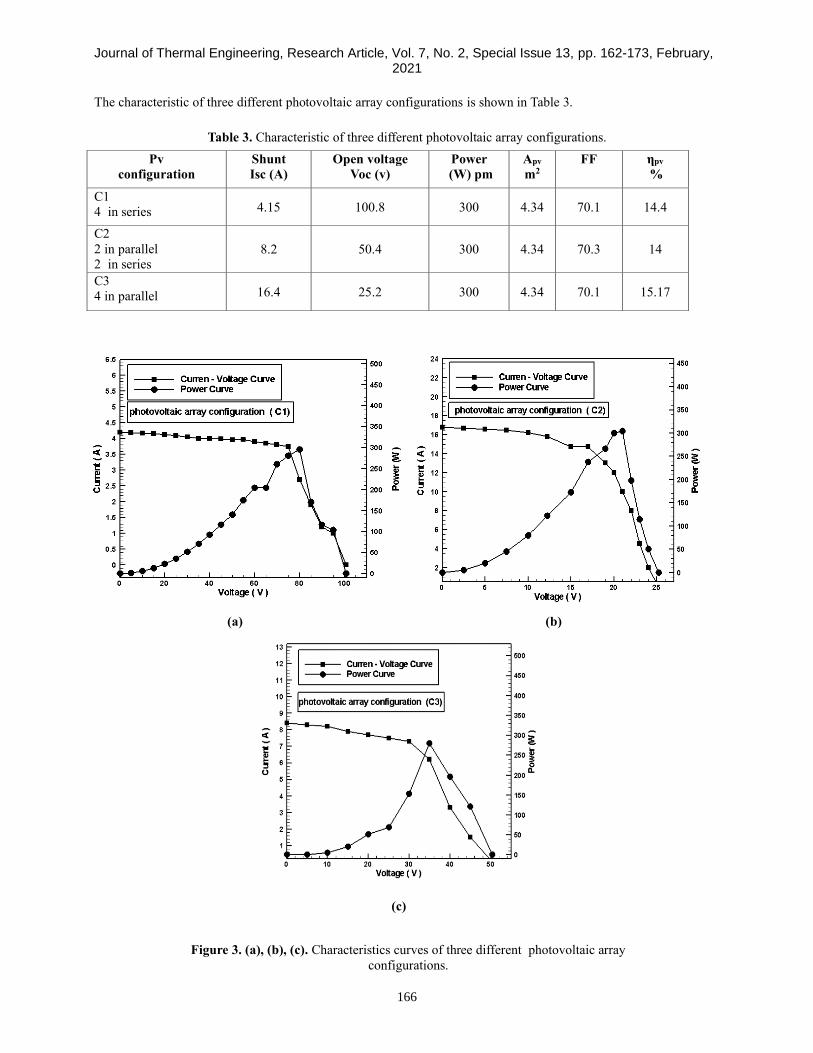
can be able to reach the maximum volumetric rate of water. Firstly the comparison of the volumetric water flow rates
and the electric power supplied by the three (PVSWPS) configuration (C1, C2 and C3) is made. A comparison
between the three different configurations at the same level head is depicted in Figure 5. This figure reveals the three
photovoltaic
configuration
Maximum
flow rate
(m3/day)
Maximum
power (W)
Maximum
pump
efficiency
( ηp %)
Average
pump
efficiency
( ηavp %)
Maximum
system
efficiency
( ηsys %)
Average
system
efficiency
( ηa sys %)
C1
(4 s) 1.79 117.1 72.2 42.47 7.12 3.61
C2
(2 s × 2 p) 2.298 152.4 67.6 46.51 7.44 4.22
C3
(4 p) 1.811 167.7 58.3 36.14 8.92 4.69
5April 2018
Figure 4. Typical solar radiation intensity during a sunny day
Journal of Thermal Engineering, Research Article, Vol. 7, No. 2, Special Issue 13, pp. 162-173, February, 2021
169
curves which represent the variation of the daily volumetric water flow rates supplied by the three different
photovoltaic solar water pumping system configurations. Also, this figure elucidates that the provided volumetric
flow rate by the (C2) configuration is the most significant around the mid of the day and a maximum value is
reached, while the volumetric water flow rate supplied by the other two configurations (C1 and C2), significantly
less than the volumetric water flow rate provided by the photovoltaic solar water systems. The volumetric water flow
rate supplied by (C1 and C3) configurations has a maximum values at the early morning operating time and then
remains constant through the whole operating time.
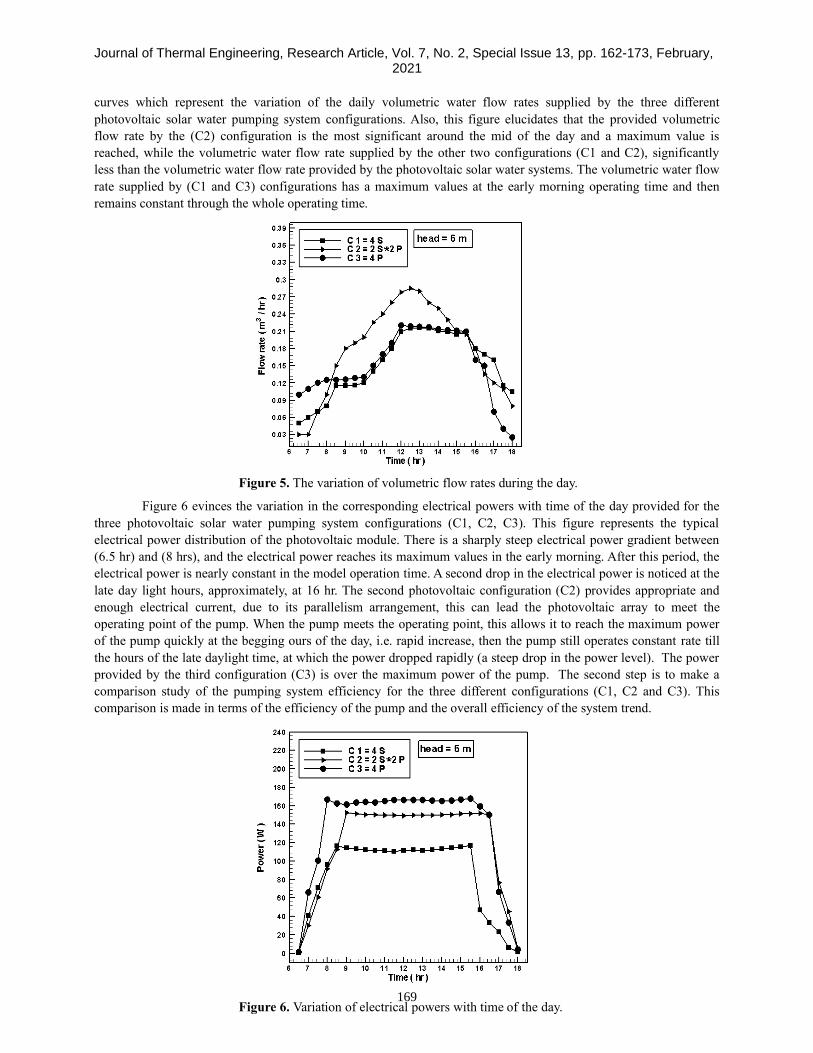
Figure 6 evinces the variation in the corresponding electrical powers with time of the day provided for the
three photovoltaic solar water pumping system configurations (C1, C2, C3). This figure represents the typical
electrical power distribution of the photovoltaic module. There is a sharply steep electrical power gradient between
(6.5 hr) and (8 hrs), and the electrical power reaches its maximum values in the early morning. After this period, the
electrical power is nearly constant in the model operation time. A second drop in the electrical power is noticed at the
late day light hours, approximately, at 16 hr. The second photovoltaic configuration (C2) provides appropriate and
enough electrical current, due to its parallelism arrangement, this can lead the photovoltaic array to meet the
operating point of the pump. When the pump meets the operating point, this allows it to reach the maximum power
of the pump quickly at the begging ours of the day, i.e. rapid increase, then the pump still operates constant rate till
the hours of the late daylight time, at which the power dropped rapidly (a steep drop in the power level). The power
provided by the third configuration (C3) is over the maximum power of the pump. The second step is to make a
comparison study of the pumping system efficiency for the three different configurations (C1, C2 and C3). This
comparison is made in terms of the efficiency of the pump and the overall efficiency of the system trend.
Figure 5. The variation of volumetric flow rates during the day.
Figure 6. Variation of electrical powers with time of the day.

Journal of Thermal Engineering, Research Article, Vol. 7, No. 2, Special Issue 13, pp. 162-173, February, 2021
170
Figure 7 (a), (b), (c)(demonstrates the efficiency of the pump curves of the three different photovoltaic
configurations (C1, C2 and C3), respectively. This figure is plotted at the water level head of 6 m. From this figure, it
can be noticed that in the early morning and in the late day light, the pumping system achieves the same values of
efficiency.
The second photovoltaic pumping system configuration (C2) provides a pumping efficiency more
significant than the pumping efficiency that provided by the other two configurations (C1 and C3). Table 4 exhibits
briefly the outline results including the average pumping efficiency. It is observed from this table that the second
photovoltaic pumping system configuration provides the best average pumping efficiency and the maximum water
flow rate during the day (2.298 m3/ day). In order to assess the effect of the photovoltaic configuration on the overall
system efficiency Figure 8(a), (b), (c) is plotted. This figure illustrates the variation of the overall system efficiency
during the operation period for ahead level of 6m. This figure clarifies a comparison of the overall system efficiency
(a) (b)
(c)
Figure 7. (a), (b), (c) Variation of pump efficiency for three different photovoltaic
configurations during the day.

Journal of Thermal Engineering, Research Article, Vol. 7, No. 2, Special Issue 13, pp. 162-173, February, 2021
171
the three different photovoltaic configurations. It can be noted from this figure that the second photovoltaic solar
water pumping system configuration (C2) provides an overall efficiency with a significant and constant values along
the operating period hours of the days except at the early morning hours and at the late ours afternoon. The overall
efficiency of the system that is provided by the first photovoltaic pumping system configuration (C1) is less
significant through the day time except in the early morning hours and in the late afternoon hours, at which the
overall efficiency marked higher efficiency level.
CONCLUSION
An experiment was carried out on a photovoltaic solar water pumping system to study its performance
under three different photovoltaic module configurations. In general, the photovoltaic solar pumping system is
sensitive to the variation of the solar irradiance failing on the photovoltaic array and the voltage and current that
needed to run the pumping load.
Besides, the volume of water provided by the photovoltaic module configuration of the second
configuration (C2) is more significant around noon when compared with the other two photovoltaic system
(a) (b)
(c)
Figure 8. (a), (b), (c) Overall system efficiency for three configurations (C1, C2 and C3)
along operating time.

Journal of Thermal Engineering, Research Article, Vol. 7, No. 2, Special Issue 13, pp. 162-173, February, 2021
172
configurations. The maximum average water volume delivered the first array configuration (C1), second array
configuration (C2), and third configuration (C3 were 1.79 m3, 2.289 m3 and 1.811 m3 respectively. Also, the second
system configuration (C2) is suitable for supplying a maximum flow of water through the daily operating period
daily period.
Furthermore, the overall system efficiency with the second photovoltaic configuration (C2) is more
appropriate in comparison with the tow photovoltaic array systems during the optimum sun light. That means, in
order to run the pumping system, the photovoltaic configuration (C2) is an appropriate choice.
NOMENCLATURE
REFERENCES
[1] Ghoneim AA. Design optimization of photovoltaic powered water pumping systems. Energy Convers Manag
2006;47:1449-1463. https://doi.org/10.1016/j.enconman.2005.08.015.
[2] Amer EH, Younes MA. Estimating the monthly discharge of a photovoltaic water pumping system: Model
verification. Energy Convers Manag 2006;47:2092-2102. https://doi.org/10.1016/j.enconman.2005.12.001.
[3] Hadj Arab A, Benghanem M, Chenlo F. Motor-pump system modelization. Renew Energy 2006;31:905-913.
https://doi.org/10.1016/j.renene.2005.06.003.
[4] Moechtar M, Juwono M, Kantosa E. Performance evaluation of a.c. and d.c. direct coupled photovoltaic
water pumping systems. Energy Convers Manag 1991;31,6:512-527.https://doi.org/10.1016/0196-
8904(91)90087-Y.
[5] Metwally HMB, Anis WR. Dynamic performance of directly coupled photovoltaic water pumping system
using D.C. shunt motor. Energy Convers Manag 1996;35:1405-1416.https://doi.org/10.1016/0196-
8904(95)00226-X.
[6] Grassie T, MacGregor K, Muneer T, Kubie J. Design of a PV driven low flow solar domestic hot water
system and modeling of the system collector outlet temperature. Energy Convers Manag 2002;43,8:1063-
1078 https://doi.org/10.1016/S0196-8904(01)00090-5.
[7] Lara DD, Merino GG, Pavez BJ, Tapia JA. Efficiency assessment of a wind pumping system. Energy
Convers Manag 2011;52:793-803. https://doi.org/10.1016/j.enconman.2010.08.004.
[8] Anagnostopoulos JS, Papantonis DE. Pumping station design for a pumped-storage wind-hydro power plant.
Energy Convers Manag 2007;48,11:3009-3017. https://doi.org/10.1016/j.enconman.2007.07.015.
[9] Mokeddem A, Midoun A, Kadri D, Hiadsi S, Raja IA. Performance of a directly-coupled PV water pumping
system. Energy Convers Manag 2011;52,10:3089-3095 . https://doi.org/10.1016/j.enconman.2011.04.024.
[10] Skretas SB, Papadopoulos DP. Systematic procedure for efficient design of electric water pumping systems
Apr Area of photovoltaic array, m2.
E Solar energy intensity, W/m2.
Ee Pump electric power, Wh/day
FF Fill factor.
Im Maximum current of the pump, A.
P Pump power required, W.
Q Water flow rate, m3/s.
Voc Photovoltaic array open circuit voltage, V.
ηp Pump efficiency, %.
Ch The constant = 9800 Kg/m2 s2.
Ei Energy of incident solar radiation, Kwh/day.
Eh Hydraulic energy of the pump, Wh/day.
H Water level head, m.
Isc Photovoltaic array short circuit current, A.
Pm Photovoltaic array maximum power.
Vm Pump nominal voltage, V.
ηpv Photovoltaic array efficiency, %.
ηoverall Overall system efficiency, %.
Journal of Thermal Engineering, Research Article, Vol. 7, No. 2, Special Issue 13, pp. 162-173, February, 2021
173
fed by PV or/and WECS: Application using measured meteorological data for the city of Xanthi/Thrace,
Greece. Energy Convers Manag 2008;49,4:595-607. https://doi.org/10.1016/j.enconman.2007.07.043.
[11] Alajlan SA, Smiai MS. Performance and development of PV - Plant for water pumping and desalination for
remote area in Saudi Arabia. Renew Energy 1996;8,1-4:441-446.https://doi.org/10.1016/0960-
1481(96)88895-1.
[12] Benghanem M, Hadj Arab A. Photovoltaic water pumping systems for Algeria. Desalination 2007;290,1:50-
57. https://doi.org/10.1016/j.desal.2007.04.008.
[13] Benghanem M, Arab AH, Mukadam K. Data acquisition system for photovoltaic water pumps. Renew
Energy 1999;17,3:385-396. https://doi.org/10.1016/S0960-1481(98)00126-8.
[14] Hadj Arab A, Chenlo F, Benghanem M. Loss-of-load probability of photovoltaic water pumping systems. Sol
Energy 2004;76,6:713-723. https://doi.org/10.1016/j.solener.2004.01.006.
[15] Anis WR, Nour MA. Optimum design of a photovoltaic powered pumping system. Energy Convers Manag
1994;35,12:1123-1130. https://doi.org/10.1016/0196-8904(94)90016-7.
[16] Clark RN. Photovoltaic water pumping for livestock in the Southern Plains. Am. Soc. Agric. Eng. Meet.,
1994; 94-4529.
[17] Vick BD, Clark RN. Performance of wind-electric and solar-pv water pumping systems for watering
livestock. J Sol Energy Eng Trans ASME 1996;18:212-216. https://doi.org/10.1115/1.2871780.
[18] Vick BD, Clark RN. Determining the optimum solar water pumping system for domestic use, livestock
watering or irrigation. 38th ASES Natl. Sol. Conf. 2009, Sol. 2009, 2009.
[19] Vick BD, Clark RN. Water pumping performance of a solar-PV powered helical pump. Proc. Sol. World
Congr. 2005 Bringing Water to World, Incl. Proc. 34th ASES Annu. Conf. Proc. 30th Natl. Passiv. Sol. Conf.,
2005.
[20] Sutthivirode K, Namprakai P, Roonprasang N. A new version of a solar water heating system coupled with a
solar water pump. Appl Energy 2009;86:1423-1430. https://doi.org/10.1016/j.apenergy.2008.12.002.
[21] Biswas S, Iqbal MT. Dynamic Modelling of a Solar Water Pumping System with Energy Storage. J Sol
Energy 2018;84:1-12.https://doi.org/10.1155/2018/8471715.
[22] Benghanem M, Daffallah KO, Almohammedi A. Estimation of daily flow rate of photovoltaic water
pumping systems using solar radiation data. Results Phys 2018;8:949-954
https://doi.org/10.1016/j.rinp.2018.01.022.
[23] Kolhe M, Joshi JC, Kothari DP. Performance analysis of a directly coupled photovoltaic water-pumping
system. IEEE Trans Energy Convers 2004;19: 613-618. https://doi.org/10.1109/TEC.2004.827032.
[24] Argaw N. Optimisation of photovoltaic water pumps coupled with an interfacing pulse width modulated
DC/AC inverter power conditioning device. Conf. Rec. IEEE Photovolt. Spec. Conf., 1994.
https://doi.org/10.1109/wcpec.1994.520170.
[25] Roonprasang N, Namprakai P, Pratinthong N. Experimental studies of a new solar water heater system using
a solar water pump. Energy 2008;33:639646. https://doi.org/10.1016/j.energy.2007.12.002.
[26] Kracker U, Pienitz S. Ermittlung von Photovoltaik-Referenzprofilen. Ew -- Mag F{ü}r Die Energiewirtschaft
2017.
[27] Kroni R, Stettler S, Friesen G, Chianese D. Energy rating of solar modules–final report 2005.
[28] Kenny RP, Friesen G, Chianese D, Bernasconi A, Dunlop ED. Energy rating of PV modules: Comparison of
methods and approach. Proc. 3rd World Conf. Photovolt. Energy Convers., 2003.
[29] Mohanty P, Muneer T, Gago EJ. Solar Photovoltaic System Applications. 2016. https://doi.org/10.1007/978-
3-319-14663-8.