Embed Size (px)
Citation preview

Experimental Investigation and Optimization ofDelamination Factors in the Drilling of Jute FiberReinforced Polymer Biocomposites with MultipleEstimatorsBachir Adda
Universite du 20 aout 1955 de SkikdaAhmed Belaadi ( [email protected] )
Universite du 20 aout 1955 de SkikdaMessaouda Boumaaza
Université 8 Mai 1945 GuelmaMostefa Bourchak
King Abdulaziz University
Research Article
Keywords: Drilling/Machining, Composite delamination, Statistical properties/methods, RSM/ANN,Genetic algorithm optimization
Posted Date: May 18th, 2021
DOI: https://doi.org/10.21203/rs.3.rs-519941/v1
License: This work is licensed under a Creative Commons Attribution 4.0 International License. Read Full License
Version of Record: A version of this preprint was published at The International Journal of AdvancedManufacturing Technology on July 13th, 2021. See the published version athttps://doi.org/10.1007/s00170-021-07628-9.

Page 1 of 42
Experimental Investigation and Optimization of Delamination Factors
in the Drilling of Jute Fiber Reinforced Polymer Biocomposites with
Multiple Estimators
Bachir Adda1,2, Ahmed Belaadi 1,3*, Messaouda Boumaaza3, Mostefa Bourchak 4
1Département de Génie Mécanique, Faculté de Technologie, Université 20 Août 1955- Skikda, Algérie. 2 Laboratoire LGMM, Université 20 Août 1955- Skikda, Algérie. 3 Laboratoire LSPN, Université 8 mai 1945 Guelma, Algérie. 3 Laboratoire de Génie Civil & Hydraulique (LGCH), Université 8 Mai 1945 Guelma, Algérie. 4 Aeronautical Engineering Department, King Abdulaziz University, Jeddah, Saudi Arabia.
*Corresponding author, Dr, A Belaadi (http://orcid,org/0000-0002-6059-3974)
E-mail addresses: a,belaadi@univ-skikda,dz , ahmedbelaadi1@yahoo,fr
Abstract
Currently, the manufacture of composite structures often requires material removal operations
using a cutting tool. Indeed, since biocomposites are generally materials that do not conduct
electricity, electro-erosion cannot be utilized. As a result, the processes that can be used are
limited to conventional machining, called chip removal machining, such as drilling.
Delamination factors are widely recognized for controlling the damaged area (delamination)
induced by drilling in industry. As discussed in the literature, several approaches are available
to evaluate and quantify the delamination surrounding a hole. In this context, the objective of
this study is to compare the three Fd evaluation methods that have been most frequently used
in previous investigations. To this end, three rotational and feed speeds and three BSD tool
diameters were selected (L27) for drilling 155 g/m2 density jute fabric reinforced polyester
biocomposites. The response surface methodology (RSM) and artificial neural networks
(ANNs) were applied to validate the results obtained experimentally as well as to predict the
behavior of the structure depending on the cutting conditions.
Keywords: Drilling/Machining; Composite delamination; Statistical properties/methods; RSM/ANN; Genetic algorithm optimization.

Page 2 of 42
1. Introduction
Natural fibers are initially biodegradable and are often considered neutral with respect to CO2
emissions into the atmosphere because their biodegradation only produces a certain amount of
carbon dioxide[1]. Biocomposites are therefore easier to recycle. Moreover, if their matrix is
biodegradable, these materials are also compostable after grinding when the material is too
degraded [2]. Biocomposites are mainly used in several fields, such as construction, sports, and
transport [3, 4]. On the other hand, the manufacturing processes and implementations of these
biomaterials are poorly controlled because of the natural origin of the biofibers. Indeed, to better
understand the behavior of biocomposites, in-depth scientific studies have been conducted by
several researchers [5, 6]. Currently, a wide variety of plant fibers are currently used as
reinforcements for different matrices [7, 8], such as sisal.[9], jute [10], Agave americana L.
[11], flax [4, 12–14], Washingtonia filifera [15], date palm [16, 17] and pineapple [18].
To date, in several studies, the machining process has been investigated during the
drilling of glass, aramid and carbon composites to study the interaction mechanisms between
the cutting tools and the material and to determine the most influential machining parameters
with respect to the behavior of the fibers; thus, the most suitable process can be chosen [19–
27]. On the other hand, there have been only a limited number of studies in the literature that
address the machining of biocomposites [28–54] as well as comparative studies between
biocomposites and glass fiber composites [55]. However, the milling process [56, 57] and
orthogonal cutting [58, 59] have been much less studied.
Chandramohan and Rajesh [60] showed that the drill geometry has an effect on the drilling
torque. These researchers relied on the drilling torque results of two types of drills for the
prediction of the drilling torque when machining biocomposites. Indeed, the drilling torque with
a multisided drill was greater than that with a twist drill at a low cutting speed. The effect of
the drill geometry on the drilling quality of laminated composites has been the subject of much
research. In investigations on the drilling of FFRPs using drills of different geometries, Rezghi
Maleki et al. [61] found that due to the difference in the cutting mechanism, the type of drill
used had a great influence on the pushing force and thereby on the delamination size.
Furthermore, their ANOVA showed that the choice of drill bit had a great impact on the
delamination factor (67.27%) and surface roughness (74.44%). However, the tool geometry has
been shown to have less impact on the residual tensile strength of FFRP composites [62].
Bajpai and Singh [30] experimentally investigated the drilling behavior of the natural fiber
reinforced biodegradable biocomposite sisal/PP. In this study, the effect of cutting parameters

Page 3 of 42
(spindle speed, feed speed and tool geometry) and drill geometry (twist drill and tool
trepanation) was investigated. The investigation, using ANOVA, showed that the influence of
the tool geometry is more important than other parameters. In other work presented by Bajpai
et al. [31], the drilling performance of the biodegradable biocomposite sisal and Grewia optiva
reinforced polylactic acid was studied using tool geometries, namely, twist, Jo, and parabolic
drills with 8 mm diameter solid carbide. The RSM method was used to optimize the cutting
parameters in terms of the drilling thrust force and torque and drilling-induced damage. This
study showed that the geometry of the tools is an important factor influencing the forces and
damage induced by drilling. Davim and Reis [63] experimentally studied the influence of the tool
material and geometry, such as a straight shank drill bit and Brad & Spur drill. Their work focused on
producing less entry and exit delamination on carbon reinforced epoxy composite laminates.
Chaudhary and Gohil [35] conducted an experimental study of the drilling performance, e.g.,
the thrust force, torque and exit delamination factor, on polyester/bidirectional cotton fiber
biocomposites by varying the cutting parameters, namely, the spindle speed and feed speed
geometry of a 10 mm diameter drill. In addition, the tests were carried out by the Taguchi
orthogonal method (L27) to optimize the cutting forces and damage using a one-way analysis
(ANOVA) method. A comparative study developed by Athijayamani et al. [55] between two
composite materials (epoxy/glass and epoxy/sisal) was conducted to analyze the effect of the
two different tungsten carbide drill tool geometries (6 mm in diameter). The machining
operation was realized with a classical helical drill and a Brad type (BSD) tool. In addition, the
experiments were carried out at a constant spindle speed of 2800 rev/min with two feed rates
(0.05 and 0.2 mm/rev). Venkateshwaran and ElayaPerumal [36] investigated the influence of
drilling conditions (spindle speed and feed speed) using a constant 10 mm diameter HSS drill
on the exit delamination factor damage of an epoxy matrix reinforced short banana fiber green
biocomposite. The damage was analyzed using the ultrasonic C-scan technique. Moreover, the
obtained results were evaluated using ANOVA. Ismail et al [39] studied the drilling behavior
of different drill tool diameters on biodegradable composite laminates made of natural hemp
fibers by varying the spindle speed and feed speed. The Taguchi method according to the L16
orthogonal network method was chosen. These authors concluded that the optimal results for
delamination and surface roughness were obtained at a lower cutting speed and feed speed. In
a similar work, Abilash and Sivapragash [41] studied the effect of experimental drilling
parameters using the Taguchi method (L18 orthogonal network). In this work, the force output,
torque and delamination were studied by drilling holes in green biodegradable composite
polyester laminates reinforced with natural fibers treated with bamboo. ANOVA was adopted

Page 4 of 42
to determine which drilling parameters were statistically significant. Athijayamani et al. [37]
studied the drilling behavior of polyester-reinforced sisal and roselle fiber hybrid green
composites. The fibers were treated using an alkali treatment of 10% NaOH for different
durations. A constant dill (8 mm HSS) was used to perform the drilling process. The obtained
results suggest that a better dimensional stability was reached by using a 30% by weight of fiber
treatment for 8 h. Recently, Lotfi et al. [14] examined the drilling performance of a developed
high-strength NFRC laminate (flax/PLA) and evaluated the influence of the cutting parameters,
feed rate and spindle speed using two drills (HSS twist drill and carbide drill) on the generation
of the minimum drilling force and drilling-induced damage. The authors concluded that the
lowest damage with a good quality of the hole of the flax/PLA biocomposite is achieved with
the HSS twist drill, a spindle speed of 2550 rpm and a feed rate of 0.08 mm/rev. In addition,
this drill demonstrated better hole quality than carbide drills and results in a nearly 60% lower
thrust force. In other recent work, Parthipan et al. [64] conducted interesting research that
focused on the effect of the drilling performance of silane-treated silicon (IV) oxide particles
dispersed in an epoxy matrix reinforced with kenaf fibers. The drilling behavior of the
biocomposite showed that the addition of nano-silicon(IV) oxide and silane-treated kenaf fiber
maintains high dimensional stability, lower friction penetration, a lower thermal affected zone
and lower tool wear. Recently, Belaadi et al. [28] performed interesting research on the effect
of drilling parameters such as the spindle speed, feed rate and drilling diameters on
jute/polyester staple fiber biocomposites to estimate the influence of the delamination factor
Fd. In other recent work by Belaadi et al. [46], an artificial neural network (ANN) model was
developed to evaluate the direct and interaction effects of cutting parameters to analyze
delamination. In their experiments, epoxy matrix jute fabric sheets were drilled three times for
each cutting condition, and the hole exit damage was measured using a high-resolution scanner.
The resulting image was subsequently processed by ImageJ to calculate the delamination factor.
The results revealed that delamination is sensitive to each cutting parameter and that a
combination of a high cutting speed and a low feed rate can minimize it. Furthermore, the
regression analysis established a very good match between the predicted and experimental
values of the delamination factor. This model establishes a nonlinear relationship between the
drilling parameters and the delamination factor.
Indeed, most of the damage induced by the drill during the drilling process is located in the
internal or external region of the biocomposite, where the evaluation of the latter is a difficult
task. To quantify the size, shape and region of the delamination area, it is essential to use

Page 5 of 42
microstructural analysis supported by image processing software. The visual inspection
technique creates special problems for quantifying the delamination of biocomposites. From
the literature review, it can be stated that few research studies have discussed the area of drilling
of natural fiber biocomposites. In other words, there is still an important field of research in the
field of machining biocomposites. In this context, this study focuses on the effect of drilling
machining parameters on the delamination factor (Fd) of woven jute fabric/polyester (WJFP)-
reinforced epoxy biocomposites. For comparison, different expressions for the evaluation of
the delamination damage factor in drilling were used. A tool with different diameters was
chosen, such as a wood drill (Brad & Spur), to estimate the influence and the simultaneous
interaction of the input parameters on the Fd factor. Additionally, the response surface
methodology (RSM) and artificial neural networks (ANNs) were used for Fd evaluation to
estimate the influence and interaction of the cutting parameters at the exit of the drilling
delamination. Finally, optimization functions such as the desirability based on the RSM, genetic
algorithm (GA) and function (fmincon) were used to confirm the optimal combination of
optimal cutting parameters (f, N and d) for the biosandwich structures studied in this work.
2. Materials and methods
2.1. Biocomposites manufacturing
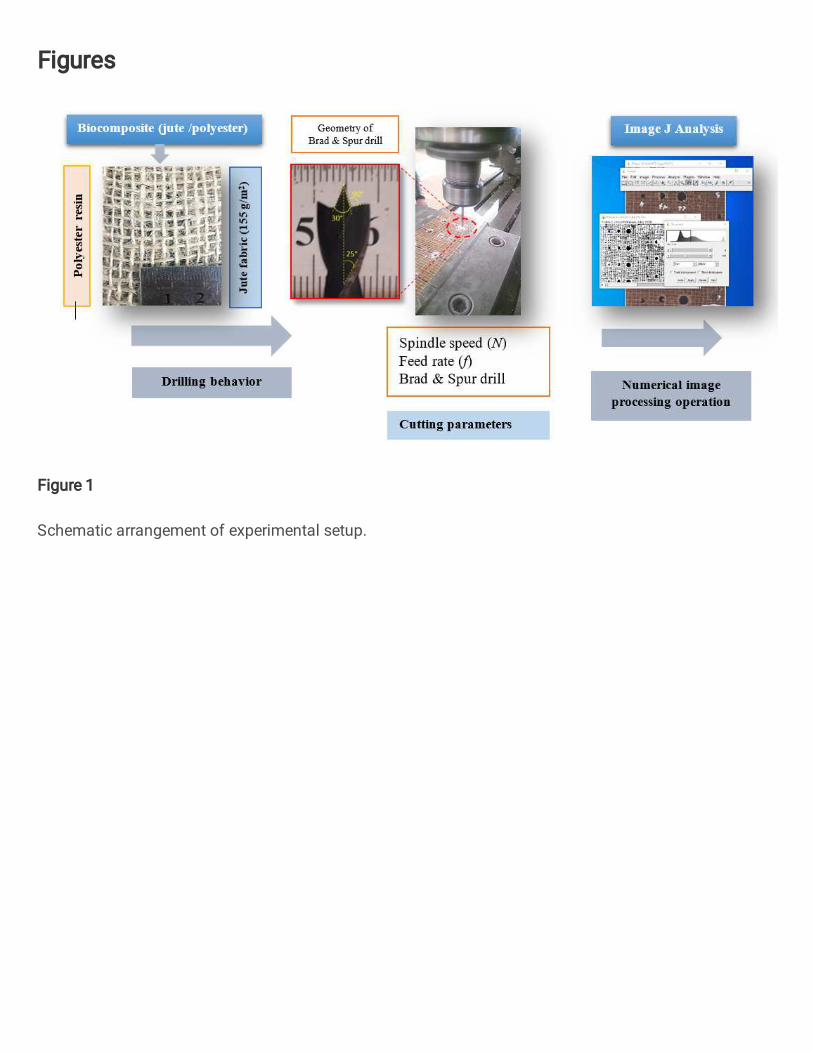
In the present study, the reinforcement consisted of bidirectional jute fibers (Figure 1)
with a basis weight of 155 g/m2 (28 × 23 threads/100 mm) and polyester resin with a density of
1.410 kg/m3. The polyester resin and jute fabric were supplied locally. The average mechanical
characteristics of the polyester resin, namely, a 32 MPa tensile strength, a 2.7% elongation and
a Young's modulus equal to 1.12 GPa, were described by Belaadi et al. [28] . The biocomposite
samples (jute/polyester) were developed using the contact molding and hand lay-up process;
the fabric was previously fabricated and then cut to dimensions of 280 × 280 mm. The obtained
biocomposite samples were rectangular sheets, which were 280 mm in length, 280 mm in width
and approximately 5.5±0.2 mm in thickness, consisting of five layers. Furthermore, the fiber
content of the biocomposite laminates was 30 wt%. The processing of the polyester resin was
carried out by catalysis and polymerization in proportions of approximately 1 to 1.5% by mass.
The mixture (fiber/matrix) was cured and kept in the mold for 24 hours under standard
atmospheric pressure (1 bar) and at an ambient temperature of 26°C until the end of the
polymerization. To allow the mixture to polymerize, the plates were kept in open air for 15 days
to ensure complete polymerization of the resin. The samples were finally postcured at a
temperature of 60°C in an oven for 5 hours. The specimens for the drilling experiments were

Page 6 of 42
cut to the following dimensions, namely, 260 × 90 × 5.5 mm3, using a diamond saw with water
lubrication to avoid excessive heating during cutting. Subsequently, the specimens were air-
dried at room temperature (23°C) for 20 days.
2.2. Drilling experimental procedure
The drilling tests were performed using a MOMAC universal milling machine equipped
with a 1400 rpm spindle with a feed rate of 4.6 to 1040 mm/rev [28, 46], and all drilling was
performed on this machine. During the drilling phase, to limit the bending of the parts to avoid
amplifying the defects at the exit of the hole, a solid steel support was placed under the
composite parts. To carry out the drilling tests, the geometry of the workpiece was 260 × 90 ×
5.5 mm3, and Figure 1 shows a workpiece fixation system. In this study, Brad & Spur drills
with different diameters (5 mm, 7 mm and 10 mm) were used, and the shape and geometry of
the tool are shown in Figure 1. The drilling of the holes in this study was performed in a single
phase. To ensure a well-sized hole and prevent the wear of the drilling tool, the drill bit was
renewed every four to five operations. The drilling operations were performed dry, without
coolant. The spindle speeds were 355, 710 and 1400 rpm, and three feed rates were chosen (50,
108 and 190 mm/min). The cutting parameters were selected following a literature review
presented in Table 1.
Then, the drilled specimens were scanned using a high-resolution scanner up to 2400 × 4800
dpi (48-bit internal color depth) to obtain a high-precision image. The resulting digital images
were then imported and processed in ImageJ (free software v1.47, published by the National
Institute of Health, USA [50, 51, 65]) to evaluate the damage area of the drilled hole Fd. The
threshold filter was adjusted to highlight the delamination surrounding the hole. Delamination
represents one of the major damage defects in drilled laminate composites. Figure 2 shows the
processing procedure adopted to determine the different damage areas of the hole. The three
calculation methods used for the determination of Fd in this study under different machining
conditions are presented in Table 2.
2.3. Experimental design
Table 3 shows the values of the response parameters Fd1, Fd2 and Fd3 determined under
different experimental configurations. The experimental design of this study was an orthogonal
(L27) central composite design (CCD) array. This design was adopted to limit the number of
experiments, and thus, the experimental expense and time was reduced. Three groups of levels,

Page 7 of 42
namely, the drill diameter (d), spindle speed (N), and feed rate (f), and three levels in each group
were considered (Table 4).
3. Results and discussion
3.1 Influence of the drilling parameters on the delamination factor
The condition of the drilled holes at the exit and entrance (#3, #12 and #21) with feed rates of
50, 108, and 190 mm/min and a spindle speed of 355 rpm was examined (Figure 2a and b).
The machined jute/polyester fiber composites were digitally imaged with a standard scanner
with a resolution of 4800 pixels. Image processing software was used to create two concentric
circles. The damage caused by drilling the holes in the composite is related to the delamination
factor. The choice of cutting parameters and the fiber fabric used during the design process is a
fundamental concern for delamination. Indeed, the determination of the delamination factor Fd
of biosandwich structures using Brad & Spur drills (BSD) is related to many factors, such as
the feed rate, cutting speed and tool diameter. Additionally, it is appropriate to determine the
different parameters for the calculation of the delamination factors performed on the drills and
to analyze the image obtained through this calculation (Figure 2c).
3.3 Response surface methodology and ANOVA for delamination factor
The response surface analysis method was used to process the experimental results to find the
correlation that exists between delamination and the different parameters of the composite.
Indeed, the response surface methodology (RSM) is a mathematical and statistical approach
that is generally used in engineering sciences and cutting operations [66]. Moreover, this
method is based on an empirical modeling approach that aims to find the relationship between
input and output parameters, such as the delamination Fd, by changing the different cutting
parameters when drilling the biosandwiches. The mathematical equations of the regression are
reported in Table 5 for the different delamination factors obtained by Design-Expert software,
which recommended the quadratic models. These models are second-order mathematical
models based on the RSM. Figure 3 shows the relationship between the probability of the
residuals and the predicted and experimental values of the delamination Fd for Fd1, Fd2 and
Fd3. For the Fd delamination residuals, the normal probability curve shown in Figures 3a and
b indicates that the residuals form a straight line, implying that the errors are correctly
distributed. These results demonstrate that the fit of the model is excellent. Thus, the results
obtained show satisfactory agreement of the regression model since the predicted values are

Page 8 of 42
statistically identical to the experimental values with a 95% confidence level. The significance
synthesis of the results revealed that the quadratic model is statistically significant for the
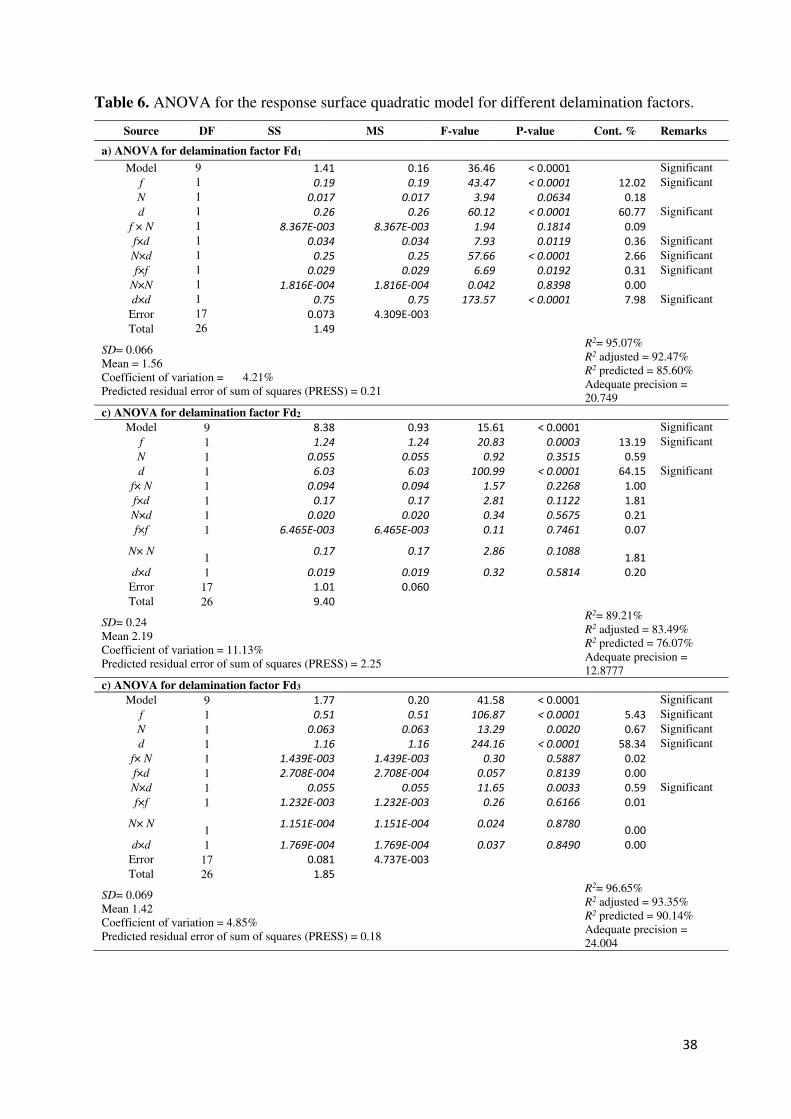
delamination analysis. In Table 6, the results of the ANOVA quadratic model for Fd1, Fd2 and
Fd3 are presented; however, the model terms f, d, N×d, N2, and d2 are significant, while N and
f×N are also significant for BSD only. The R2 coefficient and adjusted R2 coefficient
corresponding to delamination are 95.07% and 95.47% for Fd1, 89.21% and 83.49% for Fd2,
and 96.65% and 93.35% for Fd3, respectively. Thus, it is clear that this regression model
provides a perfect fit between the responses and the independent factors. In this study, to
confirm the effect of the cutting-related parameters on the responses, the statistical tools called
"p-value" and "F-value" (the ratio of the mean square to the mean square and the ratio of the
mean square to the mean square of the experimental error, respectively) are described. If the p-
values are less than 0.05 (p-value < 0.05), then the conditions required by the model are
significant. The present analysis is performed at a 5% significance level, i.e., for a 95%
confidence level. According to ANOVA, the models were highly statistically significant (p <
0.0001). In addition, the F-values for Fd1, Fd2 and Fd3 are 36.46, 15.61 and 41.58, respectively.
Due to the larger F-value, it appears that the diameter d and feed rate f are the most significant
parameters for the delamination of composites Fd1, Fd2 and Fd3 compared to cutting speed N.
However, for Fd1, the model terms f, d, f×d, N×d, f×f and d×d are significant, while only the
terms f and d are significant for Fd2, and f, N, d and N×d influence Fd3. The most important
variable influencing the response value of the delamination factors is the drill diameter. Then,
the second variable influencing the response value is the feed rate. Therefore, it appears that the
diameter of the drill is the main parameter that affects the delamination factor, followed by the
feed rate and the cutting speed. In addition, the contribution of the d-factor is most significant
for Fd1, Fd2 and Fd3. The diameter of the drill was more significant with respect to delamination
than the feed rate and cutting the speed.
3.3 2D surface plots for the delamination factor
The results in Figure 4 provide a mapping of the response surfaces obtained for delamination
at the exit of composites machined by BSD drills as a function of the feed rate (f), cutting speed
(N) and diameter (d). For a constant diameter, the delamination does not exceed 1.10 for the
factor Fd1 with f between 50 and 58 mm/min and N from 1241 to 1400 rev/min, but it exceeds
1.5 when f is between 123 and 190 mm/min and N from 355 to 773 rev/min (Figure 4a). For
tool Fd2, notably, the delamination does not exceed 1.2 when f is between 50 and 57 mm/min
and N is between 459 and 992 rev/min, while it exceeds 2.0 when f is between 185 and 190

Page 9 of 42
mm/min and N is between 355 and 658 rev/min (Figure 4b). For tool Fd3, we also note that the
delamination does not exceed 1.1 for f between 50 and 78 mm/min and N from 355 to 1400
rev/min, but it exceeds 1.3 when f is between 164 and 190 mm/min and N from 355 to 1400
rev/min (Figure 4c). Figures 4d-f show for a constant cutting speed how the feed rate and drill
diameter significantly affect delamination Fd1, Fd2 and Fd3 using the BSD drills. Delamination
is less than 1.2 for Fd1 when f is between 50 and 88 mm/min and d is between 5 and 5.4 mm,
less than 1.5 for Fd2 when f is between 50 and 58 mm/min and d is between 5 and 5.2 mm, and
less than 1.2 for Fd3 when f is between 50 and 126 mm/min and d is between 5 and 6.5 mm. It
also appears that the delamination is greater than 1.8 for Fd1 when f is between 50 and 190
mm/min and d is between 6.6 and 10 mm, greater than 3 for Fd2 when f is between 90 and 190
mm/min and d is between 9.8 and 10 mm, and greater than 1.8 for Fd3 when f is between 112
and 190 mm/min and d is between 8.5 and 10 mm. The effect of drill tool diameter and cutting
speed on delamination at a constant feed rate is shown in Figures 4g-h. The delamination is
less than 1.2, 1.5 and 1.1 for Fd1, Fd2 and Fd3, respectively, when d and N are between 5-5.2
mm and 721-1400 rev/min for Fd1, 5-6.4 mm and 355-1400 rev/min for Fd2 and 5-5.7 mm and
355-1400 rev/min for Fd3. Furthermore, it is also observed that the Fd value exceeds 1.8, 2.5
and 1.6 when d and N are between 7.9-9.2 mm and 1295-1400 rev/min for Fd1, 6-10 mm and
720-1400 rev/min for Fd2 and 9.8-10 mm and 1295-1400 rev/min for Fd3, respectively. These
results are fully consistent with those observed by Belaadi et al [28, 46] for epoxy/jute fabric
biocomposites under identical cutting conditions. In the case where the drill diameter is kept
constant, the Fd factor increases with increasing feed rate. On the other hand, by increasing the
spindle speed, the delamination factor decreases. In general, Fd1 (≈ 1.12 to 1.89) produces lower
Fd values than Fd2 (≈ 1.12 to 3.07) and Fd3 (≈ 1.01 to 2.02).
3.4 Prediction of the delamination factor by neural networks
The input layer integrates the data into the network model, and the output layer provides the
response. For the prediction of the delamination factor, a multilayer perceptron consisting of an
input layer, a hidden layer and an output layer was used. The ANN network was designed using
the MATLAB Neural Network Toolbox. The use of neural network modeling offers a powerful
solution capable of simulating the behavior of all nonlinear systems [67]. The ANN model
training method in this investigation was based on the LM (Levenberg-Marquardt) algorithm,
which associates both the principles of the quasi-Newton algorithm and steepest descent
backpropagation, adapted to solve nonlinear least squares problems and curve adjustment. Of
the total data, 80% and 75% of the datasets were chosen as training sets, and the remaining

Page 10 of 42
datasets (20% and 25%) of the total data were used for testing and validation for Fd1 and (Fd2,
Fd3), respectively. For models Fd1, Fd2 and Fd3, the input layer contains three neurons, the
hidden layers contain ten, eleven and eleven neurons, and the output layer contains one neuron
(Figure 5). The choice of the number of neurons in the hidden layers is based on the principle
of reducing the error with an increasing number of hidden nodes [68]. Table 7 shows the ANN
architectures and the MSE and R-values for training, validation and testing of Fd1, Fd2 and Fd3.
In fact, these neurons are linked together by weights. Figures 6 a-i correspond to the predictions
of Fd delamination through the neural network against the experimental test results for Fd1, Fd2
and Fd3 for the training, test, and validation data sets. The ANN prediction is in perfect
agreement with the experimental results. Thus, according to the results, the capability of the
ANN models developed for Fd1, Fd2 and Fd3 can satisfactorily interpret the data, and this
approach is a good way to predict the delamination factor (Table 8). Furthermore, the results
indicate that the model is an effective and applicable way to measure the delamination factor
of composites made from jute/polyester fabric.
3.5 Comparison of the RSM and ANN models
Figure 7 and Table 9 present a comparison of the results predicted by the ANN and RSM
models with those obtained experimentally. Both models provide a satisfactory description of
the experimentally obtained results. Figures 8-10 show a comparison between the 3D surface
plots of the delamination factor as a function of f, N and d of the composite obtained with the
RSM and ANN models. Both models provide a satisfactory description of the experimentally
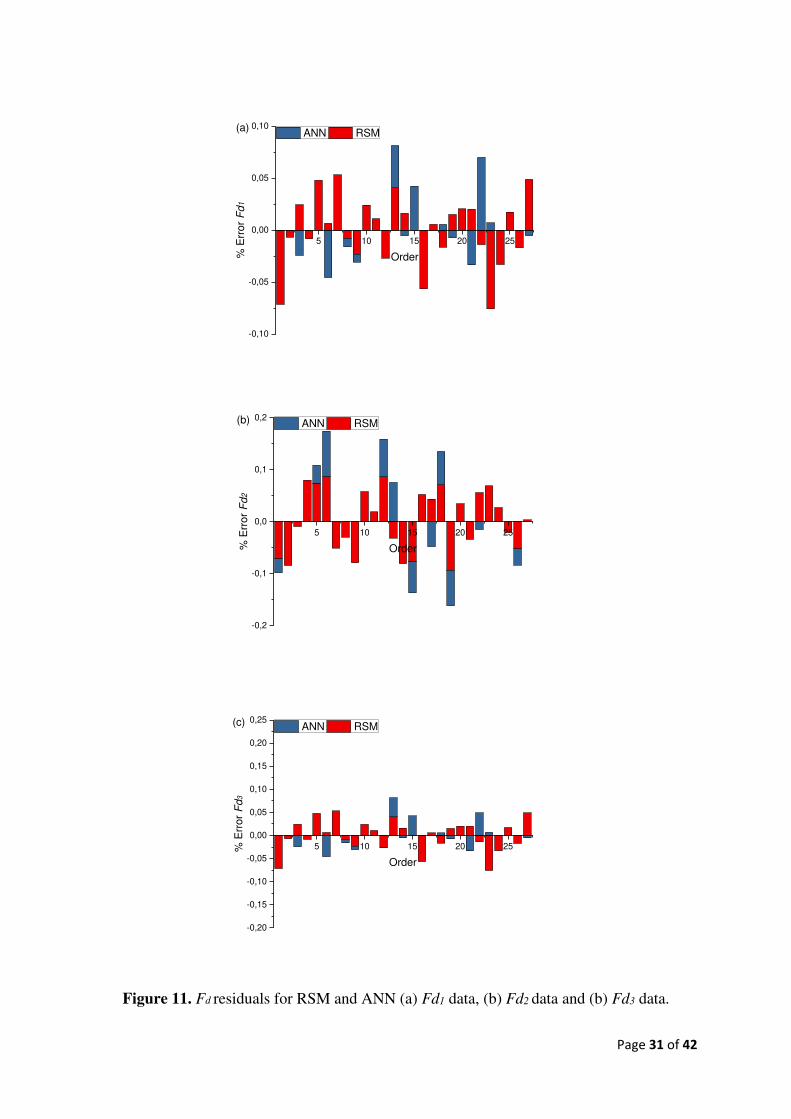
obtained results. According to the results of Figure 11, the maximum absolute percentage of
the error in the prediction by the ANN model of the delamination factors Fd1, Fd2 and Fd3 is
6.99%, 8.71% and 4.89%, while by the RSM model, this percentage is 7.58%, 9.36% and
7.14%, respectively. Therefore, we can conclude that the ANN model provides a more accurate
prediction than the RSM model. Since these error rates are low, we can say that the optimization
process is appropriate and that the model predicts the responses with high accuracy.
3.6 Optimization of the responses
Figures 12 and 13 show the mapping and distribution of the desirability contour and ramp
function for Fd1, Fd2 and Fd3 and their combination in Figure 13d. Determining the cutting
parameters and minimizing the delamination factors are the main objectives of the optimization.
Table 10 shows the cutting parameters used in the optimization process as well as the optimized
values of the factors, and the responses obtained are shown in Table 11. The selection of the

Page 11 of 42
10 trials was conducted because of the high desirability factor. These first 10 trials show that at
a low feed rate, a small tool diameter and a high spindle speed, the reduction of the delamination
factor is appropriate with desirability factors of 1.00, 0.98 and 1.00 for Fd1, Fd2 and Fd3,
respectively (Figures 13a-c). The optimal drilling conditions according to Table 11 (f = 50
mm/min, N = 1085.89 rev/min and d = 5.00 mm) resulted in minimal delamination for Fd1, Fd2
and Fd3 with the following values, i.e., 1.13, 1.23 and 1.02, respectively. To solve the
optimization problem through the genetic algorithm (GA) and to find a minimum of the
multivariable nonlinear constraint function (fmincon) using MATLAB software, the models
generated with the ANN method were chosen. The results of this optimization of the input
parameters and Fd1, Fd2 and Fd3 are presented in Table 12. Indeed, these results show that the
response parameters from the GA and fmincon produce almost similar values. Finally, a
comparison of the response parameters Fd1, Fd2 and Fd3 with those predicted by the GA and
fmincon algorithms are 1.11, 1.15 and 1.01 for RSM, 1.04, 1.70 and 1.59 for the fmincon
function and 1.10, 1.84 and 1.65 for the GA, respectively, thus validating the relevance of the
models and the concordance of the results with those obtained by the GA and fmincon [28].
4. Conclusion
The present study focuses on the optimization of the delamination factor during the orthogonal
drilling of a material consisting of a bidirectional jute/polyester fabric matrix using the BSD
tool. Models via artificial neural networks (ANNs) and the response surface methodology
(RSM) were developed to predict the delamination factor determined by different methods. A
three-level factorial design was applied to generate the input-output data used to develop the
ANN and RSM models. The two models were compared in terms of the performance based on
their predictive accuracy through the realization of the surface curves corresponding to the
direct and interaction links of the parameters related to the drilling operations. The main
conclusions drawn from the present study are as follows:
o From the effects of the interaction of the cutting parameters during the drilling process,
it is apparent that the combination of a low feed rate and small tool diameter is necessary
to reduce the delamination factor.
o The delamination factor is influenced by the diameter of the drill as well as the size of
the feed rate, and the spindle speed has no influence on the delamination factor.
o The contributions of the different elements of the optimal drilling condition to Fd1, Fd2
and Fd3 are the drill diameter (60.77%, 64.15% and 58.34%), feed rate (12.02%, 13.19%
and 5.43%), and spindle speed (0.18%, 0.59% and 0.67%), respectively.

Page 12 of 42
o This optimization is considered to be of good quality, as the overall desirability factor
is 97%.
o The results of the predictive models and the experimental results are in perfect
agreement.
o The percentage of the maximum absolute error for the ANN model prediction of the
delamination factors Fd1, Fd2 and Fd3 is 6.99%, 8.71%, and 4.89%, compared to 7.58%,
9.36%, and 7.14% for the RSM model, respectively.
o The agreement between the ANN and RSM models, used to predict cutting parameters
in drilling processes, and the experimental data is very high. A comparison of the
experimental results with those predicted by the RSM and ANN models reveals that the
ANN models are more accurate and generate excellent results.

Page 13 of 42
Acknowledgements : The authors gratefully acknowledge (la Direction Générale de la Recherche
Scientifique et du Développement Technologique, Algérie) DGRSDT for their support in this work.
Author contribution
Bachir Adda : Conceptualization, Investigation, Methodology, Writing - review & editing.
Ahmed Belaadi: Conceptualization, Investigation, Methodology, Supervision, Writing - review & editing.
Messaouda Boumaaza: Conceptualization, Investigation, Writing - review & editing.
Mostefa Bourchak: Investigation, Writing - review & editing.
Funding information :The authors declare no funding information.
ORCID ID Ahmed Belaadi https://orcid.org/0000-0002-6059-3974
Data availability Not applicable.
COMPLIANCE WITH ETHICAL STANDARDS
Competing interests The authors declare no competing interests.
Ethics approval The work contains no libelous or unlawful statements, does not infringe on the rights
of others, or contains material or instructions that might cause harm or injury.
Consent to participate The authors consent to participate.
Consent for publication The authors consent to publish.

Page 14 of 42
References
1. Atagur M, Seki Y, Oncu O, et al (2020) Evaluating of reinforcing effect of Ceratonia Siliqua
for polypropylene: Tensile, flexural and other properties. Polym Test 89:106607.
https://doi.org/https://doi.org/10.1016/j.polymertesting.2020.106607
2. Sarasini F, Tirillò J, Lampani L, et al (2019) Static and dynamic characterization of
agglomerated cork and related sandwich structures. Compos Struct 212:439–451.
https://doi.org/10.1016/j.compstruct.2019.01.054
3. Belaadi A, Bourchak M, Aouici H (2016) Mechanical properties of vegetal yarn: Statistical
approach. Compos Part B Eng 106:. https://doi.org/10.1016/j.compositesb.2016.09.033
4. Belaadi A, Amroune S, Bourchak M (2019) Effect of eco-friendly chemical sodium
bicarbonate treatment on the mechanical properties of flax fibres: Weibull statistics. Int J Adv
Manuf Technol. https://doi.org/10.1007/s00170-019-04628-8
5. Zhou Y, Fan M, Chen L (2016) Interface and bonding mechanisms of plant fibre composites:
An overview. Elsevier Ltd
6. Rajmohan T, Vinayagamoorthy R, Mohan K (2019) Review on effect machining parameters on
performance of natural fibre–reinforced composites (NFRCs). J Thermoplast Compos Mater
32:1282–1302. https://doi.org/10.1177/0892705718796541
7. Dutta S, Kim NK, Das R, Bhattacharyya D (2019) Effects of sample orientation on the fire
reaction properties of natural fibre composites. Compos Part B Eng 157:195–206.
https://doi.org/10.1016/j.compositesb.2018.08.118
8. Merli R, Preziosi M, Acampora A, et al (2020) Recycled fibers in reinforced concrete: A
systematic literature review. J Clean Prod. https://doi.org/10.1016/j.jclepro.2019.119207
9. Cherief M, Belaadi A, Bouakba M, et al (2020) Behaviour of lignocellulosic fibre-reinforced
cellular core under low-velocity impact loading: Taguchi method. Int J Adv Manuf Technol.
https://doi.org/10.1007/s00170-020-05393-9
10. Boumaaza M, Belaadi A, Bourchak M (2020) The Effect of Alkaline Treatment on Mechanical
Performance of Natural Fibers-reinforced Plaster: Optimization Using RSM. J Nat Fibers.
https://doi.org/10.1080/15440478.2020.1724236
11. Jaouadi M, M’sahli S, Sakli F (2009) Optimization and Characterization of Pulp Extracted
from the Agave Americana L. Fibers. Text Res J 79:110–120.
https://doi.org/10.1177/0040517508090781
12. Bedjaoui A, Belaadi A, Amroune S, Madi B (2019) Impact of surface treatment of flax fibers
on tensile mechanical properties accompanied by a statistical study. Int J Integr Eng 6:10–17
13. Lotfi A, Li H, Dao DV (2019) Effect of Drilling Parameters on Delamination and Hole Quality
in Drilling Flax Fiber Reinforced Bio-Composites BT - Sustainable Design and Manufacturing
2018. In: Dao D, Howlett RJ, Setchi R, Vlacic L (eds). Springer International Publishing,
Cham, pp 71–81

Page 15 of 42
14. Lotfi A, Li H, Dao DV (2020) Analytical and experimental investigation of the parameters in
drilling flax/poly(lactic acid) bio-composite laminates. Int J Adv Manuf Technol 109:503–521.
https://doi.org/10.1007/s00170-020-05668-1
15. Benzannache N, Belaadi A, Boumaaza M, Bourchak M (2021) Improving the mechanical
performance of biocomposite plaster/ Washingtonian filifira fibres using the RSM method. J
Build Eng 33:. https://doi.org/10.1016/j.jobe.2020.101840
16. Benzidane R, Sereir Z, Bennegadi ML, et al (2018) Morphology, static and fatigue behavior of
a natural UD composite: The date palm petiole ‘wood.’ Compos Struct 203:110–123.
https://doi.org/10.1016/j.compstruct.2018.06.122
17. Djoudi T, Hecini M, Scida D, Djebloun Y (2019) Physico-Mechanical Characterization of
Composite Materials Based on Date Palm Tree Fibers Physico-Mechanical Characterization of
Composite Materials Based on Date Palm Tree Fibers. J Nat Fibers 0:1–14.
https://doi.org/10.1080/15440478.2019.1658251
18. Mercy JL, Sivashankari P, Sangeetha M, et al (2020) Genetic Optimization of Machining
Parameters Affecting Thrust Force during Drilling of Pineapple Fiber Composite Plates – an
Experimental Approach. J Nat Fibers 1–12. https://doi.org/10.1080/15440478.2020.1788484
19. Zhang H, Zhu P, Liu Z, et al (2020) Research on prediction method of mechanical properties of
open-hole laminated plain woven CFRP composites considering drilling-induced delamination
damage. Mech Adv Mater Struct 0:1–16. https://doi.org/10.1080/15376494.2020.1745969
20. Feito N, Díaz-Álvarez J, López-Puente J, Miguelez MH (2018) Experimental and numerical
analysis of step drill bit performance when drilling woven CFRPs. Compos Struct 184:1147–
1155. https://doi.org/10.1016/j.compstruct.2017.10.061
21. Fernández-Pérez J, Cantero JL, Díaz-Álvarez J, Miguélez MH (2017) Influence of cutting
parameters on tool wear and hole quality in composite aerospace components drilling. Compos
Struct 178:157–161. https://doi.org/10.1016/j.compstruct.2017.06.043
22. Feito N, Diaz-Álvarez J, López-Puente J, Miguelez MH (2016) Numerical analysis of the
influence of tool wear and special cutting geometry when drilling woven CFRPs. Compos
Struct 138:285–294. https://doi.org/10.1016/j.compstruct.2015.11.065
23. Feito N, Diaz-Álvarez A, Cantero JL, et al (2016) Experimental analysis of special tool
geometries when drilling woven and multidirectional CFRPs. J Reinf Plast Compos 35:33–55.
https://doi.org/10.1177/0731684415612931
24. Díaz-Álvarez J, Olmedo A, Santiuste C, Miguélez MH (2014) Theoretical estimation of
thermal effects in drilling of woven carbon fiber composite. Materials (Basel) 7:4442–4454.
https://doi.org/10.3390/ma7064442
25. Díaz-Álvarez A, Rodríguez-Millán M, Díaz-Álvarez J, Miguélez MH (2018) Experimental
analysis of drilling induced damage in aramid composites. Compos Struct 202:1136–1144.
https://doi.org/10.1016/j.compstruct.2018.05.068

Page 16 of 42
26. Bayraktar Ş, Turgut Y (2020) Determination of delamination in drilling of carbon fiber
reinforced carbon matrix composites/Al 6013-T651 stacks. Measurement 154:107493.
https://doi.org/https://doi.org/10.1016/j.measurement.2020.107493
27. Geng D, Liu Y, Shao Z, et al (2019) Delamination formation, evaluation and suppression
during drilling of composite laminates: A review. Compos Struct 216:168–186.
https://doi.org/https://doi.org/10.1016/j.compstruct.2019.02.099
28. Belaadi A, Laouici H, Bourchak M (2020) Mechanical and drilling performance of short jute
fibre-reinforced polymer biocomposites: statistical approach. Int J Adv Manuf Technol
106:1989–2006. https://doi.org/10.1007/s00170-019-04761-4
29. Chaitanya S, Singh I (2018) Ecofriendly treatment of aloe vera fibers for PLA based green
composites. Int J Precis Eng Manuf - Green Technol 5:143–150.
https://doi.org/10.1007/s40684-018-0015-8
30. Bajpai PK, Singh I (2013) Drilling behavior of sisal fiber-reinforced polypropylene composite
laminates. J Reinf Plast Compos 32:1569–1576. https://doi.org/10.1177/0731684413492866
31. Bajpai PK, Debnath K, Singh I (2015) Hole making in natural polylactic acid laminates : An
experimental investigation. J Thermoplast Compos Mater 30:1–17.
https://doi.org/10.1177/0892705715575094
32. Debnath K, Sisodia M, Kumar A, Singh I (2016) Damage-Free Hole Making in Fiber-
Reinforced Composites: An Innovative Tool Design Approach. Mater Manuf Process 31:1400–
1408. https://doi.org/10.1080/10426914.2016.1140191
33. Debnath K, Singh I, Dvivedi A (2014) Drilling Characteristics of Sisal Fiber-Reinforced Epoxy
and Polypropylene Composites. Mater Manuf Process 29:1401–1409.
https://doi.org/10.1080/10426914.2014.941870
34. Debnath K, Singh I, Dvivedi A (2017) On the analysis of force during secondary processing of
natural fiber-reinforced composite laminates. Polym Compos 38:164–174.
https://doi.org/10.1002/pc.23572
35. Chaudhary V, Gohil PP (2016) Investigations on Drilling of Bidirectional Cotton Polyester
Composite. Mater Manuf Process 31:960–968.
https://doi.org/10.1080/10426914.2015.1059444
36. Venkateshwaran N, ElayaPerumal A (2013) Hole quality evaluation of natural fiber composite
using image analysis technique. J Reinf Plast Compos 32:1188–1197.
https://doi.org/10.1177/0731684413486847
37. Athijayamani A, Thiruchitrambalam M, Natarajan U, Pazhanivel B (2010) Influence of alkali-
treated fibers on the mechanical properties and machinability of roselle and sisal fiber hybrid
polyester composite. Polym Compos 31:723–731. https://doi.org/10.1002/pc.20853
38. Ramesh M, Sri Ananda Atreya T, Aswin US, et al (2014) Processing and mechanical property
evaluation of banana fiber reinforced polymer composites. Procedia Eng 97:563–572.

Page 17 of 42
https://doi.org/10.1016/j.proeng.2014.12.284
39. Ismail SO, Dhakal HN, Dimla E, et al (2016) Effects of drilling parameters and aspect ratios on
delamination and surface roughness of lignocellulosic HFRP composite laminates. J Appl
Polym Sci 133:. https://doi.org/10.1002/app.42879
40. De Olveira LÁ, Santos JC Dos, Panzera TH, et al (2018) Investigations on short coir fibre-
reinforced composites via full factorial design. Polym Polym Compos 26:391–399.
https://doi.org/10.1177/0967391118806144
41. Abilash N, Sivapragash M (2016) Optimizing the delamination failure in bamboo fiber
reinforced polyester composite. J King Saud Univ - Eng Sci 28:92–102.
https://doi.org/https://doi.org/10.1016/j.jksues.2013.09.004
42. Díaz-Álvarez A, Díaz-Álvarez J, Santiuste C, Miguélez MH (2019) Experimental and
numerical analysis of the influence of drill point angle when drilling biocomposites. Compos
Struct 209:700–709. https://doi.org/10.1016/j.compstruct.2018.11.018
43. Babu GD, Babu KS, Gowd BUM (2012) Effects of drilling parameters on delamination of
hemp fiber reinforced composites. Int J Mech Eng Res Dev 2:1–8
44. Azuan SAS (2013) Effects of Drilling Parameters on Delamination of Coconut Meat Husk
Reinforced Polyester Composites. Adv Environ Biol 7:1097–1100.
https://doi.org/10.1007/978-3-642-38345-8_6
45. Roy Choudhury M, Srinivas MS, Debnath K (2018) Experimental investigations on drilling of
lignocellulosic fiber reinforced composite laminates. J Manuf Process 34:51–61.
https://doi.org/https://doi.org/10.1016/j.jmapro.2018.05.032
46. Belaadi A, Boumaaza M, Amroune S, Bourchak M (2020) Mechanical characterization and
optimization of delamination factor in drilling bidirectional jute fibre-reinforced polymer
biocomposites. Int J Adv Manuf Technol. https://doi.org/10.1007/s00170-020-06217-6
47. Rao YS, Mohan NS, Shetty N, Shivamurthy B (2019) Drilling and structural property study of
multi-layered fiber and fabric reinforced polymer composite - a review. Mater Manuf Process
34:1549–1579. https://doi.org/10.1080/10426914.2019.1686522
48. Azuan SAS, Juraidi JM, Muhamad WMW (2012) Evaluation of Delamination in Drilling Rice
Husk Reinforced Polyester Composites. Appl Mech Mater 232:106–110.
https://doi.org/10.4028/www.scientific.net/AMM.232.106
49. Aravindh S, Umanath K (2015) Delamination in drilling of natural Fibre Reinforced Polymer
Composites produced by Compression moulding. Appl Mech Mater 767:796–800.
https://doi.org/10.4028/www.scientific.net/AMM.766-767.796
50. Sridharan V, Muthukrishnan N (2013) Optimization of machinability of polyester/modified
jute fabric composite using grey relational analysis (GRA). Procedia Eng 64:1003–1012.
https://doi.org/10.1016/j.proeng.2013.09.177
51. Sridharan V, Raja T, Muthukrishnan N (2016) Study of the Effect of Matrix , Fibre Treatment

Page 18 of 42
and Graphene on Delamination by Drilling Jute / Epoxy Nanohybrid Composite. Arab J Sci
Eng 10–14. https://doi.org/10.1007/s13369-015-2005-2
52. Yallew TB, Kumar P, Singh I (2015) A study about hole making in woven jute fabric-
reinforced polymer composites. Proc IMechE Part L J Mater Des Appl 0:1–11.
https://doi.org/10.1177/1464420715587750
53. Monteiro SN, Terrones LAH, D’Almeida JRM (2008) Mechanical performance of coir
fiber/polyester composites. Polym Test 27:591–595.
https://doi.org/10.1016/j.polymertesting.2008.03.003
54. Jayabal S, Natarajan U (2011) Drilling analysis of coir – fibre-reinforced polyester composites.
Bull Mater Sci 34:1563–1567. https://doi.org/doi.org/10.1007/s12034-011-0359-y
55. Durão LMP, Gonçalves DJS, Tavares JMRS, et al (2013) Drilling delamination outcomes on
glass and sisal reinforced plastics. Mater Sci Forum 730–732:301–306.
https://doi.org/10.4028/www.scientific.net/MSF.730-732.301
56. Çelik YH, Alp MS (2020) Determination of Milling Performance of Jute and Flax Fiber
Reinforced Composites. J Nat Fibers 1–15. https://doi.org/10.1080/15440478.2020.1764435
57. Vinayagamoorthy R (2012) Analysis of cutting forces during milling of natural fibered
composites using Fuzzy logic. Int J Compos Mater Manuf
58. Chegdani F, El M, Chebbi A (2021) Cutting behavior of flax fibers as reinforcement of
biocomposite structures involving multiscale hygrometric shear. Compos Part B 211:108660.
https://doi.org/10.1016/j.compositesb.2021.108660
59. Díaz-Álvarez A, Díaz-Álvarez J, Cantero JL, Santiuste C (2020) Analysis of orthogonal cutting
of biocomposites. Compos Struct 234:111734.
https://doi.org/https://doi.org/10.1016/j.compstruct.2019.111734
60. Chandramohan D, Rajesh S (2014) STUDY OF MACHINING PARAMETERS ON
NATURAL FIBER PARTICLE REINFORCED POLYMER COMPOSITE MATERIAL.
Acad J Manuf Eng 12:
61. Rezghi Maleki H, Hamedi M, Kubouchi M, Arao Y (2019) Experimental investigation on
drilling of natural flax fiber-reinforced composites. Mater Manuf Process 34:283–292.
https://doi.org/10.1080/10426914.2018.1532584
62. Nasir AAA, Azmi AI, Khalil ANM (2015) Parametric Study on the Residual Tensile Strength
of Flax Natural Fibre Composites after Drilling Operation. Procedia Manuf 2:97–101.
https://doi.org/https://doi.org/10.1016/j.promfg.2015.07.017
63. Davim JP, Reis P (2003) Drilling carbon fiber reinforced plastics manufactured by autoclave—
experimental and statistical study. Mater Des 24:315–324.
https://doi.org/https://doi.org/10.1016/S0261-3069(03)00062-1
64. Parthipan N, Ilangkumaran M, Maridurai T, Prasanna SC (2020) Effect of Silane Treated
Silicon (IV) Oxide Nanoparticle Addition on Mechanical, Impact Damage and Drilling
Page 19 of 42
Characteristics of Kenaf Fibre-Reinforced Epoxy Composite. Silicon 12:459–467.
https://doi.org/10.1007/s12633-019-00138-0
65. Davim JP, Rubio JC, Abrao AM (2007) A novel approach based on digital image analysis to
evaluate the delamination factor after drilling composite laminates. Compos Sci Technol
67:1939–1945. https://doi.org/https://doi.org/10.1016/j.compscitech.2006.10.009
66. Majumder A (2010) COMPARISON OF ANN WITH RSM IN PREDICTING SURFACE
ROUGHNESS WITH RESPECT TO PROCESS PARAMETERS IN Nd: YAG LASER
DRILLING. Int J Eng Sci Technol 2:5175–5186
67. Karnik SR, Gaitonde VN, Davim JP (2008) A comparative study of the ANN and RSM
modeling approaches for predicting burr size in drilling. Int J Adv Manuf Technol 38:868–883
68. Benardos PG, Vosniakos G-C (2003) Predicting surface roughness in machining: a review. Int
J Mach Tools Manuf 43:833–844. https://doi.org/https://doi.org/10.1016/S0890-
6955(03)00059-2
69. Rezghi Maleki H, Hamedi M, Kubouchi M, Arao Y (2019) Experimental study on drilling of
jute fiber reinforced polymer composites. J Compos Mater 53:283–295
70. Ramesh M, Palanikumar K, Reddy KH (2014) Experimental investigation and analysis of
machining characteristics in drilling hybrid glass-sisal-jute fiber reinforced polymer
composites. In: 5th international & 26th all india manufacturing technology, design and
research conference AIMTDR
71. Vinayagamoorthy R, Rajeswari N, Karthikeyan S (2015) Investigations of damages during
drilling of natural sandwich composites. In: Applied Mechanics and Materials. Trans Tech
Publ, pp 812–817
72. Vinayagamoorthy R, Rajeswari N, Sivanarasimha S, Balasubramanian K (2015) Fuzzy based
optimization of thrust force and torque during drilling of natural hybrid composites. In:
Applied Mechanics and Materials. Trans Tech Publ, pp 265–269
73. Ramnath BV, Sharavanan S, Jeykrishnan J (2017) Optimization of process parameters in
drilling of fibre hybrid composite using Taguchi and grey relational analysis. In: IOP
Conference Series: Materials Science and Engineering. IOP Publishing, p 12003
74. Vinayagamoorthy R (2017) Parametric optimization studies on drilling of sandwich composites
using the Box–Behnken design. Mater Manuf Process 32:645–653.
https://doi.org/10.1080/10426914.2016.1232811
75. Pailoor S, Murthy HNN, Sreenivasa TN (2021) Drilling of In-Line Compression Molded Jute /
Polypropylene Composites. J Nat Fibers 18:91–104.
https://doi.org/10.1080/15440478.2019.1612309
76. Babu J, Sunny T, Paul NA, et al (2016) Assessment of delamination in composite materials: A
review. Proc Inst Mech Eng Part B J Eng Manuf 230:1990–2003.
https://doi.org/10.1177/0954405415619343

Page 20 of 42
77. Vigneshwaran S, John KM, Deepak Joel Johnson R, et al (2020) Conventional and
unconventional machining performance of natural fibre-reinforced polymer composites: A
review. J Reinf Plast Compos. https://doi.org/10.1177/0731684420958103
78. Mohan NS, Kulkarni SM, Ramachandra A (2007) Delamination analysis in drilling process of
glass fiber reinforced plastic (GFRP) composite materials. J Mater Process Technol 186:265–
271. https://doi.org/10.1016/j.jmatprotec.2006.12.043
79. Mudhukrishnan M, Hariharan P, Palanikumar K (2020) Measurement and analysis of thrust
force and delamination in drilling glass fiber reinforced polypropylene composites using
different drills. Meas J Int Meas Confed 149:106973.
https://doi.org/10.1016/j.measurement.2019.106973
80. Chen W-C (1997) Some experimental investigations in the drilling of carbon fiber-reinforced
plastic (CFRP) composite laminates. Int J Mach Tools Manuf 37:1097–1108.
https://doi.org/https://doi.org/10.1016/S0890-6955(96)00095-8

Page 21 of 42
Figure 1: Schematic arrangement of experimental setup.
Biocomposite (jute /polyester)
Ju
te f
ab
ric (
15
5 g
/m2)
Poly
este
r re
sin
Cutting parameters
Spindle speed (N) Feed rate (f) Brad & Spur drill
Image J Analysis
Drilling behavior
Geometry of Brad & Spur drill
Numerical image
processing operation

Page 22 of 42
Figure 2. Typical holes drilled on jute fabric/polyester biocomposites for three test (#3, #12
and #21): (a) entrance, (b) exit and typical damage in drilling and (c) determination of
different parameters for calculation the delamination factors at the drill and resulting image
obtained with ImageJ software.

Page 23 of 42
Figure. 3 (a–c) Normal probability distribution and (d–f) predicted vs. actual values for different Fd method evaluated.
Internally Studentized Residuals
Norm
al %
Pro
babili
ty
Normal Plot of Residuals
-3.00 -2.00 -1.00 0.00 1.00 2.00 3.00
1
5
10
20
30
50
70
80
90
95
99
Actual
Pre
dic
ted
Predicted vs. Actual
1
1.2
1.4
1.6
1.8
2
1 1.2 1.4 1.6 1.8 2
Internally Studentized Residuals
Norm
al %
Pro
babili
ty
Normal Plot of Residuals
-3.00 -2.00 -1.00 0.00 1.00 2.00
1
5
10
20
30
50
70
80
90
95
99
Actual
Pre
dic
ted
Predicted vs. Actual
1
1.5
2
2.5
3
3.5
1 1.5 2 2.5 3 3.5
Externally Studentized Residuals
Norm
al %
Pro
babili
ty
Normal Plot of Residuals
-3.00 -2.00 -1.00 0.00 1.00 2.00
1
5
10
20
30
50
70
80
90
95
99
Actual
Pre
dic
ted
Predicted vs. Actual
1
1.2
1.4
1.6
1.8
2
2.2
1 1.2 1.4 1.6 1.8 2 2.2
Color poinFd-1:
1.887
1.118
Color poinFd-2:
3.074
1.117
Color poinFd-3:
2.025
1.011
(c)
(d) (a)
(b) (e)
(f)

Page 24 of 42
Figure 4 : Contour plots for predicted data of the different Fd evaluated as a function of the cutting parameters of the biocomposites produced: (a-c) Fd1 data, (d-f) Fd2 data et (g-i) Fd3
data.
50 70 90 110 130 150 170 190
355
564
773
982
1191
1400Fd-1
A: f (mm/min)
B: N
(re
v/m
in)
1.1
1.2
1.3
1.4
1.5
50 70 90 110 130 150 170 190
355
564
773
982
1191
1400Fd-2
A: f (mm/min)
1.2
1.41.6
1.8
2
2
50 70 90 110 130 150 170 190
355
564
773
982
1191
1400Fd-3
A: f (mm/min)
1.1 1.21.3
50 70 90 110 130 150 170 190
5
6
7
8
9
10Fd-1
A: f (mm/min)
C: d (
mm
)
1.21.4
1.6
1.8
1.8
50 70 90 110 130 150 170 190
5
6
7
8
9
10Fd-2
A: f (mm/min)
1.5
2
2.5
3
50 70 90 110 130 150 170 190
5
6
7
8
9
10Fd-3
A: f (mm/min)
1.2
1.4
1.6
1.8
355 564 773 982 1191 1400
5
6
7
8
9
10Fd-1
B: N (rev/min)
C: d (
mm
)
1.2
1.4
1.4
1.6
1.6
1.8
355 564 773 982 1191 1400
5
6
7
8
9
10Fd-2
B: N (rev/min)
1.5
2
2.5
355 564 773 982 1191 1400
5
6
7
8
9
10Fd-3
B: N (rev/min)
1.1
1.2
1.3
1.4
1.5
1.6
Color poinFd-1:
1.887
1.118
Color poinFd-2:
3.074
1.117
Color poinFd-3:
2.025
1.011
(a) (b) (c)
(d) (e) (f)
(g) (h) (i)

Page 25 of 42
Fig. 5 ANN architecture used for (a) Fd1, (b) Fd2 and (b) Fd3.
(a) (b)
(c)

Page 26 of 42
Fig. 6: Regression validation scheme of (a-c) Fd1 data, (d-f) Fd2 data et (g-i) Fd3 data.
(a) (b) (c)
(d) (e) (f)
(g) (h) (i)

Page 27 of 42
Figure 7 : Comparison between experimental and predicted Fd with RSM and ANN models (a) Fd1 data, (b) Fd2 data and (b) Fd3 data.
(a) (b)
(c)

Page 28 of 42
Figure 8 : Comparison between 3D surface plots of delamination factor for Fd1 versus f, N
and d of biocomposites elaborated (a-c) RSM and (d-f) ANN models.

Page 29 of 42
Figure 9 : Comparison between 3D surface plots of delamination factor for Fd2 versus f, N
and d of biocomposites elaborated (a-c) RSM and (d-f) ANN models.

Page 30 of 42
Figure 10 : Comparison between 3D surface plots of delamination factor for Fd3 versus f, N
and d of biocomposites elaborated (a-c) RSM and (d-f) ANN models.
Page 31 of 42
Figure 11. Fd residuals for RSM and ANN (a) Fd1 data, (b) Fd2 data and (b) Fd3 data.
5 10 15 20 25
-0,10
-0,05
0,00
0,05
0,10
% E
rro
r F
d1
Order
ANN RSM(a)
5 10 15 20 25
-0,2
-0,1
0,0
0,1
0,2
% E
rro
r F
d2
Order
ANN RSM(b)
5 10 15 20 25
-0,20
-0,15
-0,10
-0,05
0,00
0,05
0,10
0,15
0,20
0,25
% E
rro
r F
d3
Order
ANN RSM(c)

Page 32 of 42
Figure 12: Contour plot of desirability for different Fd method evaluated.
50 70 90 110 130 150 170 190
355
564
773
982
1191
1400Fd-1
A: f (mm/min)
B:
N (
rev/m
in)
1.1
1.2
1.3
1.4
1.5
Prediction 1.18368
50 70 90 110 130 150 170 190
355
564
773
982
1191
1400Fd-2
A: f (mm/min)
B:
N (
rev/m
in)
1.2
1.41.6
1.8
2
2
Prediction 1.14746
50 70 90 110 130 150 170 190
355
564
773
982
1191
1400Fd-3
A: f (mm/min)
B:
N (
rev/m
in)
1.1 1.21.3
Prediction 1.01084
Color poinFd-1:
1.887
1.118
Color poinFd-2:
3.074
1.117
Color poinFd-3:
2.025
1.011
(a) (b)
(c)

Page 33 of 42
(a)
(b)
(c)

Page 34 of 42
Figure 13. Ramp function graph of multi-objective optimization for different Fd method
evaluated (a) Fd1 data, (b) Fd2 data, (c) Fd3 data and (d) Combination data
(d)

Page 35 of 42
Table 1 Process parameters available in open literature for drilling of jute fibre-reinforced polymer composites
Matrix Fibre Fibre
content
(% w/w)
Cutting parameters References Tool material Drill
diameter
d (mm)
Feed rate
f (mm/rev)
Spindle Speed
N (rpm)
Epoxy Unidirectional Jute - HSS twist drills 6, 8, 10 50, 150, 250 (mm/min) 1000, 2000, 3000 [49] Polyester Treated and untreated Jute fabric 30 HSS twist drill 6 0,03, 0,06, 0,09, 0,12 9,42, 15,07, 20,72, 26,36 (m/min) [50] Epoxy and Polyester
Treated and untreated Jute fabric 30 HSS twist drill
6 0,03, 0,06, 0,09, 0,12 500, 800, 1100, 1400
[51]
Polypropylene Jute fabric 30, 40, 50 Twist drills Jo drills, parabolic drills
8 0,05, 0,12, 0,19 900, 1800 2800
[52]
Epoxy Jute fabric 43 HSS twist drill CoroDrill 854, N2OC CoroDrill 856, N2OC
8 0,05, 0,10, 0,15 750, 1250, 1750 [69]
Polyester Glass-sisal-jute - Brad & Spur, coated carbide 6, 9, 12 0,04, 0,06, 0,08 1000, 2000, 3000 [70] Vinyl-ester Untreated Vetiver- jute-glass - Twist drills, 60°, 90°,120°, 150° 10 0,1, 0,2, 0,3, 0,4 500, 1000, 1500, 2000 [71] Vinyl-ester Treated (NaOH) Vetiver- jute-glass - Twist drills, 60°, 90°,120°, 150° 10 0,1, 0,2, 0,3, 0,4 500, 1000, 1500, 2000 [72] Epoxy Glass-flax-jute Drill bit carbide 6, 8, 10 0,1, 0,2, 0,3 600, 1200 1800 [73] Polyester Short jute fibre 5, 10 and 15 mm 40 Brad & Spur drills Twist drills 5, 7, 10 50, 108, 190 (mm/min) 355, 710, 1400 [28] Epoxy Jute fabric (210 g/m2) 40 Brad & Spur drills
Twist drills (HSS) Twist drills (HSS-TiN)
5, 7, 10 50, 108, 190 (mm/min) 355, 710, 1400
[46]
Polyester Jute fabric and steel fibres HSS, 90°,120°,150° 8,10,12 0,1, 0,2, 0,3 500, 1250, 2000 [74] Polypropylene Unidirectional Jute 30 HSS, Co-HSS 2, 3, 4 0,1, 0,2, 0,3 600, 1260 2700 [75] Epoxy Jute and flax fabric - HSS, HSS-TiN, WC 4 0,01, 0,015, 0,020 2500, 5000, 7500 [56] Polyester Jute fabric (155 g/m2) 30 Brad & Spur drills 5, 7, 10 50, 108, 190 (mm/min) 355, 710, 1400 This work
CS: solid carbide; CSC: TiN coated solid carbide; HSS: High-speed steel; Brad & Spur drill: BSD

36
Table 2. Different delamination measuring equations [76–80].
Method
estimation
Assessment parameter Formula
Fd1 Delamination factor (diameter) 𝐹𝑑 = 𝐷𝑚𝑎𝑥𝐷
Fd2 Delamination factor (area) 𝐹𝑑 = 𝐴𝑚𝑎𝑥𝐴0
Fd3 Delamination factor (area) 𝐹𝑑 = 𝐴𝑑𝐴0
A0: drilled area (hole area) Ad: delamination area in the vicinity of the drilled hole Amax : delamination area related to Dmax
D: nominal diameter of drilled hole
Dmax: maximum diameter of delamination Fd : conventional delamination factor
Table 3. Experimental results for delamination factor of the drilled holes at the exit.
Experiment
number
Input variables Output variables
f
(mm/min)
N
(rev/min)
d
(mm) Fd1 Fd2 Fd3
1 50 355 5 1.12 1.12 1.02
2 108 355 5 1.45 1.54 1.14
3 190 355 5 1.64 2.17 1.44
4 50 710 5 1.18 1.25 1.08
5 108 710 5 1.46 1.75 1.17
6 190 710 5 1.53 2.18 1.38
7 50 1400 5 1.13 1.38 1.01
8 108 1400 5 1.24 1.68 1.09
9 190 1400 5 1.30 1.90 1.38
10 50 355 7 1.66 1.90 1.28
11 108 355 7 1.83 2.11 1.37
12 190 355 7 1.85 2.77 1.40
13 50 710 7 1.72 1.59 1.11
14 108 710 7 1.85 1.61 1.30
15 190 710 7 1.89 1.68 1.56
16 50 1400 7 1.59 2.10 1.29
17 108 1400 7 1.83 2.29 1.49
18 190 1400 7 1.82 2.66 1.64
19 50 355 10 1.33 2.35 1.38
20 108 355 10 1.47 2.90 1.52
21 190 355 10 1.49 2.94 1.78
22 50 710 10 1.43 2.68 1.54
23 108 710 10 1.45 2.90 1.73
24 190 710 10 1.51 2.96 1.82
25 50 1400 10 1.73 2.88 1.68
26 108 1400 10 1.76 2.87 1.71
27 190 1400 10 1.84 3.07 2.02

37
Table 4. Design of experiments.
n° Factors Notation Units Levels
L1 L2 L3 1 Spindle speed N rev/min 355 710 1400 2 Feed rate f mm/min 50 108 190 3 Drill diameter d mm 5 7 10
Table 5. Mathematical models for different delamination factors for drilling of jute fabric /polyester biocomposite.
RSM
response
Fd1
−1.90932 + 7.86866 × 10⁻³ × 𝑓 − 6.23020 × 10⁻⁴ × 𝑁 + 0.87873 × 𝑑 − 7.06429 × 10⁻⁷ × 𝑓 × 𝑁 − 3.01359 × 10⁻⁴ × 𝑓 × 𝑑 + 1.07601 × 10⁻⁴ × 𝑁 × 𝑑 − 1.46448 × 10⁻⁵ × 𝑓2− 2.28431 × 10⁻⁸ × 𝑁2 − 0.059233 × 𝑑2
Fd2
0.12200 + 0.012543 × 𝑓 − 1.07049 × 10⁻³ × 𝑁 + 0.14591 × 𝑑 − 2.36589 × 10⁻⁶ × 𝑓 × 𝑁 − 6.67351 × 10⁻⁴ × 𝑓 × 𝑑 + 3.07495 × 10⁻⁵ × 𝑁 × 𝑑 − 6.93560 × 10⁻⁶ × 𝑓2+ 7.00806 × 10⁻⁷ × 𝑁2 + 9.40370 × 10⁻³ × 𝑑2
Fd3
0.70471+ 1.64052 × 10⁻³ × 𝑓 − 2.69733 × 10⁻⁴ × 𝑁 + 0.047514 × 𝑑+ 2.92946 × 10⁻⁷ × 𝑓 × 𝑁 − 2.6833 × 10⁻⁵ × 𝑓 × 𝑑 + 5.07080 × 10⁻⁵ × 𝑁 × 𝑑 − 3.02775 × 10⁻⁶ × 𝑓2 − 1.81812× 10⁻⁸ × 𝑁2 + 9.11111 × 𝑑2
38
Table 6. ANOVA for the response surface quadratic model for different delamination factors.
Source DF SS MS F-value P-value Cont. % Remarks
a) ANOVA for delamination factor Fd1
Model 9 1.41 0.16 36.46 < 0.0001 Significant f 1 0.19 0.19 43.47 < 0.0001 12.02 Significant N 1 0.017 0.017 3.94 0.0634 0.18 d 1 0.26 0.26 60.12 < 0.0001 60.77 Significant
f × N 1 8.367E-003 8.367E-003 1.94 0.1814 0.09 f×d 1 0.034 0.034 7.93 0.0119 0.36 Significant N×d 1 0.25 0.25 57.66 < 0.0001 2.66 Significant f×f 1 0.029 0.029 6.69 0.0192 0.31 Significant
N×N 1 1.816E-004 1.816E-004 0.042 0.8398 0.00 d×d 1 0.75 0.75 173.57 < 0.0001 7.98 Significant
Error 17 0.073 4.309E-003 Total 26 1.49
SD= 0.066 Mean = 1.56 Coefficient of variation = 4.21% Predicted residual error of sum of squares (PRESS) = 0.21
R2= 95.07% R2 adjusted = 92.47% R2 predicted = 85.60% Adequate precision = 20.749
c) ANOVA for delamination factor Fd2
Model 9 8.38 0.93 15.61 < 0.0001 Significant f 1 1.24 1.24 20.83 0.0003 13.19 Significant N 1 0.055 0.055 0.92 0.3515 0.59 d 1 6.03 6.03 100.99 < 0.0001 64.15 Significant
f× N 1 0.094 0.094 1.57 0.2268 1.00 f×d 1 0.17 0.17 2.81 0.1122 1.81 N×d 1 0.020 0.020 0.34 0.5675 0.21 f×f 1 6.465E-003 6.465E-003 0.11 0.7461 0.07
N× N 1
0.17 0.17 2.86 0.1088 1.81
d×d 1 0.019 0.019 0.32 0.5814 0.20 Error 17 1.01 0.060 Total 26 9.40
SD= 0.24 Mean 2.19 Coefficient of variation = 11.13% Predicted residual error of sum of squares (PRESS) = 2.25
R2= 89.21% R2 adjusted = 83.49% R2 predicted = 76.07% Adequate precision = 12.8777
c) ANOVA for delamination factor Fd3
Model 9 1.77 0.20 41.58 < 0.0001 Significant f 1 0.51 0.51 106.87 < 0.0001 5.43 Significant N 1 0.063 0.063 13.29 0.0020 0.67 Significant d 1 1.16 1.16 244.16 < 0.0001 58.34 Significant
f× N 1 1.439E-003 1.439E-003 0.30 0.5887 0.02 f×d 1 2.708E-004 2.708E-004 0.057 0.8139 0.00 N×d 1 0.055 0.055 11.65 0.0033 0.59 Significant f×f 1 1.232E-003 1.232E-003 0.26 0.6166 0.01
N× N 1
1.151E-004 1.151E-004 0.024 0.8780 0.00
d×d 1 1.769E-004 1.769E-004 0.037 0.8490 0.00 Error 17 0.081 4.737E-003 Total 26 1.85
SD= 0.069 Mean 1.42 Coefficient of variation = 4.85% Predicted residual error of sum of squares (PRESS) = 0.18
R2= 96.65% R2 adjusted = 93.35% R2 predicted = 90.14% Adequate precision = 24.004

39
Table 7. ANN tested architectures MSE and R-values for training, validation and testing of Fd1, Fd2 and Fd3.
Model Network Structure Percentage Samples RMSE R value
Fd1
3-10-1
Training 80 21 4.47413E-4 9.96034E-1 Validation 10 3 5.73370E-3 9.00364E-1
Testing 10 3 5.26047E-3 9.62397E-1
Fd2
3-11-1
Training 75 20 1.39890E-2 9.83323E-1 Validation 10 3 3.58284E-2 9.39395E-1 Testing 15 4 1.46822E-1 8.68254E-1
Fd3
3-11-1 Training 75 21 2.92196E-3 9.82227E-1 Validation 10 3 3.42195E-3 9.62655E-1 Testing 15 3 7.23046E-3 9.99763E-1

40
Table 8. Mathematical models for different delamination factors Fd for drilling of jute fabric /polyester biocomposite obtained with ANN Method.
ANN
response
Fd1 −1.6398 × 𝐻1 + 0.1493 × 𝐻2 − 1.2052 × 𝐻3 − 0.7614 × 𝐻4 − 0.3814 × 𝐻5 + 1.2643 × 𝐻6 + 1.4256× 𝐻7 + 0.4444 × 𝐻8 − 0.0256 × 𝐻9 − 0.4312 × 𝐻10 + 0.9798
{ 𝐻1 = tanh(0.5 × (0.0032 × 𝑁 − 0.0001 × 𝑓 + 0.6634 × 𝑑 − 4.4658)) 𝐻2 = tanh(0.5 × (−0.0158 × 𝑁 − 0.0014 × 𝑓 − 0.5497 × 𝑑 + 7.6695)) 𝐻3 = tanh(0.5 × (−0.0071 × 𝑁 + 0.0008 × 𝑓 − 0.4698 × 𝑑 + 3.2338)) 𝐻4 = tanh(0.5 × (−0.0051 × 𝑁 − 0.0023 × 𝑓 − 0.3416 × 𝑑 + 7.7537)) 𝐻5 = tanh(0.5 × (−0.0167 × 𝑁 + 0.0002 × 𝑓 + 0.2674 × 𝑑 − 1.3141)) 𝐻6 = tanh(0.5 × (−0.0080 × 𝑁 − 0.0016 × 𝑓 − 0.0799 × 𝑑 + 4.7291)) 𝐻7 = tanh(0.5 × ( 0.0066 × 𝑁 − 0.0004 × 𝑓 + 1.0907 × 𝑑 − 7.1045)) 𝐻8 = tanh(0.5 × (−0.0006 × 𝑁 + 0.0052 × 𝑓 − 0.2445 × 𝑑 − 2.6163)) 𝐻9 = tanh(0.5 × (−0.0174 × 𝑁 − 0.0039 × 𝑓 + 0.4714 × 𝑑 + 2.2667)) 𝐻10 = tanh(0.5 × (0.02066 × 𝑁 − 0.0019 × 𝑓 + 1.3044 × 𝑑 − 10.5202))
Fd2 0.1856 × 𝐻1 − 1.3672 × 𝐻2 + 0.3959 × 𝐻3 + 3.4304 × 𝐻4 + 1.4228 × 𝐻5 − 0.1183 × 𝐻6 − 1.5498× 𝐻7 + 0.5441 × 𝐻8 + 1.8424 × 𝐻9 − 3.3793 × 𝐻10 − 0.0453 × 𝐻11 + 1.8329
{ 𝐻1 = tanh(. 5 × (0.0168 × 𝑁 + 0.0013 × 𝑓 + 1.0404 × 𝑑 − 10.0074)) 𝐻2 = tanh(. 5 × (−0.0015 × 𝑁 − 0.0030 × 𝑓 + 0.8445 × 𝑑 − 1.8146)) 𝐻3 = tanh(. 5 × (−0.0219 × 𝑁 + 0.0020 × 𝑓 + 0.5208 × 𝑑 − 2.3531)) 𝐻4 = tanh(. 5 × (0.0060 × 𝑁 + 0.0010 × 𝑓 + 0.3422 × 𝑑 − 2.0797)) 𝐻5 = tanh(. 5 × (−0.0025 × 𝑁 − 0.0047 × 𝑓 − 0.7390 × 𝑑 + 7.4919)) 𝐻6 = tanh(. 5 × (0.0334 × 𝑁 − 0.0021 × 𝑓 + 0.8752 × 𝑑 − 8.1817)) 𝐻7 = tanh(. 5 × (−0.0025 × 𝑁 + 0.0010 × 𝑓 − 0.2736 × 𝑑 + 1.5680)) 𝐻8 = tanh(. 5 × (0.0025 × 𝑁 + 0.0019 × 𝑓 − 0.4599 × 𝑑 + 2.1186)) 𝐻9 = tanh(. 5 × (−0.0028 × 𝑁 − 0.0023 × 𝑓 + 0.2517 × 𝑑 + 0.8347)) 𝐻10 = tanh(. 5 × (−0.0007 × 𝑁 − 0.0009 × 𝑓 − 0.0955 × 𝑑 + 2.3405)) 𝐻11 = tanh(. 5 × (−0.0298 × 𝑁 + 0.0005 × 𝑓 − 0.2519 × 𝑑 + 6.3235))
Fd3 −0.0294 × 𝐻1 + 0.4314 × 𝐻2 − 0.3314 × 𝐻3 + 0.2097 × 𝐻4 − 1.1851 × 𝐻5 − 0.3202 × 𝐻6 + 0.6172× 𝐻7 − 0.8388 × 𝐻8 + 1.2221 × 𝐻9 + 0.1085 × 𝐻10 + 0.3920 × 𝐻11 + 2.5024
{ 𝐻1 = tanh(. 5 × ( 0.0009 ×𝑁 − 0.00004 × 𝑓 − 0.0116 × 𝑑 + 0.0701)) 𝐻2 = tanh(. 5 × (−0.0006 ×𝑁 + 0.00008 × 𝑓 + 0.0171 × 𝑑 − 0.3091)) 𝐻3 = tanh(. 5 × (−0.0007 ×𝑁 + 0.00001 × 𝑓 − 0.0234 × 𝑑 + 0.4472)) 𝐻4 = tanh(. 5 × (0.0009 ×𝑁 − 0.00006 × 𝑓 + 0.0095 × 𝑑 − 0.3226)) 𝐻5 = tanh(. 5 × (−0.0010 ×𝑁 − 0.00011 × 𝑓 − 0.0589 × 𝑑 + 1.1869)) 𝐻6 = tanh(. 5 × (−0.0022 ×𝑁 + 0.00024 × 𝑓 − 0.0029 × 𝑑 + 0.2842)) 𝐻7 = tanh(. 5 × (0.0004 ×𝑁 − 0.00003 × 𝑓 + 0.0219 × 𝑑 − 0.4857)) 𝐻8 = tanh(. 5 × (−0.0001 ×𝑁 − 0.00002 × 𝑓 − 0.0446 × 𝑑 + 0.8271)) 𝐻9 = tanh(. 5 × (0.0011 ×𝑁 + 0.00007 × 𝑓 + 0.0582 × 𝑑 − 1.1684)) 𝐻10 = tanh(. 5 × (0.0001 ×𝑁 − 0.00006 × 𝑓 − 0.0010 × 𝑑 − 0.0102)) 𝐻11 = tanh(. 5 × (0.0009 ×𝑁 − 0.00005 × 𝑓 + 0.0146 × 𝑑 − 0.3994))

41
Table 9. Comparison between RSM and ANN approach for different Fd.
Fd1 Fd2 Fd3
Order EXP RSM ANN EXP RSM ANN EXP RSM ANN
1 1.12 1.24 1.12 1.12 1.25 1.15 1.02 1.05 1.09 2 1.45 1.46 1.45 1.54 1.67 1.54 1.14 1.17 1.21 3 1.64 1.60 1.68 2.17 2.19 2.17 1.44 1.37 1.39 4 1.18 1.19 1.18 1.25 1.15 1.25 1.08 1.04 1.01 5 1.46 1.39 1.46 1.75 1.52 1.51 1.17 1.16 1.12 6 1.53 1.52 1.66 2.18 1.97 1.86 1.38 1.38 1.35 7 1.13 1.07 1.13 1.38 1.45 1.38 1.01 1.01 1.08 8 1.24 1.25 1.25 1.68 1.73 1.68 1.09 1.15 1.17 9 1.30 1.33 1.31 1.90 2.05 1.90 1.38 1.38 1.35
10 1.66 1.62 1.66 1.90 1.72 1.90 1.28 1.20 1.22 11 1.83 1.81 1.83 2.11 2.07 2.11 1.37 1.31 1.32 12 1.85 1.90 1.85 2.77 2.47 2.47 1.40 1.51 1.51 13 1.72 1.65 1.65 1.59 1.64 1.41 1.11 1.22 1.18 14 1.85 1.82 1.86 1.61 1.94 1.61 1.30 1.35 1.32 15 1.89 1.89 1.81 1.68 2.28 1.78 1.56 1.56 1.53 16 1.59 1.68 1.59 2.10 1.99 2.10 1.29 1.27 1.31 17 1.83 1.82 1.83 2.29 2.19 2.40 1.49 1.40 1.44 18 1.82 1.85 1.81 2.66 2.40 2.49 1.64 1.63 1.64 19 1.33 1.31 1.34 2.35 2.57 2.71 1.38 1.43 1.49 20 1.47 1.44 1.47 2.90 2.80 2.90 1.52 1.55 1.61 21 1.49 1.46 1.54 2.94 3.04 2.94 1.78 1.74 1.77 22 1.43 1.45 1.33 2.68 2.53 2.72 1.54 1.52 1.58 23 1.45 1.56 1.44 2.90 2.70 2.90 1.73 1.64 1.73 24 1.51 1.56 1.51 2.96 2.88 2.96 1.82 1.84 1.90 25 1.73 1.70 1.73 2.88 2.94 2.88 1.68 1.66 1.60 26 1.76 1.79 1.76 2.87 3.02 2.96 1.71 1.80 1.75 27 1.84 1.75 1.85 3.07 3.06 3.07 2.02 2.02 1.97
Table 10. Goals and parameter ranges for optimization of cutting conditions for different Fd.
Condition Goal Lower limit Upper limit
Feed rate, f (mm/min) Is in range 50 190 Spindle speed, N (rev/min) Is in range 355 1400 Drill, d (mm) Is in range 5 10
Fd1 Minimize 1.011 1.782
Fd2 Minimize 1.011 1.782
Fd3 Minimize 1.089 2.029

42
Table 11. Response optimization for response parameters using RSM for different Fd.
Test n°
Machining parameters
Response parameters Desirability f
(mm/min) N
(rev/min) d
(mm) Fd1 Fd2 Fd3
1 50.000 1085.886 5.000 1.127 1.232 1.025 0.972 2 50.000 1089.754 5.000 1.127 1.234 1.025 0.972 3 50.000 1081.805 5.000 1.128 1.230 1.025 0.972 4 50.000 1067.066 5.000 1.131 1.223 1.026 0.971 5 50.001 1107.844 5.000 1.124 1.243 1.024 0.971 6 50.000 1116.723 5.000 1.122 1.248 1.024 0.971 7 50.000 1054.089 5.000 1.133 1.217 1.026 0.971 8 50.000 1041.842 5.000 1.135 1.212 1.027 0.971 9 50.001 1133.836 5.000 1.119 1.257 1.023 0.971
10 50.000 1035.703 5.000 1.136 1.209 1.027 0.971
Table 12. Comparing the response optimization techniques RSM, GA and fmincon optimization for different Fd.
Machining parameters
Response parameters
f
(mm/min) N
(rev/min) d
(mm) Fd Response
RSM optimization 56.535 1340.801 5.003 1.109 Fd1 50.000 738.491 5.000 1.147 Fd2 50.046 1392.963 5.002 1.011 Fd3
GA optimization 66.422 857.25 7.201 1.098 Fd1 160.01 1369.21 8.161 1.841 Fd2 50.109 365.12 5.124 1.650 Fd3
fmincon optimization 50.000 841.118 7.147 1.044 Fd1 50.005 356.02 5.004 1.705 Fd2 50.044 349.92 5.001 1.590 Fd3
Figures
Figure 1
Schematic arrangement of experimental setup.

Figure 2
Typical holes drilled on jute fabric/polyester biocomposites for three test (#3, #12 and #21): (a) entrance,(b) exit and typical damage in drilling and (c) determination of different parameters for calculation thedelamination factors at the drill and resulting image obtained with ImageJ software.
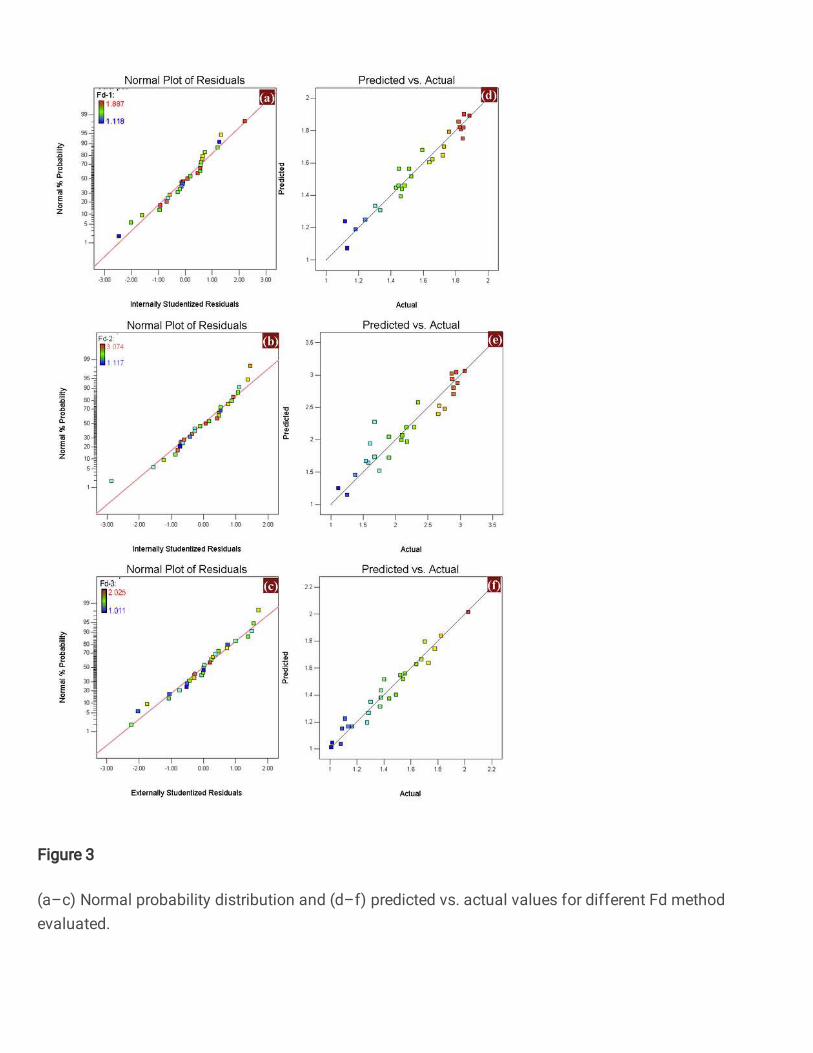
Figure 3
(a–c) Normal probability distribution and (d–f) predicted vs. actual values for different Fd methodevaluated.

Figure 4
Contour plots for predicted data of the different Fd evaluated as a function of the cutting parameters ofthe biocomposites produced: (a-c) Fd1 data, (d-f) Fd2 data et (g-i) Fd3 data.

Figure 5
ANN architecture used for (a) Fd1, (b) Fd2 and (b) Fd3.
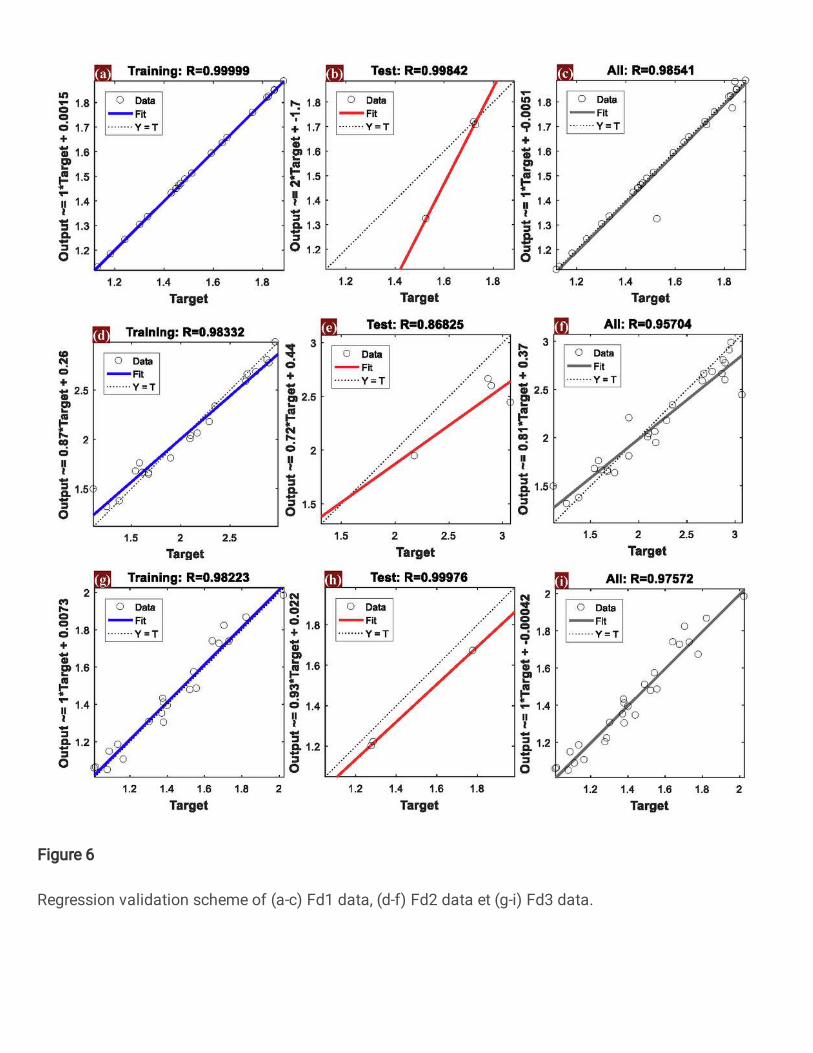
Figure 6
Regression validation scheme of (a-c) Fd1 data, (d-f) Fd2 data et (g-i) Fd3 data.

Figure 7
Comparison between experimental and predicted Fd with RSM and ANN models (a) Fd1 data, (b) Fd2data and (b) Fd3 data.

Figure 8
Comparison between 3D surface plots of delamination factor for Fd1 versus f, N and d of biocompositeselaborated (a-c) RSM and (d-f) ANN models.

Figure 9
Comparison between 3D surface plots of delamination factor for Fd2 versus f, N and d of biocompositeselaborated (a-c) RSM and (d-f) ANN models.

Figure 10
Comparison between 3D surface plots of delamination factor for Fd3 versus f, N and d of biocompositeselaborated (a-c) RSM and (d-f) ANN models.

Figure 11
Fd residuals for RSM and ANN (a) Fd1 data, (b) Fd2 data and (b) Fd3 data.

Figure 12
Contour plot of desirability for different Fd method evaluated.

Figure 13
Ramp function graph of multi-objective optimization for different Fd method evaluated (a) Fd1 data, (b)Fd2 data, (c) Fd3 data and (d) Combination data