Embed Size (px)
Citation preview

Agricultural Productivity and Natural Resource Endowments
Philip Pardey University of Minnesota
The National Academies workshop A Sustainability Challenge: Food Security for All, May 2, 2011
Venable LLP Conference Center, Washington D.C.

Critical Questions
• What are the past and prospective rates of agricultural productivity growth?
• Is growth slowing, stagnating, or increasing?
• Where in the world is this happening (at what scale)?
• What commodities are performing better than others?
• What is the (past and prospective) relative rates of growth of productivity (supply) vs demand

Critical Questions (contd).
• How has, and likely will, the endowment of natural resources change over time?
• within and outside the extent of agriculture
• What is the link between
• the nature, size, and location of natural resource endowments and the flows of services from those natural resources, and
• the flow of services and agricultural productivity (and vice versa)

Vice versa? -- Productivity to Natural Resources Linkages
Put another way, thanks to the agricultural productivity increases made possible through research and new technology development since 1990, an area greater than all the land in the 26 states east of the Mississippi River, has been spared for other uses. Imagine the environmental disaster that would have occurred if hundreds of millions of environmentally fragile acres, not suited to farming, had been ploughed up and brought into production. Think of the soil erosion, loss of forests and grasslands, and biodiversity, and extinction of wildlife species that would have ensued!
Norman Borlaug, Foreword
Persistence Pays 2001
Critical Indicators
• What is produced?
• Crop and livestock choice (variety and breed)
• Where is it produced?
• Location, location, location
• How is it produced?
• Input composition and intensity
• “Intensive” vs “extensive”
• Continuous cropping vs rotation vs intercropped
• Crop-livestock interactions
• Land, labor •Capital, materials • Farm produced (seed,
feed, traction) •Natural inputs

ECON 101 – Measures of Productivity
TFP (total factor productivity) = Q
X
MFP (multi-factor productivity) = i
i
QX i = included outputs and inputs
ee
Q (excluded outputs as a share of total outputs)
ee
Xx
X (excluded inputs as a share of total inputs)
i e
i e
Q Q QTFP
XX X
Difference between growth in TFP and growth in MFP
ln ln ( ln ln ) ( ln ln )e e i e e id TFP d MFP q d Q d Q x d X d X

Natural Inputs • Key to the nexus between productivity and
environmental endowments and flows
• Weather (rainfall, sunlight, day length, wind)
• Terrain (slope, elevation)
• Soil (type, depth, organic and nutrient content)
• Pests and diseases (Exputs)
All these natural inputs vary across time and space

Getting the Temporal Calibration Right
(i.e., changes the technical relationship between inputs and outputs)
Productivity Change Technical Change R&D

Aggregate R&D Spending -Productivity Lag
Source: Alston, Pardey and Ruttan (2008) and Alston et al. (2010)
34
5 years
0.00
0.02
0.04
0.06
0.08
0.10
0 10 20 30 40 50
Lag Weights
Year
Gamma (Alston, Andersen, James & Pardey 2010)
Trapezoidal (Huffman & Evenson 1993 & 2006)
(Griliches 1959)
(Pardey and Craig 1989) ≥ 30 Years
50 Years

Illustrative Technology Development Lags
Source: Alston, Pardey and Ruttan (2008) and Alston et al. (2010)
1877Beal conducts first controlled
crosses/hybrid vigor
1905-1912Shull developed correct understanding of
inbreeding and cross breeding
1917 James developed double cross-hybrid
1922Iowa State station began corn in-breeding
program
1933First commercial planting of Hybrid Iowa
939 developed by Merle Jenkins
1936
First release of a widely popular double-
cross hybrid developed at Purdue
University
1960Vastly improved in-breds led to shift to
single-cross hybrids
1960 95 percent of U.S. corn acreage in hybrids
Hybrid Corn
1901Bacillus thuringiensis (Bt) discovered in
Japan (and 1911 in Germany)
1950s Bt used as a control agent and registered
1986 Cry1Ab gene sequence published
1986Cry1Ab cloned into root colonyzing
Pseudomonas bacteria
1992YieldGard insect protected corn event
Mon810 produced by "gene gun"
1996FDA, USDA & EPA approvals for Yield
Guard
1997Bt corn (corn borer protection)
commercialized in U.S.
1998Stacked with other traits (e.g. herbicide
tolerance)
2004U.S. patent issued to Monsanto for
Mon810
2008 Regulatory approval in 20 countries
Bt Corn
1970Glyphosphate shown to have herbicidal
activity
1976 Roundup herbicide commercialized in U.S.
1980Idnetification of 3 mechanisms to infer
glyphosphate tolerance
Late 1980sSeveral genes encoding glyphospate
insensitivity isolated
1987 First soybean transformation achieved
1990 & 91 Glyphosphate tolerant seeds evaluated
1996 Roundup Ready Soybeans commercialized
Roundup Ready Soybean
59 years 96 years 26 years

U.S. Maize Technology Adoption Lags
Source: Beddow (2011 forthcoming)
0
20
40
60
80
1001
93
0
19
35
19
40
19
45
19
50
19
55
19
60
19
65
19
70
19
75
19
80
19
85
19
90
19
95
20
00
20
05
20
10
Per
cen
tage
of
U.S
. Mai
ze A
cres
Hybrid Maize
Nitrogen
Nitrogen (rate, index)
Herbicide
Irrigation
18 years 17 years
20 years
13 years
30 years
12 years

Some Indications of (Global)
Productivity Patterns

Global Crop Yields Averages, 1920-2008 (Beta version)
0
1
2
3
4
5
61
92
0
19
25
19
30
19
35
19
40
19
45
19
50
19
55
19
60
19
65
19
70
19
75
19
80
19
85
19
90
19
95
20
00
20
05
Yie
ld (
MT/
Ha.
)
barley maize millet oats rice
rye sorghum soybeans wheat
Maize
Wheat
Rice
Source: Pardey, Beddow, Xudong and Hurley (forthcoming)
1920-1960
Commodity Rate Maize 0.69% Wheat 0.99%
Rice 0.49%
1990-2008
Commodity Rate Maize 1.78% Wheat 0.97%
Rice 1.07%
1960-1990
Commodity Rate Maize 1.73% Wheat 2.57%
Rice 2.19%

A Century of Global Crop Yield Distributions (Beta version)
Source: Pardey, Beddow, Rao and Hurley (forthcoming)
Wheat
Maize Rice

Groupings
Land Productivity Labor Productivity
1961-90 1990-08 Difference 1961-90 1990-08 Difference
Percent per year
World (simple av.) 1.78 1.55 -0.23 1.74 1.84 [0.09]
World 1.95 2.01 0.06 0.92 1.52 0.62
World minus China 1.79 1.53 -0.26 1.09 0.75 -0.35
80% (N = 22) 1.98 2.21 0.23 0.97 1.78 0.82
80% minus China 1.96 1.88 -0.08 2.68 3.06 0.38
< 80% (N= 158) 1.82 1.17 -0.64 1.11 0.24 -0.87
Partial Factor Productivity Growth, 1961-1990 vs 1990-2008
Source: Pardey (forthcoming)

Global Slowdown in Multifactor Productivity Growth?
“I see no evidence of a general slowdown in sector-wide agricultural TFP [growth]. At
least through 2006. If anything, the growth rate in agricultural TFP accelerated in
recent decades….
Despite this generally optimistic conclusion, it is also clear that agricultural productivity
growth has been very uneven… TFP growth may in fact be slowing in developed
countries while accelerating in developing countries.”
Fuglie (2008, p. 440)

Sample of Regional and Global Productivity Studies
Authors
Publication year
Data Year(s) Countries
Method
Hayami and Ruttan
1970 1955, 1965 38 & 1970
Econometric
Antle 1983 1965 45 Econometric
Lau & Yotopolous 1989 1960, 1970 43 & 1980
Econometric
Block 1994 1963-1998 39 (6 intervals)
Econometric
Craig, Pardey & Roseboom
1997 1961-1990 98 Econometric
Fulginiti & Perrin 1998 1961-1985 18 Econometric Malmquist
Coelli & Rao 2005 1980-2000 93 Malmquist/DEA
Fuglie 2008 1961-2006 171 Growth accounting
O’Donnell 2010 1970-2001 88 Hicks–Moorsteen/DEA
Common Denominator– FAO and World Bank Data

Land – count of arable, permanently pastured and cropped area
Labor – head count of economically active population in agriculture
Capital – count of tractors in use/on farm
– percent of irrigated acres
Livestock – weighted head count of buffalo, cattle, pig, sheep, and goat
Materials – fertilizer (nitrogen, phosphate and potash and use in units of active ingredients)
FAO and World Bank Data

Fuglie Factor Weights
Developing World U.S. InSTePP
(percent per year)
Agg. Input -0.22 0.07 0.54 -0.07
MFP 1.94 1.65 1.18 1.73
Estimated U.S. Aggregate Input and MFP Growth Rates, 1961-2006
Source: Pardey (forthcoming)

U.S. Multifactor Productivity, 1949-2007
State MFP Growth Distributions
0
4
8
12
16
20
24
28
-2.5 -1.5 -0.5 0.5 1.5 2.5 3.5 4.5 5.5
1949-1990 US = 2.02%pa
0
4
8
12
16
20
24
28
-2.5 -1.5 -0.5 0.5 1.5 2.5 3.5 4.5 5.5
1990-2007 US = 1.18%pa
Percent per year
InStePP Production Accounts Outputs
Crops 61 Livestock (9) Miscellaneous (4)
Inputs Land (3)
Cropland, irrigated cropland, pasture and grassland Labor (32)
Family labor Hired labor Operator labor (30)
Education: 0–7 years, 8 years, 1–3 years of high school, 4 years of high school, 1–3 years of college, 4 years or more of college Age: 25–34, 35–44, 45–54, 55–64, or 65 or more years of age
Capital (12) Machinery (6)
Automobiles, combines, mowers and conditioners, pickers and balers, tractors, trucks
Biological capital (5) Breeding cows, chickens, ewes, milking cows, sows
Buildings Materials (11)
Electricity, purchased feed, fuel, hired machines, pesticides, nitrogen, phosphorous, potash, repairs, seeds, miscellaneous purchases

Some Big (Largely) Unknowns
• The Location of Production • The Spatial Dynamics of Agriculture
• The Prevalence (and consequences) of Pests and Diseases

Spatial Distribution of Crop Yields, 2000 (SPAM ver 3.0)
Panel a: Maize
Panel d: Rice Panel c: Soybean
Panel b: Wheat
Source: HarvestChoice (2010)
Share of World’s High-Yielding Area
US Africa
(percent)
Maize 32 2.5
Wheat 28 3.6
Soybean 25 5.6
Rice 5.3 5.7

Which cropland extent?
MODIS Africover

0
100
200
300
400
500
600
1908 1930 1960 2008
Africa Asia (exclude Japan) Europe+NorthAm+Oceania Latin America Other
Global Value of Field Crops Production, 1908-2008 (beta)
$81.6 b $113.7 b
$191.7 b
$534.2 b
Africa 6.6 percent Asia 43.9 percent Europe etc 26.2 percent LAC 13.3 percent
Africa 3.7 percent Asia 18.1 percent Europe etc. 52.0 percent LAC 5.2 percent
Crops included (15 field crops)
Barley Buckwheat Cassava Maize Millet Oats Potatoes Rice Rye Sorghum Soybean Sugarbeet Sugarcane Sweet potatoes Wheat
Source: Pardey (forthcoming)
Intl dollars (billions, 1999-2001)

Changing Location of Agriculture
Panel a: Cropland Extent, 1700
Panel b: Cropland Extent, 2000
Panel c: Movement of Regional Cropland Centroids, 1700 – 2000
Source: Beddow, Pardey, Koo and Wood (2010)
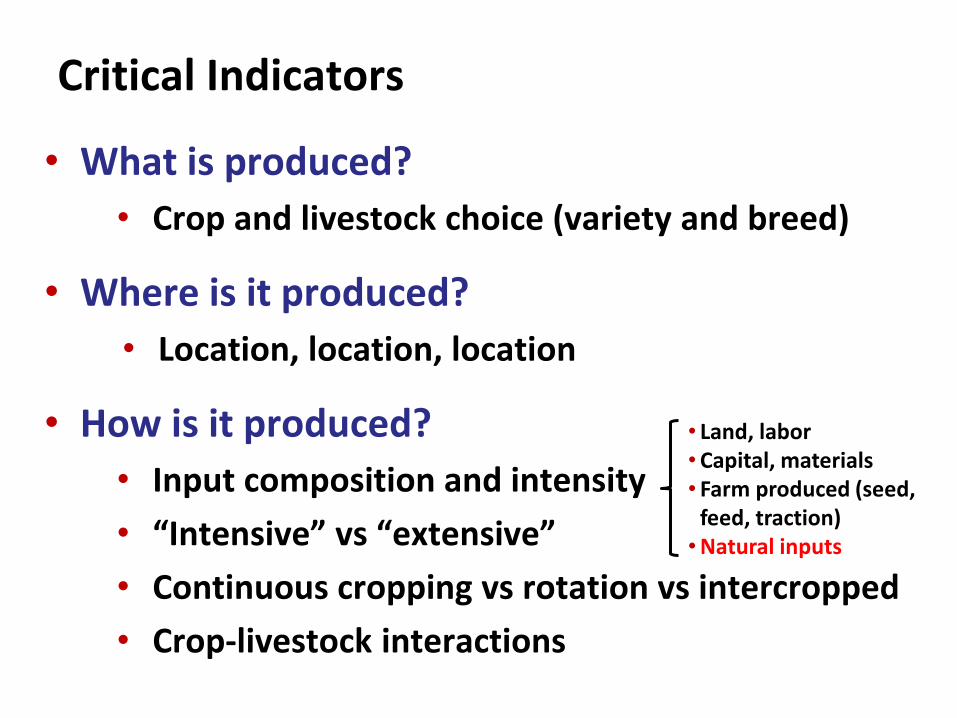
U.S. Maize Production, 1880 and 2007
1880
2007
Source: Beddow (2011 forthcoming)

Spatial Concentration of Global Agricultural Production, 2006-08 average
0
10
20
30
40
50
60
70
80
90
100
0 4 8
12
16
20
24
28
32
36
40
44
48
52
56
60
64
68
72
76
80
84
88
92
96
10
0
10
4
10
8
11
2
11
6
12
0
12
4
12
8
13
2
13
6
14
0
14
4
14
8
Shar
e (
pe
rce
nta
ge)
Number of countries
World Value of Production
Cumulative Country Share (%)
China 22.5 USA 33.3 India 43.8 FSU 49.4 Brazil 54.9
Maize 2008
1 United States 37.2
2 China 20.1
3 Brazil 7.1
4 Mexico 2.9
5 Argentina 2.7
Top 5 total 70.0
top 10 total 79.2
Wheat 2008
1 China 16.5
2 India 11.5
3 United States 10.0
4 Russia 9.3
5 France 5.7
Top 5 total 52.9
top 10 total 70.9
Rice 2008
1 China 28.2
2 India 21.6
3 Indonesia 8.8
4 Bangladesh 6.8
5 Viet Nam 5.6
Top 5 total 71.1
top 10 total 86.0
Source: Pardey (forthcoming)

Spatial Variation in Abiotic Productivity Constraints
Steeplands
Drylands
Poorly drained Soils
Low Nutrient Capital Soils
Explore more at http://labs.harvestchoice.org/2010/12/updating-soil-functional-capacity-classification-system/

Global Probability of Occurrence of Wheat Rust (pre-release version)
Puccinia striiformis (Stripe Rust)
Puccinia triticina (Leaf Rust)
Puccinia graminis (Stem Rust)
Source: Pardey et al. (2011 forthcoming)
Growth Index
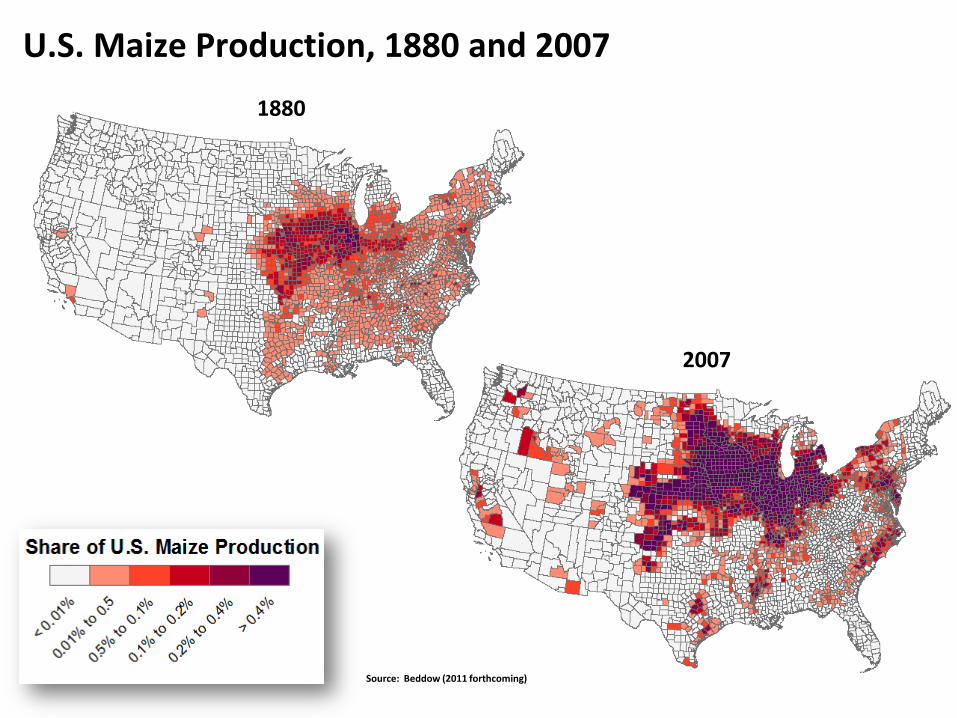
Crop Disease – Stem Rust Example
KS& ND 20.4 MMT ~ 100% Oz output

Final Thoughts
“Since we know little about the causes of productivity increase, the
indicated importance of this element may be taken to be some sort of
measure of our ignorance about the causes of economic growth in the
United States.” Abramovitz (AER 1956, pp. 5-23)
In an idea he attributed to Zvi Griliches, Schultz argued that the
economically ideal output-to-input ratio would stay at or close to one,
the notion being that “… the closer we come to a one-to-one
relationship in our formulation, the more complete would be our
(economic) explanation *of the sources of output growth+.”
Schultz (1956, p.758)

Final Thoughts
Agricultural economists and other social scientists tend to take data as facts.
The problem is the data are not facts. Facts are what is really there. Data are
quantitative representation of facts, which statistical workers and
economists concoct.
I call the study of how primary statistical information is made into economic
data “factology.” The neglect of factology risks scientific ruin.
The bottom line is, for data producers, that full disclosure of procedures and
labeling of data series are essential; and, for data users, be careful and
investigate the data before using them.
Bruce Gardner (1992, AAEA Waugh Lecture)
Alston, J.M., BA. Babcock and P.G. Pardey. The Shifting Patterns of Agricultural Production and Productivity Worldwide, 2010. (Especially chapters 2, 3, 13 and 15)
Alston, J.M., M.A. Andersen, J.S. James, and P.G. Pardey. Persistence Pays: U.S. Agricultural Productivity Growth and the Benefits from Public R&D Spending. New York: Springer, 2010.
Thanks!
www.harvestchoice.org www.instepp.umn.edu
Pardey , P.G. and P.L. Pingali. “Reassessing International Agricultural Research for Food and Agriculture.” Report prepared for the Global Conference on Agricultural Research for Development (GCARD), Montpellier, France, 28-31 March 2010.
Selected Sources