Embed Size (px)
DESCRIPTION
Africa Property & Construction Handbook
Citation preview

91
11
AFRICAPROPERTY & CONSTRUCTION HANDBOOK 2012

1
1 Davis Langdon, An AECOM Company 5
Purpose and core values 10
Message from the managing director 12
BBBEE statement 14
Delivering to the highest standards 15
Safety, health and environmental management 16
Sustainability 17
Research support 18
Quantity surveying/Cost management 19
Engineering cost management 23
Building services cost management 25
Project management 26
2 Inclusive rate estimates 29
Inherent difficulties and pitfalls 31
Specification 31
Wall-to-floor ratio — plan shape 32
Floor-to-ceiling heights 33
Plumbing, mechanical & electrical installations 33
Construction areas 33
Internal subdivisions 34
Parking 34
3 Approximate inclusive building cost rates 37
Regional variations 39
Building rates 39
Building services 44
DL Handbook Africa Section 0 final.indd 1 2012/03/09 8:06 AM

2
4 International costs 47
Cost comparisons 49
Africa building cost rate comparison 50
International building cost rate comparison 51
International prestigious office rental comparison 52
5 Building cost 55
Building cost 57
Escalation rate 57
Calculation of estimated escalation 58
Tender price escalation 59
Cost indices 60
Tender climate 61
Unique large-scale projects 62
Value Added Tax 62
6 Graphs: BER and JBCC CPAP 63
January-to-January percentage change 65
January indices 66
Tender market indicator 67
7 Method for measuring rentable areas 69
SAPOA methods 71
The basis 71
Area definitions 72
General definitions 73
Retail, industrial, residential and other developments 74
Generally 74
DL Handbook Africa Section 0 final.indd 2 2012/03/09 8:06 AM
3
8 Return on investment 75
Criteria to be employed 77
The initial return 77
Cash flow analysis 78
Example 79
9 Residual land value 81
The formula 83
Example 84
10 Africa in figures 85
Area and population 87
Graph: population 2009 88
Gross domestic product 2009 89
Graph: gross domestic product 2009 90
11 Directory of offices 91
DL Handbook Africa Section 0 final.indd 3 2012/03/09 8:06 AM

4
NOTES
DL Handbook Africa Section 0 final.indd 4 2012/03/09 8:06 AM

5
1DAVIS LANGDON,
AN AECOM COMPANY
DL Handbook Africa Section 1 FINAL.indd 5 2012/03/09 8:15 AM

6
DL Handbook Africa Section 1 FINAL.indd 6 2012/03/09 8:15 AM

7
DAVIS LANGDON, AN AECOM COMPANYDavis Langdon, an AECOM company, is a leading global construction consultancy, providing managed solutions for clients investing in infrastructure, property and construction.
Davis Langdon employs approximately 3,000 people in more than 75 offices globally, spanning Africa, Europe, the Middle East, Australia and New Zealand, and the USA. This international coverage and resource base enables us to support our clients’ long-term business strategies with a unique global reach, linked to local delivery.
AECOM is a global provider of professional technical and management support services to a broad range of markets, including transportation, facilities, environmental, energy, water and government. With approximately 45,000 employees around the world, AECOM is a leader in all of the key markets that it serves. AECOM provides a blend of global reach, local knowledge, innovation and technical excellence in delivering solutions that create, enhance and sustain the world’s built, natural, and social environments. A Fortune 500 company, AECOM serves clients in more than 130 countries and had revenue of $8.0 billion during its fiscal year 2011.
We aim to work with clients from the earliest possible opportunity — the first people clients come to when investing in the built, natural and social environment. Our goal is to work with clients through every stage of the development process, as well as post completion, extending into the operational life cycle.
Our servicesOur core services are cost, programme and project management, complemented by a wide range of specialist consultancy capabilities, including building surveying, capital allowances consulting, design management, engineering cost management, legal support; management consulting, specification consulting; facilities management, value and risk management and sustainability consulting.
1
DL Handbook Africa Section 1 FINAL.indd 7 2012/03/09 8:15 AM

8
1
Our projectsAround the world, our cost managers, project managers and specialist consultants work on complex and challenging projects across a range of sectors. Current and past projects include the Gautrain Rapid Rail Link in Gauteng, and the Green Point Stadium in Cape Town, South Africa; the Tate Modern Extension, the Eden Project and The Shard at London Bridge in the United Kingdom; Abu Dhabi International Airport in the Middle East; the Grand Egyptian Museum in Cairo, Egypt; The Gateway Bridge Upgrade in Brisbane, Australia; and the Transbay Terminal in San Francisco, USA, to name but a few.
Local and international recognitionIn 2011, we received the Professional Management Review (PMR) Diamond Arrow award for the most outstanding Large Quantity Surveying firm in Africa.
Davis Langdon has also been named World Architecture’s “Top International Construction Consultant” for 18 successive years.
Industry awardsThe consistently high standard of professional service provided by both Davis Langdon and AECOM is recognised throughout the construction industry, as evidenced by the following prestigious awards:
Davis Langdon
- Received the PMR 2011 “Diamond Arrow” Award for the most outstanding large Quantity Surveying firm in South Africa
- Named Building Design World Architecture’s “Top International Construction Consultant” for the 18th successive year
- Our cost management project “Aurecon’s head office” in Cape Town earned a 5-Star Green Star rating by the Green Building Council of South Africa — the first building in South Africa to achieve this rating.
AECOM
- Named one of the World’s Most Ethical Companies for 2011 by the Ethisphere Institute
- Named Top Design Firm in the USA by Engineering News-Record’s Top 500 Design Firms for 2011
DL Handbook Africa Section 1 FINAL.indd 8 2012/03/09 8:15 AM

9
1
- AECOM’s program, cost, consultancy (PCC) capability project, the Evelyn Grace Academy in London, UK, was the recipient of this year’s highly prestigious RIBA Stirling Award and 20 other PCC projects were awarded regional awards
- AECOM’s PCC capability project — Central St. Giles in London, UK — was named “Best of the Best” at the British Council of Offices 2011 Award Ceremony in London
- Granary Wharf in Leeds, UK — AECOM’s PCC capability project — received the Regeneration Award at the UK’s 2011 Royal Institution of Chartered Surveyors (RICS) Awards
- The Waitomo Glowworm Caves Visitor Centre, AECOM’s PCC capability project, was awarded the top prize at the New Zealand Architecture Awards, the country’s premier architecture competition.
DL Handbook Africa Section 1 FINAL.indd 9 2012/03/09 8:15 AM

10
1
PURPOSE AND CORE VALUES
Across our operations, Davis Langdon offers a unique blend of global reach, local knowledge, innovation, and technical excellence. We are united by our shared purpose and core values.
Our Purpose:Our professionals around the world are united by a common purpose — to create, enhance and sustain the world’s built, natural and social environments.
Our Core Values:Integrity - We are honest and ethical in everything we do - We keep our commitments and treat others with mutual
respect and trust
Employees - Our employees are our most valuable and valued
resource; they make our success possible - We respect and encourage our employees’ ideas,
diversity and cultures
Clients - Our success is measured by the success of our clients - We are committed to our clients and to setting industry
standards for client service and solutions- We are passionate about solving our clients’ problems
and exploring new opportunities with them
Excellence- We strive to achieve excellence in all areas of our
business — technical, operational, and administrative - We pride ourselves on bringing outstanding results to
everything we do
Innovation- We look for creative, new or better ways to provide our
expertise in all dimensions of our business - Creativity, exploration and imagination are key to our
approach to our work
DL Handbook Africa Section 1 FINAL.indd 10 2012/03/09 8:15 AM

11
1
Agility- We embrace change, flexibility and adaptation in a
rapidly evolving world - We strive to anticipate changes in market drivers and
to work with our clients and employees to adapt to those changes
Safety- We are committed to creating a safe workplace for our
employees by preventing injuries to people and damage to facilities, property, equipment, and the environment
Profitable Growth- Living and executing these Core Values every day will
result in profitable growth, which drives our business and enables us to invest in and create opportunities for our employees
DL Handbook Africa Section 1 FINAL.indd 11 2012/03/09 8:15 AM

12
1
MESSAGE FROM THE MANAGING DIRECTOR
As a business we continue to evolve, and 2012 sees another chapter being written in our evolutionary process. Our evolution is focused on innovation, our people and clients.
Our diversified business model in the geographies and market sectors in which we do business is a key differentiator which has enabled us to maintain continued performance and manage the economic realities of the global financial crisis. Through this we have diligently adhered to our mission of making a measurable difference to the value, cost and time of our client’s projects.
Innovation investment is a manifestation of being a global business, which allows knowledge and systems to be shared and transferred. Davis Langdon is working on the development of a global project tool that will enable each of our geographies to benefit from sharing global cost, programme, design and key project levers. Another initiative that we are working on with our worldwide AECOM colleagues, through knowledge gained from global projects, is the development of a Building Information Modelling (BIM) capability. The key differentiator of this innovation is that being a global and diversified business, committed to a broad range of technical services, we have the distinct
DL Handbook Africa Section 1 FINAL.indd 12 2012/03/09 8:15 AM

13
ability to harness data from global projects across varying design disciplines, combined with project and cost management disciplines. We have invested in thought leadership and research with a dedicated team working on this. Research will be a new service offering to our clients with a focus on construction.
We will continue to retain, attract and recruit the best people. The essence of our service delivery is based on our people. Re-tooling, up-skilling and redirecting our talent to service client’s projects is key to our mission. Training, mentoring and knowledge sharing with our teams across sectors and geographies will continue to arm our people with the mandate to lead best practice in our industry. The Davis Langdon Academy, launched at the end of 2011, is an investment in empowering our youth through education, whilst simultaneously advancing our corporate social responsibility.
Our sector-based business approach has sharpened our focus on commercial, hotels, retail, energy & utilities, mining, transportation, healthcare and education. We have appointed sector leaders in these focus areas who are working with our clients and colleagues.
Our passion and commitment to Africa remains, as we continue to invest in expanding our footprint and geographic reach through our global technical expertise and client services. Through these investments we are positioning ourselves to leverage opportunities in our markets, as we pursue new growth opportunities across our sectors and geographies.
Best Regards,
Indresen Pillay
1
DL Handbook Africa Section 1 FINAL.indd 13 2012/03/09 8:15 AM

14
1
BBBEE STATEMENT
Davis Langdon is fully committed to embrace the principles of the Broad-Based Black Economic Empowerment Bill (BBBEE) No. 53 of 2003. We have been independently evaluated and certified in terms of the Act for the Construction Sector Charter issued in terms of section 9(1) of the BBBEE Act 53 of 2003 gazetted on 4 May 2009 and the results are as follows:
Score: 69.34
Level: Level 4 contributor
Procurement recognition level: 100%
Value-added supplier: Yes
The above scores have been achieved by quantifying all the components of BBBEE, namely:
- Ownership
- Management control
- Employment equity
- Skills development
- Preferential procurement
- Enterprise development
- Socio-economic development
Notwithstanding the above achievements, Davis Langdon has set itself a continuing improvement target in all the above criteria in order to maintain and increase our leading role amongst professionals in the built environment.
DL Handbook Africa Section 1 FINAL.indd 14 2012/03/09 8:15 AM

15
DELIVERING TO THE HIGHEST STANDARDS
Delivering well is not only about employing the best people, but also about equipping them with the best tools.
The way in which information is shared has changed dramatically, and we are able to offer our clients both traditional and more innovative solutions for team collaboration on projects.
In doing so we are fully committed to the principles incorporated within our quality management system, which is certified in accordance with the ISO 9001:2008 international standard. These principles emphasise the need to fully understand our client’s requirements and to strive to meet or exceed their expectations. The policies and procedures contained within our quality management system are incorporated within our integrated management system and these provide for a cycle of corrective and preventative actions, thus creating positive opportunities for continuous improvement.
1
DL Handbook Africa Section 1 FINAL.indd 15 2012/03/09 8:15 AM

16
1
SAFETY, HEALTH AND ENVIRONMENTAL MANAGEMENT
Davis Langdon has an integrated management system which incorporates requirements of environmental management in alignment with ISO 14001:2004 and safety and health management in alignment with BS OHSAS 18001:2007. Consequentially, the firm obtained and maintains certification in accordance with both these international standards.
The rationale behind this is that we support the ethos of an operationally safe office environment and remain committed to ensuring we have a healthy and safe environment for our staff and colleagues. Furthermore, to ensure a positive “green” culture, we have formulated an environmental policy to monitor, and wherever possible, control and reduce the impact of our activities on the environment. This is done by way of a policy of continuous improvement, wherein each executive and each employee feels responsible for the resources they use and the activities they undertake on behalf of the firm.
Additionally, Davis Langdon is committed to positively contributing to the efforts of our clients in developing their projects in such a way as to minimise their environmental impact, where such commitment is compatible with the scope of our commission. To this end we are a “silver” founding member of the Green Building Council of South Africa.
DL Handbook Africa Section 1 FINAL.indd 16 2012/03/09 8:15 AM
17
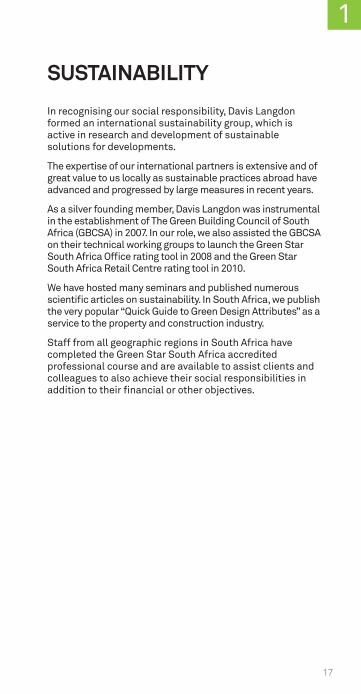
SUSTAINABILITY
In recognising our social responsibility, Davis Langdon formed an international sustainability group, which is active in research and development of sustainable solutions for developments.
The expertise of our international partners is extensive and of great value to us locally as sustainable practices abroad have advanced and progressed by large measures in recent years.
As a silver founding member, Davis Langdon was instrumental in the establishment of The Green Building Council of South Africa (GBCSA) in 2007. In our role, we also assisted the GBCSA on their technical working groups to launch the Green Star South Africa Office rating tool in 2008 and the Green Star South Africa Retail Centre rating tool in 2010.
We have hosted many seminars and published numerous scientific articles on sustainability. In South Africa, we publish the very popular “Quick Guide to Green Design Attributes” as a service to the property and construction industry.
Staff from all geographic regions in South Africa have completed the Green Star South Africa accredited professional course and are available to assist clients and colleagues to also achieve their social responsibilities in addition to their financial or other objectives.
1
DL Handbook Africa Section 1 FINAL.indd 17 2012/03/13 6:55 AM

18
1
RESEARCH SUPPORT
There is a shortage of “in-depth” research in the built environment. Davis Langdon consequently decided, for the benefit of our clients and colleagues and to conform to international standards, to contribute to relevant research in a rigorous way.
Research is firstly conducted to support our knowledge database and existing activities to deliver the highest quality and relevant services. Secondly, it serves the purpose to enhance our competitive edge in order to also deliver cost-effective services. Thirdly, contract research is undertaken on assignment for clients in order to resolve industry-specific problems.
Research activities nationally, regionally and internationally include, amongst others, the following:
- Cost
- Planning, design and development
- Collaboration with universities, professional bodies, government and research institutions
- Sustainability
- Continuing education workshops
- Industry reports and brochures
- Collaboration with our international offices with specific reference to the following:
- Retail
- Public
- Commercial property
- Residential
- Hotels, sports and culture
- Transport
- Industrial
- Mining and resources
- Infrastructure
- Tall, large and complex buildings.
DL Handbook Africa Section 1 FINAL.indd 18 2012/03/09 8:15 AM

19
QUANTITY SURVEYING/ COST MANAGEMENT
Davis Langdon provides comprehensive cost management services from project initiation to completion through all six stages of the project cycle identified by The South African Council for the Quantity Surveying Profession, Tariff of Professional Fees, Quantity Surveying Profession Act 2000 (Act 49 of 2000) as follows:
Stage 1- Assisting in developing a clear project brief
- Attending project initiation meetings
- Advising on the procurement policy for the project
- Advising on other professional consultants and services required
- Defining the quantity surveyor’s scope of work and services
- Concluding the terms of the client/quantity surveyor professional services agreement with the client
- Advising on economic factors affecting the project
- Advising on appropriate financial design criteria
- Providing necessary information within the agreed scope of the project to the other professional consultants
- Providing services for which the following deliverables are applicable:
- Agreed scope of work
- Agreed services
- Signed client/quantity surveyor professional services agreement
1
DL Handbook Africa Section 1 FINAL.indd 19 2012/03/09 8:15 AM

20
1
Stage 2- Agreeing on the documentation programme with the
principal consultant and other professional consultants
- Attending design and consultant’s meetings
- Reviewing and evaluating design concepts and advising on viability in conjunction with the other professional consultants
- Receiving relevant data and cost estimates from the other professional consultants
- Preparing preliminary and elemental or equivalent estimates of construction cost
- Assisting the client in preparing a financial viability report
- Auditing space allocation against the initial brief
- Liaising, cooperating and providing necessary information to the client, principal consultant and other professional consultants
- Providing services for which the following deliverables are applicable:
- Preliminary estimates of construction cost
- Elemental or equivalent estimates of construction cost
- Space allocation audit for the project
Stage 3- Reviewing the documentation programme with the
principal consultant and other professional consultants
- Attending design and consultant’s meetings
- Reviewing and evaluating design and outline specifications as well as exercising cost control in conjunction with the other professional consultants
- Receiving relevant data and cost estimates from the other professional consultants
- Preparing detailed estimates of construction cost
- Assisting the client in reviewing the financial viability report
DL Handbook Africa Section 1 FINAL.indd 20 2012/03/09 8:15 AM

21
- Commenting on space and accommodation allowances and preparing an area schedule
- Liaising, cooperating and providing necessary information to the client, principal consultant and other professional consultants
- Providing services for which the following deliverables are applicable:
- Detailed estimates of construction cost
- Area schedule
Stage 4- Attending design and consultant’s meetings
- Assisting the principal consultant in the formulation of the procurement strategy for contractors, subcontractors and suppliers
- Reviewing working drawings for compliance with the approved budget of construction cost and/or financial viability
- Preparing documentation for both principal and subcontract procurement
- Assisting the principal consultant with calling of tenders and/or negotiation of prices
- Assisting with financial evaluation of tenders
- Assisting with preparation of contract documentation for signature
- Providing services for which the following deliverables are applicable:
- Budget of construction cost
- Tender documentation
- Financial evaluation of tenders
- Priced contract documentation
Stage 5- Attending the site handover
- Preparing schedules of predicted cash flow
1
DL Handbook Africa Section 1 FINAL.indd 21 2012/03/09 8:15 AM

22
1
- Preparing proactive estimates for proposed variations for client decision-making
- Attending regular site, technical and progress meetings
- Adjudicating and resolving financial claims by the contractors
- Assisting in the resolution of contractual claims by the contractors
- Establishing and maintaining a financial control system
- Preparing valuations for payment certificates to be issued by the principal agent
- Preparing final accounts for the works on a progressive basis
- Providing services for which the following deliverables are applicable:
- Schedules of predicted cash flow
- Estimates for proposed variations
- Financial control reports
- Valuations for payment certificates
- Progressive and draft final accounts
Stage 6- Preparing valuations for payment certificates to be
issued by the principal agent
- Concluding final accounts
- Providing services for which the following deliverables are applicable:
- Valuations for payment certificates
- Final accounts
DL Handbook Africa Section 1 FINAL.indd 22 2012/03/09 8:15 AM

23
ENGINEERING COST MANAGEMENT
Engineering cost management operates as a specialist service within Davis Langdon and comprises specialist skills and applications that enhance the risk and value management techniques required by the infrastructure, mining, minerals, metallurgical and petro-chemical sectors of the industry.
This includes the constitution of dedicated independent teams specialising in and responsible for the estimating, procurement, cost management and contract administration activities relative to the abovementioned industries. The engineering cost management group is responsible for many diverse projects within these industries with principle benefits to our clients being independence, accountability and evidence of corporate governance.
Our engineering cost management team operates throughout Africa using infrastructure support from other local Davis Langdon offices located in all major centres in South Africa and Botswana. The engineering cost management group employs professional qualified quantity surveyors, cost managers, cost engineers, contract administrators, construction programmers and building surveyors.
Infrastructure, mining, minerals, metallurgical and petro-chemical projects are generally of a high monetary value, and it is therefore most beneficial to involve the engineering cost management team at an early stage in the project cycle. This allows for strong financial discipline to be imposed on the project to ensure accurate and structured estimating, timeous and cost-effective procurement, accurate and up-to-date maintenance of costs to completion, including the cost management of design changes and the timeous close-out of contracts. The implementation of these principles of financial management will deliver maximum shareholder value and it is in this area that the engineering cost management team strives to significantly influence project outcomes to benefit all stakeholders.
Davis Langdon’s engineering cost management group provides a depth of experience, expertise and independence, which will contribute to and complement the client’s team. This is critical, particularly in the early stages of a project when the opportunity to add value,
1
DL Handbook Africa Section 1 FINAL.indd 23 2012/03/09 8:15 AM

24
1
as well as recognise and define cost is established. Simultaneously, the formalisation of project principles is equally critical throughout the project with cost management continuing through to the post–contract period and final closeout.
DL Handbook Africa Section 1 FINAL.indd 24 2012/03/09 8:15 AM

25
BUILDING SERVICES COST MANAGEMENT
Building services cost management, another specialist team within Davis Langdon’s engineering cost management service, draws upon its unique expertise to provide financial management and contract administration of building services, including the following:
- Electrical installation
- (Heating, Ventilating and Air Conditioning) HVAC
installations
- Fire protection systems
- Fire detection and evacuation systems
- Access control
- (Closed Circuit Television) CCTV
- Lifts, escalators, travelators
- Communication systems
- Building management systems
- Security systems
- Data systems
Working in close conjunction with the appointed mechanical, electrical and fire protection consultants, our building services team provides a comprehensive service, including cost advice and quantity surveying services encompassing the following:
- Cost planning
- Contract procurement
- Tender and contract documentation
- Cost control
- Risk management
- Value management
- Life cycle and whole life costing.
1
DL Handbook Africa Section 1 FINAL.indd 25 2012/03/13 6:55 AM

26
1
PROJECT MANAGEMENT
Davis Langdon’s project management team provides that vital independent and professional service to plan, lead, organise and control the management of projects and programmes, from inception to completion.
Recognised as one of the world’s leading providers of management and consultancy services, we employ highly skilled professional project managers from a broad range of professional disciplines — offering experience across a wide range of sectors.
This equips our project management team with the in-house skills and market expertise to recognise potential and define objectives from the outset, whilst also ensuring the delivery of value and appropriate management of risk throughout the project cycle.
Our strength lies in our ability to provide a dedicated service on a local, national and international basis that is focused on the vision for the project in question. Through our approach to managing projects, we draw on the inherent commercial strength of the practice whilst also delivering a creative and people-based service.
Our services can be tailored to suit the needs of the project and client and include:
- Project management
- Client’s representative
- Principal agency
- Engineering Procurement Construction Management (EPCM)
- Value and risk management
- Programming, planning and control
- Project monitoring
- Project consultancy
- Development management
- Due diligence reporting
Our project management team will invariably work with client teams that are carefully pre-qualified and selected
DL Handbook Africa Section 1 FINAL.indd 26 2012/03/09 8:15 AM

27
for their expertise, personnel, enthusiasm and drive to deliver the required results.
Our project managers work together with our clients to manage the appointments of the necessary consultants, including advising on the various methods of selection, the negotiation and agreement of their services and fees. In addition, we will provide a single point of contact for the client when dealing with other third parties, contractors and suppliers.
We are committed to building and managing teams with a common culture of delivering excellence, and strive to engender healthy and vibrant working relationships throughout the life cycle of the project.
The growth of this service in recent years has been built upon strong alliances with long-standing clients and our ability to deliver wherever and whenever required, to a prescribed quality, on time and within budget on a consistent basis.
1
DL Handbook Africa Section 1 FINAL.indd 27 2012/03/09 8:15 AM

28
1
NOTES
DL Handbook Africa Section 1 FINAL.indd 28 2012/03/09 8:15 AM

29
2
2INCLUSIVE RATE
ESTIMATES
DL Handbook Africa Section 2 FINAL.indd 29 2012/03/09 8:07 AM

30
2
DL Handbook Africa Section 2 FINAL.indd 30 2012/03/09 8:07 AM

31
2
INHERENT DIFFICULTIES AND PITFALLS This section highlights the inherent difficulties and pitfalls that may be experienced when inclusive or single rates are used to establish the estimated cost of a particular building.
Construction cost estimation is complex. Comprehensive exercises based on detailed and accurate information are required to achieve reliable levels of comfort. For various reasons, however, decisions are often based on inclusive rate estimates, i.e. rate per square metres (m²) of construction area or rate per unit in number.
The most widely used method of quick approximate estimating to obtain an indication of the construction cost of a building is by the rate/m²-on-plan method. It is often also referred to as the “order of magnitude” method of cost estimation. It certainly is both quick and convenient, but it can be very misleading if used indiscriminately without care being taken in the calculation of the construction area and the selection of the rate.
Comparisons of the costs of various buildings are often made by comparing the individual rates/m² without due consideration being given to a number of factors that can affect the rate/m² to a substantial degree.
Very often the cost of a building is expressed in R/m² and the unit cost is ignored, if calculated at all. This rate/m² is then used as the sole yardstick of what the building costs. For example, a security guard’s shelter measuring 2m x 2m consisting of brick walls with windows, one door and a simple roof construction may cost R6,000/m². This rate, when compared with the rate for a 200m² house containing plumbing, carpets, etc. at R4,700/m² would seem to be very expensive. Yet, in fact, the unit cost of the shelter is R24,000 compared with R940,000 for the house.
The following are a few of the important criteria to be taken into account when rates/m² are considered:
SPECIFICATIONTwo buildings having identical shape and accommodation can have vastly different R/m² rates should the one building have finishes of a differing standard from the other. For example, expensive carpets in lieu of vinyl floor tiles can increase the rate by R100/m².
DL Handbook Africa Section 2 FINAL.indd 31 2012/03/09 8:07 AM

32
2
WALL-TO-FLOOR RATIO — PLAN SHAPEThe most economical shape of a building is a square. This shape requires the minimum wall length to enclose a given floor area, e.g.
Case A
Area 1,600m²
Wall length 160m
Wall height 3m
Wall area 480m²
Wall floor ratio 480/1,600
Cost of external facade in terms of R/m² of floor area to each R/m² of facade area 30.0%
Case B
Area 1,600m²
Wall length 232m
Wall height 3m
Wall area 696m²
Wall floor ratio 696/1,600
Cost of external facade in terms of R/m² of floor area to each R/m² of facade area 43.5%
40m
40m
16m
100m
DL Handbook Africa Section 2 FINAL.indd 32 2012/03/09 8:07 AM

33
2
The rate/m² on plan of a facade costing R600/m² on elevation in each case is:
Case A R600 x 30.0% = R180/m²
Case B R600 x 43.5% = R261/m²
The reader with a good knowledge of mathematics will correctly fault the above argument by promoting a circle as being the geometric shape that requires the minimum wall length to enclose a given floor area. In very few cases, however, this is the most economical plan shape of a building, as for various reasons the cost of constructing a circular as opposed to a straight external envelope is generally greater than the saving in quantity of the envelope.
FLOOR-TO-CEILING HEIGHTSTwo buildings of identical plan shape and area but of different floor-to-ceiling heights will have different rates/m² due to the additional cost of walling, finishes, etc. in the building with the higher floor-to-ceiling height.
PLUMBING, MECHANICAL & ELECTRICAL INSTALLATIONSThe concentration of plumbing installations has a marked effect on the rate/m² of the building. The cost of a toilet block per m² is much greater than that of a house containing one bathroom because the high cost of the bathroom area is spread over the less expensive areas of the remainder of the house.
Similarly, in office blocks, factories, etc., the rate/m² will depend greatly on whether air-conditioning, security systems, sprinklers, smoke detection systems, specialised electrical installations, acoustic treatment or other specialised installations are incorporated into the design.
CONSTRUCTION AREASThe rate/m² for a building having large balconies or access corridors that have been included in the construction area cannot be compared with the rate/m² for a building not having similar areas of low cost.
DL Handbook Africa Section 2 FINAL.indd 33 2012/03/09 8:07 AM

34
2
INTERNAL SUBDIVISIONSThe rate/m² for open plan offices should not be compared directly with the rate/m² for offices having internal partitions without the relevant adjustments being made. The inclusion of partitions can increase the overall rate/m² by up to R230/m² of office area.
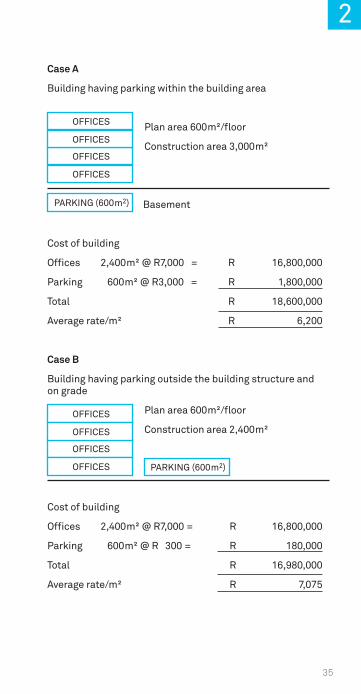
PARKINGShould the building in question contain certain areas for parking within the building area, the average rate/m² will be less than for a building having the identical accommodation but with parking outside the building structure. An example follows overleaf.
DL Handbook Africa Section 2 FINAL.indd 34 2012/03/09 8:07 AM
35
2
Case A
Building having parking within the building area
Plan area 600m²/floor
Construction area 3,000m²
Basement
Cost of building
Offices 2,400m² @ R7,000 = R 16,800,000
Parking 600m² @ R3,000 = R 1,800,000
Total R 18,600,000
Average rate/m² R 6,200
Case B
Building having parking outside the building structure and on grade
Plan area 600m²/floor
Construction area 2,400m²
Cost of building
Offices 2,400m² @ R7,000 = R 16,800,000
Parking 600m² @ R 300 = R 180,000
Total R 16,980,000
Average rate/m² R 7,075
OFFICES
OFFICES
OFFICES
OFFICES
PARKING (600m2)
OFFICES
OFFICES
OFFICES
OFFICES PARKING (600m2)
DL Handbook Africa Section 2 FINAL.indd 35 2012/03/09 8:07 AM

36
2
Under Case B the area of parking is not included as part of the “construction area” for purposes of calculating the rate/m². Similarly, the rate/m² for supermarket/hypermarket shopping centres should be qualified as to whether the cost of on-site parking and ancillary site development has been included, which cost could be in the region of R500/m² of construction area.
There are numerous further points of consideration that should be taken into account in addition to those given above. Amongst these are site works (particular to each specific contract), number of storeys, floor loadings, column spans, concentration of joinery and other fittings, overall height of building, open atrium upper volumes, etc.
In conclusion, rates/m² must be used with circumspection and the degree of accuracy of the answers provided must be considered to be in direct proportion to the amount of research and surveys undertaken to establish the rate for the building in question.
DL Handbook Africa Section 2 FINAL.indd 36 2012/03/09 8:07 AM

37
3
3APPROXIMATE
INCLUSIVE BUILDING
COST RATES
DL Handbook Africa Section 3 FINAL.indd 37 2012/03/09 8:08 AM

38
3
DL Handbook Africa Section 3 FINAL.indd 38 2012/03/09 8:08 AM

39
33
BUILDING COST RATESThis section provides a list of approximate inclusive building cost rates for various building types in South Africa.
Rates are based on 1 July 2012, and therefore represent the average expected building cost rates for 2012. It is emphasized that these rates are of indicative nature only and should be used circumspectly, as they are dependent upon a number of assumptions. See “Inclusive rate estimates” herein.
The area of the building expressed in m² is equivalent to the “construction area” where appropriate, as defined in the “Method for Measuring Floor Areas in Buildings, First Edition” (effective from 1 August 2005), published by the South African Property Owners Association (SAPOA).
REGIONAL VARIATIONSConstruction costs normally vary between the different provinces of South Africa. Costs in parts of the Western Cape and KwaZulu-Natal, specifically upper class residential, for example, are generally significantly higher than Gauteng due to the demand for this accommodation. Rates have therefore been based on data received from the Gauteng province, where possible. Be mindful, however, that cost differences between provinces at a given point in time are not constant and may vary over time due to differences in supply and demand or other factors. Specific costs for any region can be given upon request by any Davis Langdon office in that region.
BUILDING RATESRates include the cost of appropriate building services, e.g. air-conditioning, electrical, etc., but exclude costs of site infrastructure development, parking, any future escalation, loss of interest, professional fees and Value Added Tax (VAT).
Offices Rate per m² (excl. VAT)
Low-rise office park development with standard specification R 5,500 - R 6,700
Low-rise prestigious office park development R 7,100 - R 10,600
High-rise tower block with standard specification R 7,800 - R 10,600
High-rise prestigious tower block R 10,600 - R 13,250
DL Handbook Africa Section 3 FINAL.indd 39 2012/03/09 8:08 AM

40
33
Note: Office rates exclude parking and include appropriate tenant allowances incorporating carpets, wallpaper, louvre drapes, partitions, lighting, air-conditioning and electrical reticulation.
Parking Rate per m² (excl. VAT)
Parking on grade, including integral landscaping R 375 - R 480
Structured parking R 2,950 - R 3,800
Parking in semi-basement R 2,950 - R 4,000
Parking in basement R 3,200 - R 4,800
Retail
Local convenience centres (Not exceeding 5,000m²) R 5,300 - R 6,900
Neighbourhood centres (5,000–12,000m²) R 5,300 - R 7,400
Community centres (12,000–25,000m²) R 5,800 - R 8,000
Minor regional centres (25,000–50,000m²) R 6,400 - R 8,500
Regional centres (50,000–100,000m²) R 7,400 - R 9,000
Super regional centres (Exceeding 100,000m²) R 7,400 - R 10,000
Note: Super regional centres and regional centres are generally inward trading with internal malls, whereas convenient, neighbourhood and community centres are generally outward trading with no internal malls.
Retail rates include the cost of tenant requirements and specifications of national chain stores.
Retail costs vary considerably depending on the tenant mix and sizing of the various stores.
DL Handbook Africa Section 3 FINAL.indd 40 2012/03/09 8:08 AM

41
33
Industrial Rate per m² (excl. VAT)
Industrial warehouse, including office and change facilities within structure area (architect/engineer-designed):
- Steel frame, steel cladding and roof sheeting R 2,650 - R 4,000
- Steel frame, brickwork to ceiling, steel cladding above and roof sheeting R 3,200 - R 4,450
- Administration offices, ablution and change room block R 5,100 - R 6,400
- Cold storage facilities R 9,400 - R 13,500
Residential Rate per no (excl. VAT)
Site services to low-cost housing stand (250 - 350m²) R 23,500 - R 36,000
Rate per m² (excl. VAT)
RDP housing R 1,300 - R 1,500
Low-cost housing R 2,100 - R 3,400
Simple low-rise apartment block R 5,000 - R 7,000
Duplex townhouse - Economic R 5,000 - R 7,100
Prestige apartment block R 9,500 - R 14,800
Private dwelling houses: - Economic R 3,600 - Standard R 4,900 - Middle class R 5,800 - Luxury R 8,300 - Exclusive R 12,300 - Exceptional (‘super luxury’) R 19,000 - R 38,000
Outbuildings R 2,100 - R 3,600
Rate per no (excl. VAT)
Carport (shaded) - single R 3,100 - double R 5,900
Carport (covered) - single R 4,800 - double R 8,800
DL Handbook Africa Section 3 FINAL.indd 41 2012/03/09 8:08 AM

42
33
Rate per no (excl. VAT)
Swimming pool - Not exceeding 50 kl R 64,000 - Exceeding 50 kl and not exceeding 100 kl R 64,000 - R 106,000
Tennis court - Standard R 228,000 - Floodlit R 297,000
Hotels
Budget R 525,000 - R 820,000/key Mid-scale R 1,100,000 - R 1,450,000/key Luxury R 1,865,000 - R 2,565,000/key
Note: Hotel rates exclude allowances for furniture, fittings and equipment (FF&E).
Studios Rate per m² (excl. VAT)
Studios - dancing, art exhibitions, etc. R 9,400 - R 13,500
Conference centres
Conference centre to international standards R 17,000 - R 22,000
Retirement centres
Dwelling houses - Middle class R 5,600 - Luxury R 7,850
Apartment block - Middle class R 5,800 - Luxury R 9,000
Community centre - Middle class R 7,500 - Luxury R 11,100
Frail care R 9,000
DL Handbook Africa Section 3 FINAL.indd 42 2012/03/09 8:08 AM

43
33
Schools Rate per m² (excl. VAT)
Primary school R 4,800 - R 6,000
Secondary school R 5,100 - R 6,700
Stadiums Rate per no (excl. VAT)
Stadium to PSL standards R 23,000 - R 36,000/seat
Stadium to FIFA standards R 53,000 - R 71,000/seat
Stadium pitch to FIFA standards R 15,000,000 - R18,000,000
Prisons
1,000 Inmate prison R 400,000 - R 425,000/inmate
500 Inmate prison R 425,000 - R 475,000/inmate
High/maximum security prison R 635,000 - R 850,000/inmate
DL Handbook Africa Section 3 FINAL.indd 43 2012/03/09 8:08 AM

44
33
BUILDING SERVICESThe following rates are for building services (mechanical and electrical) applicable to typical building types in the categories indicated. Rates are dependent on various factors related to the design of the building and the requirements of the system.
In particular, the design, and therefore the cost of air-conditioning, can vary appreciably depending on the orientation, shading, extent and type of glazing, external wall and roof construction, etc.
Electrical installation Rate per m² (excl. VAT)
Offices - Standard installation R 345 - R 595 - Sophisticated installation R 490 - R 780 - UPS, substations, standby generators to office buildings R 250 - R 340
Residential R 370 - R 570
Shopping centres R 560 - R 700
Hotels R 720 - R 890
Hospitals R 850 - R 1,100
Electronic installation
Offices - Standard installation R 370 - R 470 - Sophisticated installation R 480 - R 600
Residential R 200 - R 260
Shopping centres R 450 - R 600
Hotels R 400 - R 500
Hospitals R 400 - R 520
Note: Electronic installation includes access control, CCTV, public address, fire detection, data installation, Wireless Fidelity (WiFi), Community Antenna Television (CATV), Private Automatic Branch Exchange (PABX) and Building Management Systems (BMS).
DL Handbook Africa Section 3 FINAL.indd 44 2012/03/09 8:08 AM

45
33
Fire protection installation Rate per m² (excl. VAT) (offices)
Sprinkler system, including hydrants and hose reels (excluding void sprinklers) R 150 - R 240
Air-conditioning installation
Ventilation to parking/service areas R 160 - R 310
Offices - Console units R 480 - R 630 - Console/split units R 550 - R 700 - Package units R 770 - R 950 - Central plant R 1,000 - R 1,450 - Variable refrigerant flow (VRF) R 1,000 - R 1,600
Residential — split units R 720 - R 1,250
Shopping centres - Split units R 660 - R 780 - Package units R 715 - R 1,250 - Evaporative cooling R 330 - R 800
Hotels — public areas R 1,000 - R 1,700
Hospitals — split units to wards R 1,430 - R 1,650
Rate per no (excl. VAT)
Hotels - Console units R 13,250 - R 18,500/key - Split units R 27,500 - R 37,500/key - Central plant R 42,500 - R 70,000/key
Hospitals — operating theatres (per theatre) R 220,000 - R800,000
Note: For guidance with regard to the cost of buildings rated under the Green Star South Africa rating tool system, see the latest edition of the Davis Langdon publication entitled “Quick Guide to Green Design Attributes.”
DL Handbook Africa Section 3 FINAL.indd 45 2012/03/09 8:08 AM

46
33
NOTES
DL Handbook Africa Section 3 FINAL.indd 46 2012/03/09 8:08 AM

47
4
4INTERNATIONAL COSTS
DL Handbook Africa Section 4 FINAL.indd 47 2012/03/09 8:08 AM

48
4
DL Handbook Africa Section 4 FINAL.indd 48 2012/03/09 8:08 AM

49
4
COST COMPARISONS This section makes provision for comparison of Africa building costs, international building costs and international rental rates.
The following table (Africa building cost comparison, see page 50), presents in summarised form the approximate estimated building costs for different types of buildings in various locations in Africa. Rates are based on 1 July 2012 and therefore represent the average expected building cost rates for 2012. Exchange rates have been based on 1 November 2011.
Rates include the cost of appropriate building services, e.g. air-conditioning, electrical, etc., but exclude costs of site infrastructure development, parking, any future escalation, loss of interest, professional fees and VAT. These rates are of indicative nature and therefore the qualifications dealt with elsewhere in this publication would apply.
These are estimated costs only and should, in particular, be considered in the context of acceptable building standards in each relevant country. These standards, both at a technical level and pertaining to quality, do vary from country to country, therefore the building costs must be seen as being for the normal standards prevailing in each particular region. This being the case, these costs must be used circumspectly.
The cost data under the heading “International building cost rate comparison” (see page 51) was made available by Davis Langdon Australasia. Their assistance in this regard is acknowledged with thanks. It should be noted that these rates are based on the second quarter of 2011 and can therefore not be compared with other rates contained in this publication.
DL Handbook Africa Section 4 FINAL.indd 49 2012/03/09 8:08 AM

50
4
Pri
ces
excl
ude
land
, sit
e w
orks
, pro
fess
iona
l fee
s, te
nant
fito
ut, e
quip
men
t & V
AT. H
otel
rate
s ex
clud
e an
allo
wan
ce fo
r FF&
E.
Ango
la
Luan
daBo
tsw
ana
Gabo
rone
Gha
na
Accr
aK
enya
N
airo
biM
ozam
-bi
que
Map
uto
Nig
eria
Ab
uja
Rw
anda
K
igal
iS
eneg
al
Dak
arS.
Afr
ica
Joha
n-ne
sbur
g
Tanz
ania
D
ar e
s Sa
laam
Uga
nda
Kam
pala
Zam
bia
Lusa
ka
AFR
ICA
BU
ILD
ING
CO
ST R
ATE
COM
PAR
ISO
N (U
SD)
B
uild
ing
type
Res
iden
tial
(rat
e/m
2 )
Av
erag
e m
ulti-
unit
high
-ris
e 1,
370
870
850
850
830
1,40
0 89
0 92
0 1,
050
850
880
1,27
5 Lu
xury
uni
t hig
h-ri
se
2,23
0 1,
230
1,35
0 1,
370
1,34
0 2,
200
1,44
0 1,
440
1,50
0 1,
350
1,39
0 1.
965
Indi
vidu
al p
rest
ige
hous
es
(Det
ache
d ho
uses
&
bung
alow
s)
3,83
0 1,
850
2,15
0 2,
160
2,13
0 3,
900
2,24
0 2,
200
1,50
0 2,
150
2,20
0 1,
965
Com
mer
cial
/Ret
ail (
rate
/m2 )
Aver
age
stan
dard
of
fice
s hi
gh-r
ise
1,50
0 92
0 90
0 90
0 88
0 1,
490
920
940
1,14
0 90
0 91
0 1,
590
Pre
stig
e of
fice
s hi
gh-r
ise
2,58
0 1,
540
1,46
0 2,
590
1,44
0 2,
610
1,53
0 1,
530
1,47
0 1,
460
1,50
0 1,
965
Maj
or s
hopp
ing
cent
re (C
BD
) 2,
170
1,28
0 1,
170
1,20
0 1,
150
2,19
0 1,
230
1,23
0 1,
070
1,17
0 1,
200
1,57
5In
dust
rial
(rat
e/m
2 )
Li
ght d
uty
fact
ory
1,39
0 82
0 80
0 82
0 77
0 1,
390
850
840
440
800
840
585
Hea
vy d
uty
fact
ory
2,27
0 1,
260
1,31
0 1,
330
1,26
0 2,
280
1,38
0 1,
350
600
1,31
0 1,
350
675
Hot
el (r
ate/
key)
B
udge
t 13
3,90
0 10
1,20
0 81
,000
82
,500
78
,900
13
3,30
0 84
,100
84
,100
10
0,00
0 81
,000
83
,500
12
7,50
0 Lu
xury
(inc
l spa
) 55
6,10
0 32
2,90
0 32
8,00
0 33
8,30
0 31
7,80
0 55
2,50
0 34
3,40
0 34
3,40
0 32
5,00
0 32
8,00
0 33
8,30
0 52
5,00
0 R
esor
t sty
le (i
ncl s
pa)
645,
800
363,
900
394,
600
410,
000
358,
000
697,
000
445,
900
425,
400
- 39
4,60
0 43
5,60
0 37
5,00
0O
ther
(rat
e/m
2 )
M
ulti
sto
rey
car p
ark
1,28
0 64
0 72
0 74
0 71
0 1,
270
750
790
420
720
720
585
Exch
ange
rate
s
(1 N
ovem
ber 2
011)
AO
A B
WP
GH
S
KES
M
ZN
NG
N
RW
F XO
F ZA
R
TZS
U
GX
ZMK
U
SD =
1
95.0
2 7.
20
1.58
99
.74
26.6
5 15
7.78
60
1.15
53
0.00
8.
12
1,71
0.05
2,
703.
13
4,89
7.81
DL Handbook Africa Section 4 FINAL.indd 50 2012/03/09 8:08 AM

51
4IN
TER
NAT
ION
AL B
UIL
DIN
G C
OST
RAT
E CO
MPA
RIS
ON
(USD
/m² :
2nd
QU
ARTE
R 2
011)
B
uild
ing
type
Res
iden
tial
Av
erag
e m
ulti-
unit
high
-ris
e 2,
845
1,77
0 1,
305
1,35
0 1,
370
2,14
5 56
7 1,
695
487
788
832
940
3,50
0 3,
600
3,70
0 2,
740
Luxu
ry u
nit h
igh-
rise
3,
265
2,67
0 1,
625
1,80
0 2,
000
2,37
0 1,
004
2,78
5 1,
129
995
1,16
6 1,
640
4,20
0 4,
300
4,50
0 3,
820
Indi
vidu
al p
rest
ige
hous
es
3,44
0 2,
815
1,70
0 1,
900
1,80
0 3,
690
785
#2,
420
1,01
5 1,
090
971
1,65
0 3,
400
3,50
0 3,
800
4,51
5
Com
mer
cial
/Ret
ail
Aver
age
stan
dard
offi
ces
high
-ris
e 3,
160
1,60
5 1,
185
1,50
0 1,
785
2,17
5 95
9 2,
100
794
783
753
1,25
0 3,
700
3,90
0 4,
000
3,16
0 P
rest
ige
offi
ces
high
-ris
e 3,
585
1,85
0 1,
305
1,75
0 1,
995
2,64
0 1,
283
^2,3
40
1,16
5 1,
020
987
1,60
0 4,
200
4,40
0 4,
500
4,56
0 M
ajor
sho
ppin
g ce
ntre
(CB
D)
2,53
0 1,1
10
1,26
0 1,
400
1,22
5
1,29
5 2,
500
967
890
937
1,180
2,
800
3,10
0 3,
200
2,11
0In
dust
rial
Li
ght d
uty
fact
ory
685
450
650
650
925
1,14
0 N
/A
1,13
0 46
4 40
0 60
2 43
0 1,
200
1,40
0 1,
200
960
Hea
vy d
uty
fact
ory
865
575
730
870
1,05
0 1,
245
N/A
1,
375
551
445
N/A
60
0 1,
600
1,80
0 1,
900
1,58
5
Hot
el
3-S
tar B
udge
t 3,
265
2,22
0 1,
890
2,40
0 2,
100
2,61
5 1,
180
*2,5
85
1,62
3 1,
163
1,37
2 1,
900
2,10
0 2,
200
2,25
0 2,
140
5-S
tar L
uxur
y 4,
530
2,88
0 2,
660
3,13
0 3,
350
3,32
0 1,
941
*3,4
70
2,36
5 1,
500
1,94
1 2,
500
4,50
0 4,
600
4,70
0 3,
970
Res
ort s
tyle
4,
110
2,22
0 3,
250
3,41
0 3,
575
N/A
N
/A
*3,4
70
1,40
8 1,
210
2,27
6 3,
000
4,50
0 4,
600
N/A
N
/AO
ther
M
ulti
sto
rey
car p
ark
895
535
650
550
725
985
461
770
302
435
351
460
850
880
900
685
Dis
tric
t hos
pita
l 4,
055
3,13
0 2,
465
3,29
0 3,
420
3,11
0 1,
191
N/A
1,
048
1,21
0 N
/A
1,25
0 7,
300
7,50
0 6,
300
3,31
5 P
rim
ary
& s
econ
dary
sch
ools
1,
720
1,76
0 1,
550
1,50
0 1,
100
1,45
0 62
0 1,
065
305
736
N/A
85
0 3,
000
3,20
0 3,
600
2,76
5Ex
chan
ge ra
tes
(1
Jul
y 20
11)
AUD
N
ZD
BH
D
AED
Q
AR
HK
D
CH
Y S
GD
M
YR
PH
P TH
B
RAR
U
SD
U
SD
U
SD
G
BP
U
SD =
1
0.93
1.
25
0.83
3.
67
3.64
7.
80
6.47
1.
24
3.00
45
.50
29.8
8 7.
00
1.00
1.
00
1.00
0.
63
Not
e: P
rice
s ex
clud
e la
nd, s
ite
wor
ks, p
rofe
ssio
nal f
ees,
tena
nt fi
tout
and
equ
ipm
ent.
* R
ates
incl
ude
FF&
E. E
xcl.
GST
/VAT
. # R
ate
incl
udes
par
king
and
min
imal
ext
erna
l w
orks
. ^ R
ate
incl
udes
rais
ed fl
oori
ng a
nd c
eilin
g to
tena
nted
are
as.
Sydn
eyAu
ck-
land
Bah
rain
Abu
Dha
bi
UAE
Doh
a,
Qat
arH
ong
Kon
gB
eijin
gSi
nga-
pore
Kua
la
Lum
pur
Man
ilaB
angk
okJo
han-
nesb
urg
Los
Ange
les
San
Fran
-ci
sco
New
Yo
rkLo
ndon
DL Handbook Africa Section 4 FINAL.indd 51 2012/03/09 8:08 AM

52
4
INTERNATIONAL PRESTIGIOUS OFFICE RENTAL COMPARISON
Country City USD/m² per annum
Australia Adelaide 490Australia Brisbane 860Australia Melbourne 540Australia Perth 820Australia Sydney 990Bahrain Manama 400Botswana Gaborone 195China Beijing 550China Guangzhou 375China Hong Kong 1,750China Shanghai 600Egypt Cairo 330England Birmingham 470England Cambridge 415England Leeds 415England Liverpool 325England London (City) 990England London (West End) 1,650England Manchester 480England Oxford 340France Paris 1,000India Bangalore 190India Mumbai 700Indonesia Jakarta 260Ireland Dublin 450Kenya Nairobi 160Korea Seoul 500Lebanon Beirut 380Malaysia Kuala Lumpur 265Mozambique Maputo 360New Zealand Auckland 430
DL Handbook Africa Section 4 FINAL.indd 52 2012/03/09 8:08 AM

53
4
New Zealand Christchurch 400New Zealand Wellington 430Nigeria Abuja 585Nigeria Lagos 720Philippines Manila 230Qatar Doha 640Russia Moscow 1,200Russia St Petersburg 700Rwanda Kigali 280Scotland Edinburgh 485Scotland Glasgow 470Singapore Singapore 940South Africa Cape Town 240South Africa Durban 230South Africa Johannesburg 310South Africa Port Elizabeth 220South Africa Pretoria 230Spain Barcelona 290Tanzania Dar Es Salaam 290Thailand Bangkok 300Uganda Kampala 260United Arab Emirates Dubai 440 (International Financial Centre Excluded) United Arab Emirates Dubai 630 (International Financial Centre)
United Arab Emirates Abu Dhabi 550USA Boston 700USA Los Angeles 350USA New York (Manhattan) 1,000USA Philadelphia 350USA Sacramento 300USA San Francisco 500USA Seattle 500USA Washington DC 600Zambia Lusaka 250
Note: Rates are applicable as at 1 January 2012 and exclude VAT, but include General Sales Tax where applicable. Above are gross rentals and include operating costs and municipal costs, but exclude electricity and water consumption.
DL Handbook Africa Section 4 FINAL.indd 53 2012/03/09 8:08 AM

54
4
NOTES
DL Handbook Africa Section 4 FINAL.indd 54 2012/03/09 8:08 AM

55
5
5BUILDING COST
DL Handbook Africa Section 5 FINAL.indd 55 2012/03/09 8:09 AM

56
5
DL Handbook Africa Section 5 FINAL.indd 56 2012/03/09 8:09 AM

57
5
BUILDING COSTThe meaning of the words “building cost” depends on the application and context. A building contractor, for example, may refer to building cost as the cost of labour, material, plant, fuel and supervision. In contrast, a developer may refer to building cost as either the tender price from the contractor or to the ultimate cost of the project, which could include professional fees, plan approval fees, escalation, loss of interest, etc.
For the purposes of this document, building cost shall be deemed to mean the tender price (or negotiated price) submitted by the building contractor.
ESCALATION RATEThere seem to be two popular methods of calculating and expressing percentage annual increases, namely the average rate and the year-on-year rate. The average rate is of no real use in calculating escalation and is of general interest only. The year-on-year rate should be used in escalation calculations, taking cognisance of actual project programmes.
The average rate compares the indices for each month (or quarter) of the year with those of the corresponding months (or quarters) of the preceding year and calculates the average of these, which is then quoted as the average annual increase for that particular year.
The year-on-year rate compares the January (or December) index with the index for the corresponding month of the previous year and reflects the increase over that year.
There could be a significant difference in the two rates in question. For example, in 2008 the year-on-year rate (January 2008 to January 2009) of building cost inflation in South Africa is only 6.3 % but the average annual rate (comparing monthly indices) is 14.4 %.
DL Handbook Africa Section 5 FINAL.indd 57 2012/03/09 8:09 AM

58
5
CALCULATION OF ESTIMATED ESCALATION OF CONSTRUCTION CONTRACTSPre-contract
Construction cost, for various reasons, change on an ongoing basis. Provision should therefore be made for the changes in tender prices during the period from the date of the estimate to the expected tender date. When the said increase is added to the estimated current building cost, the total will equal the anticipated tender amount.
It is calculated by multiplying the estimated current building cost by the average estimated monthly percentage increase and by the number of months from the date of the estimate to the tender date.
Contract price adjustment
Provision is made for the escalation in building cost during the contract period. The Joint Building Contracts Committee — Series 2000 Contract Price Adjustment Provisions (JBCC CPAP) formula provides for 85 % of the contract amount to be subject to escalation adjustment — the remaining 15 % to stay fixed. Furthermore, a factor must be introduced to take account of the cash flow of payments during the construction period — usually 0.6 is acceptable if a short method of calculation is employed.
The total escalation during the contract period is therefore calculated by multiplying the anticipated tender amount by 0.85 and 0.6 and then by the estimated monthly percentage increase indicated by the relevant indices incorporated in the JBCC CPAP formula and by the contract period expressed in months.
DL Handbook Africa Section 5 FINAL.indd 58 2012/03/09 8:09 AM
59
5
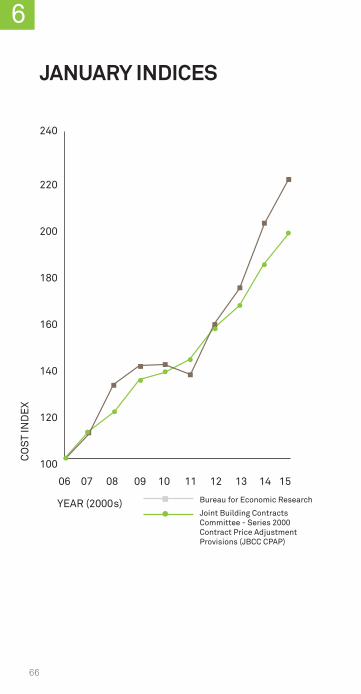
TENDER PRICE ESCALATIONThe annual year-on-year increases in building costs (i.e. tender prices) based on the indices published by the Bureau for Economic Research, University of Stellenbosch (BER) (January-to-January of each year) and for JBCC CPAP formula (work group 181 “Commercial/Industrial buildings”) published by Statistics South Africa (P0151), are as follows:
DL Handbook Africa Section 5 FINAL.indd 59 2012/03/09 8:09 AM

60
5
COST INDICES APPLICABLE TO THE BUILDING INDUSTRY
Note: The average annual increases indicated by the BER in their publications are the average of the quarterly increases for that particular year and will not correspond to the above year-on-year increases.
The difference between the tender price escalation and the escalation according to the indices incorporated in the JBCC CPAP formula for any one period may be attributed to the market factor, which incorporates the contractor’s mark-up, productivity, availability of materials, etc.
* Forecast based on information provided by Medium- Term Forecasting Associates Building Economists,
Stellenbosch.
YEAR BER JBCC CPAP TMI
Index (Jan 2006 =100)
Year-on-year increase
Index (Jan 2006 =100)
Year-on-year increase
2006 100.0 100.0
2007 111.2 + 11.2% 111.5 + 11.5% 1.00
2008 131.7 + 18.4% 120.2 + 7.8% 1.10
2009 140.0 + 6.3% 133.9 + 11.4% 1.05
2010 140.5 + 0.4% 137.5 + 2.7% 1.02
2011 136.3 - 3.0% 142.7 + 3.8% 0.96
*2012 158.0 + 15.9% 155.9 + 9.2% 1.01
*2013 174.7 + 10.6% 166.2 + 6.6% 1.06
*2014 201.8 + 15.5% 183.8 + 10.6% 1.10
*2015 221.0 + 9.5% 197.7 + 7.6% 1.12
DL Handbook Africa Section 5 FINAL.indd 60 2012/03/09 8:09 AM

61
5
TENDER CLIMATEThe column marked tender market indicator (TMI), gives an indication of the tender climate. The building cost index, as published by the BER and which is based on tender prices, has been deflated by the index for JBCC CPAP work group 181, which is based on the cost of labour and material. The result is the movement of tender prices excluding the influence of market costs of labour and material, giving an indication of competitiveness of tendering. It represents a comparison or rate of change of BER and JBCC CPAP indices.
When the TMI (see graph on page 67) shows a downward gradient, this indicates a favourable tender market, i.e. the next point is numerically less than the previous, which results from the calculation of BER divided by JBCC CPAP and indicates that the increase in BER (tender index) is less than the increase in the JBCC CPAP index; therefore, a favourable tender market from the viewpoint of the employer exists.
Conversely, if the graph has an upward gradient, the increase in BER is greater than the increase in JBCC CPAP indices, indicating an unfavourable tender market from the viewpoint of the employer and it would be prudent to recommend negotiation as opposed to tendering.
This tendency is also apparent on the cost indices graph (see page 66). When the two lines (JBCC CPAP and BER) converge, i.e. JBCC CPAP is “dropping” and BER is “rising,” then you should negotiate. When the two lines diverge, i.e. JBCC CPAP is “rising” and BER is “dropping,” then proceed to tender instead.
Base dates: To allow for comparison of indices, a factor has been introduced resulting in an equal base to both BER and JBCC CPAP indices (i.e. January 2006 = 100).
DL Handbook Africa Section 5 FINAL.indd 61 2012/03/09 8:09 AM

62
5
UNIQUE LARGE-SCALE PROJECTSBuilding cost estimation seems to become more complex when unique circumstances prevail. For example, in anticipation of the 2010 FIFA World Cup South Africa™, many new construction works and associated infrastructure projects were under construction. Projects of such magnitude can only be constructed by major contractors possessing the required expertise and resources. It was apparently experienced throughout that the unit costs of these projects were significantly higher than originally anticipated. Selected contractors at this level have little competition, and based on a favourable supply and demand market for them, priced costs accordingly, resulting in clients’ cost overruns, causing severe pressure on budgets.
VALUE ADDED TAXAs the majority of developers are registered vendors in the property industry, any value added tax (VAT) paid by them on commercial property development is fully recoverable. Therefore, to reflect the net development cost, VAT should be excluded. Should the gross cost (i.e. after VAT inclusion) be required, then VAT at the ruling rate (currently 14 %) should be added.
Cognisance should be taken, however, of the effect of VAT on cash flow over a period of time. This will vary according to the payment period of the individual vendor, but in all cases will add to the capital cost of the project to the extent of interest on the VAT outstanding for the VAT cycle of the particular vendor.
DL Handbook Africa Section 5 FINAL.indd 62 2012/03/09 8:09 AM

63
6
6GRAPHS:
BER AND JBCC CPAP
DL Handbook Africa Section 6 FINAL.indd 63 2012/03/09 8:19 AM

64
6
DL Handbook Africa Section 6 FINAL.indd 64 2012/03/09 8:19 AM

65
6
JANUARY-TO-JANUARY% Change
20
19
18
17
16
15
14
13
12
11
10
9
8
7
6
5
4
3
2
1
0
06 07 08 09 10 11 12 13 14
PE
RC
EN
TAG
E
YEAR (2000s) Bureau for Economic Research
Joint Building Contracts Committee — Series 2000 Contract Price Adjustment Provisions (JBCC CPAP)
DL Handbook Africa Section 6 FINAL.indd 65 2012/03/09 8:19 AM
66
6
Bureau for Economic Research
Joint Building Contracts Committee - Series 2000 Contract Price AdjustmentProvisions (JBCC CPAP)
JANUARY INDICES
240
220
200
180
160
140
120
100
06 07 08 09 10 11 12 13 14 15
YEAR (2000s)
CO
ST
IND
EX
DL Handbook Africa Section 6 FINAL.indd 66 2012/03/09 8:19 AM

67
6
TENDER MARKET INDICATORBER deflated by JBCC CPAP
1.15
1.10
1.05
1.00
0.95
0.90
0.85
06 07 08 09 10 11 12 13 14
Note: This graph gives an indication of the tender climate. It is the result of the relationship between BER and JBCC CPAP. Refer section 5, page 60.
YEAR (2000s)
IND
ICAT
OR
DL Handbook Africa Section 6 FINAL.indd 67 2012/03/09 8:19 AM

68
6
NOTES
DL Handbook Africa Section 6 FINAL.indd 68 2012/03/09 8:19 AM

69
7
7METHOD FOR
MEASURING RENTABLE AREAS
DL Handbook Africa Section 7 FINAL.indd 69 2012/03/09 8:11 AM

70
7
DL Handbook Africa Section 7 FINAL.indd 70 2012/03/09 8:11 AM

71
7
SAPOA METHODS In the past, many landlords and developers have derived methods for calculating the rentable areas in buildings.
The current, most commonly used, is the method recommended by South African Property Owners Association (SAPOA) entitled “Method for Measuring Floor Areas in Buildings, First Edition” (effective from 1st August 2005). It replaces the document, “The SAPOA Method for Measuring Floor Areas in Commercial and Industrial Buildings” (updated August 1991). It should be noted, however, that the latest edition is approved for use from the 1st of August 2005 and that it should not be applied retrospectively.
Notwithstanding or detracting from the above publication, and by kind permission of SAPOA, we have abbreviated and simplified for easier understanding the definitions contained in that document, together with our comments on the use of rentable areas as follows:
The document separately provides methods for measuring floor areas of:
- Offices of all types
- Retail developments, including malls, stand-alone, strip and value centres/warehouses
- Industrial developments, including factories, warehouses, mini-units and trading warehouses, multi-storey and the like
- Residential buildings, including houses, flats/ apartments, townhouses, cluster houses, etc.
For “offices of all types” referred to before, the following definitions and explanations are applicable:
THE BASISThe basis used in calculating the rentable area, is the measurement of useable area together with common area and supplementary area, which is determined at each level of offices. Unless otherwise indicated, the unit of measurement is given in square metres (m²).
DL Handbook Africa Section 7 FINAL.indd 71 2012/03/09 8:11 AM

72
7
AREA DEFINITIONSConstruction area
The construction area is the entire covered built area. This is the sum of the areas measured at each floor level over any external walls to the external finished surface.
Only the lowest levels of atria are to be included, and all openings on other levels to form atria, are to be excluded.
Rentable area
The rentable area is the total area of the building that is enclosed by the dominant face and is adjusted by deducting major vertical penetrations. No deduction shall be made for columns.
Its intended use is in determining the revenue-producing area of a building, which comprises rentable area, supplementary area and parking. It is also used by those analysing the economic potential of a building.
Rentable area shall have a minimum floor-to-ceiling height of 1.5 metres.
Rentable area comprises useable area plus common area.
Rentable area excludes supplementary area, which may produce additional revenue.
Useable area
The useable area is the area capable of exclusive occupation by the tenant — the total area of the building enclosed by the dominant face, adjusted by deducting all common area and major vertical penetrations. No deduction shall be made for columns.
Its intended use is to be the essential part of rentable area and the basis for the apportionment of common area.
Common area
Common area is an area to which the tenant has access and/or use, and is part of rentable area. Primary common area of the building is apportioned to tenancies pro-rata to the useable area of that tenancy. Secondary common area is apportioned only to tenancies that it services.
The common area has two components:
DL Handbook Africa Section 7 FINAL.indd 72 2012/03/09 8:11 AM

73
7
- The primary common area comprises all rentable area on a given floor that is not useable area, together with remote common area, which comprises areas such as entrance foyers, plant and service rooms, or any other portion of rentable area not located on the given floor.
- The secondary common area comprises areas beyond primary common area giving access to multiple tenancies. Accordingly, this area may vary over the life of a multiple tenancy building.
Supplementary area
Supplementary area is any additional revenue-producing component that falls outside of the definition of rentable area. Supplementary area need not be weatherproof, and includes, for example, storerooms, balconies, terraces, patios, access/service passages and signage/advertising areas and parking areas demarcated for the use of the tenant.
Parking bays shall be given in number.
GENERAL DEFINITIONSAtrium
An atrium is a weatherproof interior space, accessible and capable of use by the tenant at the lowest level. Voids in floors above atrium space shall not be included in rentable area.
Entrance foyer
The entrance foyer is a portion of remote common area, including associated adjacent rooms and lobby.
Lift lobby and entrance foyers that occur together with parking floors (not adjacent to office areas) shall be remote common area.
Major vertical penetrations
Stairs and landings, lift shafts, flues, pipe shafts, vertical ducts, and the like, and their enclosing walls, exceeding 0.5m² in area, shall be deducted from rentable area.
Remote service areas and plant rooms
Remote refuse rooms, electrical sub-stations, transformer rooms, central air-conditioning plant rooms and lift motor rooms shall be included in primary common area.
DL Handbook Africa Section 7 FINAL.indd 73 2012/03/09 8:11 AM

74
7
Storage areas
Dedicated storage areas within useable area shall be included as useable area.
Dedicated storage areas are separately listed as supplementary areas.
RETAIL, INDUSTRIAL, RESIDENTIAL AND OTHER DEVELOPMENTSSimilar provisions have been made for measuring floor areas of retail, industrial and residential buildings referred to above. For detailed information, it is suggested that the relevant sections of the said document be carefully studied.
The above method is designed to accommodate the measurement, as far as practical, of most building types, however, certain building types such as hotels, leisure and sport centres, petrol stations, hospitals, law courts, retirement villages and others may only be able to utilise the underlying principles adopted within this method.
GENERALLYDevelopers and financiers are constantly attempting to either reduce building costs or increase rental levels to achieve higher returns. When these parameters are exhausted, it becomes incumbent on the architects and designers to design more efficiently. One must therefore understand the complete “SAPOA Method for Measuring Floor Areas in Buildings, First Edition,” and implement the various facets of the definitions to achieve higher efficiencies between the various areas.
The initial return is more sensitive to an increase in rental income (which can be affected by increasing the rental area) than the corresponding percentage reduction in construction costs.
Once again, the above has been published as a quick guideline only, and should not be used in preference to the SAPOA publication, which is far more comprehensive and detailed. We are thankful to SAPOA for their permission to use extracts from this publication.
DL Handbook Africa Section 7 FINAL.indd 74 2012/03/09 8:11 AM

75
8
8RETURN ON INVESTMENT
DL Handbook Africa Section 8 FINAL.indd 75 2012/03/09 8:11 AM

76
8
DL Handbook Africa Section 8 FINAL.indd 76 2012/03/09 8:11 AM

77
8
CRITERIA TO BE EMPLOYED There are two distinct criteria generally used for evaluating the financial viability of a property investment, namely:
- The initial return and
- The cash flow analysis
THE INITIAL RETURNThe initial return is based on the net income during the first year of operation of the development. The return is expressed as a percentage per annum of the anticipated capital investment. Escalation in construction cost and cost of capital are both taken into account in an effort to incorporate the “time value of money.”
The major advantage of employing the initial return method is that expenses and income do not have to be escalated too far into the future and these are therefore relatively accurate and easily understood in today’s money terms. The fact that the first year of operation may have a higher vacancy factor than subsequent years should be ignored when the initial return is calculated in order to reflect long-term potential more accurately.
The initial return should be qualified as follows:
- All expenses and income have been escalated to the construction completion date
- Interim income received prior to the construction completion date has been deducted from the capital investment after adjusting for operating expenses and cost of capital
- The returns are expressed as percentages of the escalated capital investment and do not take into account loans, loan repayments or interest charges on loans
- The calculated returns are for the first complete year of operation only and do not cater for the following:
- When the project may not reach full maturity during the first year of operation
- Vacancies
- Recoupment of capital during the income-bearing period of the investment or realisation value of the investment at the end of the investment period
- Income tax
DL Handbook Africa Section 8 FINAL.indd 77 2012/03/09 8:11 AM

78
8
CASH FLOW ANALYSIS OVER A PREDETERMINED PERIODIn the cash flow method, the income and expenditure cash flow over the economic lifespan of the investment is taken into account. Usually an internal rate of return (IRR) and/or a net present value (NPV) is employed to evaluate the financial viability.
The NPV (discounted cash flow) method works as follows: determine the sum of all cash flows (inflows, outflows and initial investment) and discount to present values at the project’s cost of capital. With a positive NPV the project can be accepted and it should be rejected if the NPV is negative.
The IRR is the rate of interest that equates the present value of the expected future net income with the present value of the cost of the investment. The NPV would therefore be exactly zero if the IRR is used as the discount rate. The IRR of an investment is generally used by institutional investors, as it is a comparative indication of the profitability of alternative investment options.
A weakness of the IRR calculation is the fact that an implicit assumption is made that cash flows are reinvested at the project’s own IRR. The modified internal rate of return (MIRR) overcomes this problem by assuming that cash flows are reinvested at the cost of capital rate (or any other given rate), and may be calculated in addition. As the cost of capital rate is normally determined at a lower rate than the IRR, it can be assumed that the MIRR-calculation will always render a lower result.
The assumptions on which the cash flow return is based should be listed. These should inter alia include the assumed investment period (e.g. 20 years after the construction completion date), that income has been taken into account at the beginning of each month and expenditure at the end of each month, the terminal value, escalation in rental and operating expenses over the investment period, etc.
It is suggested that, where applicable, a comprehensive financial viability analysis should incorporate both the initial return and the cash flow method of evaluation. It is of significance to notice by informal observation, by the experienced analyst, that there is a close relationship between the initial return and the IRR — to be applied with care, however.
DL Handbook Africa Section 8 FINAL.indd 78 2012/03/09 8:11 AM

79
8
EXAMPLETotal capital expenditure (investment) R 100,000,000
Rental in first year (net income) R 10,500,000
Initial return in first year 10.50%
Escalation in net rental income 9.00% per annum
Net cash flow
Year 0 -100,000,000Year 1 10,500,000Year 2 11,445,000Year 3 12,475,050Year 4 13,597,805Year 5 14,821,607Year 6 16,155,552Year 7 17,609,551Year 8 19,194,411Year 9 20,921,908Year 10 22,804,879Year 11 24,857,319Year 12 27,094,477Year 13 29,532,980Year 14 32,190,948Year 15 35,088,134Year 16 38,246,066Year 17 41,688,212Year 18 45,440,151Year 19 49,529,764Year 20 53,987,443 (+ terminal value) 560,441,075 614,428,518
The IRR with 9.00% annual escalation in rental is 19.50%.The terminal value is subjective and in this example has been assumed as the capitalised value of the anticipated rental in year 21 (i.e. R53, 987,443 + 9.00% = R58, 846,313) capitalised at the initial yield, i.e. 10.50%.
DL Handbook Africa Section 8 FINAL.indd 79 2012/03/09 8:11 AM

80
8
Should the terminal value be assumed to be nil (this is unlikely as the land parcel will always have a value), the IRR drops to 16.92%.
A rule of thumb for the calculation of the approximate IRR for an investment is that it is equal to the sum of the initial return plus the escalation rate (assumed to be constant over the investment period), provided that the terminal value is calculated as in the given example, i.e. the capitalised value of the anticipated rental in the year after disposal, assuming a capitalisation rate equal to the initial return.
Thus, in the given example, the initial return is 10.50%, the escalation rate is 9.00% and the approximate IRR is the sum of the two, i.e. 19.50%.
Note: Where Green Star South Africa ratings are a requirement, cash flow analyses over longer time periods have become essential. Capital expenses are normally higher due to investment in “green” technology and more expensive methods employed. Therefore, the long-term effect on the operation and maintenance of buildings due to better energy efficiency and the like should be demonstrated to building owners and tenants in order to determine the viability in a scientific way.
DL Handbook Africa Section 8 FINAL.indd 80 2012/03/09 8:11 AM

81
9
9RESIDUAL LAND VALUE
DL Handbook Africa Section 9 FINAL.indd 81 2012/03/09 8:11 AM

82
9
DL Handbook Africa Section 9 FINAL.indd 82 2012/03/09 8:12 AM
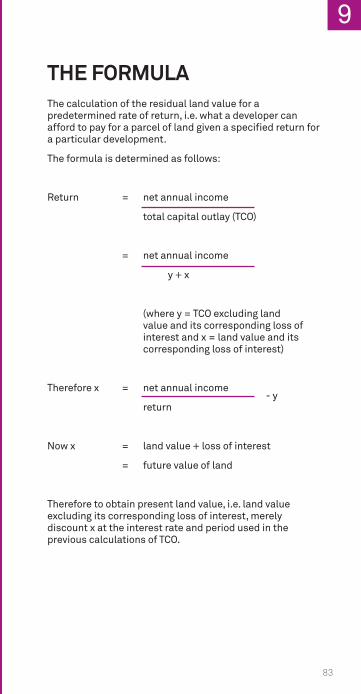
83
9
THE FORMULAThe calculation of the residual land value for a predetermined rate of return, i.e. what a developer can afford to pay for a parcel of land given a specified return for a particular development.
The formula is determined as follows:
Return = net annual income
total capital outlay (TCO)
= net annual income
y + x
(where y = TCO excluding land value and its corresponding loss of interest and x = land value and its corresponding loss of interest)
Therefore x = net annual income
return
Now x = land value + loss of interest
= future value of land
Therefore to obtain present land value, i.e. land value excluding its corresponding loss of interest, merely discount x at the interest rate and period used in the previous calculations of TCO.
- y
DL Handbook Africa Section 9 FINAL.indd 83 2012/03/09 8:12 AM

84
9
EXAMPLEWhat price should be paid for land to obtain a return of 10.00% p.a. with a net annual income of R6,000,000 and the following capital outlay?
Estimated escalated building cost R 38,150,000
Professional fees 5,725,000
Legal and plan approval fees 45,000
Interim rates on ground during construction period 265,000
Loss of interest and/or bond interest at 10.5% p.a. compounded monthly over a 15 month construction period 3,180,000
Total capital outlay excluding land cost (y) R 47,365,000
x = net annual income
return
= R6,000,000
0.10
= R12,635,000
Therefore land value is R12, 635,000 discounted at 10.5% p.a. over 15 months = R11, 087,204 (say) R 11,000,000
The above residual value is very sensitive to changes of the required rate of return, otherwise known as the capitalisation rate (CAP rate), and careful consideration should be given to this rate, taking into account the risk profile of the proposed development.
- y
- R47,365,000
DL Handbook Africa Section 9 FINAL.indd 84 2012/03/09 8:12 AM

85
10
10AFRICA IN FIGURES
DL Handbook Africa Section 10 FINAL.indd 85 2012/03/09 8:12 AM

86
10
DL Handbook Africa Section 10 FINAL.indd 86 2012/03/09 8:12 AM

87
10
Land
are
a (0
00km
2 )
Pop
mill
ion
2009
Aver
age
annu
al %
gr
owth
200
0-20
09
Pop
dens
ity
(per
km
²) 2
009
HIV
pre
vale
nce
% o
f po
p ag
es
15-4
9 2
007
AREA AND POPULATION
Angola 1,247 18.0 2.9 14 2.1
Botswana 582 1.9 1.4 3 *
DRC 2,345 66.0 2.9 29 *
Ghana 239 24.0 2.2 103 1.9
Kenya 580 40.0 2.6 68 *
Lesotho 30 2.1 1.0 68 *
Malawi 118 15.0 2.8 158 11.9
Mozambique 802 23.0 2.5 28 12.5
Namibia 824 2.2 1.9 3 *
Nigeria 924 155.0 2.4 166 3.1
South Africa 1,221 49.0 1.3 40 18.1
Swaziland 17 1.2 1.0 68 *
Tanzania 945 44.0 2.8 48 6.2
Uganda 241 33.0 3.2 161 5.4
Zambia 753 13.0 2.4 17 15.2
Zimbabwe 391 13.0 0.1 32 15.3
Source: World Development Report 2011 * Figures not available
DL Handbook Africa Section 10 FINAL.indd 87 2012/03/09 8:12 AM

88
10
POPULATION 2009160
150
140
130
120
110
100
90
80
70
60
50
40
30
20
10
0
Ang
ola
Bot
swan
a
DR
C
Gha
na
Ken
ya
Leso
tho
Mal
awi
Moz
ambi
que
Nam
ibia
Nig
eria
Sou
th A
fric
a
Sw
azila
nd
Tanz
ania
Uga
nda
Zam
bia
Zim
babw
e
Mill
ion
DL Handbook Africa Section 10 FINAL.indd 88 2012/03/09 8:12 AM
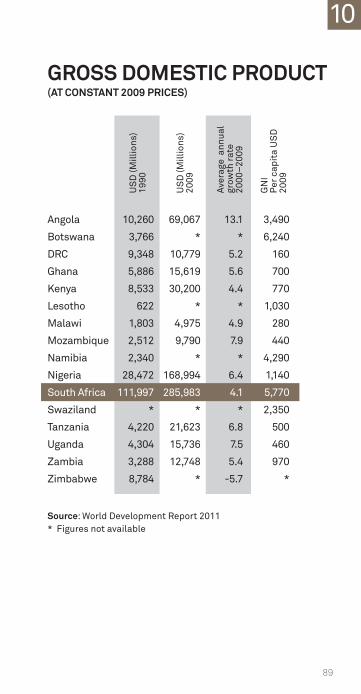
89
10
GROSS DOMESTIC PRODUCT (AT CONSTANT 2009 PRICES)
Angola 10,260 69,067 13.1 3,490
Botswana 3,766 * * 6,240
DRC 9,348 10,779 5.2 160
Ghana 5,886 15,619 5.6 700
Kenya 8,533 30,200 4.4 770
Lesotho 622 * * 1,030
Malawi 1,803 4,975 4.9 280
Mozambique 2,512 9,790 7.9 440
Namibia 2,340 * * 4,290
Nigeria 28,472 168,994 6.4 1,140
South Africa 111,997 285,983 4.1 5,770
Swaziland * * * 2,350
Tanzania 4,220 21,623 6.8 500
Uganda 4,304 15,736 7.5 460
Zambia 3,288 12,748 5.4 970
Zimbabwe 8,784 * -5.7 *
Source: World Development Report 2011* Figures not available
US
D (M
illio
ns)
1990
US
D (M
illio
ns)
2009
Aver
age
ann
ual
grow
th ra
te
2000
–200
9
GN
I Pe
r ca
pita
US
D
2009
DL Handbook Africa Section 10 FINAL.indd 89 2012/03/09 8:12 AM

90
10
GROSS DOMESTIC PRODUCT 2009
280000
260000
240000
220000
200000
180000
160000
140000
120000
100000
80000
60000
40000
20000
0
7000
6500
6000
5500
5000
4500
4000
3500
3000
2500
2000
1500
1000
500
0
USD Millions GNI per capita USD
Ang
ola
Bot
swan
aD
RC
Gha
naK
enya
Leso
tho
Mal
awi
Moz
ambi
que
Nam
ibia
Nig
eria
Sou
th A
fric
aS
waz
iland
Tanz
ania
Uga
nda
Zam
bia
Zim
babw
e
DL Handbook Africa Section 10 FINAL.indd 90 2012/03/09 8:12 AM

91
11
11DIRECTORY OF OFFICES
DL Handbook Africa Section 11 FINAL.indd 91 2012/03/09 8:13 AM

92
11
DL Handbook Africa Section 11 FINAL.indd 92 2012/03/09 8:13 AM

93
11
DIRECTORY OF OFFICESCORPORATE OFFICE
Johannesburg Tel: +27 (0) 11 666 2000E-mail: [email protected] Address: 2nd Floor Citibank Plaza Building 145 West Street, Sandton, 2196Managing director: Indresen PillaySenior executive: Andries Schoeman Executives: Stefan Smit Yagen Naidoo
REGIONAL OFFICES
Cape TownTel: +27 (0) 21 423 7840E-mail: [email protected] Address: 45 Buitengragt Street, Cape Town,
8000Executives: Alan van Rensburg Martin Meinesz Tim Smith
DurbanTel: +27 (0) 31 275 4200E-mail: [email protected]: 1st Floor, 17 The Boulevard, Westway
Office Park, Westville, Durban, 3630Executives: Andries Schoeman Dean Narainsamy Martin Donnelly Rakesh Patel
GeorgeTel: +27 (0) 44 873 5070E-mail: [email protected] Address: 97 Mitchell Street, George, 6529Executive: Dean Chandler
JohannesburgTel: +27 (0) 11 666 2000E-mail: [email protected]: 2nd Floor Citibank Plaza Building 145 West Street, Sandton, 2196Executives: Alastair Reid Craig Hall Craig Stuart
DL Handbook Africa Section 11 FINAL.indd 93 2012/03/29 3:16 PM

94
11
Gerhard Brümmer Ian Gildenhuys Indresen Pillay Kevin Pickup Neels Heunis Rob Black Rob Fleming Sean Forbes
PietermaritzburgTel: +27 (0) 33 345 8371E-mail: [email protected] Address: 300 Jabu Ndlovu Street,
Pietermaritzburg, 3201Executive: Noel Stevens
Port ElizabethTel: +27 (0) 41 365 6221E-mail: [email protected] Address: 25A Frank Street, Newton Park,
Port Elizabeth, 6000Executive: Dean Chandler
PretoriaTel: +27 (0) 12 460 5100E-mail: [email protected] Address: 1st Floor Lakeview II, 138 Middel Str,
Nieuw Muckleneuk, Pretoria, 0001Executives: Karl Röhrs Pieter Rossouw Tobie van Wyk
StellenboschTel: +27 (0) 21 880 8300E-mail: [email protected] Address: Time Square, 9 Electron Street,
Technopark, Stellenbosch, 7600Executives: Francois du Toit Ian Sutherland
DL Handbook Africa Section 11 FINAL.indd 94 2012/03/09 8:13 AM

95
11
AFRICA
Tel: +27 (0) 11 666 2000E-mail: [email protected]: 2nd Floor Citibank Plaza Building 145 West Street, Sandton, 2196Senior Executive: Andries SchoemanExecutives: Greg Pearson Mohammad Seedat
BOTSWANA Davis Langdon BotswanaTel: +267 390 0711E-mail: [email protected] Address: Plot 127, Unit 10, Kgale Court,
Gaborone International Finance Park, Gaborone, Botswana
Executive: Fred Selolwane
MOZAMBIQUE Davis Langdon MozambiqueTel: +258 21 490 696/7E-mail: [email protected] Address: Rua D. Estevao de Ataide No. 38/48,
Sommerschield 1, Maputo, Mozambique
Executive: Charle Viljoen
DL Handbook Africa Section 11 FINAL.indd 95 2012/03/09 8:13 AM

96
11
NOTES
DL Handbook Africa Section 11 FINAL.indd 96 2012/03/09 8:13 AM

92
11
Printed on Munken Lynx. Munken is an environmentally friendly and ecologically sound uncoated wood free paper. The producing mill is certifi ed according to ISO 14001 and report their work according to EMAS. It is FSC™ (The mark of responsible forestry) and PEFC (Promoting sustainable Forestry) certifi ed.
Written and revised by Dr. Gerhard Brümmer, ExecutiveResearch assistant Corrie PienaarDesign and layout Jme Creative
DAVIS LANGDON, AN AECOM COMPANYAFRICA REGIONPROPERTY AND CONSTRUCTION HANDBOOK 2012
25th EDITION © 2012
ISBN 978-0-620-52370-7
Published by Davis Langdon as a service to the property and construction industry.
All rights reserved. No part of this publication may be reproduced, copied, stored or transmitted in any form without prior written permission fromDavis Langdon.
The information contained herein should be regarded as indicative and for general guidance only. Davis Langdon makes no representation, expressed or implied, with regard to the accuracy of the information herein and cannot accept any responsibility or liability for any errors or omissions that maybe made.
FOUNDING MEMBER : CATEGORY SILVER
certitit fiifii efiefi dede
DEKRA Certification
ISO 9001:2008Quality Management
We are certifiedVoluntary participation in regular monitoring according to ISO 9001:2008
certitit fiifii efiefi dede
DEKRA Certification
ISO 14001EnvironmentalManagementISO 14001:2004Voluntary participation in regular monitoring
certitit fiifii efiefi dede
DEKRA Certification
OHSAS 18001Work SafetyOHSAS 18001
Voluntary participation in regular monitoring
DL Handbook Africa Cover Elec FINAL.indd 92 2012/03/29 3:20 PM