Embed Size (px)
Citation preview

Thomas Weisel Partners does and seeks to do business with companies covered in its research reports. As a result, investors should be aware that the firm may have a conflict of interest that could affect the objectivity of this report. Customers of Thomas Weisel Partners in the United States can receive independent, third-party research on the company or companies covered in this report, at no cost to them, where such research is available. Customers can access this independent research at www.tweisel.com or can call (877) 921-3900 to request a copy of this research. Investors should consider this report as only a single factor in making their investment decision.
Please see analyst certification and other important disclosures
starting on page 70 and continuing through page
70.
Equity Research
A Primer on Energy Efficiency Conservation Gets a New Name
A White Paper on a Facet of the Industrial Growth Sector
Alternative Energy Jeff Osborne 212.271.3577 [email protected] Scott Reynolds 212.271.3429 [email protected] Dilip Warrier 415.364.2983 [email protected] January 31, 2008


A Primer on Energy Efficiency Conservation Gets a New Name
Table of Contents
Executive Summary.........................................................................................................................................................5 Alarming Expected Energy Use Calls for A Response...............................................................................................6 The Commercial and Industrial Market for Green Buildings....................................................................................8 The Healthcare Market for Green Buildings ............................................................................................................ 12 The Education Market for Green Buildings ............................................................................................................. 13 The Residential Market For Green Buildings ........................................................................................................... 13 Leadership in Energy and Environmental Design Standards Becoming Synonymous with Green Building.. 17 Regulation: Government Is Stepping Up to the Plate for Energy Efficiency ...................................................... 20 The 2007 Energy Bill.................................................................................................................................................... 21 Materials: Major Products and Trends in Energy Efficiency.................................................................................. 23 Lighting .......................................................................................................................................................................... 23 Types of Lights.............................................................................................................................................................. 27 Heating, Ventilation and Air-Conditioning (HVAC)............................................................................................... 37 Understanding Efficiency Measures........................................................................................................................... 42 HVAC Controls ............................................................................................................................................................ 48 Equipment ..................................................................................................................................................................... 51 Water Use....................................................................................................................................................................... 56 The Building Envelope ................................................................................................................................................ 57 Windows ........................................................................................................................................................................ 57 Insulation ....................................................................................................................................................................... 62 Foundations................................................................................................................................................................... 65 Roofs .............................................................................................................................................................................. 66 Walls ............................................................................................................................................................................... 67 Examples of “Green Buildings” ................................................................................................................................. 68


January 31, 2008 Thomas Weisel Partners LLCPage 5 of 71 Jeff Osborne 212.271.3577
A Primer On Energy Efficiency Conservation Gets a New Name
EXECUTIVE SUMMARY
Conservation gained a bad name in the 1980’s when President Ronald Reagan referred to it as being “cold in the winter and hot in the summer”. With the resurgence of high energy prices, however, energy usage has once again been pushed to the front burner, but this time with a new name and concept. Energy efficiency is the idea that energy can be used in a better way, while providing a product that is superior to the previous at little or no extra cost. It is essentially educating people that the products and services needed to reduce energy use exist now and do not involve turning down lights or wearing several sweaters in the winter. The purpose of this white paper is to present a comprehensive overview of energy efficiency as well as the opportunities that exist for the “Green” building market.
Energy consumption is expected to increase some 25 quadrillion Btu by 2030, according to the International Energy Agency (IEA), which carries an estimated price tag of $10 trillion for electricity generation, transmission and distribution assets alone. A significant amount of progress toward addressing tomorrow’s energy needs can be met through efficiency measures. Today’s buildings and appliances are horribly inefficient. For example, an incandescent light bulb wastes 90-95% of the energy it uses in the form of heat, a major problem in areas that have heavy cooling loads. Also, the majority of the electricity used by buildings is generated by coal combustion, a process in which 70-80% of the energy consumed is given off in the form of waste heat. Producing energy close to the source would allow that wasted heat to be recovered and used in heating and cooling, thereby increasing the efficiency to over 90%. Because buildings account for 40% of all the energy used in the United States and 72% of all the electricity consumed, their efficiency is slated to become an increasing social and political issue.
In total, the residential and commercial building market is close to a $1.2 trillion per year market. Yet, green commercial buildings only represent roughly 2% of the overall market; this percentage is even lower on the residential side. Given an expected 10% per year growth in the green buildings market, this area represents one of the greatest business opportunities of the 21st century.
Perhaps the most striking thing about the energy efficiency concept is relevant products not only exist today, but they are typically superior and achieve this at little or no extra cost (all without the need for government subsidies). The multidisciplinary nature of the industry, however, will require products, installers and services to work together to be effective. So, in this industry, we favor companies offering fully integrated energy solutions that are able to prove their cost effectiveness, while improving the product they are replacing. In the past, many consumers have been burned by promises of energy conservation that resulted in the acceptance of sub par products; such a scenario is unlikely to play out today. The need to prove energy savings will also likely lead to the need for whole building software and metering solutions, a segment we also feel will grow in the coming years.

A PRIMER ON ENERGY EFFICIENCY
January 31, 2008 Thomas Weisel Partners LLCPage 6 of 71 Jeff Osborne 212.271.3577
ALARMING EXPECTED ENERGY USE CALLS FOR A RESPONSE
At about $298 billion in sales in 2005, the electric power industry is one of the largest in the United States and represents roughly 3% of U.S. real GDP, according to the Edison Electric Institute. On a business as usual case, the Department of Energy estimates that by 2030, 508 coal steam plants, 31 nuclear plants, 330 combined cycle and 564 combustion turbine plants will need to be built to satisfy future expected demand: a tremendous amount of capital even for this large industry. Investment in generation, transmission and distribution assets to meet required demand is expected to be $10 trillion between 2005 and 2030, according to the International Energy Agency (IEA).
U.S. Electric Power Sector Power Plant Additions Needed to Meet Future Electricity Demand
Electric Generator Typical New Palnt Capacity (MW) 2010 2015 2020 2025 2030 TotalCoal Steam 600 19 30 70 147 242 508Combined Cycle 400 42 47 68 85 88 330Combusion Turbine 160 28 47 87 141 261 564Nuclear Power 1000 - 1 9 9 12 31Pumped Storage 142 - - - - - -Fuel Cells 10 - - - - - -Conventional Hydropower 5 4 4 30 42 42 122Geothermal 50 4 5 10 13 17 49Municipal Solid Waste 30 7 19 19 19 21 85Wood and Other Biomass 80 2 2 4 10 22 40Solar Thermal 100 1 2 2 2 2 9Solar Photovoltaic 5 9 21 37 55 72 194Wind 50 147 162 165 165 167 806Total 262 340 501 691 947 2741
Distributed generation 150 1 3 13 34 71 122
US Electric Power sector Power Plant additions Needed to Meet Future Electricity Demand
Source: 2007 Buildings Energy Data Book
U.S. Electricity New Generation by Plant Type (Billion kW Hours)
Electricity NGas Coal Renewable Nuclear Total1990 265 118 1560 324 577 29012000 399 98 1911 316 754 36382005 546 111 1956 323 780 38832010 658 82 2090 370 789 42092020 776 89 2418 416 885 47812030 609 92 3191 434 896 5402
US Electricity Net Generation by Plant Type
Source: 2007 Buildings Energy Data Book
Energy efficiency, especially in buildings, has a chance to supplant a meaningful proportion of the projected energy need. The EIA reports that in 2005, buildings consumed 40% of all energy in the United States and 72% of all the electricity produced; yielded 38% of all carbon dioxide emissions and 36% of all greenhouse gas emissions; and accounted for 80% (or $238 billion) of total U.S. electricity expenditures. A 5% increase in building efficiency would translate to roughly 78 billion kW hours of electricity saved at 2005 levels, or roughly $5 billion at a national $0.06-0.07 per kW price.

A PRIMER ON ENERGY EFFICIENCY
January 31, 2008 Thomas Weisel Partners LLCPage 7 of 71 Jeff Osborne 212.271.3577
Consider these facts from the 2007 Buildings Energy Data Book concerning U.S. buildings:
• Buildings now use 72% of all electricity and account for 80% of all electric expenditures.
• “Internal gains” account for as much as 27% of a home’s cooling load.
• The average new single-family home has increased in size by about 700 square feet since 1980.
• In 2006, 50% of all new homes were built in the South, meaning the energy used in cooling is going up.
• U.S. buildings’ carbon dioxide emissions (630 million metric tons of carbon) approximately equal the combined emissions of Japan, France and the United Kingdom.
• Lighting uses more energy than cooling in the residential sector. This underscores the importance of breakthrough lighting technologies.
• In 2001, lighting consumed 756 Billion kWh, according to the U.S. Lighting Market Characterization Report 2002. In 2001, according to the Annual Energy Review 2003, the United States’ 104 nuclear generating units produced 769 billion kWh while operating at a capacity factor of 89%. Therefore, it takes the United States’ entire nuclear fleet to illuminate the country.
Energy efficiency, as opposed to the generation-focused side of the energy debate, is available now and at little or no extra cost to the consumer, all while typically increasing the levels of comfort and satisfaction of the products. Although it would possibly be the largest beneficiary of a move to increased energy efficiency, the building sector is wrought with issues with regard to implementing changes. The sector is highly fragmented and multidisciplinary. Local authorities, capital providers, developers, agents and owners all have a role in the construction of a building, with some having little incentive to change their building habits. Just as consumers have moved to more fuel-efficient vehicles with rising gas prices, they will also call for more efficient buildings when energy costs become too great to ignore.
The multidisciplinary nature of the industry will require products, installers and services to be effective. In the past, many consumers have been burned by promises of energy conservation that resulted in the acceptance of sub par products; such a scenario is unlikely to play out today. The need to prove energy savings will also likely lead to the need for whole building software and metering solutions, a segment we also feel will grow in the coming years. So, in this industry, we believe the companies most likely to succeed are those offering fully integrated energy solutions that are able to prove their cost effectiveness, such as incumbents General Electric, Honeywell, Johnson Controls, United Technologies and Siemens, as well as newer companies such as EnerNOC, Comverge, Orion Energy Systems, PowerSecure, Echelon and Verdiem, among others. We note the increasing level of venture capital interest in energy efficiency, which we expect to continue, should fuel the entrance of new companies into the space. We also expect to see increasing acquisition and investment activity by the incumbents, including buying companies to strengthen their position, just as GE has done with its stake in Orion Energy Systems.

A PRIMER ON ENERGY EFFICIENCY
January 31, 2008 Thomas Weisel Partners LLCPage 8 of 71 Jeff Osborne 212.271.3577
THE COMMERCIAL AND INDUSTRIAL MARKET FOR GREEN BUILDINGS
In 2005, the value of commercial construction was $285.9 billion, while the value of building improvements and repairs was $177.4 billion. As of 2003, office space encompasses the largest portion of the market at 17%, with retail/malls second at 16%. Commercial floor space has its largest concentration in the southern part of the United States, with 37% of the overall space. If the market for green building was roughly 2% in 2005, as stated by the McGraw-Hill in its “The Greening of Corporate America” study, it would be approximately $5.7 billion, while the value of improvements and repairs would be $3.5 billion. With the relatively low penetration of green building into the traditional buildings market, we believe there is substantial room for growth in the coming years.
The median lifetime of a commercial building can range anywhere from 65 to 80 years, a substantial amount of time in terms of the innovation that takes place. As energy costs cut deeper into corporate budgets, we would expect the retrofit market for these older buildings to grow. While it is unlikely that a 40 year old building will have the same HVAC system and lighting system, it is a possibility that the insulation (or lack there of) and windows will be the same, and both represent substantial holes in the building envelope. In the future, integrated HVAC and lighting control systems should become more popular in the retrofit market as wireless systems arrive, eliminating the need to run wire through already existing walls (a time-consuming and expensive job).
Commercial Building Median Lifetimes and Commercial Floorspace by Region
Building TypeHealth Care 65Food Sales 65Food Service 65Lodging 69Mercantile and Service 65Assembly 80Large Office 73Small Office 73Education 80Warehouse 80Other 75
Commercial Building Median Lifetimes (years)
Region TotalNortheast 20%Midwest 25%South 37%West 18%
Share of Commercial Floorspace by Region
Source: 2007 Buildings Energy Data Book
A PRIMER ON ENERGY EFFICIENCY
January 31, 2008 Thomas Weisel Partners LLCPage 9 of 71 Jeff Osborne 212.271.3577
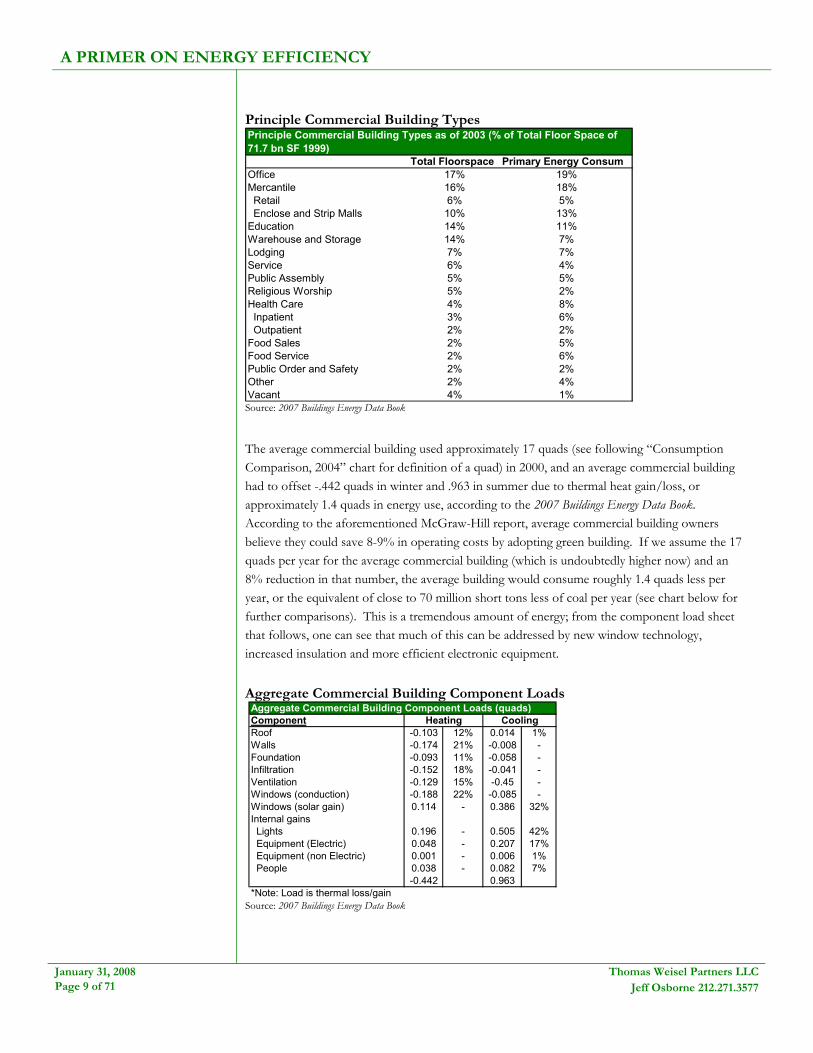
Principle Commercial Building Types
Total Floorspace Primary Energy ConsumOffice 17% 19%Mercantile 16% 18% Retail 6% 5% Enclose and Strip Malls 10% 13%Education 14% 11%Warehouse and Storage 14% 7%Lodging 7% 7%Service 6% 4%Public Assembly 5% 5%Religious Worship 5% 2%Health Care 4% 8% Inpatient 3% 6% Outpatient 2% 2%Food Sales 2% 5%Food Service 2% 6%Public Order and Safety 2% 2%Other 2% 4%Vacant 4% 1%
Principle Commercial Building Types as of 2003 (% of Total Floor Space of 71.7 bn SF 1999)
Source: 2007 Buildings Energy Data Book
The average commercial building used approximately 17 quads (see following “Consumption Comparison, 2004” chart for definition of a quad) in 2000, and an average commercial building had to offset -.442 quads in winter and .963 in summer due to thermal heat gain/loss, or approximately 1.4 quads in energy use, according to the 2007 Buildings Energy Data Book. According to the aforementioned McGraw-Hill report, average commercial building owners believe they could save 8-9% in operating costs by adopting green building. If we assume the 17 quads per year for the average commercial building (which is undoubtedly higher now) and an 8% reduction in that number, the average building would consume roughly 1.4 quads less per year, or the equivalent of close to 70 million short tons less of coal per year (see chart below for further comparisons). This is a tremendous amount of energy; from the component load sheet that follows, one can see that much of this can be addressed by new window technology, increased insulation and more efficient electronic equipment.
Aggregate Commercial Building Component Loads
ComponentRoof -0.103 12% 0.014 1%Walls -0.174 21% -0.008 -Foundation -0.093 11% -0.058 -Infiltration -0.152 18% -0.041 -Ventilation -0.129 15% -0.45 -Windows (conduction) -0.188 22% -0.085 -Windows (solar gain) 0.114 - 0.386 32%Internal gains Lights 0.196 - 0.505 42% Equipment (Electric) 0.048 - 0.207 17% Equipment (non Electric) 0.001 - 0.006 1% People 0.038 - 0.082 7%
-0.442 0.963*Note: Load is thermal loss/gain
Aggregate Commercial Building Component Loads (quads)Heating Cooling
Source: 2007 Buildings Energy Data Book

A PRIMER ON ENERGY EFFICIENCY
January 31, 2008 Thomas Weisel Partners LLCPage 10 of 71 Jeff Osborne 212.271.3577
Consumption Comparison, 2004 Consumption Comparisons in 2004
One quad equals:49 million short tons of coalenough coal to fill a train of railroad cars 4,450 miles long (about one and a half times across the U.S.)971 billion cubic feet natural gas8 billion gallons of gasoline = 21 days of U.S. gasoline use19.8 million passenger cars each driven 12,500 miles17.0 million light-duty vehicles each driven 12,200 milesall new passenger cars and light-duty trucks sold, each driven 11,500 miles12.7 million stock passenger cars, each driven 11,500 miles = 9% of all passenger cars, each driven 11,500 milesall new passenger cars each making 6 round-trips from New York to Los Angeles172 million barrels of crude oil = 15 days of U.S. imports = 177 days of oil flow in the Alaska pipeline at full capacitythe amount of crude oil transported by 483 supertankers
the approximate annual primary consumption of any one of the following states: Arkansas, Connecticut, Iowa, Kansas, Mississippi, Oregon, or West Virginia
Quad: Quadrillion Btu (10^15 or 1,000,000,000,000,000 Btu)Generic Quad for the Buildings Sector: One quad of primary energy consumed in the buildings sector (includes the residential and commercial sectors), apportioned between the various primary fuels used in the sector according to their relative consumption in a given year. To obtain this value, electricity is converted into its primary energy forms according to relative fuel contributions (or shares) used to produce electricity in the given year.Electric Quad (Generic Quad for the Electric Utility Sector): One quad of primary energy consumed at electric utility power plants to supply electricity to end-users, shared among various fuels according to their relative contribution in a given year. (Note: The consumption of an electric quad results in the delivery of just under 1/3 the electric quad due to generation and transmission losses.)
21 hours of world energy usethe electricity delivered from 235 coal-fired power plants (200-MW each) in one yearthe electricity delivered from 37 nuclear power plants (1000-MW each) in one yearaverage annual per capita consumption of 2.9 million people in the U.S.
Primary Energy: The total energy consumed by an end-user, including the energy used in the generation and transmission of electricity. Also referred to as "source" energy.Delivered Energy: The energy consumed by an end-user on site, not including electricity generation and transmission losses.
Source: 2007 Buildings Energy Data Book
Corporate Sediment
It is not surprising that with energy costs at all-time highs, individuals and companies have acknowledged that energy efficiency and sustainable building techniques are going to be increasingly important going forward. According to a McGraw-Hill report entitled The Greening of Corporate America, 82% of surveyed corporations will be greening at least 15% of their real estate portfolio by 2009. Turner Construction supports that claim with its findings that 87% of industry executives report their green building activities will be increasing over the next three years, including 43% reporting a substantial increase. On the residential side, Turner predicts the market will be $20 billion by 2010, up substantially from an estimated $2 billion in 2005.
Although commercial and residential owners understand the benefits derived from sustainable building practices, many are not pursuing them. In the McGraw-Hill study, 80% of businesses have never conducted an energy audit, while only 29% have invested in energy efficient computers, according to research done by Intel. In 2006, the U.S. Green Building Council (USGBC) reported only 775 million square feet of commercial space registered under their LEED certification, or roughly 2% of the commercial space in the United States. Although it is likely the number of “green” buildings is greater than 2%, that figure shows the minimal

A PRIMER ON ENERGY EFFICIENCY
January 31, 2008 Thomas Weisel Partners LLCPage 11 of 71 Jeff Osborne 212.271.3577
penetration of total building sustainability measures within the market. The 2005 McGraw-Hill Greening of Corporate America study estimates that green buildings will comprise 5-10% of the commercial construction market by 2010. In the 2007 report, McGraw-Hill’s poll of the commercial construction market place revealed the perceived business advantages in green building:
• Operating cost decreases: 8-9%
• Building value increase: 7.5%
• Return on investment improvement: 6.6%
• Occupancy ratio increases: 3.5%
• Rent ratio increases: 3%
According to the McGraw-Hill study, the largest groups of companies are concentrated on compliance and instituting profitable greening practices; overall there is still a heavy weighting to legally compliant only companies. Still important though is that 43% of all the survey respondents see green activities and building as being part of their company’s growth strategy. Also, as illustrated in the following charts, the percentage of companies “significantly” involved in green building continues to grow: from 7% in 2005 to 24% in 2007. The study projects that a “tipping point” will occur somewhere in the 2009 timeframe, when the number of companies dedicated to green building will overtake the segment exploring action: a move likely to accelerate the growth in the green building market.
Company’s Role in Green Actions Stage Description
Stage 1Green is not part of the company's mission and at times may weaken the company's effectiveness.
Stage 2Green enters into the company mission as it is legally required and is viewed as a cost.
Stage 3
The company considers the proactive applications of green to be consistent with the profit mission. However, the company has not built green concepts into its technologies, policies and operations on an institution-wide basis.
Stage 4
The company is transforming into a green organization. Green is viewed more as an opportunity than a cost. The company sees competitive advantage from sustainability initiatives.
Stage 5
The company is driven by a passionate value-based commitment to improving the well-being of the company, society and the environment. The company approaches business as a holistic, restorative company.
Company's Role in Green Actions
11%
32%
40%
15%
3%
0%
5%
10%
15%
20%
25%
30%
35%
40%
45%
Stage 1 Stage 2 Stage 3 Stage 4 Stage 5
Source: McGraw-Hill study, The Greening of Corporate America

A PRIMER ON ENERGY EFFICIENCY
January 31, 2008 Thomas Weisel Partners LLCPage 12 of 71 Jeff Osborne 212.271.3577
Level of Corporate Building Green Building Tipping Point Level of Corporate Green Building Over Time
37%27% 19%
56%62%
56%
7% 11%24%
0%
10%
20%
30%
40%
50%
60%
70%
80%
90%
100%
2005 2006 2007
Signif icantly Involved (30%+ ofportfolio)
Moderate Involvement (up to30% of portfolio)
Exploring Action (lowinvolvement)
Corporate America Green Building Tipping Point
74%
60%
45%
30%
15%
2% 2%8%
14%20%
0%
10%
20%
30%
40%
50%
60%
70%
80%
2005 2006 2007E 2008E 2009E
% o
f Pop
ulat
ion
Exploring Action (<16% ofprojects green)Largely Dedicated to GreenBuilding (60%+ of portfolio)
Source: McGraw-Hill study, The Greening of Corporate America
While increasing energy costs continue to be the largest driver of the shift toward greening building practices, other sources are increasingly leading companies to view not going green as a liability. This is especially prevalent among larger businesses (i.e., revenue greater than $2.5 billion), which have faced increasing public and shareholder pressure. The McGraw-Hill study, The Greening of Corporate America, found that 75% of the respondents were primarily concerned with increasing energy costs, 40% considered government regulations and incentives and 26% were concerned about global influences. Large companies are also more likely to quickly embrace green practices because they can afford to hire the expertise necessary to do so. The number one reason for not fully implementing green practices was that it was “too-multi-disciplinary”, and did not fit within the current corporate structure. In the future, it is likely that energy management will be outsourced by companies too small to acquire the expertise, making it a more substantial part of corporate strategy.
THE HEALTHCARE MARKET FOR GREEN BUILDINGS
Healthcare construction is the fourth largest segment in the U.S. commercial construction segment; McGraw-Hill projected the market in 2007 was $23.7 billion and the green building segment is expected to grow 5-10% annually until 2010. In 2005, healthcare building peaked at 107 million square feet, and is likely to continue to pull in from those levels, but 2010 and beyond could see stronger growth as the aging population will provide a need for new facilities. A study done by McGraw-Hill Construction found that healthcare is viewed as likely to be the fifth fastest growing segment within green building.
A study done by Turner Construction Company perceived an increase in green building. According to the survey, 87% of construction industry respondents expect green building to increase over the next three years, with 34% expecting a rapid increase. Tied for the top reason to build green are enhanced staff and patient health as well as operational cost savings. Obstacles to the greening of healthcare are similar to other commercial construction: lack of knowledge or too multidisciplinary; cost and time of approval; and lack of product information. Hospitals do require a great deal of energy to run equipment, especially continuous monitors. This is, however, a relatively small cost for a typical hospital, so a large focus has not been placed on energy cost savings. Also, hospitals are 10 times the size of a typical commercial building, so the projects are particularly sensitive to perceived extra costs and possible budget

A PRIMER ON ENERGY EFFICIENCY
January 31, 2008 Thomas Weisel Partners LLCPage 13 of 71 Jeff Osborne 212.271.3577
overruns. Because of their large size and position, hospitals tend to be very risk adverse, making it difficult to push them toward greener practices.
THE EDUCATION MARKET FOR GREEN BUILDINGS
In 2007, the education market was projected to be $53 billion, making it the largest share of commercial construction at 27% of the market. McGraw-Hill expects the green education market to grow at a faster rate (5-10% by 2010) than the underlying commercial construction market. Older K-12 schools (42 years old on average) in conjunction with higher enrolment in colleges should drive the education construction market going forward. A study done by McGraw-Hill Construction found that education is viewed as likely to be the fastest growing segment within green building.
Perceived advantages of green building were a 10% decrease in operating costs, 6% increase in building value and a 14% decrease in energy used. McGraw-Hill estimates that annual utility costs for new schools utilizing green building could actually decrease from 20-40%, while renovated schools could decrease from and 20-30%. McGraw-Hill also estimates that energy reduction would be 40% and anticipated water reduction of up to 30%. The largest reason cited for building green is lower operating costs, but the industry is working on educating the consumer about the environmental and health benefits also associated with such building.
THE RESIDENTIAL MARKET FOR GREEN BUILDINGS
After the record building of 2005, building starts fell to 1.33 million in 2006, and McGraw-Hill estimates that housing starts will end down further from that in 2007. Although McGraw-Hill predicts 2008 declines will be less than 2006 and 2007, and 2009 will stabilize, all indications suggest that the residential housing market is not what one would consider strong. Differentiation among builders will be increasingly important in this falling market, and it seems that the green builders could capture an advantage.
Single Family Housing Starts
Single Family Housing Starts
0
200
400
600
800
1000
1200
1400
1600
1800
2000 2001 2002 2003 2004 2005 2006 2007
Year
thou
sand
s of
uni
ts
Source: McGraw-Hill Construction, 2007

A PRIMER ON ENERGY EFFICIENCY
January 31, 2008 Thomas Weisel Partners LLCPage 14 of 71 Jeff Osborne 212.271.3577
In 2005, the value of residential construction market was $490 billion, while the value of building improvements and repairs was $215 billion. Exhibited below is the total cost of a typical 2,150 square foot house as well as an illustration indicating that the average constructed house size in 2006 was 2,469 square feet. As can be seen by the cost breakdown, a relatively small portion of the overall cost of a house is attributed to HVAC, lighting and appliances, while the largest portions go to framing, walls/finish and property features. Here, it is important to recognize that the main features that will make a house more energy efficient are not large sellers of a home. HVAC, windows, insulation, etc. are not typically as large of a focus to the average home buyer as more noticeable things that enhance appearance. That is why such a large portion of the house’s overall cost is attributed to wall/finish and property features.
Construction Cost Breakdown and Construction Statistics
CostFinished Lot 62,539 24%Construction Cost Inspection/Fees 4,057 2% Shell/Frame Framing 29,928 11% Windows/Doors 9,940 4% Exterior Finish 10,939 4% Foundation 15,610 6% Wall/Finish Trim 27,301 10% Flooring 6,978 3% Equipment Plumbing 8,552 3% Electrical Wiring 5,456 2% Lighting Fixtures 1,510 1% HVAC 5,972 2% Appliances 2,095 1% Property Features 17,000 6%Financing 4,985 2%Overhead and General E 15,139 6%Marketing 3,716 1%Sales Commissions 8,940 3%Profit 24,350 9%Total 265,036 100%
1998 Cost Breakdown of a 2,150 Square Foot, New Single-Family Home (2005 dollars)
Construction Statistics1000 units Average Sq Ft
1990 966 20902000 1242 22662005 1636 24342006 1654 2469
Source: 2007 Buildings Energy Data Book
Unlike the residential building market, the residential remodeling and renovation market has remained relatively consistent; it is valued by the U.S. Census bureau at roughly $200 billion in 2006, with others estimating over $300 billion, according to McGraw-Hill. This places the residential remodeling and renovation market at approximately the same size as the entire commercial construction market. According to the Global Insight and Home Improvement Research Institute, the residential remodeling and renovation market should decline slightly by 1.3% in 2007, but has an expected long-term growth rate of 5% annually over the next four years. The Institute expects the market to grow to $394.1 billion by the end of 2012.
Remodeling is also dependent on the age of the housing stocks. As seen below, the Northeast and Midwest have a large number of houses built before 1939. Also, the Midwest happens to have the highest incidence of plumbing, cabinet and window replacement.

A PRIMER ON ENERGY EFFICIENCY
January 31, 2008 Thomas Weisel Partners LLCPage 15 of 71 Jeff Osborne 212.271.3577
Age of Housing Stocks Age of House Stocks
0 2 4 6 8 10
Built 2000 or later
Built 1990 to 1999
Built 1980 to 1989
Built 1970 to 1979
Built 1960 to 1969
Built 1950 to 1959
Built 1940 to 1949
Built 1939 or earlier
million of units
MidwestNortheastSouthWest
Source: McGraw-Hill, The Green Home Owner Report
Green building activity in the residential space has largely centered on the South and the West. Though the largest gains in efficiency could potentially come from the East and Midwest, the majority of the new building has been concentrated in the South and West. The following exhibit shows the states with the largest penetration of Energy Star Qualified Homes as a percentage of new single-family housing permits. McGraw-Hill Construction, which has more stringent guidelines for its definition of a green home, puts Texas at the top of its list for 2006, followed by Florida, Washington, Colorado and Nevada. Buyers of green homes, as reported by McGraw-Hill, are highest in the South at 42%, with the West at 32%, Midwest at 16% and East at 10%.
Energy Star Qualified New Single Family Homes versus Homes Completed by Region
Nevada 18.9 71%Alaska 1 64%Iowa 5.9 57%Texas 60.8 37%Hawaii 2.1 37%Arizona 20.1 36%New Jersey 5.4 31%Delaware 1.2 24%Vermont 0.5 24%Connecticut 1.6 23%California 18.1 17%New Hampshire 0.8 17%Utah 3.6 16%Ohio 3.5 13%New York 2.6 13%Florida 3.3 2%
Market Indices for 2006 Energy Star Qualified New Single Family Homes (1000s)
Energy Star Qualified
Mkt Penetration
2006 New Homes Completed by RegionRegion Single Family Units %Northeast 128 8%Midwest 286 19%South 826 46%West 415 27%
Source: 2007 Buildings Energy Data Book

A PRIMER ON ENERGY EFFICIENCY
January 31, 2008 Thomas Weisel Partners LLCPage 16 of 71 Jeff Osborne 212.271.3577
The average residential building used approximately 20.5 quads of energy in 2000, and an average household had to make up for approximately four quads in the winter and 1.1 quads in the summer, or roughly five quads in total. According to the 2007 Buildings Energy Data Book, roughly 25% of energy expenditures go to load management. Similar to commercial buildings, residential houses lose/gain much of their energy through the building envelope (outer-shell of the building) and would benefit greatly from advanced technology windows and insulation as well as the minimizing of weak thermal areas. Internal gains are also a concern in the summer as electronics and lighting become more energy intensive.
Aggregate Residential Building Component Loads
ComponentRoof -0.65 12% 0.16 14%Walls -1 19% 0.11 10%Foundation -0.76 15% -0.07 -Infiltration -1.49 28% 0.19 16%Windows (conduction) -1.34 26% 0.01 1%Windows (solar gain) 0.43 - 0.37 32%Internal gains 0.79 - 0.31 27%
-3.99 1.08
Heating CoolingAggregate Residential Building Component Loads (quads)
Source: 2007 Buildings Energy Data Book
Consumer Sentiment
The average green home buyer is from the East or West coasts, between the ages of 25-44 (mean of 45 but with large distribution), married, has above average income (two-thirds above $50,000 per year) and is female (71%), according to McGraw-Hill Construction, 2007. Word of mouth has overtaken TV as the main way people learn about green buildings, but that depends on demographics. People in the West are more likely than those in any other region of the country to contact a builder, while people in the South are more likely to obtain information via the TV than any other source. Education level is also a large determinate, as 80% of green home owners report some college experience and 60% report college or advanced degrees. The higher education level plays a large part in the way people receive information about green homes, as people with higher education levels tend to watch less TV and give advertisements less weight. It is reported that 40% of green homeowners are not at all interested in celebrities and television, something that will require a change from traditional consumer product advertisement.
The number one reason behind purchasing a green home in the residential arena is similar to commercial: operational cost savings, followed by environmental concerns, occupant health and potential higher resale. Lack of education in the residential space continues to be the main obstacle in a purchase, while cost and lack of available green homes come in a close second.
Cost continues to be a main concern. While Energy Star homes are efficient, they do cost more, (roughly $3,000-8,000 more depending on options) and energy efficiency is not typically at the top of the list for most consumers. Things like the paint job and granite countertops are still big sellers of homes. The U.S. Department of Energy, however, reported that the average family spends at least $1,291 on home energy per year, a number that will continue to rise. As energy prices rise, energy efficient appliances and building materials have more economic value because the cost is reduced to a payback of one to three years. A more competitive housing market coupled with a more educated consumer and higher energy costs will likely push energy efficient

A PRIMER ON ENERGY EFFICIENCY
January 31, 2008 Thomas Weisel Partners LLCPage 17 of 71 Jeff Osborne 212.271.3577
housing as builders look to differentiate themselves and consumers learn about the benefits of green building.
The perception of a green home long after purchase is just as important for the industry as the reasoning for the initial purchase, given how many learn about the homes through word-of-mouth. Unlike commercial building owners, residential owners are most pleased with the improved health and wellbeing associated with a green home (i.e., higher air quality and improved family health). Overall, the top perceived benefits are home quality, easier maintenance, better indoor air quality, more efficient appliances and better health, with price having the lowest satisfaction level. With these benefits, 85% of green homeowners are likely to recommend a green home.
A change in consumer behavior and changes in demographics are also likely to continue to fuel the green building trend. According to a McGraw-Hill Construction study on the green homeowner (“The Green Home Owner Report”), sales of organic foods are expected to grow 20% annually over the next few years; the market for hybrid cars is increasing; socially responsible investing is on the rise; and two-thirds of Americans say they consider a company’s business practices before a purchase. Consumers from the age of 13-25 are even more likely to consider a company’s cause, business practices and social commitment when considering a purchase, something that is likely to spill over into their choices for home buying. While consumer behavior is still largely determined by brand and costs, these trends show a likely movement toward other intangible factors that will have a larger effect.
LEADERSHIP IN ENERGY AND ENVIRONMENTAL DESIGN STANDARDS BECOMING SYNONYMOUS WITH GREEN BUILDING
LEED (Leadership in Energy and Environmental Design) are standards for integrated green building design, construction and operation. LEED is quickly becoming synonymous with green, sustainable building techniques and will likely be a major determining factor in how new green building products will be developed. The program was first started in 1998 with loose guidelines, but now has specific codes for nine types of buildings.
The largest downside to building green continues to be the cost. According to Greentech Media, green building costs roughly $3 more per square foot than conventional building techniques, which can be a huge turnoff to builders that are concerned with delivering a product on budget. The estimated energy savings over time is $73 per square foot, however, a number that is usually not known or understood. Paperwork is also a headache for many builders (though everything is done on the internet), as each point must be documented. Currently, only 3% of new construction is LEED certified, with the private sector leading the way.
U.S. LEED Registered Projects
Private Sector Corps 33%Local Govt 25%Nonprofit Corp 14%State Govt 13%Federal Govt 10%Other 5%
US LEED Registed Project by Ownership Catergory
Source: Building Energy Data Book, 2007 (data sourced from 2003)

A PRIMER ON ENERGY EFFICIENCY
January 31, 2008 Thomas Weisel Partners LLCPage 18 of 71 Jeff Osborne 212.271.3577
According to the World Business Council for Sustainable Development in a 2007 Building Efficiency report, the perceptions of the cost necessary to achieve greener buildings are significantly higher than the actual costs. The average perception was a 17% premium, when in fact cost studies have shown far lower numbers. For commercial properties, the Franunhofer Institute has shown that energy demand in a new building can be reduced by 50% without adding to traditional construction costs. The U.S. building council has done several studies and has shown that LEED certification cost is between 0% and 3%, and the cost of reaching a platinum level is less than 10%. Retrofitting existing building can also be extremely effective, according to the IEA. A study done on high-rise apartments in the European Union concluded that colder climates could achieve significant efficiency gains: 80% in the least efficient buildings with an average of 28% energy savings.
Cost Premium for LEED Buildings by Level Cost Premium by Location and Energy Efficiency Level
0%
2%
4%
6%
8%
10%
12%
UCSB, CA SanFrancisco, CA
Merced, CA Denver, CO Boston, MA Houston, TX
Cos
t pre
miu
m b
y lo
catio
n an
d LE
ED le
vel
SilverGoldPlatinum
Source: World Business Council for Sustainable Development in a 2007 Building Efficiency report
The LEED Ratings System
There are four levels of certification:
• LEED Certified: 26-32 points
• LEED Silver: 33-38 points
• LEED Gold: 39-51 points
• LEED Platinum: 52-69 points

A PRIMER ON ENERGY EFFICIENCY
January 31, 2008 Thomas Weisel Partners LLCPage 19 of 71 Jeff Osborne 212.271.3577
U.S. LEED Certified Projects
Platinum Gold Silver Bronze CertifiedArizona 1 7 4 1 21California 12 37 31 0 120Colorado 2 11 15 0 41Georgia 2 10 19 0 41Illinois 4 8 14 0 40Maryland 1 6 5 0 20Massachusetts 3 6 9 0 41Michigan 0 13 11 0 34New Jersey 0 7 7 0 21New York 3 10 7 0 32Ohio 0 4 8 0 22Oregon 2 32 13 1 60Pennsylvania 3 28 31 0 78Texas 0 7 13 0 36Virginia 0 4 9 0 23Washington 1 20 23 0 70Wisconsin 0 5 6 0 20
US LEED Certified Projects by Certification
1) Project types include new construction, major renovations, existing building operations, interior design, homes, neighborhood development, development multi-building complexes, schools, and retail spaces. 2) Certified projects do not constitute the sum total of the other four categories, but rather designate an entirely separate category in and of itself. Source: United States Green Building Council Website, accessed August 2007
Sustainable Sites – 14 possible points, one prerequisite: This deals with the choosing of a site and the management of a site in a green way, with minimal effect on the surrounding ecosystem. Extra points are given for development or cleaning of existing sites or abandoned sites. Other standards include water runoff management, wildlife management, light pollution management and heat island effect reduction (creating an area that is 2-10 degrees Fahrenheit hotter than the surrounding area). Sites also should encourage public transportation, walking, biking and other ways to minimize personal vehicle travel. The prerequisite is that builders must plan and implement a construction activity pollution prevention plan to reduce environmental pollution associated with construction before the start of the project.
Water Efficiency – five possible points, no prerequisites: This deals with the management of water on the side and in the building. Points are awarded for a reduction in water use, a reduction in wastewater from the building and site as well as the use of rainwater and grey water.
Energy and Atmosphere – 17 possible points, three prerequisites: The site and building should address the amount of pollution produced by the building and the energy consumption. The building can receive points by implementing strategies that minimize energy used by increasing the efficiency of the building envelope (i.e., insulation, windows, sustainable design, etc.) and by utilizing renewable energy generating sources. The first prerequisite is an energy system installed and implemented in the building and verified for optimum performance as defined by a third-party commissioning agent with accurate and objective data collection. The second prerequisite, building standard 90.1-2004, is used to set minimum standards for building envelope efficiency. The third prerequisite is reducing ozone depletion through refrigerant management, essentially using zero CFCs in new construction and a phase out in renovations.
Materials and Resources – 13 possible points, one prerequisite: This deals with utilizing existing building and site materials, managing construction waste and using renewable materials

A PRIMER ON ENERGY EFFICIENCY
January 31, 2008 Thomas Weisel Partners LLCPage 20 of 71 Jeff Osborne 212.271.3577
and local resources. The prerequisite is that the site must have recycling storage and collection plans that are executed by the occupants and be easily accessible to the entire building.
Indoor Environmental Quality – 15 possible points, two prerequisites: This is primarily concerned with the wellbeing of the building occupants. The first prerequisite is that all LEED buildings must have a no smoking policy, or a properly sealed and ventilated smoking area. The second prerequisite is that buildings must maintain a minimum level for indoor air quality and ventilation as defined by ASHRE code for Indoor Air Quality. Points can be awarded in construction by using low chemical emitting materials and properly ventilating spaces. Points are also awarded for the level of individual control on temperature and lighting as well as the incorporation of daylight into occupied spaces.
Innovation in Design and Process – five points possible, no prerequisite: This category is meant for going above and beyond the standards or addressing something not specifically in the LEED rating system. A point is awarded for having a LEED certified individual as a project principal.
REGULATION: GOVERNMENT IS STEPPING UP TO THE PLATE FOR ENERGY EFFICIENCY
The U.S. government has taken a proactive role in energy efficiency with the 2007 Energy Bill, which included a slew of new requirements, some the first changes in over a decade. According to the White House, the 2007 Energy Bill includes provisions to improve energy efficiency in lighting and appliances, as well as requirements for Federal agency efficiency and renewable energy use that will help reduce greenhouse gas emissions.
Recently, the Department of Energy (DOE) established regulations that require most new federal buildings to achieve at least 30% greater energy efficiency than that of the prevailing building codes. The new standards, which were published on December 21, 2007, are also 40% more efficient than the standards in the current code. Over the next 10 years, it is believed the standards could save more than 40 trillion Btu and reduce carbon dioxide emissions by two million metric tons, according to the DOE. The new regulation applies to any federal building that entered the “design for construction” phase by January 3, 2007. The new regulations took effect on January 22, 2008, and apply to new federal commercial buildings, multi-family high-rise residential buildings and low-rise residential buildings. The standards aim to address energy efficiency by looking at a building’s entire performance. The high standards put forth in the new regulations will also encourage federal builders to use an integrated approach when constructing new buildings.

A PRIMER ON ENERGY EFFICIENCY
January 31, 2008 Thomas Weisel Partners LLCPage 21 of 71 Jeff Osborne 212.271.3577
THE 2007 ENERGY BILL
Federal/Municipal
The bill will require all general purpose lighting in Federal buildings to use Energy Star products or products designated under the Energy Department's Federal Energy Management Program (FEMP) by the end of Fiscal Year 2013. The federal government will designate energy managers to conduct comprehensive energy and water evaluations for each of the 500,000 federal facilities.
The Bill will establish an Office of High-Performance Green Buildings (OHPGB) in the U.S. General Services Administration. This office will promote green building technology implementation in Federal buildings.
Residential Buildings
The Bill will update the Energy Policy and Conservation Act to set new appliance efficiency standards. The Act amends the Energy Policy and Conservation Act to prescribe or revise standards affecting regional efficiency for heating and cooling products, procedures for new or amended standards, energy conservation, energy efficiency labeling for consumer electronic products, residential boiler efficiency, electric motor efficiency, and home appliances.
Commercial Buildings
The Bill sets a national goal to reduce commercial building energy use and achieve zero-net energy by 2030. All existing buildings are also expected to meet that same goal by 2050. That means facilities such as the Integrated Design Associates’ zero-energy and zero-carbon emissions building in San Jose can be replicated all over the country.
Industrial Buildings
There’s now a program to identify and recover industrial waste heat and energy, which will include grants and a registry of sites with economically feasible situations. The government also will promote the use of new materials, processes, technologies and operating techniques to optimize efficiency in energy-intensive businesses.
School Buildings
The bill contains grants to states to provide technical assistance for programs that address environmental issues and include standards for school design, construction and renovation.
Appliance Standards
Lamp Efficiency Standards: These new standards require incandescent bulbs to use 25-30% less energy than today’s most common bulbs by 2012-2014, and use at least 60% less energy by 2020. Initial targets can be met with advanced incandescent lamps that manufacturers are

A PRIMER ON ENERGY EFFICIENCY
January 31, 2008 Thomas Weisel Partners LLCPage 22 of 71 Jeff Osborne 212.271.3577
currently introducing into the space, along with compact fluorescent lamps and light-emitting diodes.
DOE Rulemakings: Required the DOE to complete revised standards for refrigerators by 2011; clothes washers by 2012; external power supplies and battery chargers by July 2011 and again by July 2015; dishwashers by 2015; walk-in coolers and freezers by 2012; and metal halide lamp fixtures and general service lamps by 2017 and 2022. The standards require that most products include energy use in standby and off modes.
Heating and Cooling (HVAC): Allows for regional standards for HVAC. The rules provide authority for the Secretary to: set a national minimum standard and one additional regional standard for residential furnaces and heat pumps; develop enforcement plans; and grant new authority for States to enforce regional standards.
Electronics: The new bill requires the Federal Trade Commission to develop new energy consumption labeling programs for televisions, personal computers, cable and satellite set-top boxes, stand-alone digital video recorders, computer monitors, etc. This is an important standard as current requirements are only to display max power and say little about consumption. Energy Star requirements do not effectively address standby power usage, which will be updated.
Other provisions in the Bill give the DOE the power to expedite the process of rule making based on consensus recommendations, but does not require a Federal Register notice and legal review as was necessary before. This takes the timeline for approval down by 10 months, a process that typically takes three years and gives the DOE significant amounts of power in setting standards.
The American Council for an Energy-Efficient Economy estimates that the standard provisions will save at least 2.0 quadrillion Btu’s in 2030, or 1.6% of total projected nationwide energy use that year. The bill is estimated to save 177 billion kWh per year in 2030, and reduce peak electricity demand by 33,000 MW, or 110 power plants at 300MW each.
Progress of State Regulation
• Thirty-two states have, through legislation or regulation, ordered utilities to design and fund programs that promote or deliver energy efficiency.
• Twelve states have implemented, or are in the process of implementing, Energy Efficiency Resource Standards, which generally require utilities to allocate funds to energy efficiency programs to meet near-term savings targets set by state governments or regulatory authorities. These states include California, Texas, Colorado, New Jersey and Illinois.
• In recent years, there has also been an increasing focus on “decoupling,” a regulatory initiative designed to break the linkage between utility kWh sales and revenues, in order to remove the disincentives for utilities to promote load reducing initiatives. Decoupling aims to encourage utilities to actively promote energy efficiency by allowing utilities to generate revenues and returns on investment from employing energy management solutions. To date, nearly half of all states have adopted or are adopting forms of decoupling for gas or electric utilities.

A PRIMER ON ENERGY EFFICIENCY
January 31, 2008 Thomas Weisel Partners LLCPage 23 of 71 Jeff Osborne 212.271.3577
Funding
A number of new programs promoting energy efficiency have been created, but these programs need to be funded. With the EPA Act of 2005, many programs were forgotten as Congress did not provide the money for them. We are not holding our breath for all of these programs to take off, as it has historically been common for funding and ambition for such sweeping programs to dry up. We do feel, however, that a meaningful portion will find legs, given the overwhelmingly strong support.
An appropriations act signed into law in December 2007 provides $1.536 billion in direct support of the DOE Office of Energy Efficiency and Renewable Energy (EERE), a 4.2% increase over the funds that were provided earlier. The act provides roughly $26 million for the DOE’s National Renewable Energy Laboratory, including $5 million toward a new Energy Systems Integration Facility. While the appropriations act is difficult to interpret, and there are many areas left open, money has been earmarked, which is a positive sign for the programs.
MATERIALS: MAJOR PRODUCTS AND TRENDS IN ENERGY EFFICIENCY
Green, sustainable, energy efficient, or whatever the name may be, are descriptions of a growing trend in the market. When producing a LEED certified, high performance building, the whole building design process must be utilized. The whole building design considers all pieces of the building in terms of performance, both in terms of energy efficiency and comfort of its inhabitants. In the following section, we discuss each input into the whole building design with current market, products and R&D.
LIGHTING
Lighting now makes up between 20-30% commercial energy consumption on average.
Lighting Share of Overall Energy Use and Expenditure US Buildings Primary Energy and Expenditure and End Use
End Use Residential Commercial Residential CommercialSpace Heating 31% 14% 35% 16%Lighting 11% 26% 10% 23%Space Cooling 12% 13% 11% 8%Water heating 12% 7% 13% 12%Electronics 7% 6% 6% 4%Refrigeration 8% 4% 7% 6%Cooking 5% 2% 4% 2%Wet Clean 5% 0% 4% 0%Ventilation 0% 6% 0% 6%Computers 1% 3% 1% 3%Other 4% 13% 4% 13%
Energy Expenditure
Source: 2007 Buildings Energy Data Book
Increasing electricity prices have forced many commercial companies to reassess their strategies toward lighting in general. Historically, relatively cheep electricity prices have encouraged the building of sprawling commercial and industrial complexes that have no natural light sources and require full lighting for a significant portion of the day, if not the full 24 hours. In these instances, the fixtures installed by the building contractor are also typically the cheapest possible, or the standard florescent light set, further adding to the relative inefficiencies of the lighting.

A PRIMER ON ENERGY EFFICIENCY
January 31, 2008 Thomas Weisel Partners LLCPage 24 of 71 Jeff Osborne 212.271.3577
Lighted Floorspace for Commercial Buildings 2003 Lighted Floorspace for the Stock of Commercial Buildings
Lighted Floorspace Percent of Type of Lamp (Bn SF) Lighted FloorspaceStandard Fluorescent 59.7 96%Incandescent 38.5 62%Compact Fluorescent 27.6 44%High-Intensity Discharge 20.6 33%Halogen 17.7 29% Note: Total lighted floor space 62.06 Billion SF. The percentage of Lighted floorspace totals more than 100% because most floor space is lighted by more than one type of lamp. Source: 2007 Buildings Energy Data Book
The standard incandescent bulb still plagues the residential and, to a smaller extent, commercial markets because it is one of the largest sources of lighting inefficiency. On the residential side, incandescent bulbs consumed 87% of an average home’s lighting expenditures in 2001, while only producing 66% of the total light. In the commercial market, only 6% of light was attributable to incandescents, while they consumed 26% of the overall lighting load. Ireland recently banned the sale of incandescent bulbs in 2009, moving toward a European Union pledge to use energy efficient lighting by 2010 and saving Irish households an estimated $269.3 million. With political pressure, utility rebates and environmental concerns, it is likely that the 100-year-old incandescent bulb will lose its place as the incumbent light producer in the residential market and be considerably scaled down in any C&I applications.
Lighting controls have a dramatic effect on the performance of many light bulbs. For instance, a halogen lamp will last four times longer (12,000 hours or roughly seven years at average usage) if dimmed by 30%, which is the average level by which most consumers dim their lights. Also, it goes without saying that if one dims the lights by 50%, there is a corresponding roughly 50% drop in energy consumption attributed to lights. Because the typical residential occupant prefers slightly dimmed lights, installing dimmers in each residence (a relatively low tech solution) could save a tremendous amount of electricity. Lutron, a lighting control company, estimates that if one of their dimmers was installed in every U.S. home, it would save roughly $230 million in electricity cost per year.
The U.S. Energy Information Administration Office estimates that 44% of the energy use in an office building is for lighting; this figure is 56% in education buildings. Lighting control systems such as the ones Cooper Lighting has been offering for years (controlling occupied/non-occupied light levels, shades, daylight levels and, in some cases, integrating it into a software solution) can provide paybacks of anywhere from one to three years. Also, they can typically provide a better working environment for occupants, thereby increasing productivity. Solutions with longer paybacks of six to eight years can also succeed in the market, provided that they provide superior technology (i.e., smaller size, longer life, reliability, quieter operation, better convenience, etc.).
While it seems completely intuitive to include these systems in an office or similar building, two major obstacles need to be overcome. First, retrofit equipment for these systems can be cumbersome. Every control and switch needs to be wired into a central control panel. This requires extensive wiring, and most office/education structures are not wiring friendly once built. Wireless machine-to-machine connectivity solutions will likely be the answer to this problem as they become increasingly cost effective in the market. The second hurdle in many offices has been ownership. The management company pushes energy costs through to the lessee and has little incentive to implement cost saving measures, while lessees find it difficult to

A PRIMER ON ENERGY EFFICIENCY
January 31, 2008 Thomas Weisel Partners LLCPage 25 of 71 Jeff Osborne 212.271.3577
install systems in buildings they do not own. It is also common for a lessee to have energy billed by square foot and not by individual energy usage, again giving little incentive to install energy saving measures. The value of LEED certified buildings and various incentives for energy efficiency are likely to help the ownership issue, but with estimated costs for energy efficiency products typically overestimated, it becomes the job of the industry to sell its product to the consumer and overcome the barriers.
Lighting System’s Decision Tree
Source: National Renewable Energy Lab

A PRIMER ON ENERGY EFFICIENCY
January 31, 2008 Thomas Weisel Partners LLCPage 26 of 71 Jeff Osborne 212.271.3577
Typical Efficacies and Lifetimes of Lamps Typical Efficacies and Lifetimes of Lamps
Efficacy Typical Rated Current Technology (Lumen/Watt) Lifetime (hours) CRI
Incandescent 10-19 750-2500 97Halogen 14-20 2000-3500 99Fluorescent T5 25-55 6000-7500 52-75 T8 35-87 7500-20000 52-90 T12 35-92 7500-20000 50-92 Compact 40-70 10000 82HID Mercury Vapor 25-50 29000 15-50 Metal Halide 50-115 30000-20000 65-70 HP Sodium 50-124 29000 22 LP Sodium 18-180 18000 0CRI = Color Rendition Index; indicating a lamp's ability to show natural colors Source: 2007 Buildings Energy Data Book
Relative output per watt and the lifetime of incandescents, halogens and standard Fluorescent T5 lighting lag other options. From the following chart (“2001 Total Lighting Technology Light Output vs. Consumption”), it appears as if T-12 and T-8 seem to be the most commonly used in the industrial and commercial setting, a solution that provides both long life, a good CRI (color rendition index) and efficacy. There is a wide range for each, however, suggesting widely varying product quality in the industry.
Lighting represents a major opportunity for creating more energy efficient buildings. Currently, there is 84 billion square feet of commercial building space, with 20 billion square feet in the commercial and industrial segments alone. If one assumed a standard fluorescent fixture every 200 square feet, and each fixture cost roughly $100, the market size for the C&I space would be roughly $10 billion dollars. Using Orion Energy’s HIF (high intensity fluorescent) technology, the company is able to place a fixture every 400-500 square feet, rather than the traditional 200 square feet, allowing it to garner double the traditional average selling price while providing considerable energy savings.
Light Output Versus Consumption by Lighting Technology 2001 Total Lighting Technology Light Output vs. Consumption
Output Consump Output Consump Output ConsumpIncandescent Standard 66% 87% 6% 26% 0% 2% Halogen 3% 3% 2% 5% 0% 0%Fluorescent T5 0% 0% 0% 0% T8 20% 13% 24% 21% T12 54% 40% 47% 45% Compact 1% 1% 3% 3% 0% 1% Miscellaneous 29% 9% 0% 0% 0% 0%HID Mercury Vapor 1% 0% 1% 2% 2% 3% Metal Halide 10% 9% 20% 23% HP Sodium 0% 0% 3% 1% 7% 5% LP Sodium 0% 0% 0% 0%Output in trillion Lumen-hour per yearConsumption in billion kWh per year
Residential Commercial Industrial
Source: 2007 Buildings Energy Data Book

A PRIMER ON ENERGY EFFICIENCY
January 31, 2008 Thomas Weisel Partners LLCPage 27 of 71 Jeff Osborne 212.271.3577
TYPES OF LIGHTS
Incandescent
The over 100-year-old incandescent light bulb works from about 1.5-300 volts and 0.1-10,000 watts. It is characterized by a low cost to produce and electrical flexibility as it does not require external regulating equipment to operate.
Makeup of the Typical Incandescent
1. Glass bulb2. Low pressure inert gas3. Tungsten filament4. Contact wire (goes out of stem)5. Contact wire (goes into stem)6. Support wires7. Stem (Glass mount)8. Contact wire (goes out of stem)9. Cap (Sleeve)10. Insulation (Vitrit)11. Electrical contact
Source: Wikimedia Commons
The bulbs typically have a glass enclosure, which is filled with an inert gas that prevents filament oxidation and supports the glass. In the enclosure is a coiled tungsten filament wire (thickness suited to application) through which electricity is passed, heating the filament to high temperatures of roughly 3,000-4,000 degrees Fahrenheit, making the metal white hot and creating light (the process of incandescence). Because the filament produces a full spectrum of light (visual and non-visual), incandescent lights are largely considered the most natural sources of light, but they also waste a considerable amount of heat in the process (approximately 90-95% of the energy used in incandescent lights is wasted as heat). For this reason, they are also the most inefficient of the popular lighting sources. In addition, they only last about 750-1,000 hours because the tungsten evaporates and deposits itself on the glass, eventually creating a thin spot where the filament will break.
Long Life Incandescent Lights
The Centennial Light is widely recognized as the longest burning light bulb, operating since 1901. The reason for this is the light bulb is powered by only four watts, which is considerably below its maximum output. A 5% reduction in the operating voltage of a light bulb results in roughly a doubling in a light bulb’s life, and running a light bulb significantly below its rated capacity can make it last a very long time, as in the case of the Centennial Light. Many long-life bulbs take advantage of this fact and cut the voltage to the bulb so it will last longer. Unfortunately, it does not pay to dim an incandescent bulb. Because the value of the electricity during the life of a typical light bulb is so much more than the actual light bulb, it pays to make them more efficient, and thus run them at a higher wattage.

A PRIMER ON ENERGY EFFICIENCY
January 31, 2008 Thomas Weisel Partners LLCPage 28 of 71 Jeff Osborne 212.271.3577
Suppose you have 10 100-watt light bulbs with a rated lifetime of 750 hours and, in total, they all use about 1 kW at a cost of $0.09 per hour (typical U.S. rate). A typical bulb costs $1.00 in many stores, so the average cost would be $67.50 for the electricity and $10 for the bulbs, or $77.50 in total. Now assume that we use 110 volts instead of 120 volts, the bulbs would produce 76% of their normal light output and consume 0.88 kW of electricity. To get the same light output as the 10 lights at full power you must now run roughly 13 lights at 110 volts. This results in a cost of $77 in electricity, higher than the cost of running the lights at full power and replacing them.
Opposition to Incandescent Lighting
The recent popularity of “green” thinking has brought about opposition to the relatively inefficient incandescent bulb. The European Union has proposed a ban on the sale of the bulbs, but it has yet to be approved by all of the member states. The first movers have been Italy, the Netherlands and Ireland, with others calling for phase outs, but not yet setting a firm date. In the United States, California will phase out the bulbs by 2018, while in Canada, the federal government has called for the phase out of “inefficient” incandescent lights (although not all incandescent bulbs) by 2012. Many other countries, including Brazil, Australia and Venezuela, have also moved to phase out the bulbs.
The elimination of incandescent bulbs has been met with opposition due to shortcomings with replacement technologies, specifically compact fluorescent lamps (CFL), related to their higher cost, operating performance and environmental issues (namely the small amounts of mercury in each bulb).
The 2007 Energy Bill included a new lamp efficiency standard for the incandescent industry. By 2012-2014, bulbs are required to use 25-30% less energy than today’s most common incandescent bulbs, and at least 60% less by 2020.
Halogen
A halogen is an incandescent light in which the filament is encapsulated by a small enclosure filled with a halogen gas. The gas allows the filament to operate at a higher temperature without oxidation, providing a slightly better operating life than traditional incandescents. The halogen gases also have another interesting property: when operating at a high temperature, the halogen will redeposit evaporated atoms back on the tungsten filament, essentially recycling the atoms and allowing for greater life.
A halogen bulb can be 10-20% more efficient than an ordinary incandescent bulb of similar properties. Halogen bulbs may also have a life that is two to three times longer than ordinary incandescent bulbs. The lifetime and efficiency is typically determined by the filler gas, usually krypton, xenon or argon.
Although the halogen’s life and efficiency are greater than a typical incandescent light, the relatively high operating temperature of halogen lights often require shields or cages, limiting the number of applications in which they are used. Similar issues with incandescent bulbs are also present in the use of dimmers with halogen lighting. Also, it is important to note that the halogen recycling process does not function as well when the light is not operating at full power. Major increases in bulb life necessitate a “soft-start” device, which keeps “necking” from

A PRIMER ON ENERGY EFFICIENCY
January 31, 2008 Thomas Weisel Partners LLCPage 29 of 71 Jeff Osborne 212.271.3577
occurring at the ends of the filaments (creation of weak points due to power spikes on the starting of the lights).
Fluorescent
A fluorescent lamp is a gas-discharge lamp that uses electricity to excite mercury vapor in argon or neon gas, creating plasma that produces ultra-violet light, which is converted to visible light through the use of fluorescence. The fluorescent conversion occurs in the typical phosphor coating placed on the inner part of the tube, where high energy photons are absorbed by electrons in the phosphor’s atoms, creating visible light. The cathode is typically made of tungsten, typically coated with barium, strontium and calcium oxide. Fluorescent lights require a ballast to regulate voltage and amperage, which is typically incorporated into the lamp housing.
Makeup of a Fluorescent Bulb
Source: Tom Harris – “How Fluorescent Lamps Work”, December 7, 2001 via Howstuffworks.com
Fluorescent lighting finds its history in the early discovery that evacuated glass glowed when a current was passed through it. In 1856, a German glassblower named Heinrich Geibler created a mercury vacuum pump superior to what had been previously available, thereby creating a tube that produced significantly more light than was previously possible. Although at that time it was simply a phenomenon most popular as a source of amusement, continued work on the Geibler design led to superior products, and forced the innovation of GE’s incumbent incandescent bulb to a longer-lasting tungsten filament in the early 1900s. By the early 1930’s, GE had obtained the lion’s share of the patents in the space and established a massive R&D effort geared toward the technology. By 1938, GE commercialized the technology, and by 1951 more light was produced in the United States by fluorescents than by incandescents.
Florescent lighting has two main advantages over their incandescent counterparts: higher efficiency and longer life. Compared to incandescent lights, florescent lights convert a larger proportion of energy into useable light and less energy into heat. Typical fluorescent lamps will last 10 to 20 times longer as an equivalent incandescent lamp. These two large advantages are offset, however, by many disadvantages that have allowed incandescent bulbs to maintain a strong market share. Because fluorescent lights do not provide a steady light source when magnetic ballasts are used, fluctuating at twice the supply frequency, they present many environmental issues (electronic ballasts do not produce light flicker). Flicker has been associated with headache and fatigue, among other more serious issues. Flicker is also an issue in industrial settings with rotating equipment as makes the equipment appear as if it is not

A PRIMER ON ENERGY EFFICIENCY
January 31, 2008 Thomas Weisel Partners LLCPage 30 of 71 Jeff Osborne 212.271.3577
moving, thereby creating a safety issue. Also, fluorescent lights produce UV light, which causes problems for individuals with sensitivity. Fluorescent lights require a voltage regulator or ballast, which adds an extra cost as well as added complexity to fluorescents. The ballast can also produce an audible buzzing noise and radio frequency noise, both of which can typically be addressed, but at an added cost. Furthermore, two main components of fluorescent lamps, phosphor and mercury, are toxic and present environmental and disposal issues. In 2006, a typical four foot lamp contained 12mg of mercury. In 2007, the National Electrical Manufacturers Association announced that it would establish a voluntary commitment to produce bulbs with less than 5-6mg of mercury (depending on wattage). Though this is a dramatic reduction in mercury, recycling programs will still be required, increasing the lifetime cost of the lighting system.
Compact Fluorescent Lights (CFLs)
CFLs are a basic fluorescent lamp, somewhat miniaturized, with an integrated ballast (although some have a modular ballast, which is less common). They are typically packaged to fit in a standard screw base for an incandescent bulb. CFLs typically last 7,500-20,000 hours, far longer than the 750-2,500 hours of a standard incandescent, while operating at a lower temperature and consuming approximately 75% less energy. The sales of Energy Star-qualified CFLs nearly doubled in 2007, according to Environmental Protection Agency (EPA) estimates. In 2007, 290 million CFLs were sold, and the bulbs now account for about 20% of the U.S. light bulb market. The EPA estimates that if every U.S. household replaced just one light bulb with a CFL, the United States would save more than $600 million each year in energy costs
Retailers such as Wal-Mart, Lowes, Home Depot, Costco, Menards, Ace Hardware and Sam’s Club have played a large role in the growth of the CFL, educating consumers and pushing the products in their stores.
Typical CFL Bulb
Source: Energy Star, Department of Energy
Issues with CFLs, however, are numerous. CFLs present all of the advantages and disadvantages of a typical fluorescent lamp, with a couple of other specific issues. CFLs continue to be larger than their incandescent counterparts, causing issues when a swap is attempted. CFLs do not work with dimmers, a problem with retrofitting. Also, the shapes required to fit a CFL in a conventional incandescent fixture are typically not optimal for light diffusion, causing lighting pattern issues. CFLs can take several minutes to reach full lighting and are best suited for applications during which they run for at least 15 minutes, if not more.

A PRIMER ON ENERGY EFFICIENCY
January 31, 2008 Thomas Weisel Partners LLCPage 31 of 71 Jeff Osborne 212.271.3577
The upfront costs for a CFL are considerably higher than a typical incandescent, creating a long payback period for what is considered by many residential consumers to be a lower quality light. Efficiency claims are also typically not accurate as optimum temperatures and usages are assumed, cutting into the value proposition of CFLs in real-world applications. Recycling and disposal of the bulbs present a major issue as programs are not widely established, and it is still easier to simply throw the bulbs away.
High Intensity Discharge (HID) Lamps
High intensity discharge lamps, also known as HIDs, have long been used in applications requiring significant light in large areas, such as streetlights, factories, stadiums, warehouses, etc. There are three main types of lamps: Mercury vapor, metal halide and high pressure sodium. The EIA estimates that as of 2003, there were 455,000 buildings in the United States representing 20.6 billion square feet that utilized HID lighting
HID System Make-Up
Source: Wikipedia
Light for HIDs is produced by an electric arch between two tungsten electrodes. The inert gas provides for the initial strike of the arc. Once the arc has started, it heats and evaporates the metal, creating plasma, which produces light. Like fluorescents, HIDs require a ballast for voltage regulation. HID lamps fail when, with age, the voltage required to maintain light increases past the amount supplied by the ballast, requiring the lamp to cycle off to cool down to the point where it can restart, and this process becomes more frequent as the lamp gets older.
Types of HID Lamps
High Pressure Mercury Vapor: These lamps typically contain a small amount of mercury with argon gas enclosed in a quartz tube. They typically produce a blue/white light as well as both visible and non-visible UV light. Color can be corrected using phosphors like the ones used in fluorescent bulbs, but doing so sacrifices efficiency. These types of lamps typically have a life in the 29,000 hour range. In many cases, mercury vapor lamps require UV filters, as the high level of UV light can cause severe sunburn or “arc eye”. The technology continues to be replaced by newer metal halide and high pressure sodium technology as cost comes down and technology improves. Mercury vapor lamps were first commercialized in 1934.

A PRIMER ON ENERGY EFFICIENCY
January 31, 2008 Thomas Weisel Partners LLCPage 32 of 71 Jeff Osborne 212.271.3577
Metal Halide: Constructed in a similar way to high pressure mercury lamps, metal halide contains other specialized metals to produce other color balances and higher efficiency. The most popular versions contain sodium iodide and scandium iodide.
High Pressure Sodium: Sodium lamps operate in much the same way as other HID lamps, but contain a small amount of sodium in addition to the mercury. These lamps operate at a higher temperature (1,300 degrees Celsius). Because the molten salt degrades glass or quartz at these high temperatures, a translucent ceramic material must be used. This ceramic is typically surrounded by a glass enclosure. High pressure sodium lamps produce an orange/white light. They are more efficient than mercury or metal halide lamps, but have a lower average life time than metal halide lamps.
The high temperatures of operation have limited the applications for HID lights, much like halogen lamps. Given that that HID lights use roughly half of the power of an equivalent halogen light, however, they are becoming more favored in niche applications. HID headlights have taken off in the past couple of years as the cleaner white/blue light is more favorable in nighttime driving than the yellowish color produced by halogens. Complaints about higher glare from HID headlights have prompted European regulation to require automatic aiming devices and lens cleaners to avoid blinding passing vehicles; no such regulation currently exists in the United States.
Light Emitting Diodes (LEDs)
Light emitting diodes, commonly referred to as solid state lighting, are semiconductor diodes that emit light when electricity is passed through. An LED consists of semi-conducting material doped to create a p-n junction, much like a typical diode. The doped material directs energy from the p-side to the n-side. When the charge reaches the n-side, it fills the hole, falling into a lower energy level and shedding a photon in the process. The color produced by the photon depends on the band gap of the material forming the junction.
LEDs were first created in the 1920s, but it was not until 1962 that the first practical, visible LED was created. Until recently, LEDs were primarily used in applications for which low voltage and long life were most important, namely in electronic device indicator lamps. Technology improvements over the last two decades have enabled LEDs to be used in many other applications, most notably when brightness and life are crucial, such as signaling and signage devices. LEDs are also currently used in task lighting, pathway and decorative lighting as well as general Illumination applications.
Benefits of LEDs
Long life
Energy savingsBetter quality light outputIntrinsically safeSmaller flexible light fixturesDurable
LEDs have minimum ultraviolet and infrared radiation.LED systems are low voltage and are generally cool to the the touch.The small size of LEDs makes them useful for lighting tight spaces.LEDs have no filament to break and can withstand vibrations.
LEDs can provide 50,000 hours or more of life, which can reduce maintenance costs. In comparison, an incandescent light bulb lasts approximately 1,000 hours.
Benefits of LEDs
Commercial white LEDs provide 40 lumens per watt, compared to 14-20 lumens per watt for incandescent lighting. LEDs are especially advantageous for colored lighting applications because filters are not needed.
Source: Rensselaer Lighting Research Center

A PRIMER ON ENERGY EFFICIENCY
January 31, 2008 Thomas Weisel Partners LLCPage 33 of 71 Jeff Osborne 212.271.3577
Lighting Supermarket Freezers with LEDs; A New Niche Application
Refrigerator display cases can account for nearly half of a supermarket’s energy usage; also, the lighting for these cases uses a quarter of the electricity required to operate the entire case, according to the Rensselaer Lighting Research Center (RLEC). Nearly all commercial refrigerators and freezers use linear fluorescent lamps, but their use in this application is not ideal. Fluorescent lamps in refrigerator applications exhibit a reduced light output of up to 25%, and have uneven lighting due to the lower temperatures and lack of appropriate placement.
In 2003, RLRC worked with GELcore, a LED systems manufacturer, and Tyler Refrigeration to build a prototype four door supermarket freezer incorporating white LED lights. The freezer was placed next to a fluorescent lit display case for 18 months, while a sales and energy analysis was conducted along with shopper surveys. According to the findings, 86% of the shoppers preferred the LED lighted freezers to the fluorescent lighted ones. With the LEDs dimmed 15% for power savings, 68% of the shoppers preferred the lighting to traditional fluorescents. Although in both cases the power output was lower for the LEDs than the fluorescents, the correlated color temperature (CCT) likely contributed the notion that the LED freezer was brighter. There was no significant difference in sales for the two cases, and fluorescents won on energy usage (in the study conducted in 2003). When the study was completed in 2006, efficacy of LEDs had nearly doubled to 45lm/MW, versus 25lm/W in 2003. Assuming 2006 efficacy levels based on this information, the energy savings with dimmed LEDs is 14W, with an overall benefit in lighting quality. We also note that this study only took into account the electricity consumed by the lamps, and not the necessary offset to the heat produced by fluorescent lighting, which is a clear benefit of LEDs.
Freezers from Rensselaer Lighting Research Center Study
Left: Fluorescent-lighted freezer with an average illuminance of 2871lx. Right: LED-lighted freezer with and average illuminance of 2470lx. Source: Rensselaer Lighting Research Center (RLEC)
Currently, EfficientLights, a subsidiary of PowerSecure, produces LED lights primarily for grocery stores for application similar to the one illustrated above. The LEDs emit a better light, while producing less heat in the refrigerator, which saves considerable energy. PowerSecure expects to get roughly $25,000 per store; according to the 2002 U.S. Census, there were roughly 66,000 grocery stores in the country, making this a possible $1.65 billion industry.

A PRIMER ON ENERGY EFFICIENCY
January 31, 2008 Thomas Weisel Partners LLCPage 34 of 71 Jeff Osborne 212.271.3577
Current Department of Energy R&D
Conventional Lighting (Source: DOE)
• “Higher Efficiency Filaments for Incandescent Lamps: modify the surface chemistry of tungsten to significantly increase the energy efficiency of incandescent light bulbs.”
• “Next-Generation, Energy-Efficient Fluorescent Lighting: developing advanced phosphors aimed at improving the color rendition and efficiency of compact and linear fluorescent lamps.”
• “Advanced Light Source Development: Includes multi-photon phosphor research.”
Integrated Building Environmental Communications System
Lawrence Berkeley National Laboratory produced a ballast/network interface that incorporates a digital potentiometer to dim 0-10 Volt ballast over the ballast control circuit. The cost of the interface to OEMs is estimated to be $1.
Ballast Circuit Board
Source: Department of Energy
This system can:
1. Add low-cost intelligence to ballasts, switches and sensors, thus allowing control systems to better serve their main purpose: efficiently managing lighting usage, while improving occupant comfort and satisfaction.
2. Implement demand-responsive lighting (or load shedding) by coupling dynamic control of lighting with real-time monitoring of electric lighting power.
3. Incorporate common design architecture, which allows attached sensors to serve more than one function and permits data from sensors and meters to be used by any program or system that needs it. For example, occupancy sensors could double as room occupancy indicators during times of emergency.
4. Allow all devices to be physically connected to a simple data bus, which greatly simplifies installation.
5. Allow all devices to speak a common protocol regardless of their functionality, which lowers the cost of software development.
6. Add network connectivity to lighting and other equipment, giving both facilities managers and occupants supervised control over building lighting systems.

A PRIMER ON ENERGY EFFICIENCY
January 31, 2008 Thomas Weisel Partners LLCPage 35 of 71 Jeff Osborne 212.271.3577
Energy Saving Benefits: Providing network connectivity to lighting equipment will bring about a complete transformation in how building lighting systems are commissioned, operated and maintained. Building managers will have the ability to selectively control lighting loads, while monitoring electric power in real time. Demand responsive lighting will reduce operating costs for the building, while improving the reliability of the overall electrical grid. The new technology will give building occupants greater influence over their personal lighting environment by allowing them to adjust local lights according to preference using a web browser on their PC.
Light Emitting Diodes and Organic Light Emitting Diodes (OLED)
Record Efficacy for White OLED (Source: DOE): “Universal Display Corporation successfully demonstrated an all-phosphorescent white organic light emitting diode with a record power efficacy of 45lm/W at 1,000cd/m2. This high-efficacy device was enabled by lowering the device operating voltage, increasing the outcoupling efficiency and incorporating highly efficient phosphorescent emitters.”
Universal Display Corporation White LED
Source: Department of Energy
LED Record Efficacy and Brightness (Source: DOE): “The Cree XLamp power LED set new records for LED brightness and efficacy, up to 85lm/W at 350mA. The XLamp utilizes Cree’s performance EZBright™ LED chip; both products include technology that was developed in part with R&D funding support from DOE.”
Cree XLamp power LED
Source: Department of Energy
Record EQE in Blue OLED Device (Source: DOE): “Scientists at Pacific Northwest National Laboratory have created a blue OLED device with an external quantum efficiency (EQE) of 11% at 800cd/m2. This achievement was accomplished at a much lower operating voltage (6.2V) than previous demonstrations, revealing potential for much higher power efficiencies.”

A PRIMER ON ENERGY EFFICIENCY
January 31, 2008 Thomas Weisel Partners LLCPage 36 of 71 Jeff Osborne 212.271.3577
Pacific Northwest National Laboratory blue OLED
Source: Department of Energy
Breakthrough Performance in White LEDs (Source: DOE): “Cree, Inc.’s Santa Barbara Technology Center achieved breakthrough efficacy greater than 65 lumens per watt in a white LED pre-production prototype. The improvement in brightness is particularly significant because it was achieved with Cree’s standard XLamp® power LED package, rather than a developmental package.”
Cree, Inc.’s White LED
Source: Department of Energy
Major Industry Players
Manufacturers of lighting products: Cooper Industries, Ruud Lighting, Acuity Brands and Genlyte.
Manufacturers of energy management solutions: EnerNOC, Comverge, Honeywell, Johnson Controls and Siemens.
Energy product distributors: Graybar, W.W. Grainger and GE Supply.
Electric contractors: very fragmented and localized.

A PRIMER ON ENERGY EFFICIENCY
January 31, 2008 Thomas Weisel Partners LLCPage 37 of 71 Jeff Osborne 212.271.3577
HEATING, VENTILATION AND AIR-CONDITIONING (HVAC) US Buildings Primary Energy and Expenditure and End Use
End Use Residential Commercial Residential CommercialSpace Heating 31% 14% 35% 16%Lighting 11% 26% 10% 23%Space Cooling 12% 13% 11% 8%Water heating 12% 7% 13% 12%Electronics 7% 6% 6% 4%Refrigeration 8% 4% 7% 6%Cooking 5% 2% 4% 2%Wet Clean 5% 0% 4% 0%Ventilation 0% 6% 0% 6%Computers 1% 3% 1% 3%Other 4% 13% 4% 13%
Energy Expenditure
Source: 2007 Buildings Energy Data Book
Heating, ventilation and air conditioning (known simply by HVAC in the industry) is the largest combined expenditure for both residential and commercial applications, representing 40-60% of energy used. Systems can work in tandem in a residential home, with a central heating, cooling and water heating system, or work completely separate in a modular fashion. In larger commercial settings, each system tends to be separate, but with the same central control system. HVAC tends to be looked at as a combined system because all functions are designed to maintain air temperature and quality.
In 2005, the total number of air-conditioners/heat pumps shipped was 8,607,525, and the total number of furnaces shipped was 3,512,464. Packaged air-conditioning units made up 50% of the market, while packaged heating units made about 30%.
US Heating and Air Conditioning Systems Manu Shipments, by Type (Inc Exports)Equipment Types 2000 2005 2005 Value (mn)Air Conditioners 5346 6472.3 5,836.60Heat Pumps 1539.2 2336 2,226.40Chillers 38.1 37.3 1,092.60Furnaces 3680.7 3623.7 2,143.70Boilers 368.4 369.7 NA Source: 2007 Buildings Energy Data Book
Types of Heaters
Boilers
Boilers typically consist of some type of tank containing water, which is heated by combustion to create hot water or steam. Boilers can use most any major fuel, including oil, coal, natural gas, electricity and wood power, depending on the application and availability of resources.
Main Residential Heating Fuel1970-1979 1980-1989 1990-2001
Natural Gas 42% 41% 56%Electricity 45% 50% 36%Fuel Oil 4% 2% 2%LPG 4% 5% 5%Other 4% 2% 1% Source: 2007 Buildings Energy Data Book

A PRIMER ON ENERGY EFFICIENCY
January 31, 2008 Thomas Weisel Partners LLCPage 38 of 71 Jeff Osborne 212.271.3577
Conventional Heaters
Cast Iron Boilers remain the most common. They can range from the smallest residential boilers all the way up to 10 million BTU/hour and are the most durable. Efficiencies range from 75% to 93%, depending on whether the boiler utilizes steam or hot water as well as boiler controls and boiler tune-ups. They work with most major fuels.
Water Tube Boilers range in size from 10 million BTU/hr to 300 million BTU/hour. They are generally found in large commercial/industrial applications and can use high or low pressure steam. Water tube boilers utilize hot flew gases passing around tubes that are filled with water. Efficiencies depend on many factor similar to cast iron boilers and work with most major fuels.
Fire Tube Boilers range in size from 0.6 million BTU/hr to 50 million BTU/hour. They utilize hot flew gases passing through tubes that are placed in water. They are found in medium-to-large C&I applications and can utilize steam or hot water. Efficiencies rely on many of the same factors highlighted above.
Boiler System
Source: Energy Star, Department of Energy
Modern Electronic Furnaces are differentiated by three types of electronic ignitions: the intermittent spark pilot, the intermittent hot surface ignition pilot (Honeywell smart valve and ignition assembly) and the hot surface ignition furnace. While the three are different, they all offer higher efficiencies and are controlled by solid-state circuit boards. The intermittent pilot directs a 10,000 volt charge across the fuel, causing ignition. Meanwhile, a hot surface contains a silicon-carbon element that glows red hot when power is applied to it, igniting the fuel as a result. Honeywell created an intermittent/hot surface system that uses both technologies. Both are very energy efficient because a pilot is not required, thereby saving energy.

A PRIMER ON ENERGY EFFICIENCY
January 31, 2008 Thomas Weisel Partners LLCPage 39 of 71 Jeff Osborne 212.271.3577
Typical Furnace
Source: Energy Star, Department of Energy
Heat Delivery Methods
Forced Hot Water delivery methods are often used with the previously mentioned boilers. The hot water or steam is passed through piping to separate rooms or areas, and is then diffused into the room. Temperature is regulated by the flow of hot water into the area.
Forced Hot Air furnaces are what the majority of single family homes utilize. Air is taken in from the home, heated, filtered and then returned to the home. They typically serve each room through ducts. This is a relatively inefficient way of heating a home as duct leakage allows for substantial heat losses.
Other Heating Methods
Electric Heat utilizes electricity to create heat, usually in a modular fashion rather than a central location. Heating is not cost effective or fuel efficient because most electricity is created by burning coal, oil, gas, etc., all of which only convert 30% of the energy into electricity.
Heat Pumps generally work in principle as an air conditioner in reverse. They move heat from one place to another. They are especially popular in the South, where relatively mild winters allow for their use. Electrically is typically used for the process; this is far more economical than producing heat with electricity because the electricity is not producing heat, but moving it. Ground sourced heat pumps, or geothermal pumps, typically are the most efficient because the ground tends to be cooler than the air when it is hot and warmer than the air when it is cold. The best heat pumps are more efficient than high-efficiency gas fired combustion furnaces. Ground sourced heat pumps continue to have a small foothold in market as air sourced pumps are less complicated to install.

A PRIMER ON ENERGY EFFICIENCY
January 31, 2008 Thomas Weisel Partners LLCPage 40 of 71 Jeff Osborne 212.271.3577
Heat Pump
Source: Energy Star, Department of Energy
Cooling
Absorption/Evaporative Cooling takes advantage of the differences in the space air and the cooling source in its operation. In the usual process, air temperature is lowered by passing it over a cooled surface, typically created by refrigerant of water.
Typical Absorption Air conditioner
Source: Energy Star, Department of Energy
Chillers are the cooling equipment that produces chilled water or refrigerant to cool air. There are two main categories of chillers: water-cooled and air-cooled. Water-cooled chillers use water to move heat away from their condensers, which are cooled in a cooling tower. An air-cooled system has condensers that are cooled with air rather than water. The most efficient chillers currently available operate at efficiencies of around 0.50 kilowatts per ton (kW/ton). There are several types of chillers that cater to specific applications (see following exhibit).

A PRIMER ON ENERGY EFFICIENCY
January 31, 2008 Thomas Weisel Partners LLCPage 41 of 71 Jeff Osborne 212.271.3577
Chiller Types Chiller Types
Centrifugal Reciprocating Rotary AbsorptionDescription Variable-volume
compression using centrifugal force
Piston type compression, suitable for small and variable loads
Positive displacement compression using two machine rotors
Uses heat in the system instead of mechanical compression
Initial cost per ton of cooling $500-700 $450-600 $500-800 $1,000-1,400Maintenance cost Medium Higher Lower LowerAppropriate size in tons of cooling 90-1000 3-100 20-2000 100-5000Space requirements, noise and vibration Small, high-pitched
noise, no vibrationLarge, high noise and vibration
Small, quite, no vibration
Large, low noise and vibration
One ton of cooling= 12,000 btu/hr or 3.5 kW of cooling output Source: 2007 Buildings Energy Data Book
Although an air conditioning system operates in much the same way regardless of the components one uses, the efficiency is greatly affected by more than just the air conditioning unit itself. A complete system also includes the air distribution system (i.e., ductwork, dampers, grilles and registers) as well as the temperature control system. Each of these components makes an important contribution to the performance and efficiency of the system as a whole. In order to operate efficiently, a system needs to be properly sized and installed. Oversized units cost more to operate, and poor installation can dramatically reduce the efficiency of the system. A quality installation will have properly sized ductwork that is sealed to reduce air leakage, balanced airflow throughout the building as well as proper refrigerant charge and airflow. The controls are also an integral part of the system and should include programmable thermostats and timers for scheduling of air conditioning equipment.
HVAC Efficiencies and Standard Min Efficiency Standards and Max Energy Use for Typical Single Family Residential Heating and Cooling Equip
Heating Equipment 2006 North South North SouthNatural Gas, Furnace (AFUE) 78 1170 445 1170 445Oil, Boiler (AFUE) 80 731 NA 731 NAElectric, Heat Pump (HSPF) 7.7 12923 4685 11412 4137
Cooling Equipment 2006 North South North SouthCentral Air Conditioner 13 1113 2543 927 2119Electric, Heat Pump 13 1100 2414 846 1857
Max Electricity Usage 1992 New Units, kWh Max Electricity Usage 2006 New Units, kWhMax Efficiency AFUE
Max Efficiency SEER 1992 New Units, kWh 2006 New Units, kWh
Source: 2007 Buildings Energy Data Book
Residential Air Conditioner and Heat Pump Cooling Efficiencies Residential Air Conditioner and Heat Pump Cooling EfficienciesEquipment Type 2004 US Average New Eff 2005 Best Available New EffAir Conditioners 11.2 18.9Heat Pump-CoolingAir-Source 11.5 18.6Ground-Source 16 27Heat Pump -HeatingAir-Source 6.8 10.6Ground-Source 3.5 4.9 Source: 2007 Buildings Energy Data Book

A PRIMER ON ENERGY EFFICIENCY
January 31, 2008 Thomas Weisel Partners LLCPage 42 of 71 Jeff Osborne 212.271.3577
Commercial Equipment Efficiencies Commercial Equipment EfficienciesEquipment Type Eff parameter 2004 Avg. New Eff 2004 Best AvailableChillers Reciprocating COP 2.9 3.5 Centrifugal COP 5.9 7.3 Gas-Fired Absorption COP 1 NA Gas-Fired Engine Driven COP 2 NARooftop A/C COP 3 4Rooftop Heat Pump EER 10.3 11.7Boilers Gas-Fired Thermal Eff 80 90 Oil-Fired Thermal Eff 83 89 Electric Thermal Eff 98 98Gas Fired Furnace AFUE 80 82Water Heater Gas-Fired Thermal Eff 80 99 Electric Resistance Thermal Eff 98 98 Gas-Fired Instantaneous Thermal Eff 80 89 Source: 2007 Buildings Energy Data Book
UNDERSTANDING EFFICIENCY MEASURES
EER (energy efficiency ratio) is a measure of how efficiently a cooling system will operate when the outdoor temperature is at a specific level (usually 95 degrees Fahrenheit). A higher EER means the system is more efficient. The term EER is most commonly used when referring to window and unitary air conditioners and heat pumps, as well as water-source and geothermal heat pumps.
SEER (Seasonal Energy Efficiency Rating) is the most commonly used measure of the efficiency of consumer central air conditioning systems. EER, or Energy Efficiency Rating, is the most commonly used measure of efficiency for commercial air conditioning systems. We also note that as of January 2006, an air conditioner must have a SEER of at least 13 to be sold in the United States. Higher efficiency models have a SEER of up to 21.
COP (coefficient of performance) is the measurement of how efficiently a heating or cooling system (particularly a heat pump in its heating mode and a chiller for cooling) will operate at a single outdoor temperature condition. When applied to the heating modes of heat pumps, that temperature condition is usually 47 degrees Fahrenheit. The higher the COP, the more efficient the system.
AFUE (annual fuel utilization efficiency) is the measurement of how efficiently a gas furnace or boiler will operate over an entire heating season. The AFUE is expressed as a percentage of the amount of energy consumed by the system that is actually converted to useful heat. For instance, a 90% AFUE means that for every Btu worth of gas used over a heating season, the system will provide 0.9 Btu of heat. The higher the AFUE, the more efficient the system.
The thermal efficiency of a furnace or boiler is equal to the combustion efficiency minus the jacket loss. Stated differently, the thermal efficiency is the efficiency of the furnace after you subtract out the energy lost up the flue, and the energy thrown off (and lost) by the jacket of the boiler itself.

A PRIMER ON ENERGY EFFICIENCY
January 31, 2008 Thomas Weisel Partners LLCPage 43 of 71 Jeff Osborne 212.271.3577
Major Industry Players 2005 Market Shares
Company FurnaceAir Conditioners /
Heat PumpsUTC/Carrier 30% 28%Goodman (Amana) 15% 16%American Standard (Trane) 13% 15%Lennox 14% 12%Rheem 11% 11%York 9% 10%Nordyne 6% 7%Others 2% 2% Source: 2007 Buildings Energy Data Book
The market in the heating and cooling business is relatively concentrated. With Ingersoll-Rand’s acquisition of Trane (announced in December 2007), it will move into the number two spot behind leader Carrier Corp, a division of UTC, which is a $14 billion per year business.
Co-Generation and Efficiency
At the beginning of the 20th century, vertically integrated electricity utility producers made up approximately two-fifths of the nation’s electricity requirements. At the time, many businesses generated their own electricity, but when utilities offered access to cheaper electricity via transmission lines, there was a shift to the more convenient means of accessing electricity. The installation of increased transmission infrastructure led to the inevitable increased use by individual household consumers. As a result, electricity consumption in the United States took off. As the utilities grew, states began to regulate the business due to the view that generation and distribution were natural monopolies that needed to be regulated. The regulations generally allowed utilities to have a monopoly in an area, an ability to pass on costs and a fair rate of return in exchange for rate control by the states. This is the traditional rate-based system we see today. Federal regulation in the 1920s took any additional private utilities that the states were unable to regulate and placed them under government control.
Currently, approximately two-thirds of the fuel used to generate electricity in the United States via conventional central power plants is wasted in the form of discarded heat, according to the Oak Ridge National Laboratory. Co-generation has the potential to play a large role in augmenting the current electrical system and increasing the efficiency overall. Co-generation works by producing electricity and using the waste heat for environmental heating/cooling and water heating.

A PRIMER ON ENERGY EFFICIENCY
January 31, 2008 Thomas Weisel Partners LLCPage 44 of 71 Jeff Osborne 212.271.3577
Losses in Power Production
Source: Oak Ridge National Laboratory
The benefits of Co-generation are:
1) It can deliver energy close to or at the source: The ability to generate power at the point of use eliminates the need for costly infrastructure upgrades and transmission loss.
2) Onsite generation can be used in conjunction with the grid: Many industrial applications choose to supplement their grid electricity use with a distributed generation system to guard against potential power outages that could halt operations.
3) Increased costs associated with shutdown: In today’s world of real-time inventories, many producers cannot afford the costs of an unplanned plant shutdown. Unexpected power outages are becoming increasingly expensive for companies. This, coupled with the decreasing reliability of the U.S. grid system, has contributed to a compelling argument for distributed generation and co-generation.
4) High Efficiency: A typical co-generation plant can operate at over 80% efficiency, which is far superior to central generation.
Current Department of Energy R&D
Diagnostic and real-time monitoring tool (Source: DOE): “Diagnostic tools improve equipment performance by signaling the need for preventive maintenance or repairs. Also, monitoring tools allow real-time control of energy loads. DOE and its partners are currently developing a charge indicator: an on-board diagnostic tool that measures the charge of working fluid on vapor compressors, alerting facility managers or homeowners of the need for recharging. Heat pumps are the initial target application. Other potential applications include commercial refrigerators, heat pump water heaters, small residential heating as well as cooling equipment and large chillers. Other current developments are the coefficient of performance (COP) meter, an on-board or hand-held device that assesses heating and cooling equipment efficiency by measuring charge, air flow and temperature. Also available is the distributed

A PRIMER ON ENERGY EFFICIENCY
January 31, 2008 Thomas Weisel Partners LLCPage 45 of 71 Jeff Osborne 212.271.3577
package terminal air-conditioner (PTAC) controller, which allows real-time monitoring and control of package terminal air-conditioners, enabling commercial facilities to automatically turn off cooling in unoccupied rooms, or to selectively shed loads in periods of peak demand.”
Improvements in supermarket refrigeration (Source: DOE): “Current supermarket refrigeration systems have the potential for significant refrigerant leak rates and high power consumption. DOE has assessed several system concepts that feature greatly reduced refrigerant charge and emission levels as well as the integration of the stored heating/cooling equipment to allow the refrigeration rejected heat to be recovered for space heating. A field demonstration, conducted in collaboration with a supermarket chain, an electric utility in Massachusetts and the Electric Power Research Institute (EPRI), showed that a distributed refrigeration/water-source heat pump HVAC system could achieve about 20% primary energy savings in the Massachusetts area, compared to a state-of-the-art conventional refrigeration/HVAC arrangement.”
Frostless heat pump (Source: DOE): “When ambient temperatures fall below about 40 degrees Fahrenheit, frost begins to build up on the outdoor heat exchanger coil of conventional heat pumps, diminishing their heating effectiveness. Periodic defrosting is required, during which a four-way valve temporarily reverses the heat pump cycle, diverting heat from inside the house to the outdoor coil. To temper the resulting drop in temperature of the air supplied to the indoor space, conventional systems energize supplemental resistance-heating elements. Even with substantial power flowing through the heating elements, however, the indoor air temperature is temporarily lowered, resulting in what is commonly called “cold blow”, a major concern of heat pump manufacturers and consumers. The defrosting cycle not only reduces occupant thermal comfort and causes power surges, but also decreases system reliability because of the stresses imposed on such components as the four-way valve, the compressor and the resistance-heating elements.
“The frostless heat pump, developed with support from DOE and industry partners, cost-effectively addresses these concerns by drastically reducing the frequency of defrost cycling (by a factor of five in the Knoxville, Tennessee area) and eliminating cold blow. The key innovation is the addition of heat to the accumulator, which increases the temperature of the refrigerant entering the outdoor coil. Tests have shown that the addition of moderate amounts of heat dramatically retards frost formation over a substantial range of outdoor ambient conditions where frost is likely to form. When the frostless heat pump does require cycle reversing, the indoor fan is shut off, thus avoiding cold blow draft and heat removal from the conditioned space.”
Thermally activated heat pumps (Source: DOE): “Heat pumps used today are electrically driven and operate on the conventional vapor-compression refrigeration cycle. Thermally activated heat pumps that operate on natural gas fuel have the potential to revolutionize the way residential and commercial buildings are heated and cooled. Such natural gas driven heat pumps can achieve substantial improvements in energy efficiency by avoiding the energy conversion losses (approximately 70%) associated with electric power generation and distribution. Highly efficient heat pumps could outperform the best natural gas furnaces, reducing energy use by as much as 50%, while also providing gas-fired air conditioning. In large commercial-size absorption chillers, energy efficiency can be improved by 50% with advanced high-temperature cycles and novel fluids. The DOE is developing and testing thermally activated technologies in residential absorption heat pumps, such as the generator absorber heat exchange cycle heat

A PRIMER ON ENERGY EFFICIENCY
January 31, 2008 Thomas Weisel Partners LLCPage 46 of 71 Jeff Osborne 212.271.3577
pump and the “Hi-Cool” heat pump, as well as in large commercial chillers with double-condenser-coupled cycles.”
Residential thermal distribution systems (Source: DOE): “Because nearly all new homes in the United States feature forced air distribution, these systems have been the focus of recent DOE research. Typical duct systems lose 25-40% of the heating or cooling energy put out by a central furnace, heat pump or air conditioner. Air leaks are one source of energy loss. Another source is conduction loss, which is greatest when ducts are installed outside the conditioned (heated and cooled) parts of the houses. The National Association of Home Builders found this to be the case in 67% of new homes with forced air distribution built between 1996 and 1998.
“Improving thermal efficiency can yield dramatic reductions in energy costs. DOE research, conducted in conjunction with Habitat for Humanity and Oak Ridge National Laboratory, measured the energy savings realized by placing the thermal distribution system inside the conditioned space and demonstrated a 30-40% savings in both the heating and cooling energy demand for a 1,200 square foot house. DOE is working on several new technologies for improving duct efficiency and enabling easier installation within conditioned space.”
Controls
Lighting Controls
Type of ControlOpen Office -
DaylitOpen Office -
Interior
Occupancy Sensors ++ ++
Time Scheduling ++ ++
Daylight Dimming ++ 0
Bi-Level Switching + +
Demand Lighting ++ ++
Typical Lighting Control Applications
++ = good savings potential
+ = some savings potential
0 = not applicable Source: “How to Select Lighting Controls for Offices and Public Buildings”; Federal Energy Management Program, December 2000
Manual Dimmers: This is a typical side switch dimmer that most of us have in our houses. Typical installations are for the comfort of the owner, but can facilitate energy savings and lengthen the life of the bulb in use. More complex electronic dimmers will have preset settings for various mood lighting. The most common dimmers are for incandescent applications as they require no special ballast regulators. Halogen lights benefit particularly from dimming as it extends their already superior lifetime. Fluorescent and high intensity discharge lamps are less likely to use dimmers because of the added cost and complexity of ballast adjustments. A mix of ballast requiring lighting and incandescent lighting with dimmers can be used for a mix of steady and variable light to achieve cost savings.
Photosensors: These devices adjust lighting based on the light detected. Typically, a photocell is used and the energy produced by the cell regulates the dimmer. Some sensors will turn lights off and on, while others dim based on desired light levels. This technology is particularly interesting in applications in which lights are left on all day, but natural light is present, such as C&I settings with skylights.

A PRIMER ON ENERGY EFFICIENCY
January 31, 2008 Thomas Weisel Partners LLCPage 47 of 71 Jeff Osborne 212.271.3577
Occupancy Sensors: These devices turn lights on and off by detecting motion in a space. The sensor can be used in conjunction with dimmers to lower the amount of light when an area is not occupied. Three types of sensors are typically used: passive infrared, ultrasonic and a combination of the two. Passive infrared detects occupant’s body heat and is best suited for small spaces with a limited number of obstructions. Ultrasonic emits an inaudible sound that is read upon reflection. Ultrasonic sensors are better for larger areas and those that require detection of minor motion. They work best in areas with hard surfaces, which deflect the sound. Sensors incorporating both infrared and ultrasonic minimize the shortcomings of both technologies, but at a higher cost.
Bi-Level: This technology is most commonly used in situations when both overhead and task lighting are utilized. It is a simple switch between the two. It can also apply within a single fluorescent fixture where multiple bulbs are present.
Timers: These devices are primarily a switch that is turned off and on by a clock or at a preset time period. They can be used as stand-alone elements, but work best in conjunction with occupancy sensors, photosensors or a centralized lighting control system.
Centralized controls: This technology is a central control system that controls total building lighting. Centralized controls use all above controls to control the lighting, using a preset scheme based on occupancy, time of day and lighting needs. A centralized system offers the greatest control of lighting needs, especially for lighting systems in which space either is not occupied all the time or receives significant natural light, among other things.
Demand dimming: Peak demand periods, notably the middle of the day during the summer, can translate into higher energy costs (in some cases for some users). Dimming during these peak periods can provide significant operational savings. As time of day pricing becomes more prevalent, so will the demand for such controls.
The following chart below demonstrates the cost effectiveness of popular lighting controls.
Cost Comparison of Lighting Controls
PerformanceOccupancy
Sensors DaylightingOccupancy Sensor
+ Daylighting
Annual Energy Usea 340 kWh 330 kWh 250 kWh
Annual Energy Cost $24 $24 $18
Annual Energy Cost Savings $9 $9 $15
Performance Time Scheduling Occupancy Sensors DaylightingTime Scheduling +
Daylighting
Annual Energy Usea 5100 kWh 5000 kWh 4200 kWh 3700 kWh
Annual Energy Cost $305 $300 $250 $220
Annual Energy Cost Savings $35 $40 $90 $120 a Average daily "on" hours for wall switch is 9.1. Average daily occupied hours for the office is 6.8.Cost-Effectiveness Assumptions: Each of the two operating cost comparisons assumes that the workspace has approximately 1.5 watts per square foot of ceiling lighting, with parabolic troffer luminaires containing T-8 lamps and electronic ballasts. Daylighting examples assume a design light level of 55 footcandles at work surfaces. Assumed electricity price: $0.06/kWh, the Federal average electricity price (including demand charges) in the U.S.
Open Office Area, 1000 sq. ft.
a Average daily "on" hours for wall switch is 14.7. Average daily occupied hours for the office is 12.9.
Operating Cost Comparison
Private Office, 128 sq. ft.
Operating Cost Comparison
Source: “How to Select Lighting Controls for Offices and Public Buildings”; Federal Energy Management Program, December 2000

A PRIMER ON ENERGY EFFICIENCY
January 31, 2008 Thomas Weisel Partners LLCPage 48 of 71 Jeff Osborne 212.271.3577
HVAC CONTROLS
Defined as products that control and regulate heating, ventilation and air-conditioning, HVAC controls can be very broad in application. Controls for these products have been around for many years in the forms of thermostats and other more rudimentary devices. The development of smaller computer systems have greatly changed the way HVAC is controlled. In residential applications, the user would most likely see a control panel at the furnace or in a central location that can cycle hot air/water times in conjunction with the conventional thermostat, based on occupancy, sleep times, time of day, etc.
Programmable Thermostat
Source: Energy Star, Department of Energy
Commercial and industrial applications require much more sophisticated equipment. In the early days of large buildings and HVAC, control providers often did not sell their products over the counter, but on a supervised basis, through distributors and installers with expertise in the area. The development of direct digital controls created niche markets for energy management in the late 1970s due to the higher energy costs at that time. Since then, incumbents have adapted this technology, but still face a relatively high level of competition from smaller firms in the digital control equipment market.
In some cases within the C&I market, heating and cooling generation are in one centralized spot; this is common in a larger, taller building where space is limited. In a factory-like environment, heating and cooling units will be mounted on the roof; this is a lower cost solution for larger spaces. Regardless of application, direct digital controls on the point of interest will gather information and send it to a central control.

A PRIMER ON ENERGY EFFICIENCY
January 31, 2008 Thomas Weisel Partners LLCPage 49 of 71 Jeff Osborne 212.271.3577
Major HVAC Industry Players
Environmental control systems
Environmental combustion controls; sensing controls
Auxilec Bosch
Barber Colman Cherry
Dukes Danfoss
Eaton-Vickers Eaton
Goodrich Emerson
Liebherr Endress & Hauser
Pacific Scientific Holmes
Parker Hannifin Invensys
Smiths Johnson Controls
TAT Motorola
United Technologies Schneider
EnerNOC Siemens
Comverge United Technologies
Orion Yamatake Source: Honeywell 2006 10-K
Advanced Metering and Demand Response
Demand response, simply put, is the automatic voluntary or mandatory curtailment of electricity usage by utility end consumers at critical times when electricity demand threatens to outstrip capacity or in response to high electricity prices.
Services such as lights, machines, heaters and air conditioners are reduced according to a pre-planned load prioritization scheme during a critical time period, often through wireless signals. In some demand response programs, the load is transferred to distributed generators at customer sites, thus reducing stress on the grid. By automatically sending a signal to shut down, the utility or program administrator not only reduces the load on the system, but effectively creates an additional amount of capacity equal to the reduction in load, which can be used to meet peak demand at reasonable rates. Essentially, demand response shifts the demand curve to the left, and therefore the price of electricity supply down, while improving system reliability. To provide a frame of reference for the potential savings from demand response, the International Energy Agency estimates that even a 5% reduction in peak demand during the California energy crisis of 2000-2001 would have reduced the highest wholesale prices by 50%.
The Federal Energy Regulatory Commission (FERC) defines advanced metering as “a metering system that records customer consumption (and possibly other parameters) hourly or more frequently and that provides for daily or more frequent transmittal of measurements over a communication network to a central collection point.” The key here is that advanced metering does not just refer to meters, but also includes the infrastructure required, such as communication networks and data management systems. This full system is commonly referred to as Advanced Metering Infrastructure (AMI).
Thus, AMI differs from (1) conventional electromechanical “kilowatt-hour” meters, which account for more than 90% of the current meter population, record cumulative energy usage and are usually read once a month during an on-site visit by a utility employee; and (2) automated meter reader systems (AMR), which add a low-power transceiver to a conventional kWh meter. This meter can then be read from a utility vehicle that drives by the customer site once a month, speeding up meter reading and reducing utility personnel costs.

A PRIMER ON ENERGY EFFICIENCY
January 31, 2008 Thomas Weisel Partners LLCPage 50 of 71 Jeff Osborne 212.271.3577
Building Blocks of AMI
Source: FERC
FERC estimates that AMI currently has a low market penetration of just less than 6% in the United States. Moreover, the results of FERC’s 2006 survey indicate that AMI penetration across utility customer classes is similar to the national penetration estimate, with the highest penetration rate (8%) associated with transportation customers (see exhibit below).
United States Penetration of AMI
Source: FERC
Some of the more prominent meter manufacturers include Cannon Technologies, Echelon, ESCO Technologies, Hunt Technologies, Itron, Power Meter, SmartSynch and the Trilliant Group.
Penetration of AMI by Customer Class
0%
1%
2%
3%
4%
5%
6%
7%
8%
9%
Transportation Residential Industrial Commercial Other
United States Penetration of AMI
Non-Advanced Metering
94.1%
Advanced Metering
5.9%

A PRIMER ON ENERGY EFFICIENCY
January 31, 2008 Thomas Weisel Partners LLCPage 51 of 71 Jeff Osborne 212.271.3577
Example of a Smart Thermostat
Source: Comverge, Inc.
AMI networks may be configured to allow one-way or two-way communications. Two-way AMI networks allow communications between both the customer and the meter, and between the grid operator and the meter. One-way communication networks, on the other hand, only support reporting of customer usage from the meter out to the utility and/or to the grid operator. Two-way AMI communications networks enable the grid operator to control a customer’s usage and remotely diagnose and repair outages, as well as provide price information or system conditions to the customer and in-home devices such as smart thermostats, air conditioning units and computer networks that link to in-home appliances. Therefore, two-way AMI networks have greater capacity to support various forms of demand response than one-way AMI.
A feature of meters that has gained attention of late is the ability to connect to a Home Area Network (HAN). A HAN is a network contained within a user’s home that connects a person’s digital devices (from multiple computers and their peripheral devices to telephones, VCRs, televisions, video games, home security systems, “smart” appliances, fax machines and other digital devices that are wired into the network). Including the HAN module into the meter can provide the benefits of remote load control over multiple in-home appliances, enhanced ability to measure, verify and dispatch demand response as well as feedback displays to consumers that show the billing effects associated with usage of various appliances.
EQUIPMENT
Standard Appliances
Refrigerators alone account for 12% of the energy used in the residential space, while water heaters account for another 17%. Small increases in efficiencies for these products can yield large results. Multiple examples exist where energy consumption can be reduced. Also, in an environment where customers demand energy efficiency, manufacturers will be in an advantageous position to “pick the low hanging fruit” to satisfy demand.
• The Department of Energy estimates that between 1980 and 1990, more than $6 billion in energy costs was saved from an improved refrigerator/freezer compressor design. The DOE has also designed a freezer that uses less than 1 kWh of energy per day, half as much as the latest government standards. Also, if every one of the 125 million refrigerators/freezers in the country ran as efficiently, $6.5 billion in energy costs would be saved. If the waste heat used in refrigeration was recovered, that would also be a huge boost in efficiency.

A PRIMER ON ENERGY EFFICIENCY
January 31, 2008 Thomas Weisel Partners LLCPage 52 of 71 Jeff Osborne 212.271.3577
• The DOE estimates that the use of horizontal-axis clothes washers could save 60% in energy costs and 40% in water usage over traditional washers.
• In 2004, the DOE estimated that Energy Star products could have saved home owners up to one-third of their energy costs, and did save $10 billion in energy costs overall.
Energy Vampires
While the aforementioned energy efficient products are helpful, there is an increasing number of products with some type of standby or continuous running, as well as external power supplies that continuously run. Below is the standby power consumption of a list of products complied by the DOE.
Efficiency Recommendations
Product TypeRecommended Standbyb Levels
Best Available Standby Level
Desktop Computera 2 watts or less 1 watt or lessIntegrated Computera,c 3 watts or less 3 watts or less
Laptop Computer 1 watt or less 1 watt or lessWorkstationa,d 2 watts or less 1 watt or less
Computer Monitor 1 watt or less 1 watt or lessPrintera 1 watt or less 1 watt or lessCopier 1 watt or less 1 watt or lessScanner 1 watt or less 1 watt or lessFax/Printer 2 watts or less 1 watt or lessMultifunction Devicesa,e 1 watt or less 1 watt or less
Docking Station 2 watts or less 1 watt or less
TV 1 watt or less 1 watt or lessVCR 2 watts or less 1 watt or lessTV/VCR/DVD Combo 3 watts or less 1 watt or lessDVD Players 1 watt or less 1 watt or less
Consumer Audio 1 watt or less 1 watt or less
Microwave Oven 2 watts or less 2 watts or less
Efficiency Recommendation
Office Equipment
Audio/Video Products
Major Appliances
a If this product is connected to a local area network and operated continuously, then buyers should select products with the lowest possible sleep power level.b Standby power refers to the electricity used by electrical products when they are switched off or not performing their primary purpose.c An "integrated computer" is a product that combines the processor and display monitor in one case and draws power through a single cord.d A "workstation" is a high-performance desktop computer that can be equipped with multiple processors and is generally dedicated to computationally intensive tasks.e A "multifunction device" is a product that perfroms two or more of the following: copying, faxing, scanning, or printing. Fax machines that do convenience copying (single sheet) are not considered multifunction devices for purpose of determining standby power. Source: Department Of Energy

A PRIMER ON ENERGY EFFICIENCY
January 31, 2008 Thomas Weisel Partners LLCPage 53 of 71 Jeff Osborne 212.271.3577
While the standby power levels do not look substantial, spread over a residence, or more importantly an office building, these “vampires”, as they are called, really add up. The DOE estimates that energy vampires add some 20% each month to an average residence’s energy costs. This amounts to a cost of $3 billion per year, or roughly 5% of U.S. energy consumption. In fact, the DOE cites that a TV can use more energy during the 20 hours it is off waiting for you to turn it on than during the four hours in the evening when you are watching it. The DOE says that on average, one watt saved in standby power equals $1.25 in energy costs over the lifetime of the product. For example, if an office was to buy 200 low-standby monitors at one watt for standby instead of three watts, it would save $500 over the lifetime of the monitors.
Smart Appliances
Just as our computers talk to each other, soon our appliances will as well. The concept is not new; Microsoft has been creating its vision of the futuristic home since 1994. Controls and self-monitoring systems have been present in automobiles for more than two decades, but the advances there have made little progression over to the consumer appliance space. The prevalence of cheap, thin LCDs, the promise of even cheaper and thinner OLED screens as well as dropping memory, processing and wireless costs, however, are making it increasingly likely that the new features will be incorporated into our everyday home appliances, making them more computer-like than ever before. Companies will increasingly be able to differentiate their products by adding a number of novel technologies to augment traditional appliance functions.
Aside from the advantages of a stove alerting you to burning fish sticks, or a washer that can really tell you if your whites are whiter, there are some larger benefits to “smart” appliances. Self-monitoring products can alert users of operational issues, which would be extremely helpful in gas stoves, for example. Also, appliances that could monitor their own energy usage would be a boost to energy efficiency. In two separate studies done by Pacific Northwest National Laboratory, it was found that consumers with smart appliances that monitored energy consumption were willing to adjust their energy use to market price signals. Customers were given new electric meters, thermostats, water heaters and dryers all connected by IBM designed software, and were able to adjust consumption via the internet. The dryers were outfitted with equipment that would shut down the heating element and other energy zappers when there was strain on the grid, but keep the tumbler going, causing customers to barely notice. Some customers reported up to 15% energy savings. The cost of retrofitting a house was roughly $1,000, but this included research costs. Therefore, the researchers feel the cost could drop to $200 in a few years.
Perhaps the greatest opportunity in the space exists not in the hardware, but in the systems software for new appliances. The introduction of wireless technology along with cheap components will allow the products to exist, but the real trick will be getting them to talk in some productive manner. A product named Surveyor, which was developed through the Northwest Efficiency Alliance and is now marketed by Verdiem, measures and manages energy use of computers (which now is essentially an appliance in many areas) on networks. A typical computer consumes 600kWh of electricity per year, but wastes nearly half of the energy delivered to it. The Surveyor software talks with each computer on the network and is able to reduce energy consumption by an average of 200kWh per computer, or $20-60 per PC per year. In a PC intensive environment such as an office building with 10,000 PCs, the system can save

A PRIMER ON ENERGY EFFICIENCY
January 31, 2008 Thomas Weisel Partners LLCPage 54 of 71 Jeff Osborne 212.271.3577
the user roughly $200,000 per year. Potential technology like this could be applied to multiple pieces of equipment in both the C&I and residential markets, allowing users to monitor and automatically regulate energy consumption.
Data Centers
The demand of processing power in the last decade has led to a substantial increase in the amount of power used (most notably by servers), particularly as companies have focused on performance while placing little emphasis on power consumption. A study from Berkeley National Lab entitled Estimating Total Power Consumption by Servers in the U.S. and the World estimated that energy use by servers made up 1.2% of U.S. and 0.8% of world electricity consumption in 2005. In a study by the Alliance to Save Energy (ASE) supported by Advanced Micro Devices, which was entitled Energy Efficiency in Data Centers: A New Policy Frontier, it was estimated that there were roughly 10 million servers in the United States and 20 million servers worldwide that run 24 hours a day, seven days a week and require a significant amount of energy. The study states that data centers typically consume 15 times more energy per square foot than a typical office building and, in some cases, may be 100 times more energy intensive. Data centers in just the United States now consume an estimated 20-30 billion kWh of electricity annually, which is roughly the electricity consumption of Utah or the equivalent of 30 power plants. Nationwide, it is estimated that data centers pay roughly $2-3 billion every year in electricity.
According to the ASE study, the number of installed servers is expected to increase by 40-50% nationally over the next four years, or by roughly seven million servers per year. ASE estimates that if efficiencies and energy rates remain where they are today, energy bills attributable to servers will double in less than 10 years, leading to an additional $200-300 million each year. Major computational powerhouses have taken note, with companies such as IBM, HP, Google, Intel and AMD all commissioning studies and instituting savings plans. In November 2007, Google instituted a new strategic initiative named RE<C, which seeks to develop renewable energy sources and reduce power consumption. Thomas Weisel Partner’s Google analyst estimates that 20-30% of COGS (excluding depreciation) is attributable to energy, and that Google could potentially spend $500-700 million on power alone in 2008. Also in November, IBM announced that it had partnered with Neuwing Energy, a verifier of energy efficiency, to issue energy efficiency certificates for the energy saved when companies undergo IBM’s energy savings projects.

A PRIMER ON ENERGY EFFICIENCY
January 31, 2008 Thomas Weisel Partners LLCPage 55 of 71 Jeff Osborne 212.271.3577
Typical Data Center Energy Use Typical Data Center Energy Use
Data Center Server Load
51%
Data Center CRAC25%
Cooling Tow er Plant4%
Office Space Conditioning
1%
Lighting2%
Other13%
Electrical Room Cooling
4%
Source: Energy Efficiency in Data Centers: A New Policy Frontier; a study conducted by Alliance to Save Energy (ASE) with support from Advanced Micro Devices
Software producers have not typically focused on the cost of processing power or the amount of energy used in a server when writing code. As energy becomes a more prominent part of IT companies’ COGS, software producers may be able to differentiate themselves with products that minimize processing requirements by producing more stable code. Another method is related to direct server use. Data centers are typically oversized based on the idea that additional capacity will either be needed in the future or used to compensate for other centers. A study of six corporate data centers conducted by Hewlett Packard Lab found that most of the 1,000 servers were using only 10-25% of their capacity. “Right sizing” along with “virtualization” and software systems could substantially reduce power consumption. Recently, HP and Citrix, a software application company, announced HP will use the latter’s PowerSmart software in conjunction with power management tools in its HP ProLiant portfolio of servers. The software uses virtualization technology to organize servers in a data center, consolidate applications workloads more efficiently and optimize traffic. The software automatically dials back server usage levels based on traffic and application levels, effectively managing power during non-peak hours.
Computer Room Air-Conditioning (CRAC) also represents a large and growing portion of data center energy consumption. The ASE study highlighted two major tendencies of data centers. The first is they are overcooled at 68 degrees Fahrenheit to prevent damage to the equipment. According to a study done by Lawrence Berkeley National Lab, the temperatures are too conservative and the maintenance of constant levels is more important than absolute. The second tendency is to oversize HVAC systems, leading to inefficient operation. Because HVAC systems have a relatively long life in comparison to IT equipment, managers tend to buy more equipment than they need, just to be conservative. Right sizing of HVAC equipment to match heating loads could dramatically improve energy use.
The barriers to data center efficiency still remain. The average data center manager will never see an energy bill. A data center manager’s performance is typically rated by reliability and performance, so any disruption caused by instituting new technologies to save energy could jeopardize this goal, leading many toward being risk adverse when attempting anything new.

A PRIMER ON ENERGY EFFICIENCY
January 31, 2008 Thomas Weisel Partners LLCPage 56 of 71 Jeff Osborne 212.271.3577
Also, IT is increasingly being outsourced and data centers are operating much more like utilities. A problem is that many companies are billed on the number of servers that are utilized, giving the data center operator little incentive for improvements.
WATER USE
Two-thirds of the Earth’s surface is covered by water, but only roughly 1% of it is suitable for human consumption. The increasing demand for water is putting strain on our water infrastructure and increasing rates, causing companies and individuals to reexamine water use. From 1986 to 1996, water rates rose between 100% and 400% in some areas of the United States. The DOE estimates future increases in water rates will be about 10% per year nationwide. These rate increases are not just due to scarce supplies. In many regions, especially the East, waste treatment plant capacity is driving the higher rates.
Combined Water and Sewer Rates for the United States
Source: Energy Information Administration
New technologies could provide some relief. Companies such as Kohler are working on toilets, faucets, bathtubs and just about everything you can think of that use water to reduce consumption. The company’s new sterling toilet line, for example, has a duel flush feature, so one can use less water depending on flushing needs. Also, new technologies have made waterless urinals that are much more appealing to users.
Tankless water heaters are also rapidly growing in popularity. Traditional water heaters work by heating water with a boiler or electric element and then maintaining that temperature until the water is needed. New on-demand units work by producing hot water at the time it is needed, thus eliminating the costly maintenance of water temperature. Takagi, a Japanese maker of tankless water heaters, estimates that 30-50% can be saved by using a tankless water heater. Tankless systems also take up less space, last longer, are up to 94% efficient and do not run out of hot water.

A PRIMER ON ENERGY EFFICIENCY
January 31, 2008 Thomas Weisel Partners LLCPage 57 of 71 Jeff Osborne 212.271.3577
THE BUILDING ENVELOPE
The building envelope is the basic shell of any building. The main components of a complete building envelope are the windows and doors, insulation, foundation, wall systems and roofing. Each section has an important role in a whole building designed to be energy efficient. A discussion of the elements of the building envelope follows.
Makeup of the Building Envelope
Source: Department of Energy
WINDOWS
An old adage in building construction was that windows were the weakest point in the structure with regard to heating and cooling losses, so the conventional reasoning was to minimize window area. Window performance gains, however, have been rather dramatic. In 1970, window thermal resistance was 1-2 F ft^2/Btu, but now new windows have thermal resistance of up to 6 F ft^2/Btu. Windows can also be outfitted with special coatings to minimize solar gain and UV light. The following two charts illustrate the acceptance of insulated glass usage as efficiencies have increased.
Residential Prime Window Sales Residential Prime Window Sales, by Type (mn Units)Type 1990 1999 2005Single Lite 4.90 4.80 4.20Two Lite, Sealed, (Insulated Glazing) 12.00 55.20 63.80Other 18.70 2.00 2.50
Source: 2007 Buildings Energy Data Book

A PRIMER ON ENERGY EFFICIENCY
January 31, 2008 Thomas Weisel Partners LLCPage 58 of 71 Jeff Osborne 212.271.3577
Insulated Glass Window Historical Penetration Insulating Glass Historical Penetration, by Sector (% Total US Usage)Sector 1985 1990 1995 2000 2005Residential 73% 86% 89% 92% 94%Nonresidential 63% 80% 84% 86% 88% Source: 2007 Buildings Energy Data Book
Andersen’s new E4 windows are an example of the new technology available in the residential window arena. The E4 windows are a dual pane with argon filling in between the panes to minimize thermal transfer. The E4 window is 35% more energy efficient in the winter and 41% more efficient in the summer than a traditional double pane window.
Solar Gain by Window Technology
Source: Department of Energy
Typical Thermal Performance of Residential Windows Typical Thermal Performance of Residential Windows, by Type
Type Low High Low HighSingle-Pane 0.93 1.23 0.69 0.84Single-Pane, Tinted 0.90 1.21 0.50 0.61Double-Pane 0.49 0.73 0.62 0.76Double-Pane, Tinted 0.48 0.73 0.40 0.54Double-Pane, Low-e, Gas-fill 0.34 0.42 0.48 0.58Double-Pane, Spectrally Selective Low 0.32 0.32 0.35 0.35Triple Pane 0.38 0.60 0.54 0.68Triple-Pane, 2 Low-e, Gas-fill 0.24 0.24 0.40 0.40
U-Factor Solar Heat Gain
Note: Ranges reflect difference in frame material and design. Aluminum frame windows are at the higher end of the ranges, while wood and vinyl framed windows have the lowest values. Source: 2007 Buildings Energy Data Book
The increased performance of windows has lead to their increased use in many applications where previously they were not suitable. In the Northeast, thermal gain in the winter and natural light, which makes it possible to turn off electric lights, offset thermal heat losses from the windows. Solar coatings prevent the opposite in the South, keeping solar heat out, while letting light in. Simple and low cost skylights are being developed for industrial applications to maximize light capture during daylight hours and minimize the need to use electrical lighting.

A PRIMER ON ENERGY EFFICIENCY
January 31, 2008 Thomas Weisel Partners LLCPage 59 of 71 Jeff Osborne 212.271.3577
The U-factor measures the rate of heat loss, or how well a product prevents heat from escaping. The lower the U-factor, the better the insulating value. To improve U-factor, manufacturers may apply low-E (low-emittance) coatings to window surfaces. R-factor, the inverse of U-factor, measures the insulating value of the product. Windows may also have several panes, gases between those panes to maximize efficiency, low thermal conductive (non-metallic) frames and spacers.
The Solar Heat Gain Coefficient (SHGC) measures how well a products blocks against incoming sunlight. The lower the SHGC, the less solar heat it transmits. Low E-coatings can be applied by the manufacturer to minimize heat loss in the winter and reduce solar gain in the summer. Building design based on environment becomes of large importance in this case. In colder climates, solar gain may be required in the winter. A window with a high R-factor can be used to maximize winter solar gain and larger roof overhangs can be incorporated to block sun during the summer months.
Residential Prime Window Stocks 2005 Residential Prime Window Stock, by TypeType % of Existing Stocks ResidentialSingle Lite 49%Two Light, Non-Sealed 15%Two Lite, Sealed, (Insulated Glazing) 35%Other 1% Source: 2007 Buildings Energy Data Book
Nonresidential Window Stocks Nonresidential Window Stock and usage, by Type
Glass Area Usage (mn sq ft)Single Pane 56Insulated Glass 407
Clear 44%Tinted 15%Reflective 4%Low-e 37% Source: 2007 Buildings Energy Data Book
According to the U.S. Department of Energy and Energy Star, installing Energy Star saves an average of $125-450 per year when replacing single-pane windows and $25-110 per year over double-paned, clear glass replacement windows.

A PRIMER ON ENERGY EFFICIENCY
January 31, 2008 Thomas Weisel Partners LLCPage 60 of 71 Jeff Osborne 212.271.3577
Cost Savings from Using Energy Star Rated Windows
Source: Energy Star website, savings calculated by Lawrence Berkeley National Lab
CURRENT DEPARTMENT OF ENERGY R&D
Heat Loss Control (Source: DOE)
“Heat loss through windows is the largest single energy-related aspect of window performance. Although development of low-e coatings and gas fills has been a key DOE program success, there are still significant opportunities to reduce energy associated with winter heat loss by addressing glazing properties as well as the sash/frame combination.
“Gas-filled, low-e glazings have substantially reduced the energy impacts of windows over standard double glazing. Further improvements in the insulating value of window systems for new and retrofit applications are possible and beneficial up to values of R10. An R10 window will have less annual heat loss than a highly insulated wall, even in northern U.S. climates.
“Research efforts are being pursued in two areas. The first is novel transparent insulating materials (e.g., aerogels, vacuum windows and honeycombs), which have the potential to create very low heat-loss glazings. Efforts will focus on improving costs, durability and optical characteristics, as well as incorporating these materials into suitable low heat-loss sash and framing systems. The second area is multilayer low-conductance window systems, which incorporate existing insulating glazings (e.g., low-e, gas fills, additional layers, integral shading, etc.) in designs that achieve insulating values in the R10 range. The focus is on improving durability, cost and other market requirements.”

A PRIMER ON ENERGY EFFICIENCY
January 31, 2008 Thomas Weisel Partners LLCPage 61 of 71 Jeff Osborne 212.271.3577
Solar Gain Control (Source: DOE)
“Control of solar gain is critical for reducing cooling loads and, in turn, peak electric use in new and existing buildings. Strategies include “passive” or static control of solar gain as well as dynamic modulation via “smart” (chromogenic) windows.
“High-performance coatings: The use of high-performance static coatings, such as spectrally selective low-e coatings with high-daylight transmittance, is becoming widespread in new construction and replacement window markets in both residential and commercial sectors. Greater performance and market penetration can still be achieved. Glue-on retrofit solar control films lag behind glass coatings in performance and durability. Even glass coatings, particularly those that are silver-based, need improved durability for handling, shipping, storage and cutting. Several promising technical approaches are being explored. These include: (1) creating a more durable silver layer through treatment with plasma during growth, modification of the surrounding oxide layers and variation in silver alloy composition; (2) using metallic oxides and nitrides with moderately good performance and greater durability than silver, together with associated deposition techniques; and (3) using non-metallic, all-dielectric alternatives with internal optical structures that produce very sharp filters (e.g., extruded polymer multilayers, liquid crystals and holograms). R&D is guided by industry needs in terms of overall performance, cost, durability and other market factors.
“Chromogenic or dynamic windows: Because solar gain and occupant needs vary widely throughout the day, a window system that can dynamically change its properties is one of the highest priorities expressed in the Window Industry Technology Roadmap. Electrochromic windows, which use a coating with controllable properties, are reaching an advanced stage of materials development with direct support from DOE and assistance from the national laboratories. The DOE program assists the industry in developing current electrochromic technologies through materials research and analysis, performance modeling, research on building systems integration as well as extensive field testing and demonstrations. In addition, DOE is in the early stages of research on next-generation electrochromic coatings. Conventional electrochromic coatings are composed of thick layers, making them costly to manufacture. They are also absorptive, which increases thermal stress. Next-generation research will investigate the use of a newly discovered material, reflective transition metal hydrides, to create simple gasochromic windows that might overcome these limitations, enabling higher performance and lower cost. Other chromogenic technologies, such as suspended particle devices, also will be monitored as potentially promising alternatives to electrochromics.
“Daylight Enhancement Technologies: Lighting is one of the largest energy users in commercial buildings. Daylight from windows and skylights could displace over 25% of electric lighting needs. While a skilled architect can design an effectively daylighted building using conventional glass and shading systems, these systems are severely limited in their ability to control glare and cooling loads. A new generation of light-redirecting optical technologies would help resolve the most complex design tradeoffs, enabling more widespread applications of daylighting.
“Several types of microstructured glazing materials under development, including holograms, microlouvers and liquid, can be directly integrated into a standard window, or even retrofitted into an existing window. Certain physical limitations may apply to such two-dimensional microsystems. Other alternatives are three-dimensional light redirecting systems, using such

A PRIMER ON ENERGY EFFICIENCY
January 31, 2008 Thomas Weisel Partners LLCPage 62 of 71 Jeff Osborne 212.271.3577
components as mirrors, light shelves and pipes. While these systems may not have physical limitations, they could entail higher cost and complexity. Therefore, they need to be more carefully integrated into the building design. The most promising light-redirecting systems will be identified for further research, performance analysis and testing.
“Advanced Facade Systems: An architectural trend in commercial buildings is the “all-glass” facade, which feature curtainwall systems with large glazed areas and operable shadings. Managing air flow, solar gain and daylight with all-glass facades is challenging. Either Airflow windows or more complex envelope systems with external or internal shading may be used. One option, the double envelope, flows air through a cavity between inner and outer glazings (20cm to 100cm) for comfort control, and may be an effective part of a natural ventilation system. Research will focus on creating a taxonomy of advanced facade systems for new and retrofit applications, identifying the technologies and systems integration needed to make them work as well as the obstacles to wider use, along with gathering performance data on various approaches.”
INSULATION
Heating and cooling (“space conditioning”) account for 50-70% of the energy used in the average American home, of which about 20% goes for heating water. On the other hand, lighting, appliances and everything else account for only 10-30% of the energy used in most residences. Much of the existing housing stocks in the United States are not insulated to the best level, with older homes being more likely to use more energy than newer homes. Inadequate insulation and air leakage are leading causes of energy waste in most homes.
Insulation has several important characteristics:
• Insulating capacity
• Fire resistance
• Moisture control
• Weight
• Convective heat loss
• Settling and loss of insulating capacity

A PRIMER ON ENERGY EFFICIENCY
January 31, 2008 Thomas Weisel Partners LLCPage 63 of 71 Jeff Osborne 212.271.3577
Examples of Where to Insulate
In unfinished attic spaces, insulate between and over the floor joists to seal off living spaces below.* 1A: attic access door. 2A: between the studs of "knee" walls. 2B: between the studs and rafters of exterior walls and roof. 2C: ceilings with cold spaces above. 2D: extend insulation into joist space to reduce air flows. All exterior walls, including: 3A: walls between living spaces and unheated garages, shed roofs, or storage areas. 3B: foundation walls above ground level. 3C: foundation walls in heated basements: full wall either interior or exterior. Floors above cold spaces, such as vented craw spaces and unheated garages. Also insulate: 4A: any portion of the floor in a room that is cantilevered beyond the exterior wall below. 4B: slab floors built directly on the ground**. 4C: as an alternative to floor insulation, foundation walls of un-vented crawl spaces. 4D: extend insulation into joist space to reduce air flows. Band joists. Replacement or storm windows and caulk and seal around all windows and doors. *Well-insulated attics, crawl spaces, storage areas and other enclosed cavities should be ventilated to prevent excess moisture build-up. **For new construction, slab on grade insulation should be installed to the extent required by building codes, or greater. Source: Department of Energy

A PRIMER ON ENERGY EFFICIENCY
January 31, 2008 Thomas Weisel Partners LLCPage 64 of 71 Jeff Osborne 212.271.3577
Types of Insulation Form Method of Installation Where Applicable AdvantagesBlankets: Batts or Rolls Do-it-yourself
Fiber glass Suited for standard stud and joist spacing, which is relatively free from obstructions
Rock wool
Loose-Fill (blown-in) or Spray-applied
Enclosed existing wall cavities or open new wall cavities
Commonly used insulation for retrofits (adding insulation to existing finished areas)
Rock wool Unfinished attic floors and hard to reach places
Good for irregularly shaped areas and around obstructions
Fiber glassCellulosePolyurethane foam
Rigid Insulation Interior applications: Must be covered with 1/2-inch gypsum board or other building-code approved material for fire safety
Basement walls High insulating value for relatively little thickness
Extruded polystyrene foam (XPS)
Exterior applications: Must be covered with weather-proof facing
Exterior walls under finishing (Some foam boards include a foil facing which will act as a vapor retarder. Please read the discussion about where to place, or not to place, a vapor retarder)
Can block thermal short circuits when installed continuously over frames or joists.
Expanded polystyrene foam (EPS or beadboard)
Polyurethane foam Unvented low slope roofs
Polyisocyanurate foam
Reflective Systems Do-it-yourself
Foil-faced paper All suitable for framing at standard spacing. Bubble-form suitable if framing is irregular or if obstructions are present
Foil-faced polyethylene bubblesFoil-faced plastic film Effectiveness depends on
spacing and heat flow direction
Foil-faced cardboard
Loose-Fill (poured in)Vermiculite or Perlite
not currently used for home insulation, but may be found in older homes
Types of Insulation--Basic Forms
Fitted between studs, joists and beams All unfinished walls, floors and ceilings
Blown into place or spray applied by special equipment
Foils, films, or papers: Fitted between wood-frame studs joists, and beams
Unfinished ceilings, walls, and floors
Source: Department of Energy
R-Value
R-value is the measurement of how effectively a material resists the transfer of heat via conduction. The higher the R-value, the less heat transfer can take place.
Some materials are more resistant to heat transfer than others, giving them higher R-values. One of the best ways to enhance R-value is to increase the amount of gas inside or immediately surrounding the material. Double pane glass with air sealed in the space between the panes will increase the thickness of one of the insulating gas layers (air layers), more than doubling the window’s R-value as a result. Hard woods typically have an insulating value of R-1 per inch of thickness. Softer woods, however, have R-values twice as high due to their greater number of air-filled pores.

A PRIMER ON ENERGY EFFICIENCY
January 31, 2008 Thomas Weisel Partners LLCPage 65 of 71 Jeff Osborne 212.271.3577
The actual R-value of insulation products can vary greatly. The products with the lowest R-values are perlite and vermiculite loose-fills (R-2.2 to R-2.7 per inch). The most resistant are polyisocyanurate rigid boards (R-7 per inch). Fiberglass blankets and cellulose loose-fills are two of the most common residential insulations (R-3.1 to R-3.7 per inch).
New Technologies
Super Insulation: Reinforced vacuum powder-filled, gas filled and vacuum fiber-filled panels could soon be available in niche applications offering four times better insulating values than current best options, according to the DOE. High thermal resistance foam could also see increased use as the building envelope gains more attention.
FOUNDATIONS
For each foundation type, there are several construction systems and products from which to choose. Foundations can be designed to meet necessary structural, thermal, radon and moisture control requirements, depending on location and application. Below are the typical foundation types.
Foundation Types Foundation Types Cast-in-Place Concrete Cast-in-place concrete construction involves setting up removable forms for the pouring of concrete foundation walls. It's a common method for all three types of foundations—basement, slab-on-grade, and crawlspace. Rigid foam board insulation is usually placed between the removable forms and held in place with a system of non-conductive ties. Then concrete is poured on either side of the foam. Steel rebar is also generally used to add strength to the wall. Once the concrete has cured, the forms can be removed and reused as many as 3,000 times with minimum maintenance.
Concrete or Masonry Blocks Another common foundation system is the use of concrete or masonry blocks. When using blocks for a foundation wall, the block cores should be filled with insulation. Filling the block cores with high-pressure foam works better than most other block-filling methods, such as poured-in insulations like polystyrene beads and vermiculite. Foam inserts for the block cores are also available. These are installed as the blocks are mortared into place. Some concrete block manufacturers attempt to increase the thermal resistance of their product by adding materials such as polystyrene or wood chips to the concrete mix. Even though the block cavities and special block designs can improve a block wall's thermal characteristics, it doesn't reduce heat movement very much when compared to insulation installed over the surface of the blocks, either on the exterior or interior of the foundation walls.
Insulating Concrete Forms Insulating Concrete Forms (ICFs) serve as both foundation structure and insulation. They are basically forms for poured concrete walls that stay in place as a permanent part of the wall assembly. The forms, made of rigid foam insulation, are either pre-formed interlocking blocks or separate panels connected with plastic ties. The left-in-place forms not only provide continuous insulation but also a backing for drywall on the inside. Although all ICFs are identical in principle, the various brands differ widely in the details of their shapes, cavities, and component parts. Currently, about one-third of all ICFs sold are used in residential basements.
Precast Concrete Manufacturers construct precast concrete foundation walls or panels off-site. Most of them are preinsulated as well with rigid foam board. But additional insulation of your choice usually can be added inside the wall cavity to achieve a high R-value. The panels typically come in lengths of up to 16 feet and in standard heights of 4, 8, and 10 feet. Once constructed, they're transported to the building site. A crane is needed to lift them in to place. Precast concrete panels not only can provide for high R-values, but also structural integrity and termite protection. They minimize air infiltration, as well.
Permanent Wood Foundation Permanent wood foundation (PWF) construction is similar to wood-framed exterior wall construction, with some exceptions. Because PWF walls are used in below-grade applications, all lumber and plywood is pressure-preservative treated for decay and termite resistance. Any type of insulation product can be used with a PWF, but there is some indoor air quality issues in regards to the preservatives used to treat the wood. Wood foundations also don't have the same structural integrity as concrete foundations.
Source: Department of Energy

A PRIMER ON ENERGY EFFICIENCY
January 31, 2008 Thomas Weisel Partners LLCPage 66 of 71 Jeff Osborne 212.271.3577
ROOFS
Roofing is often looked at for its longevity in resisting climate relative to its cost, but it also has a huge role to play in energy efficiency. In regions that require more cooling, high reflectivity material or solar shading designs/devices that minimize solar gain are preferable. Reflective materials keep the roof, which exposed to the sun all day, from absorbing the heat. Energy Star reflective roof products will have an initial reflectivity of at least 65%. Wall shading designs/devices (e.g., roof overhangs, window shades, awnings and landscaping) can also significantly reduce solar gain within a building. Shading on the east and west sides of structures will provide the greatest benefit, but in hotter climates southern shading is also advised.
Building Integrated Photovoltaics
Building Integrated Photovoltaics (BIPV) are integrated building materials that incorporate PV technology and have the promise of providing distributed generation of electricity. The products are typically replacements for existing building materials (see following illustration for an example). BIPV can utilize traditional polysilicon production methods, such as SunPower’s roof tiles, or use a thin film approach as represented in the example below. BIPV can also be incorporated in windows, shades and other places that receive significant sunlight.
BIPV Applications
Left: These roof shingles are coated with PV cells made of amorphous silicon. When installation is complete, the PV shingles look much like ordinary roofing shingles, but they generate electricity. Right: The outside surfaces of the North Exelon Pavilion buildings in Chicago are covered in 460 BIPV modules that generate up to 16,000 kWh of electricity annually. Source: Department of Energy and National Renewable Energy Lab
Although costs need to come down and the technologies are still relatively new, these approaches are likely to replace the mounted panels currently used in residential roof mounted applications. Also, with further improvements, these technologies could be as reliable as traditional roofing materials, while producing electricity for the owner.

A PRIMER ON ENERGY EFFICIENCY
January 31, 2008 Thomas Weisel Partners LLCPage 67 of 71 Jeff Osborne 212.271.3577
WALLS
There are four major types of walls that are utilized: wood, steel, concrete, and thermal mass.
1. Wood walls are the most prevalent among residential buildings as they are easy to construct, the materials are readily available and they have high R-values because wood is not a good conductor of heat. Manufactured wood products have gained popularity recently as their cost has decreased and their quality has increased. Manufactured wood products often perform as well or better than lumber. Another structure that is gaining popularity is something called structural insulated panels, which typically consist of polystyrene foam board in-between wood (usually plywood or oriented strand board). These products provide high structural stability, a high R-value and can be used in place of traditional stud-frame construction.
2. Steel construction of walls is most common in commercial applications, and it is gaining popularity in the residential space. Steel framing is more durable that wood as it has a greater resistance to weather, insects and fire. Construction costs run about the same as wood. Steel can span longer distances and comes in many shapes (manufactured wood does also), giving much flexibility over traditional framing methods. Steel is, however, an excellent conductor of heat. In fact, it conducts heat 300 times faster than wood. If not insulated correctly, steel frames can cause significant leaks in the building envelope.
3. Concrete construction has been popular in commercial construction for some time because of its high thermal efficiencies (it efficiently blocks air while absorbing heat), flexibility in sourcing and construction methods as well as it structural integrity. There are five major types of concrete walls: masonry, autoclaved aerated concrete, insulating concrete forms, cast-in-place and precast.
a. Masonry methods have not changed much in many years: block-on-block with mortar in-between. The construction method still works, however, especially when the wall is coated to maximize the amount of heat gain during daylight hours.
b. Autoclaved aerated concrete is similar to a traditional concrete block, but lighter as an expanding agent creates larger air bubbles in the material without harming the integrity. This increases the material’s R-value.
c. Insulating concrete forms are rigid plastic foam forms that hold concrete in place during curing and remain in place afterward to serve as insulation for concrete walls. The lightweight foam increases the R-value of the wall, while providing increased stability for the concrete.
d. Cast-in-place concrete methods are how most construction is done; the process is very similar to the methods used in foundation construction. This involves setting up temporary, removable forms into which the concrete is placed. Once the concrete has hardened, the forms are then removed. Steel rebar is often placed in the concrete to provide structural stability.
e. Precast concrete is pretty much self explanatory; it is precast prior to placement in a building or structure. Precast concrete is popular for structurally significant points because it can be engineered to higher quality than typical concrete construction. Precast concrete is typically made at or near a building site, which is more ideal than

A PRIMER ON ENERGY EFFICIENCY
January 31, 2008 Thomas Weisel Partners LLCPage 68 of 71 Jeff Osborne 212.271.3577
shipping steel long distances. It is also more resistant to weather and insects, among other things. As its design capabilities have become more refined, precast has more recently started to gain some traction in replacing stone in architectural finishes. Also, precast contributes to LEED points.
4. Thermal Mass is a type of construction that was very typical hundreds of years ago. Log construction might be the most recognizable, but a new construction method has become increasing popular in the southwest: straw construction. The method is relatively simple and cheap. A basic 2,000 square foot house requires about 200 standard three-ire bales of straw. This is placed on a foundation, the bales are fastened together with rebar and, after wiring and plumbing, the walls are sealed and finished. The walls provide an R-value of about 50. Other similar straw construction methods are straw-clay buildings, mortar bale and pressed straw.
EXAMPLES OF “GREEN BUILDINGS”
Visionaire, Battery Park City, New York City
The Starwood Capital Group and the Albanese Organization created this 35 story, 235 unit condominium tower in Battery Park City, which is located in New York City. Called The Visionaire and designed by Rafael Pelli of Pelli Clarke Pelli, the building will be Albanese’s third green building at Battery Park City. The Visionaire is expected to receive LEED Platinum status when completed.
Green features include: a design to reduce energy consumption by 35% over code; building-integrated solar panels, which will yield 5% of the tower’s electricity needs; the building will purchase 35% of its electricity from renewable energy sources; individual residences will be equipped with digital, programmable thermostats; and water conservation measures will include a graywater system and a 10,000 gallon recycled water storage tank, which will serve, in part, to irrigate a green roof.
Source: Thomas Weisel Partners LLC

A PRIMER ON ENERGY EFFICIENCY
January 31, 2008 Thomas Weisel Partners LLCPage 69 of 71 Jeff Osborne 212.271.3577
7 World Trade Center, New York City
Finished in 2006, the new 7 World Trade Center was completed after the original structure was destroyed on September 11, 2001. The building is 49 floors; a power substation, which provides power for the Financial District, occupies the first 11 floors. With the structure receiving LEED gold certification, 7 World Trade Center became New York City’s first “green” office tower. Green features include: nearly 30% of structural steel used in the building consists of recycled steel; rainwater is collected and used for irrigation of the park and to cool the building; the building is designed to allow in plenty of natural light; power is metered to tenants to encourage them to conserve energy; the heating steam is reused to generate some power for the building; and recycled materials are used for insulation and interior materials.
Pictures of 7 World Trade Center
Source: Thomas Weisel Partners LLC and Wikipedia

A PRIMER ON ENERGY EFFICIENCY
January 31, 2008 Thomas Weisel Partners LLCPage 70 of 71 Jeff Osborne 212.271.3577
ADDITIONAL INFORMATION IS AVAILABLE UPON REQUEST.
ANALYST CERTIFICATION AND IMPORTANT DISCLOSURES:
The Research Analyst(s) principally responsible for the analysis of any security or issuer included in this report certifies that the views expressed accurately reflect the personal views of the Research Analyst(s) about the subject securities or issuers and certifies that no part of his or her compensation was or is or will be, directly or indirectly, related to the specific recommendations or views expressed by the Research Analyst(s) in this report.
This report contains statements of fact relating to economic conditions generally and to parties other than Thomas Weisel Partners. Although these statements of fact have been obtained from and are based on sources that Thomas Weisel Partners believes to be reliable, we do not guarantee their accuracy and any such information might be incomplete or condensed. All opinions and estimates included in this report constitute Thomas Weisel Partners LLC’s judgment as of the date of this report and are subject to change without notice. This report is for information purposes only. It is not intended as an offer or a solicitation with respect to the purchase or sale of a security, and it should not be interpreted as such. This report does not take into account the investment objective, financial situation or particular needs of any particular investor. Investors should obtain individual financial advice based on their own particular circumstances before making an investment decision based on the recommendations in this report. In the United Kingdom, this document is intended only to be directed at market counterparties and intermediate customers. It is not intended to be directed at private customers, and it may not and is not intended to be distributed to or passed on, directly or indirectly, to private customers. The investments and/or services detailed in this document are available only to market counterparties and intermediate customers. Only market counterparties and intermediate customers may rely on this document. Private customers should not rely on the contents of this document. Thomas Weisel Partners International Limited, authorized by the FSA, has approved this document for the sole purpose of the financial promotion regime under Section 21 of the Financial Services and Markets Act of 2000. © Thomas Weisel Partners LLC, 2008. All rights reserved. Any unauthorized use, duplication or disclosure is prohibited by law and will result in prosecution.

Thomas Weisel Partners LLC • One Montgomery Street • San Francisco CA 94104 • tel 415.364.2500 • fax 415.364.2695 • www.tweisel.com
E Q U I T Y R E S E A R C H D I R E C T O R Y
Stephen J. Buell • Director of Research • [email protected] • 212.271.3750 R. Keith Gay • Associate Director of Research • [email protected] • 415.364.2582
Cons umer
Gaming & Lodging and Interactive Market Services Jake Fuller [email protected] 212.271.3821
Timothy Forrester 212.271.3843
Lifestyles/Sports Retailers Jim Duffy [email protected] 415.364.5974
Christian Buss 415.364.2519
Restaurants Matthew J. DiFrisco [email protected] 212.271.3673
Jake Bartlett, CFA 212.271.3802
Retailing: Hardlines Matt Nemer [email protected] 415.364.5901
Trisha Dill, CFA 415.364.2619
Retailing: Softlines Liz Dunn [email protected] 212.271.3806
Bill Strauss 212.271.3425 Christina Colone 212.271.3582
Hea l thca re
Biotechnology Ian Somaiya [email protected] 212.271.3761
Michael Ulz 212.271.3423 Stephen Willey 212.271.3620
Healthcare Information Technology and Pharmaceutical Services Steven P. Halper [email protected] 212.271.3807
Alan Fishman 212.271.3679 Topher Orr 212.271.3659
Life Science and Diagnostics Peter Lawson, PhD [email protected] 212.271.3859
Jonathan Palmer 212.271.3834 Eric Criscuolo 212.271.3592
Medical Devices Robert C. Faulkner [email protected] 212.271.3760
Philip E. Legendy 212.271.3762
Hea l thca re (Cont inue d)
Pharmaceuticals: Specialty Donald B. Ellis, PharmD [email protected] 415.364.7038
Aaron Mishel 415.364.2622 Yumi Odama 415.364.5965
Indust r ia l Grow th
Alternative Energy Jeff Osborne [email protected] 212.271.3577
Dilip Warrier 415.364.2983 Scott Reynolds 212.271.3429
Applied Technologies Ajit Pai [email protected] 212.271.3695
Sven Eenmaa 212.271.3838 Andy Yeung, CFA 415.364.2589
Defense & Security David Gremmels, CFA [email protected] 212.271.3787
Alex Motamed 212.271.3803 Akil Marsh 212.271.3742
Me dia a nd Te lec om
Internet Services Christa Quarles, CFA [email protected] 415.364.7154
Cyrus Modanlou 415.364.2976 Jennifer Wang, CFA 415.364.2590
Media & Entertainment Lloyd Walmsley [email protected] 415.364.2584
Telecom Services James D. Breen, Jr., CFA [email protected] 617.488.4107
Louie DiPalma 617.488.4167 Shane J. Larkin 617.488.4108
Te c hno log y
Communications Equipment: Core & Wireless Hasan Imam, PhD [email protected] 212.271.3698
Te c hno log y ( Cont inue d)
Communications Equipment: IP Networking Jason Ader, CFA [email protected] 617.488.4621
Jason Kim 617.488.4192
Computer Systems and Storage Doug Reid, CFA [email protected] 212.271.3841
Nehal Chokshi 212.271.3653
Electronic Supply Chain Matt Sheerin [email protected] 212.271.3753
Alberto Mann 212.271.3635 Aaron Berman 212.271.3427
Information & Financial Technology Services David Grossman [email protected] 415.364.2541
Nicole Conway 415.364.5934 Melissa Moran, CFA 415.364.2586
Semiconductors: Analog & Mixed Signal Tore Svanberg [email protected] 650.688.5261
Evan Wang 650.688.5263
Semiconductors: Multimedia & Specialty Heidi T. Poon, CFA [email protected] 415.364.2505
Semiconductors: Processors & Components Kevin Cassidy [email protected] 650.688.5264
Software: Applications & Communications Tom Roderick [email protected] 415.364.5952
Gur Talpaz 415.364.2608 Chris Koh 415.364.2655
Software: Infrastructure Tim Klasell [email protected] 415.364.2949
Dormain Geyer 415.364.2807 Marc Griffin 415.364.6951