Embed Size (px)
Citation preview

ENERGY EFFICIENCY AND CONSERVATION MEASURE RESOURCE ASSESSMENT
FOR THE RESIDENTIAL, COMMERCIAL, INDUSTRIAL AND AGRICULTURAL SECTORS
Prepared for the
Energy Trust of Oregon, Inc.
By
Ecotope, Inc.
The American Council for an Energy Efficient Economy (ACEEE) Tellus Institute, Inc.
January, 2003

ENERGY EFFICIENCY AND CONSERVATION MEASURE RESOURCE ASSESSMENT FOR THE RESIDENTIAL, COMMERCIAL, INDUSTRIAL AND AGRICULTURAL SECTORS Final Report, January, 2003 Prepared by: Shelly Borrelli Ecotope, Inc. 4056 Ninth Avenue NE Seattle, WA 98105 (206) 322-3753 Principal Analysts: Ecotope, Inc.: David Baylon Shelly Borrelli American Council for an Energy Efficient Economy: Neal Elliott Anna Shipley Steve Nadel Harvey Sachs Elizabeth Brown Tellus Institute: David von Hippel Alison Bailie Michael Lazarus
i
Table of Contents
1. Project Overview.....................................................................................................................1 2. Summary of Results ................................................................................................................2 3. Methodology...........................................................................................................................3
3.1. Initial List of Measures .....................................................................................................3 3.2. Resource Assessment .......................................................................................................5 3.3. Prioritized List of Conservation Measures ........................................................................7
4. Industrial Sector Resource Assessment Results .......................................................................8 4.1. Industrial Sector Characterization .....................................................................................9 4.2. Cross Cutting Measures ..................................................................................................10 4.3. Hi-Tech Subsector..........................................................................................................20 4.4. Agriculture and Food Products Subsector .......................................................................23 4.5. Wood Products and Paper...............................................................................................27 4.6. Industrial Sector Conclusions and Recommendations .....................................................29
5. Commercial Sector Resource Assessment Results .................................................................29 5.1. Commercial Sector Characterization...............................................................................33 5.2. Existing Commercial Buildings ......................................................................................35 5.3. New Commercial Construction.......................................................................................61 5.4. Commercial Process Loads.............................................................................................69 5.5. Schools...........................................................................................................................70 5.6. Commercial Sector Conclusions and Recommendations .................................................72
6. Residential Sector Resource Assessment Results...................................................................73 6.1. Residential Sector Characterization ................................................................................76 6.2. Lighting Measures ..........................................................................................................77 6.3. Appliances......................................................................................................................79 6.4. HVAC Measures ............................................................................................................79 6.5. Energy Star Measures: ....................................................................................................81 6.6. Weatherization ...............................................................................................................82 6.7. Window Replacement.....................................................................................................83 6.8. Domestic Hot Water (DHW) ..........................................................................................84 6.9. Multi Family Sector........................................................................................................85 6.10. Emerging Technologies ................................................................................................86 6.11. Residential Sector Conclusions and Recommendations.................................................86
7. References.............................................................................................................................88 APPENDIX A Initial List of Measures for Consideration and Analysis ..................................A-1 APPENDIX B Commentary on Selected Measures ................................................................B-1

ii
Table of Tables Table 1.1 Measures Reviewed for Energy Trust Service Territory..............................................1 Table 2.1 Industrial Sector Savings (based on Technical Potential).............................................2 Table 2.2 Commercial Sector Savings (based on Technical Potential) ........................................3 Table 2.3 Residential Sector Savings (based on Technical Potential) ..........................................3 Table 4.1. Prioritized List of Measures for the Industrial Sector .................................................9 Table 4.2. Industrial Electricity End-Use in Energy Trust Service Territory..............................11 Table 4.3a. Industrial Electricity Supply System Efficiency Measures.......................................12 Table 4.3b. Industrial Electric Motor and Motor System Efficiency Measures...........................14 Table 4.3c: Industrial Lighting Efficiency Measure Savings ......................................................16 Table 4.3d: Other Cross Cutting Industrial Efficiency Measures................................................17 Table 4.4. Electricity End-Use in Computer and Electronics (NAICS 33)..................................20 Table 4.5. Hi-Tech Subsector-Specific Measures ......................................................................22 Table 4.6: Electricity End-Use in Agriculture and Food Product Manufacturing........................24 Table 4.7. Agricultural and Food Sector Specific Measures......................................................27 Table 4.8. Electricity End-Use in Wood Products and Paper Manufacturing.............................28 Table 5.1a. Prioritized List of Measures for New Commercial Construction.............................30 Table 5.1b. Prioritized List of Measures for Existing Commercial Construction .......................31 Table 5.2: Commercial Sector Characterization by End Use (2001 Data) .................................34 Table 5.3: Estimated Growth Rates in Commercial Sector Square Footage...............................35 Table 5.4 Commercial Lighting Retrofit Measures ...................................................................39 Table 5.5. Lighting Advanced Technologies Measures.............................................................41 Table 5.6 Commercial HVAC Retrofit Measures ......................................................................42 Table 5.7 HVAC Packaged AC Equipment Efficiency Table.....................................................43 Table 5.8 Savings from Tier 2 Equipment Over Tier 1 ..............................................................44 Table 5.9 Applicable Population by Equipment Size .................................................................44 Table 5.10 Equipment Efficiency Improvements, Indirect/Direct Evaporative Cooling Retrofit.46 Table 5.11 Chiller Efficiency Measures.....................................................................................46 Table 5.12 Small HVAC System Maintenance Measures ..........................................................49 Table 5.13 Applicability: Small HVAC System Maintenance...................................................50 Table 5.14 Commercial Small HVAC System Maintenance Measures .....................................51 Table 5.15 Duct sealing savings potential..................................................................................52 Table 5.16 Duct Sealing Energy Savings Potential ....................................................................53 Table 5.17 Commercial Appliance Energy Use .........................................................................54 Table 5.18 Commercial Appliance Technical Savings Potential ...............................................54 Table 5.19 Domestic Hot Water Measures (100 KBTU system) ................................................56 Table 5.20 DHW Measures - Technical Potential ......................................................................58 Table 5.21 Commercial New Construction Large HVAC Measures..........................................64 Table 5.22: Program Recommendations for Large Commercial HVAC Systems ......................64 Table 5.23: Commissioning Measures ......................................................................................67 Table 5.24. Costs and Savings for New Commercial Commissioning Measures ........................68 Table 5.25: Commercial Lighting.............................................................................................68 Table 5.26: Impact of Lighting Measures on New Construction ...............................................69 Table 5.27: Lighting Program Applicability .............................................................................69 Table 5.28. Commercial New Construction Process Load Measures.........................................70
iii
Table 5.29 Measure Savings in Schools - New Construction ....................................................70 Table 5.30 Measure Savings in Schools - Retrofit ....................................................................71 Table 6.1a: Residential Sector Summary: New Single Family Construction.............................73 Table 6.1b: Residential Sector Summary: New Manufactured Homes .....................................74 Table 6.1c: Residential Sector Summary: New Multi-Family Construction .............................74 Table 6.1d: Residential Sector Summary: Single Family Retrofit/Replace ...............................75 Table 6.1e: Residential Sector Summary: Manufactured Home Retrofit/Replace .....................76 Table 6.1f: Residential Sector Summary: Multi-Family Retrofit/Replace.................................76 Table 6.2: Residential Lighting Measures: Cost and Technical Potential Savings .....................78 Table 6.3: Residential Appliances: Measure Cost and Technical Potential Savings...................79 Table 6.4: Residential HVAC Measure: Cost and Technical Potential Savings .........................81 Table 6.5: Residential Energy Star Package: Measure Cost and Technical Potential Savings ....82 Table 6.6: Residential Weatherization Measures: Costs and Technical Potential Savings..........83 Table 6.7: Residential Window Replacement Measures: Cost and Technical Potential Savings 84 Table 6.8: Residential Domestic Hot Water Measures: Cost and Technical Potential................85 Table 6.9: Multi-Family Measures: Cost and Technical Potential Savings .................................86
1
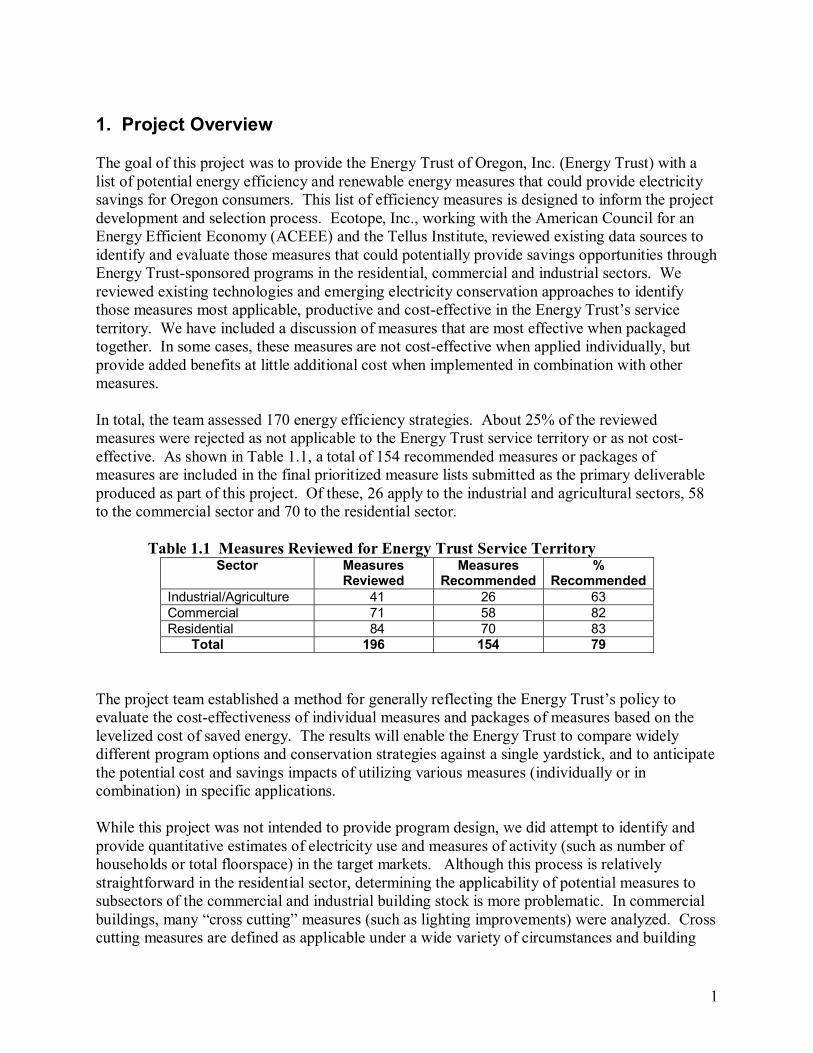
1. Project Overview The goal of this project was to provide the Energy Trust of Oregon, Inc. (Energy Trust) with a list of potential energy efficiency and renewable energy measures that could provide electricity savings for Oregon consumers. This list of efficiency measures is designed to inform the project development and selection process. Ecotope, Inc., working with the American Council for an Energy Efficient Economy (ACEEE) and the Tellus Institute, reviewed existing data sources to identify and evaluate those measures that could potentially provide savings opportunities through Energy Trust-sponsored programs in the residential, commercial and industrial sectors. We reviewed existing technologies and emerging electricity conservation approaches to identify those measures most applicable, productive and cost-effective in the Energy Trust’s service territory. We have included a discussion of measures that are most effective when packaged together. In some cases, these measures are not cost-effective when applied individually, but provide added benefits at little additional cost when implemented in combination with other measures. In total, the team assessed 170 energy efficiency strategies. About 25% of the reviewed measures were rejected as not applicable to the Energy Trust service territory or as not cost-effective. As shown in Table 1.1, a total of 154 recommended measures or packages of measures are included in the final prioritized measure lists submitted as the primary deliverable produced as part of this project. Of these, 26 apply to the industrial and agricultural sectors, 58 to the commercial sector and 70 to the residential sector. Table 1.1 Measures Reviewed for Energy Trust Service Territory
Sector Measures Reviewed
Measures Recommended
% Recommended
Industrial/Agriculture 41 26 63 Commercial 71 58 82 Residential 84 70 83 Total 196 154 79
The project team established a method for generally reflecting the Energy Trust’s policy to evaluate the cost-effectiveness of individual measures and packages of measures based on the levelized cost of saved energy. The results will enable the Energy Trust to compare widely different program options and conservation strategies against a single yardstick, and to anticipate the potential cost and savings impacts of utilizing various measures (individually or in combination) in specific applications. While this project was not intended to provide program design, we did attempt to identify and provide quantitative estimates of electricity use and measures of activity (such as number of households or total floorspace) in the target markets. Although this process is relatively straightforward in the residential sector, determining the applicability of potential measures to subsectors of the commercial and industrial building stock is more problematic. In commercial buildings, many “cross cutting” measures (such as lighting improvements) were analyzed. Cross cutting measures are defined as applicable under a wide variety of circumstances and building
2
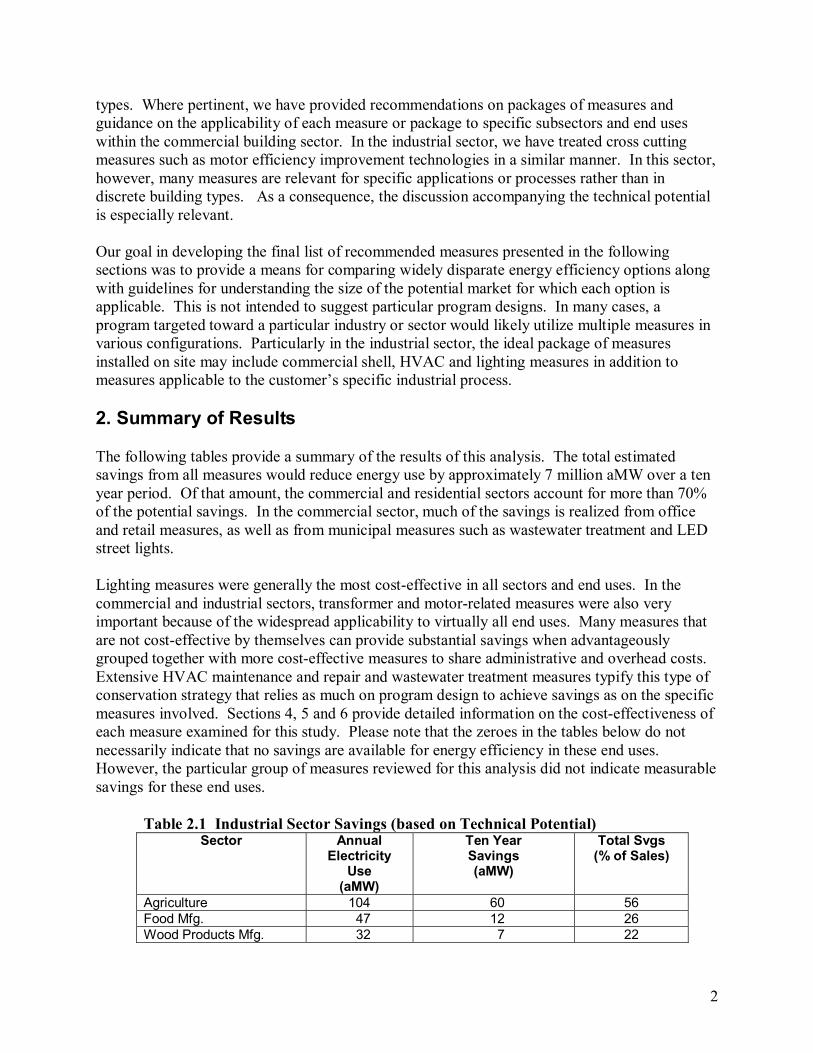
types. Where pertinent, we have provided recommendations on packages of measures and guidance on the applicability of each measure or package to specific subsectors and end uses within the commercial building sector. In the industrial sector, we have treated cross cutting measures such as motor efficiency improvement technologies in a similar manner. In this sector, however, many measures are relevant for specific applications or processes rather than in discrete building types. As a consequence, the discussion accompanying the technical potential is especially relevant. Our goal in developing the final list of recommended measures presented in the following sections was to provide a means for comparing widely disparate energy efficiency options along with guidelines for understanding the size of the potential market for which each option is applicable. This is not intended to suggest particular program designs. In many cases, a program targeted toward a particular industry or sector would likely utilize multiple measures in various configurations. Particularly in the industrial sector, the ideal package of measures installed on site may include commercial shell, HVAC and lighting measures in addition to measures applicable to the customer’s specific industrial process. 2. Summary of Results The following tables provide a summary of the results of this analysis. The total estimated savings from all measures would reduce energy use by approximately 7 million aMW over a ten year period. Of that amount, the commercial and residential sectors account for more than 70% of the potential savings. In the commercial sector, much of the savings is realized from office and retail measures, as well as from municipal measures such as wastewater treatment and LED street lights. Lighting measures were generally the most cost-effective in all sectors and end uses. In the commercial and industrial sectors, transformer and motor-related measures were also very important because of the widespread applicability to virtually all end uses. Many measures that are not cost-effective by themselves can provide substantial savings when advantageously grouped together with more cost-effective measures to share administrative and overhead costs. Extensive HVAC maintenance and repair and wastewater treatment measures typify this type of conservation strategy that relies as much on program design to achieve savings as on the specific measures involved. Sections 4, 5 and 6 provide detailed information on the cost-effectiveness of each measure examined for this study. Please note that the zeroes in the tables below do not necessarily indicate that no savings are available for energy efficiency in these end uses. However, the particular group of measures reviewed for this analysis did not indicate measurable savings for these end uses.
Table 2.1 Industrial Sector Savings (based on Technical Potential) Sector Annual
Electricity Use
(aMW)
Ten Year Savings (aMW)
Total Svgs (% of Sales)
Agriculture 104 60 56 Food Mfg. 47 12 26 Wood Products Mfg. 32 7 22

3
Paper Mfg. 61 31 48 Primary Metal Mfg. 62 9 15 Fabricated Metal Mfg. 57 9 14 Computers & Electronics 422 162 37 Transportation Equip Mfg. 88 16 17 Total: 873 306
Table 2.2 Commercial Sector Savings (based on Technical Potential) Sector Annual
Electricity Use aMW
10 Year Savings (New) aMW
10 Year Savings (Retrofit)
aMW
Total Svgs (% of Sales)
Office 162 14 58 44.4% Restaurant 81 1 21 27.9% Retail 223 14 71 38.4% Grocery 95 2 20 22.8% Warehouse 65 1 8 13.9% Schools 62 6 7 20.8% Colleges/Universities 32 3 6 26.8% Health 92 4 7 12.4% Lodging 43 1 5 14.9% Miscellaneous & TCU* 278 9 106 41.4% Total: 1132 55 309 * Includes waste water and municipal facilities. Table 2.3 Residential Sector Savings (based on Technical Potential)
Sector Annual Electricity
Use aMW
Savings (New) aMW
Savings (Retrofit)
aMW
Total Svgs (% of Sales)
Single Family 1154 42 222 23 Multi Family 210 33 43 36 Manufactured Homes 102 27 41 67 Total: 1466 102 306
3. Methodology
3.1. Initial List of Measures The first step in this project was to identify potential electric energy efficiency measures that could be applicable in the Oregon market. To do this, the team used internal resources in addition to an extensive literature review to identify measures in each sector that were potentially cost-effective, and for which cost and performance information was sufficiently well developed to serve as the basis for evaluation and potential program design. Economic and demographic information for Oregon and for the Energy Trust service territory was also collected. These data were used to refine the list of measures to be analyzed in order to target those technologies most applicable to the building stock,

4
climate and market conditions within the target area. Appendix A provides a complete list of the measures initially considered for review. In the industrial sector, an initial assessment of potential measures yielded 35 candidates, with an additional four measures applicable to the agricultural sector. Two additional measures were suggested by the Trust for this sector (lean analysis and soil moisture sensors), for a total of 41 measures studied. Our analysis eliminated 15 of these measures on the basis of cost-effectiveness or applicability to the target market. The lean analysis measure was dropped because it relates to the overall optimization of particular processes rather than specifically to energy efficiency. Those aspects of lean analysis that are related to equipment rather than process loads have been subsumed into the industrial measures. The soil moisture sensor measure was included as part of the Irrigation Hardware and Pumps measure. The initial commercial sector list of potential measures identified 71 candidates for further review. At the request of the Trust, we added a measure for Super T-8 lighting retrofits. Only one measure was dropped -- the red LED traffic lights measure was dropped because free ridership was estimated to be extremely high. An additional 13 measures were evaluated and found to cost more than $0.05/kWh, and were therefore not cost-effective according to the parameters used for this analysis. The cost effectiveness level used for this work was based on a regional average, and was used to select measures for further analysis. The Energy Trust has a procedure for conducting a more refined cost-effectiveness analysis using more detailed parameters, but that level of analysis was outside the scope of this effort. Several measures were evaluated and found to have limited applicability or were cost-effective only in specific, well defined situations. These included many of the emerging technologies that we examined. These measures were treated separately and our qualitative (rather than quantitative) results are presented in memo form in Appendix B. The more significant of these measures have been presented in multiple configurations that take into account varying sector or size characteristics. Therefore, a total of 85 workbook measures are presented in the final Measure List. Measures for the residential sector were analyzed separately for each subsector (single family, multi-family and manufactured homes). Our initial list identified 84 measures for further review. Approximately 7% of these measures were found not to be cost-effective or not applicable to the Oregon market and climate and were therefore dropped from further consideration. However, where appropriate, we have grouped individual measures into a package of measures that maximizes the cost-effectiveness of the group. Therefore, the final list for further review contained 78 measures and/or packages of measures. Of these, approximately 18 measures are applicable to the multi-family sector and 7 of these are targeted to new construction. The remaining 11 multi-family entries are retrofit measures. In each of the remaining residential subsectors (single-family and manufactured homes), approximately 30 measures were studied. About half of these measures were applicable to new homes and half designed for application in retrofit situations, although in many cases the only difference between the new and retrofit
5
measures is the target population since the same equipment or procedure is examined in both sectors.
3.2. Resource Assessment The measures identified in the initial list of measures were each then analyzed for cost and performance in the Energy Trust service territory. Data on measure costs, benefits, technological maturity, and applicability were collected. The Oregon market was also studied to identify market potential, infrastructure, climate, energy use, energy costs, and other variables that impact the usefulness of each of the measures in the particular market served by the Energy Trust. For each measure, we attempted to identify and quantify the potential market for which that measure was applicable. While this is relatively straightforward in the residential sector and only slightly problematic in the commercial sector, it is very difficult to provide the same level of detail for a technical potential assessment in the industrial sector. Nevertheless, we have provided an approximate technical potential for each measure that can be used to estimate overall program size and savings potential. To calculate the cost-effectiveness of each measure, the following assumptions were generally followed. Where appropriate, exceptions have been noted within the measure workbook. Only actual equipment and labor costs were included in the measure cost calculation used in this analysis. In addition, incremental costs (or savings) related to differences in operations and maintenance were considered in the cost-effectiveness analysis. We did not consider program administrative costs, marketing or other overhead expenses. For each measure, the incremental cost of the equipment examined in the measure over that required by the relevant energy code was used where applicable in new construction, renovation and replacement, and over existing equipment for retrofit situations. These measures generally examine one-for-one equipment selections so all other costs are assumed to be the same. In cases where additional installation costs would be associated with the equipment in the measure, these incremental costs have also been included. The impact of the measure on O&M expenses was also calculated and included in the cost-effectiveness analysis. For the savings analysis, we assumed that the measure would be applied to 100% of situations for which it was applicable and for which no related measure was applied. For retrofit measures, we assumed that 10 percent of the population would be addressed each year for a period of ten years. For replacement measures, we first calculated a replacement rate and then assumed that the measure was applied to all of the replacements for which it was appropriate. For new measures, we assumed that all of the applicable new construction was treated every year for ten years. Growth rates were developed based on US Census Bureau data.
6
3.2.1. Tool Selection and Use
One of the primary goals of this project was to develop a method of analyzing measures across sectors and technology types that would provide a means of comparing anticipated costs and benefits associated with a variety of program options. A spreadsheet-based tool, developed by the Tellus Institute, was adopted and modified for this purpose.
The Assessment Tool selected by the team includes several favorable features:
1. Standardized program assumptions. It was outside the scope of this project to provide
a complete cost/benefit analysis of particular program options. However, in order to calculate a levelized cost of saved energy, certain program assumptions had to be estimated. This spreadsheet tool allowed the team to use the same set of program assumptions for each measure, so that differences in the results of the analysis of any two measures were impacted only by the variables of interest (cost, benefits, technical potential).
2. Updateable. The measure cost and performance, market penetration and other inputs
into the tool can be easily changed to analyze a particular measure under a variety of program and cost conditions. For example, Trust personnel can easily modify the cost of the measure or number of program participants and calculate a new levelized cost of saved energy.
3. Consistent analysis approach. The measures were individually assessed by team
members with expertise in particular areas. The use of this tool ensured that measure assessments performed by different analysts were comparable.
4. Record of assumptions, sources, etc. The input requirements of the tool provide a
record of the data and processes used by the analysts to develop levelized costs. We believe this will be extremely informative and provide insights to the Trust that will be helpful during program design, particularly in cases where multiple measures are combined into a single conservation package targeted at a particular customer, subsector or building type.
3.2.2. Tool Limitations While the strict data input structure of the Assessment Tool provides a consistent way to compare measures across sectors, it does impose some limitations: 1. The total measure costs and benefits calculations are based on an estimate of the
number of cases for which the measure is applicable; ie, the program participation was estimated to be the total technical potential. These figures will need to be adjusted for programs that target only a portion of the identified market.
7
2. The tool does not allow multiple-measure “what if” analysis. No means is provided to allow Trust personnel to combine measures into various packages for comparison (although this can be done using existing Trust tools). While we have assessed a number of combined-measure packages, the costs and benefits must be calculated and combined outside the tool and entered as one set of assumptions.
3. The tool provides limited flexibility. The tool we selected did not provide
optimum flexibility to analyze measures by subsector or across subsectors without creating multiple worksheets. While this did impose some limits on the analysis methodology, the strict requirements of the tool ensure that comparable computations across all types of measures and sectors are made.
3.2.3. Data Collection
To develop the inputs required by the tool, the team utilized a wide variety of resources. A literature review was conducted to collect equipment and labor costs and energy benefits. This review was augmented by internal data developed by the team members for use in prior projects. Where available, the Northwest Power Planning Council’s (NPPC) Regional Technical Forum (RTF) data was utilized in the residential sector to collect costs and energy benefits. In addition, the NPPC libraries provided cost and benefit data for many of the commercial sector measures. In some cases, technical papers or data provided by manufacturers was used. The data source(s) used for each measure are noted in the Notes and Sources section of each measure workbook. To determine the applicability of measures to the Energy Trust service territory and to assess market conditions, economic and census data was collected from Economy.com and from the U.S. Census Bureau and the Department of Housing and Urban Development. Population estimates were also collected from the Portland State University Center for Population Studies and from the Manufactured Housing Association. Where available, public documents prepared by the individual utilities were used to generate electricity end use or device saturation and penetration rates for the Energy Trust service territory. Where not available, these rates were extrapolated from county- or state-level data.
3.3. Prioritized List of Conservation Measures The results of our assessment are provided in the form of separate spreadsheets for the residential, commercial and industrial sectors (see Sections 4, 5 and 6 for the final lists of measures). For each measure or package of measures, we developed cost and savings estimates (including peak load savings), as well as an estimate of overall achievable energy savings over the next ten years. To generate both the costs and savings impacts over time, we assumed that the measure was applied to all potential candidates over the

8
course of ten years. These calculations could change considerably as specific programs are developed, but provide an overview of the maximum potential available from each measure. As a final step, the list of measures was prioritized by overall cost-effectiveness. 3.3.1. Prioritization Methodology To compare and prioritize measures, we developed a levelized cost of saved energy (CSE) for each measure or package of measures. The CSE calculation starts with the incremental capital cost of a given measure or package of measures over and above the cost of standard technologies. This cost is amortized over an estimated measure lifetime using an average discount rate (in this case a real discount rate of 3 percent/year, which is the standard value used by Energy Trust), and added to any net annual operating and maintenance cost (or benefit) to estimate an annual net "levelized" cost for the measure. This annual net measure cost is then divided by the annual net energy savings (in kilowatt-hours) from measure application (again relative to a standard technology) to produce the CSE estimate in dollars per kWh saved, as illustrated in Formula 1.
)(($)kWhSavingsAnnualNet
CostAnnualNetCSE =
The CSE is a figure that can be compared with the full cost of delivering power from electricity generation options. The CSE approach was chosen as the most practical and useful method of comparing measures of various types and applications.
4. Industrial Sector Resource Assessment Results A list of the recommended industrial measures, ordered by the cost of saved energy, is provided in Table 4.1. This list presents individual measures, with incremental capital costs and net operations and maintenance costs (or benefits—shown as negative O&M costs) expressed in units of kWh of annual energy savings by the measure. In the industrial sector, applications of measures are highly dependent on the specific facility or process, so data provided on a “per unit” basis (such as per square foot of factory floor area) is not meaningful. In the section that follows, we provide a discussion of the potential application of these measures, as well as selected recommendations regarding potential program designs for the industrial sector.

9
Table 4.1. Prioritized List of Measures for the Industrial Sector Measure Name Incre-
mental Cost
($/Unit)
O&M Cost ($/Yr)
Cost of Saved Energy($/kWh)
Year 10 Savings (aMW)
Status
Advanced Motor Design 0.023 -150.50 -96.488 41.368 emergingSensors and Controls 8.821 -1.47 -0.342 5.230 available UV Curing -0.079 0.00 -0.066 0.089 available Advanced Lubricants 0.006 -0.07 -0.050 1.228 available Electronics Polysilicon -0.193 0.00 -0.020 16.068 emergingFood Cooling and Storage 0.004 -0.02 -0.013 0.920 available Electrical Supply Systems Improvement 0.010 -0.01
-0.006 24.930 emerging
Pump Efficiency Improvement 0.154 -0.02 0.000 26.436 available Agriculture: Barn Fans 0.000 0.00 0.000 10.594 available Motor Management 0.020 0.00 0.001 7.117 available Air Compressor Systems 0.031 0.00 0.002 0.651 available Motor Systems Optimization 0.023 0.00 0.002 3.175 available Fan System Improvements 0.030 0.00 0.002 1.319 available Generic O&M 0.000 0.01 0.004 16.620 available Transformers (Tier 2) 0.188 0.00 0.005 5.540 available Electronics Advanced Cleanroom 0.139 0.00 0.006 11.521 emergingIrrigation Hardware Pump Systems 0.184 -0.01 0.007 8.040 available Efficient Lighting Fixtures and Lamps 0.160 -0.02 0.010 16.157 available Duct/Pipe Insulation 0.090 0.00 0.011 53.026 available Efficient Lighting Design 0.288 0.00 0.011 20.631 available Microwave Processing 0.450 0.00 0.034 0.158 available Water Management 0.179 0.07 0.074 3.405 available Advanced Industrial HVAC 0.650 0.05 0.084 11.603 available Electric IR Heating & Drying 0.450 0.00 0.375 0.123 available RF Heating and Drying 0.450 0.50 0.378 0.010 available Electronics Continuous Melt Silicon 23.071 0.00 2.401 26.780 emerging Total 312.739
Note: Shaded measures are not cost-effective by the criteria used for this analysis.
4.1. Industrial Sector Characterization In order to characterize the baseline industrial electricity use for the Energy Trust’s service territory, statewide census data was paired with Department of Energy (DOE) utility data. Statewide data was drawn from 1997, the latest year in which the Economic Census (USDOC 2000) and Agricultural Census (USDA 2000) were taken in the same year. The Economic Census reports value of shipments and electricity use information on the manufacturing, mining and construction subsectors. The Agricultural Census offers information specific to farming and ranching, including market value of crops and electricity use. Using these sources of data, a baseline of industrial electricity use for the state of Oregon was created. Utility data reported to the DOE (EIA 2002) reports that approximately 57 percent of the statewide industrial electricity was consumed in the Energy Trust service territory, allowing the creation of an Energy Trust baseline.
In 1997, the largest electricity-using subsector was primary metal manufacturing, dominated overwhelmingly by primary aluminum. Paper, wood products, computer

10
equipment manufacturing and agriculture completed the top five electricity users in the service territory. Together, these industries used approximately three-fourths of the industrial electricity consumed.
By 2000, however, a series of factors had caused a shift in the two largest industrial electricity users in the Energy Trust territory. These factors included repercussions of the California energy crisis; which, coupled with over-capacity in the aluminum market, led to the virtual elimination of that industry in Oregon. It appears unlikely that this industry will return due to changes in the global aluminum market. Similarly, increases in electricity prices combined with declining old-growth timber inventories led to a decline in the wood products and primary paper industries. The outlook for these industries is equally uncertain. During the same period, substantial growth occurred in the computer industry within the Energy Trust territory. The growth in the electronics industry continued a trend that had been occurring for more than two decades. While market downturns in the past two years have caused a reduction in electricity use by this sector, many experts anticipate that this sector will recover in the state, along with the hi-tech industry at large.
The agriculture sector also experienced significant growth. According to interviews in the region, this reflects a shift in the sector toward greater on-farm processing. It has always been difficult to differentiate food processing and farming. This trend in Oregon may indicate that these two sectors should be treated together, since many of the major processes (such as refrigeration and cold storage) are common between both sectors.
In 2000, the sector with the largest single consumption of industrial electricity was Computer and Electronic Product Manufacturing, which includes computers and peripherals, as well as semiconductor manufacturing. This subsector represents over 25 percent of the electricity used in the service territory. Paper and wood product manufacturing maintained their positions as second and third largest electricity users. Primary metal manufacturing had the largest shift, losing 8 percentage points and falling to the fifth ranked position.
4.2. Cross Cutting Measures
In the industrial sector, the most substantial savings are available from the application of cross cutting measures; those that apply to a broad spectrum of facility and process types (and particularly those related to motor technologies). In many cases, while the savings from these individual cross cutting measures can be modest when considered as a fraction of overall energy use by a particular piece of equipment, the widespread applicability of cross cutting measures offers some of the largest potential savings in the sector.
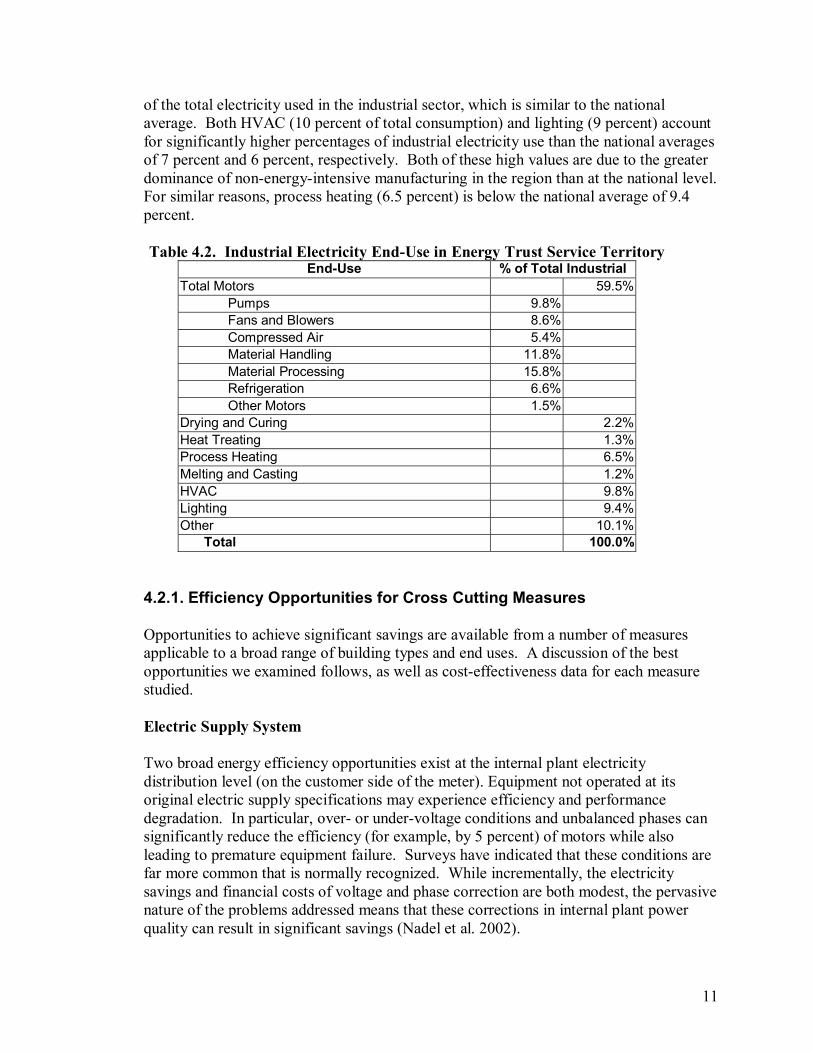
Within the industrial sector, the largest cross cutting electricity uses include motors and motor-driven systems, electric supply, and lighting. Table 4.2 provides estimates of electricity end-use within the Energy Trust service territory in these and other categories (please note that the total percentage does not add up to 100 percent due to rounding within the subsectors). Motors and related electricity consumption account for 60 percent
11
of the total electricity used in the industrial sector, which is similar to the national average. Both HVAC (10 percent of total consumption) and lighting (9 percent) account for significantly higher percentages of industrial electricity use than the national averages of 7 percent and 6 percent, respectively. Both of these high values are due to the greater dominance of non-energy-intensive manufacturing in the region than at the national level. For similar reasons, process heating (6.5 percent) is below the national average of 9.4 percent.
Table 4.2. Industrial Electricity End-Use in Energy Trust Service Territory
End-Use % of Total Industrial Total Motors 59.5%
Pumps 9.8% Fans and Blowers 8.6% Compressed Air 5.4% Material Handling 11.8% Material Processing 15.8% Refrigeration 6.6% Other Motors 1.5%
Drying and Curing 2.2% Heat Treating 1.3% Process Heating 6.5% Melting and Casting 1.2% HVAC 9.8% Lighting 9.4% Other 10.1% Total 100.0%
4.2.1. Efficiency Opportunities for Cross Cutting Measures
Opportunities to achieve significant savings are available from a number of measures applicable to a broad range of building types and end uses. A discussion of the best opportunities we examined follows, as well as cost-effectiveness data for each measure studied. Electric Supply System
Two broad energy efficiency opportunities exist at the internal plant electricity distribution level (on the customer side of the meter). Equipment not operated at its original electric supply specifications may experience efficiency and performance degradation. In particular, over- or under-voltage conditions and unbalanced phases can significantly reduce the efficiency (for example, by 5 percent) of motors while also leading to premature equipment failure. Surveys have indicated that these conditions are far more common that is normally recognized. While incrementally, the electricity savings and financial costs of voltage and phase correction are both modest, the pervasive nature of the problems addressed means that these corrections in internal plant power quality can result in significant savings (Nadel et al. 2002).

12
Transformers Similarly, all electric power passes through one or more transformers on its way to service equipment, lighting, and other loads. Currently available materials and designs can considerably reduce both load and no-load losses. The new National Electrical Manufacturer’s Association (NEMA) TP-1 standard is used as the reference definition for energy-efficient products. Tier-1 represents TP-1 dry-type transformers while Tier-2 reflects a switch to liquid immersed TP-1 products. More efficient transformers with attractive payback periods are estimated to save 40 to 50 percent of the energy lost by a "typical" transformer, which translates into a one to three percent reduction in electric bills for commercial and industrial customers. Typical paybacks range from 3 to 5 years (Nadel, et al. 1998). Unfortunately, the application of high-efficiency transformers offers no significant non-energy benefits, which limits adoption of this measure in commercial and industrial applications. The cost and savings potential for each of the cross cutting measures is presented below. Synergistic opportunities may exist for offering these measures in combination programs, as is discussed below. Table 4.3a presents the cross cutting electric supply system efficiency measures, and breaks out the share of the projected economic electric savings potential that exists in each of the key industries in the Energy Trust territory. Table 4.3a. Industrial Electricity Supply System Efficiency Measures
Measure Name Incre- mental Cost
($/Unit)
O&M Cost ($/Yr)
Cost of Saved Energy($/kWh)
Year 10 Savings (aMW)
Electric Supply Sys Improvements 0.010 -0.01 -0.006 24.930 Food mfg 1.132 Wood product mfg 0.995 Paper mfg 3.301 Primary metal mfg 1.625 Computer & electronic product mfg 11.306 Agriculture 3.735 Fabricated metal product mfg 1.147 Transportation equipment mfg 1.688
Transformers (Tier 2) 0.188 0.00 0.005 5.540 Food mfg 0.251 Wood product mfg 0.221 Paper mfg 0.734 Primary metal mfg 0.361 Computer & electronic product mfg 2.513 Agriculture 0.830 Fabricated metal product mfg 0.255 Transportation equipment mfg 0.375 Total: 30.470
13
Replacement Motors Since almost two-thirds of industrial electricity flows through motors, motor efficiency is a logical focus for efficiency opportunities. Motors are inherently efficient devices, and the implementation in 1997 of the minimum-efficiency standards in the Energy Policy Act of 1992 (EPAct) eliminated the least-efficient products from the new-motor market. A new standard, NEMA Premium™, defining energy efficiency criteria for more efficient motors, was introduced in 2001, and several advanced motor designs (including copper rotor, switch reluctance and written-pole motors) are becoming available. While the NEMA Premium motors are cost-effective in many high-use industrial applications, the current potential for advanced motors is limited by their cost. Many experts feel that focusing on changing the existing motor stock is more important, because motors can last for more than 30 years, so most motors now operating are pre-EPAct. Under normal circumstances, these motors will be repaired four times before being replaced. As a result, the focus needs to shift to impacting repair and replacement decisions. The foundation of this activity is the implementation of motor-management plans at industrial facilities, which is the major focus of the national Motor Decisions Matter ™ initiative, sponsored by "a consortium of motor industry manufacturers and service centers, trade associations, electric utilities and government agencies" (see http://www.motorsmatter.org/). This initiative focuses on affecting planned motor repair and replacement decisions to encourage replacement of old motors with new EPAct or Premium motors, and to ensure that motors are repaired properly so that their efficiency is maintained. In addition, these improved management practices can lead to greater motor system reliability, resulting in very substantial improvements in productivity and reductions in process downtime (Nadel et al. 2002). In the Pacific Northwest, Drivepower is working with Motor Decisions Matter ™ to provide motor management assistance, providing additional direct assistance and training for motor management personnel in industrial facilities. Advanced Lubricants A related motor O&M measure is the use of advanced lubricants. While these engineering lubrication products have been on the market for more than twenty years, they have seen somewhat limited market penetration due to their significantly higher cost compared with conventional petroleum-based lubricants. These advanced lubricants, however, offer a number of distinct advantages. In addition to energy savings, these advantages include extended re-lubrication intervals. Life-cycle savings in labor and lubricant often more than offset the higher lubricant costs. In addition, since the leading cost of rotating equipment failure is bearing failure, the improved lubricant life has been demonstrated to improve equipment reliability (Nadel et al. 2002). Motor-Related Equipment While small differences in motor efficiency can result in significant energy savings, even greater savings can be realized through improvements in the efficiency of the systems
14
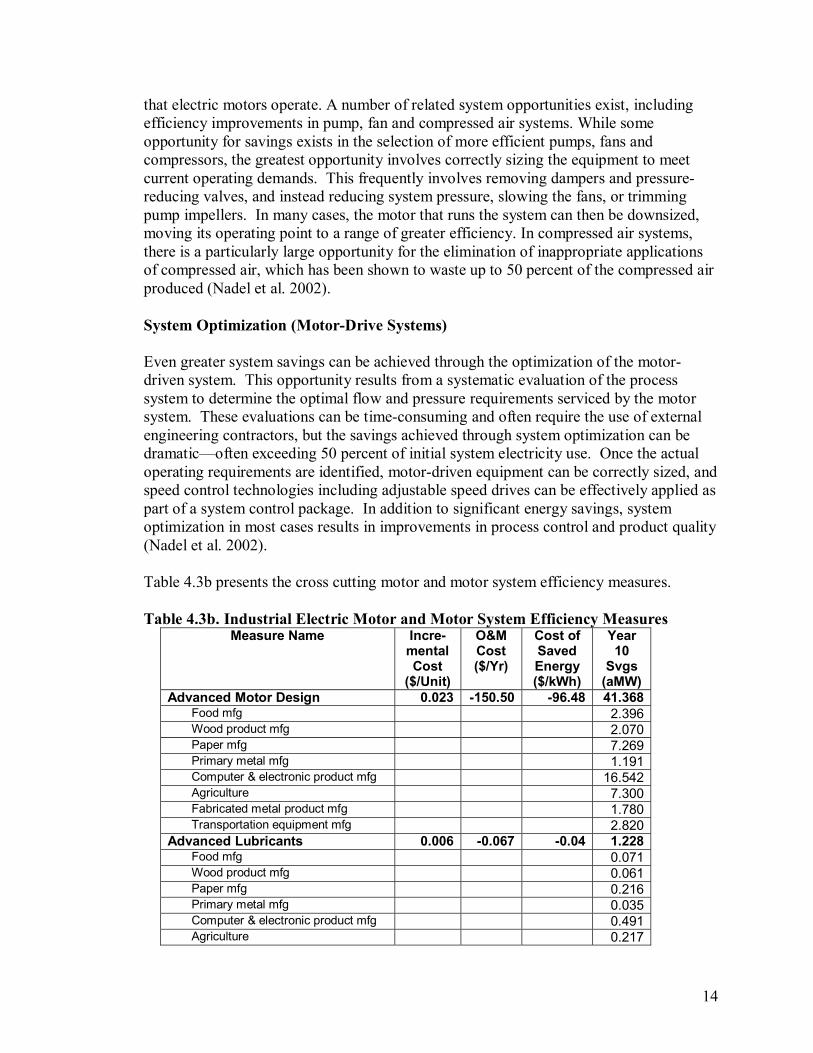
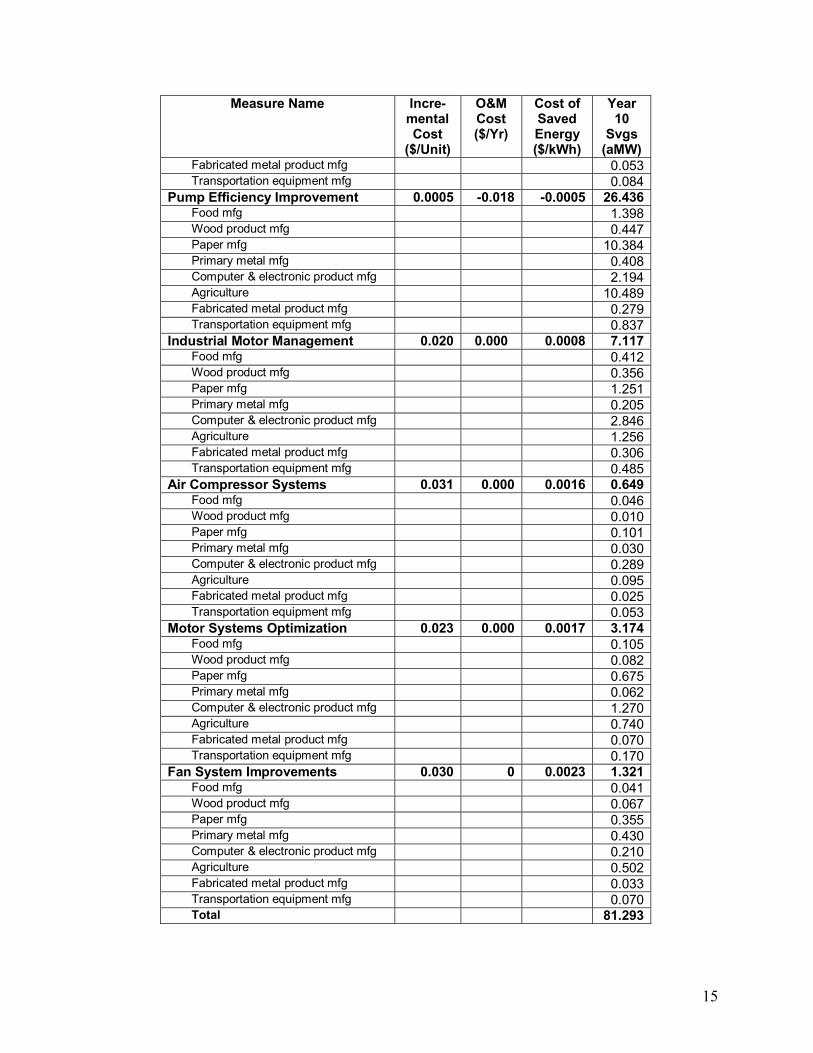
that electric motors operate. A number of related system opportunities exist, including efficiency improvements in pump, fan and compressed air systems. While some opportunity for savings exists in the selection of more efficient pumps, fans and compressors, the greatest opportunity involves correctly sizing the equipment to meet current operating demands. This frequently involves removing dampers and pressure-reducing valves, and instead reducing system pressure, slowing the fans, or trimming pump impellers. In many cases, the motor that runs the system can then be downsized, moving its operating point to a range of greater efficiency. In compressed air systems, there is a particularly large opportunity for the elimination of inappropriate applications of compressed air, which has been shown to waste up to 50 percent of the compressed air produced (Nadel et al. 2002). System Optimization (Motor-Drive Systems) Even greater system savings can be achieved through the optimization of the motor-driven system. This opportunity results from a systematic evaluation of the process system to determine the optimal flow and pressure requirements serviced by the motor system. These evaluations can be time-consuming and often require the use of external engineering contractors, but the savings achieved through system optimization can be dramatic—often exceeding 50 percent of initial system electricity use. Once the actual operating requirements are identified, motor-driven equipment can be correctly sized, and speed control technologies including adjustable speed drives can be effectively applied as part of a system control package. In addition to significant energy savings, system optimization in most cases results in improvements in process control and product quality (Nadel et al. 2002). Table 4.3b presents the cross cutting motor and motor system efficiency measures. Table 4.3b. Industrial Electric Motor and Motor System Efficiency Measures
Measure Name Incre- mental Cost
($/Unit)
O&M Cost ($/Yr)
Cost of Saved Energy ($/kWh)
Year 10
Svgs (aMW)
Advanced Motor Design 0.023 -150.50 -96.48 41.368 Food mfg 2.396 Wood product mfg 2.070 Paper mfg 7.269 Primary metal mfg 1.191 Computer & electronic product mfg 16.542 Agriculture 7.300 Fabricated metal product mfg 1.780 Transportation equipment mfg 2.820
Advanced Lubricants 0.006 -0.067 -0.04 1.228 Food mfg 0.071 Wood product mfg 0.061 Paper mfg 0.216 Primary metal mfg 0.035 Computer & electronic product mfg 0.491 Agriculture 0.217
15
Measure Name Incre- mental Cost
($/Unit)
O&M Cost ($/Yr)
Cost of Saved Energy ($/kWh)
Year 10
Svgs (aMW)
Fabricated metal product mfg 0.053 Transportation equipment mfg 0.084
Pump Efficiency Improvement 0.0005 -0.018 -0.0005 26.436 Food mfg 1.398 Wood product mfg 0.447 Paper mfg 10.384 Primary metal mfg 0.408 Computer & electronic product mfg 2.194 Agriculture 10.489 Fabricated metal product mfg 0.279 Transportation equipment mfg 0.837
Industrial Motor Management 0.020 0.000 0.0008 7.117 Food mfg 0.412 Wood product mfg 0.356 Paper mfg 1.251 Primary metal mfg 0.205 Computer & electronic product mfg 2.846 Agriculture 1.256 Fabricated metal product mfg 0.306 Transportation equipment mfg 0.485
Air Compressor Systems 0.031 0.000 0.0016 0.649 Food mfg 0.046 Wood product mfg 0.010 Paper mfg 0.101 Primary metal mfg 0.030 Computer & electronic product mfg 0.289 Agriculture 0.095 Fabricated metal product mfg 0.025 Transportation equipment mfg 0.053
Motor Systems Optimization 0.023 0.000 0.0017 3.174 Food mfg 0.105 Wood product mfg 0.082 Paper mfg 0.675 Primary metal mfg 0.062 Computer & electronic product mfg 1.270 Agriculture 0.740 Fabricated metal product mfg 0.070 Transportation equipment mfg 0.170
Fan System Improvements 0.030 0 0.0023 1.321 Food mfg 0.041 Wood product mfg 0.067 Paper mfg 0.355 Primary metal mfg 0.430 Computer & electronic product mfg 0.210 Agriculture 0.502 Fabricated metal product mfg 0.033 Transportation equipment mfg 0.070 Total 81.293
16
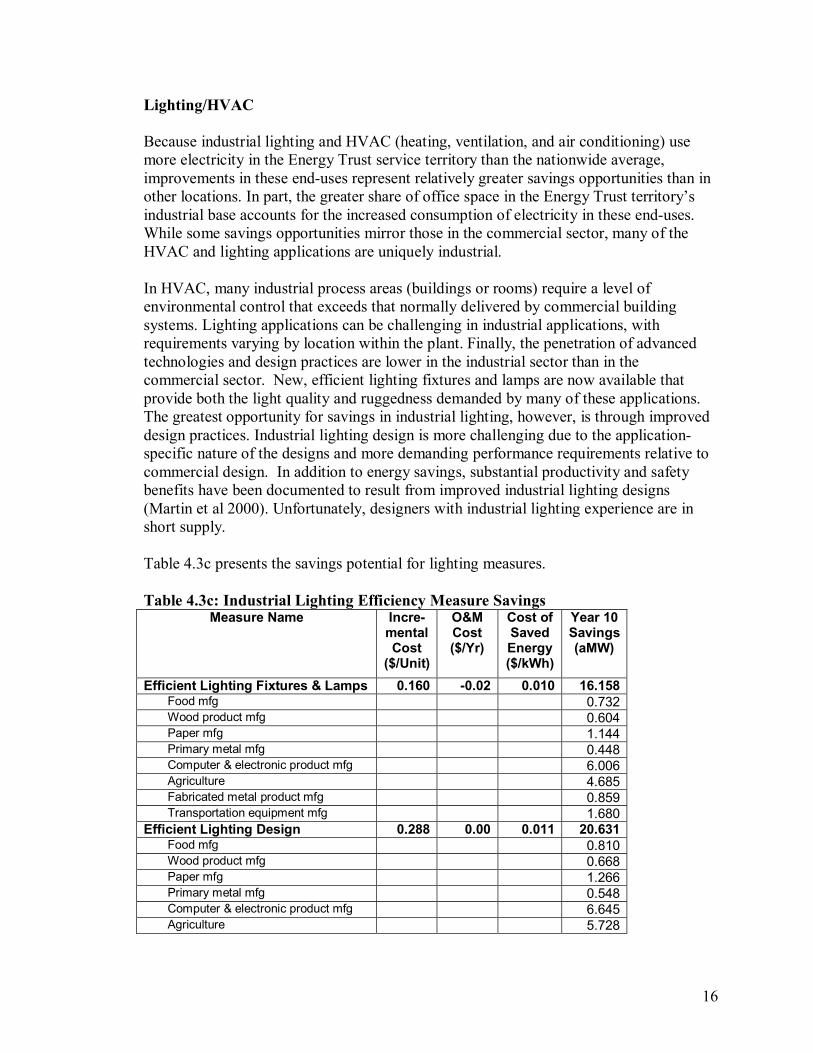
Lighting/HVAC Because industrial lighting and HVAC (heating, ventilation, and air conditioning) use more electricity in the Energy Trust service territory than the nationwide average, improvements in these end-uses represent relatively greater savings opportunities than in other locations. In part, the greater share of office space in the Energy Trust territory’s industrial base accounts for the increased consumption of electricity in these end-uses. While some savings opportunities mirror those in the commercial sector, many of the HVAC and lighting applications are uniquely industrial. In HVAC, many industrial process areas (buildings or rooms) require a level of environmental control that exceeds that normally delivered by commercial building systems. Lighting applications can be challenging in industrial applications, with requirements varying by location within the plant. Finally, the penetration of advanced technologies and design practices are lower in the industrial sector than in the commercial sector. New, efficient lighting fixtures and lamps are now available that provide both the light quality and ruggedness demanded by many of these applications. The greatest opportunity for savings in industrial lighting, however, is through improved design practices. Industrial lighting design is more challenging due to the application-specific nature of the designs and more demanding performance requirements relative to commercial design. In addition to energy savings, substantial productivity and safety benefits have been documented to result from improved industrial lighting designs (Martin et al 2000). Unfortunately, designers with industrial lighting experience are in short supply. Table 4.3c presents the savings potential for lighting measures.
Table 4.3c: Industrial Lighting Efficiency Measure Savings
Measure Name Incre- mental Cost
($/Unit)
O&M Cost ($/Yr)
Cost of Saved Energy($/kWh)
Year 10 Savings (aMW)
Efficient Lighting Fixtures & Lamps 0.160 -0.02 0.010 16.158 Food mfg 0.732 Wood product mfg 0.604 Paper mfg 1.144 Primary metal mfg 0.448 Computer & electronic product mfg 6.006 Agriculture 4.685 Fabricated metal product mfg 0.859 Transportation equipment mfg 1.680
Efficient Lighting Design 0.288 0.00 0.011 20.631 Food mfg 0.810 Wood product mfg 0.668 Paper mfg 1.266 Primary metal mfg 0.548 Computer & electronic product mfg 6.645 Agriculture 5.728

17
Measure Name Incre- mental Cost
($/Unit)
O&M Cost ($/Yr)
Cost of Saved Energy($/kWh)
Year 10 Savings (aMW)
Fabricated metal product mfg 1.734 Transportation equipment mfg 3.232 Total 36.789
Sensors and Controls A key element to implementing system optimization is the application of sensors and controls. These allow processes to be monitored and systems adjusted to minimize energy consumption. Perhaps more importantly from the consumer’s perspective, these systems allow better control of the process that can improve product quality and reduce scrap rates. Since most scrap- and waste-generating events occur towards the end of the production process when the imbedded energy content is greatest, the resulting waste reduction can reduce in significant net energy savings, as well as other productivity and cost benefits (Martin et al. 2000). HVAC Systems Typically the HVAC equipment and installation is an incidental part of an industrial process design. This coupled with the need to adjust both process lines and conditioning requirements as part of the production process leaves the industrial sector with numerous opportunities to improve the space conditioning systems. Current estimates are that 20% of the energy needed for HVAC and refrigeration is sacrificed to inadequate or non-existent duct and pipe insulation. The impact of these relatively simple measures provides one of the significant savings opportunities across the sector. Equipment provides another significant opportunity. The sector uses the same equipment as the commercial building sector but most of the equipment is not subject to energy codes and often includes recycled/rebuilt equipment that preserves historical inefficiencies in this end use. The measures here would use the higher efficiency “Tier 2” equipment to replace existing older equipment as production line changes and regular equipment obsolescence permits. The cost-effectiveness depends on the use of incremental cost for the efficiency at the point of equipment change-out. Table 4.3d presents the savings potential for sensors and controls and other cross-cutting measures. Table 4.3d: Other Cross Cutting Industrial Efficiency Measures
Measure Name Incre- mental Cost
($/Unit)
O&M Cost ($/Yr)
Cost of Saved Energy($/kWh)
Year 10 Savings (aMW)
Sensors and Controls 8.821 -1.47 -0.342 5.231 Food mfg 0.293 Wood product mfg 0.109

18
Measure Name Incre- mental Cost
($/Unit)
O&M Cost ($/Yr)
Cost of Saved Energy($/kWh)
Year 10 Savings (aMW)
Paper mfg 0.881 Primary metal mfg 0.323 Computer & electronic product mfg 1.916 Agriculture 1.298 Fabricated metal product mfg 0.159 Transportation equipment mfg 0.252
Generic O&M 0.000 -0.01 0.004 16.620 Food mfg 0.754 Wood product mfg 0.664 Paper mfg 2.201 Primary metal mfg 1.083 Computer & electronic product mfg 7.538 Agriculture 2.490 Fabricated metal product mfg 0.765 Transportation equipment mfg 1.125
Duct / Pipe Insulation 0.090 0.00 0.011 53.026 Food mfg 2.625 Wood product mfg 0.410 Paper mfg 1.178 Primary metal mfg 2.633 Computer & electronic product mfg 38.249 Agriculture 3.846 Fabricated metal product mfg 1.374 Transportation equipment mfg 2.711
Advanced Industrial HVAC 0.650 0.05 0.084 11.603 Food mfg 0.218 Wood product mfg 0.192 Paper mfg 0.318 Primary metal mfg 0.163 Computer & electronic product mfg 9.543 Agriculture --- Fabricated metal product mfg 0.335 Transportation equipment mfg 0.834 Total 86.480
4.2.2. Cross Cutting Program Recommendations The cross cutting measures described above are best delivered on an industry-wide basis. These broad-based offerings can also be packaged with industry-specific measures as part of industry-specific outreach activities. The following packages of measures are recommended for this sector:

19
Electric Supply System Tune-Up
An "Electric Supply System Tune-Up" program would combine the cross cutting electricity supply and transformer measures described above. The program would include elements of education and awareness, provision of technical information and assistance in identifying plant-level opportunities, and assistance in implementing improvements. The assistance might include educational materials, loan of instrumentation equipment, technical support, software tools, and access to experts. Comprehensive Motor Systems
Because of the importance and savings opportunities offered by electric motors, a motor program should be the core of any industrial program offering. Some portions of this type of industrial program can be fairly easy to implement, such as a general motor management offering. The implementation of other types of cross cutting measures, such as system optimization, is very complex, and program models are still evolving. The Drivepower program and the Motor Decision Matter™ program together have increased consumer awareness and provided the basic tools packages available. This national initiative can be used as the foundation upon which an Energy Trust program is built. Additional elements can then be added to the program offering, based on the needs and receptivity of the customer base. Programs which target opportunities such as pump motors in the agricultural sector, refrigeration equipment motors in the food warehouse sector, and materials handling and processing motors in the hi tech industries all provide attractive energy savings from both motor efficiency and system design improvements. This can form an integral part of a program that includes motor efficiency improvements as part of a total energy efficiency package.
The national Compressed Air Challenge initiative offers awareness and training in compressed air measures application, while the Northwest Energy Efficiency Alliance’s (the Alliance) SaveAir program augments the national initiative with a 24 x 7 multipoint monitoring and control system to compliment the other engineering approaches in the market to improve compressed air systems. For the pump, fan, and system optimization measures, no proven program models currently exist, although a number of groups are actively engaged in developing pilot programs (Elliott 2002).
Lighting Assistance
To achieve maximum effectiveness, a program for improvement in the energy efficiency in lighting needs to be focused on design. Industrial lighting design experts should be identified and/or trained, and regional case studies should be developed that build awareness and document energy and non-energy benefits. Some co-funding for design and technology from Energy Trust, augmented with funds from other sources, could be used to build awareness, acceptance and expertise related to the implementation of lighting efficiency improvements.
20
4.3. Hi-Tech Subsector
The electronics industry has been the fastest growing industry in Oregon for the past decade, with the subsector being dominated by semiconductor manufacturing (NAICS 3344), and computer and peripheral manufacturing (NAICS 3341). With the decline in other industries in Oregon (notably the wood products and aluminum industries) and with the hi-tech sector’s growth, the electronics industry has consumed an increasingly important fraction of overall industrial electricity demand. Even with the recent economic slowdown, the electronics industry remains one of the most significant subsectors, and one of few large Northwest industries with significant future potential for growth. Plants producing high-value chips rather than bulk products such as DRAM dominate the semiconductor industry in Oregon. At this point, the Oregon industry is comprised of only fabricators, relying upon refiners in adjacent states to provide the polysilicon feedstock required for growing the crystals (Robertson 2002). 4.3.1. Energy Use in the Hi-Tech Subsector
Non-HVAC motors account for a smaller fraction of overall electricity consumption in the hi-tech industries than in most other industries. Also, because of the reliance on clean-room manufacturing space, the lighting and HVAC requirements for the hi-tech subsector are significantly more important than in other industries. Among the motor uses, compressed air and materials processing are significant. Motors that power specialized functions such as clean water and other materials processes provide the largest opportunity to impact non-HVAC motors in the hi tech sector. In addition, computer manufacturing tends to have a higher fraction of its square-footage in office space than is common in other industries.
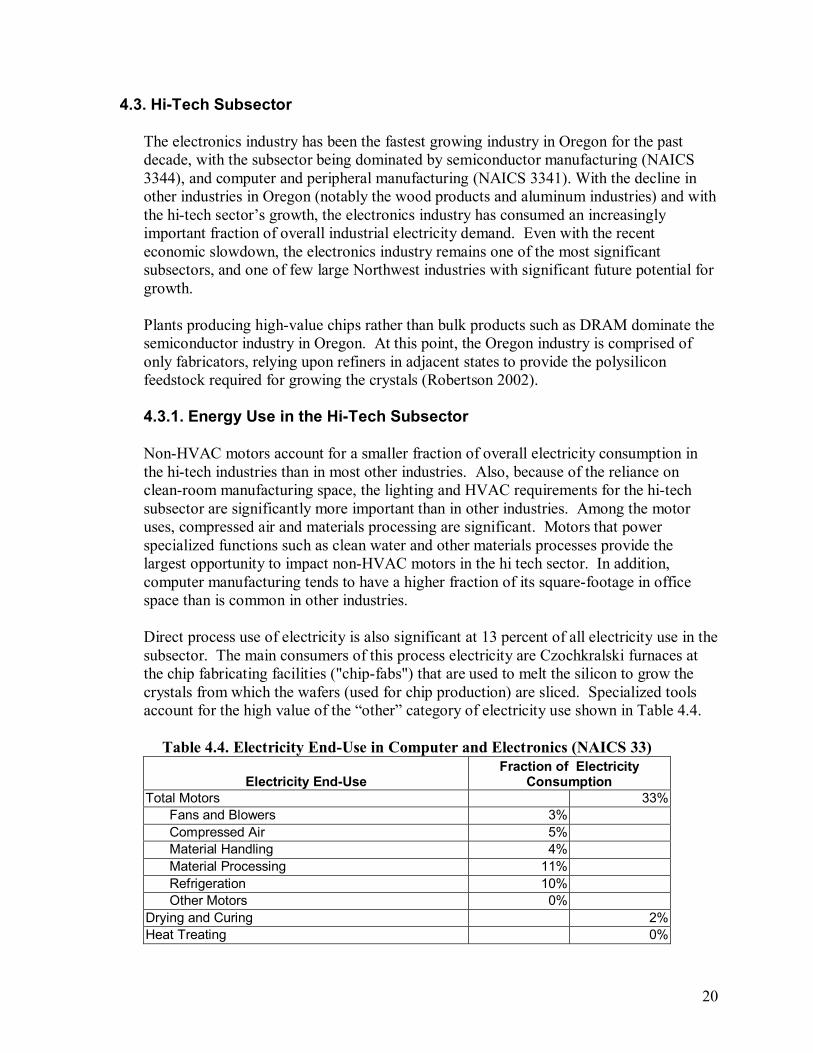
Direct process use of electricity is also significant at 13 percent of all electricity use in the subsector. The main consumers of this process electricity are Czochkralski furnaces at the chip fabricating facilities ("chip-fabs") that are used to melt the silicon to grow the crystals from which the wafers (used for chip production) are sliced. Specialized tools account for the high value of the “other” category of electricity use shown in Table 4.4.
Table 4.4. Electricity End-Use in Computer and Electronics (NAICS 33)
Electricity End-Use Fraction of Electricity
Consumption Total Motors 33%
Fans and Blowers 3%Compressed Air 5%Material Handling 4%Material Processing 11%Refrigeration 10%Other Motors 0%
Drying and Curing 2%Heat Treating 0%

21
Electricity End-Use Fraction of Electricity
Consumption Heating 13%HVAC 26%Lighting 13%Other 13%
Total 100%
4.3.2. Efficiency Opportunities in the Hi-Tech Subsector
Cross cutting measures that address compressed air, HVAC and lighting electricity use represent important efficiency opportunities for the hi-tech industrial subsector. In addition, because of the significant electricity consumption at these facilities, electric supply system tune-ups are important options, and also represent opportunities to address power quality concerns important to this industry’s precision manufacturing processes. Three sector-specific opportunities have been identified: advanced cleanrooms, continuous melt silicon crystal growth, and advanced polysilicon production. Since there is no current polysilicon production in the Energy Trust territory, this later measure represents an opportunity if a new silicon refinery is sited in the region, which is likely if the market for electronic chips recovers (Robertson 2002).
• Continuous Melt Silicon Crystal Growth: All silicon produced for both
semiconductor and solar photovoltaic end-uses is currently produced in batches. A continuous recharge system would allow the introduction of material during the run and would permit the growing of longer silicon ingots. The challenges to continuous melt growth include maintaining the growing environment, maintaining acceptable temperatures and temperature gradients when introducing materials, insuring the uniformity of the melted material, avoiding disturbance of the melt surface, and avoiding contaminating the silicon being drawn from the melt. Continuous crystal growth would result in huge energy savings for the industry due to the higher utilization of materials.
• Advanced Polysilicon Production. This technology reduces hydrogen and other contaminants in deposited silicon film while increasing system throughput. The reduced hydrogen content in the polysilicon precursor film enables rapid conversion of the film into polysilicon. These polysilicon systems reduce particles and process contamination and dramatically extend the lifetime of process chamber components and the time between "wet cleans", thus reducing overall O&M costs.
• Cleanrooms. Microelectronic component manufacture must take place in a cleanroom environment. While the majority of the energy used in cleanrooms is attributed to motors, there are specific advanced cleanroom technologies that can significantly reduce the energy consumption in these facilities. Many laboratories have multiple hoods, and it is common for the fume hoods to “drive” the required air changes (100 percent outside air) in laboratory facilities. Therefore, fume hoods are a major factor in making the typical laboratory four to five times more energy intensive

22
than typical commercial buildings. Large quantities of energy are required to move and condition the supply and exhaust air. As 100 percent outside air is used to make up the exhaust, heating and air-conditioning loads are substantial when the outside air temperature is at a minimum or maximum. The state-of-the-art in energy efficient fume hood design uses sophisticated controls on the hood and in the supply and exhaust air streams to provide a constant “face velocity” while varying the air volume.
4.3.3. Hi-Tech Program Recommendations
The number, size and output of microelectronics and silicon production facilities are projected to grow significantly in Oregon. These facilities have high energy use and high capital equipment costs. One of the keys to fostering energy efficiency improvements in this sector is to encourage adoption of energy-saving technologies early in the design process of a new process line or facility. Since most hi-tech facility processes have an effective life of only 18-36 months, retrofit improvements will most likely never be implemented. The Northwest Energy Efficiency Alliance has had success working with electronics manufacturers by forming partnerships. An example of one of these partnerships was a “design charrette” for an existing electronics fabrication line ("fab")—an intensive workshop where a project design is subjected to an intensive “out of the box” review and brainstorming session—held with Hewlett Packard (H-P). The charrette was the first step in an integrated design process and has been successfully used to introduce innovative efficiency options in the commercial and industrial sectors. This project facilitated the charette for H-P’s fab renovation, which resulted in the identification of a number of energy-saving opportunities. These options where presented to H-P and the company’s design firm. The Alliance has also had success in encouraging adoption of energy-efficient technologies in the areas of silicon growing and HVAC.
Table 4.5. Hi-Tech Subsector-Specific Measures
Measure Name Incre- mental Cost
($/Unit)
O&M Cost ($/Yr)
Cost of Saved Energy($/kWh)
Year 10 Savings (aMW)
Electronics Continuous Melt Silicon 23.071 0 2.401 26.780 Electronics Polysilicon -0.193 0 -0.020 16.068 Electronics Adv Clean Room HVAC 0.139 0 0.006 11.521
Total 54.369
Because of the industry-specific nature of the electric efficiency opportunities, it is important to develop a program targeted specifically at hi-tech facilities. The Northwest Alliance has had a program targeted at this industry for several years. The marketing for this program has been conducted primarily through industry group meetings, publications such as Semiconductor Fabtech, and partnerships with utilities, technology vendors, and end-users.

23
The hi-tech subsector is a high priority for Oregon. Encouraging energy-efficiency in the hi-tech subsector has been a historically difficult task, since the ratio of energy costs to the value of product shipments is relatively low. Many manufacturers have been concerned with establishing new product lines and facilities as quickly as possible, with little concern for energy consumption. The current lull in the hi-tech market however, presents a great opportunity for the energy-efficiency community. Manufacturers are more likely to consider the benefits of energy-efficient equipment and practices in an effort to make their facilities more cost-effective. The energy saving opportunities in this subsector are considerable, and the growth rate of the subsector will provide many future efficiency opportunities as new facilities are built.
4.4. Agriculture and Food Products Subsector
The agricultural and food manufacturing subsectors together consume more than 15 percent of the total electricity used in the industrial sector in the Energy Trust service territory. These industries are evolving, trending towards more food processing being done on farms. For that reason, the agriculture and food products sectors are approached together in our analysis.
In food processing, the most significant sub-groups are fruits and vegetables, dairy, and bakeries, with the fruit and vegetables dominating the values of shipments from Oregon (Census 2000). Similarly, the most important Oregon agricultural products (USDA 2000) are, in order of value of shipments:
• Cattle and calves • Fruits and Vegetables • Nurseries and greenhouses • Dairy
Based on this, it is clear that the fruit and vegetable and dairy groups are among the most important combined agriculture and food groups.
4.4.1. Agricultural and Food Products Energy Use
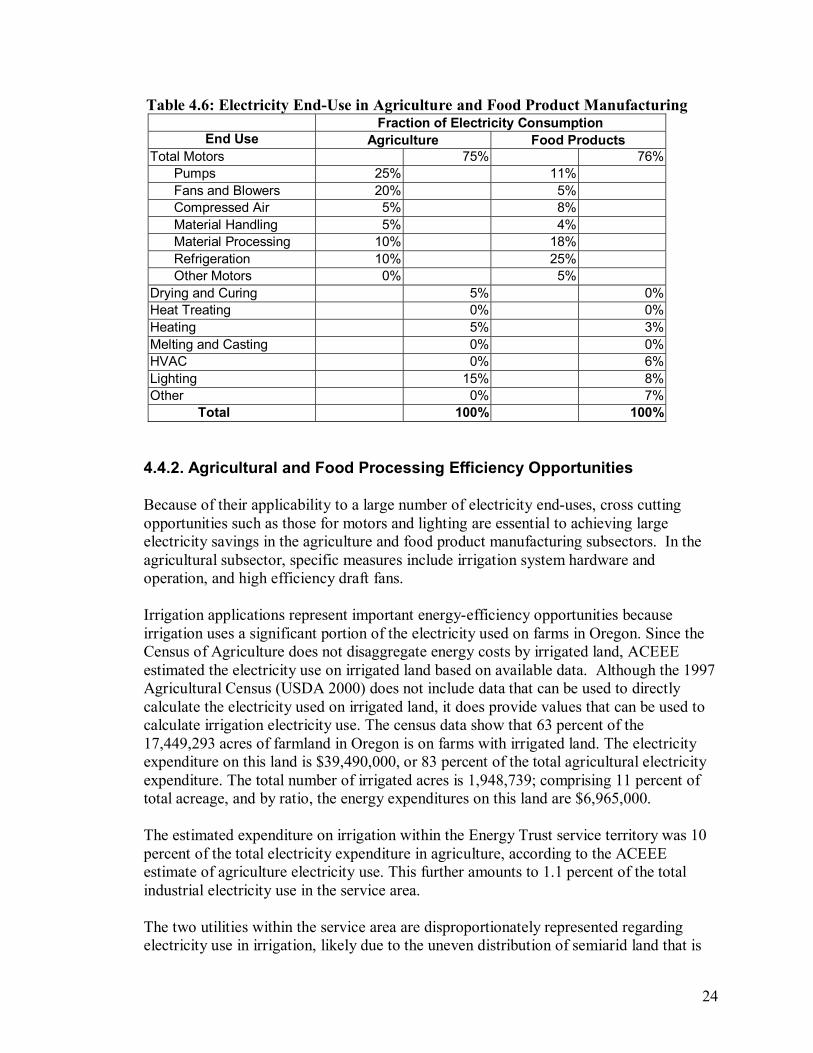
The pattern of electricity end-use in the agriculture and food processing industries is described in Table 4.6. Motors account for 75 and 76 percent of total electricity consumption in the agricultural and food subsectors, respectively. Lighting is secondary, but still accounts for 15 percent of agriculture electricity consumption and 8 percent of consumption in food processing. Among the motor loads, pumps, process motors and refrigeration are among the most important. In addition, fans represent an important agricultural application. A significant fraction of the agricultural pumping is used by irrigation systems.
24
Table 4.6: Electricity End-Use in Agriculture and Food Product Manufacturing Fraction of Electricity Consumption
End Use Agriculture Food Products Total Motors 75% 76%
Pumps 25% 11% Fans and Blowers 20% 5% Compressed Air 5% 8% Material Handling 5% 4% Material Processing 10% 18% Refrigeration 10% 25% Other Motors 0% 5%
Drying and Curing 5% 0%Heat Treating 0% 0%Heating 5% 3%Melting and Casting 0% 0%HVAC 0% 6%Lighting 15% 8%Other 0% 7%
Total 100% 100%
4.4.2. Agricultural and Food Processing Efficiency Opportunities
Because of their applicability to a large number of electricity end-uses, cross cutting opportunities such as those for motors and lighting are essential to achieving large electricity savings in the agriculture and food product manufacturing subsectors. In the agricultural subsector, specific measures include irrigation system hardware and operation, and high efficiency draft fans.
Irrigation applications represent important energy-efficiency opportunities because irrigation uses a significant portion of the electricity used on farms in Oregon. Since the Census of Agriculture does not disaggregate energy costs by irrigated land, ACEEE estimated the electricity use on irrigated land based on available data. Although the 1997 Agricultural Census (USDA 2000) does not include data that can be used to directly calculate the electricity used on irrigated land, it does provide values that can be used to calculate irrigation electricity use. The census data show that 63 percent of the 17,449,293 acres of farmland in Oregon is on farms with irrigated land. The electricity expenditure on this land is $39,490,000, or 83 percent of the total agricultural electricity expenditure. The total number of irrigated acres is 1,948,739; comprising 11 percent of total acreage, and by ratio, the energy expenditures on this land are $6,965,000.
The estimated expenditure on irrigation within the Energy Trust service territory was 10 percent of the total electricity expenditure in agriculture, according to the ACEEE estimate of agriculture electricity use. This further amounts to 1.1 percent of the total industrial electricity use in the service area.
The two utilities within the service area are disproportionately represented regarding electricity use in irrigation, likely due to the uneven distribution of semiarid land that is

25
farmed in the two territories. PacifiCorp’s territory includes some of the major irrigated farming regions of Oregon. The expenditures on irrigation electricity in PacifiCorp's territory therefore reflect 98 percent of the total irrigation electricity expenditures in the Energy Trust territory. On the opposite end of the spectrum is PGE, which claims only 2 percent of the total irrigation expenditures in the Energy Trust territory.
Irrigation represents a tenth of the total electricity expenditures in agriculture in the Energy Trust service territory, so any significant decrease in agricultural electricity used by pumps and motors would provide a noticeable reduction in overall demand. Resource efficiency efforts for irrigation in the past have focused largely on improving the efficiency of water use. Electricity savings have been achieved as a byproduct of these efforts to improve water use efficiency, as the electricity used in irrigation is directly proportional to water use. The Northwest Alliance has sponsored two related programs that have been successful in increasing efficiency in irrigation. Scientific Irrigation Scheduling (SIS) is a group of techniques that create a more efficient way to irrigate soil. This program includes elements such as farmer education, application of irrigation management equipment, and irrigation management services. One piece of SIS is irrigation monitoring equipment The Alliance is in the process of marketing a simplified monitoring device. The program involves the use of soil moisture data loggers, which are easy-to-use soil monitors that measure water content in soil to alert farmers when the soil needs irrigation. This measure reduces both water and electricity use for irrigation by about 15 percent.
The Alliance implemented a market penetration program for SIS in the late 1990s. The Alliance contracted with Research into Action, Inc. to review the success of the programs that implemented SIS measures in the Northwest. The report found that there are an increasing number of consultants that offer SIS services, an indicator that the program is becoming more "mainstream". Also, the review of the program indicated that more individual farmers are choosing to adopt SIS. Overall, the programs from the Alliance have created a market for SIS in the region. It currently appears that while certain aspects of SIS would benefit from further support in order to enter the mainstream market, SIS-type measures have their own momentum in the market. In addition, irrigation pump maintenance and optimization initiatives have been implemented over the years in the Northwest. Some of the oldest programs in California have been running since the 1930s. These programs focus on encouraging irrigation pump maintenance and optimum pump sizing. These pump hardware-related programs have the added benefit of identifying equipment on the verge of failure, thus reducing maintenance costs. Advice is also provided on piping design and selection, and in the selection of more efficient nozzles that can further reduce energy use while improving irrigation system performance.

26
Agricultural ventilation fans were identified as a significant opportunity in the late 1970s by Mid-Western energy efficiency programs. These fans are used extensively in livestock confinement structures and in greenhouses, the latter being an increasingly important agricultural subsector in the Energy Trust territory. For the most part, fans used in these facilities are axial fans, with the least expensive type of fans using sheet metal blades while more expensive models use cast aluminum airfoil blades. The airfoil fans are much more efficient than their inexpensive siblings, and are cost-effective in most applications. Lack of awareness of the energy-saving potential of airfoil fans, and concerns over the higher first-cost of these units, appear to be the major barriers to adoption of these more efficient fans.
Improvements in refrigeration for cooling and storage are important measures, as they have applicability to both food processing and on-farm fruit and produce processing facilities. Industrial refrigeration improvement measures cover several aspects of cooling, including improved-efficiency fan coils, motors, compressors, and fluids. Refrigeration in the food sector is a large energy consumer and is mainly used for freezing or cooling of meat, fruit, and vegetables, and for production of frozen food products (for example, ice-cream and juice concentrates). Refrigeration in industry is accomplished primarily by means of compression cooling, and in some cases by absorption cooling. Technical improvements in this area include thermal storage systems, a reduction of refrigerant charges and the development of new refrigeration working fluids.
4.4.3. Agriculture Program Recommendations
Programs in the agricultural and food-processing subsectors should be focused on specific market segments, bundling a broad range of cross cutting and subsector-specific measure offerings. Because these subsectors tend to be made up of relatively small customers, it is important to partner with existing service providers. These providers, which can include farmer cooperatives, local agricultural extension services, agricultural supply centers and industry associations, have existing relationships with customers that allow them to bundle energy efficiency measures with other services. In addition, these organizations have credibility with the farmers and so are much more effective in delivering programs than are “new” energy efficiency program providers.
Among the sector-specific measures, agricultural fans provide a classic market transformation program opportunity. Under pressure from Midwest efficiency programs, the Air Movement and Control Association (AMCA) established a testing and labeling program reporting the efficiency of the agricultural fans on the market. This AMCA standard and label can serve as the basis for an awareness campaign. It can be paired with a motor management and electric system tune-up opportunity to maximize savings.
For the irrigation-specific measures, the Northwest Alliance has already gained significant experience with the irrigation market. There may be some opportunities for greater program efficiency by bundling measures for this market.

27
Similar to the agricultural sector, partnering with food processor groups is an effective strategy for delivering programs to this group of relatively small electricity customers. Because the one subsector-specific measure described above provides fairly modest energy-efficiency opportunities, it will be important to offer a broad range of cross cutting measures to achieve significant benefits. Further research into the structure of this market and its relationship to the fruit and produce markets may reveal additional program synergies.
Table 4.7. Agricultural and Food Sector Specific Measures
Measure Name Incre- mental Cost
($/Unit)
O&M Cost ($/Yr)
Cost of Saved Energy($/kWh)
Year 10 Savings (aMW)
Irrigation Pump Systems 0.184 -0.010 0.007 8.040 Hi Efficiency Barn Draft Fans 0 0 .00004 10.594 Irrigation Water Management 0.179 0.067 0.074 3.405 Food Processing Cooling & Storage 0.004 -0.021 -0.013 0.920
Total 22.959
The customers in the agricultural and food products industries tend to be smaller-volume electricity consumers, so managing program cost will be a significant issue. As a result, it will be critical to achieve strategic delivery partnerships so that delivery costs can be shared with the delivery of other services. With respect to the subsector-specific measures, the irrigation programs have been effective in delivering these measures, but have proven to be labor-intensive, reducing their cost-effectiveness.
The food processing represents an important target market for the Energy Trust, particularly for the delivery of cross cutting measures. The potential in the agricultural subsector will be more difficult to realize because of the relatively low per-customer on-farm energy use in this subsector (relative to other industrial subsectors), so the focus should be on the development of partnerships with other groups rather than on development of direct delivery infrastructure.
4.5. Wood Products and Paper
Historically, the wood products and paper industries in Oregon have been based on the use of virgin materials, much of it old growth timber. With the depletion of available timber resources, and a national decline in wood products prices, output levels of both industries have declined in Oregon. It appears unlikely that either wood or paper production will recover significantly in the foreseeable future. Wood products manufacturing and paper manufacturing are both projected to continue to decline. However, the secondary paper industry, based on the use of recycled feedstock, appears healthy and will likely account for much or all of the future growth in these industries. Newsprint is the principal product of this secondary industry. The majority of this growth is attributed to Georgia Pacific Camas Mill in Camas, Washington. This

28
newsprint mill is actually within the Oregon service territory and has been included in the analysis.
Wood products and paper manufacturing are among the most motor-intensive of the manufacturing industries, with motors accounting for 75 and 80 percent of total electricity consumption respectively (Table 4.8). Improvements in motors and motor systems represent the most important efficiency opportunities in these industries. In particular, pump system optimization has proven to offer significant opportunities in the paper industry (Xenergy 1998). The industry-specific measures identified in this analysis all offer significant non-energy benefits as well as primary energy savings, but involve fuel switching from steam to electricity, so are outside the scope of this assessment (Martin, et al. 2000). Table 4.8. Electricity End-Use in Wood Products and Paper Manufacturing Fraction of Electricity Consumption Wood Products Paper Mfg Total Motors 75% 80% Pumps 4% 28% Fans and Blowers 10% 16% Compressed Air 2% 6% Material Handling 33% 6% Material Processing 26% 17% Other Motors 0% 7% Drying and Curing 6% 2%HVAC 6% 3%Lighting 7% 4%Other 6% 11%
Total 100% 100%
4.5.1. Wood Products and Paper Program Recommendations
With the current market uncertainty in these sectors, the most appropriate program approach may be to promote a package of cross cutting measures in cooperation with regional associations, such as the Technical Association of the Pulp and Paper Industry (TAPPI). The identification or development of appropriate sector case studies would be a useful element of such a program. A subsector to target is the recycled newsprint industry, which is healthier and even more electric- and motor-intensive than the rest of the sector.
As a result of the current depressed wood products and paper markets, it is unlikely that there will be significant new capital investment in these sectors in Oregon in the near future. The likely impacts of energy-efficiency programs may be more modest than in other sectors because of the facilities' reduced ability to implement energy-efficiency measures while the subsector is in decline.
29
4.6. Industrial Sector Conclusions and Recommendations
For the industrial sector, continuity and persistence are key features of successful energy saving programs. Experience indicates that, for most projects, intervals between initial program contact and implementation average between three and five years. Therefore, it is important for the program to continue through at least a five-year period. Multi-year programs also allow time for relationship and trust building between the program and industry teams, a quality necessary for successful programs.
Accomplishing these goals frequently involves partnering on low-risk measures such as lighting, and then evolving to projects that have greater potential process impacts. Thus, the program should have a range of offerings that will be appropriate for different phases of the relationship (Elliott, Pye and Nadel 1996). In addition, the program offering will need to be different for various sized companies. Large companies are more likely to make use of higher-level services, already having basic measures in place, while smaller firms may need simpler, less complex offerings. For the smaller firms, this is because their opportunities are more basic, and because the magnitude of the savings at these facilities is smaller and less program expenditure can be justified (Shipley, Elliot and Hinge 2002).
It is also important to integrate program offerings and develop an integrated delivery strategy. Customers appreciate a single point of contact, and experience indicates that the development of a relationship with a program representative is an important factor leading to implementation of projects (Elliot, Pye and Nadel 1996).
4.6.1. Limitations & Barriers
The major challenge faced in developing industrial efficiency programs is the development of the infrastructure and relationships between program and facility staff. Successful programs, such as the NYSERDA’s FlexTech program, have identified technical expertise in the targeted region, and developed a network of private consultants that support the program. For basic program offerings such as motor management and compressed air, extensive program experience is available both in-region and at the national level. For motor system optimization and industrial lighting design, where access to experienced engineers and designers are more critical, the identification and/or development of the support network will require time and effort, and limited savings are likely to be realized initially.
5. Commercial Sector Resource Assessment Results A list of the recommended commercial measures, prioritized by the cost of saved energy, is provided in Table 5.1. This list presents individual measures, with costs and benefits expressed on a per unit (for example, per device or per square foot of floor area) basis.

30
Table 5.1a. Prioritized List of Measures for New Commercial Construction
Measure Name Cost
Cost/Svgs Unit
Cost Basis
O&M Cost ($/Yr)
Cost of Saved Energy ($/kWh)
Year 10 Savings (aMW)
Status
LED Traffic Signals (Green)
150.00 $/Each Capital -30.00 -0.0630 0.823 Exist
LED Walk/Don't Walk Signals
220.00 $/Each Capital -30.00 -0.0335 0.655 Emerg
Transformers (TP 1-rated)
4.42 $/kVa Increm 0.00 0.0048 0.090 Exist
HVAC–Chiller (Large Bldgs)
0.05 $/SF Increm 0.00 0.0062 0.334 Exist
Windows (Punched/U=.4)
0.09 $/SF Increm 0.00 0.0074 0.177 Exist
Refrig-Super Market Displays
22.26 $/MWh Increm 0.00 0.0082 0.265 Exist
HVAC- Distribution Zone Fans (Large Bldgs)
0.10 $/SF Increm 0.00 0.0083 1.809 Exist
Windows (Punched/U=.35)
0.14 $/SF Increm 0.00 0.0092 0.260 Exist
Refrig-Lo Cost Bev & Cooler
29.04 $/MWh Increm 0.00 0.0098 0.164 Exist
Lighting- Integrated fixtures & controls
50.00 $/MWh Increm 0.01 0.0102 1.141 Exist
Hot Water- Wastewater Heat Exchanger
5,000.00 $/Each Increm 0.00 0.0118 0.249 Exist
Refrig-Icemakers & Vending
27.65 $/MWh Increm 0.00 0.0125 0.023 Exist
Lighting- Advanced fixtures & lamps
50.00 $/MWh Increm 0.00 0.0152 0.507 Exist
Refrig- Walk-in Coolers/Freezers
53.37 $/MWh Increm 0.00 0.0160 0.380 Exist
Hot Water- Computerized controls
3,000.00 $/Each Increm 0.00 0.0177 0.046 Exist
HVAC-Packaged AC (3 ton)
0.06 $/SF Increm 0.00 0.0188 0.151 Exist
Lighting- Daylighting 300.00 $/MWh Increm 0.00 0.0199 1.796 Exist Washing Machines 659.00 $/Each Increm 0.00 0.0203 0.005 Exist HVAC-Heat Pump Loop (Large Bldgs)
0.25 $/SF Increm 0.00 0.0206 0.246 Exist
Refrig-Hi Cost Bev & Cooler
80.38 $/MWh Increm 0.00 0.0208 0.214 Exist
HVAC- Enhanced HP loop
0.85 $/SF Increm 0.00 0.0211 1.332 Exist
Computer Mgmt (EZ Conserve)
20.00 $/Each Capital 0.00 0.0229 0.551 Exist
HVAC- ASD Central Fans (Large Bldgs)
0.25 $/SF Increm 0.00 0.0248 0.403 Exist

31
Commission-Controls&Train
0.25 $/SF Increm 0.00 0.0273 5.084 Exist
HVAC- ASD Central Pumps (Large Bldgs)
0.25 $/SF Increm 0.00 0.0310 0.200 Exist
HVAC-Packaged AC (7.5 ton)
0.07 $/SF Increm 0.00 0.0358 0.093 Exist
HVAC- Integrated design
3.00 $/SF Increm 0.00 0.0372 17.393 Exist
HVAC-Packaged AC (15 ton)
0.12 $/SF Increm 0.00 0.0377 0.158 Exist
Heat Pump Water Heater
12,419.63 $/Each Increm 72.01 0.0395 0.203 Emerging
HVAC-Packaged AC (25 ton)
0.25 $/SF Increm 0.00 0.0437 0.480 Exist
HVAC- Underfloor delivery
2.00 $/SF Increm 0.00 0.0444 2.466 Exist
Windows (Curtain/U=.4)
0.74 $/SF Increm 0.00 0.0478 2.294 Exist
Commission- Lighting Schedule & Controls
0.25 $/SF Increm 0.00 0.0523 2.421 Exist
Commissioning- HVAC 0.65 $/SF Increm 0.00 0.0531 4.842 Exist Energy Mgmt System-Fast Food Restaurants
13,070.00 $/Each Increm 800.00 0.0555 0.044 Exist
Solar Hot Water Heater
41,912.93 $/Each Increm 250.00 0.0724 0.201 Exist
EStar Computer Monitor
200.00 $/Each Increm 0.00 0.4101 0.440 Exist
Total: 47.940 Note: Measures in grayed rows were not found to be cost-effective. Table 5.1b. Prioritized List of Measures for Existing Commercial Construction
Measure Name Cost
Cost/Svgs Unit
Cost Basis
O&M Cost ($/Yr)
Cost of Saved Energy ($/kWh)
Year 10 Savings (aMW)
Status
LED Traffic Signals (Green)
150.00 $/Each Increm -30.00 -0.0630 0.823 Exist
LED Walk/Don't Walk Signals
220.00 $/Each Increm -30.00 -0.0335 0.655 Exist
LED Exit Signs 85.00 $/MWh Capital -10.86 -0.0193 4.689 Exist HVAC Chiller System Optimization
1,352.36 $/Each 0.00 0.0048 1.996 Exist
Transformers (TP 1-rated)
4.42 $/kVa Increm 0.00 0.0048 3.196 Exist
Wastewater Pump and aeration optimization
18.76 $/Each Increm 0.00 0.0100 63.027 Exist
Windows (Punched/U=.4)
0.09 $/SF Increm 0.00 0.0074 0.647 Exist

32
Wastewater motors
2.63 $/Each Increm 0.00 0.0100 10.756 Exist
Refrig- Super Market Displays
22.26 $/MWh Increm 0.00 0.0082 4.885 Exist
Windows (Punched/U=.35)
0.14 $/SF Increm 0.00 0.0092 0.950 Exist
Refrig-Lo Cost Bev & Cooler
0.00 $/MWh Increm 0.00 0.0098 3.379 Exist
Small ECM fans 0.10 $/SF Increm 0.00 0.0099 20.961 Exist Lighting-Super T-8 37.82 $/MWh Increm 0.00 0.0102 17.295 Exist Wastewater Heat Exchanger
5,000.00 $/Each Increm 0.00 0.0118 0.115 Exist
HVAC System/Ducts Svc-Restaurant
0.70 $/SF Increm 0.00 0.0121 0.300 Exist
Refrig- Ice makers & vending
0.00 $/MWh Increm 0.00 0.0125 0.415 Exist
HVAC System/Ducts Svc-Schools
0.24 $/SF Increm 0.00 0.0136 0.317 Exist
Lighting-Advanced Technologies
72.50 $/MWh Increm 0.00 0.0143 19.984 Exist
Refrig- Walk-in Coolers/Freezers
0.00 $/MWh Increm 0.00 0.0160 6.968 Exist
Hot Water- Computerized controls
3,000.00 $/Each Increm 0.00 0.0177 0.268 Exist
HVAC System/Ducts Svc-Retail
0.34 $/SF Increm 0.00 0.0182 0.956 Exist
HVAC-Packaged AC (3 ton)
0.06 $/SF Increm 0.00 0.0188 0.352 Exist
Washing Machines 659.00 $/Each Increm 0.00 0.0204 3.189 Exist Refrig-Hi Cost Bev & Cooler
0.00 $/MWh Increm 0.00 0.0208 4.415 Exist
Small DX Tune Up- New economizer
0.59 $/SF Increm 0.01 0.0233 10.082 Exist
Computer Mgmt (EZ Conserve)
20.00 $/Each Capital 0.00 0.0253 0.000 Exist
Small DX Tune Up- Economizer controls
0.24 $/SF Increm 0.01 0.0282 39.470 Exist
HVAC- Chillers 18,000.00 $/Each Increm 0.00 0.0299 1.823 Exist HVAC-Packaged AC (7.5 ton)
0.07 $/SF Increm 0.00 0.0358 0.217 Exist
HVAC-Packaged AC (15 ton)
0.12 $/SF Increm 0.00 0.0377 0.368 Exist
Energy Mgmt System (Fast Food)
13,070.00 $/Each Increm 800.00 0.0392 1.295 Exist
Heat Pump Water Heater
12,419.63 $/Each Increm 72.01 0.0395 0.997 Emerging
Small DX Tune Up- Thermostat
0.15 $/SF Increm 0.01 0.0435 5.049 Exist
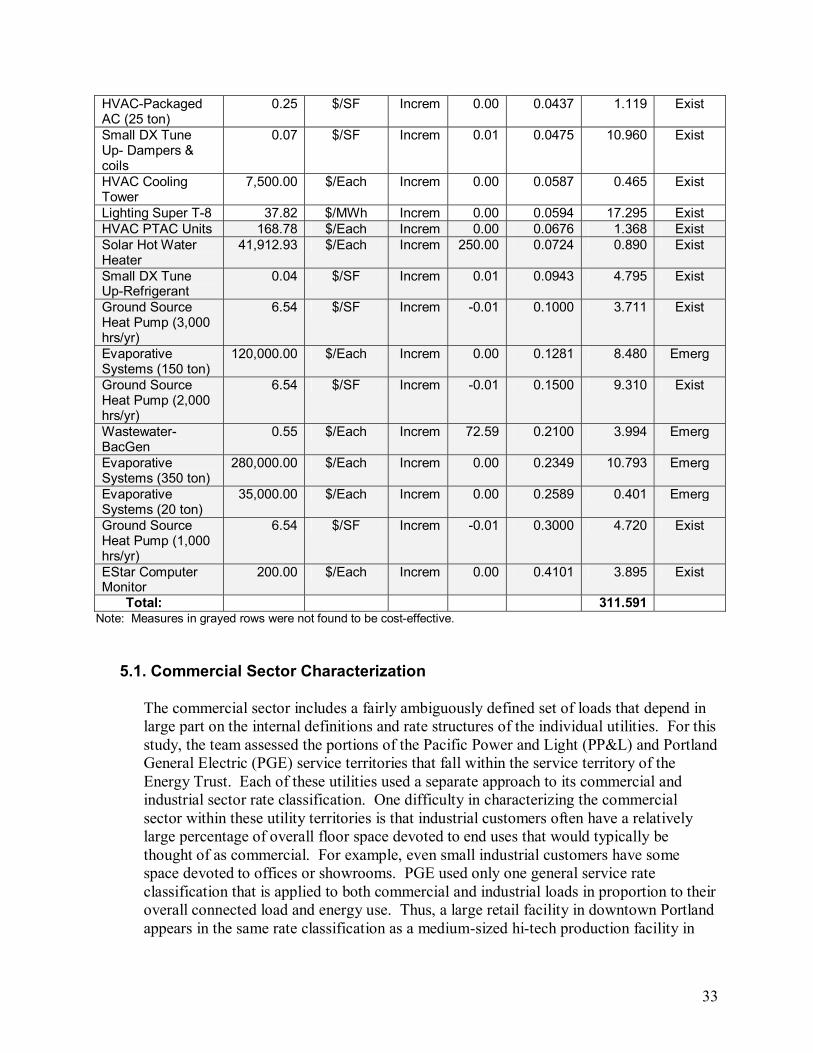
33
HVAC-Packaged AC (25 ton)
0.25 $/SF Increm 0.00 0.0437 1.119 Exist
Small DX Tune Up- Dampers & coils
0.07 $/SF Increm 0.01 0.0475 10.960 Exist
HVAC Cooling Tower
7,500.00 $/Each Increm 0.00 0.0587 0.465 Exist
Lighting Super T-8 37.82 $/MWh Increm 0.00 0.0594 17.295 Exist HVAC PTAC Units 168.78 $/Each Increm 0.00 0.0676 1.368 Exist Solar Hot Water Heater
41,912.93 $/Each Increm 250.00 0.0724 0.890 Exist
Small DX Tune Up-Refrigerant
0.04 $/SF Increm 0.01 0.0943 4.795 Exist
Ground Source Heat Pump (3,000 hrs/yr)
6.54 $/SF Increm -0.01 0.1000 3.711 Exist
Evaporative Systems (150 ton)
120,000.00 $/Each Increm 0.00 0.1281 8.480 Emerg
Ground Source Heat Pump (2,000 hrs/yr)
6.54 $/SF Increm -0.01 0.1500 9.310 Exist
Wastewater-BacGen
0.55 $/Each Increm 72.59 0.2100 3.994 Emerg
Evaporative Systems (350 ton)
280,000.00 $/Each Increm 0.00 0.2349 10.793 Emerg
Evaporative Systems (20 ton)
35,000.00 $/Each Increm 0.00 0.2589 0.401 Emerg
Ground Source Heat Pump (1,000 hrs/yr)
6.54 $/SF Increm -0.01 0.3000 4.720 Exist
EStar Computer Monitor
200.00 $/Each Increm 0.00 0.4101 3.895 Exist
Total: 311.591 Note: Measures in grayed rows were not found to be cost-effective.
5.1. Commercial Sector Characterization
The commercial sector includes a fairly ambiguously defined set of loads that depend in large part on the internal definitions and rate structures of the individual utilities. For this study, the team assessed the portions of the Pacific Power and Light (PP&L) and Portland General Electric (PGE) service territories that fall within the service territory of the Energy Trust. Each of these utilities used a separate approach to its commercial and industrial sector rate classification. One difficulty in characterizing the commercial sector within these utility territories is that industrial customers often have a relatively large percentage of overall floor space devoted to end uses that would typically be thought of as commercial. For example, even small industrial customers have some space devoted to offices or showrooms. PGE used only one general service rate classification that is applied to both commercial and industrial loads in proportion to their overall connected load and energy use. Thus, a large retail facility in downtown Portland appears in the same rate classification as a medium-sized hi-tech production facility in
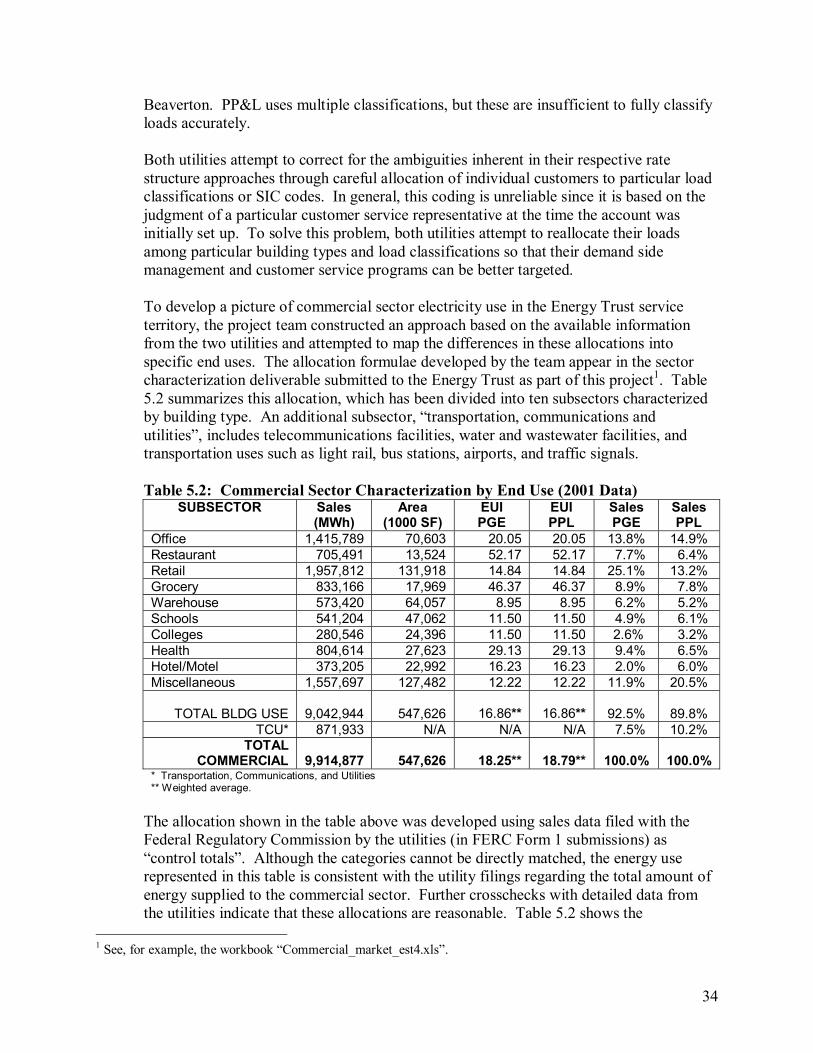
34
Beaverton. PP&L uses multiple classifications, but these are insufficient to fully classify loads accurately.
Both utilities attempt to correct for the ambiguities inherent in their respective rate structure approaches through careful allocation of individual customers to particular load classifications or SIC codes. In general, this coding is unreliable since it is based on the judgment of a particular customer service representative at the time the account was initially set up. To solve this problem, both utilities attempt to reallocate their loads among particular building types and load classifications so that their demand side management and customer service programs can be better targeted.
To develop a picture of commercial sector electricity use in the Energy Trust service territory, the project team constructed an approach based on the available information from the two utilities and attempted to map the differences in these allocations into specific end uses. The allocation formulae developed by the team appear in the sector characterization deliverable submitted to the Energy Trust as part of this project1. Table 5.2 summarizes this allocation, which has been divided into ten subsectors characterized by building type. An additional subsector, “transportation, communications and utilities”, includes telecommunications facilities, water and wastewater facilities, and transportation uses such as light rail, bus stations, airports, and traffic signals.
Table 5.2: Commercial Sector Characterization by End Use (2001 Data)
SUBSECTOR Sales (MWh)
Area (1000 SF)
EUI PGE
EUI PPL
Sales PGE
Sales PPL
Office 1,415,789 70,603 20.05 20.05 13.8% 14.9% Restaurant 705,491 13,524 52.17 52.17 7.7% 6.4% Retail 1,957,812 131,918 14.84 14.84 25.1% 13.2% Grocery 833,166 17,969 46.37 46.37 8.9% 7.8% Warehouse 573,420 64,057 8.95 8.95 6.2% 5.2% Schools 541,204 47,062 11.50 11.50 4.9% 6.1% Colleges 280,546 24,396 11.50 11.50 2.6% 3.2% Health 804,614 27,623 29.13 29.13 9.4% 6.5% Hotel/Motel 373,205 22,992 16.23 16.23 2.0% 6.0% Miscellaneous 1,557,697 127,482 12.22 12.22 11.9% 20.5%
TOTAL BLDG USE 9,042,944 547,626
16.86**
16.86** 92.5% 89.8% TCU* 871,933 N/A N/A N/A 7.5% 10.2%
TOTAL COMMERCIAL 9,914,877 547,626
18.25**
18.79** 100.0% 100.0%
* Transportation, Communications, and Utilities ** Weighted average.
The allocation shown in the table above was developed using sales data filed with the Federal Regulatory Commission by the utilities (in FERC Form 1 submissions) as “control totals”. Although the categories cannot be directly matched, the energy use represented in this table is consistent with the utility filings regarding the total amount of energy supplied to the commercial sector. Further crosschecks with detailed data from the utilities indicate that these allocations are reasonable. Table 5.2 shows the
1 See, for example, the workbook “Commercial_market_est4.xls”.
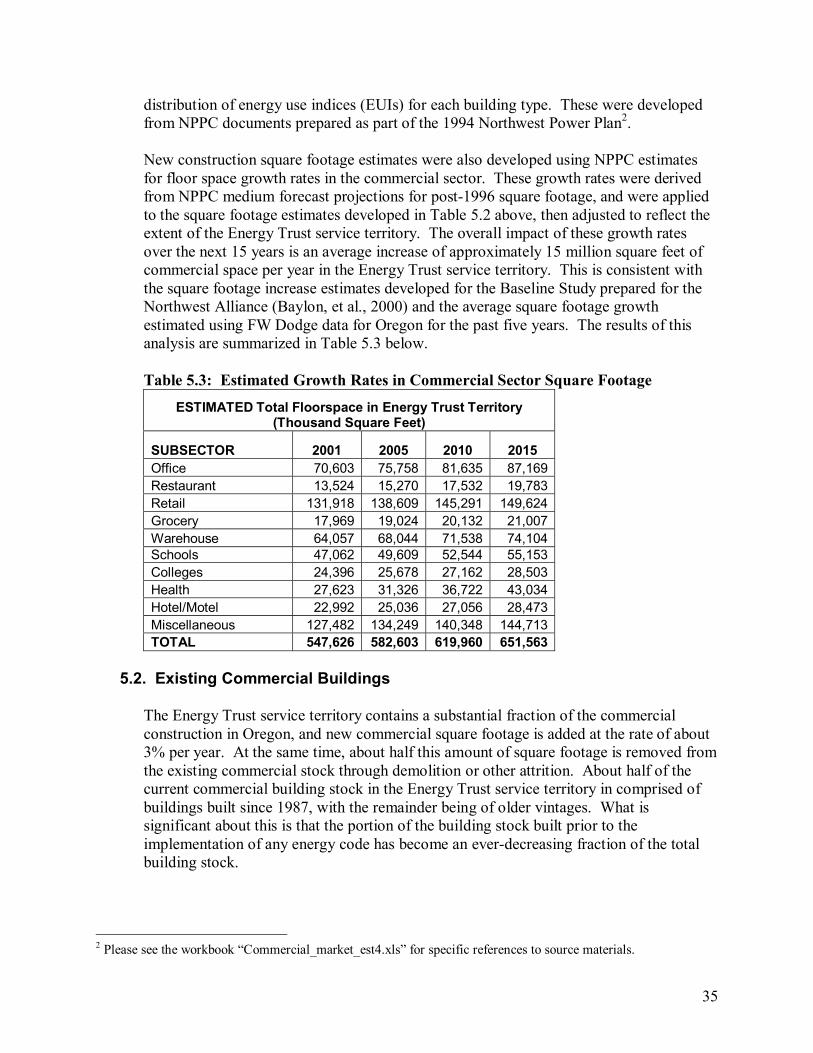
35
distribution of energy use indices (EUIs) for each building type. These were developed from NPPC documents prepared as part of the 1994 Northwest Power Plan2.
New construction square footage estimates were also developed using NPPC estimates for floor space growth rates in the commercial sector. These growth rates were derived from NPPC medium forecast projections for post-1996 square footage, and were applied to the square footage estimates developed in Table 5.2 above, then adjusted to reflect the extent of the Energy Trust service territory. The overall impact of these growth rates over the next 15 years is an average increase of approximately 15 million square feet of commercial space per year in the Energy Trust service territory. This is consistent with the square footage increase estimates developed for the Baseline Study prepared for the Northwest Alliance (Baylon, et al., 2000) and the average square footage growth estimated using FW Dodge data for Oregon for the past five years. The results of this analysis are summarized in Table 5.3 below.
Table 5.3: Estimated Growth Rates in Commercial Sector Square Footage
ESTIMATED Total Floorspace in Energy Trust Territory (Thousand Square Feet)
SUBSECTOR 2001 2005 2010 2015 Office 70,603 75,758 81,635 87,169 Restaurant 13,524 15,270 17,532 19,783 Retail 131,918 138,609 145,291 149,624 Grocery 17,969 19,024 20,132 21,007 Warehouse 64,057 68,044 71,538 74,104 Schools 47,062 49,609 52,544 55,153 Colleges 24,396 25,678 27,162 28,503 Health 27,623 31,326 36,722 43,034 Hotel/Motel 22,992 25,036 27,056 28,473 Miscellaneous 127,482 134,249 140,348 144,713 TOTAL 547,626 582,603 619,960 651,563
5.2. Existing Commercial Buildings
The Energy Trust service territory contains a substantial fraction of the commercial construction in Oregon, and new commercial square footage is added at the rate of about 3% per year. At the same time, about half this amount of square footage is removed from the existing commercial stock through demolition or other attrition. About half of the current commercial building stock in the Energy Trust service territory in comprised of buildings built since 1987, with the remainder being of older vintages. What is significant about this is that the portion of the building stock built prior to the implementation of any energy code has become an ever-decreasing fraction of the total building stock.
2 Please see the workbook “Commercial_market_est4.xls” for specific references to source materials.
36
Buildings constructed after 1994 represent approximately 30 percent of commercial building area in current use in the Energy Trust service territory. This group of buildings was constructed after the advent of significant energy code enforcement. Buildings built prior to 1995 are the stock from which significant retrofit opportunities can be drawn. For example, the implementation of the current energy code in Oregon increased the stringency of the lighting requirements in the Oregon building stock by about 30% over previous practice. Buildings with lighting systems built to this standard are not good candidates for a cost-effective lighting retrofit (although they may be candidates for some of the advanced lighting technologies). However, there are still lighting control opportunities in these newer buildings.
In older buildings, opportunities for replacing existing lighting and HVAC equipment exist. These opportunities arise largely as tenant occupancy or building use changes occur over the building’s natural lifetime, and are discussed in the following sections on retrofits to existing commercial buildings. While these end use changes do not necessarily result in changes to energy using features, they do represent an opportunity to influence building owners, operators and designers to improve the lighting, HVAC and envelope systems. In other situations, the current energy using features of the building are so inefficient that a retrofit can be cost justified either by the building owner or by the Energy Trust. In these cases, the cost-effectiveness is reduced, but the building efficiency is upgraded long before the building would otherwise be upgraded or demolished.
To evaluate energy conservation and energy efficiency opportunities in existing commercial buildings, we focused on three main categories of measures that could be grouped in programmatic ways that maximize savings while minimizing administration and overhead expenses. In addition, we reviewed individual measures for appliances, building envelope, and energy management. The primary categories we examined include:
1. Lighting Systems. The goal was to describe individual technologies that can replace
existing systems on a one-for-one basis, either as part of an ongoing tenant improvement or as a major retrofit. These measures can have a substantial impact on overall lighting power density (LPD). Other opportunities with more limited impacts involve daylighting and controls. These latter measures are often more difficult and expensive to introduce into older buildings than can be justified by the energy savings.
2. HVAC Systems. Our effort has been focused on describing the turnover in these
systems. Our analysis assumes that an existing, worn out piece of equipment is replaced with new and more efficient equipment that exceeds not only the efficiency of the existing system but also the current code efficiency requirements. This is taken as an improved percentage in the efficiency rating of specific equipment. Most equipment in this category has a life expectancy of 15 years; therefore, the number of equipment changeovers each year is about 3 percent. This occurs independently of any changes in system function or process.

37
3. Operations and Maintenance (O&M): Almost without exception, studies focused on
operation, maintenance, installation and commissioning suggest that most buildings are operating well below their optimum level. This is usually either because initial set-ups were based on assumptions different from actual use, or because the control systems and ongoing maintenance do not keep up with deteriorating settings and components in the HVAC system. We have included several O&M measures targeted to commercial buildings, especially for small- and medium-sized equipment. This represents the vast majority of HVAC equipment in use in the Energy Trust’s service territory and is typically characterized by very limited ongoing maintenance (unlike large equipment, which is typically serviced at least annually).
In general, these three categories have been applied to various measures to constitute a complete program package. In these cases, particular equipment is identified in the measure, with the assumption that the existing equipment can be changed out on a one-for-one basis with specific higher efficiency options. The O&M is assumed to be an enhancement to the existing maintenance infrastructure, using existing contractors and/or building operators as the primary service deliverers. This is the most cost-effective method of developing an infrastructure that can substantially change O&M behavior in the commercial sector.
5.2.1. Commercial Retrofit Lighting Measures
In assessing lighting measures applied in a retrofit or replacement context in the existing commercial sector, there are two classes of measures:
• New technology that can upgrade or replace existing lighting and result in reduced lighting wattage
• More efficient versions of current technology that offer increased savings even for
relatively new buildings.
Generally, existing buildings that have not received any serious retrofit from previous utility programs or as the result of a previous major remodel have substantial savings opportunities. Even buildings that have already undergone substantial improvements prior to 1995 can provide savings opportunities. These buildings were often rehabbed with first generation T-8 fixtures with electronic ballasts or even electronically ballasted T-12 fixtures that were used as conservation measures in the late 1980s and early 1990s. Upgrading this older retrofit lighting with new technology can provide substantial additional savings opportunities.
To estimate the technical potential from fluorescent lighting measures, we considered the following factors:
1. Buildings constructed following the advent of the current Energy Code were excluded
because those buildings already meet a very high LPD requirement which exceeds the
38
previous energy code levels by almost 50 percent. This eliminated approximately 20 percent of the total commercial square footage from our technical potential estimate.
2. The next step was to determine the population for which a fluorescent tube retrofit
would be applicable. Work done for Oregon baseline characteristics assessments conducted by Ecotope in 1991 and 1998 estimates that approximately half of the total lighting wattage in the commercial sector used applicable lighting technologies.
3. The fraction of lighting systems which had previously been improved, either as a
result of the lighting code or earlier utility intervention were excluded, which reduced some of the savings opportunities for this measure.
The first lighting measure we evaluated was designed to change out existing florescent tube lighting systems with new high output lamps and low output ballasts which, in combination, reduce individual fixture draw by up to 20%. The measures were described in two categories that were evenly divided among the technical potential population. This resulted in an estimated lighting wattage of 64 W per 2-tube fixture, which represents a value approximately half way between a T-12 (with an efficient magnetic ballast commonly used in the 1980s) and the T-8 with electronic ballast systems common in the mid and early 1990s. The measure itself was set to reduce the total lighting wattage to approximately 48 W per 2-tube fixture. Approximately half of the total savings available from this measure in existing buildings is available from retrofit programs, with the remaining half available from replacement situations in which normal attrition in lighting systems is influenced by an Energy Trust program. In the latter case, only the incremental cost of the more efficient ballast/lamp combination was included, which reduces the cost of energy saved by about 80 percent versus a full retrofit situation. The second class of lighting measures is applicable to the remaining lighting wattage in the commercial sector. This was subsumed into a single measure meant to describe various “advanced” lighting technologies. These include:
• Retrofit daylighting controls. • Improved high-intensity discharge (HID) and compact fluorescent lighting (CFL)
applied to older incandescent and mercury vapor technologies.
• LED lighting for signage and other purposes.
• Integrated lighting controls that would improve the performance of daylighting, sweep controls, and other systems.
The data from all sources was insufficient to separate these measures by technology and use type. The approach we selected was to use the relative impacts of these technologies nationally and then generate a weighted average of impacts from the various measures
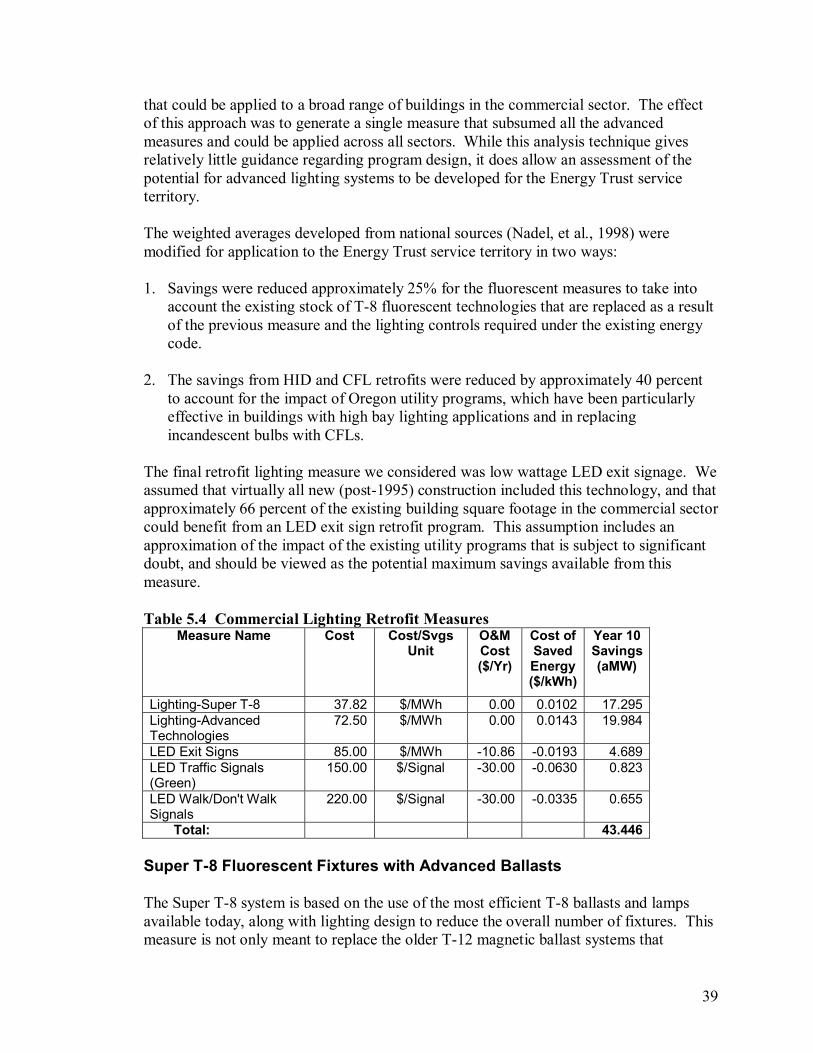
39
that could be applied to a broad range of buildings in the commercial sector. The effect of this approach was to generate a single measure that subsumed all the advanced measures and could be applied across all sectors. While this analysis technique gives relatively little guidance regarding program design, it does allow an assessment of the potential for advanced lighting systems to be developed for the Energy Trust service territory. The weighted averages developed from national sources (Nadel, et al., 1998) were modified for application to the Energy Trust service territory in two ways:
1. Savings were reduced approximately 25% for the fluorescent measures to take into
account the existing stock of T-8 fluorescent technologies that are replaced as a result of the previous measure and the lighting controls required under the existing energy code.
2. The savings from HID and CFL retrofits were reduced by approximately 40 percent
to account for the impact of Oregon utility programs, which have been particularly effective in buildings with high bay lighting applications and in replacing incandescent bulbs with CFLs.
The final retrofit lighting measure we considered was low wattage LED exit signage. We assumed that virtually all new (post-1995) construction included this technology, and that approximately 66 percent of the existing building square footage in the commercial sector could benefit from an LED exit sign retrofit program. This assumption includes an approximation of the impact of the existing utility programs that is subject to significant doubt, and should be viewed as the potential maximum savings available from this measure.
Table 5.4 Commercial Lighting Retrofit Measures
Measure Name Cost
Cost/Svgs Unit
O&M Cost ($/Yr)
Cost of Saved Energy ($/kWh)
Year 10 Savings (aMW)
Lighting-Super T-8 37.82 $/MWh 0.00 0.0102 17.295 Lighting-Advanced Technologies
72.50 $/MWh 0.00 0.0143 19.984
LED Exit Signs 85.00 $/MWh -10.86 -0.0193 4.689 LED Traffic Signals (Green)
150.00 $/Signal -30.00 -0.0630 0.823
LED Walk/Don't Walk Signals
220.00 $/Signal -30.00 -0.0335 0.655
Total: 43.446
Super T-8 Fluorescent Fixtures with Advanced Ballasts
The Super T-8 system is based on the use of the most efficient T-8 ballasts and lamps available today, along with lighting design to reduce the overall number of fixtures. This measure is not only meant to replace the older T-12 magnetic ballast systems that

40
characterized commercial construction techniques prior to 1990, but will also provide significant savings over older T-8 electronic ballast combinations sold in the early 1990’s. The strategy implied by this analysis is to use a high lumen output tube (based on high phosphorus technology) which allows a 20 percent increase in lighting level for a given level of power. This tube would then be driven from an electronic ballast designed for lower output. The combination would result in equivalent light output to older T-8’s or electronic ballasts. This technology would reduce energy use by approximately 10 watts, which translates into a 17 percent reduction in power compared to older T-8 systems. For T-12 systems, the potential savings is almost twice that. The Super T-8 system has been evaluated as a retrofit measure that could be implemented during tenant changeovers and/or as a replacement measure which would be undertaken strictly for the purposes of reducing the lighting power in the space. Although they are the same measure, in one case the evaluation used an incremental cost for a less efficient T-8 with electronic ballast. In the other case, a full optimal cost of the retrofit is included. Robert Sardinski of Rising Sun Company, Boulder Colorado and Jim Benya, a lighting consultant working with Mr. Sardinsky, provided the costs and energy savings data for this measure. For the analysis, a fixture rated at 64 watts was selected, representing the median value between T-12 and older T-8 fixtures. The analytical combination used for the Super T-8 retrofit was 48 W/fixture, which represents a combination is between approximately 46 watts per two tube fixture and 50 watts per two tube fixture. The overall cost of the retrofit was based on a $15 cost for the more efficient ballast, and $9/tube for the higher lumen output tubes. A labor cost of $34 per fixture for installing these new ballasts and tubes was also assumed. This would include, in some cases, the installation of spectral reflectors or alternative lens reconfigurations. For the replacement measure, we used the full costs for the system. The analysis of the technical potential for this is based on 30 fixtures (2x4) per thousand square feet in an applicable floor area. The total lighting power density of 1.7 watts per square foot represents the lighting code enforced in Oregon in the late 1980’s and early 1990’s. This, for the most part, was comprised of T-12 tubes with magnetic ballasts. Though their level of efficiency is somewhat higher than older fluorescent fixtures, it is lower than the standard T-8 with electronic ballasts installed in the early to mid 1990’s. For this analysis, we assumed an occupancy cycle of 2,100 hours per year for the lighting system, and a lighting level of 3.6 kWh/ft2/yr was derived. The savings from this base were calculated by combining the range of values for fluorescent and T-8 lighting, and utilizing the median value. Approximately 50 percent of the retrofits were conducted on more efficient T-8 systems, and 50 percent were conducted on T-12 systems. The measure was applied primarily to office buildings, although the applicability for such a retrofit extends to virtually all of the sectors. The technical potential was based on lighting energy use index (EUI) for the fraction of the lighting used by the entire sector, reduced by 25%. Over a 10 year program, this would address the entire applicable population. We estimated total savings of 35 average megawatts achieved in both retrofits and replacement.

41
Where retrofits are conducted without the benefit of incremental remodel or rehabilitation, this measure is not cost-effective, providing a cost of saved energy of about $0.06/kWh saved. This value assumes a mix of T-8 and T-12 fixtures. If only T-12 fixtures are assumed, the cost of saved energy drops to about $0.048 (although the amount of energy saved by the measure also drops by at least 30%). When combined with any other kind of rehabilitation where labor costs or other costs could be offset by work being done for other reasons, the cost-effectiveness increases dramatically to approximately $0.01/kWh saved. Lighting – Advanced Technologies Numerous measures have been reviewed as retrofit or new construction measures to install more efficient lighting systems in non-residential buildings. For this set of measures, the Nadel report (Nadel, et al., 1998) was used as the primary source document. The measures identified in this report are summarized in Table 5.5. The analysis presents these measures as a package to represent the most technically feasible and applicable lighting measures throughout the commercial sector, weighted based on both their applicability and savings potential. To analyze these measures, a single weighted average savings was developed. The specific technologies and practices included in this analysis are delineated in Table 5.5.
Table 5.5. Lighting Advanced Technologies Measures
Category of Lighting Improvements
Implied net
$/kWh/yrLifetime (years)
Implied CSE
($/kWh)
Savings per unit
over base (%)
Savings reduction
due to overlap or
code Indirect Lighting $0.3992 25 $0.031 10% 0% Improved Fluorescent Dimming Ballasts $0.4264 15 $0.044 19% 25% Improved Daylighting Controls $0.3548 20 $0.031 23% 25% Integrated Lighting Fixtures and Controls $0.2500 20 $0.022 30% 25% Reduced Cost and/or Higher Efficiency CFLs $0.0327 15 $0.003 44% 40% Metal Halide Replacements for lncandescents $0.0187 6.5 $0.004 48% 40% Advanced Lighting Distribution Systems $0.4990 20 $0.044 20% 0% One-Lamp Fixtures and Task Lighting $0.3029 20 $0.026 31% 0% WEIGHTED AVERAGE $0.014 32% This included savings in lighting energy use for the aggregate building stock evaluated in the Nadel report. In this analysis, we assumed the aggregate building stock in Oregon is similar for the savings calculations. A certain fraction of the measures were reduced on several factors. Most significant is that the Nadel report included multi-family residential applications. A factor of 40% was removed from the potential savings from those
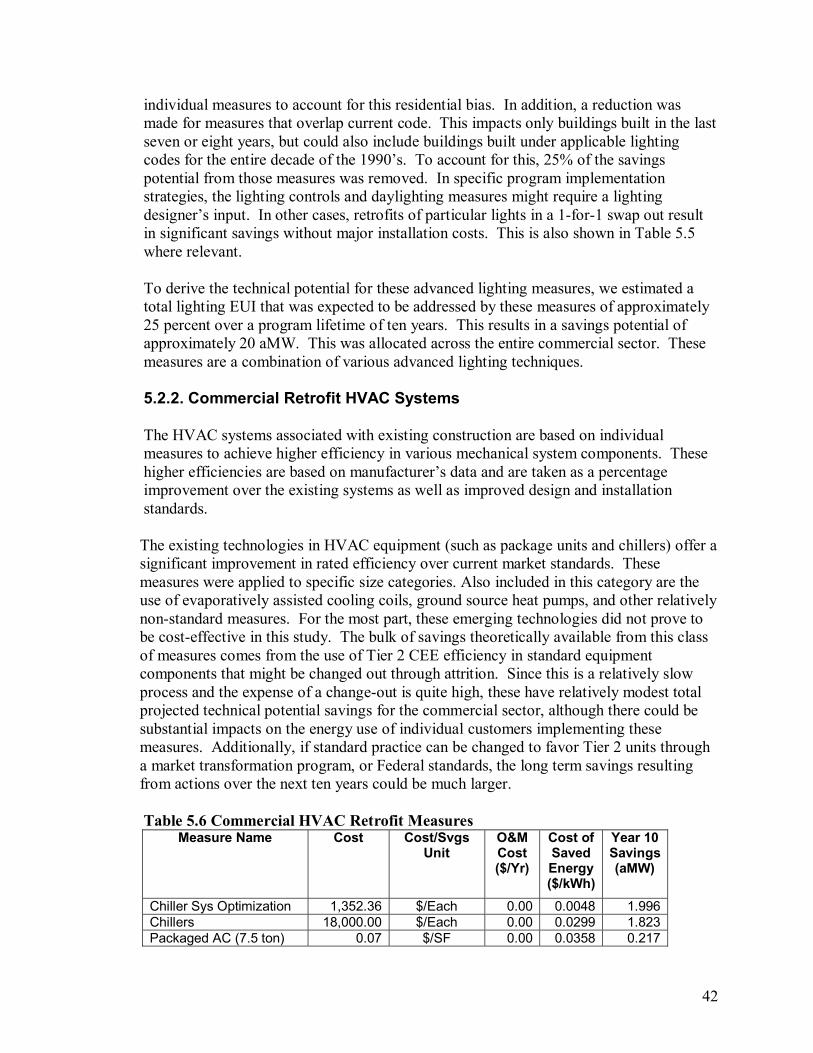
42
individual measures to account for this residential bias. In addition, a reduction was made for measures that overlap current code. This impacts only buildings built in the last seven or eight years, but could also include buildings built under applicable lighting codes for the entire decade of the 1990’s. To account for this, 25% of the savings potential from those measures was removed. In specific program implementation strategies, the lighting controls and daylighting measures might require a lighting designer’s input. In other cases, retrofits of particular lights in a 1-for-1 swap out result in significant savings without major installation costs. This is also shown in Table 5.5 where relevant. To derive the technical potential for these advanced lighting measures, we estimated a total lighting EUI that was expected to be addressed by these measures of approximately 25 percent over a program lifetime of ten years. This results in a savings potential of approximately 20 aMW. This was allocated across the entire commercial sector. These measures are a combination of various advanced lighting techniques. 5.2.2. Commercial Retrofit HVAC Systems
The HVAC systems associated with existing construction are based on individual measures to achieve higher efficiency in various mechanical system components. These higher efficiencies are based on manufacturer’s data and are taken as a percentage improvement over the existing systems as well as improved design and installation standards.
The existing technologies in HVAC equipment (such as package units and chillers) offer a significant improvement in rated efficiency over current market standards. These measures were applied to specific size categories. Also included in this category are the use of evaporatively assisted cooling coils, ground source heat pumps, and other relatively non-standard measures. For the most part, these emerging technologies did not prove to be cost-effective in this study. The bulk of savings theoretically available from this class of measures comes from the use of Tier 2 CEE efficiency in standard equipment components that might be changed out through attrition. Since this is a relatively slow process and the expense of a change-out is quite high, these have relatively modest total projected technical potential savings for the commercial sector, although there could be substantial impacts on the energy use of individual customers implementing these measures. Additionally, if standard practice can be changed to favor Tier 2 units through a market transformation program, or Federal standards, the long term savings resulting from actions over the next ten years could be much larger.
Table 5.6 Commercial HVAC Retrofit Measures
Measure Name Cost
Cost/Svgs Unit
O&M Cost ($/Yr)
Cost of Saved Energy ($/kWh)
Year 10 Savings (aMW)
Chiller Sys Optimization 1,352.36 $/Each 0.00 0.0048 1.996Chillers 18,000.00 $/Each 0.00 0.0299 1.823Packaged AC (7.5 ton) 0.07 $/SF 0.00 0.0358 0.217

43
Packaged AC (15 ton) 0.12 $/SF 0.00 0.0377 0.368Packaged AC (25 ton) 0.25 $/SF 0.00 0.0437 1.119Cooling Tower 7,500.00 $/Each 0.00 0.0587 0.465PTAC Units 168.78 $/Each 0.00 0.0676 1.368Ground Source Heat Pump (3,000 hrs/yr)
6.54 $/SF -0.01 0.1000 3.711
Evaporative Systems (150 ton)
120,000.00 $/Each 0.00 0.1281 8.480
Ground Source Heat Pump (2,000 hrs/yr)
6.54 $/SF -0.01 0.1500 9.310
Evaporative Systems (350 ton)
280,000.00 $/Each 0.00 0.2349 10.793
Evaporative Systems (20 ton)
35,000.00 $/Each 0.00 0.2589 0.401
Ground Source Heat Pump (1,000 hrs/yr)
6.54 $/SF -0.01 0.3000 4.720
Total: 44.771Note: Measures in grayed rows were not found to be cost-effective. Packaged AC Equipment For this measure, several categories of equipment were considered (all of which were sized for less than 25 tons of cooling) that provide an incremental improvement in both compressor efficiency and economizers at the time of replacement. Improved efficiency is based on improvements from Tier 1 to Tier 2 levels of efficiency. The Consortium for Energy Efficiency (CEE) was the source for both the cost and savings values. The level of detail provided by CEE allows for categories of measures to be evaluated in different equipment size classifications.
Table 5.7 summarizes the efficiency ratings for various classes of equipment. The ASHRAE column represents the current standard used by manufacturers and is the minimum efficiency for equipment that is produced in the United States. Tier 1 is more representative of the range of equipment actually purchased in Oregon to replace existing equipment. A conservative assumption is that the Oregon energy code is actually closer to the ASHRAE number. Ecotope’s baseline survey from 1998 suggests that equipment purchased in Oregon exceeded the then-current ASHRAE standard by approximately 10%, which approximates the Tier 1 level. This was used as the basis for the savings calculations. The savings for this measure are based on a composite of various common duty cycles and hours of operation input. This value was primarily constructed from survey data, and does not necessarily reflect simulations performed specifically for the Pacific Northwest region.
Table 5.7 HVAC Packaged AC Equipment Efficiency Table
EER Rating Equipment Size
ASHRAE Tier 1 Tier 2
Incremental Cost (Tier 2) $/Ton
3 Ton 9.7 11.5 13.0 23 7.5 Ton 9.9 10.3 11.0 27 15 Ton 9.1 9.7 10.8 48 25 Ton 8.8 9.5 10.0 100* *Assumes best practice EER = 11.0
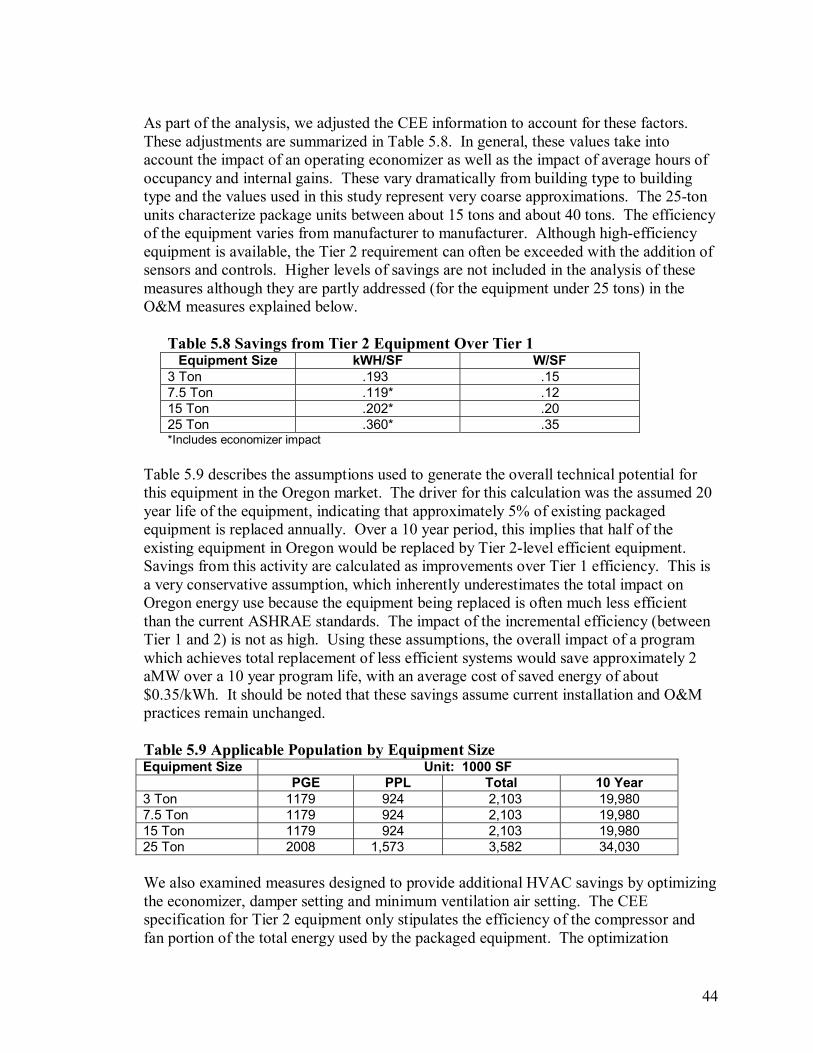
44
As part of the analysis, we adjusted the CEE information to account for these factors. These adjustments are summarized in Table 5.8. In general, these values take into account the impact of an operating economizer as well as the impact of average hours of occupancy and internal gains. These vary dramatically from building type to building type and the values used in this study represent very coarse approximations. The 25-ton units characterize package units between about 15 tons and about 40 tons. The efficiency of the equipment varies from manufacturer to manufacturer. Although high-efficiency equipment is available, the Tier 2 requirement can often be exceeded with the addition of sensors and controls. Higher levels of savings are not included in the analysis of these measures although they are partly addressed (for the equipment under 25 tons) in the O&M measures explained below.
Table 5.8 Savings from Tier 2 Equipment Over Tier 1
Equipment Size kWH/SF W/SF 3 Ton .193 .15 7.5 Ton .119* .12 15 Ton .202* .20 25 Ton .360* .35 *Includes economizer impact
Table 5.9 describes the assumptions used to generate the overall technical potential for this equipment in the Oregon market. The driver for this calculation was the assumed 20 year life of the equipment, indicating that approximately 5% of existing packaged equipment is replaced annually. Over a 10 year period, this implies that half of the existing equipment in Oregon would be replaced by Tier 2-level efficient equipment. Savings from this activity are calculated as improvements over Tier 1 efficiency. This is a very conservative assumption, which inherently underestimates the total impact on Oregon energy use because the equipment being replaced is often much less efficient than the current ASHRAE standards. The impact of the incremental efficiency (between Tier 1 and 2) is not as high. Using these assumptions, the overall impact of a program which achieves total replacement of less efficient systems would save approximately 2 aMW over a 10 year program life, with an average cost of saved energy of about $0.35/kWh. It should be noted that these savings assume current installation and O&M practices remain unchanged.
Table 5.9 Applicable Population by Equipment Size Equipment Size Unit: 1000 SF PGE PPL Total 10 Year 3 Ton 1179 924 2,103 19,980 7.5 Ton 1179 924 2,103 19,980 15 Ton 1179 924 2,103 19,980 25 Ton 2008 1,573 3,582 34,030
We also examined measures designed to provide additional HVAC savings by optimizing the economizer, damper setting and minimum ventilation air setting. The CEE specification for Tier 2 equipment only stipulates the efficiency of the compressor and fan portion of the total energy used by the packaged equipment. The optimization

45
measures (DX Tune-up) are designed to complement the HVAC equipment measures, and the savings are additive. Indirect/Direct Evaporative Cooling Retrofit The measure included in the technical potential assessment is an emerging technology that promises an immediately cost-effective approach to reducing energy use by cooling equipment. The strategy is to provide an evaporative stage before the DX coil itself. This would provide a cooling boost to the air approaching the DX coil and thus reduce its energy requirement. This mechanism is fairly typical in built up systems, which typically use cooling towers to provide some or all of the cooling under certain outdoor conditions. In smaller package equipment, however, the addition of a cooling tower is more complicated. This measure assesses a packaged technology that would add evaporative-assist cooling to an existing unit. The following table shows the potential cost and equipment efficiency benefits from an indirect/direct evaporative retrofit. This measure is relatively expensive, and the overall cost-effectiveness of individual units is about $0.20 per kWh saved. In some localities, particularly in California, this technology has shown itself to be cost-effective, although usually this involves much drier climates with much higher cooling loads than found in the Energy Trust’s service territory. The costs and savings used for this analysis were taken from research performed for the Department of Energy (Arthur D. Little, Inc., 1998) and other sources. As a retrofit package, the cost has the potential of being reduced dramatically, especially if individual components of this technology become available from the mainstream equipment manufacturers. Using the sizes shown in the following table, an assessment was made of the probability of equipment of this type and size being used in the existing Oregon market. Using survey data from Oregon, it is estimated that about 12% of the commercial square footage used large (over 150 ton) equipment, and that about 10% of this equipment did not already use some sort of an evaporative assist in the form of either a cooling tower or other type of water-side economizer. For the 20 ton equipment, the use of this approach is somewhat more problematic, since interaction with air side economizers could obviate much of the savings. For this analysis, we reduced the number of potential cases to a relatively small percentage of the actual units and assumed that the technical potential over the 10 year period was approximately 2.5% of the cooling load in this sector. This is a relatively small saturation. The fact that two-thirds of the mechanical cooling could be offset by this technology, especially if it is applied to favorable climates or end uses, means substantial technical savings of almost 20 aMW are predicted from our methodology. All savings would be gained from the retrofit market, since the current Oregon code requires either an air side or a water side economizer. Larger equipment almost invariably uses cooling towers as part of the built up package in larger office and retail buildings.
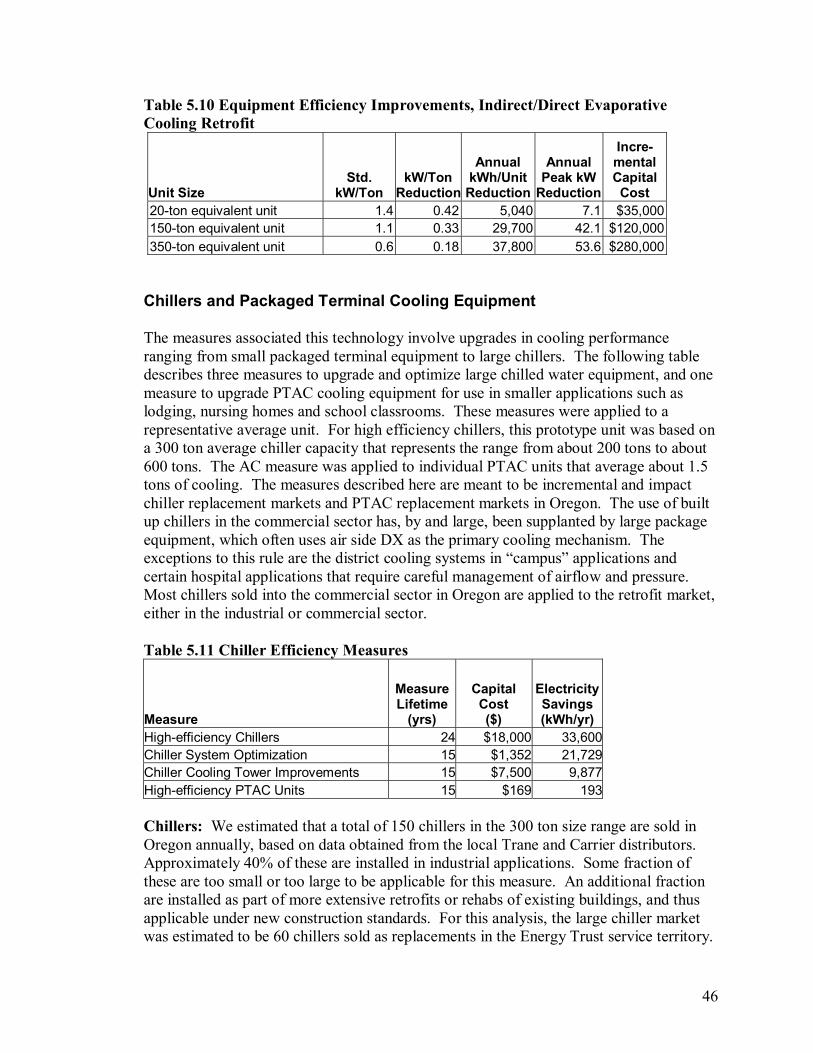
46
Table 5.10 Equipment Efficiency Improvements, Indirect/Direct Evaporative Cooling Retrofit
Unit Size Std.
kW/Ton kW/Ton
Reduction
Annual kWh/Unit
Reduction
Annual Peak kW
Reduction
Incre-mental Capital Cost
20-ton equivalent unit 1.4 0.42 5,040 7.1 $35,000 150-ton equivalent unit 1.1 0.33 29,700 42.1 $120,000 350-ton equivalent unit 0.6 0.18 37,800 53.6 $280,000
Chillers and Packaged Terminal Cooling Equipment The measures associated this technology involve upgrades in cooling performance ranging from small packaged terminal equipment to large chillers. The following table describes three measures to upgrade and optimize large chilled water equipment, and one measure to upgrade PTAC cooling equipment for use in smaller applications such as lodging, nursing homes and school classrooms. These measures were applied to a representative average unit. For high efficiency chillers, this prototype unit was based on a 300 ton average chiller capacity that represents the range from about 200 tons to about 600 tons. The AC measure was applied to individual PTAC units that average about 1.5 tons of cooling. The measures described here are meant to be incremental and impact chiller replacement markets and PTAC replacement markets in Oregon. The use of built up chillers in the commercial sector has, by and large, been supplanted by large package equipment, which often uses air side DX as the primary cooling mechanism. The exceptions to this rule are the district cooling systems in “campus” applications and certain hospital applications that require careful management of airflow and pressure. Most chillers sold into the commercial sector in Oregon are applied to the retrofit market, either in the industrial or commercial sector.
Table 5.11 Chiller Efficiency Measures
Measure
Measure Lifetime
(yrs)
Capital Cost ($)
Electricity Savings (kWh/yr)
High-efficiency Chillers 24 $18,000 33,600Chiller System Optimization 15 $1,352 21,729Chiller Cooling Tower Improvements 15 $7,500 9,877High-efficiency PTAC Units 15 $169 193 Chillers: We estimated that a total of 150 chillers in the 300 ton size range are sold in Oregon annually, based on data obtained from the local Trane and Carrier distributors. Approximately 40% of these are installed in industrial applications. Some fraction of these are too small or too large to be applicable for this measure. An additional fraction are installed as part of more extensive retrofits or rehabs of existing buildings, and thus applicable under new construction standards. For this analysis, the large chiller market was estimated to be 60 chillers sold as replacements in the Energy Trust service territory.
47
Taken as a whole, the chiller replacement and upgrade have a technical potential of about 4.3 megawatts average, 40% of which is the result of improved efficiency in the chiller equipment itself, and the remaining 60% in improved controls and the use of more aggressive cooling tower technologies to support the chillers. PTACs: For the PTAC replacement measure, a market of 7,800 units/year in the entire service territory was estimated, which represents all units replacing existing units as they fail. The potential for the PTAC efficiency measure is based on developing a program which could address all 7,800 of these individual units. The PTAC at this level have a potential of 1 1/3 megawatts average savings over a 10 year horizon. Efficient Motors (ECM) Beginning in the mid-1980s, technology was developed to provide the benefits of variable speed direct drive motors to relatively small fractional horsepower motors used in various HVAC applications. This technology, known as electronically commutated motors (ECMs), provided several substantial benefits for HVAC systems in the commercial sector. Like a variable speed drive, the ECM transforms the motor into a direct current application. Thus, the speed of the motor can be regulated while reducing exponentially the kilowatt draw. As a result, even motors that are designed to be produced at low cost and high volume can be made much more efficient, since they can be adjusted to the desired volume while still achieving the same or greater level of efficiency than the rated efficiency of the motor at the outset. The alternative most commonly found in current practice is to use an SCR controller, which has the effect of reducing the motor speed and output by generating heat at the controller itself, and thereby has no impact on the overall efficiency or electricity draw of the motor. In applications where testing and balancing are relevant, the addition of an SCR motor can reduce the fan efficiency for conventional fans from about 40% to about 20%. The ECM technology actually causes the motor to be more efficient as the speed is reduced, which could easily double, or even triple, the efficiency in such applications.
For this analysis, we examined ECM fans that are dedicated to HVAC and venting applications, where motors sized for fractional horsepower are typical. Given the probability of large buildings with VAV systems in this sector, we estimated that 50% of the existing retail and office space could have such a system. All of these buildings could benefit from a retrofit of ECM motors and controllers as part of the routine maintenance and upgrade of VAV boxes. The induction boxes of a VAV system typically have 15 year life expectancies. As these boxes are replaced or rebuilt, the motor can be replaced with ECM technology.
When the boxes are changed out in this way, the fan energy reduction is about 0.5 kWh per square foot. The incremental cost is less than $0.10 per square foot. The result is an extremely cost-effective measure. Its applicability in this analysis is only to retrofit and replacement applications where rehabilitation or maintenance results in the change over of existing induction box technologies. Even so, the pervasiveness of these small fans and the potential efficiency improvement results in a potential of about 20 aMW for the
48
entire commercial sector. With this sort of potential it may be worth viewing the possibility of retrofitting ECM motors even when replacement is not under consideration. It appears that this measure would be cost-effective even if the cost of the ECM motors with installation goes up by a factor of five. We were not able to develop costs for this application within the time and budget constraints of this project, but a substantial increase in the technical potential could be anticipated.
Restaurant EMS Restaurants (and fast food restaurants in particular) are extremely energy intensive. This measure evaluates a current Energy Trust and Oregon Office of Energy program to put EMS systems in restaurants that can regulate both the HVAC system and the timing of their auxiliary heating and venting equipment. This would result in about a 10% savings on overall energy use, or 30,000 kilowatt hours per year, and peak savings of about 7 kW in demand per restaurant. These savings are derived from automated control of the heating, air conditioning, refrigeration, ventilation and lighting systems that currently depend on manually resetting the equipment. Market reviews from Oregon Office of Energy show about 800 fast food and other restaurants would benefit from this technology. This results in an overall technical potential for a measure of about 1.3 aMW. This is quite cost-effective, and can be packaged and marketed to individual restaurants where existing control systems are not already based on automatic controls of this sort. 5.2.3. Commercial Retrofit Control and O&M Measures
Operations and Maintenance (O&M) measures include a number of approaches meant to capture additional savings from applying commissioning techniques to newer control strategies or early maintenance reviews to improve HVAC performance. We analyzed numerous measures that affect electricity use in small HVAC systems in the commercial sector. According to our analysis, the most cost-effective measure is to repair and upgrade the duct and HVAC delivery system (ducts). Unfortunately, this is somewhat misleading. The difficulty in identifying buildings that could benefit from a duct-sealing program is likely to marginalize the potential savings.
HVAC equipment in the commercial sector is routinely serviced. This group of measures is intended as an enhancement to existing O&M procedures. The goals are not only to upgrade the controls and equipment performance, but also to identify opportunities for additional new or retrofit measures. O&M: Small Packaged HVAC Systems Energy codes and even utility programs have been based on the assumption that specifying particular performance levels for economizers would result in improved efficiency in the HVAC system without further investigating the nature of these systems (or the installation and set-up practices that might influence their performance). To
49
determine actual versus predicted performance, several investigations of rooftop performance have been conducted to compare actual performance to the theoretical calculations. These reports tend to support the idea that set-up, installation standards and maintenance practices largely determine the efficiency of the HVAC equipment and systems. The more crucial issue for this group of measures is the disconnection between the performance experienced in the field versus anticipated savings. The standards of the industry regarding installation and maintenance practices currently result in units that perform at dramatically lower efficiencies than might otherwise be assumed. A program design that includes a substantial training and quality control step is more likely to deliver savings than a program focused solely on equipment or service visits. The work done by the Eugene Water and Electric Board (EWEB) (Davis, et al, 2002) and in many other parts of the country suggested that between 50 and 80 percent of the package rooftop units installed in commercial buildings are performing at a fraction of their potential efficiency, usually because of economizer set-up or some other O&M problem. The difficulty from a program standpoint is that one cannot predict in advance precisely the size or the nature of the required repair, replacement, or upgrade of the unit. Nor can one predict the degree to which such an upgrade will provide permanent or at least long-term savings in the operation of this equipment. For these reasons, the cost-effectiveness of any of these measures is subject to considerable speculation, although the potential impact on the cooling energy associated with packaged equipment is to reduce the total consumption by 30 to 50 percent. It should be noted that the savings from improved equipment efficiency (Tier 2 efficiency) measures would not exceed 20 percent in any application. The total savings available from this O&M measure would be two or three times that available from a 20% improvement in the equipment EER. Furthermore, in all cases in the Energy Trust service territory, the economizer control dampers required to achieve savings from installation and set-up of economizers are already in place as a result of code requirements for this equipment.
All of the measures in Table 5.12 were derived from work conducted in the Eugene and Puget Sound areas on small packaged rooftop units. Table 5.12 also indicates the probability of a particular O&M or optimization measure being available or required by units based on this relatively limited work. The savings and costs generated in Table 5.12 were based on a typical 7 ton unit in the EWEB work. For this evaluation, incremental capital cost per square foot, annual savings per square foot, and measure applicability in percent units were used to generate the savings potential in the energy code.
Table 5.12 Small HVAC System Maintenance Measures
Measure Increm.
Cost
Annual kWh
Savings/ Unit
Increm. Cost ($/ft2)
Measure applicab
ility (%units)
Annual kWh Svgs/
ft2.

50
Economizer Controllers--New/Reconfigure $659 2,150 $0.24 67 0.80Thermostat $400 1,100 $0.15 25 0.41New Economizer $1,600 4,600 $0.59 8 1.70Correct Refrigerant Charge $100 350 $0.04 50 0.13Damper Repair and Coil Cleaning $200 800 $0.07 50 0.30
Table 5.13 describes the total building square footage for which this measure is applicable. Savings were established based on retail and office usage and only those two sectors have been calculated. Based on the probability that small packaged rooftop units would provide the space heating and space cooling for this sector, a total saturation of 40% of all floor area was assigned in each service territory. This was distributed between the retail and office sectors, as shown in Table 5.13 (representing 15% of all existing commercial space Trust’s service territory). Rooftop equipment probably serves a higher percentage of that floor area. These measures are intended to be applied to only smaller (under 20 ton) units that are typically installed in smaller office buildings and single-story retail establishments of all sizes. Therefore, over a 10-year program, these measures would account for approximately 70 megawatts average savings, exclusively from improved cooling efficiency through the use of more optimized economizers and outside air damper settings and better function on the part of the cooling compressors.
This analysis does not include any heating side savings. In some cases, a heat pump or electric resistance furnace might provide heating, and some of the measures (particularly the repair measures) would improve the efficiency of the heating system. Those savings are not included in this analysis.
The program designed here focuses on the use of existing O&M technicians who currently service the same equipment, and providing them with additional tools and incentives to improve economizer and control settings in small rooftop units that have typically received relatively little optimization and ongoing maintenance.
Table 5.13 Applicability: Small HVAC System Maintenance
Applicable Square
Feet
Percent of Applic. Sq.
Feet
Percent of Total
Office + Retail
Office--PGE 8,460,371 10.4% 4.2%Office--PPL 19,780,696 24.4% 9.8%Total Office--Both Utilities 28,241,067 34.8% 14.0%Retail--PGE 29,203,882 36.1% 14.4%Retail--PPL 23,563,469 29.1% 11.6%Total Retail--Both Utilities 52,767,351 65.2% 26.0%Total of above--PGE 37,664,253 46.5% 18.6%Total of above--PPL 43,344,164 53.5% 21.4% Based on this analysis, the available technical potential for these measures is about 70 aMW throughout the Energy Trust service territory. Because this technology is ubiquitous on virtually all low rise retail and office structures, the impact would spread to

51
almost any commercial district in Oregon. Table 5.14 summarizes the technical potential for this measure.
There are additional O&M savings that have not been evaluated here, primarily retro-commissioning of larger systems. For the most part these systems include all the controls and equipment to operate efficiently but operators and installers have not been adequately informed on the operation and maintenance of these systems. The new construction analysis has included these measures but the analysis was not extended to the existing building sector due to a lack of reliable cost and savings information. It is safe to assume that the addition of these measures could significantly increase the O&M impacts for existing buildings discussed above.
Table 5.14 Commercial Small HVAC System Maintenance Measures
Measure Name Cost
Cost/Svgs Unit
O&M Cost ($/Yr)
Cost of Saved Energy ($/kWh)
Year 10 Savings (aMW)
New economizer 0.59 $/SF 0.01 0.0233 10.082Install or adjust economizer controls
0.24 $/SF 0.01 0.0282 39.470
Install thermostat 0.15 $/SF 0.01 0.0435 5.049Clean/adjust dampers & coils
0.07 $/SF 0.01 0.0475 10.960
Adjust refrigerant 0.04 $/SF 0.01 0.0943 4.795Total: 70.356
Commercial Duct Testing and Sealing
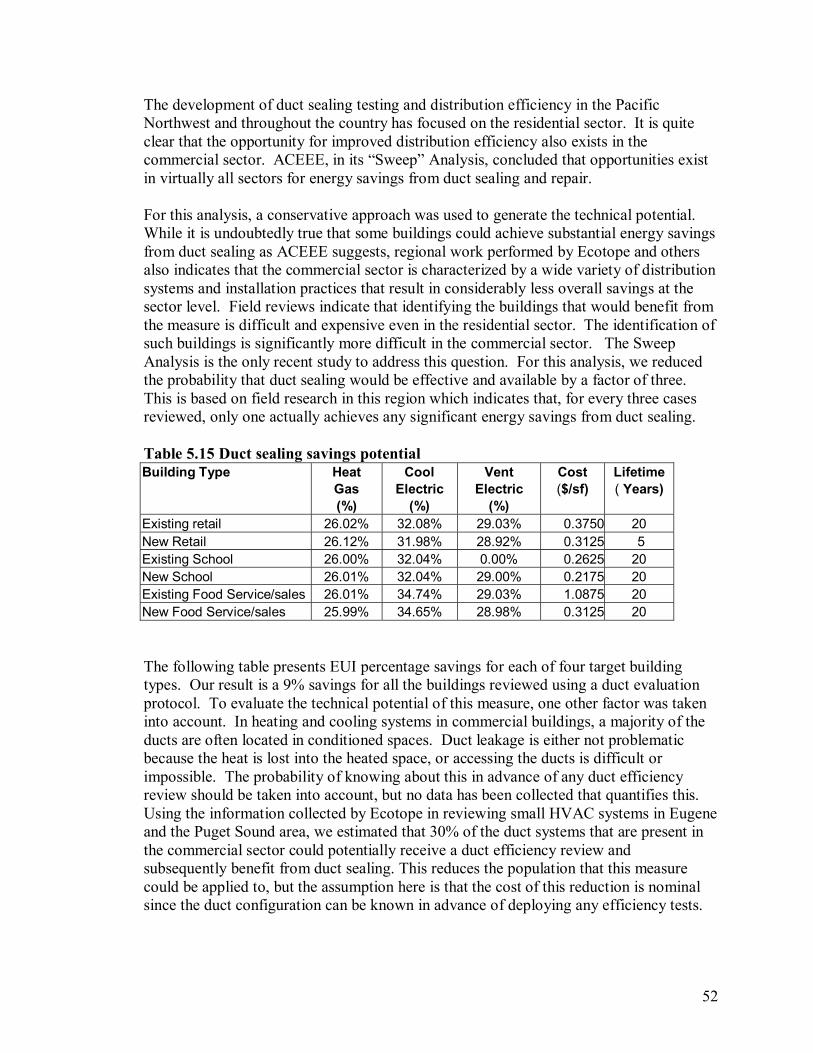
52
The development of duct sealing testing and distribution efficiency in the Pacific Northwest and throughout the country has focused on the residential sector. It is quite clear that the opportunity for improved distribution efficiency also exists in the commercial sector. ACEEE, in its “Sweep” Analysis, concluded that opportunities exist in virtually all sectors for energy savings from duct sealing and repair. For this analysis, a conservative approach was used to generate the technical potential. While it is undoubtedly true that some buildings could achieve substantial energy savings from duct sealing as ACEEE suggests, regional work performed by Ecotope and others also indicates that the commercial sector is characterized by a wide variety of distribution systems and installation practices that result in considerably less overall savings at the sector level. Field reviews indicate that identifying the buildings that would benefit from the measure is difficult and expensive even in the residential sector. The identification of such buildings is significantly more difficult in the commercial sector. The Sweep Analysis is the only recent study to address this question. For this analysis, we reduced the probability that duct sealing would be effective and available by a factor of three. This is based on field research in this region which indicates that, for every three cases reviewed, only one actually achieves any significant energy savings from duct sealing.
Table 5.15 Duct sealing savings potential Building Type Heat Cool Vent Cost Lifetime Gas Electric Electric ($/sf) ( Years) (%) (%) (%) Existing retail 26.02% 32.08% 29.03% 0.3750 20 New Retail 26.12% 31.98% 28.92% 0.3125 5 Existing School 26.00% 32.04% 0.00% 0.2625 20 New School 26.01% 32.04% 29.00% 0.2175 20 Existing Food Service/sales 26.01% 34.74% 29.03% 1.0875 20 New Food Service/sales 25.99% 34.65% 28.98% 0.3125 20
The following table presents EUI percentage savings for each of four target building types. Our result is a 9% savings for all the buildings reviewed using a duct evaluation protocol. To evaluate the technical potential of this measure, one other factor was taken into account. In heating and cooling systems in commercial buildings, a majority of the ducts are often located in conditioned spaces. Duct leakage is either not problematic because the heat is lost into the heated space, or accessing the ducts is difficult or impossible. The probability of knowing about this in advance of any duct efficiency review should be taken into account, but no data has been collected that quantifies this. Using the information collected by Ecotope in reviewing small HVAC systems in Eugene and the Puget Sound area, we estimated that 30% of the duct systems that are present in the commercial sector could potentially receive a duct efficiency review and subsequently benefit from duct sealing. This reduces the population that this measure could be applied to, but the assumption here is that the cost of this reduction is nominal since the duct configuration can be known in advance of deploying any efficiency tests.
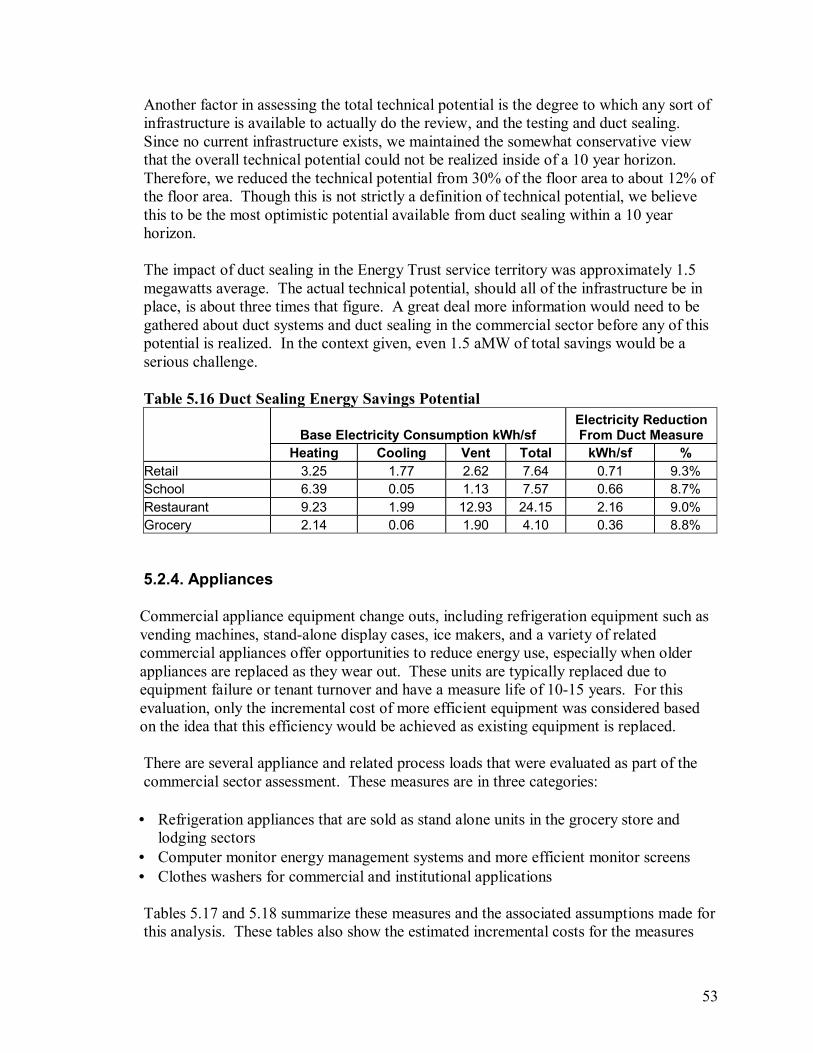
53
Another factor in assessing the total technical potential is the degree to which any sort of infrastructure is available to actually do the review, and the testing and duct sealing. Since no current infrastructure exists, we maintained the somewhat conservative view that the overall technical potential could not be realized inside of a 10 year horizon. Therefore, we reduced the technical potential from 30% of the floor area to about 12% of the floor area. Though this is not strictly a definition of technical potential, we believe this to be the most optimistic potential available from duct sealing within a 10 year horizon.
The impact of duct sealing in the Energy Trust service territory was approximately 1.5 megawatts average. The actual technical potential, should all of the infrastructure be in place, is about three times that figure. A great deal more information would need to be gathered about duct systems and duct sealing in the commercial sector before any of this potential is realized. In the context given, even 1.5 aMW of total savings would be a serious challenge.
Table 5.16 Duct Sealing Energy Savings Potential
Base Electricity Consumption kWh/sf Electricity Reduction From Duct Measure
Heating Cooling Vent Total kWh/sf % Retail 3.25 1.77 2.62 7.64 0.71 9.3% School 6.39 0.05 1.13 7.57 0.66 8.7% Restaurant 9.23 1.99 12.93 24.15 2.16 9.0% Grocery 2.14 0.06 1.90 4.10 0.36 8.8%
5.2.4. Appliances
Commercial appliance equipment change outs, including refrigeration equipment such as vending machines, stand-alone display cases, ice makers, and a variety of related commercial appliances offer opportunities to reduce energy use, especially when older appliances are replaced as they wear out. These units are typically replaced due to equipment failure or tenant turnover and have a measure life of 10-15 years. For this evaluation, only the incremental cost of more efficient equipment was considered based on the idea that this efficiency would be achieved as existing equipment is replaced. There are several appliance and related process loads that were evaluated as part of the commercial sector assessment. These measures are in three categories:
• Refrigeration appliances that are sold as stand alone units in the grocery store and
lodging sectors • Computer monitor energy management systems and more efficient monitor screens • Clothes washers for commercial and institutional applications
Tables 5.17 and 5.18 summarize these measures and the associated assumptions made for this analysis. These tables also show the estimated incremental costs for the measures

54
described. The impact of these various appliances on an individual basis is fairly small. However, there are substantial numbers of these units throughout the commercial sector. In general, the incremental cost assumes that the measure is to offer a rebate to the consumer or incentive to the sales person at the time of sale to induce the consumer or institution to purchase the more efficient equipment.
Table 5.17 Commercial Appliance Energy Use
Appliance Measure Base Use
(kWh)
Measure (kWh)
Savings (kWh)
Savings (%)
Washer 4,333 2,000 2,333 45 Refrig: Display 7,560 6,048 1,512 26 Refrig: Reach-In Units 7,078 4,459 2,619 37 Refrig: Ice Makers 11,956 9,206 2,750 23 Refrig: Walk-In Coolers 20,714 13,464 7,250 35 Computer Energy Mgmt. 650 437 213 33 Monitor (LCD) 110 33 77 70
Table 5.18 Commercial Appliance Technical Savings Potential Appliance Units per Year Increm. Cost
($) Washer 1,259 650 Refrig: Display 3,500 200 Refrig: Reach In 3,100 400 Refrig: Ice Makers 1,600 100 Refrig: Walk-In Cooler 1,000 1,200 Computer Energy Mgmt. 61,777 20 Monitor (LCD) 88,253 200
The calculation of the technical potential for these appliances has been based on a market model in which approximately 100% of the appliances are changed out as a result of normal attrition over a ten year period. While this level of intervention may not be approached by the final program design, the use of incremental costs as a basis for the cost/benefit analysis depends on intervening in the transaction, not on the absolute cost-effectiveness of a whole new piece of equipment. Washers The measures included as commercial appliances and process loads are relatively small individual energy use appliances which stand alone in various facilities. The washing machines are commercial scale. These machines are located in institutions, laundromats, dry-cleaning establishments, etc. throughout the commercial sector. The overall energy savings are based on EnergyStar evaluations. Most of the savings (98%) result in the more efficient use of hot water. For this analysis, half of the commercial water heaters in the service territory were assumed to use electric water heaters and the balance was heated by gas. For this analysis, only washers with electric water heat were considered as part of the technical potential.

55
Refrigeration Several refrigeration measures were considered in this analysis. Most are identified in work conducted by Steve Nadel and his team at ACEEE in 2000. There are numerous technologies we have combined into major categories. These include a range of technologies and products which would be of use in refrigeration appliances in the institutional sector. This equipment, in general, has a measure life of approximately ten years. The market assessment was based on an estimate of total refrigeration demand in each of these sectors and a life expectancy that replaced most of this equipment over a ten year period. The refrigeration display, ice-maker, and reach-in beverage case measures are all designed around improved heat exchange, improved installation, and design which reduces overall unit heat loss. These measures represent a variety of equipment with average levels of savings taken from the Nadel, et al. work. Extending these measures to the Energy Trust service territory was done using the sector characterization prepared for this project and Northwest Power Planning Council refrigeration EUI estimates for these individual sectors. The market for this type of equipment in Oregon is estimated to be between one and two percent of the national market for these products. This appears to be approximately the scale of the Oregon economy, and was used to represent the Energy Trust service territory. Clearly, more detailed assessment would be required before the nature of this market in Oregon could be determined. Monitors
The final set of appliances reviewed were computer screens and energy management software for managing the stand-by energy used by monitors and computer screens. These two measures were based on technologies which turn off computer monitors when they are not in use to reduce the energy load during off hours. That measure reduces the actual monitor’s energy use by 70%. One difficulty in increasing consumer acceptance of this technology is that individual customer computer systems are complicated and can interact negatively with the EMS software. The nature of this interaction is determined by what other components are also being managed by the software. The life expectancy of computer system is approximately four years. In that period, the software could be installed in computer systems throughout the commercial office sector. Our analysis shows that LCD monitors make a substantial difference in total energy use. However, limited market acceptance has caused us to reduce the technical potential estimate. This has been partially offset because the EMS software is likely to continue to be used by organizations that have invested in the software following monitor replacements. In some cases, new LCD screens will replace older less efficient technology. The measure is extended over ten years. In some cases the measure may overlap with the installation of software or the installation of other higher efficiency screen technologies. Over a 10

56
year period, the entire sector is assumed to be saturated by the higher efficiency screens and efficient energy management systems.
The overall impact of these appliances on the commercial sector is quite large. The refrigeration technologies potentially account for savings of about 20 aMW. In the Oregon market, all three categories of appliances have estimated savings of almost 30 aMW throughout the commercial sector.
5.2.5. Domestic Hot Water
These measures were examined because they are ubiquitous in buildings throughout the commercial sector. However, cost-effective implementation of these measures is confined to a few specific uses, especially laundry facilities associated with laundromats, health care and lodging facilities. For the most part, the efficiency measures we reviewed were applied to those subsectors and include both a higher efficiency tank and circulation system and the use of solar or heat pump technologies to reduce the energy requirement for hot water demand The application of various domestic hot water savings programs to electrically heated hot water was evaluated using a variety of data sources, largely from national surveys of potential savings measures in this sector. The following table lists the measures evaluated for this analysis, which represent the classes that could be applied to building service water in various contexts. The evaluation of measures has been normalized to a relatively large system designed to provide 100 kBTU’s surface water, maximum capacity. This is the equivalent of about a 10 to 12 unit multi-family or small office building or a 20 unit motel structure. Cost and savings estimates were derived from an analysis performed for the Department of Energy (Arthur D. Little, Inc., 1998).
Table 5.19 Domestic Hot Water Measures (100 KBTU system)
Measure Measure Life (yrs)
Capital Cost
O&M Cost (annual)
Electricity Savings (kWh)
Cost of saved energy ($/kWh)
Computerized Controller 15 $3,000 0 8,383 0.0177 Solar Water Heater 15 $41,913 250 31,435 0.0724 Heat Pump Water Heater 15 $12,420 72 17,062 0.0395 Wastewater Heat Exchanger 15 $5,000 0 20,956 0.0118
We reviewed four separate measures. The first is a control measure designed to manage the pump and standby losses associated with a circulating water heating system. These systems are common in virtually all types of lodging and health care domestic hot water systems, and less commonly in systems with modest water heating demands such as office or other miscellaneous commercial uses. The equipment examined for this measure uses a temperature and feedback controller to determine the pump and pump speed of a circulating water system, thereby reducing both standby losses from the circulating system and the parasitic pump energy requirements for the circulation.
57
The remaining measures we reviewed are alternative methods for generating the hot water. Three alternatives were examined:
• The first is a domestic solar water heater. This is a system based on solar panels
generating thermal energy in domestic hot water. The technology is available and used throughout the western United States, but remains fairly expensive. The effectiveness of this measure depends rather critically on relatively high levels of demand and a system designed to precisely meet the loads of the structure and end use.
This evaluation assumes that a program in the Energy Trust service territory could be designed to achieve about 60% of the domestic hot water load. This would depend on either a relatively large storage system or a relatively sunny climate. In this analysis it was assumed that even in the Portland area, a design could be developed that would achieve these goals. The system is based on a large system by the Heliodyne Corporation for an apartment complex. The system included 40 square feet of panels, exchangers, storage, etc. The overall impact of this system on Oregon could be rather large, but the system remains fairly costly. Even in larger applications, the overall cost of saved energy approaches 8 cents/kWh over a 15 year measure life.
• The second system used to generate hot water is a heat pump water heater. This
technology has been used in residential applications and some commercial applications for the past two decades. For the most part, it offers a 50% savings in water use using air to water heat pump technology. This analysis was based on a DEC Thermastore® system applied to small and medium sized commercial operations such as restaurants, stores, and other operations where heat recovery is available. While this system could theoretically be applied to a wide variety of operations, the need for adequate airflow and a certain amount of interior heat limits its applicability. The heat pump application would be competitive to a solar application. Therefore, the solar saturation was developed so as not to overlap with the heat pump saturation; however, the same buildings would be candidates for either measure in most cases. For this analysis, we assumed that solar systems would be applied wherever they could be applied and that the heat pump would be applied to the majority of the remaining opportunities.
• The final water heat generation equipment we reviewed was the wastewater heat
exchanger. This system would recover heat from wastewater as it went down the drain, and transfer it to the incoming water, thereby preheating water going to a domestic system. This system is a relatively promising and low-tech operation requiring only a heat exchanger in the drain line. It also requires relatively close proximity between supply lines and drain lines. For this reason, in new construction, a system could be installed relatively inexpensively. However, in retrofit situations, the opportunity to add on this equipment would only be available in limited cases without substantial investment in plumbing or re-plumbing. The system cost and performance is based on conversations with representatives of the GFX Corporation, which manufactures this heat exchanger. Given the plumbing difficulties in a retrofit application of this sort, only a small number of cases should be considered as part of the technical potential.
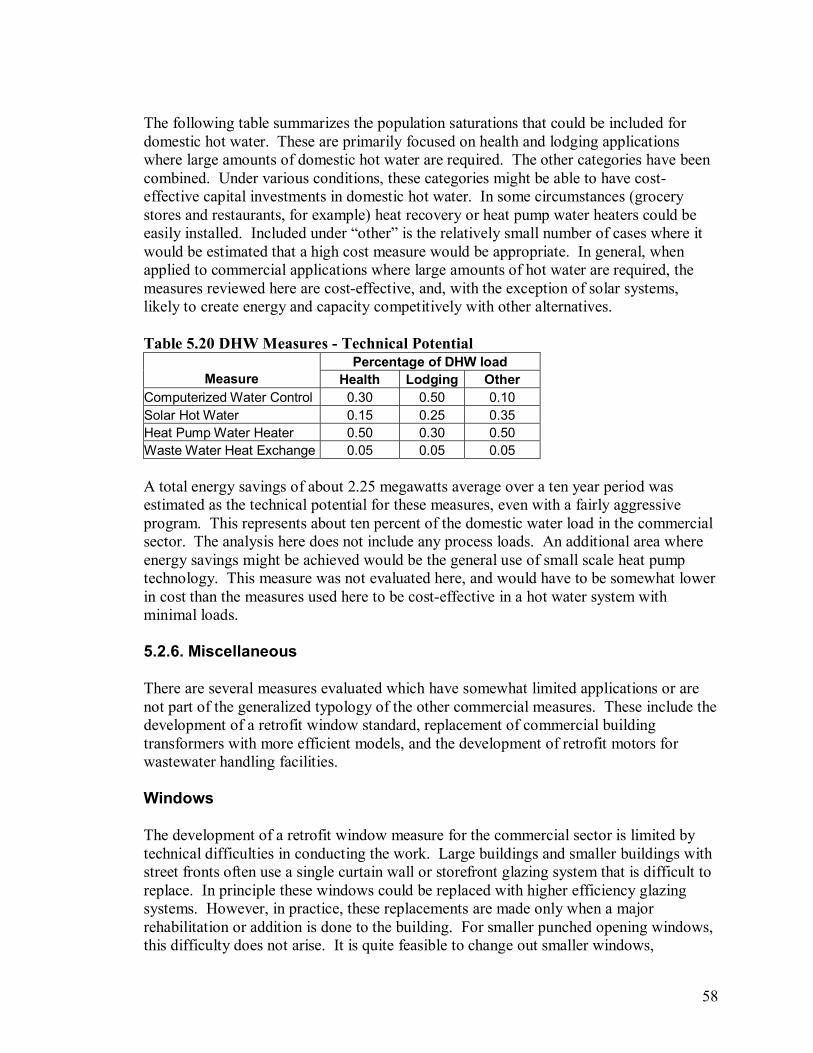
58
The following table summarizes the population saturations that could be included for domestic hot water. These are primarily focused on health and lodging applications where large amounts of domestic hot water are required. The other categories have been combined. Under various conditions, these categories might be able to have cost-effective capital investments in domestic hot water. In some circumstances (grocery stores and restaurants, for example) heat recovery or heat pump water heaters could be easily installed. Included under “other” is the relatively small number of cases where it would be estimated that a high cost measure would be appropriate. In general, when applied to commercial applications where large amounts of hot water are required, the measures reviewed here are cost-effective, and, with the exception of solar systems, likely to create energy and capacity competitively with other alternatives.
Table 5.20 DHW Measures - Technical Potential
Percentage of DHW load Measure Health Lodging Other
Computerized Water Control 0.30 0.50 0.10 Solar Hot Water 0.15 0.25 0.35 Heat Pump Water Heater 0.50 0.30 0.50 Waste Water Heat Exchange 0.05 0.05 0.05
A total energy savings of about 2.25 megawatts average over a ten year period was estimated as the technical potential for these measures, even with a fairly aggressive program. This represents about ten percent of the domestic water load in the commercial sector. The analysis here does not include any process loads. An additional area where energy savings might be achieved would be the general use of small scale heat pump technology. This measure was not evaluated here, and would have to be somewhat lower in cost than the measures used here to be cost-effective in a hot water system with minimal loads. 5.2.6. Miscellaneous
There are several measures evaluated which have somewhat limited applications or are not part of the generalized typology of the other commercial measures. These include the development of a retrofit window standard, replacement of commercial building transformers with more efficient models, and the development of retrofit motors for wastewater handling facilities.
Windows The development of a retrofit window measure for the commercial sector is limited by technical difficulties in conducting the work. Large buildings and smaller buildings with street fronts often use a single curtain wall or storefront glazing system that is difficult to replace. In principle these windows could be replaced with higher efficiency glazing systems. However, in practice, these replacements are made only when a major rehabilitation or addition is done to the building. For smaller punched opening windows, this difficulty does not arise. It is quite feasible to change out smaller windows,

59
especially in buildings that are relatively low rise, with more modern window systems. It is not generally part of common practice, but would benefit commercial buildings as much as the residential sector is benefited from similar measures. For this measure, we restricted the total amount of area that could receive new windows to ten percent of the commercial floor area in the office, retail, and schools sectors. We have assumed that the window area impacted by the measure is approximately 11% of the floor area. The energy savings estimates are based on simulations with the prototypes used by the Northwest Power Planning Council (Kennedy, 1997).
These assumptions yield a technical potential of approximately 400,000 square feet of windows that could be replaced using punched opening frames. These could be installed with the same infrastructure that currently provides replacement windows in various parts of the residential sector. This estimate assumes that virtually all the punched openings in the commercial sector and the Energy Trust service territory would be replaced with new, more modern windows over the course of ten years.
For this analysis, we divided the sector into two parts: The first is windows that could be replaced with Class 40 windows, U-value of 0.4; the second is windows that could be moved to Class 35 windows, with a U-value of 0.35. The distinction between these two classes of windows is primarily a function of framing type and framing structural requirements that would limit the nature of the replacement window in many commercial buildings. For this analysis, we assumed that 50% of the punched opening windows could be brought to Class 35 standards using vinyl window frames or equivalent, and the remaining percent would be brought to the Class 40 standards using aluminum or other metal frame combinations. The glazing itself would be a “low-ε2” product with an argon or other gas fill and a U-value of approximately 0.3.
The cost of these windows was based on the incremental cost of an improved glazing system, and this calculation is important to the overall cost-effectiveness of the window. If the incremental cost is not used, then the cost of saved energy goes from approximately $0.01 per kilowatt hour to approximately $0.20 per kilowatt hour, because the cost of the windows themselves is much greater in this sector than the cost of the glazing improvements. We have assumed that the 800,000 square feet of windows implied by the two measures would all be drawn from windows that would otherwise be replaced.
The savings also assume a base case of a code-compliant window with a U value of 0.55. The amount of savings from the actual replacement would be much greater than this, since the window being replaced is very likely to be a single-glazed or much lower performing window. Even so, it is unlikely that window replacement can be made cost-effective unless the building owner or operator is replacing the windows and the Energy Trust’s role is to limited to encouraging an upgrade in the selection of windows to meet the higher standards implied by these measures.
Overall, because of the discounted savings, this measure actually delivers only about 1.5 aMW energy savings over a 10 year life. If the base case was changed reflect the current

60
windows in place in punched openings, the total savings would approximately triple, but the incremental step associated with this increased savings would not be cost-effective. Transformers In most medium and large buildings, transformers are used to step down three-phase power from the utility line. They are also used, to some extent, to provide power conditioning to the building or internal processes. Commercial transformers are characterized by two important factors: • They are typically owned and operated by the building owner, and they are
considerably less efficient than new utility transformers. • In most cases, they operate at substantially lower duty cycles than the utility owned
transformers.
The impact of transformer efficiency is almost 2 percent of the total electrical load in the commercial sector. The fact that transformers are ubiquitous and used in virtually the entire sector indicates a large technical potential for savings, even if savings from individual installations are modest. For this analysis, the average commercial sector transformer load factor was assumed to 20% (Cadmus Group, 1999). Savings and costs for this measure were based on analysis conducted by the Oak Ridge National Lab (Barnes, et al., 1997). From that analysis, a savings of 23.3 kilowatt hours was derived for transformers with a TP-2 (Tier 2) designation from the EnergyStar Program. The analysis assumed a weighted average of five types of transformers commonly used. The potential for these measures is based on the number of transformers sold in Oregon. The analysis broke the total transformer sales of 85,000 kVa into new and existing buildings. Savings could total about 3.2 aMW savings if this market could be fully saturated with TP-2 EnergyStar transformers. For new construction, the available savings are much lower, as part of the demand is already met by existing high quality transformers. For this analysis, the overall estimation procedures were identical to the existing construction. However, the potential saturation was reduced dramatically, and a total savings potential of 0.1 megawatt hours average was calculated. Clearly this measure has much more significance in replacing older existing transformers. Over a ten year period, this would result in 25% of the transformers in operation being replaced. Such a program would, over a longer period of time, result in savings three times that estimated by this analysis.
5.2.7. Existing Commercial Sector Program Recommendations
The important feature of the existing commercial sector is the need to develop strong relationships with existing service providers. Almost all systems in the commercial sector have some amount of professional O&M associated with them, even if it only involves the replacement of filters. Building and plant operators and HVAC maintenance personnel can each play a role in increasing the efficiency of the existing building stock,
61
and successful programs will require the cooperation and detailed understanding by each of these groups regarding the impact of their actions and the potential savings benefits available. Our observation has been that these groups respond well to incentives and to detailed information that can be used in marketing. This is not only true for HVAC systems, but also for lighting systems. The vast majority of the savings in existing commercial buildings comes from one of these two systems. Therefore, the development of an O&M and repair program for the retrofit and replacement markets constructed around these service providers can offer substantial reductions in overall energy use by the entire sector. A second important point is that the development of an appliance replacement program can be extremely effective if marketed adequately. While this end use does not represent a large fraction of total savings for the commercial sector, the potential exists to decrease energy use by 3 million MWh annually. This figure does not include savings available from office equipment, computers, etc. that could further enhance total savings.
The group of measures related to HVAC O&M provides a very effective program option to the Energy Trust, both from the point of view of cost-effectiveness and from the point of view of absolute reductions in energy use. The consistent treatment of O&M by utility programs is extremely difficult. Previous attempts in this region to implement O&M-based programs have failed either because of the need for long term utility involvement in individual pieces of equipment, or for lack of a clear definition of what long-term O&M actually means and how it might be integrated into the existing service delivery system. This is not so much a capital investment as it is an ongoing commitment of attention to the controls, dampers, and compressor functions in the equipment which already exists.
5.3. New Commercial Construction Traditional supply curve methodology for assessing conservation potential in any sector, and particularly in the commercial sector, has focused on the use of individual measures that could improve the efficiency of one or another component of a building energy system. In the early days of conservation programs, this was a singularly successful analysis technique. Then-current practice deviated sufficiently far from energy efficiency that even modest efforts to improve component efficiency paid large dividends. This was particularly true in new lighting systems as strict energy codes and more efficient fixtures modified standard practice. Because the existing fixtures were energy intensive relative to more effective systems, even poorly designed lighting systems could be improved without paying a significant amount of attention to either the system design or the controls. With HVAC systems this was less true, or at least less obvious. Several advances were made that resulted in higher efficiency cooling equipment and in the use of outdoor air
62
cooling, which had clear benefits to the energy intensity of buildings. These components were introduced into the Oregon energy code, and, by now, have been well integrated into current construction practice. When reviewing the measures that could be applied in this sector, the underlying savings from more efficient components has been largely taken in either current practice or current code requirements. This does not imply that the buildings themselves have become sufficiently efficient to obviate the need for any commercial energy conservation program. On the contrary, what this suggests is that the larger component of savings will be the result of more efficient designs, configurations and controls, which would deliver benefits in the context of a more integrated approach. Thus, the evaluation of the conservation potential in new commercial construction has focused on measures that attempt to capture the interaction between design, installation and operation to deliver buildings that exceed the performance of a conventional approach to meeting the Oregon energy code. The use of this sort of adaptive response could have the effect of reducing the energy use of a building by more than 20 percent without changing a single component in either the HVAC or lighting system. Unfortunately, this could also result in no savings, or even negative savings, if the particulars of the control system were not adequately set up for adaptation to outdoor conditions or occupancy schedules, or were set to provide inadequate ventilation or cooling.
5.3.1. Commercial New HVAC Systems
The energy used by HVAC systems in the commercial sector is largely determined by the nature of the occupancy and the internal gains. High internal heat generation often reduces the need for heating in the Pacific Northwest. Therefore, the primary considerations for HVAC systems are heated and cooled air distribution, ventilation and occupancy rather than the thermal integrity of the envelope. Measures evaluated for new construction focus on the design approach for HVAC systems. This differs considerably between large buildings with highly engineered designs and smaller buildings which capitalize on the use of packaged units and pre-engineered systems.
The largest single entry point provided for program intervention is in the design of the HVAC system itself. In particular, programs focused on the ability of the system itself to absorb and redistribute the heating and cooling loads will be the most cost-effective. The energy use of HVAC systems is typically divided into three separate categories:
1. Heating energy: This refers to the heating energy required when outside air temperatures fall below the nominal balance point of the building (usually well below 45° F).
2. Cooling energy: This is usually described as the energy used by the compressor-based chiller or related system which provides cooling to the building to offset internal load. These systems provide cooling to offset solar and internal loads,
63
which can greatly affect the energy requirements of commercial buildings even in moderate climates.
3. Distribution: The distribution system includes the fans and pumps used to move air throughout the building in response to localized temperature requirements and to maintain temperature modulation between zones. These systems quite often also affect conditioning requirements since they provide outdoor air for ventilation and to offset cooling requirements through the use of air-side economizers.
Typical efforts to date have focused on the efficiency of the central chiller and on high efficiency compressors and exchangers, which can provide significant savings. However, additional advantages can be gained from the use of variable speed fan systems (especially in zone and smaller distribution fans) and pump systems (especially feeding heat pump and fan coil loops) which allow the fan and pump energy to be reduced as the temperature requirements of the building shift due to seasonal, occupancy or building use changes. These end uses do not typically use the more efficient fan and variable speed controllers. Equally significant to reducing energy use is the introduction of control strategies and modest incremental changes in system design, distribution and ventilation efficiency. These will allow the HVAC system to recover heat or cooling from some parts of the building to condition other parts when required. The distribution itself can also be made more responsive and energy efficient through careful manipulation of variable loads throughout the building. One of the most important program impacts is the use of economizers, which allows outdoor air (often ventilation air) to be used as a source of cooling to offset internal loads as they develop. Energy Efficiency Assessment of Large Commercial HVAC Systems
For the commercial sector, an energy efficiency program for large commercial HVAC systems must focus on two major approaches:
a. Individual measures: Programs supporting measures that increase the efficiency of
the various components of the HVAC system will incrementally and cost-effectively reduce overall energy use.
b. Design and control strategies: Alone, these strategies would reduce the energy use of
the building through heat recovery and usually provide more comfort to the building occupants by improving internal distribution. Coupled with more efficient equipment, the savings are even more significant.
Table 5.21 shows an evaluation of energy efficiency measures that focus on improving the efficiency of individual components of the HVAC system. For this analysis, the energy savings are expressed as a change in the energy use index (EUI) in the form of annual kWh saved per square foot. Absolute EUIs and savings vary substantially across building types even where similar HVAC systems are installed. The distribution systems

64
reviewed for this analysis focus on large office, retail and educational structures with similar load patterns and occupancy densities. A weighted average of these end uses was developed to estimate the information presented in the table below.
Table 5.21 Commercial New Construction Large HVAC Measures
Measure Name Cost
Cost/Svgs Unit
O&M Cost ($/Yr)
Cost of Saved Energy ($/kWh)
Year 10 Savings (aMW)
Chiller 1 0.05 $/SF 0.00 0.0062 0.334Zone Distribution Fans (ECM)
0.10 $/SF 0.00 0.0083 1.809
Heat Pump Loop3 0.25 $/SF 0.00 0.0206 0.246ASD Central Fans2 0.25 $/SF 0.00 0.0248 0.403ASD Central Pumps2 0.25 $/SF 0.00 0.0310 0.200
Total: 2.9921 Cooling EUI: 2.0 kWh/SF (average of all end uses). Change in efficiency of .14 kW/ton or 22% improved efficiency. Cost assumes $60/ton incremental cost for high efficiency units and 400 SF/ton of capacity. 2 Central fans and pumps use a base EUI (all distribution systems) of 3.0 kWh/SF. Central fans and pumps account for 30% of this EUI. ASDs improve energy use by 50% over inlet valves and bypass controls. 3 Increased heat pump efficiency by 20% over base (ASHRAE 90.1-99) and provide ASD pumps for the loop. The impact is 6 kWh/SF.
Design Approach The following table presents three proposed HVAC design packages. These measures are meant to enhance the equipment selection for the individual components of the HVAC system. This presentation method is somewhat arbitrary in that the combinations of measures presented are applicable in particular cases but do not represent all cases. These packages, however, illustrate the level of savings available from the application of programs to systems that have already been improved by energy code activity and the ASHRAE 90.1 standard for equipment efficiency. Beyond these increases in component equipment efficiency, control systems and distribution systems represent the major improvements available from HVAC systems in new commercial construction.
Table 5.22: Program Recommendations for Large Commercial HVAC Systems
Program Package description Base EUI*
(kWh/sf)
Improved EUI
(kWh/SF)
Savings/unit (kWh/yr)
Improved distribution and control (VSD and ECM motors)
10.0 9.0 1.0
Underfloor distribution (low pressure distribution) 10.0 8.0 2.0 Enhanced Heat Pump Loop with VSD and variable controls
10.0 8.0 2.0
Integrated Design (TRAV) 10.0 6.0 4.0 * Base EUI is based on 10 kWh/SF from office, retail and school sectors.
1. Enhanced VSD (variable speed drive) controls on central fans and pumps: These
controls are designed to vary the fan or pump speed as a function of overall load, usually using constant pressure control in the duct system. These systems are often used in central air distribution systems that supply the VAV (variable air volume)

65
systems. Quite often, small fans in VAV boxes operate at less than 30 percent efficiency. Assumptions built into this program also include the use of higher efficiency distribution fans in each zone. These fans use direct current (DC) technology similar to those used in VSD central fans, which has been adapted to the small fans used in VAV distribution boxes. With the ECM (electronically commutated motor) motors, manufacturers estimate an approximate doubling of the current level of efficiency.
2. Underfloor distribution system: The principal advance in distribution system efficiency is based on the use of low-pressure air delivery systems. Most commercial heating systems are located in ceilings, so the air required for heating and cooling must be delivered at a sufficiently high velocity to drive down through the space to floor level. This increases the requirements for both fan velocity and fan pressure throughout the system. An underfloor distribution system treats the floor system itself as a massive plenum that can operate under very low pressure. The impact of these systems is not based on the use of a more efficient zonal or central distribution fan, but relies on savings in energy required to deliver conditioned air to the space. These distribution systems also provide the advantage of reduced temperature requirements for the air delivery itself. Because the air is being delivered at the occupied zone, the temperature of cooling air can be slightly higher and the heating air temperature can be slightly lower, thereby lessening demand on the heating and cooling equipment.
3. Heat pump loop: This system represents a measure for heat pumps equivalent to
those associated with heat recovery in the system types described above. The heat pump loop differs from central heating and cooling systems in that the bulk of the chiller capacity is located in DX coils in individual zone boxes. This system has been used for many decades in the Pacific Northwest, and was pioneered in the Portland area in the 1950s. It is not used extensively, however, and offers the possibility of increased performance in both the heating and cooling loads in many occupancy applications in the non-residential sector. The heat pump loop includes a water loop that connects the individual heat pumps. When a particular heat pump is required to provide heating to a zone, it extracts heat from the loop. Conversely, when the heat pump is in cooling mode, it sheds heat to the water in the loop. In non-residential occupancies which require both heating and cooling throughout the year, this system allows zones needing heat to provide chilled water to zones requiring cooling. In such diverse applications, a significant impact on overall heating and cooling loads can be achieved. It is important for heat pump loops to use carefully designed pump systems to circulate the water. These systems often require as much energy as the heat pumps themselves unless integrated controls are included that allow variable speed pumping systems to be used to maintain flow in the loop without circulating an unnecessarily large amount of water and without requiring a bypass system when heat pump loads are low due to low occupancy.
66
These systems also include a central cooling tower using evaporative cooling to provide auxiliary cooling to the water loop, and a gas-fired boiler to provide auxiliary heating requirements. In both cases, this substantially reduces the requirements on the central system and can reduce individual loads on the heat pumps as they exchange heating and cooling through the zones.
4. Integrated design: This measure represents a combination of control system design
using terminal regulated air volume system (TRAV) at individual zones coupled with heat recovery, chillers, and gas-fired hot water loops. The most significant aspect of this integrated design could be included with any of the other equipment configurations, but it assumes an enhanced level of performance based both on the use of more effective controls and the use of higher efficiency heat recovery chillers and ventilation systems, as well as offsetting electric heat requirements in terminal boxes common in most of the region’s VAV systems.
5.3.2. New Commercial Commissioning
Literature on commissioning is largely specific to individual buildings and cases. Quite often, these commissioning results suggest savings in excess of 20%. To evaluate a targeted program, we have separated commissioning into three distinct measures. Savings for each of these measures have been calculated independently.
1. HVAC system commissioning. This measure includes testing and balancing, damper
settings, economizer settings, and proper HVAC heating and compressor control installation. The measure would also include the proper set-up of single zone package equipment in simple HVAC systems. The majority of the commercial sector is served by this technology.
2. Control set-up. This measure assumes the development of an “open source” control
package aimed at describing scheduling and control points throughout the HVAC system, properly training operators so that scheduling can be maintained and adjusted as needed, and the provision of operator back-up so that temperature reset, pressure reset, and minimum damper settings are set at optimum levels for the current or changing occupancy.
3. Lighting control. This measure includes the commissioning of occupancy and sweep
controls, and the proper setting of daylighting controls. Since the effectiveness of these measures is largely a function of schedule settings (except in cases where daylighting controls are integrated into the energy management software), we have included only the impact of properly controlled lighting scheduling and occupancy.
Commissioning Measures The savings calculated for each of the commissioning measures are subject to significant uncertainty. Our observations, based primarily on field work conducted in large and medium-sized buildings in the Seattle area, suggests that the impact of commissioning

67
and operator control can be 25-30%. Literature from California and from the Pacific Northwest suggests savings of 6-12% (Tso, et al, 2002). There are very few systematic studies that would confirm this number. The literature suggests that this in a consensus value, but a program aimed at general construction might vary considerably. Furthermore, this measure is meant to include smaller buildings as well as complex buildings. The existing literature leans very heavily on the larger buildings. Nevertheless, a summary of the estimated savings available from various commissioning measures is shown in the following table.
Table 5.23: Commissioning Measures
Measure Savings
(% of end use)
Capital Cost
($/SF)
Applicable construction
(%)
Annual New Construction
(000 sf). HVAC System Commissioning 6% $0.65 80% 7467 Control Set Up/Operator Training 12% $0.25 70% 6534 Lighting Scheduling/Controls 10% $0.25 30% 3343 While this level of savings may only apply to a portion of the building population, the sophistication of the control systems available today is usually well beyond the training and insights of the operator without additional technical backup. The purpose of these measures is to provide that technical backup through operator training and through commissioning as part of the construction process.
Savings can be significantly enhanced when other commissioning measures are combined with commissioning of building occupancy and lighting schedules. In buildings where we were able to directly observe the immediate impact of schedule commissioning, the typical adjustment was approximately four to six hours per day of occupancy time. This is usually because the occupancy assumptions used during building set up have never been adjusted to account for actual occupancy conditions. Operator training will enhance the ability of the operator to ensure that controls are set at optimum levels for existing conditions. This alone can amount to about 12% of the energy use of the building. We have used this value as the impact of proper operator training. This is consistent with findings from the evaluation of the Building Operator Training Program by the NW Alliance (Anderson, 2002)
Most of the savings for the lighting and occupancy control measure are subsumed in other measures. However, we estimate that an additional 10% savings are available from the lighting energy requirement.
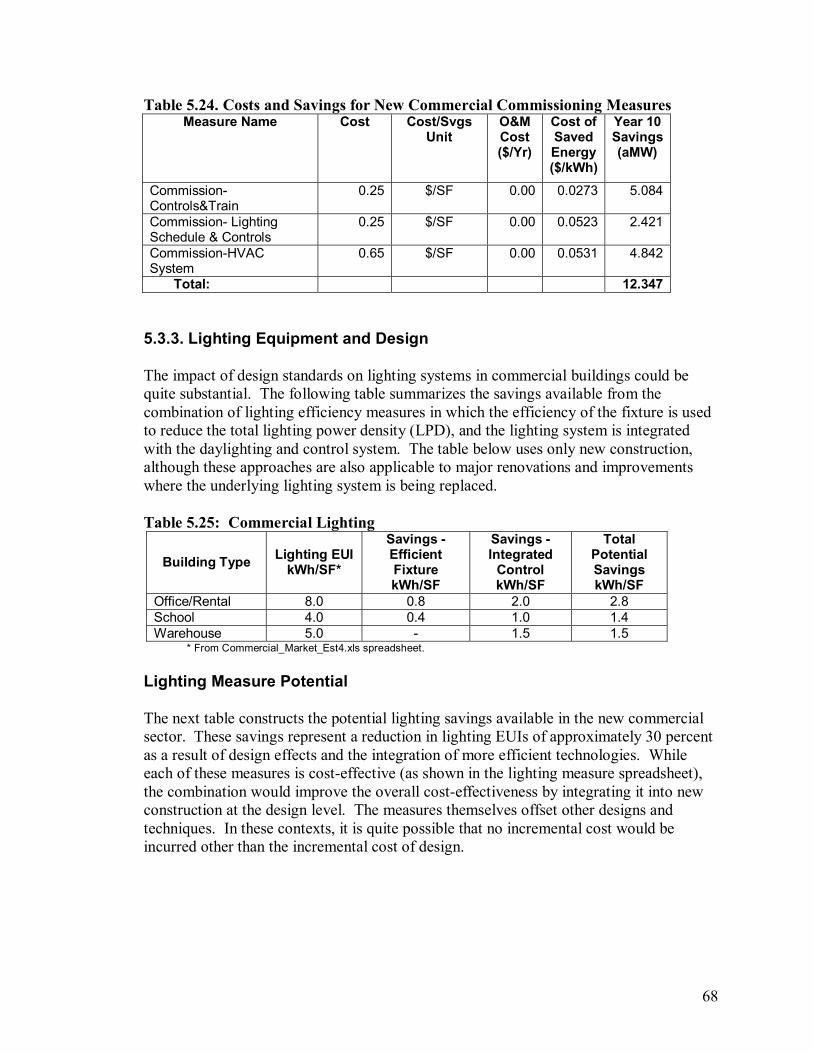
68
Table 5.24. Costs and Savings for New Commercial Commissioning Measures Measure Name Cost
Cost/Svgs
Unit O&M Cost ($/Yr)
Cost of Saved Energy ($/kWh)
Year 10 Savings (aMW)
Commission-Controls&Train
0.25 $/SF 0.00 0.0273 5.084
Commission- Lighting Schedule & Controls
0.25 $/SF 0.00 0.0523 2.421
Commission-HVAC System
0.65 $/SF 0.00 0.0531 4.842
Total: 12.347 5.3.3. Lighting Equipment and Design The impact of design standards on lighting systems in commercial buildings could be quite substantial. The following table summarizes the savings available from the combination of lighting efficiency measures in which the efficiency of the fixture is used to reduce the total lighting power density (LPD), and the lighting system is integrated with the daylighting and control system. The table below uses only new construction, although these approaches are also applicable to major renovations and improvements where the underlying lighting system is being replaced.
Table 5.25: Commercial Lighting
Building Type Lighting EUI kWh/SF*
Savings - Efficient Fixture kWh/SF
Savings - Integrated
Control kWh/SF
Total Potential Savings kWh/SF
Office/Rental 8.0 0.8 2.0 2.8 School 4.0 0.4 1.0 1.4 Warehouse 5.0 - 1.5 1.5
* From Commercial_Market_Est4.xls spreadsheet.
Lighting Measure Potential
The next table constructs the potential lighting savings available in the new commercial sector. These savings represent a reduction in lighting EUIs of approximately 30 percent as a result of design effects and the integration of more efficient technologies. While each of these measures is cost-effective (as shown in the lighting measure spreadsheet), the combination would improve the overall cost-effectiveness by integrating it into new construction at the design level. The measures themselves offset other designs and techniques. In these contexts, it is quite possible that no incremental cost would be incurred other than the incremental cost of design.

69
Table 5.26: Impact of Lighting Measures on New Construction
Sector Saving/Unit kWh/Sf
Annual Const. 106 SF
Technical Potential Savings
(Per Program Year) aMW
Office/Rental 2.8 5.5 1.8 School 1.4 1.9 0.3 Warehouse 1.5 1.5 0.2
Lighting system improvements could provide potential savings of more than 2 aMW/yr for the three building types evaluated for this project. These building types represent about two-thirds of the floor area anticipated in Oregon over the next 15 years. The achievable potential for this set of measures is between one-third and one-half of the floor area constructed. In this sector, design assistance can have a considerable impact if the costs of the design and the potential costs of the measures are partially offset. In the absence of incentives, only higher-end buildings with designers interested in innovative solutions are likely to be the markets for these approaches.
Warehouses may provide significant energy savings opportunities, since the installation of skylights and the placement of fixtures have the potential to considerably improve both the ambiance and the lighting energy requirements of these buildings. Considerable progress in this area has been made in the California market with modest to no impact on the overall budgets for warehouse construction. Nevertheless, a programmatic approach to the warehouse sector would still require some amount of design incentives to achieve the potential savings from these combinations of measures, as another cost-cutting measure.
Table 5.27: Lighting Program Applicability Category of Lighting Improvements Savings
(%) % floor
area Lifetime
Integrated lighting fixtures,controls 15% 75% 25 Daylighting, office retail,schools 25% 33% 25 Daylighting, warehouses 40% 50% 25 Improved efficency (fixtures,lamps) 10% 75% 25
These savings represent a reduction in lighting EUIs of approximately 30 percent as a result of design effects and the integration of higher efficiency technologies. While each of these measures is cost-effective (as shown in the lighting measure spreadsheet) the combination would improve the overall cost-effectiveness by integrating it into new construction at the design level. In this context, it is quite possible that no incremental cost would be incurred other than the incremental cost of design.
5.4. Commercial Process Loads There are two commercial sector process loads that were reviewed in this analysis separately from the building uses and appliances noted above. These two uses are wastewater and water utility systems and “server” installations.

70
In this analysis, the efficiency of water and wastewater systems was affected primarily by motors and motor controls. The principal design alternative reviewed for this project is the “Biological Management” system (e.g. BacGen). This process does not provide cost-effective energy savings, although it does provide non-energy benefits. The principal advantage to adopting the Biological Management system in terms of reducing energy use is the potential it provides to market efficient motors and motor controls, which could offer very cost-effective and substantial savings to the wastewater subsector. The pumping systems, however, have considerable potential mostly linked to optimized pumping control and improved motor efficiency. Table 5.28 summarizes the technical potential from these measures. Table 5.28. Commercial New Construction Process Load Measures
Measure Name Cost
Cost/Svgs Unit
O&M Cost ($/Yr)
Cost of Saved Energy ($/kWh)
Year 10 Savings (aMW)
Wastewater Pump and aeration optimization
18.76 $/Each 0.00 0.01 63.027
Wastewater Motors 2.63 $/Each 0.00 0.01 10.756Wastewater Heat Exchanger
5,000.00 $/System 0.00 0.0118 0.115
Total: 73.898 The other principal process load we reviewed involved server and telecommunications processes. Although our analysis shows that substantial savings are available from design intervention in server farms and other high energy use applications, the growth in this sector has collapsed. For the foreseeable future, the opportunities for savings will be minimal and there is a high risk that any investments in this sector would be defeated by obsolescence or bankruptcy. See the memorandum on this topic provided in Appendix B to this report.
5.5. Schools Funding to achieve energy efficiency in schools is regulated and budgeted differently in Oregon from the rest of the service territory. Therefore, the savings associated with schools from each relevant measure are presented in the tables below. In all cases, these savings have also been included in the measure and program descriptions in the previous sections. These calculations are made from the evaluation of the commercial sector as a whole. The estimates of the energy savings from schools are assumed to be the ratio of the school construction to all commercial construction. Table 5.29 Measure Savings in Schools - New Construction
Measure 10 Year Savings (aMW)

71
Commissioning: Controls & operator training 0.548 Commissioning: HVAC system 0.522 Commissioning: Lighting schedule & controls 0.261 HVAC: Enhanced HP loop 0.143 HVAC: Integrated design 1.780 HVAC: Underfloor delivery 0.372 HVAC: ASD central fans 0.060 HVAC: ASD central pumps 0.021 HVAC: Chillers 0.051 HVAC: Distribution zone fans 0.185 HVAC: Heat pump loop 0.034 HVAC: Packaged AC 3 ton 0.009 HVAC: Packaged AC 7.5 ton 0.006 HVAC: Packaged AC 15 ton 0.010 HVAC: Packaged AC 25 ton 0.029 Hot Water: Computerized controls 0.009 Hot Water: Solar Hot Water Heater 0.069 Hot Water: Heat Pump Water Heater 0.056 Hot Water: Wastewater Heat Exchanger 0.069 Lighting: Advanced fixtures & lamps 0.071 Lighting: Daylighting 0.337 Lighting: Integrated fixtures & controls 0.159 Transformers 0.006 Washing machines 0.316 Windows: Upgrade curtain wall to 0.40 0.324 Windows: Upgrade punched to 0.35 0.042 Windows: Upgrade punched to 0.40 0.029 Total: 5.518
Table 5.30 Measure Savings in Schools - Retrofit
Measure 10 Year Savings (aMW)
Ground Source Heat Pump (1000 hrs/yr) 0.586 Ground Source Heat Pump (2000 hrs/yr) 1.042 Ground Source Heat Pump (3000 hrs/yr) 0.391 Hot Water: Computerized controls 0.001 Hot Water: Solar Hot Water Heater 0.016 Hot Water: Heat Pump Water Heater 0.012 Hot Water: Wastewater Heat Exchanger 0.001 HVAC: Duct System Service /Repair 0.317 HVAC: Packaged AC 0.004 HVAC: High Efficiency Chillers & PTAC 0.002 Lighting: “Super” T-8, Retrofit 1.005 Lighting: Advanced fixtures & lamps 1.159 Lighting: LED Exit Signs 0.262 Small ECM Fans 2.070 Transformers 0.218 Windows: Upgrade punched to 0.35 0.191 Windows: Upgrade punched to 0.40 0.130 Total 7.407

72
5.6. Commercial Sector Conclusions and Recommendations
The commercial sector measures evaluated in the accompanying workbooks describe individual components of building-based energy use. These individual measures can be very cost-effective, but many have already been integrated into regional practices through energy codes or utility programs. Therefore, successful programs in the commercial sector will have to focus on addressing design issues and implementing appropriate combinations of applicable measures to reduce administrative costs and maximize savings.
A program aimed at HVAC design and distribution systems addresses the potential for more efficiency in the integration of better equipment and better air movement in non-residential buildings. This combination promises savings that are 2 to 3 times the savings available from simply upgrading the equipment in existing buildings with inefficient distribution systems and poor controls. The use of these approaches provides substantial improvements in the total HVAC system design, resulting in more efficient buildings with performance that is greatly improved over current Code requirements and over current utility programs focused on particular types of equipment.
In the Energy Trust service territory commercial lighting sector, both utility intervention and the Oregon energy code have combined to produce extremely low lighting EUIs. Substantial savings opportunities remain, especially in new construction, from the use of more efficient fixtures and controls and in lighting systems not regulated by code requirements (e.g. retail display lighting). In the late 1990s, a survey of Oregon commercial buildings showed virtually no lighting control strategies were used in new construction other than simple on/off mechanisms for off-hour occupancy (Baylon, et al., 2001). Daylighting and advanced occupancy controls were rarely used. A combination of the most efficient equipment and design could offer lighting EUI savings of up to 40 percent, but this is only achievable if equipment upgrade and control strategies are included at the design level.
This is also true in HVAC and building shell systems. The interactions between these components provide considerable benefits in both decreased electricity consumption and the cost of operation. These benefits can only be realized when combinations of applicable measures are all installed to maximize the efficiency and effectiveness of the individual measures. Without these combinations, the available saturations for each measure are relatively low. More importantly, the benefits gained from applying individual measures are substantially lower than those achievable by combining measures.
Programs addressing the commercial sector, particularly new construction and large additions, should focus on identifying those measures applicable to a particular case and addressing the introduction of equipment selection and efficient installation options into the design process early. This approach will assure the Energy Trust that the maximum savings are realized from the programs.
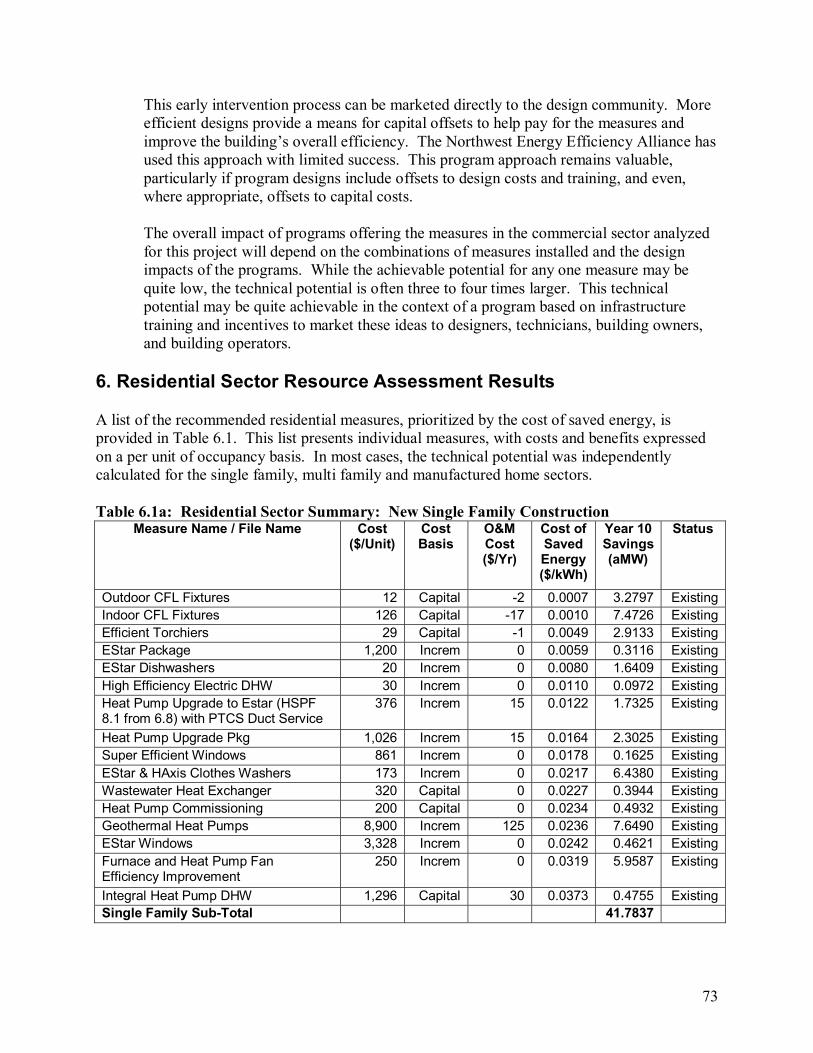
73
This early intervention process can be marketed directly to the design community. More efficient designs provide a means for capital offsets to help pay for the measures and improve the building’s overall efficiency. The Northwest Energy Efficiency Alliance has used this approach with limited success. This program approach remains valuable, particularly if program designs include offsets to design costs and training, and even, where appropriate, offsets to capital costs. The overall impact of programs offering the measures in the commercial sector analyzed for this project will depend on the combinations of measures installed and the design impacts of the programs. While the achievable potential for any one measure may be quite low, the technical potential is often three to four times larger. This technical potential may be quite achievable in the context of a program based on infrastructure training and incentives to market these ideas to designers, technicians, building owners, and building operators.
6. Residential Sector Resource Assessment Results A list of the recommended residential measures, prioritized by the cost of saved energy, is provided in Table 6.1. This list presents individual measures, with costs and benefits expressed on a per unit of occupancy basis. In most cases, the technical potential was independently calculated for the single family, multi family and manufactured home sectors. Table 6.1a: Residential Sector Summary: New Single Family Construction
Measure Name / File Name Cost ($/Unit)
Cost Basis
O&M Cost ($/Yr)
Cost of Saved Energy ($/kWh)
Year 10 Savings (aMW)
Status
Outdoor CFL Fixtures 12 Capital -2 0.0007 3.2797 Existing Indoor CFL Fixtures 126 Capital -17 0.0010 7.4726 Existing Efficient Torchiers 29 Capital -1 0.0049 2.9133 Existing EStar Package 1,200 Increm 0 0.0059 0.3116 Existing EStar Dishwashers 20 Increm 0 0.0080 1.6409 Existing High Efficiency Electric DHW 30 Increm 0 0.0110 0.0972 Existing Heat Pump Upgrade to Estar (HSPF 8.1 from 6.8) with PTCS Duct Service
376 Increm 15 0.0122 1.7325 Existing
Heat Pump Upgrade Pkg 1,026 Increm 15 0.0164 2.3025 Existing Super Efficient Windows 861 Increm 0 0.0178 0.1625 Existing EStar & HAxis Clothes Washers 173 Increm 0 0.0217 6.4380 Existing Wastewater Heat Exchanger 320 Capital 0 0.0227 0.3944 Existing Heat Pump Commissioning 200 Capital 0 0.0234 0.4932 Existing Geothermal Heat Pumps 8,900 Increm 125 0.0236 7.6490 Existing EStar Windows 3,328 Increm 0 0.0242 0.4621 Existing Furnace and Heat Pump Fan Efficiency Improvement
250 Increm 0 0.0319 5.9587 Existing
Integral Heat Pump DHW 1,296 Capital 30 0.0373 0.4755 Existing Single Family Sub-Total 41.7837

74
Table 6.1b: Residential Sector Summary: New Manufactured Homes Measure Name / File Name Cost
($/Unit) O&M
Cost ($/Yr)
Cost of Saved Energy ($/kWh)
Year 10 Savings (aMW)
Status
Outdoor CFL Fixtures 12 Capital -2 0.0007 0.5383 Existing Indoor CFL Fixtures 126 Capital -17 0.0010 1.2265 Existing Efficient Torchiers 29 Capital -1 0.0049 0.4781 Existing EStar Package 700 Increm 0 0.0068 0.0000 Existing EStar Dishwashers 20 Increm 0 0.0080 0.2534 Existing High Efficiency Electric DHW 30 Increm 0 0.0110 0.2716 Existing Heat Pump Upgrade to Estar (HSPF 8.1 from 6.8) with PTCS Duct Service
376 Increm 15 0.0179 0.7284 Existing
EStar & HAxis Clothes Washers 173 Increm 0 0.0217 1.0192 Existing Heat Pump Upgrade Pkg 1,026 Increm 15 0.0240 1.2459 Existing Super Efficient Windows 530 Increm 0 0.0302 1.1682 Existing Furnace and Heat Pump Fan Efficiency Improvement
250 Increm 0 0.0319 0.9228 Existing
Heat Pump Commissioning 200 Capital 0 0.0342 0.2425 Existing Geothermal Heat Pumps 8,900 Increm 125 0.0346 14.5754 Existing Integral Heat Pump DHW 1,296 Capital 30 0.0373 1.3282 Existing EStar Windows 2,048 Increm 0 0.0466 2.9316 Existing Manufactured Home Sub-Total 26.930
Table 6.1c: Residential Sector Summary: New Multi-Family Construction
Measure Name / File Name Cost ($/Unit)
Cost Basis
O&M Cost ($/Yr)
Cost of Saved Energy ($/kWh)
Year 10 Savings (aMW)
Status
Indoor CFL Fixtures 60 Capital -8 0.0007 1.6224 ExistingEfficient Torchiers 29 Capital -1 0.0049 0.9811 ExistingEStar Dishwashers 20 Increm 0 0.0080 0.4916 ExistingHigh Efficiency Electric DHW 30 Increm 0 0.0110 0.0859 ExistingSuper Efficient Windows 462 Increm 0 0.0178 5.5854 ExistingEStar & HAxis Clothes Washers 173 Increm 0 0.0217 1.3343 ExistingEStar Windows 1,449 Increm 0 0.0268 23.0041 ExistingMulti Family Home Sub-Total 33.105
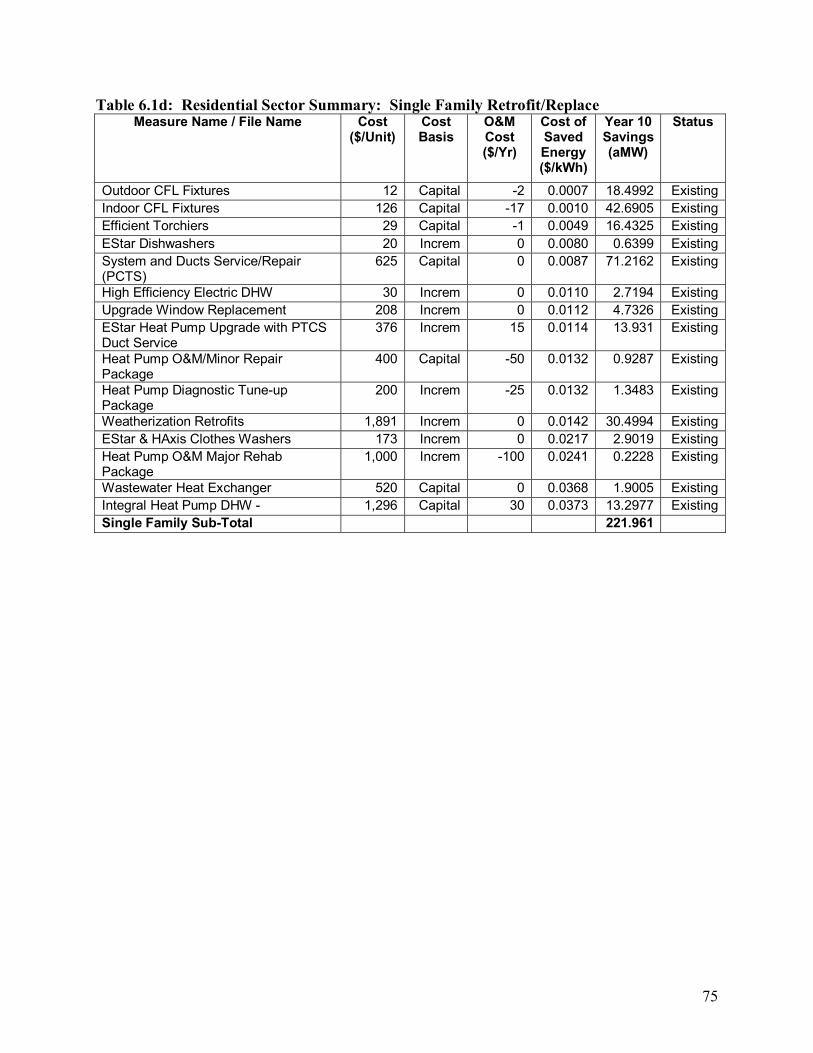
75
Table 6.1d: Residential Sector Summary: Single Family Retrofit/Replace Measure Name / File Name Cost
($/Unit) Cost Basis
O&M Cost ($/Yr)
Cost of Saved Energy ($/kWh)
Year 10 Savings (aMW)
Status
Outdoor CFL Fixtures 12 Capital -2 0.0007 18.4992 Existing Indoor CFL Fixtures 126 Capital -17 0.0010 42.6905 Existing Efficient Torchiers 29 Capital -1 0.0049 16.4325 Existing EStar Dishwashers 20 Increm 0 0.0080 0.6399 Existing System and Ducts Service/Repair (PCTS)
625 Capital 0 0.0087 71.2162 Existing
High Efficiency Electric DHW 30 Increm 0 0.0110 2.7194 Existing Upgrade Window Replacement 208 Increm 0 0.0112 4.7326 Existing EStar Heat Pump Upgrade with PTCS Duct Service
376 Increm 15 0.0114 13.931 Existing
Heat Pump O&M/Minor Repair Package
400 Capital -50 0.0132 0.9287 Existing
Heat Pump Diagnostic Tune-up Package
200 Increm -25 0.0132 1.3483 Existing
Weatherization Retrofits 1,891 Increm 0 0.0142 30.4994 Existing EStar & HAxis Clothes Washers 173 Increm 0 0.0217 2.9019 Existing Heat Pump O&M Major Rehab Package
1,000 Increm -100 0.0241 0.2228 Existing
Wastewater Heat Exchanger 520 Capital 0 0.0368 1.9005 Existing Integral Heat Pump DHW - 1,296 Capital 30 0.0373 13.2977 Existing Single Family Sub-Total 221.961
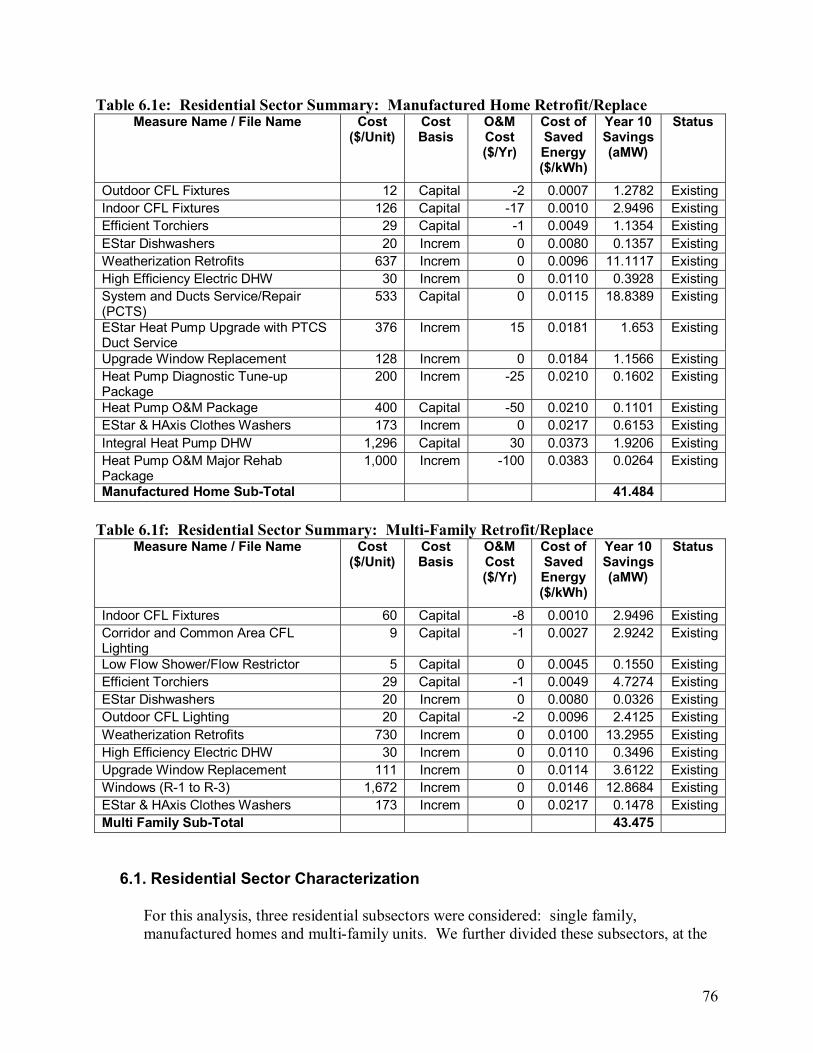
76
Table 6.1e: Residential Sector Summary: Manufactured Home Retrofit/Replace Measure Name / File Name Cost
($/Unit) Cost Basis
O&M Cost ($/Yr)
Cost of Saved Energy ($/kWh)
Year 10 Savings (aMW)
Status
Outdoor CFL Fixtures 12 Capital -2 0.0007 1.2782 Existing Indoor CFL Fixtures 126 Capital -17 0.0010 2.9496 Existing Efficient Torchiers 29 Capital -1 0.0049 1.1354 Existing EStar Dishwashers 20 Increm 0 0.0080 0.1357 Existing Weatherization Retrofits 637 Increm 0 0.0096 11.1117 Existing High Efficiency Electric DHW 30 Increm 0 0.0110 0.3928 Existing System and Ducts Service/Repair (PCTS)
533 Capital 0 0.0115 18.8389 Existing
EStar Heat Pump Upgrade with PTCS Duct Service
376 Increm 15 0.0181 1.653 Existing
Upgrade Window Replacement 128 Increm 0 0.0184 1.1566 Existing Heat Pump Diagnostic Tune-up Package
200 Increm -25 0.0210 0.1602 Existing
Heat Pump O&M Package 400 Capital -50 0.0210 0.1101 Existing EStar & HAxis Clothes Washers 173 Increm 0 0.0217 0.6153 Existing Integral Heat Pump DHW 1,296 Capital 30 0.0373 1.9206 Existing Heat Pump O&M Major Rehab Package
1,000 Increm -100 0.0383 0.0264 Existing
Manufactured Home Sub-Total 41.484 Table 6.1f: Residential Sector Summary: Multi-Family Retrofit/Replace
Measure Name / File Name Cost ($/Unit)
Cost Basis
O&M Cost ($/Yr)
Cost of Saved Energy ($/kWh)
Year 10 Savings (aMW)
Status
Indoor CFL Fixtures 60 Capital -8 0.0010 2.9496 Existing Corridor and Common Area CFL Lighting
9 Capital -1 0.0027 2.9242 Existing
Low Flow Shower/Flow Restrictor 5 Capital 0 0.0045 0.1550 Existing Efficient Torchiers 29 Capital -1 0.0049 4.7274 Existing EStar Dishwashers 20 Increm 0 0.0080 0.0326 Existing Outdoor CFL Lighting 20 Capital -2 0.0096 2.4125 Existing Weatherization Retrofits 730 Increm 0 0.0100 13.2955 Existing High Efficiency Electric DHW 30 Increm 0 0.0110 0.3496 Existing Upgrade Window Replacement 111 Increm 0 0.0114 3.6122 Existing Windows (R-1 to R-3) 1,672 Increm 0 0.0146 12.8684 Existing EStar & HAxis Clothes Washers 173 Increm 0 0.0217 0.1478 Existing Multi Family Sub-Total 43.475
6.1. Residential Sector Characterization
For this analysis, three residential subsectors were considered: single family, manufactured homes and multi-family units. We further divided these subsectors, at the
77
request of the Energy Trust, into low income, medium low income, and all other income levels (see the ResSectorChar.xls spreadsheet). For this analysis, only electricity savings were considered (excluding gas, propane, or other fuel savings). Therefore, for most residential measures, only electrically heated homes were included in the technical potential estimates provided here. There were three exceptions; the lighting and appliance measures were applied to homes heated with all fuel types, and the fan efficiency improvement measure was applied to homes with either gas or electric forced air furnaces. In cases where the nature of the measure limits its applicability to a portion of the homes (for example, duct measures exclude homes with basements), adjustments to the technical potential are contained in the workbook for that measure.
6.2. Lighting Measures
As Table 6.2 indicates, the most cost-effective measures are in the lighting end-use. Replacing or installing compact fluorescent lighting fixtures and bulbs in lieu of standard incandescent fixtures provides a weighted-average CSE of approximately $.001/kWh for both interior and exterior applications across all residential building types. In addition, this set of measures is one of the most widely applicable since incandescent lighting is the default used in new construction, home replacement and renovation, and retrofit applications. These lighting measures are also very cost-effective to the consumer, with an O&M savings of approximately $0.75 per fixture per year. The relatively high unit cost of CFL bulbs is a substantial market barrier to the increased usage of CFL fixtures. Although a wider selection of design options for fixtures and bulbs is available now than ever before, the selection of decorative lighting options is still somewhat limited. Nevertheless, the reduced energy usage and the longer lamp life of the CFL result in payback periods of less than 2 years for most consumer applications. This suggests the possibility of a market transformation that would result in CFLs becoming the standard for Oregon residential uses. In this context, the use of an extensive variety of lamps in new residential construction would improve the image and impact of this technology.
The measures evaluated for this analysis assume that 21 of the lamps in a single family or manufactured home would be replaced by fluorescent bulbs, based on a weighted average of three prototype homes simulated by Ecotope for the RFT analysis. For the multi-family sector, we assumed that 10 bulbs would be replaced, based on a similar weighted average of two prototypes. Such a measure would be aimed at most or all of the most commonly used fixtures in the home (especially fixtures in the kitchen, bathrooms and bedrooms). The cost of such a measure would be about $125 per home, resulting in savings of 600 to 800 kWh per home per year. For exterior applications, the number of fixtures replaced was set at two per home. One popular decorative lighting option, fluorescent torchiers, was also analyzed and found to be very cost-effective.
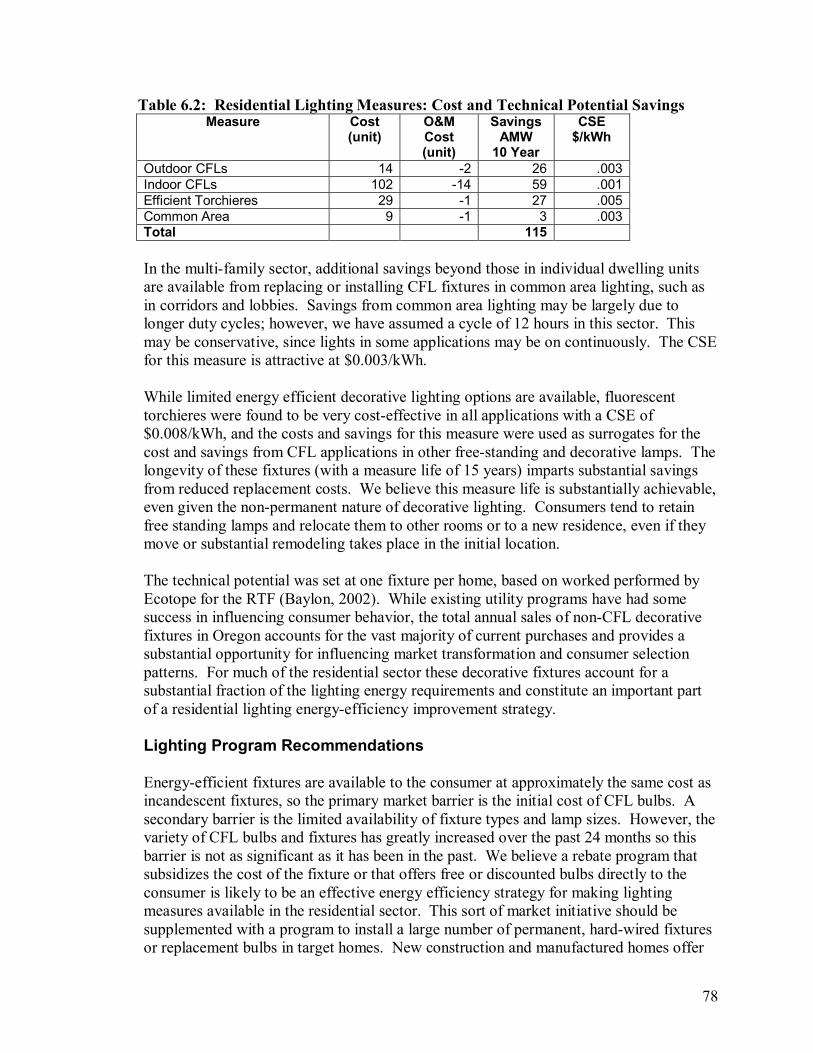
78
Table 6.2: Residential Lighting Measures: Cost and Technical Potential Savings Measure Cost
(unit) O&M Cost (unit)
Savings AMW
10 Year
CSE $/kWh
Outdoor CFLs 14 -2 26 .003 Indoor CFLs 102 -14 59 .001 Efficient Torchieres 29 -1 27 .005 Common Area 9 -1 3 .003 Total 115 In the multi-family sector, additional savings beyond those in individual dwelling units are available from replacing or installing CFL fixtures in common area lighting, such as in corridors and lobbies. Savings from common area lighting may be largely due to longer duty cycles; however, we have assumed a cycle of 12 hours in this sector. This may be conservative, since lights in some applications may be on continuously. The CSE for this measure is attractive at $0.003/kWh. While limited energy efficient decorative lighting options are available, fluorescent torchieres were found to be very cost-effective in all applications with a CSE of $0.008/kWh, and the costs and savings for this measure were used as surrogates for the cost and savings from CFL applications in other free-standing and decorative lamps. The longevity of these fixtures (with a measure life of 15 years) imparts substantial savings from reduced replacement costs. We believe this measure life is substantially achievable, even given the non-permanent nature of decorative lighting. Consumers tend to retain free standing lamps and relocate them to other rooms or to a new residence, even if they move or substantial remodeling takes place in the initial location. The technical potential was set at one fixture per home, based on worked performed by Ecotope for the RTF (Baylon, 2002). While existing utility programs have had some success in influencing consumer behavior, the total annual sales of non-CFL decorative fixtures in Oregon accounts for the vast majority of current purchases and provides a substantial opportunity for influencing market transformation and consumer selection patterns. For much of the residential sector these decorative fixtures account for a substantial fraction of the lighting energy requirements and constitute an important part of a residential lighting energy-efficiency improvement strategy. Lighting Program Recommendations Energy-efficient fixtures are available to the consumer at approximately the same cost as incandescent fixtures, so the primary market barrier is the initial cost of CFL bulbs. A secondary barrier is the limited availability of fixture types and lamp sizes. However, the variety of CFL bulbs and fixtures has greatly increased over the past 24 months so this barrier is not as significant as it has been in the past. We believe a rebate program that subsidizes the cost of the fixture or that offers free or discounted bulbs directly to the consumer is likely to be an effective energy efficiency strategy for making lighting measures available in the residential sector. This sort of market initiative should be supplemented with a program to install a large number of permanent, hard-wired fixtures or replacement bulbs in target homes. New construction and manufactured homes offer

79
the best opportunity, but other programs could target existing single family dwellings. The objective here would be to develop a much larger installed base for CFLs. This would give the consumer more incentive to purchase CFLs and generate more interest in the retail marketing efforts of CFL manufacturers and retailers.
6.3. Appliances Our reviews of appliances with Energy Star or better ratings appear to offer varying opportunities for energy savings in residential new construction. In new homes, dishwashers rated to Energy Star or H-Axis standards provided a cost of saved energy of $0.0119 kWh in single-family, multi-family and manufactured home units. By contrast, the relatively high incremental cost of $173 for clothes washers increased the CSE for these appliances to $0.032 kWh in new construction. The appliance measures reviewed were cost-effective but offer relatively little overall savings to the Energy Trust or to the customer. These results are shown in Table 6.3.
Table 6.3: Residential Appliances: Measure Cost and Technical Potential Savings Measure Cost
(unit) O&M Cost (unit)
Savings AMW
10 Year
CSE $/kWh
Dishwashers 20 0 3 .008 Clothes washers 173 0 12 .022 Total 15
6.4. HVAC Measures Some of the most substantial long-term savings in the residential sector are available from measures aimed at improving the efficiency of existing heat pumps and duct systems. However, because of the relatively high cost to program sponsors of conducting these programs and the inherent difficulty in pre-screening potential candidate program participants, these measures do not appear in the top dozen recommended measures. For measures to improve the efficiency of existing ducted heat pump systems, intelligent program design can go far to maximize realized program savings. A program based on field visits to single-family homes, that offers minor adjustments to HVAC equipment (adjust charge, clean filters, check settings) provides a cost of saved energy of about $0.02/kWh, even though approximately 20 percent of the homes visited will not, based on previous experience, have equipment deficiencies that can be corrected by the field technician. Utilizing the field opportunity to identify candidates that would benefit from more extensive interventions, however, provides substantial savings with virtually no additional program management or candidate identification costs. Although the more labor intensive minor repair measure and the major component replacement measure that we evaluated are not cost-effective as standalone measures (each have a CSE of about $0.06/kWh), the entire program is cost-effective when combined with the basic tune up measure. The total potential energy savings of the program are substantial.

80
Based on work conducted for the RTF, we estimate that one-fourth of the homes receiving the tune up would benefit from the addition or upgrade of the defrost control and/or outdoor thermostat. Installing these measures in those homes so identified would result in an additional savings of 1,450 kWh/yr at an added cost of only $400. Approximately 3 percent of the homes (including homes with controlled resistance back up heat) receiving the tune up measure can also be expected to require the replacement or repair of a major component (defrost relay and control, compressor, etc.). Taking advantage of the opportunities for these latter measures would add approximately $1,000 to the cost of treating each of those homes, and would add about 3,000 kWh/yr to the total savings expected for each of those units.
In the evaluation of these measures, additional O&M offsets were assumed in order to account for the fact that the consumer would, in some cases, initiate repair visits and that these visits would cost a minimum of $200. In the analysis, it was assumed that the offset for the basic tune-up would be $25, accounting for the standard visit in one of eight cases. In the minor repair this was raised to one case in four, and in the major repair one visit in two cases was assumed. These consumer O&M benefits are assumed to offset the costs of the visit and the repair or tune-up measures undertaken.
Increasing and upgrading the heat pump stock in the residential sector also provides cost-effective savings to the program sponsor. Upgrading the quality of the heat pump from levels dictated by the Oregon Energy Code to an HSPF of 8.1 in new construction offers savings of 2450 kWh/yr with a CSE of $0.02/kWh when the PTCS duct service is also performed.
Table 6.4 includes a package of three HVAC measures that should be considered together in a program approach for improving heat pump and duct systems in the residential sector. For new construction, installing a ground source heat pump in lieu of an electric forced air furnace provides substantial savings at a cost-effective CSE of about $0.03/kWh. The first cost for these systems is high, at $8,900 but savings of up to 2.22 aMW per year could be realized. A program that provides low- or no-interest loans for this technology could be very effective at reducing overall heating energy use in target homes.

81
Table 6.4: Residential HVAC Measure: Cost and Technical Potential Savings Measure Cost
(unit) O&M Cost (unit)
Savings AMW
10 Year
CSE $/kWh
Heat Pump Upgrade w/PTCS 376 15 16 .018 Furnace/HP Fan Improvement 250 0 7 .032 Heat Pump Commissioning 200 0 1 .029 HP Diagnostic Tune Up 200 -25 2 .017 HP Major Rehab Package 1,000 -100 0 .249 HP O&M Minor Repair Pkg. 400 -50 1 .017 HP Upgrade Package 1,026 15 0 .020 HP Upgrade w/PTCS 376 15 2 .015 System & Duct Svc/Repair 579 0 90 .010 Geothermal Heat Pump 8,900 125 22 .029 Total 141
6.5. Energy Star Measures:
The State of Oregon has a progressive energy code which strictly regulates energy use in the residential sector, particular in shell measures. Therefore, we believe the most effective initiatives in new construction in the residential sector must focus on measures beyond current construction practices. With the exception of windows, the Oregon State Energy Code provides a good guideline for cost-effective shell measures (especially insulation levels) in residential new construction. Therefore, we did not review the costs of impacts from insulation measures in new construction. We did review the proposed regional Energy Star measure package for single-family and manufactured homes that is being promulgated as a regional standard. The single family package for electrically heated buildings is based on the installation of high efficiency heat pumps and Energy Star windows, along with a package of quality control measures designed to reduce both building shell and duct leakage and to stipulate the efficiency standard required of the heat pump itself. Variants of each of these measures would also apply to gas-fired heating systems. The impacts on gas systems are not, however, included in this analysis.
The bulk of these Energy Star measures focus on on-site quality control and inspection to deliver higher quality building envelope/HVAC systems than those required by the Oregon Energy Code. In manufactured homes, the Energy Star program parallels the Super Good Cents (SGC) program, although savings have been adjusted to include additional envelope measures and improved duct and heat pump standards. The Energy Star and SGC packages are aimed only at electrically-heated buildings. Together, they offer technical potential savings of about 4 aMW in 2010. Approximately two-thirds of these savings are achieved in the manufactured housing sector, where the saturation of electric heat in new construction is much higher than in the single family sector. In addition to the package measures, separate workbooks have been presented for several of the measures that are included in the Energy Star program. These include quality control and commissioning of Energy Star-rated heat pumps, the Performance Tested

82
Comfort System program (PTCS), and duct sealing based on standards included in recent Oregon tax credit legislation. Several windows measures were also analyzed for all residential sectors. A measure for Energy Star Class 35 windows was evaluated, which we estimate would provide an improvement of approximately 12 percent over the minimum performance of windows required in the Energy Code. Approximately 60 percent of the windows currently installed in new residential construction in Oregon, however, already meet the Energy Star labeling requirements. The measure we describe in the Energy Star windows workbook addresses only those low-end windows that do not already meet the Energy Star requirement. An additional measure to install Class 25 windows was evaluated (see Section 6.7). This represents a considerable improvement over current practice in Oregon. However, for this analysis, we did not consider this technology to be emerging. At least half-a-dozen of the major window suppliers in Oregon offer an efficient window with heat mirror that meets this level, including the popular Milgard and Viking lines.
Table 6.5: Residential Energy Star Package: Measure Cost and Technical Potential
Savings Measure Cost
(unit) O&M Cost (unit)
Savings AMW
10 Year
CSE $/kWh
EStar Package 950 0 .311 .006
6.6. Weatherization
The weatherization programs sponsored by Oregon utilities have been operating for most of 20 years. In this process, 40 to 50 percent of the electrically heated homes in the state have been treated with one or another weatherization package. Over this time, the treatments offered have varied by program, utility and year. For example, window treatments were not considered cost-effective during portions of the last two decades, and thus were not offered at times.
The analysis of the technical potential for residential weatherization attempts to take this program history into account. Saturations of specific weatherization measures are based on PGE’s public documents which detail their estimated penetration and saturation rates. It should be noted that the development of duct sealing and specifications and related air sealing measures have only been included in the more recent program designs.
The program proposed in the weatherization workbooks accompanying this report takes into account advances in air and duct sealing to improve both the overall impact of the weatherization and to increase the saturation potential for a more modern weatherization program. Working against this potential increase in saturation, the current cost of electricity provides a significant incentive for homes to be converted from electric resistance to systems using gas or heat pumps. While this conversion trend is dependent on the relationship between gas and electricity costs, we expect that the trend toward conversions will continue, either before or after a particular home is weatherized. The
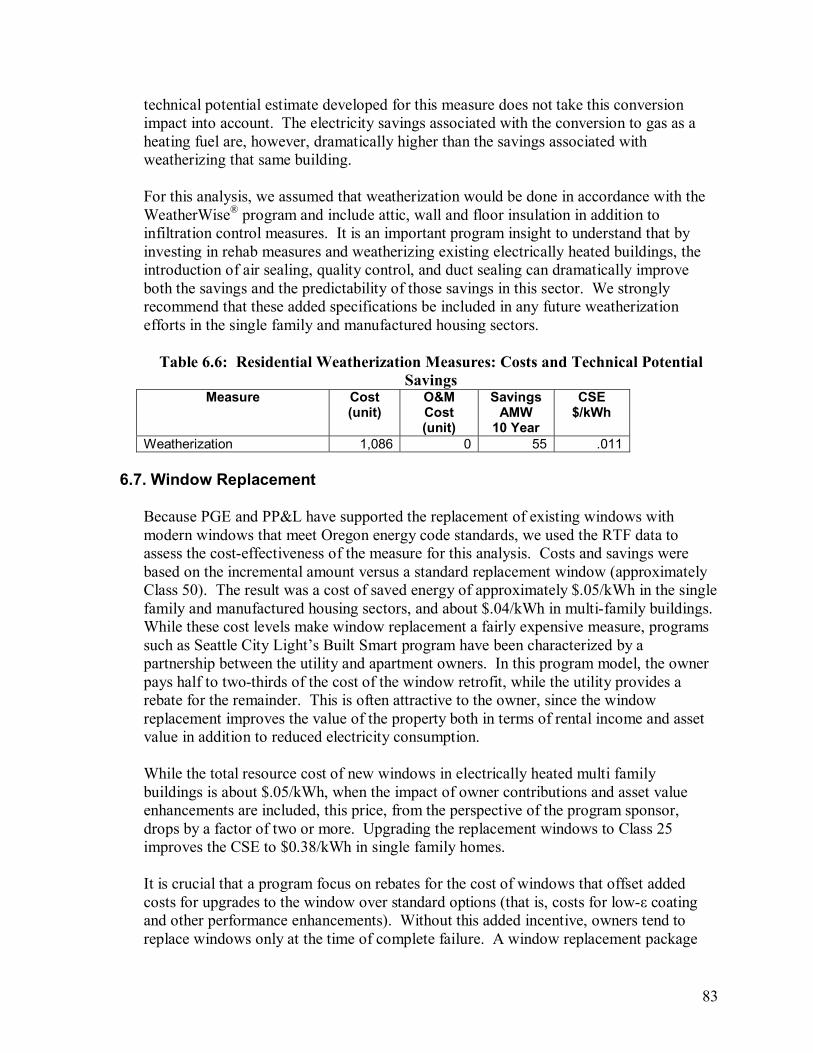
83
technical potential estimate developed for this measure does not take this conversion impact into account. The electricity savings associated with the conversion to gas as a heating fuel are, however, dramatically higher than the savings associated with weatherizing that same building.
For this analysis, we assumed that weatherization would be done in accordance with the WeatherWise® program and include attic, wall and floor insulation in addition to infiltration control measures. It is an important program insight to understand that by investing in rehab measures and weatherizing existing electrically heated buildings, the introduction of air sealing, quality control, and duct sealing can dramatically improve both the savings and the predictability of those savings in this sector. We strongly recommend that these added specifications be included in any future weatherization efforts in the single family and manufactured housing sectors.
Table 6.6: Residential Weatherization Measures: Costs and Technical Potential
Savings Measure Cost
(unit) O&M Cost (unit)
Savings AMW
10 Year
CSE $/kWh
Weatherization 1,086 0 55 .011
6.7. Window Replacement
Because PGE and PP&L have supported the replacement of existing windows with modern windows that meet Oregon energy code standards, we used the RTF data to assess the cost-effectiveness of the measure for this analysis. Costs and savings were based on the incremental amount versus a standard replacement window (approximately Class 50). The result was a cost of saved energy of approximately $.05/kWh in the single family and manufactured housing sectors, and about $.04/kWh in multi-family buildings. While these cost levels make window replacement a fairly expensive measure, programs such as Seattle City Light’s Built Smart program have been characterized by a partnership between the utility and apartment owners. In this program model, the owner pays half to two-thirds of the cost of the window retrofit, while the utility provides a rebate for the remainder. This is often attractive to the owner, since the window replacement improves the value of the property both in terms of rental income and asset value in addition to reduced electricity consumption.
While the total resource cost of new windows in electrically heated multi family buildings is about $.05/kWh, when the impact of owner contributions and asset value enhancements are included, this price, from the perspective of the program sponsor, drops by a factor of two or more. Upgrading the replacement windows to Class 25 improves the CSE to $0.38/kWh in single family homes. It is crucial that a program focus on rebates for the cost of windows that offset added costs for upgrades to the window over standard options (that is, costs for low-ε coating and other performance enhancements). Without this added incentive, owners tend to replace windows only at the time of complete failure. A window replacement package
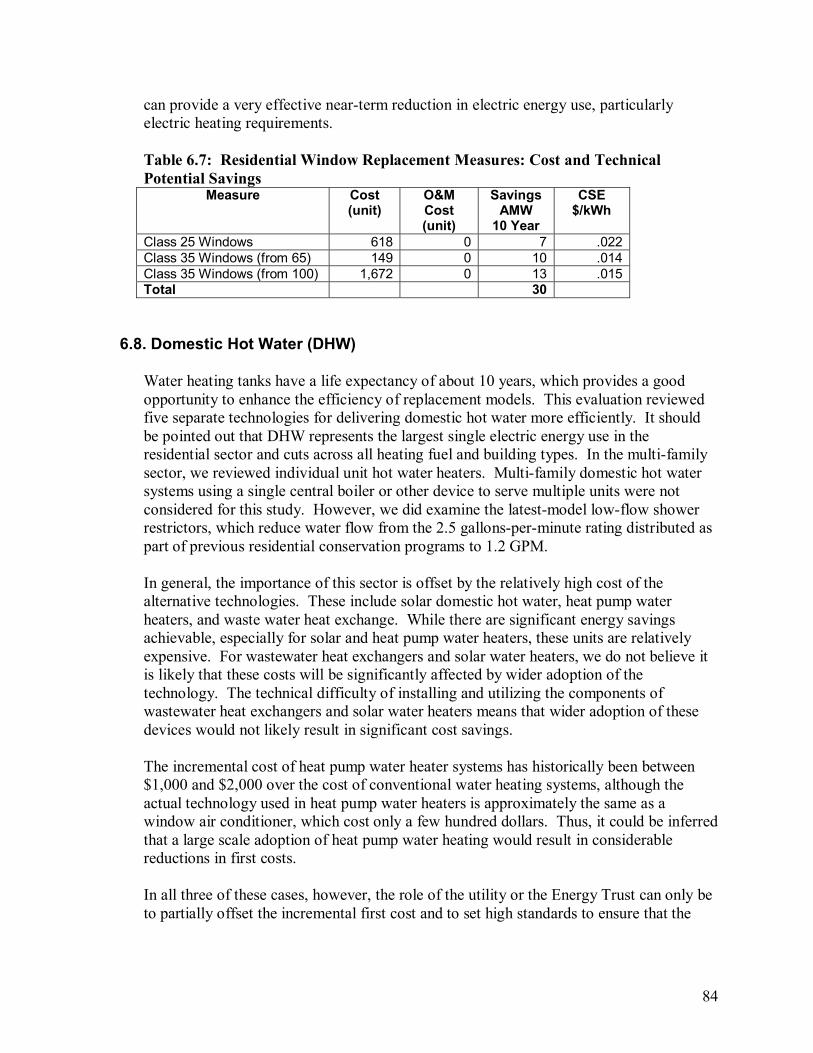
84
can provide a very effective near-term reduction in electric energy use, particularly electric heating requirements. Table 6.7: Residential Window Replacement Measures: Cost and Technical Potential Savings
Measure Cost (unit)
O&M Cost (unit)
Savings AMW
10 Year
CSE $/kWh
Class 25 Windows 618 0 7 .022 Class 35 Windows (from 65) 149 0 10 .014 Class 35 Windows (from 100) 1,672 0 13 .015 Total 30
6.8. Domestic Hot Water (DHW)
Water heating tanks have a life expectancy of about 10 years, which provides a good opportunity to enhance the efficiency of replacement models. This evaluation reviewed five separate technologies for delivering domestic hot water more efficiently. It should be pointed out that DHW represents the largest single electric energy use in the residential sector and cuts across all heating fuel and building types. In the multi-family sector, we reviewed individual unit hot water heaters. Multi-family domestic hot water systems using a single central boiler or other device to serve multiple units were not considered for this study. However, we did examine the latest-model low-flow shower restrictors, which reduce water flow from the 2.5 gallons-per-minute rating distributed as part of previous residential conservation programs to 1.2 GPM.
In general, the importance of this sector is offset by the relatively high cost of the alternative technologies. These include solar domestic hot water, heat pump water heaters, and waste water heat exchange. While there are significant energy savings achievable, especially for solar and heat pump water heaters, these units are relatively expensive. For wastewater heat exchangers and solar water heaters, we do not believe it is likely that these costs will be significantly affected by wider adoption of the technology. The technical difficulty of installing and utilizing the components of wastewater heat exchangers and solar water heaters means that wider adoption of these devices would not likely result in significant cost savings.
The incremental cost of heat pump water heater systems has historically been between $1,000 and $2,000 over the cost of conventional water heating systems, although the actual technology used in heat pump water heaters is approximately the same as a window air conditioner, which cost only a few hundred dollars. Thus, it could be inferred that a large scale adoption of heat pump water heating would result in considerable reductions in first costs.
In all three of these cases, however, the role of the utility or the Energy Trust can only be to partially offset the incremental first cost and to set high standards to ensure that the

85
installed technologies perform well over their life cycles so as to provide a consistent payback on the initial investment.
For a solar and heat pump water heater program, we recommend that partial incentives be offered only when detailed specifications have been developed and a quality control mechanism is in place to ensure that these specifications are met. In the absence of such a relatively extensive program, supporting the introduction of higher-than-standard efficiency electric resistance water heaters with relatively low incremental cost provides a modest energy savings, with a cost of saved energy of approximately $.011/kWh.
Table 6.8: Residential Domestic Hot Water Measures: Cost and Technical Potential Measure Cost
(unit) O&M Cost (unit)
Savings AMW
10 Year
CSE $/kWh
Hi Eff Electric DHW 30 0 4 .011 Integral HP DHW 1,296 30 17 .037 Wastewater Heat Exchanger 420 0 2 .030 Low Flow Shower Restrictor 5 0 17 .037 Total 40
6.9. Multi Family Sector
As in the single-family and manufactured home sectors, CFL lighting measures together contribute the most cost-effective program options for multi-family units. Unlike in the other sectors, however, multi-family weatherization options are both cost-effective and available to a large population. A measure aimed at installing attic, wall and floor insulation along with infiltration control in existing multi-family buildings was found to have a cost of saved energy of $0.01/kWh. The number of units that could benefit from this measure is estimated to be almost 90,000 according to our extrapolations of utility data. Assuming a program target of 10 percent of the potential recipients for this measure, the total savings in year 2010 would be 13 aMW (out of the 55 aMW total discussed in section 6.6, above). Multi-family sector weatherization programs require a different approach than those typically used in the single-family and manufactured homes sectors. Relatively few electrically heated multi-family buildings have ducted systems, either furnaces or heat pumps. Weatherization in these buildings is focused on the shell. In the multi-family sector, virtually all vintages of buildings have received some amount of insulation (usually for sound control). Typically, weatherization efforts in this sector would focus on window insulation and window replacement as the primary measures, with floor, ceiling and wall insulation as secondary measures to be applied to older vintage buildings. Older buildings of this type are especially prevalent in the urbanized core of Portland.
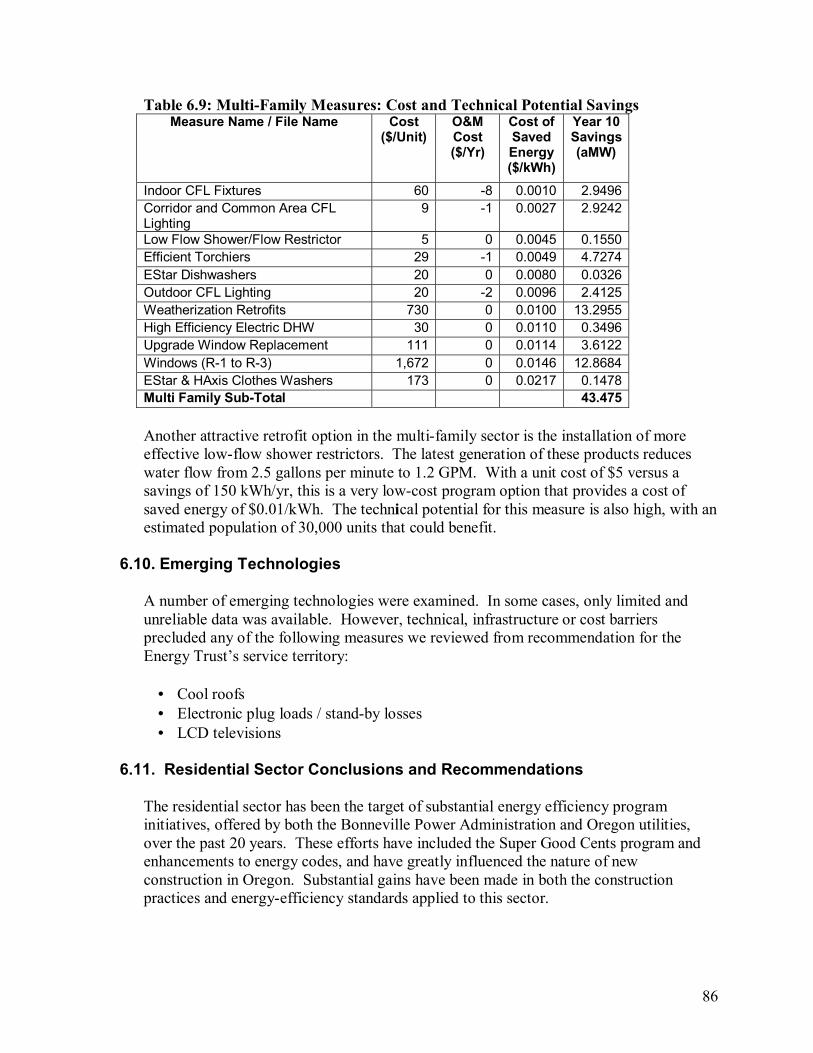
86
Table 6.9: Multi-Family Measures: Cost and Technical Potential Savings Measure Name / File Name Cost
($/Unit) O&M Cost ($/Yr)
Cost of Saved Energy($/kWh)
Year 10 Savings (aMW)
Indoor CFL Fixtures 60 -8 0.0010 2.9496 Corridor and Common Area CFL Lighting
9 -1 0.0027 2.9242
Low Flow Shower/Flow Restrictor 5 0 0.0045 0.1550 Efficient Torchiers 29 -1 0.0049 4.7274 EStar Dishwashers 20 0 0.0080 0.0326 Outdoor CFL Lighting 20 -2 0.0096 2.4125 Weatherization Retrofits 730 0 0.0100 13.2955 High Efficiency Electric DHW 30 0 0.0110 0.3496 Upgrade Window Replacement 111 0 0.0114 3.6122 Windows (R-1 to R-3) 1,672 0 0.0146 12.8684 EStar & HAxis Clothes Washers 173 0 0.0217 0.1478 Multi Family Sub-Total 43.475 Another attractive retrofit option in the multi-family sector is the installation of more effective low-flow shower restrictors. The latest generation of these products reduces water flow from 2.5 gallons per minute to 1.2 GPM. With a unit cost of $5 versus a savings of 150 kWh/yr, this is a very low-cost program option that provides a cost of saved energy of $0.01/kWh. The technical potential for this measure is also high, with an estimated population of 30,000 units that could benefit.
6.10. Emerging Technologies
A number of emerging technologies were examined. In some cases, only limited and unreliable data was available. However, technical, infrastructure or cost barriers precluded any of the following measures we reviewed from recommendation for the Energy Trust’s service territory:
• Cool roofs • Electronic plug loads / stand-by losses • LCD televisions
6.11. Residential Sector Conclusions and Recommendations
The residential sector has been the target of substantial energy efficiency program initiatives, offered by both the Bonneville Power Administration and Oregon utilities, over the past 20 years. These efforts have included the Super Good Cents program and enhancements to energy codes, and have greatly influenced the nature of new construction in Oregon. Substantial gains have been made in both the construction practices and energy-efficiency standards applied to this sector.

87
During this 20-year period, almost half of the existing residential units in Oregon have been weatherized to some degree. The trends toward more efficiency in electrically-heated buildings are affected by the high rate of conversions from electric heat to gas heat, but will remain important. The programs and measures developed for this review focus largely on operation, maintenance and commissioning that could upgrade the performance of heating systems, cooling systems, and overall equipment efficiency over the default standards in this relatively unregulated area of residential energy use.
For the most part, these measures have the potential to provide the most significant savings, equivalent to the savings provided by window and insulation measures applied in the 1980s and 1990s. These measures have been included in the RTF spreadsheets, but for the most part, they imply on-site quality control and installer certification. The Oregon tax credit and the attendant demand for higher efficiency heat pumps and duct systems has had a noticeable impact on this industry in Oregon for the past two or three years. We believe a program that enhances this improvement through the benefits of performance testing and installation standards can be cost-effective, with benefits that will be realized throughout the new and existing residential population.
The cost-effectiveness and potential savings for these heating and duct system measures provide an opportunity for the Energy Trust to use its auspices to ensure that quality control and installation standards remain not only a viable part of these industries, but also become an standard part of installation, retrofit and inspection practices used in the residential HVAC industries.
The most effective programs in the residential sector, both in terms of cost-effectiveness and energy use reduction, are likely to be based on the replacement of incandescent lighting with compact fluorescent lighting. In every application and in every subsector, these measures provide substantial savings at minimal cost. From a programmatic view, lighting programs are also inexpensive to administer and do not require any field work.
We also believe that substantial savings are available from improvements in heating and cooling systems. Programs targeting these end uses can greatly improve their overall program cost-effectiveness by combining duct system and equipment repairs and replacements into a basic O&M package that eliminates the considerable cost of identifying homes that are in need of substantial repairs to these systems.
88
7. References Anderson, Kenneth J., Project Development Engineer, Northwest Energy Efficiency Alliance,
Personal Communications
Arthur D. Little, Inc., EIA - Technology Forecast Updates - Residential and Commercial Buildings Technologies - Advanced Adoption Case, Presented to the Energy Information Administration of the US Dept. of Energy, September 2, 1998
Arthur D. Little, Inc., Energy Savings Potential for Commercial Refrigeration Equipment, Final Report, Building Equipment Division, Office of Building Technologies, U.S. Department of Energy, June 1996
Barnes, P.R., S. Das, B. W. McConnell, and J. W. Van Dyke. September 1997, Supplement to the "Determination Analysis" (ORNL-6847) and Analysis of the NEMA Efficiency Standard for Distribution Transformers, Oak Ridge National Laboratory.
Baylon and Davis, (1999) Residential Duct Sealing Cost/Benefit Analysis, December 1999. Prepared for the Oregon Office of Energy (Salem, OR), in cooperation with the Northwest Energy Efficiency Alliance (Seattle, WA) and Electric Power Research Institute (Palo Alto, CA).
Baylon, Kennedy, Borrelli and Roberts, (2001) Baseline Characteristics of the Multi-Family Sectors in Idaho, Montana, Oregon & Washington, April 2001. Prepared for the Northwest Energy Efficiency Alliance, Seattle, WA.
Baylon, Kennedy and Borrelli, (2001) Baseline Characteristics of the Non-Residential Sector in Idaho, Montana, Oregon & Washington, April 2001. Prepared for the Northwest Energy Efficiency Alliance, Seattle, WA.
Baylon, Kennedy and Borrelli, (2001) Baseline Characteristics of the Residential Sector in Idaho, Montana, Oregon & Washington, April 2001. Prepared for the Northwest Energy Efficiency Alliance, Seattle, WA.
Baylon, Kennedy and DeLaHunt, (1987), Conservation Potential for the Multi-Family Sector, July 1987, Prepared for Seattle City Light (Seattle, WA) under subcontract to United Industries Corporation
Beck, F. (2001), Energy Smart Data Centers: Applying Energy Efficient Design and Technology to the Digital Information Sector, Renewable Energy Policy Project (REPP) Research Report No. 14, November 2001. REPP, Washington, D.C.
Brown, E, Elliott, N., Shipley, A. (2002), Clean Power for the Internet, American Council for an Energy-Efficient Economy, Washington, D.C.
Cadmus Group, Inc (1999), Metered Load Factors for Low-Voltage, Dry-Type Transformers in Commercial, Industrial, and Public Buildings.

89
Davis, Francisco, Kennedy and Baylon. (2002) Enhanced Operations & Maintenance Procedures for Small Packaged Rooftop HVAC Systems: Protocol Development, Field Review, and Measure Assessment, Final Report, April 2002. Prepared for the Eugene Water and Electric Board, Eugene, OR.
DeLaHunt, Hanford, Palmiter (1984), Consumption Characteristics in the Multi-Family Sector, October 1984, Prepared for Seattle City Light (Seattle, WA) under subcontract to United Industries Corporation
DEER, 2001 Update Study Final Report, Prepared for California Energy Commission, August, 2001.
Dimond, Chris of the Oregon Office of Energy, 7/30/2002, Personal Communications
Elliott, R.N. and S. Nadel. 2002. Pump and Fan Systems: Markets and Programs: A White Paper. Washington, D.C.: ACEEE.
Elliott, R.N., M. Pye, S. Nadel. 1996. Partnerships: A Path for the Design of Utility/Industrial Energy Efficiency Programs. ACEEE-U961. Washington, D.C.: American Council for an Energy-Efficient Economy.
Henry, Mary Beth, Mt. Hood Cable Regulatory Commission
Jennifer Thorne and Margaret Suozzo (1998), Leaking Electricity: Standby and Off-Mode Power Consumption in Consumer Electronics and Household Appliances. ACEEE Report, February 1998.
Kennedy, (1997) Energy Consequenses of Non-Compliance with 1994 Washington Commercial Energy Code – 1995 Construction Year, August 1997
Kennedy and Baylon, (2001) Survey of Energy Efficiency in Seattle’s New Non-Residential Buildings: 1995-2000, July 2001. Prepared for Seattle City Light, Seattle, WA.
Kubo, Toru and Steven Nadel, May 2002,Commercial Packaged Refrigeration: an untapped lode for energy efficiency. ACEEE. Report number A015.
Martin, N., E. Worrell, M. Ruth, L. Price, R. N. Elliott, A. M. Shipley, and J. Thorne. 2000. Emerging Energy-Efficient Industrial Technologies. Washington, D.C.: American Council for an Energy-Efficient Economy.
Mitchell-Jackson, Jennifer (2001), Energy Needs in an Internet Economy: A Closer Look at Data Centers. Masters thesis. Under Review. Berkeley, Calif.: University of California
Nadel, S., R.N. Elliott, M. Shepard, S. Greenberg, G. Katz, A.T. Almeida. 2002. Energy-Efficient Motor Systems: A Handbook on Technology, Program, and Policy Opportunities, Second Edition

90
Nadel, Steven, Leo Rainer, Michael Shepard, Margaret Suozzo, Jennifer Thorue, 1998, Emerging Energy-Saving Technologies And Practices For The Buildings Sector, ACEEE, Washington, D.C.
Nadel , S. 1998. Screening Market Transformation Opportunities: Lessons from the Last Decade, Promises for the Next Decade, Washington, D.C.: American Council for an Energy-Efficient Economy.
Nordman, Bruce, Mary Ann Piette, Brian Pon, and Kris Kinney. 1998. "It's Midnight...Is your Copier On?: ENERGY STAR Copier Performance.” Berkeley, CA: Lawrence Berkeley National Laboratory. Report No. LBNL-41332.
Robertson, Chris, and Joseph Romm (2002), Data Centers, Power, and Pollution Prevention Design for Business and Environmental Advantage. The Center for Energy and Climate Solutions, May, 2002.
Robertson, Chris, Chris Roberts Associates. private consultant, Personal Communication, 2002.
Sachs, H. M., 2001. Criteria for Assessment of New Equipment Research for CEE: Chiller Retirements and Replacements (Draft). Available from http://www.aceee.org/Buildings/ComEqTyp/PackRef/chillers-CEE.pdf.
Scofield, M. and K. Dunnavant, “Evaporative Cooling and TES after Deregulation”, ASHRAE Journal, vol 41, no. 12, December, 1999
Siegel, Davis, Francisco and Palmiter (1997), Measured Heating System Efficiency Retrofits in Eight Manufactured (HUD-Code) Homes, (EPRI TR-107737, Project Number 3841-5) July 1997, Prepared for Electric Power Research Institute, Palo Alto, CA.
Shipley, A., R.N. Elliott, and A. Hinge. 2002. Energy Efficiency Programs for Small and Medium-Sized Industry. ACEEE-IE002. Washington, D.C.: American Council for an Energy-Efficient Economy.
Tso, et.al, 2002, Costs and Benefits of Commissioning Oregon Public Buildings. Proceedings. ACEEE Summer Study,
United States Department of Energy, Assessment of High-Performance, Family-Sized Commercial Clothes Washers (Report # DOE/EE-0218)
United States Department of Energy, Energy Information Agency. State Energy Price and Expenditure Report 1997 (updated 2002).
Wang, et al., 2000, Public Interest Energy Research on Building Commissioning, California Energy Commission.
Webber, Carrie and Richard Brown. 1998. "Savings Potential for ENERGY STAR Voluntary Labeling Programs.” Proceedings of the ACEEE 1998 Summer Study on Energy
91
Efficiency in Buildings, Volume 9, pp. 271-282. Washington, DC: American Council for an Energy-Efficient Economy.
Webber, Carrie, Judy Roberson, Richard Brown, Christopher Payne, Bruce Nordman, and Jonathan Koomey. 2001. "Field Surveys of Office Equipment Operation Patterns.” Berkeley, CA: Lawrence Berkeley National Laboratory. Report No. LBNL- 46930. September 2001.
Westphalen, D. and S. Koszalinski, 1999. Energy Consumption Characteristics of Commercial Building HVAC Systems, Volume II: Thermal Distribution, Auxiliary Equipment, and Ventilation. A.D. Little, Cambridge, MA, reference #33745-00
Web Sites: http://www.aceee.org/Buildings/ComEqTyp/PackRef/chillers-CEE.pdf., ASHRAE 90.1, cited in
Table 5 of Sachs, 2001, Criteria for Assessment of New Equipment Research for CEE: Chiller Retirements and Replacements (Draft).
http://www.ari.org/pr/2001/041101chillers.html (press release from Air-Conditioning and Refrigeration Institute).
http://www.cee1.org/com, Consortium for Energy Efficiency website
http://www.eia.doe.gov/cneaf/electricity/esr/esrt01dp1.html., Year 2000 data (pre-California crisis, taken as “normal”). From the Energy Information Agency, US Dept of Energy.
http://www.hvacexchange.com/cooltools/coolhome.htm
Government Agencies:
[EIA] United States Department of Energy, Energy Information Agency. 2002. 2000 Industrial Sector Data for Oregon. Available: http://www.eia.doe.gov/cneaf/electricity/esr/esr_sum.html. Washington, D.C.: USDOE.
[USDA] United States Department of Agriculture, National Agricultural Statistics Service. 2000.
1997 Agricultural Census. Available: http://www.nass.usda.gov/census/. Washington, D.C.: USDA.
[USDOC] Department of Commerce. 2000. 1997 Economic Census. EC97C23S-AS.
Washington, D.C.: Department of Commerce.
APPENDIX A
Initial List of Measures for Consideration and Analysis
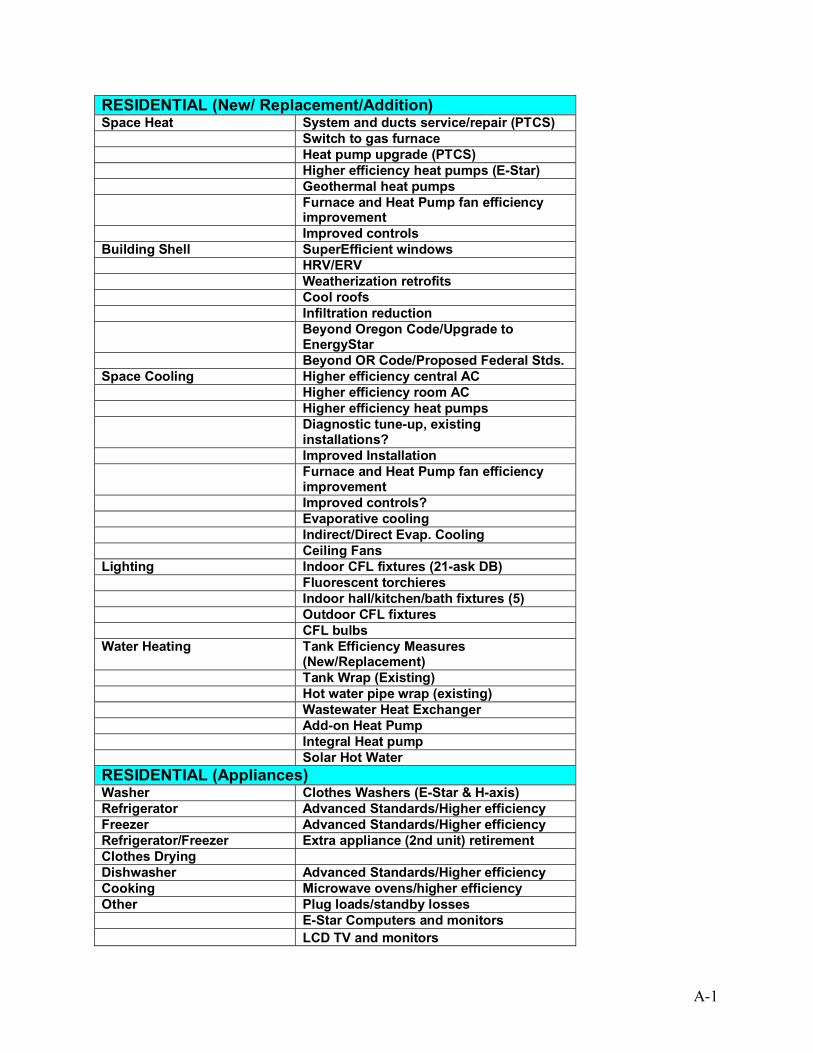
A-1
RESIDENTIAL (New/ Replacement/Addition) Space Heat System and ducts service/repair (PTCS) Switch to gas furnace Heat pump upgrade (PTCS) Higher efficiency heat pumps (E-Star) Geothermal heat pumps Furnace and Heat Pump fan efficiency
improvement Improved controls Building Shell SuperEfficient windows HRV/ERV Weatherization retrofits Cool roofs Infiltration reduction Beyond Oregon Code/Upgrade to
EnergyStar Beyond OR Code/Proposed Federal Stds. Space Cooling Higher efficiency central AC Higher efficiency room AC Higher efficiency heat pumps Diagnostic tune-up, existing
installations? Improved Installation Furnace and Heat Pump fan efficiency
improvement Improved controls? Evaporative cooling Indirect/Direct Evap. Cooling Ceiling Fans Lighting Indoor CFL fixtures (21-ask DB) Fluorescent torchieres Indoor hall/kitchen/bath fixtures (5) Outdoor CFL fixtures CFL bulbs Water Heating Tank Efficiency Measures
(New/Replacement) Tank Wrap (Existing) Hot water pipe wrap (existing) Wastewater Heat Exchanger Add-on Heat Pump Integral Heat pump Solar Hot Water RESIDENTIAL (Appliances) Washer Clothes Washers (E-Star & H-axis) Refrigerator Advanced Standards/Higher efficiency Freezer Advanced Standards/Higher efficiency Refrigerator/Freezer Extra appliance (2nd unit) retirement Clothes Drying Dishwasher Advanced Standards/Higher efficiency Cooking Microwave ovens/higher efficiency Other Plug loads/standby losses E-Star Computers and monitors LCD TV and monitors

A-2
RESIDENTIAL (Retrofit) Space Heat O&M Duct and furnace assessment Heat pump assessment Ducts service/repair Heat pump repair Space Heat Heat pump replacement for E. Furn.
(EnergyStar) Gas replacement for E.Furn. Lighting Replace hall/kitchen/bath fixtures Replace all lights with CF bulbs Windows Replace R1 with R-3 (at rehab) MULTIFAMILY (Retrofit) Building Shell Blown in walls (R-0 to R-11) Blown in ceilings (R-3 to R-30) Crawlspace upgrade window replacement(.38-.32) Windows(R-1 to R-3) Hot Water Low flow shower/flow restrictor Domestic hot water fuel switch Lighting Replacement-corridors and common
areas Replacement-exterior Heating/Cooling High efficiency cooling MULTIFAMILY (New) Building Shell EnergyStar windows, Improved shell (high-rise) Heating/Cooling Heat pump loop Rebate gas heating Cooling upgrade Hot Water Heat pump water heating MANUFACTURED HOMES (New) Meet Existing Standards SuperGoodCents Knock Once Hot Water Domestic hot water MANUFACTURED HOMES (Retrofit) Space Heat Equipment Upgrade Duct sealing Weatherization (air sealing)

A-3
COMMERCIAL Heating System & ducts servicing & repair Ground Source Heat Pump Heat Pump Loop Distribution Fan and Pump Improvements Underfloor Delivery Cooling High-efficiency chillers, Package Units Chiller optimization Evaporative systems, several sizes
(IDDEC) Residential-type Heat Pump Residential-type Room AC Residential-type CAC Ground Source Heat Pump PTAC Units System Controls/Economizers Cooling Tower Improvements Venting Fan system improvements Shell/General HVAC New/Code upgrade Cross cutting New/Commissioning (training) Windows: Upgrade to Class 35 & Class 25 Existing/Retrocommission & O&M Lighting High Eff Fluorescent Emerging Practices & Technologies Daylighting and Lighting Controls LED Exit signs LED Walk Signs LED Traffic Lights Refrigeration Lower cost measures Higher cost measures Packaged Refrigeration Equipment
(vending, icemakers, beverage machines) Water Heating Computerized Water Heater Controller Solar Hot Water Heat pump water heating Wastewater Heat Exchanger Cooking Various Technologies Misc Cross cutting programs High Efficiency Transformers Commercial Washing Machines Energy Management Systems Efficient Office Electronics Internet Data Centers Plug Loads and Stand By Losses Water Treatment Wastewater Treatment Membrane Technology Optimization of Aeration Systems Other Plug Loads Stand by Losses
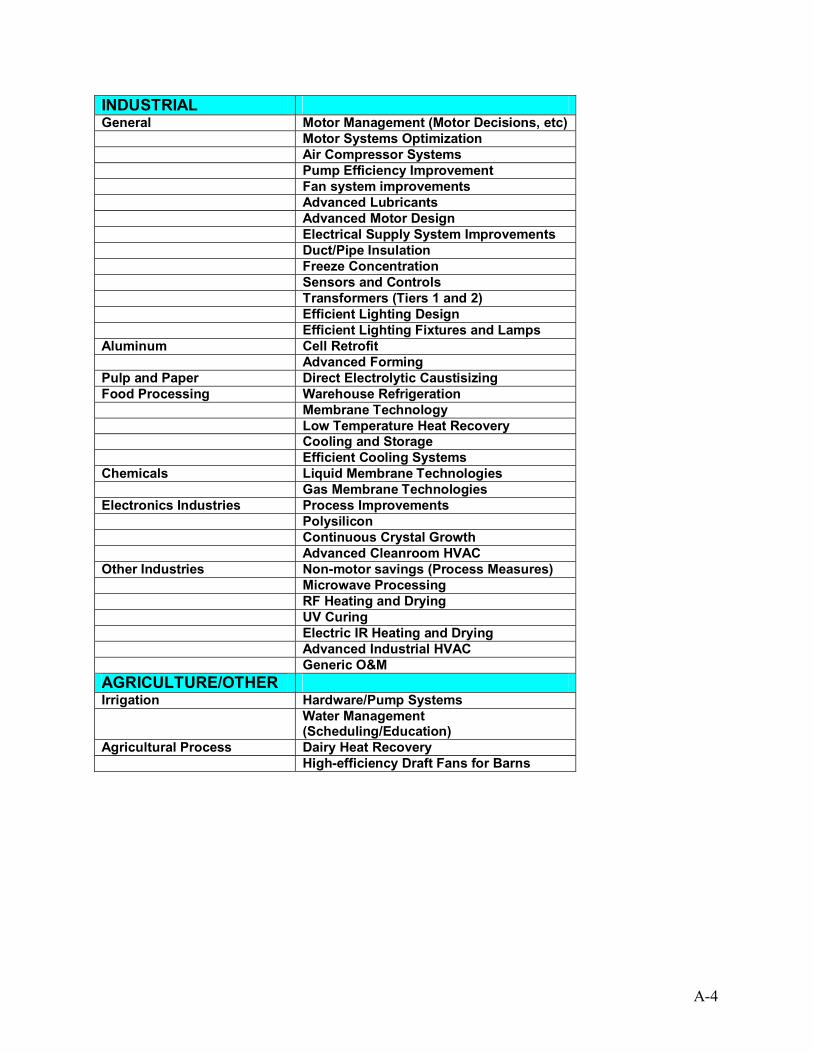
A-4
INDUSTRIAL General Motor Management (Motor Decisions, etc) Motor Systems Optimization Air Compressor Systems Pump Efficiency Improvement Fan system improvements Advanced Lubricants Advanced Motor Design Electrical Supply System Improvements Duct/Pipe Insulation Freeze Concentration Sensors and Controls Transformers (Tiers 1 and 2) Efficient Lighting Design Efficient Lighting Fixtures and Lamps Aluminum Cell Retrofit Advanced Forming Pulp and Paper Direct Electrolytic Caustisizing Food Processing Warehouse Refrigeration Membrane Technology Low Temperature Heat Recovery Cooling and Storage Efficient Cooling Systems Chemicals Liquid Membrane Technologies Gas Membrane Technologies Electronics Industries Process Improvements Polysilicon Continuous Crystal Growth Advanced Cleanroom HVAC Other Industries Non-motor savings (Process Measures) Microwave Processing RF Heating and Drying UV Curing Electric IR Heating and Drying Advanced Industrial HVAC Generic O&M AGRICULTURE/OTHER Irrigation Hardware/Pump Systems
Water Management (Scheduling/Education)
Agricultural Process Dairy Heat Recovery High-efficiency Draft Fans for Barns

APPENDIX B
Commentary on Selected Measures

The following memorandums address issues that the team felt were important to convey to the Energy Trust regarding measures that, while not cost-effective in our analysis, may still be appropriate in some circumstances. The following items are addressed in this Appendix:
Industrial/Large Commercial Sector:
• Large (350 ton) central chillers Commercial Sector:
• Data Centers • Commercial Cooking • Office Equipment
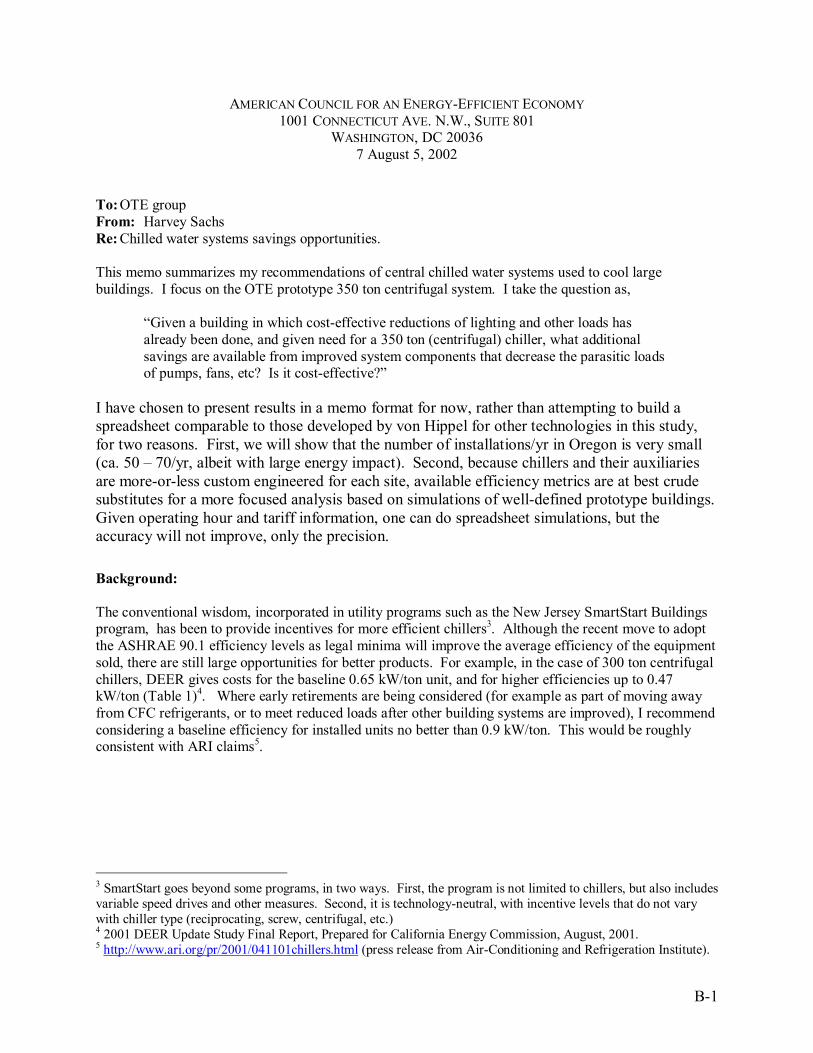
B-1
AMERICAN COUNCIL FOR AN ENERGY-EFFICIENT ECONOMY 1001 CONNECTICUT AVE. N.W., SUITE 801
WASHINGTON, DC 20036 7 August 5, 2002
To: OTE group From: Harvey Sachs Re: Chilled water systems savings opportunities. This memo summarizes my recommendations of central chilled water systems used to cool large buildings. I focus on the OTE prototype 350 ton centrifugal system. I take the question as,
“Given a building in which cost-effective reductions of lighting and other loads has already been done, and given need for a 350 ton (centrifugal) chiller, what additional savings are available from improved system components that decrease the parasitic loads of pumps, fans, etc? Is it cost-effective?”
I have chosen to present results in a memo format for now, rather than attempting to build a spreadsheet comparable to those developed by von Hippel for other technologies in this study, for two reasons. First, we will show that the number of installations/yr in Oregon is very small (ca. 50 – 70/yr, albeit with large energy impact). Second, because chillers and their auxiliaries are more-or-less custom engineered for each site, available efficiency metrics are at best crude substitutes for a more focused analysis based on simulations of well-defined prototype buildings. Given operating hour and tariff information, one can do spreadsheet simulations, but the accuracy will not improve, only the precision. Background: The conventional wisdom, incorporated in utility programs such as the New Jersey SmartStart Buildings program, has been to provide incentives for more efficient chillers3. Although the recent move to adopt the ASHRAE 90.1 efficiency levels as legal minima will improve the average efficiency of the equipment sold, there are still large opportunities for better products. For example, in the case of 300 ton centrifugal chillers, DEER gives costs for the baseline 0.65 kW/ton unit, and for higher efficiencies up to 0.47 kW/ton (Table 1)4. Where early retirements are being considered (for example as part of moving away from CFC refrigerants, or to meet reduced loads after other building systems are improved), I recommend considering a baseline efficiency for installed units no better than 0.9 kW/ton. This would be roughly consistent with ARI claims5.
3 SmartStart goes beyond some programs, in two ways. First, the program is not limited to chillers, but also includes variable speed drives and other measures. Second, it is technology-neutral, with incentive levels that do not vary with chiller type (reciprocating, screw, centrifugal, etc.) 4 2001 DEER Update Study Final Report, Prepared for California Energy Commission, August, 2001. 5 http://www.ari.org/pr/2001/041101chillers.html (press release from Air-Conditioning and Refrigeration Institute).

B-2
Table 1. DEER estimates of costs for 300 ton centrifugal chillers, augmented with incremental cost and percentage improvement data for this study.
Incremental costs of improved chiller efficiency (DEER, 2001)
kW/ton Cost, $/ton
Incremental cost
kW/ton, % Improvement
re. 0.9 re 0.650.9
0.65 $283 0.61 $297 $14 32% 6%0.54 $337 $54 40% 17%0.51 $343 $60 43% 22%0.47 $353 $70 48% 28%
In addition to replacing the chiller, system efficiency can be improved by attention to other system components. These include the cooling tower, fans and pumps, and controls. For example, an oversized cooling tower will provide cooler water to the chiller, reducing the work it does. “Parasitic” loads for chilled water systems are in the range of 22% of total chilled water system energy use (proportionally less than for other air conditioning systems)6. Table 2, below, puts this into a national context. Table 2. Non-chiller electric loads of commercial air conditioning systems. Derived from data in Westphalen and Koszalinski, 19997.
Parasitics and potential for savings. 1.5 quads primary energy losses, parasitics
0.27 fraction share of total primary for VAV and CAV 0.41 quads primary energy losses, parasitics in VAV & CAV
0.83 fraction (supply+return+exhaust) fans as fraction of parasitics
0.34 quads parasitics estimate, chiller system buildings (US) How big is the target population? As a general rule, chillers are only used in relatively large buildings8. The market for new installations and upgrades is very small. Nationwide, about 7500 centrifugal chillers were shipped in 19999. The
6 Westphalen, D. and S. Koszalinski, 1999. Energy Consumption Characteristics of Commercial Building HVAC Systems, Volume II: Thermal Distribution, Auxiliary Equipment, and Ventilation. A.D. Little, Cambridge, MA, reference #33745-00. 7 Westphalen, D. and S. Koszalinski, 1999. Energy Consumption Characteristics of Commercial Building HVAC Systems, Volume II: Thermal Distribution, Auxiliary Equipment, and Ventilation. A.D. Little, Cambridge, MA, reference #33745-00 8 Sachs, H. M., 2001. Criteria for Assessment of New Equipment Research for CEE: Chiller Retirements and Replacements (Draft). Available from http://www.aceee.org/Buildings/ComEqTyp/PackRef/chillers-CEE.pdf.

B-3
estimated market in California is 600 to 700 new chillers (median size 300 tons) each year for the next decade, 80% for replacements10. From this, since the population ratio between California and Oregon is close to 10:1, one would expect an Oregon market for 60 – 70 chillers/yr (300 ton equivalent). Almost all are likely to be in the PGE and PPL service territories. Several factors tend to make this number an upper bound:
1. Oregon has a cooler climate, meaning fewer operating hours per year over which to amortize an investment in more efficient equipment. To amplify this point, San Francisco and Seattle are both reported as about 250 CDD/yr, vs. 500 CDD/yr for LA11. This allows two inferences: (1) It is reasonable to interpolate between SF and Seattle to infer about the same low cooling load in Portland and the Willamette Valley. (2) The average CA load will be higher, driven by the doubled load in Southern California12.
2. Air-cooled packaged (rooftop) systems increasingly compete with chillers for market share. At
the conventional “rule-of-thumb” of 400 sf/ton of installed capacity, 100 tons corresponds to 40,000 sf. The building comprised two, equal-sized, 4-story wings, this load could be served by two 50 ton rooftop units, one per wing, or by one water-cooled chiller. 50 ton and larger roof-top equipment is increasingly available and accepted in the market. The full load minimum COP for air-cooled chillers with condensers, less than 150 tons capacity, is 2.80. Comparable values for water-cooled systems in the same size range are 4.45 and 5.0 for positive displacement and centrifugal units, respectively13.
3. I suspect that the “average” commercial building in CA is larger than in Oregon, and thus more
likely to use a central chilled water system than its Oregon counterpart. Low-rise buildings are increasingly likely to use large packaged rooftop systems instead of chilled water systems.
4. Oregon has lower electricity prices than California. Year 2000 commercial rates were 10.25 and
5.06 cents/kWh, respectively14. Lower electricity prices favor lower-first-cost alternatives (roof-top, air-cooled packaged units) with less operating efficiency.
Two factors might increase demand for chillers in Oregon. First, Oregon could have a higher population growth rate in the next decade than California. Second, there could be a coordinated program to encourage early replacement of CFC-using chillers. These are older, less efficient (by about 40%, on average, and often leak prodigious amounts of increasingly expensive refrigerant15. Slightly more than ½
9 Sachs, H. M., 2001. Criteria for Assessment of New Equipment Research for CEE: Chiller Retirements and Replacements (Draft). Available from http://www.aceee.org/Buildings/ComEqTyp/PackRef/chillers-CEE.pdf. 10 <http://www.hvacexchange.com/cooltools/coolhome.htm> 11 Westphalen, D. and S. Koszalinski, 1999. Energy Consumption Characteristics of Commercial Building HVAC Systems, Volume II: Thermal Distribution, Auxiliary Equipment, and Ventilation, p. 5-8. A.D. Little, Cambridge, MA, reference #33745-00. 12 Parenthetically, these cooling degree day values are much lower in all three areas than in other regions: the same source gives values of 2500 for New Orleans and Fort Worth; and about 1500 for Atlanta and Washington, DC. 13 The values are not entirely comparable, since air cooled units will not have cooling tower fans or condenser water loops. Source: ASHRAE 90.1, cited in Table 5 of Sachs, 2001, Criteria for Assessment of New Equipment Research for CEE: Chiller Retirements and Replacements (Draft). Available from http://www.aceee.org/Buildings/ComEqTyp/PackRef/chillers-CEE.pdf. 14 Year 2000 data (pre-California crisis, taken as “normal.” From EIA, http://www.eia.doe.gov/cneaf/electricity/esr/esrt01dp1.html. 15 CFCs such as R-11 and R-12 damage the ozone layer. They are taxed and no longer produced in industrialized countries, as a result of the Montreal Protocol.

B-4
of the estimated 40,000 CFC-using chillers have been replaced already, according to ARI16. EPA is attempting to encourage such replacements. All factors considered, the potential market for large chillers in buildings in Oregon is estimated as 50 – 70 units/year. What are the potential savings? California estimates the savings potential as about 20 MW of demand savings and 30 GWh/yr of energy savings each year from replacements of existing chillers (80%) and new installations (20%)17. If the two states were comparable, this would correspond to about 2 MW of demand and 3 GWh of energy per year for Oregon, given the 10:1 population ratio between the two states. If these savings are attributed to 60 chillers/year for Oregon, the average new chiller avoids 33 kW, and saves 50,000 MWh/yr18. Rough savings and costs from improvements estimated from full load efficiency improvements for a 300 ton centrifugal chiller are given in Table 119. Savings in parasitics from an appropriate program can increase this. Table 3 focuses on the supply, return, and exhaust fan savings, identified as about 83% of the potential20, and generally considered highly cost-effective.
16 http://www.ari.org/pr/2001/041101chillers.html (press release from Air-Conditioning and Refrigeration Institute). 17 <http://www.hvacexchange.com/cooltools/coolhome.htm> 18 As a check , 3 (GWh) / 2 (MW) = 1500 hr, a reasonable estimate of annual operating hours. It may have served as the basis for the CA estimates. 19 All authorities agree that full load COP or kW/ton values are poor bases for comparisons of chilled water systems. IPLV values are better, but accurate comparisons require modeling prototype buildings with hour-by-hour simulations. Still, full-load comparisons are indicative for policy evaluations. 20 Westphalen, D. and S. Koszalinski, 1999. Energy Consumption Characteristics of Commercial Building HVAC Systems, Volume II: Thermal Distribution, Auxiliary Equipment, and Ventilation. A.D. Little, Cambridge, MA, reference #33745-00.

B-5
Table 4. Relative value of improvements in parasitics relative to chiller efficiency improvements.
Parameter common Replace existing
New, upgrade Units
Chillers characteristic size 300 300tons/unit total Installations/year 60 48 12units % replacements 80% baseline kW/ton, replacements 0.9 0.65kW/ton New units 0.51 0.51kW/ton efficiency difference, new unit 0.39 0.14kW/ton incr. $/kW/ton for better unit (DEER) $60 $60 incr. $/0.1 kW/ton improved $15 $43 kW/hp 0.75 New units 0.68 0.68 hp/ton incr. $/0.1 hp/ton improved $9 $9
Parasitics variable speed drives, (av) 21 $130 $130 $/hp VSDs, $/0.1 hp improved $13 $13 $/0.1hp This is a “zero-order” estimate based on relative electric power, not energy, and cannot be used to compare investments in vsds with improved chillers. Let’s start with the chillers, for which we can estimate annual energy savings, from the relationship:
Annual Savings = (avoided kW/ton) * (unit size, tons) * (operating hours/yr) * tariff22 Annual Savings = $3780 = (0.14 kW/ton) * (300 tons) * (1500 hr/yr) * ($0.06)
for the new installation example above, which had an incremental cost of
$18,000 = ($60/ton) * (300 tons). Fans (parasitic loads) to run far more hours per year than the chillers. They are used during non-chiller-cooled hours (“economizer” cycle, when cooling loads are met by cool outside air), which can be large in Oregon, and they are used in the heating cycle. Thus, because the operating hours are so different, simply comparing the (13/9) ratio of cost per unit of demand avoided is inappropriate. In the extreme case, fans would run 8760 hr/yr (full time), vs. 1000 – 2000 hr/yr for the chiller. With a VFD, the fans can run at greatly reduced power for all but occupied hours, say [8760 (hr/yr) - 10 (hr/day) * 365 (day/yr) * 5/7 (weekdays)], or 6000 hr/yr. Because doubling air flow requires cubing power, adequate “unoccupied” ventilation with VSDs may require less than 0.25 times full power, leading to a conservative estimate of a 40% reduction in kWh/yr with a VSD system23. Since the parasitics are 22% of the chilled water system
21 DEER, 2001. CCIG: CME-02. Average for sizes typically used in large buildings. Installed prices given range from $214/hp installed at 5 hp, down to $106/hp for 50 hp motors. For new construction, only these incremental costs of the drive should be used. For retrofits, labor costs have to be added, ranging from $171/hp down to $30/hp. 22 Weighted by demand charges, as required. 23 (2/3 of hours at ¼ power) + (1/3 of hours at full power) = 0.5.
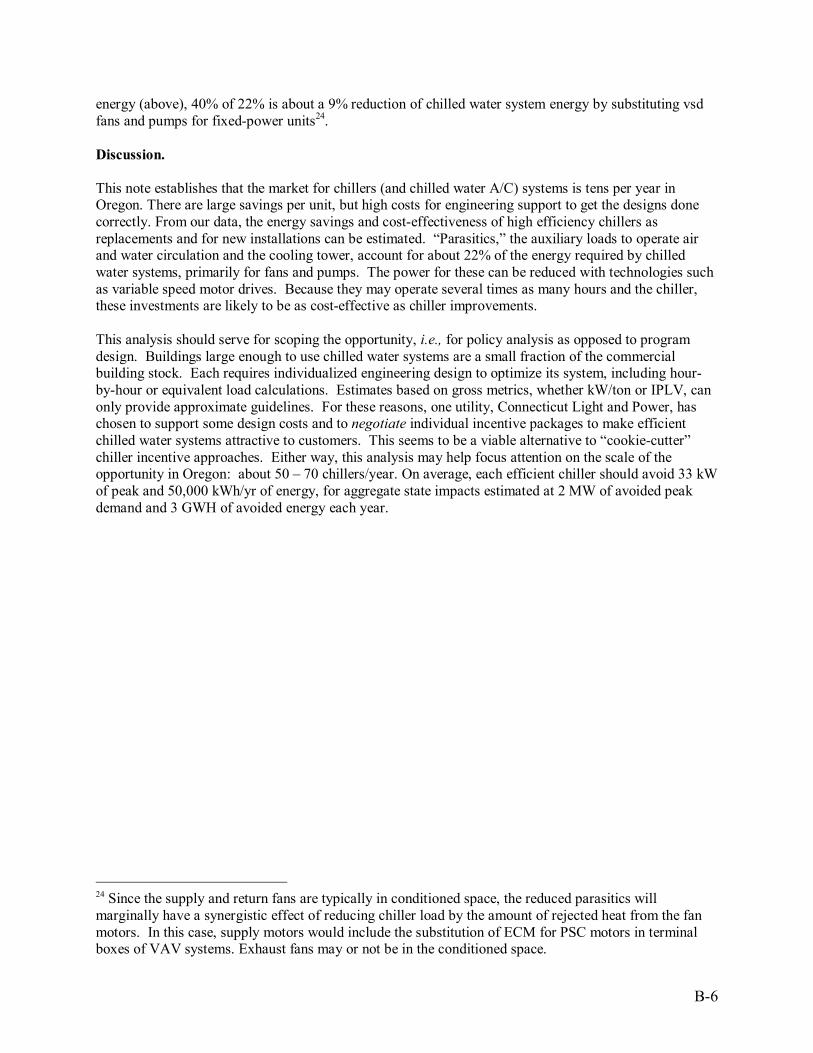
B-6
energy (above), 40% of 22% is about a 9% reduction of chilled water system energy by substituting vsd fans and pumps for fixed-power units24. Discussion. This note establishes that the market for chillers (and chilled water A/C) systems is tens per year in Oregon. There are large savings per unit, but high costs for engineering support to get the designs done correctly. From our data, the energy savings and cost-effectiveness of high efficiency chillers as replacements and for new installations can be estimated. “Parasitics,” the auxiliary loads to operate air and water circulation and the cooling tower, account for about 22% of the energy required by chilled water systems, primarily for fans and pumps. The power for these can be reduced with technologies such as variable speed motor drives. Because they may operate several times as many hours and the chiller, these investments are likely to be as cost-effective as chiller improvements. This analysis should serve for scoping the opportunity, i.e., for policy analysis as opposed to program design. Buildings large enough to use chilled water systems are a small fraction of the commercial building stock. Each requires individualized engineering design to optimize its system, including hour-by-hour or equivalent load calculations. Estimates based on gross metrics, whether kW/ton or IPLV, can only provide approximate guidelines. For these reasons, one utility, Connecticut Light and Power, has chosen to support some design costs and to negotiate individual incentive packages to make efficient chilled water systems attractive to customers. This seems to be a viable alternative to “cookie-cutter” chiller incentive approaches. Either way, this analysis may help focus attention on the scale of the opportunity in Oregon: about 50 – 70 chillers/year. On average, each efficient chiller should avoid 33 kW of peak and 50,000 kWh/yr of energy, for aggregate state impacts estimated at 2 MW of avoided peak demand and 3 GWH of avoided energy each year.
24 Since the supply and return fans are typically in conditioned space, the reduced parasitics will marginally have a synergistic effect of reducing chiller load by the amount of rejected heat from the fan motors. In this case, supply motors would include the substitution of ECM for PSC motors in terminal boxes of VAV systems. Exhaust fans may or not be in the conditioned space.
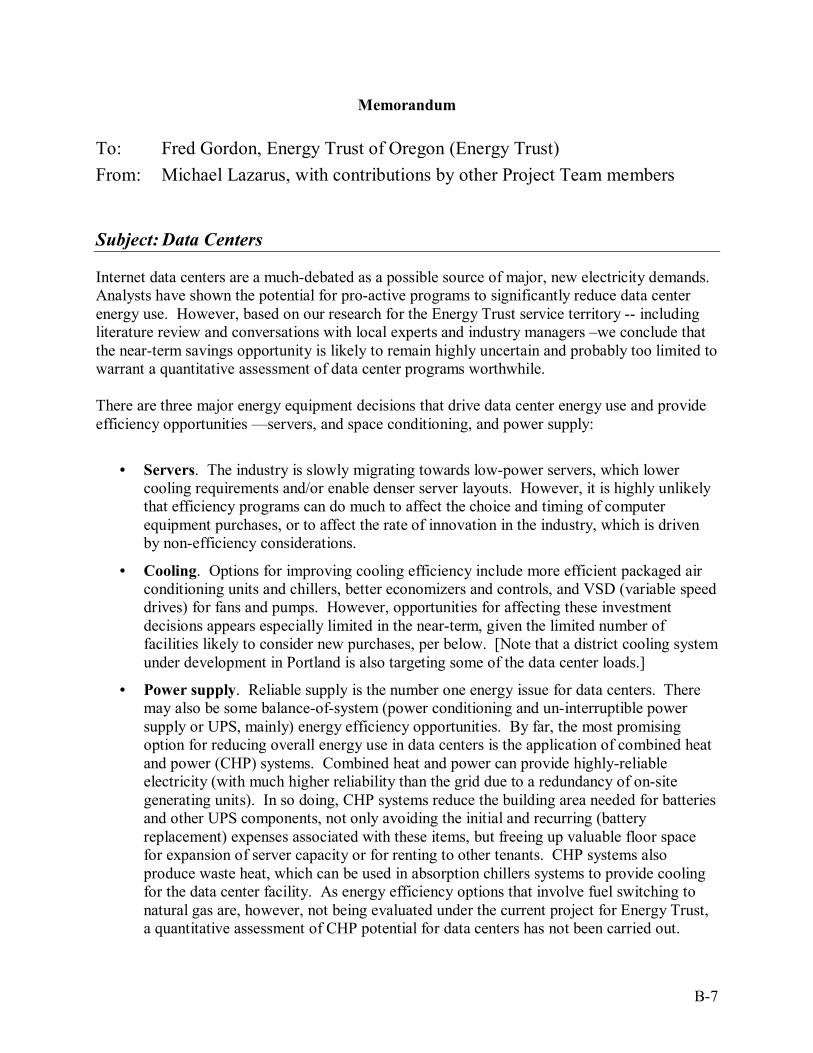
B-7
Memorandum To: Fred Gordon, Energy Trust of Oregon (Energy Trust) From: Michael Lazarus, with contributions by other Project Team members
Subject: Data Centers
Internet data centers are a much-debated as a possible source of major, new electricity demands. Analysts have shown the potential for pro-active programs to significantly reduce data center energy use. However, based on our research for the Energy Trust service territory -- including literature review and conversations with local experts and industry managers –we conclude that the near-term savings opportunity is likely to remain highly uncertain and probably too limited to warrant a quantitative assessment of data center programs worthwhile. There are three major energy equipment decisions that drive data center energy use and provide efficiency opportunities —servers, and space conditioning, and power supply:
• Servers. The industry is slowly migrating towards low-power servers, which lower cooling requirements and/or enable denser server layouts. However, it is highly unlikely that efficiency programs can do much to affect the choice and timing of computer equipment purchases, or to affect the rate of innovation in the industry, which is driven by non-efficiency considerations.
• Cooling. Options for improving cooling efficiency include more efficient packaged air conditioning units and chillers, better economizers and controls, and VSD (variable speed drives) for fans and pumps. However, opportunities for affecting these investment decisions appears especially limited in the near-term, given the limited number of facilities likely to consider new purchases, per below. [Note that a district cooling system under development in Portland is also targeting some of the data center loads.]
• Power supply. Reliable supply is the number one energy issue for data centers. There may also be some balance-of-system (power conditioning and un-interruptible power supply or UPS, mainly) energy efficiency opportunities. By far, the most promising option for reducing overall energy use in data centers is the application of combined heat and power (CHP) systems. Combined heat and power can provide highly-reliable electricity (with much higher reliability than the grid due to a redundancy of on-site generating units). In so doing, CHP systems reduce the building area needed for batteries and other UPS components, not only avoiding the initial and recurring (battery replacement) expenses associated with these items, but freeing up valuable floor space for expansion of server capacity or for renting to other tenants. CHP systems also produce waste heat, which can be used in absorption chillers systems to provide cooling for the data center facility. As energy efficiency options that involve fuel switching to natural gas are, however, not being evaluated under the current project for Energy Trust, a quantitative assessment of CHP potential for data centers has not been carried out.

B-8
According to a data center developer and telecom regulator, there are from 4-6 active data centers in Oregon today. A sizable fraction of this capacity is located within one building, where equipment choices were recently evaluated and investments made. The future rate of growth of data center floor space is highly uncertain, and current excess capacity is likely to be used up before any new facilities are built. Given the "dot-com" bust and the State's relatively stagnant economy, major growth in new data center construction seems rather unlikely in the next 2-3 years. Thus, the near-term data center market does not appear to present sufficient opportunities to justify an Energy Trust program targeted specifically at this subsector. However, if data centers are considered industrial rather than commercial-sector activity, then they might be encourage to pursue the direct finance option to help underwrite energy efficiency investments. References and contacts:
Beck, F. (2001), Energy Smart Data Centers: Applying Energy Efficient Design and Technology to the Digital Information Sector, Renewable Energy Policy Project (REPP) Research Report No. 14, November 2001. REPP, Washington, D.C. Brown, E, Elliott, N., Shipley, A. (2002), Clean Power for the Internet, American Council for an Energy-Efficient Economy, Washington, D.C. Mitchell-Jackson, Jennifer (2001), Energy Needs in an Internet Economy: A Closer Look at Data Centers. Masters thesis. Under Review. Berkeley, Calif.: University of California Robertson, Chris, and Joseph Romm (2002), Data Centers, Power, and Pollution Prevention Design for Business and Environmental Advantage. The Center for Energy and Climate Solutions, May, 2002.
Chris Robertson, private consultant Mary Beth Henry, Mt. Hood Cable Regulatory Commission
Engineer and data center developer (name withheld)

B-9
Memorandum To: Fred Gordon, Energy Trust of Oregon (Energy Trust) From: David Von Hippel, with contributions by other Project Team members
Subject: Energy Efficiency Measures in the Commercial Cooking End-Use
The Project Team's estimated characterization of electricity end-uses in the Commercial/Institutional sector of the Energy Trust's service territories in Oregon (see the workbook "Commercial_market_est4.xls") suggests that electricity use for cooking is an extremely small fraction (about 0.3 percent) of total electricity use in the sector. Given this relatively small market for higher-than-standard efficiency electric devices, the lack of a detailed characterization of cooking electric end-uses, and the lack of a comprehensive source for cooking efficiency improvements cost and performance data, the Project Team has elected not to undertake a quantitative assessment of electric energy efficiency measures in the commercial cooking end-use. Other reasons why such an assessment does not seem to be called for include:
• Energy efficiency is typically a lower priority for restaurants and other commercial cooking operations than other considerations, such as cost, convenience, safety, and the time required for food preparation.
• A substantial fraction of cooking energy use is provided by natural gas, and gas measures are not a part of the Project Team's current assessments for Energy Trust.
Though the Project Team found no comprehensive recent assessment of electric energy efficiency option for the commercial cooking end-use, there are several sources of information that could be tapped for a more in-depth review of the options. These include:
• The Pacific Gas and Electric Food Service Technology Center (for example, http://www.pge.com/003_save_energy/fstc_cart/html/fstc.html), which offers a number of publications, most on quite specific field trials of different kinds of cooking equipment.
• Publications from the Federal Energy Management Program, for example, How to Buy an Energy-Efficient Pressureless Steamer. (http://www.eren.doe.gov/femp/procurement/pdfs/presssteamer.pdf).
• Business services provided by Arizona Public Service (APS), which include descriptions of some cooking energy efficiency measures. (http://www.aps.com/aps_services/business/waystosave/BusWaystoSave_24.html)
• A service called the "Energy Information Center" includes a largely qualitative discussion of different cooking modes and energy efficiency opportunities (http://oge.apogee.net/cce/).
• An older document by a group at Arthur D. Little (Characterization of Commercial Building Appliances Prepared by Rusi F. Patel, Peter W. Teagan, and John T. Dieckmann, Arthur D. Little, Inc., 20 Acorn Park, Cambridge, MA 02140, ADL Reference No. 42520, and prepared for the Building Equipment Division, Office of Building Technologies, U.S. Department of Energy, August, 1993) appears to include a brief review of cooking efficiency opportunities,

B-10
but only the abstract of the study (http://www.eren.doe.gov/buildings/documents/pdfs/commer_build_appli.pdf) was available to the project team as of this writing.

B-11
Memorandum To: Fred Gordon, Energy Trust of Oregon (Energy Trust) From: David Von Hippel, with contributions by other Project Team members
Subject: Energy Efficiency Measures to Improve the Efficiency of Commercial-sector Office Equipment
Measures to improve the energy efficiency of electronic devices used in offices--including printers, computers, copiers, monitors, communications equipment, and other devices--include:
• Measures that reduce standby electricity losses (from power supplies, light-emitting diodes and other indicators, and other sources),
• Modifications to improve the overall efficiency of the devices, and
• Control features designed to turn off (or turn down) electronic devices when they are not actively being used.
The Project team has undertaken quantitative assessments of measures in the last two categories. The savings potential from substituting LCD (liquid crystal display) monitors for the more conventional (and less expensive) CRT (cathode ray tube) monitors is assessed in the workbook "Energy Trust_CI_OfficeElectronics_dvh.xls". The savings potential of a measure designed to control the energy saving features of computers and monitors connected to computer networks in offices is assessed in the workbook "Energy Trust_CI_Energy_Management_Software.xls". The USEPA "EnergyStar" program promotes the labeling of monitors, computers, and other office electronics that meet EnergyStar efficiency standards. The savings from using these EnergyStar units in place of standard office electronics can be substantial. The incremental savings for EnergyStar computers and monitors, taken from "Computer and Monitor Assumptions" as listed on the "EnergySTAR Purchasing Savings Calculator: Computers and Monitors" on www.energystar.gov (visited 10/25/01), provides net savings for an EnergyStar compliant versus non-compliant computer central processing unit of 84 kWh per year, and monitor savings of 197.19 kWh/yr. Energy savings from efficiency improvements in other office equipment may also be substantial. Computation of weighted average savings for other office equipment using data from LBNL workbook "ccap-outputs_public.xls", downloaded 10/25/01 (from www.lbl.gov) and listing C. Webber as author suggests the following savings:

B-12
Primary Energy Unit
savings
Cummul. 2001 to 2010
Savings
Electricity Savings per
UnitEquipment gigajoules/yr (petajoules) kWh/yr - Fax 1.4 503.7 126.38 - Copier (1) 3.2 114.0 288.87 -Multifunction 6.7 65.8 604.83 - Scanner 1.2 588.4 108.33 - Printer 0.6 844.4 56.87Weighted Ave. 1.2990 117.26
Despite these substantial savings, it seems unlikely that incentive programs can in fact do much to move the marketplace to the use of higher-efficiency equipment. Research by Lawrence Berkeley Labs and ACEEE suggests that the penetration of EnergyStar devices in the marketplace is already quite high (for some devices, on the order of 90 percent). For other types of equipment, government and non-governmental institutions working with manufacturers are resulting in changes in manufacturing practices and pushing equipment design toward lower energy consumption (including reduced "standby losses"). Other processes of innovation in the electronics industry are constantly pushing power requirements lower. This evidence of "natural" high penetration of higher-efficiency office electronics prompted the Project Team to elect not to provide a quantitative assessment of additional efficiency measures for office electronics. Additional contacts and information on the energy-efficiency of electronic office equipment include the following: Jennifer Thorne, ACEEE Jennifer Thorne and Margaret Suozzo (1998), Leaking Electricity: Standby and Off-Mode Power Consumption in Consumer Electronics and Household Appliances. ACEEE Report, February 1998. The following three reports are available from the Lawrence Berkeley National Laboratory's Energy Analysis program, Energy Efficiency Standards Group (http://eappc76.lbl.gov/tmacal/ees.cfm?CFID=13423&CFTOKEN=66929174): Webber, Carrie, Judy Roberson, Richard Brown, Christopher Payne, Bruce Nordman, and Jonathan Koomey. 2001. "Field Surveys of Office Equipment Operation Patterns." Berkeley, CA: Lawrence Berkeley National Laboratory. Report No. LBNL- 46930. September 2001. Webber, Carrie and Richard Brown. 1998. "Savings Potential for ENERGY STAR Voluntary Labeling Programs." Proceedings of the ACEEE 1998 Summer Study on Energy Efficiency in Buildings, Volume 9, pp. 271-282. Washington, DC: American Council for an Energy-Efficient Economy. Nordman, Bruce, Mary Ann Piette, Brian Pon, and Kris Kinney. 1998. "It's Midnight...Is your Copier On?: ENERGY STAR Copier Performance." Berkeley, CA: Lawrence Berkeley National Laboratory. Report No. LBNL-41332.


![CMM 2008-01 [Bigeye and Yellowfin] CONSERVATION AND MANAGEMENT MEASURE FOR BIGEYE AND YELLOWFIN TUNA IN THE WESTERN AND CENTRAL PACIFIC OCEAN Conservation and Management Measure 2008-01](https://img.dokumen.tips/doc/110x75/55cf995c550346d0339cfa56/cmm-2008-01-bigeye-and-yellowfin-conservation-and-management-measure-for.jpg)