Embed Size (px)
Citation preview

Aalborg Universitet
A DC Microgrid Coordinated Control Strategy Based on Integrator Current-Sharing
Gao, Liyuan; Liu, Yao; Ren, Huisong; Guerrero, Josep M.
Published in:Energies
DOI (link to publication from Publisher):10.3390/en10081116
Creative Commons LicenseCC BY 4.0
Publication date:2017
Document VersionPublisher's PDF, also known as Version of record
Link to publication from Aalborg University
Citation for published version (APA):Gao, L., Liu, Y., Ren, H., & Guerrero, J. M. (2017). A DC Microgrid Coordinated Control Strategy Based onIntegrator Current-Sharing. DOI: 10.3390/en10081116
General rightsCopyright and moral rights for the publications made accessible in the public portal are retained by the authors and/or other copyright ownersand it is a condition of accessing publications that users recognise and abide by the legal requirements associated with these rights.
? Users may download and print one copy of any publication from the public portal for the purpose of private study or research. ? You may not further distribute the material or use it for any profit-making activity or commercial gain ? You may freely distribute the URL identifying the publication in the public portal ?
Take down policyIf you believe that this document breaches copyright please contact us at [email protected] providing details, and we will remove access tothe work immediately and investigate your claim.
Downloaded from vbn.aau.dk on: juli 07, 2018

energies
Article
A DC Microgrid Coordinated Control Strategy Basedon Integrator Current-Sharing
Liyuan Gao 1,*, Yao Liu 2 ID , Huisong Ren 1 and Josep M. Guerrero 3 ID
1 Department of Electrical Engineering, Shandong University, Jinan 250061, China; [email protected] Zhuhai Power Supply Bureau of Guangdong Power Grid Corporation, Zhuhai 519000, China;
[email protected] Department of Energy Technology, Aalborg University, DK-9220 Aalborg East, Denmark; [email protected]* Correspondence: [email protected]
Received: 10 July 2017; Accepted: 25 July 2017; Published: 1 August 2017
Abstract: The DC microgrid has become a new trend for microgrid study with the advantages of highreliability, simple control and low losses. With regard to the drawbacks of the traditional droop controlstrategies, an improved DC droop control strategy based on integrator current-sharing is introduced.In the strategy, the principle of eliminating deviation through an integrator is used, constructing thecurrent-sharing term in order to make the power-sharing between different distributed generation(DG) units uniform and reasonable, which can reduce the circulating current between DG units.Furthermore, at the system coordinated control level, a hierarchical/droop control strategy basedon the DC bus voltage is proposed. In the strategy, the operation modes of the AC main networkand micro-sources are determined through detecting the DC voltage variation, which can ensure thepower balance of the DC microgrid under different operating conditions. Meanwhile, communicationis not needed between different DG units, while each DG unit needs to sample the DC bus voltage,which retains the plug-and-play feature of the DC microgrid. The proposed control strategy isvalidated by simulation on a DC microgrid with permanent magnet synchronous generator-basedwind turbines, solar arrays and energy storage batteries, which can be applied to small commercialor residential buildings.
Keywords: DC microgrid; DC bus voltage; hierarchical/droop control strategy; current-sharing;power balance
1. Introduction
Distributed generation (DG) is becoming a complementary to and a support of future large powergrids due to the advantages of low pollution, high energy utilization efficiency, flexible installationlocation, low transmission and distribution resources loss and low electric transmission line loss.For these reasons, DG is increasingly cited as a key feature of future power systems [1,2]. Microgrids,an effective carrier of distributed generation resources (DGR), consist of various DG units, energystorage devices, energy conversion devices, protection devices and load control devices. Being able tooperate in islanded and grid-connected modes, microgrids have become an effective way for DGRintegration in recent years [3,4].
However, the power supply quality of microgrids is influenced by the intermittence andfluctuation of distributed micro-power to some extent. Moreover, some alternating current (AC)distributed power sources are connected to the microgrid through a multi-stage conversion, whichlowers microgrid efficiency. Establishing direct current (DC) transmission lines in microgrids toconnect a number of DGRs and the energy storage (ES) system to form a DC microgrid can allow forbetter coordination and control of DGRs, so as to improve power supply quality and decrease the
Energies 2017, 10, 1116; doi:10.3390/en10081116 www.mdpi.com/journal/energies

Energies 2017, 10, 1116 2 of 17
impact on the AC main network [5–11]. Hence, technologies relevant to DC microgrids have attractedextensive attention in the research community.
The earliest studies on the structure and control methods of DC power networks originatedfrom DC nanogrids [12–17]. Bryan et al. [12] proposed using DC bus voltage as the control signal,differentiating operation modes by the value of DC bus voltage, which is allowed to change in a certainrange; however, the grid-connected mode was not taken into account. In [18,19], more complicatedoperation conditions were considered, but the control strategy could only be applied to particular DCmicrogrid structures, thus limiting its universality. Therefore, in-depth discussion on micro-sourcecontrol strategies under different working modes needs to be made so as to ensure the reliability ofDC microgrids.
At present, the major control strategies to maintain power balance in DC microgrids are centralizedcontrol [20] and decentralized control [21–23]. In centralized control, a central controller is used toexecute instructions to the micro-source unit to maintain power balance in the system. However, thisrequires a fast communication bandwidth, and a single communication failure can disrupt properDC microgrid operations. To solve these problems, a droop control strategy based on conventionalsynchronous generator characteristics was introduced in [21–23]. The power balanced state of a DCmicrogrid can be judged according to the changing DC bus voltage since it is the trigger sign of powerbalance. However, without working in the maximum power point tracking (MPPT) mode, the outputcharacteristics of micro-sources were not taken into consideration in the conventional droop controlstrategy, thereby lowering the energy utilization efficiency of the system. In order to solve this problem,an ES unit was used to overcome the output fluctuation and randomness of micro-sources in [24–29],which can reduce the frequent fluctuations of the DC bus voltage and enhance system stability [7–11].
In this paper, by taking advantage of conventional control strategies, a hierarchical/droop controlstrategy based on DC bus voltage is proposed, which can ensure that different DGs cooperate to providepower, making the system operate in the optimum state and the microgrid bus voltage maintained in areasonable range. The operation modes of the AC main network and controllable micro-sources aredetermined through detecting DC bus voltage change, so as to ensure the power balance of the DCmicrogrid when the DC bus voltage is in a different hierarchical range. Taking into full considerationthe actual output characteristics of micro-sources, the proposed strategy can overcome the fluctuationsthrough the ES unit and engage micro-sources in MPPT mode as much as possible to enhance thesystem efficiency. Moreover, the flexibility and reliability are enhanced while the system cost is reducedsince no communication between different units is needed, making the system a plug-and-play solution.Finally, a simulation model is built with a wind turbine (WT)/photovoltaic (PV)/ES DC microgridas the paradigm, which can be applied to different scenarios, such as small-sized commercial andresidential buildings. Simulation results have verified the effectiveness and feasibility of the introducedstrategy for a DC microgrid operating in different modes.
The rest of the paper is organized as follows. Section 2 starts with the structure of the DC microgridbased on PV, WT and ES, and then, the operation modes of each unit and the mode-switching processare introduced. In Section 3, the control strategies at the converter level, as well as in system level arepresented. Simulation results with the control strategies are shown and discussed in Section 4. Finally,Section 5 presents the conclusions.
2. DC Microgrid Structure and Composition
2.1. DC Microgrid Structure
The configuration of the DC microgrid studied in this paper is shown in Figure 1. The photovoltaicarray, wind turbine generator and storage battery are connected through a DC-DC converter or AC-DCconverter to form the DC microgrid. The microgrid is linked with the AC main network by a bilateralconverter, while the AC and DC loads obtain electric power from the DC bus.

Energies 2017, 10, 1116 3 of 17Energies 2017, 10, 1116 3 of 17
G- VSC
W-VSC
AC Network
PMSG
Bi-DCEnergy Storage
PW2
PG
PS
DC
Bus
P-VSC
PV Array
DC
Load
PL
LoadAC
Load
Battery Energy Management System
WT System
DC load
PW1Transformer
Figure 1. DC microgrid configuration.
2.2. DC Microgrid Composition
Grid-connected converter: The DC microgrid is integrated with the AC main network through
a voltage-sourced Pulse-Width Modulation (PWM) converter Grid-Voltage Sourced Converter
(G-VSC). Figure 2 illustrates how G-VSC switches from different operation modes. The
parameters for Figure 2 are shown in Table 1. When the DC microgrid operates in a normal grid-
connected mode, the DC bus voltage stability is ensured by G-VSC under droop control.
However, the G-VSC will switch to current-limiting mode if the interchanged power between
the microgrid and the main network reaches the maximum power of G-VSC. When the output
power of PV and WT is sufficient, the microgrid will provide power to the main network
through G-VSC.
maxGG PP
Current-Sourced Mode
Absorb
ReleasemaxG L W SP P P P
maxG L W SP P P P
maxGin GP PmaxW L G SP P P P
maxW L G SP P P P
G L W SP P P P Droop/Voltage-Sourced Mode
Figure 2. Schematic diagram of the AC main network mode-switching.
Table 1. Symbols in Figure 2.
PG: actual output power of AC main network SOC: current state of charge
PGmax: the maximum output power of G-VSC SOCmax: maximum state of charge
PGin: actual absorbed power by AC main network SOCmin: minimum state of charge
PW: actual output power of DG unit PL: actual power of loads
PWmppt: maximum tracing power of DG unit PN: rated power of loads
PS: release(+)/absorb(−) power of battery ΔP: power of shedding loads
PSmax: maximum output power of battery
Figure 1. DC microgrid configuration.
2.2. DC Microgrid Composition
• Grid-connected converter: The DC microgrid is integrated with the AC main network througha voltage-sourced Pulse-Width Modulation (PWM) converter Grid-Voltage Sourced Converter(G-VSC). Figure 2 illustrates how G-VSC switches from different operation modes. The parametersfor Figure 2 are shown in Table 1. When the DC microgrid operates in a normal grid-connectedmode, the DC bus voltage stability is ensured by G-VSC under droop control. However, theG-VSC will switch to current-limiting mode if the interchanged power between the microgridand the main network reaches the maximum power of G-VSC. When the output power of PV andWT is sufficient, the microgrid will provide power to the main network through G-VSC.
Energies 2017, 10, 1116 3 of 17
G- VSC
W-VSC
AC Network
PMSG
Bi-DCEnergy Storage
PW2
PG
PS
DC
Bus
P-VSC
PV Array
DC
Load
PL
LoadAC
Load
Battery Energy Management System
WT System
DC load
PW1Transformer
Figure 1. DC microgrid configuration.
2.2. DC Microgrid Composition
Grid-connected converter: The DC microgrid is integrated with the AC main network through
a voltage-sourced Pulse-Width Modulation (PWM) converter Grid-Voltage Sourced Converter
(G-VSC). Figure 2 illustrates how G-VSC switches from different operation modes. The
parameters for Figure 2 are shown in Table 1. When the DC microgrid operates in a normal grid-
connected mode, the DC bus voltage stability is ensured by G-VSC under droop control.
However, the G-VSC will switch to current-limiting mode if the interchanged power between
the microgrid and the main network reaches the maximum power of G-VSC. When the output
power of PV and WT is sufficient, the microgrid will provide power to the main network
through G-VSC.
maxGG PP
Current-Sourced Mode
Absorb
ReleasemaxG L W SP P P P
maxG L W SP P P P
maxGin GP PmaxW L G SP P P P
maxW L G SP P P P
G L W SP P P P Droop/Voltage-Sourced Mode
Figure 2. Schematic diagram of the AC main network mode-switching.
Table 1. Symbols in Figure 2.
PG: actual output power of AC main network SOC: current state of charge
PGmax: the maximum output power of G-VSC SOCmax: maximum state of charge
PGin: actual absorbed power by AC main network SOCmin: minimum state of charge
PW: actual output power of DG unit PL: actual power of loads
PWmppt: maximum tracing power of DG unit PN: rated power of loads
PS: release(+)/absorb(−) power of battery ΔP: power of shedding loads
PSmax: maximum output power of battery
Figure 2. Schematic diagram of the AC main network mode-switching.
Table 1. Symbols in Figure 2.
PG: actual output power of AC main network SOC: current state of chargePGmax: the maximum output power of G-VSC SOCmax: maximum state of chargePGin: actual absorbed power by AC main network SOCmin: minimum state of chargePW: actual output power of DG unit PL: actual power of loadsPWmppt: maximum tracing power of DG unit PN: rated power of loadsPS: release(+)/absorb(−) power of battery ∆P: power of shedding loadsPSmax: maximum output power of battery

Energies 2017, 10, 1116 4 of 17
• Distributed generation unit: The DG unit is composed by the wind turbine generator system andphotovoltaic generator system, which are tied with the DC microgrid by a DC/DC converter anda voltage-sourced converter Wind-Voltage Sourced Converter (W-VSC), respectively. In Figure 3,the switching process of the DG unit in different modes is illustrated. In order to capture the mostwind and solar energy possible, the DG unit works in the MPPT manner normally, enhancing theenergy utilization efficiency. When the wind and solar are sufficient and the DG unit output islarge, the DC bus voltage rises, and the operation mode will switch to droop control to sustain thevoltage stability. The DG unit will shut down if the main network is not connected, all loads areshed and the battery is fully charged.
Energies 2017, 10, 1116 4 of 17
Distributed generation unit: The DG unit is composed by the wind turbine generator system
and photovoltaic generator system, which are tied with the DC microgrid by a DC/DC converter
and a voltage-sourced converter Wind-Voltage Sourced Converter (W-VSC), respectively. In
Figure 3, the switching process of the DG unit in different modes is illustrated. In order to
capture the most wind and solar energy possible, the DG unit works in the MPPT manner
normally, enhancing the energy utilization efficiency. When the wind and solar are sufficient
and the DG unit output is large, the DC bus voltage rises, and the operation mode will switch to
droop control to sustain the voltage stability. The DG unit will shut down if the main network
is not connected, all loads are shed and the battery is fully charged.
MPPT Mode
Droop/Voltage-
Sourced ModeCut off the DG unit
0,0
max_
LGin PP
SOCSOC
0
,0
max
_
L
Gin
P
P
SOC
SOC
W WmpptP Pm
ax
W
L
G
S
P
P
P
P
max
W
L
G
S
P
P
P
P
axW L Gm SP P P P
max
W
L
G
S
P
P
P
P
0WP W L Gin SP P P P
Figure 3. Schematic diagram of the DG unit mode-switching.
Energy storage battery: The ES battery is connected with the DC microgrid by a bilateral DC/DC
converter and switches its operation modes as in Figure 4. The battery works under the charging
mode when the DC microgrid operates normally; when fully charged, the battery would be shed
from the microgrid as a standby. However, when the microgrid is islanded due to a main
network fault, the ES unit would stabilize the DC bus voltage as a balancing bus, in order to
ensure stable system operation.
Charge
Droop/Voltage-Source Mode
0SPCut off the ES unit
min_SOCSOC
max
_
SOC
SOC
ES Unit Charging
Mode
Discharge
max
(grid
mod
e)
G
G
P
P
max
_ min
G G W LP P orP P
SOC SOC
max
_m
ax
G
G
W
L
P
P
orP
P
SOC
SOC
max
(grid
mod
e)
G
G
P
P
(isla
nded
mod
e)
W
L
P
P
(islan
ded
mod
e)
W
L
P
P
Figure 4. Schematic diagram of ES battery mode-switching.
Load: The DC and AC loads are connected with the DC microgrid through a DC/DC converter
and DC/AC converter, respectively. The loads unit switches its operation mode as shown in
Figure 5. When power supply is insufficient, load-shedding control in terms of loads priority is
needed to ensure power balance of the DC microgrid and power supply quality of the
important loads.
Rated Load Shed minor loadmax maxN G W SP P P P
L NP P P L NP Pmax maxN G W SP P P P
Figure 5. Schematic diagram of load mode-switching.
Figure 3. Schematic diagram of the DG unit mode-switching.
• Energy storage battery: The ES battery is connected with the DC microgrid by a bilateral DC/DCconverter and switches its operation modes as in Figure 4. The battery works under the chargingmode when the DC microgrid operates normally; when fully charged, the battery would be shedfrom the microgrid as a standby. However, when the microgrid is islanded due to a main networkfault, the ES unit would stabilize the DC bus voltage as a balancing bus, in order to ensure stablesystem operation.
Energies 2017, 10, 1116 4 of 17
Distributed generation unit: The DG unit is composed by the wind turbine generator system
and photovoltaic generator system, which are tied with the DC microgrid by a DC/DC converter
and a voltage-sourced converter Wind-Voltage Sourced Converter (W-VSC), respectively. In
Figure 3, the switching process of the DG unit in different modes is illustrated. In order to
capture the most wind and solar energy possible, the DG unit works in the MPPT manner
normally, enhancing the energy utilization efficiency. When the wind and solar are sufficient
and the DG unit output is large, the DC bus voltage rises, and the operation mode will switch to
droop control to sustain the voltage stability. The DG unit will shut down if the main network
is not connected, all loads are shed and the battery is fully charged.
MPPT Mode
Droop/Voltage-
Sourced ModeCut off the DG unit
0,0
max_
LGin PP
SOCSOC
0
,0
max
_
L
Gin
P
P
SOC
SOC
W WmpptP P
max
W
L
G
S
P
P
P
P
max
W
L
G
S
P
P
P
P
axW L Gm SP P P P
max
W
L
G
S
P
P
P
P
0WP W L Gin SP P P P
Figure 3. Schematic diagram of the DG unit mode-switching.
Energy storage battery: The ES battery is connected with the DC microgrid by a bilateral DC/DC
converter and switches its operation modes as in Figure 4. The battery works under the charging
mode when the DC microgrid operates normally; when fully charged, the battery would be shed
from the microgrid as a standby. However, when the microgrid is islanded due to a main
network fault, the ES unit would stabilize the DC bus voltage as a balancing bus, in order to
ensure stable system operation.
Charge
Droop/Voltage-Source Mode
0SPCut off the ES unit
min_SOCSOC
max
_
SOC
SOC
ES Unit Charging
Mode
Discharge
max
(grid
mod
e)
G
G
P
P
max
_ min
G G W LP P orP P
SOC SOC
max
_m
ax
G
G
W
L
P
P
orP
P
SOC
SOC
max
(grid
mod
e)
G
G
P
P
(isla
nded
mod
e)
W
L
P
P
(islan
ded
mod
e)
W
L
P
P
Figure 4. Schematic diagram of ES battery mode-switching.
Load: The DC and AC loads are connected with the DC microgrid through a DC/DC converter
and DC/AC converter, respectively. The loads unit switches its operation mode as shown in
Figure 5. When power supply is insufficient, load-shedding control in terms of loads priority is
needed to ensure power balance of the DC microgrid and power supply quality of the
important loads.
Rated Load Shed minor loadmax maxN G W SP P P P
L NP P P L NP Pmax maxN G W SP P P P
Figure 5. Schematic diagram of load mode-switching.
Figure 4. Schematic diagram of ES battery mode-switching.
• Load: The DC and AC loads are connected with the DC microgrid through a DC/DC converterand DC/AC converter, respectively. The loads unit switches its operation mode as shown inFigure 5. When power supply is insufficient, load-shedding control in terms of loads priorityis needed to ensure power balance of the DC microgrid and power supply quality of theimportant loads.
Energies 2017, 10, 1116 4 of 17
Distributed generation unit: The DG unit is composed by the wind turbine generator system
and photovoltaic generator system, which are tied with the DC microgrid by a DC/DC converter
and a voltage-sourced converter Wind-Voltage Sourced Converter (W-VSC), respectively. In
Figure 3, the switching process of the DG unit in different modes is illustrated. In order to
capture the most wind and solar energy possible, the DG unit works in the MPPT manner
normally, enhancing the energy utilization efficiency. When the wind and solar are sufficient
and the DG unit output is large, the DC bus voltage rises, and the operation mode will switch to
droop control to sustain the voltage stability. The DG unit will shut down if the main network
is not connected, all loads are shed and the battery is fully charged.
MPPT Mode
Droop/Voltage-
Sourced ModeCut off the DG unit
0,0
max_
LGin PP
SOCSOC
0
,0
max
_
L
Gin
P
P
SOC
SOC
W WmpptP P
max
W
L
G
S
P
P
P
P
max
W
L
G
S
P
P
P
P
axW L Gm SP P P P
max
W
L
G
S
P
P
P
P
0WP W L Gin SP P P P
Figure 3. Schematic diagram of the DG unit mode-switching.
Energy storage battery: The ES battery is connected with the DC microgrid by a bilateral DC/DC
converter and switches its operation modes as in Figure 4. The battery works under the charging
mode when the DC microgrid operates normally; when fully charged, the battery would be shed
from the microgrid as a standby. However, when the microgrid is islanded due to a main
network fault, the ES unit would stabilize the DC bus voltage as a balancing bus, in order to
ensure stable system operation.
Charge
Droop/Voltage-Source Mode
0SPCut off the ES unit
min_SOCSOC
max
_
SOC
SOC
ES Unit Charging
Mode
Discharge
max
(grid
mod
e)
G
G
P
P
max
_ min
G G W LP P orP P
SOC SOC
max
_m
ax
G
G
W
L
P
P
orP
P
SOC
SOC
max
(grid
mod
e)
G
G
P
P
(isla
nded
mod
e)
W
L
P
P
(islan
ded
mod
e)
W
L
P
P
Figure 4. Schematic diagram of ES battery mode-switching.
Load: The DC and AC loads are connected with the DC microgrid through a DC/DC converter
and DC/AC converter, respectively. The loads unit switches its operation mode as shown in
Figure 5. When power supply is insufficient, load-shedding control in terms of loads priority is
needed to ensure power balance of the DC microgrid and power supply quality of the
important loads.
Rated Load Shed minor loadmax maxN G W SP P P P
L NP P P L NP Pmax maxN G W SP P P P
Figure 5. Schematic diagram of load mode-switching. Figure 5. Schematic diagram of load mode-switching.

Energies 2017, 10, 1116 5 of 17
3. Research on the Operational Control Strategy of the DC Microgrid
3.1. The DC Droop Control Strategy Based on Integrator Current-Sharing
The traditional DC droop control is presented in Figure 6, in which two distributed power sourcesin parallel provide power to DC loads. The conventional droop control strategy adopted in Figure 6 is:
Udci = U∗dc − Kdi · Idci (1)
where U∗dc is the no-load voltage of distributed sources and Udci and Idci are the output voltage andcurrent of the distributed source i, respectively. Kdi is the droop coefficient. In Figure 6, Rline1 and Rline2
are line resistances of the distributed sources.
Energies 2017, 10, 1116 5 of 17
3. Research on the Operational Control Strategy of the DC Microgrid
3.1. The DC Droop Control Strategy Based on Integrator Current-Sharing
The traditional DC droop control is presented in Figure 6, in which two distributed power
sources in parallel provide power to DC loads. The conventional droop control strategy adopted in
Figure 6 is:
*
dci dc di dciU U K I (1)
where *
dcU is the no-load voltage of distributed sources and dciU and dciI are the output voltage
and current of the distributed source i, respectively. diK is the droop coefficient. In Figure 6, Rline1
and Rline2 are line resistances of the distributed sources.
*
dcU
1dK 1lineR
*
1dcU comU
2lineR 2dK
*
dcU
1dci 2dci
loadR *
2dcU
Figure 6. Two distributed power sources in parallel based on the conventional droop control.
In order to facilitate the analysis, two distributed power sources are taken as an example to
illustrate the power characteristic. The following formulas can be derived from Figure 6:
*
1 1 1 1com dc d dc line dcU U K I R I (2)
*
2 2 2 2com dc d dc line dcU U K I R I (3)
Combining (2) and (3) yields:
1 2 2 2 1 1
2 1 1 1
dc d line d d line
dc d d line
I K R K K R
I K K R
(4)
Generally, the droop coefficient Kdi is inversely proportional to the nominal power of the DG
unit [16]. In (4), it is assumed that two distributed sources have the same capacity for simplifying the
analysis, the droop coefficients Kd1 = Kd2. Because a difference exists between line parameters of
distributed sources:
2 2
1 1
d line
d line
K R
K R (5)
the output currents of various distributed sources are different, which causes circulating current.
1 1
2 2
dc d
dc d
I K
I K (6)
From the above analysis, the output powers of various converters are different because of the
parameter differences of various distributed sources and lines; when it is worse, circulating current
Figure 6. Two distributed power sources in parallel based on the conventional droop control.
In order to facilitate the analysis, two distributed power sources are taken as an example toillustrate the power characteristic. The following formulas can be derived from Figure 6:
Ucom = U∗dc − Kd1 · Idc1 − Rline1 · Idc1 (2)
Ucom = U∗dc − Kd2 · Idc2 − Rline2 · Idc2 (3)
Combining (2) and (3) yields:
Idc1Idc2
=Kd2Kd1
+Rline2 − Kd2/Kd1 · Rline1
Kd1 + Rline1(4)
Generally, the droop coefficient Kdi is inversely proportional to the nominal power of the DGunit [16]. In (4), it is assumed that two distributed sources have the same capacity for simplifyingthe analysis, the droop coefficients Kd1 = Kd2. Because a difference exists between line parameters ofdistributed sources:
Kd2Kd16= Rline2
Rline1(5)
the output currents of various distributed sources are different, which causes circulating current.
Idc1Idc26= Kd1
Kd2(6)
From the above analysis, the output powers of various converters are different because of theparameter differences of various distributed sources and lines; when it is worse, circulating currentarises, which causes distributed sources’ output, and system stability is affected. Hence, a DC droopcontrol strategy based on the integrator current-sharing is proposed in this study, and a current-sharingterm is employed in the conventional DC droop control strategy:
Udci = U∗dc − Kdi · Idci + ∆Udci (7)

Energies 2017, 10, 1116 6 of 17
In order to achieve power-sharing, the current-sharing term should be constructed as a functionof the output power:
∆Udci = f (Pdci) (8)
In this paper, with the principle that the integrator can eliminate error, the current-sharing term isconstructed as follows:
f (Pdci) = Ku ·∫ [
(U∗com −Ucom)− Kpi · Pdci]dt (9)
Combining (7)–(9) yields the improved DC droop control strategy based on the integratorcurrent-sharing:
Udci = U∗dc − Kdi · Idci + Ku ·∫ [
(U∗com −Ucom)− Kpi · Pdci]dt (10)
Then, differentiate (11) to get:
U∗com = Ucom + Kpi · Pdci +1
Ku· dUdci
dt+
KdiKu· dIdci
dt(11)
When the system reaches the steady state, the differentials of DC values become zero, then (11)can be expressed as follows:
U∗com = Ucom + Kpi · Pdci (12)
where U∗com is the no-load voltage of the public bus, Ucom is the actual bus voltage, Kpi is thecurrent-sharing coefficient and Ku is the public integrator coefficient. It can be deduced from (12) that:
Kp1Pdc1 = Kp2Pdc2 = . . . . . . = KpiPdci (13)
Therefore, from (13), the current-sharing coefficient can be set in terms of the distributed sourcescapacity, then the output of distributed sources is rationalized, which avoids circulating currentbetween sources being aroused, affecting system stability. In addition, the Ku coefficient is a globalpublic integrator. Ku is a coefficient related to the integrator changing speed. Since the control methodproposed in this paper is a primary-layer control, normally the responding time of the primary-layeris ∆t = [10 ms, 50 ms], so the integral parameter, calculated by Ku = 1/∆t, is in the range [20, 100].Besides, the changing range of the DG output voltage is ±10%, and the nominal power in this paperis set as 380 V, so the maximum changed voltage is 76 V. If the integral parameter Ku is chosen to be100, then in the time interval t = 10 ms, the voltage is changed by 76 V in the worst situation, which isprone to cause the voltage to cross the border. Taking the above reasons into account, the parameterKu is set to be 50 in this paper, ensuring the responding speed to be reasonable and the voltage to bemaintained in a proper range.
3.2. The Hierarchical/Droop Voltage Control Strategy
For a DC microgrid, constant DC bus voltage means power balance in the system. In order toguarantee the safety and reliability of the system, DC bus voltage should be sustained in a limitedrange. Assuming the rated voltage of the DC bus is 380 V, the system operation modes can be classifiedinto three types according to DC bus voltage, which is shown in Figure 7. Moreover, the methodproposed in this paper is based on the power-sharing of the same kind of DG sources, while fordifferent kinds of DG sources, like PV and WT generation, the hierarchical control method is adopted,in which the control modes of DGs are determined by the common bus voltage.

Energies 2017, 10, 1116 7 of 17
Energies 2017, 10, 1116 7 of 17
3.2. The Hierarchical/Droop Voltage Control Strategy
For a DC microgrid, constant DC bus voltage means power balance in the system. In order to
guarantee the safety and reliability of the system, DC bus voltage should be sustained in a limited
range. Assuming the rated voltage of the DC bus is 380 V, the system operation modes can be
classified into three types according to DC bus voltage, which is shown in Figure 7. Moreover, the
method proposed in this paper is based on the power-sharing of the same kind of DG sources, while
for different kinds of DG sources, like PV and WT generation, the hierarchical control method is
adopted, in which the control modes of DGs are determined by the common bus voltage.
max
gImax
gIgI
bIwI
Ucom Ucom Ucom
400
390
380
370
360
350
MPPT
G-VSCmax
wI
Load-shedding
WT/PV battery unit
Figure 7. Three types of operation modes.
Operation Mode 1: The G-VSC sustains the stability of DC bus voltage; the DG unit operates
under the MPPT mode; the storage battery is in constant-current charge under the control of the
battery management system and then shed from the microgrid when fully charged. In this mode,
the DC bus voltage is maintained within ±10 V of the rated voltage.
Operation Mode 2: The storage battery sustains the stability of the DC bus voltage. When the
transmitted power of the AC main network to the DC microgrid reaches the G-VSC limitation,
or faults like short-circuit occurred, G-VSC will switch to current-limiting mode. The DG unit
operates in the MPPT mode. Under this circumstance, the bus voltage is stabilized within
360 V–370 V.
Operation Mode 3: The DG unit sustains the stability of the DC bus voltage. When the loads are
light and the DC bus voltage rises to over 390 V, the battery would charge with the control of
the battery management system, and the G-VSC transmits electric power to the AC main
network in its maximum power or cut off from the DC microgrid.
The system switches its operation mode as Figure 8 shows. Note that, (1) in order to extend the
battery lifetime, discharging in depth is not permitted, which stops discharging when the state of
charge (SOC) is reduced under 20%. Meanwhile, overcharging is also not allowed, which makes the
battery stop charging when the SOC exceeds 80% [30,31]; (2) When the loads are too heavy that the
energy of the DC microgrid is not capable of maintaining the power balance, shedding unimportant
loads according to the load priority is needed to sustain the power balance; (3) To avoid frequently
switching between different unit work modes, the time delay control is applied in the voltage switch,
which means the switching mode is performed only when the voltage is changing continuously in a
certain interval.
Figure 7. Three types of operation modes.
• Operation Mode 1: The G-VSC sustains the stability of DC bus voltage; the DG unit operatesunder the MPPT mode; the storage battery is in constant-current charge under the control of thebattery management system and then shed from the microgrid when fully charged. In this mode,the DC bus voltage is maintained within ±10 V of the rated voltage.
• Operation Mode 2: The storage battery sustains the stability of the DC bus voltage. When thetransmitted power of the AC main network to the DC microgrid reaches the G-VSC limitation,or faults like short-circuit occurred, G-VSC will switch to current-limiting mode. The DG unitoperates in the MPPT mode. Under this circumstance, the bus voltage is stabilized within360 V–370 V.
• Operation Mode 3: The DG unit sustains the stability of the DC bus voltage. When the loads arelight and the DC bus voltage rises to over 390 V, the battery would charge with the control of thebattery management system, and the G-VSC transmits electric power to the AC main network inits maximum power or cut off from the DC microgrid.
The system switches its operation mode as Figure 8 shows. Note that, (1) in order to extend thebattery lifetime, discharging in depth is not permitted, which stops discharging when the state ofcharge (SOC) is reduced under 20%. Meanwhile, overcharging is also not allowed, which makes thebattery stop charging when the SOC exceeds 80% [30,31]; (2) When the loads are too heavy that theenergy of the DC microgrid is not capable of maintaining the power balance, shedding unimportantloads according to the load priority is needed to sustain the power balance; (3) To avoid frequentlyswitching between different unit work modes, the time delay control is applied in the voltage switch,which means the switching mode is performed only when the voltage is changing continuously in acertain interval.Energies 2017, 10, 1116 8 of 17
Mode One
DC Microgrid
Operation
Mode Twoshed minor loadsMode
Three
370V<Udc<390V
Udc<370VUdc>
390V
Udc<390V
Udc<360V
Udc>360V
Udc>370V
Figure 8. Schematic diagram of the system mode-switching.
3.3. The Converter Control Scheme of Each Unit
In the local layer control strategy for distributed power sources of the same type, the integrator
current-sharing control strategy as Formula (14) proposed in this paper is adopted, and its control
block diagram is shown as Figure 9:
* *
dci dc di dci u com com pi dciU U K I K U U K P dt
(14)
dcU
dcI
PWM+
AC/DC
G-VSC
PIv PIc
RddcI
dcI
dcI
Udc
(a) Control block diagram of G-VSC
Current
Control
abcU
W-VSC
Droop Control Mode
PWM+
Converter
MPPT
Mode
MPPT
Mode0
dcU
dcI
RddcI
dcI
PIv
Udc
(b) Control block diagram of the DG unit
dcU
dcI
RddcI
dcI
PIv
Battery Enery
Management
System
Charging Mode
Current
Control
Bi-DC
Duty
Cycle PWM+
DC/DCUdc
(c) Control block diagram of the battery Bi-DC
Figure 9. Control block diagram of the converters.
Additionally, in the coordinated control of the system layer, the improved hierarchical/droop
control strategy based on the DC bus voltage introduced in this paper is employed, so as to ensure
Figure 8. Schematic diagram of the system mode-switching.

Energies 2017, 10, 1116 8 of 17
3.3. The Converter Control Scheme of Each Unit
In the local layer control strategy for distributed power sources of the same type, the integratorcurrent-sharing control strategy as Formula (14) proposed in this paper is adopted, and its controlblock diagram is shown as Figure 9:
Udci = U∗dc − Kdi · Idci + Ku ·∫ [
(U∗com −Ucom)− Kpi · Pdci]dt (14)
Energies 2017, 10, 1116 8 of 17
Mode One
DC Microgrid
Operation
Mode Twoshed minor loadsMode
Three
370V<Udc<390V
Udc<370VUdc>
390V
Udc<390V
Udc<360V
Udc>360V
Udc>370V
Figure 8. Schematic diagram of the system mode-switching.
3.3. The Converter Control Scheme of Each Unit
In the local layer control strategy for distributed power sources of the same type, the integrator
current-sharing control strategy as Formula (14) proposed in this paper is adopted, and its control
block diagram is shown as Figure 9:
* *
dci dc di dci u com com pi dciU U K I K U U K P dt
(14)
dcU
dcI
PWM+
AC/DC
G-VSC
PIv PIc
RddcI
dcI
dcI
Udc
(a) Control block diagram of G-VSC
Current
Control
abcU
W-VSC
Droop Control Mode
PWM+
Converter
MPPT
Mode
MPPT
Mode0
dcU
dcI
RddcI
dcI
PIv
Udc
(b) Control block diagram of the DG unit
dcU
dcI
RddcI
dcI
PIv
Battery Enery
Management
System
Charging Mode
Current
Control
Bi-DC
Duty
Cycle PWM+
DC/DCUdc
(c) Control block diagram of the battery Bi-DC
Figure 9. Control block diagram of the converters.
Additionally, in the coordinated control of the system layer, the improved hierarchical/droop
control strategy based on the DC bus voltage introduced in this paper is employed, so as to ensure
Figure 9. Control block diagram of the converters.
Additionally, in the coordinated control of the system layer, the improved hierarchical/droopcontrol strategy based on the DC bus voltage introduced in this paper is employed, so as to ensure thepower flow balance of the microgrid in different hierarchical zones. The operational modes are shownin Figure 8.
According to the load priority, loads can be sorted into n levels: Level-1, Level-2, Level-3, . . . ,Level-n, and the level is greater as the value of n is smaller. Loads in n different levels all have thecorresponding cut-off time, and T1 > T2 > T3, . . . , > Tn. When the bus voltage is detected below 360 V,all timers start. If the timer of Level-n reaches Tn, then the loads of Level-n are shed immediately.After load-shedding, T1, T2, T3, . . . , T(n − 1) will be cleared if the DC bus voltage returns to normal,while the loads in Level-(n − 1) will be cut off if the voltage is still under 360 V and it continues toT(n − 1). The rest can be done in the same manner. The load-shedding process is shown in Figure 10.

Energies 2017, 10, 1116 9 of 17
Energies 2017, 10, 1116 9 of 17
the power flow balance of the microgrid in different hierarchical zones. The operational modes are
shown in Figure 8.
According to the load priority, loads can be sorted into n levels: Level-1, Level-2, Level-3, …,
Level-n, and the level is greater as the value of n is smaller. Loads in n different levels all have the
corresponding cut-off time, and T1 > T2 > T3, …, > Tn. When the bus voltage is detected below 360 V,
all timers start. If the timer of Level-n reaches Tn, then the loads of Level-n are shed immediately.
After load-shedding, T1, T2, T3, …, T(n − 1) will be cleared if the DC bus voltage returns to normal,
while the loads in Level-(n − 1) will be cut off if the voltage is still under 360 V and it continues to T(n
− 1). The rest can be done in the same manner. The load-shedding process is shown in Figure 10.
Detect Voltage
YES
NO
T(n-1) Timing
Start
T(n-1) time is up
NO
YES
Level-(n-1) Load-Shedding
Tn Timing
Tn time is up
NO
YES
Level-n Load-Shedding
T1 Timing
T1 time is up
NO
YES
Level-1 Load-Shedding
T1=T2=,…,Tn=0
End
…
Udc<360V
Figure 10. Schematic diagram of the load-shedding process.
4. Simulation Results
4.1. Verification to the Droop Control Strategy Based on Integrator Current-Sharing
In order to verify the feasibility of the droop control strategy based on integrator current-sharing
proposed in this study, the simulation model of the microgrid is constructed using the
MATLAB/Simulink software. The simulation system of the DC microgrid is composed of three
distributed power sources with the same capacity and common loads. Because of the difference
existing in different feeder parameters of distributed sources, the feeders of the three DG units are
assumed to be 0.5 km, 2 km and 5 km, respectively, and the DC common load as 13.5 kW. The
distributed micro-source parameters under the droop control based on integrator current-sharing are
listed in Table 2.
Table 2. The control parameter of DG units.
Parameter Value Parameter Value *
comU (V) 380
*
dcU (V) 380
Kd 0.2 Kp1 0.004
Rline1 (Ω) 0.05 Kp2 0.004
Rline2 (Ω 0.2 Kp3 0.004
Rline3 (Ω) 0.5 Ku1 50
Ku2 50 Ku3 50
Figure 10. Schematic diagram of the load-shedding process.
4. Simulation Results
4.1. Verification to the Droop Control Strategy Based on Integrator Current-Sharing
In order to verify the feasibility of the droop control strategy based on integrator current-sharingproposed in this study, the simulation model of the microgrid is constructed using theMATLAB/Simulink software. The simulation system of the DC microgrid is composed of threedistributed power sources with the same capacity and common loads. Because of the difference existingin different feeder parameters of distributed sources, the feeders of the three DG units are assumedto be 0.5 km, 2 km and 5 km, respectively, and the DC common load as 13.5 kW. The distributedmicro-source parameters under the droop control based on integrator current-sharing are listed inTable 2.
Table 2. The control parameter of DG units.
Parameter Value Parameter Value
U∗com (V) 380 U∗dc (V) 380Kd 0.2 Kp1 0.004
Rline1 (Ω) 0.05 Kp2 0.004Rline2 (Ω 0.2 Kp3 0.004Rline3 (Ω) 0.5 Ku1 50
Ku2 50 Ku3 50
With the control method proposed in this paper, three DG units with the capacity of 10 kW areconnected to the bus in parallel. The simulation result is shown as Figure 11. In order to facilitate thecontrast, in the initial phase t = [0 s, 1.0 s], the conventional droop control strategy is adopted, while inthe interval t = [1.0 s, 2.0 s], the droop control strategy based on integrator current-sharing proposed inthis study is employed.

Energies 2017, 10, 1116 10 of 17
Energies 2017, 10, 1116 10 of 17
With the control method proposed in this paper, three DG units with the capacity of 10 kW are connected to the bus in parallel. The simulation result is shown as Figure 11. In order to facilitate the contrast, in the initial phase t = [0 s, 1.0 s], the conventional droop control strategy is adopted, while in the interval t = [1.0 s, 2.0 s], the droop control strategy based on integrator current-sharing proposed in this study is employed.
(a) DG output powers under the conventional and proposed control strategy
(b) DG output currents under the conventional and proposed control strategy
(c) DG output voltages under the conventional and proposed control strategy
(d) DC bus voltage under the conventional and proposed control strategy
Figure 11. Simulation results of the conventional and proposed control strategy.
0 0.2 0.4 0.6 0.8 1 1.2 1.4 1.6 1.8 20
500
1000
1500
2000
2500
3000
3500
4000
4500
5000
t/s
Pdc
/W
Pdc1Pdc2Pdc3
0 0.2 0.4 0.6 0.8 1 1.2 1.4 1.6 1.8 28
9
10
11
12
13
14
15
16
t/s
Idc/
A
Idc1Idc2Idc3
0 0.2 0.4 0.6 0.8 1 1.2 1.4 1.6 1.8 2350
352
354
356
358
360
362
364
366
368
370
t/s
Udc
/V
Udc1Udc2Udc3
0 0.2 0.4 0.6 0.8 1 1.2 1.4 1.6 1.8 2340
345
350
355
360
365
370
375
380
t/s
Uco
m/V
Figure 11. Simulation results of the conventional and proposed control strategy.
Figure 11a,b presents the power and current waves of DGs under the conventional and improvedcontrol, respectively. From the figures, before t = 1.0 s, large deviation exits both in the output powerand current of DG units under the conventional control due to the differences among different feeder

Energies 2017, 10, 1116 11 of 17
resistances. The output power difference between DG1 and DG3 is 1000 W. After t = 1.0 s, the outputsteady-state currents of the DG units with the same capacity are almost the same, and the outputpowers are exactly the same; the circulating current is nearly zero. Figure 11c,d displays the outputvoltage and public bus voltage of the DG units under conventional and improved control, respectively.Under the conventional control strategy, the output voltages of different DG units are 356 V, 353 Vand 351.5 V, respectively. The output voltage is relatively low because of the droop control strategy,which affects the system voltage level. However, after t = 1.0 s, the current-sharing term constructedin the new method not only achieves power-sharing, but also improves the system voltage by 10 V.Moreover, the public bus voltage is improved to some extent, enhancing the system voltage stabilityon the whole.
In conclusion, the proposed droop control strategy based on integrator current-sharing not onlycan realize power-sharing, which avoids circulating current and makes the DG unit capability comeinto full play, but it also enhances the voltage level and stability of the system. Therefore, this case canfully justify the feasibility and effectiveness of the proposed method.
In addition, the method proposed in this paper is that no communication is needed betweendifferent DG sources, and the current-sharing control is achieved only by the common bus voltagesignal. The communication between different DGs will disable the microgrid be a plug-and-playsolution, while the microgrid in this paper remains to have a plug-and-play characteristic.
4.2. Verification to System Coordinated Control Strategy
In order to verify the effectiveness of the hierarchical/droop voltage control strategy, thesimulation model shown in Figure 1 is built in MATLAB/Simulink, and the system is configured asshown in Table 3. According to the above analysis of the three operation modes, three respondingsimulation tests are conducted. In addition, the constant illumination model is adopted for PV, andthe constant wind speed model is adopted for wind generation. When switching modes, we assumethe illumination and wind speed are under step changes. Furthermore, the constant power load andlead-acid battery are used in this work. In the case that the battery discharges too deeply and affectsits lifetime, the Depth of Discharge (DoD) is chosen as 60% in this paper, effectively prolonging thebattery lifetime.
Table 3. Configuration of the DC microgrid.
Rated DC bus voltage 380 VMaximum output power of the AC main network 10 kW
Maximum output power of W-VSC in the WT generation system 5 kWMaximum output power of DC/DC in the PV generation system 10 kW
Maximum output power of Bi-DC in the ES system 5 kWLoad 1 (Level1) 10 kWLoad 2 (Level2) 5 kWLoad 3 (Level3) 5 kW
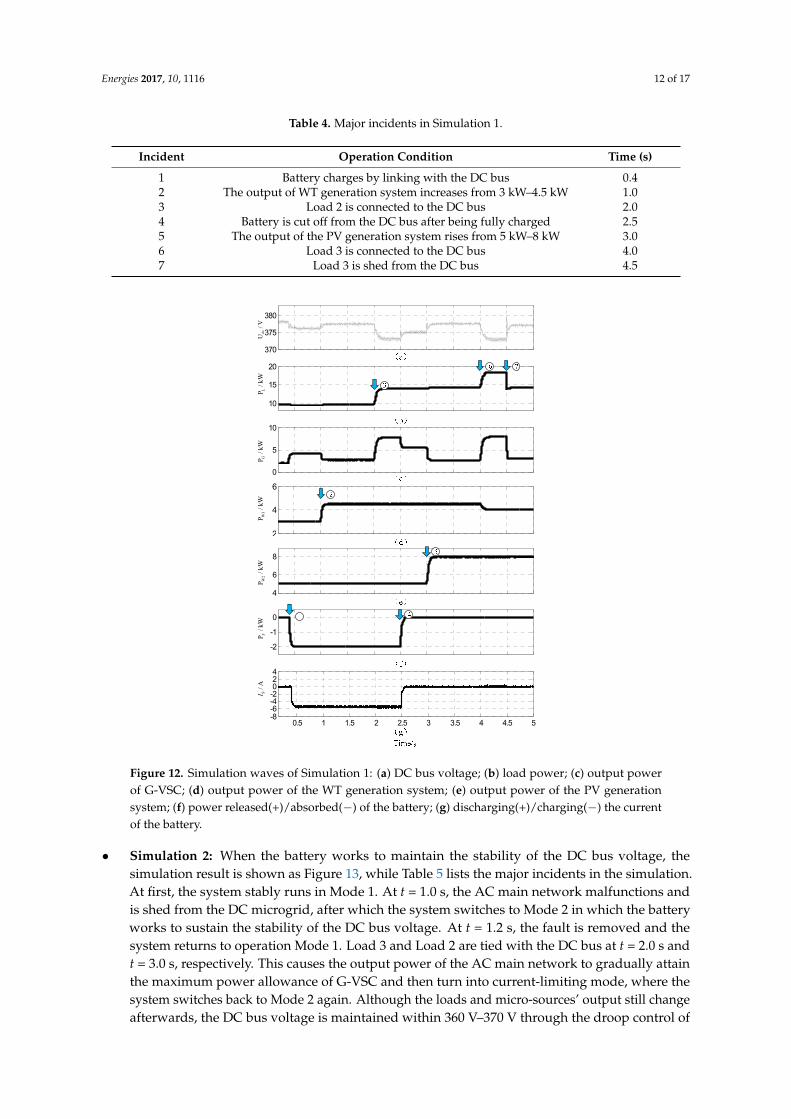
• Simulation 1: The system stably operates in Mode 1, and the AC main network is working tomaintain the stability of the DC bus voltage. The result is depicted in Figure 12, and Table 4 showsthe major incidents in the first simulation. From Figure 12, when the load and DG unit outputpower have changed, G-VSC adjusts the exchange power between the DC microgrid and themain network according to the droop characteristic to sustain the bus voltage within 370 V–390 V,while the battery is cut off from the DC bus, becoming a standby.
Energies 2017, 10, 1116 12 of 17
Table 4. Major incidents in Simulation 1.
Incident Operation Condition Time (s)
1 Battery charges by linking with the DC bus 0.42 The output of WT generation system increases from 3 kW–4.5 kW 1.03 Load 2 is connected to the DC bus 2.04 Battery is cut off from the DC bus after being fully charged 2.55 The output of the PV generation system rises from 5 kW–8 kW 3.06 Load 3 is connected to the DC bus 4.07 Load 3 is shed from the DC bus 4.5
Energies 2017, 10, 1116 12 of 17
Table 4. Major incidents in Simulation 1.
Incident Operation Condition Time (s) 1 Battery charges by linking with the DC bus 0.4 2 The output of WT generation system increases from 3 kW–4.5 kW 1.0 3 Load 2 is connected to the DC bus 2.0 4 Battery is cut off from the DC bus after being fully charged 2.5 5 The output of the PV generation system rises from 5 kW–8 kW 3.0 6 Load 3 is connected to the DC bus 4.0 7 Load 3 is shed from the DC bus 4.5
2
4
6
4
6
8
-2
-1
0
0.5 1 1.5 2 2.5 3 3.5 4 4.5 5-8-6-4-2024
370
375
380
10
15
20
0
5
10
dcU
/VLP
/kW
P/k
WG
W1
P/k
WW
2P
/kW
P/k
WS
S/A
I
Figure 12. Simulation waves of Simulation 1: (a) DC bus voltage; (b) load power; (c) output power of G-VSC; (d) output power of the WT generation system; (e) output power of the PV generation system; (f) power released(+)/absorbed(−) of the battery; (g) discharging(+)/charging(−) the current of the battery.
• Simulation 2: When the battery works to maintain the stability of the DC bus voltage, the simulation result is shown as Figure 13, while Table 5 lists the major incidents in the simulation. At first, the system stably runs in Mode 1. At t = 1.0 s, the AC main network malfunctions and is shed from the DC microgrid, after which the system switches to Mode 2 in which the battery works to sustain the stability of the DC bus voltage. At t = 1.2 s, the fault is removed and the system returns to operation Mode 1. Load 3 and Load 2 are tied with the DC bus at t = 2.0 s and t = 3.0 s, respectively. This causes the output power of the AC main network to gradually attain
Figure 12. Simulation waves of Simulation 1: (a) DC bus voltage; (b) load power; (c) output powerof G-VSC; (d) output power of the WT generation system; (e) output power of the PV generationsystem; (f) power released(+)/absorbed(−) of the battery; (g) discharging(+)/charging(−) the currentof the battery.
• Simulation 2: When the battery works to maintain the stability of the DC bus voltage, thesimulation result is shown as Figure 13, while Table 5 lists the major incidents in the simulation.At first, the system stably runs in Mode 1. At t = 1.0 s, the AC main network malfunctions andis shed from the DC microgrid, after which the system switches to Mode 2 in which the batteryworks to sustain the stability of the DC bus voltage. At t = 1.2 s, the fault is removed and thesystem returns to operation Mode 1. Load 3 and Load 2 are tied with the DC bus at t = 2.0 s andt = 3.0 s, respectively. This causes the output power of the AC main network to gradually attainthe maximum power allowance of G-VSC and then turn into current-limiting mode, where thesystem switches back to Mode 2 again. Although the loads and micro-sources’ output still changeafterwards, the DC bus voltage is maintained within 360 V–370 V through the droop control of

Energies 2017, 10, 1116 13 of 17
the storage battery. At t = 4.7 s, the output power cannot meet the load demand since the outputof the PV generation system has been reduced. According to the load grades, Load 3 is cut off.After cutting, the output power can meet the load requirement, and the system can stably operatein the mode.
Table 5. Major incidents in Simulation 2.
Incident Operation Conditions Time (s)
1 AC main network fails 1.02 AC main network recovers from the failure 1.23 Load 3 is connected to the DC bus 2.04 Load 2 is connected to the DC bus 3.05 The output of the WT generation system decreases from 3 kW–1 kW 4.06 The output of the PV generation system reduces from 5 kW–3 kW 4.57 Load 3 is shed from the DC bus 4.7
Energies 2017, 10, 1116 13 of 17
the maximum power allowance of G-VSC and then turn into current-limiting mode, where the system switches back to Mode 2 again. Although the loads and micro-sources’ output still change afterwards, the DC bus voltage is maintained within 360 V–370 V through the droop control of the storage battery. At t = 4.7 s, the output power cannot meet the load demand since the output of the PV generation system has been reduced. According to the load grades, Load 3 is cut off. After cutting, the output power can meet the load requirement, and the system can stably operate in the mode.
Table 5. Major incidents in Simulation 2.
Incident Operation Conditions Time (s) 1 AC main network fails 1.0 2 AC main network recovers from the failure 1.2 3 Load 3 is connected to the DC bus 2.0 4 Load 2 is connected to the DC bus 3.0 5 The output of the WT generation system decreases from 3 kW–1 kW 4.0 6 The output of the PV generation system reduces from 5 kW–3 kW 4.5 7 Load 3 is shed from the DC bus 4.7
360
370
380
0
10
20
0
5
10
0
2
2
4
6
-20246
0.5 1 1.5 2 2.5 3 3.5 4 4.5 5-10
0
10
dcU/V
LP/k
WP
/kW
GW
1P
/kW
W2
P/k
WP
/kW
SS
/AI
Figure 13. Simulation waves of Simulation 2: (a) DC bus voltage; (b) load power; (c) output power of G-VSC; (d) output power of the WT generation system; (e) output power of the PV generation system; (f) power released(+)/absorbed(−) of the battery; (g) discharging(+)/charging(−) current of the battery.
• Simulation 3: When the islanded mode is taken into consideration and the DG unit sustains the stability of the DC bus voltage, the simulation result is shown as Figure 14. Table 6 lists the major incidents in the simulation. At t = 1 s, the DC microgrid in the islanded mode is disconnected
Figure 13. Simulation waves of Simulation 2: (a) DC bus voltage; (b) load power; (c) output powerof G-VSC; (d) output power of the WT generation system; (e) output power of the PV generationsystem; (f) power released(+)/absorbed(−) of the battery; (g) discharging(+)/charging(−) current ofthe battery.
• Simulation 3: When the islanded mode is taken into consideration and the DG unit sustains thestability of the DC bus voltage, the simulation result is shown as Figure 14. Table 6 lists the majorincidents in the simulation. At t = 1 s, the DC microgrid in the islanded mode is disconnectedfrom the main network, causing the system to switch to operation Mode 2, in which the batterymaintains the stability of the DC bus voltage. At t = 2 s, the output power of the DG unit increases,and the DC bus voltage rises over 390 V, after which the DC microgrid switches to Mode 3.In Mode 3, the DG generation unit is under voltage-sourced control to sustain the stability of

Energies 2017, 10, 1116 14 of 17
the DC bus voltage and the power balance. The output of the PV and WT generation systems isdecided in terms of their capacity ratio (2:1). At t = 3 s, the active load changes, the stability of theDC bus voltage and system power balance are achieved through the droop control of the DG unit.At t = 4 s, the battery is fully charged and cut off from the DC microgrid.
Table 6. Major incidents in Simulation 3.
Incident Operation conditions Time(s)
1 DC microgrid disconnected from the main network, in islanded mode 1.02 The output of the DG generation system increases dramatically 2.0
3 Load 1 is shed from the DC busLoad 2 is connected to the DC bus 3.0
4 Battery is cut off from the DC bus after being fully charged 4.0
Energies 2017, 10, 1116 14 of 17
from the main network, causing the system to switch to operation Mode 2, in which the battery maintains the stability of the DC bus voltage. At t = 2 s, the output power of the DG unit increases, and the DC bus voltage rises over 390 V, after which the DC microgrid switches to Mode 3. In Mode 3, the DG generation unit is under voltage-sourced control to sustain the stability of the DC bus voltage and the power balance. The output of the PV and WT generation systems is decided in terms of their capacity ratio (2:1). At t = 3 s, the active load changes, the stability of the DC bus voltage and system power balance are achieved through the droop control of the DG unit. At t = 4 s, the battery is fully charged and cut off from the DC microgrid.
Table 6. Major incidents in Simulation 3.
Incident Operation conditions Time(s)
1 DC microgrid disconnected from the main network, in islanded mode 1.0
2 The output of the DG generation system increases dramatically 2.0
3 Load 1 is shed from the DC bus
Load 2 is connected to the DC bus 3.0
4 Battery is cut off from the DC bus after being fully charged 4.0
Figure 14. Simulation waves of Simulation 3: (a) DC bus voltage; (b) load power; (c) output power of G-VSC; (d) output power of the WT generation system; (e) output power of the PV generation system; (f) power released(+)/absorbed(−) of the battery; (g) discharging(+)/charging(−) current of the battery.
Figure 14. Simulation waves of Simulation 3: (a) DC bus voltage; (b) load power; (c) output powerof G-VSC; (d) output power of the WT generation system; (e) output power of the PV generationsystem; (f) power released(+)/absorbed(−) of the battery; (g) discharging(+)/charging(−) current ofthe battery.
4.3. Verification to the Actual PV and WT Generation System
In order to verify the voltage stability of actual PV and WT generation in the DC microgrid,actual data of PV and WT generation are used in this case. The DC microgrid system operates inMode 1. In the Figure 15, in the time interval t = [1.5 s, 2 s], the PV gets the maximum illumination,with an output of 5 kW or so, while the output of WT generation is stochastic, changing within

Energies 2017, 10, 1116 15 of 17
[3 kW, 5.8 kW]. The rest of the demanded power is provided to the load by the grid-connected inverterG-VSC, ensuring the common bus voltage within in a certain range, which verifies the stability of theDC microgrid voltage.
Energies 2017, 10, 1116 15 of 17
4.3. Verification to the Actual PV and WT Generation System
In order to verify the voltage stability of actual PV and WT generation in the DC microgrid, actual data of PV and WT generation are used in this case. The DC microgrid system operates in Mode 1. In the Figure 15, in the time interval t = [1.5 s, 2 s], the PV gets the maximum illumination, with an output of 5 kW or so, while the output of WT generation is stochastic, changing within [3 kW, 5.8 kW]. The rest of the demanded power is provided to the load by the grid-connected inverter G-VSC, ensuring the common bus voltage within in a certain range, which verifies the stability of the DC microgrid voltage.
(a) Output power of the PV generation system
(b) Output power of the WT generation system
(c) Output power of G-VSC
(d) DC bus voltage
Figure 15. Simulation results of the conventional and proposed control strategy.
0.5 1 1.5 2 2.5 3 3.5-4000
-3000
-2000
-1000
0
1000
2000
3000
4000
5000
6000
t/s
Pdc
(PV
)/W
0 0.5 1 1.5 2 2.5 3 3.5-1000
0
1000
2000
3000
4000
5000
6000
t/s
Pdc
(Win
d)/W
0 0.5 1 1.5 2 2.5 3 3.50
500
1000
1500
2000
2500
3000
t/s
Pdc
(G-V
SC
)/W
0.5 1 1.5 2 2.5 3 3.5350
355
360
365
370
375
380
385
390
395
400
t/s
Uco
m/V
Figure 15. Simulation results of the conventional and proposed control strategy.

Energies 2017, 10, 1116 16 of 17
5. Conclusions
Taking a PV/WT/ES DC microgrid applied to small-sized commercial and residential buildingsas a paradigm, this paper proposes a hierarchical/droop voltage control strategy based on the DCbus voltage, which controls the operation mode of the DC microgrid by detecting the change ofthe bus voltage to sustain the power balance of the DC microgrid. In addition, in order to avoidthe drawbacks of the conventional droop control, an improved DC droop control strategy based onintegrator current-sharing is introduced. Simulation results verify the effectiveness and feasibilityof the proposed scheme. Through the analysis, the following conclusion can be made: (1) with thehelp of the integral term, the improved droop control strategy can achieve power-sharing, as well asimprove the DC bus voltage; (2) in the method proposed in this paper, judging by using the commonDC voltage can make the operation modes switch smoothly, ensuring that the DG sources are workingat their maximum efficiency, and the system has transient steady characteristic; (3) the strategy onlydetects local information of various units, so there is no communication between different DG sources,thereby improving the flexibility and reliability of the control and meaning that the DC microgridsystem can be a plug-and-play solution.
Author Contributions: The paper was a collaborative effort between the authors. The authors contributedcollectively to the theoretical analysis, modeling, simulation, and manuscript preparation.
Conflicts of Interest: The authors declare no conflict of interest.
References
1. Yan, B.; Wang, B.; Zhu, L. A novel, stable, and economic power sharing scheme for an autonomous microgridin the energy internet. Energies 2015, 8, 12741–12764. [CrossRef]
2. Lim, Y.; Kim, H.M.; Kinoshita, T. Distributed load-shedding system for agent-based autonomous microgridoperations. Energies 2014, 7, 385–401. [CrossRef]
3. Lasseter, R.H.; Paigi, P. Microgrid: A conceptual solution. In Proceedings of the IEEE Conference on PowerElectronics Specialists, Aachen, Germany, 20–25 June 2004; pp. 4285–4290.
4. Patterson, M.; Macia, N.F.; Kannan, A.M. Hybrid microgrid model based on solar photovoltaic battery fuelcell system for intermittent load applications. IEEE Trans. Energy Convers. 2015, 30, 359–366. [CrossRef]
5. Xiao, H.; Luo, A.; Shuai, Z. An Improved control method for multiple bidirectional power converters inhybrid AC/DC microgrid. IEEE Trans. Smart Grid 2016, 7, 340–347. [CrossRef]
6. Salomonsson, D.; Sannino, A. A low-voltage DC distribution system for commercial power systems withsensitive electronic loads. IEEE Trans. Power Deliv. 2007, 22, 1620–1627. [CrossRef]
7. Mehrdad, B.; Abolfazl, J.; Mehdi, E. Cooperative energy management of hybrid DC renewable grid usingdecentralized control strategies. Energies 2016, 9, 859.
8. Liu, Y.Q.; Wang, J.Z.; Li, N.N.; Fu, Y.; Ji, Y.C. Enhanced load power sharing accuracy in droop-controlled DCmicrogrids with both mesh and radial configurations. Energies 2015, 8, 3591–3605. [CrossRef]
9. Gao, F.; Bozhko, S.; Costabeber, A. Comparative stability analysis of droop control approaches involtage-source-converter-based DC microgrids. IEEE Trans. Power Electron. 2017, 32, 2395–2415. [CrossRef]
10. Vu, T.V.; Paran, S.; Diaz, F. An alternative distributed control architecture for improvement in the transientresponse of DC microgrids. IEEE Trans. Ind. Electron. 2016, 64, 574–584. [CrossRef]
11. Hamzeh, M.; Ghazanfari, A.; Mohamed, Y. Modeling and design of an oscillatory current-sharing controlstrategy in DC microgrids. IEEE Trans. Ind. Electron. 2015, 62, 6647–6657. [CrossRef]
12. Bryan, J.; Duke, R.; Round, S. Decentralized generator scheduling in a nanogrid using DC bus signaling.In Proceedings of the IEEE Power Engineering Society General Meeting, Denver, CO, USA, 6–10 June 2004;pp. 977–982.
13. Khorsandi, A.; Ashourloo, M.; Mokhtari, H. Automatic droop control for a low voltage DC microgrid.IET Gener. Trans. Distrib. 2016, 10, 41–47. [CrossRef]
14. Lu, X.; Wan, J. Modeling and Control of the Distributed Power Converters in a Standalone DC Microgrid.Energies 2016, 9, 217. [CrossRef]

Energies 2017, 10, 1116 17 of 17
15. Dou, C.; Yue, D.; Guerrero, J.M. Multiagent System-Based Distributed Coordinated Control for Radial DCMicrogrid Considering Transmission Time Delays. IEEE Trans. Smart Grid 2016, 99, 1–12. [CrossRef]
16. Hu, R.; Weaver, W.W. DC microgrid droop control based on battery state of charge balancing. In Proceedingsof the IEEE Power and Energy Conference, Urbana, IL, USA, 19–20 February 2016; pp. 1–8.
17. Hwang, C.S.; Kim, E.S.; Kim, Y.S. A Decentralized Control Method for Distributed Generations in an IslandedDC Microgrid Considering Voltage Drop Compensation and Durable State of Charge. Energies 2016, 9, 1070.[CrossRef]
18. Salomonsson, D.; Soder, L.; Sannino, A. An adaptive control system for a dc microgrid for data centers.IEEE Trans. Ind. Appl. 2008, 44, 1910–1917. [CrossRef]
19. Xu, L.; Chen, D. Control and operation of a DC microgrid with variable generation and energy storage.IEEE Trans. Power Deliv. 2011, 26, 2513–2522. [CrossRef]
20. Zhou, T.; Francois, B. Energy management and power control of a hybrid active wind generator fordistributed power generation and grid integrator. IEEE Trans. Ind. Electron. 2011, 58, 95–104. [CrossRef]
21. Guerrero, J.M.; Vasquez, J.C.; Matas, J. Hierarchical control of droop-controlled AC and DC Microgrids—Ageneral approach toward standardization. IEEE Trans. Ind. Electron. 2011, 58, 158–172. [CrossRef]
22. Chen, D.; Xu, L. Autonomous DC voltage control of a DC microgrid with multiple slack terminals. IEEE Trans.Power Syst. 2012, 27, 1897–1905. [CrossRef]
23. Han, Y.; Chen, W.R.; Li, Q. Energy management strategy based on multiple operating states for aphotovoltaic/fuel cell/energy storage DC microgrid. Energies 2017, 10, 136. [CrossRef]
24. Teleke, S.; Baran, M.E.; Huang, A.Q.; Bhattacharya, S.; Anderson, L. Control strategies for battery energystorage for wind farm dispatching. IEEE Trans. Energy Convers. 2009, 24, 725–732. [CrossRef]
25. Dragicevic, T.; Guerrero, J.M.; Vasquez, J.C. Supervisory control of an adaptive-droop regulated DC microgridwith battery management capability. IEEE Trans. Power Electron. 2013, 29, 1–12. [CrossRef]
26. Lu, X.; Guerrero, J.M.; Sun, K. An improved droop control method for DC microgrids based on lowbandwidth communication with DC bus voltage restoration and enhanced current sharing accuracy.IEEE Trans. Power Electron. 2013, 29, 1–12. [CrossRef]
27. Lee, S.W.; Cho, B.H. Master–slave based hierarchical control for a small power DC-distributed microgridsystem with a storage device. Energies 2016, 9, 880. [CrossRef]
28. Wang, P.B.; Lu, X.N.; Yang, X. An improved distributed secondary control method for DC microgrids withenhanced dynamic current sharing performance. IEEE Trans. Power Electron. 2016, 31, 6658–6673. [CrossRef]
29. Dragicevic, T.; Lu, X.N.; Vasquez, J.C. DC Microgrids—Part I: A review of control strategies and stabilizationtechniques. IEEE Trans. Power Electron. 2016, 31, 4876–4891. [CrossRef]
30. Yu, S.Y.; Kim, H.J.; Kim, J.H. SoC-Based Output Voltage Control for BESS with a Lithium-Ion Battery in aStand-Alone DC Microgrid. Energies 2016, 9, 924. [CrossRef]
31. Lu, X.; Sun, K.; Guerrero, J.M. SoC-based droop method for distributed energy storage in DC microgridapplications. In Proceedings of the 2012 IEEE International Symposium on Industrial Electronics (ISIE),Hangzhou, China, 28–31 May 2012; pp. 1640–1645.
© 2017 by the authors. Licensee MDPI, Basel, Switzerland. This article is an open accessarticle distributed under the terms and conditions of the Creative Commons Attribution(CC BY) license (http://creativecommons.org/licenses/by/4.0/).