Embed Size (px)
Citation preview

December 2012
A Community Health Needs Assessment for Saint Peter’s University Hospital
& Robert Wood Johnson University Hospital: Findings from the Behavioral Risk Factor & Surveillance System (BRFSS), Hospital Discharge Data, A Community Survey, Key Informant Interviews, and Community Member Focus Groups
Sujoy Chakravarty, Ph.D. Susan Brownlee, Ph.D.
Jian Tong, M.S. Maria B. Pellerano, M.A., M.B.A., M.P.H.
Jenna Howard, Ph.D. Eric K. Shaw, Ph.D.
Sabrina Chase, Ph.D. Benjamin F. Crabtree, Ph.D.


Author Affiliations Rutgers University Center for State Health Policy Sujoy Chakravarty, Ph.D. Susan Brownlee, Ph.D. Jian Tong, M.S. UMDNJ - Robert Wood Johnson Medical School Dept. of Family Medicine & Community Health, Research Division Maria B. Pellerano, M.A., M.B.A., M.P.H. Jenna Howard, Ph.D. Benjamin F. Crabtree, Ph.D. Mercer University School of Medicine, Savannah Campus, Dept. of Community Medicine Eric K. Shaw, Ph.D. UMDNJ – School of Nursing, Joint Urban Systems Ph.D. Program Sabrina Chase, Ph.D.


Table of Contents Acknowledgments............................................................................................................................ i
Executive Summary ..........................................................................................................................ii
Introduction .................................................................................................................................... 1
Chapter 1: Health Indicators and Risky/Preventive Behaviors: An Analysis of 2010 Behavioral Risk Factor Surveillance System (BRFSS)
Introduction .................................................................................................................................... 4
Methods .......................................................................................................................................... 4
Findings ........................................................................................................................................... 5
Description of Crosstab Groups (Age, Gender, Race-Ethnicity, Income, Health Insurance Coverage) .................................................................................................................................... 5
Health Status ............................................................................................................................... 7
Chronic Conditions and Disability ............................................................................................... 9
Medical Utilization and Access .................................................................................................. 13
Dental Utilization ....................................................................................................................... 15
Risk Behaviors (including BMI) .................................................................................................. 17
Preventive Behaviors ................................................................................................................. 21
Conclusions ................................................................................................................................... 28
Tables ............................................................................................................................................ 29
Chapter 2: Avoidable Hospitalizations and Emergency Department Visits: An Analysis of Hospital Discharge Data
Introduction .................................................................................................................................. 54
Methods ........................................................................................................................................ 55
Findings ......................................................................................................................................... 57
Overall Rates of Avoidable Visits ............................................................................................... 57
Distribution of Avoidable Visits: Patient and Payer Characteristics ......................................... 60
Avoidable Visits Stratified by Patient and Payer Characteristics .............................................. 63

Avoidable Pediatric Hospitalizations ......................................................................................... 67
Conclusions ................................................................................................................................... 68
References .................................................................................................................................... 70
Tables ............................................................................................................................................ 72
Appendices .................................................................................................................................... 92
Appendix 2.A: 2010 Population from Nielsen/Claritas ............................................................. 92
Appendix 2.B: AHRQ PQI Conditions ......................................................................................... 93
Appendix 2.C: AHRQ PQI Composites and Constituents ........................................................... 94
Appendix 2.D: Classification of Emergency Department Visits ................................................ 95
Chapter 3: Health, Health Care Utilization, and Access: An Interpretation of 2012 Community Phone Survey
Introduction .................................................................................................................................. 96
Methods ........................................................................................................................................ 96
Findings ......................................................................................................................................... 98
Adults ........................................................................................................................................ 98
Description of Crosstab Groups (Age, Gender, Race-Ethnicity, Income, Health Insurance Coverage) ............................................................................................................................... 99
Age ..................................................................................................................................... 99
Gender ............................................................................................................................... 99
Race-Ethnicity .................................................................................................................... 99
Income ............................................................................................................................... 99
Health Insurance Status ................................................................................................... 101
Community Problem Perception ......................................................................................... 102
Health Status ....................................................................................................................... 103
Chronic Conditions .............................................................................................................. 103
Obesity ................................................................................................................................. 104
Smoking ............................................................................................................................... 105
Medical Utilization ............................................................................................................... 105
Dental Utilization ................................................................................................................. 106

Mental Health Utilization .................................................................................................... 107
Prescription Medicines ........................................................................................................ 107
Sources of Health Information and Health Promotion Events ............................................ 107
Usual Source of Care............................................................................................................ 108
Barriers to Care .................................................................................................................... 109
Attitudes about Health and Health Care ............................................................................. 110
Emergency Preparedness .................................................................................................... 111
Socio-demographics ............................................................................................................ 112
Cell Phone Usage ................................................................................................................. 113
Children ................................................................................................................................... 115
Description of Crosstab Groups (Age, Gender, Race-Ethnicity, Income, Health Insurance Coverage) ............................................................................................................................. 115
Age ................................................................................................................................... 115
Gender ............................................................................................................................. 115
Race-Ethnicity .................................................................................................................. 115
Income ............................................................................................................................. 115
Health Insurance Status ................................................................................................... 116
Health Status ....................................................................................................................... 116
Chronic Conditions .............................................................................................................. 117
Medical Utilization ............................................................................................................... 117
Dental Utilization ................................................................................................................. 118
Mental Health Utilization .................................................................................................... 118
Prescription Medicines ........................................................................................................ 119
Usual Source of Care............................................................................................................ 119
Barriers to Care .................................................................................................................... 119
Socio-demographics ............................................................................................................ 120
Conclusions ................................................................................................................................. 120
Adults ...................................................................................................................................... 120
Children ................................................................................................................................... 123
Tables .......................................................................................................................................... 125

Chapter 4: Community Input: 2012 Key Informant Interviews and Consumer Focus Groups
Introduction ................................................................................................................................ 149
Methods ...................................................................................................................................... 149
Key Informant Interviews ........................................................................................................ 149
Focus Groups ........................................................................................................................... 151
Data Analysis ........................................................................................................................... 152
Findings ....................................................................................................................................... 152
Theme 1: Perceptions of Health Care and Community Health ............................................... 153
Meaning of Health Care: Patient Perspective ..................................................................... 153
Health Status ....................................................................................................................... 153
Primary Health Conditions................................................................................................... 154
Theme 2: Health Care Resources ............................................................................................ 156
Existing Resources ............................................................................................................... 156
Physical Well-Being .......................................................................................................... 156
Mental Well-Being (including mental health, domestic violence, substance abuse, and addiction) ......................................................................................................................... 157
Social Determinants of Health ......................................................................................... 158
Needed Resources or Resources Needing Improvements .................................................. 158
Obesity ............................................................................................................................. 159
Education and Awareness ................................................................................................ 159
Comprehensive Medical and Mental Health Services ..................................................... 160
Funding ................................................................................................................................ 161
Theme 3: Barriers to Health Care ............................................................................................ 161
Health System Navigation ................................................................................................... 161
Health Care Information ...................................................................................................... 162
Health Care Access .............................................................................................................. 163
Unmet Health Needs ........................................................................................................... 165
Cultural Issues ...................................................................................................................... 165
Doctor-Patient Communication .......................................................................................... 167
Theme 4: Community Perceptions of Hospitals ...................................................................... 168

Conclusions ................................................................................................................................. 169
References .................................................................................................................................. 171
Appendices .................................................................................................................................. 172
Appendix 4.A: Questions Used for the Community Stakeholder Interviews .......................... 172
Appendix 4.B: Questions Used for Focus Groups ................................................................... 173
Appendix 4.C: Sample Recruitment Flyer ............................................................................... 174
Appendix 4.D: Qualitative Analysis Code Book ....................................................................... 175
Appendix 4.E: Good Existing Resources .................................................................................. 176
Appendix 4.F: Sources of Health Care Information ................................................................ 183
Chapter 5: Discussion
Conclusions ................................................................................................................................. 184
Interpretation, Generalizability of Findings, and Study Strengths ............................................. 187
Supplement: Summary of New Jersey Childhood Obesity Study Findings for New Brunswick, NJ
Introduction ................................................................................................................................ 190
Methods ...................................................................................................................................... 190
Findings ....................................................................................................................................... 191
Telephone Survey .................................................................................................................... 191
Food Behaviors .................................................................................................................... 191
Food Shopping Environment ............................................................................................... 192
Physical Activity ................................................................................................................... 192
Physical Activity Environment ............................................................................................. 193
Public School BMI Data ........................................................................................................... 193
Maps: Food Environment and Physical Activity ...................................................................... 194
Links to Childhood Obesity Study Reports .................................................................................. 195

List of Figures Chapter 1: Health Indicators and Risky/Preventive Behaviors: An Analysis of 2010 Behavioral Risk Factor Surveillance System (BRFSS)
Figure 1.1: Individual Characteristics .............................................................................................. 6
Figure 1.2: Percent Reporting Fair or Poor Self-assessed Overall Health Status ........................... 7
Figure 1.3: Percent Ever Diagnosed with Asthma .......................................................................... 9
Figure 1.4: Percent Ever Diagnosed with Diabetes ....................................................................... 10
Figure 1.5: Percent with an Activity Limitation ............................................................................ 12
Figure 1.6: Percent Without a Regular Doctor ............................................................................. 13
Figure 1.7: Percent Who Could Not See a Doctor due to Cost in Past Year ................................. 14
Figure 1.8: Percent Who Did Not See a Dentist in Past Year ........................................................ 16
Figure 1.9: Percent Current Smokers ............................................................................................ 18
Figure 1.10: Percent Overweight and Obese ................................................................................ 19
Figure 1.11: Percent with Not Enough Sleep or Rest More Than 2 Days/Week .......................... 20
Figure 1.12: Percent of Older Adults Who Did Not Get a Flu Shot in Past Year ........................... 22
Figure 1.13: Percent of Women Who Did Not Get a Mammogram in Past 2 Years ..................... 23
Figure 1.14: Percent of Older Adults Who Have Never Had a Pneumonia Shot .......................... 25
Figure 1.15: Percent of Adults Who Have Never Had a Sigmoidoscopy or Colonoscopy ............ 26
Figure 1.16: Percent of Adults Who Have Never Had an HIV Test ............................................... 27
Chapter 2: Avoidable Hospitalizations and Emergency Department Visits: An Analysis of Hospital Discharge Data
Figure 2.1: Avoidable Hospitalization Rate (per 100 population) ................................................ 58
Figure 2.2: Avoidable ED Visit Rate (per 100 population) ............................................................ 58
Figure 2.3: Rates and Composition of Avoidable ED Visits (per 100 population) ........................ 60
Figure 2.4: Payer Distribution of Avoidable Hospitalizations and ED Visits ................................. 61
Figure 2.5: Race-Ethnicity Distribution of Avoidable Hospitalizations and ED Visits ................... 63
Figure 2.6: Percent of Avoidable Hospitalizations by Payer ......................................................... 64
Figure 2.7: Percent of Avoidable ED Visits by Payer ..................................................................... 64

Figure 2.8: Percent of Avoidable Hospitalizations by Race .......................................................... 65
Figure 2.9: Percent of Avoidable ED Visits by Race ...................................................................... 66
Figure 2.10: Percent of Avoidable Hospitalization among Pediatric Hospitalizations - Overall and by Race .......................................................................................................................................... 67

List of Tables Chapter 1: Health Indicators and Risky/Preventive Behaviors: An Analysis of 2010 Behavioral Risk Factor Surveillance System (BRFSS)
Table 1.1: Individual Characteristics (unweighted) ...................................................................... 29
Table 1.2: Individual Characteristics ............................................................................................. 30
Table 1.3: Item Frequencies .......................................................................................................... 31
Table 1.4: Health Status by Individual Characteristics .................................................................. 42
Table 1.5: Chronic Conditions by Individual Characteristics ......................................................... 43
Table 1.6: Medical Utilization by Individual Characteristics ......................................................... 45
Table 1.7: Dental Utilization by Individual Characteristics ........................................................... 46
Table 1.8: Alcohol, Tobacco Use by Individual Characteristics ..................................................... 47
Table 1.9: Weight, Exercise by Individual Characteristics ............................................................ 48
Table 1.10: Sleep, Falls, Seatbelt Use by Individual Characteristics ............................................. 49
Table 1.11: Influenza Immunization by Individual Characteristics ............................................... 50
Table 1.12: Women's Health by Individual Characteristics .......................................................... 51
Table 1.13: Other Preventive Behaviors by Individual Characteristics ......................................... 52
Chapter 2: Avoidable Hospitalizations and Emergency Department Visits: An Analysis of Hospital Discharge Data
Table 2.1: Rates of Avoidable Hospitalizations and ED visits (per 100 population) ..................... 72
Table 2.2: Rates of Hospitalizations and ED Visits: Total and Avoidable ...................................... 73
Table 2.3: Rates of Overall, Acute and Chronic Composite Indicators of Avoidable Hospitalizations (per 100 population) .......................................................................................... 74
Table 2.4: Rates of Individual Ambulatory Care Sensitive Conditions (per 100 population) ....... 75
Table 2.5: Rates of Avoidable ED Visits and Various Categories (per 100 population) ................ 78
Table 2.6a: Payer Distribution of Avoidable Hospitalizations ...................................................... 79
Table 2.6b: Payer Distribution of Avoidable ED Visits .................................................................. 80
Table 2.7: Age Distribution of Avoidable Hospitalizations and ED Visits ..................................... 81
Table 2.8: Gender Distribution of Avoidable Hospitalizations and ED Visits ................................ 82

Table 2.9a: Race-Ethnicity Distribution of Avoidable Hospitalizations ........................................ 83
Table 2.9b: Race-Ethnicity Distribution of Avoidable ED Visits .................................................... 84
Table 2.10a: Percent of Avoidable Hospitalizations by Type of Payer ......................................... 85
Table 2.10b: Percent of Avoidable ED Visits by Type of Payer ..................................................... 86
Table 2.11a: Percent of Avoidable Hospitalizations by Patient Race ........................................... 87
Table 2.11b: Percent of Avoidable ED Visits by Patient Race ...................................................... 88
Table 2.12a: Percent of Avoidable Hospitalizations by Patient Gender and Age ......................... 89
Table 2.12b: Percent of Avoidable ED Visits by Patient Gender and Age .................................... 90
Table 2.13: Total and Avoidable Pediatric Hospitalizations ......................................................... 91
Appendix 2.A: 2010 Population from Nielsen/Claritas ................................................................. 92
Appendix 2.B: AHRQ PQI Conditions ............................................................................................ 93
Appendix 2.C: AHRQ PQI Composites and Constituents .............................................................. 94
Appendix 2.D: Classification of Emergency Department Visits .................................................... 95
Chapter 3: Health, Health Care Utilization, and Access: An Interpretation of 2012 Community Phone Survey
Table 3.1: Sample Size for Each Zip Code (unweighted) ............................................................. 125
Table 3.2: Individual Characteristics, Adults (unweighted) ........................................................ 126
Table 3.3: Phone Characteristics, Adults (unweighted) .............................................................. 127
Table 3.4: Individual Characteristics, Adults ............................................................................... 128
Table 3.5: Summary of Results - Adults ...................................................................................... 129
Table 3.5a: Access Concerns from Summary of Results - Adults ................................................ 137
Table 3.6: Individual Characteristics, Children (unweighted) ..................................................... 141
Table 3.7: Individual Characteristics, Children ........................................................................... 142
Table 3.8: Summary of Results - Children ................................................................................... 143

i Rutgers Center for State Health Policy/RWJMS Family Medicine & Community Health, Dec 2012
Acknowledgments Funding for this project was provided through a collaborative grant between St. Peter’s University Hospital and Robert Wood Johnson University Hospital that was funded through The Robert Wood Johnson Foundation’s New Jersey Health Initiatives Program. We are grateful for valuable comments on the design and content of this study by Marge Drozd, M.S.N., R.N., A.P.R.N.-B.C., Director of Community Mobile Health Services at SPUH, Mariam Merced, M.A., Director of Community Health Promotions Program at RWJUH, Camilla Comer-Carruthers, M.P.H., Manager of Community Health Education at RWJUH, and other members of the Project Steering Committee. We also thank Aracely Machias, Rajiv Ulpe, Vipal Amin, and Padma Arvind for facilitating and note taking at the Spanish, Hindi, and Gujarati focus groups. In addition, we thank the 26 community stakeholders who agreed to be interviewed for this project and for the following organizations who hosted the focus groups: First Baptist Church of Lincoln Gardens in Somerset, Mount Zion AME Church of New Brunswick, ParamCare, Puerto Rican Action Board (PRAB), the Spotswood Middle School, and Woodbridge Department of Health, and we appreciate the many members of the community who participated in the focus groups and community survey and provided valuable feedback. Finally, we thank CSHP colleagues Bram Poquette and Jose Nova for their contributions in formatting this report.

ii A Community Health Needs Assessment
A Community Health Needs Assessment for Saint Peter’s University Hospital & Robert Wood Johnson University Hospital: Findings from the Behavioral Risk Factor & Surveillance System (BRFSS), Hospital Discharge Data, A Community Survey, Key Informant Interviews, and Community Member Focus Groups Sujoy Chakravarty, Ph.D., Susan Brownlee, Ph.D., Jian Tong, M.S., Maria B. Pellerano, M.A., M.B.A., M.P.H., Jenna Howard, Ph.D., Eric K. Shaw, Ph.D., Sabrina Chase, Ph.D., and Benjamin F. Crabtree, Ph.D.
Executive Summary Under the 2010 Patient Protection and Affordable Care Act (ACA), non-profit hospitals must conduct a community health needs assessment and identify an implementation strategy to address those needs every three years. In order to comply with this requirement, St. Peter’s University Hospital and Robert Wood Johnson University Hospital teamed together under a grant from The Robert Wood Johnson Foundation’s New Jersey Health Initiatives Program. The hospitals engaged the Rutgers University Center for State Health Policy (CSHP) and the University of Medicine & Dentistry of New Jersey-Robert Wood Johnson Medical School (UMDNJ-RWJMS) Department of Family Medicine and Community Health, Research Division, to complete a series of multi-method analytic activities to inform the community health needs assessment and implementation strategy. As part of that work, CSHP conducted secondary data analyses of the 2010 Behavioral Risk Factor and Surveillance System (BRFSS) data and Uniform Billing hospital discharge data over the period 2008-2010 and interpreted findings from a community telephone survey. A separate qualitative part of the project was conducted by UMDNJ-RWJMS who reached out to broad constituencies via a series of key informant interviews and focus groups of community members. Findings converged in several key themes across all four data components. Chapter 1 of this report includes findings from an analysis of 2010 BRFSS data. CSHP analyzed data for counties included in the designated hospital service area (Middlesex, Somerset) as well as statewide comparative data. Health topics of interest were analyzed by key demographics (age, gender, race/ethnicity), income, and health insurance status.
iii Rutgers Center for State Health Policy/RWJMS Family Medicine & Community Health, Dec 2012
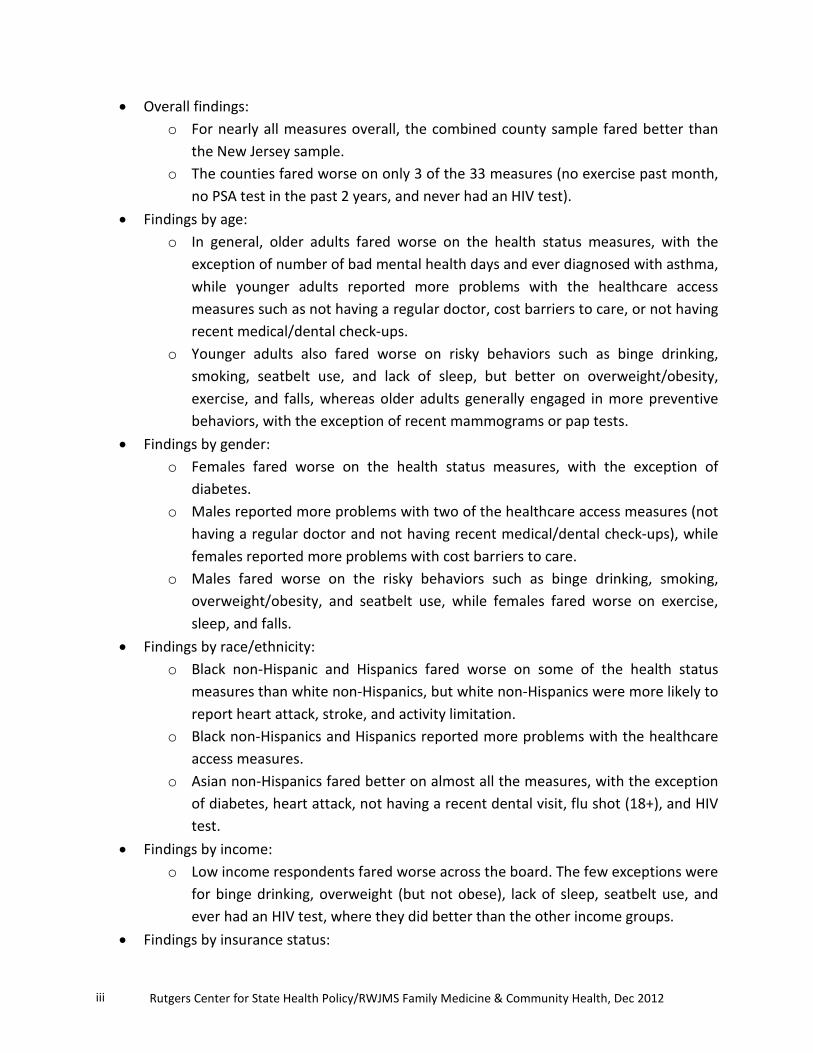
• Overall findings: o For nearly all measures overall, the combined county sample fared better than
the New Jersey sample. o The counties fared worse on only 3 of the 33 measures (no exercise past month,
no PSA test in the past 2 years, and never had an HIV test). • Findings by age:
o In general, older adults fared worse on the health status measures, with the exception of number of bad mental health days and ever diagnosed with asthma, while younger adults reported more problems with the healthcare access measures such as not having a regular doctor, cost barriers to care, or not having recent medical/dental check-ups.
o Younger adults also fared worse on risky behaviors such as binge drinking, smoking, seatbelt use, and lack of sleep, but better on overweight/obesity, exercise, and falls, whereas older adults generally engaged in more preventive behaviors, with the exception of recent mammograms or pap tests.
• Findings by gender: o Females fared worse on the health status measures, with the exception of
diabetes. o Males reported more problems with two of the healthcare access measures (not
having a regular doctor and not having recent medical/dental check-ups), while females reported more problems with cost barriers to care.
o Males fared worse on the risky behaviors such as binge drinking, smoking, overweight/obesity, and seatbelt use, while females fared worse on exercise, sleep, and falls.
• Findings by race/ethnicity: o Black non-Hispanic and Hispanics fared worse on some of the health status
measures than white non-Hispanics, but white non-Hispanics were more likely to report heart attack, stroke, and activity limitation.
o Black non-Hispanics and Hispanics reported more problems with the healthcare access measures.
o Asian non-Hispanics fared better on almost all the measures, with the exception of diabetes, heart attack, not having a recent dental visit, flu shot (18+), and HIV test.
• Findings by income: o Low income respondents fared worse across the board. The few exceptions were
for binge drinking, overweight (but not obese), lack of sleep, seatbelt use, and ever had an HIV test, where they did better than the other income groups.
• Findings by insurance status:

iv A Community Health Needs Assessment
o The uninsured fared worse across almost all measures. Exceptions were for heart attack, health problem requiring special equipment, smoking, overweight (but not obese), exercise, sleep, and HIV test, where they did better than the insured group.
Chapter 2 contains findings from secondary data analysis of New Jersey Uniform Billing hospital discharge data over the period 2008-2010. This data provides population-based rates of hospital inpatient and emergency department (ED) utilization that are useful for community health improvement strategies. Analyses focused on inpatient admissions for “ambulatory care sensitive” conditions that could be avoided by high quality primary care within the community and treat-and-release ED visits that could have been treated in a primary care setting or could have been prevented with adequate access to primary care within the community. Population-based rates of these indicators were examined within the designated hospital service area and compared to New Jersey overall, and by patient characteristics (e.g., health insurance payer, demographics). We also examined the demographic and health insurance distribution for patients who had avoidable visits. Key findings are outlined below.
• Population-based rates of avoidable hospitalizations and ED visits were lower for the combined service area of the hospitals compared to NJ overall, suggesting relatively higher adequacy of primary care.
• For the combined service area of the hospitals, the rate of avoidable inpatient hospitalizations and avoidable ED visits were 1.43 and 12.49 per 100 population. Both these rates were lower than the corresponding rates for NJ overall- 1.73 and 14.62 per 100 population.
• Examining the health insurance information for patients who had avoidable hospitalizations and ED visits, we found the following:
o Within the service area, the majority (62.3%) of avoidable hospitalizations was Medicare-paid and more than a quarter (25.9%) was paid for by private insurance.
o In contrast to avoidable hospitalizations, for avoidable ED visits the majority of the visits within the hospital service area were paid by private insurance (53.3%). Next to private pay, visits from self-pay/uninsured patients comprised the highest percentage of avoidable ED visits (22.2%).
• We also examined percentage of avoidable hospitalizations out of all hospitalizations categorized by patient health insurance and demographics. We similarly examined avoidable ED visits. These patterns help identify patient and payer characteristics with the highest risk of these hospitalizations. Our results indicated:
v Rutgers Center for State Health Policy/RWJMS Family Medicine & Community Health, Dec 2012
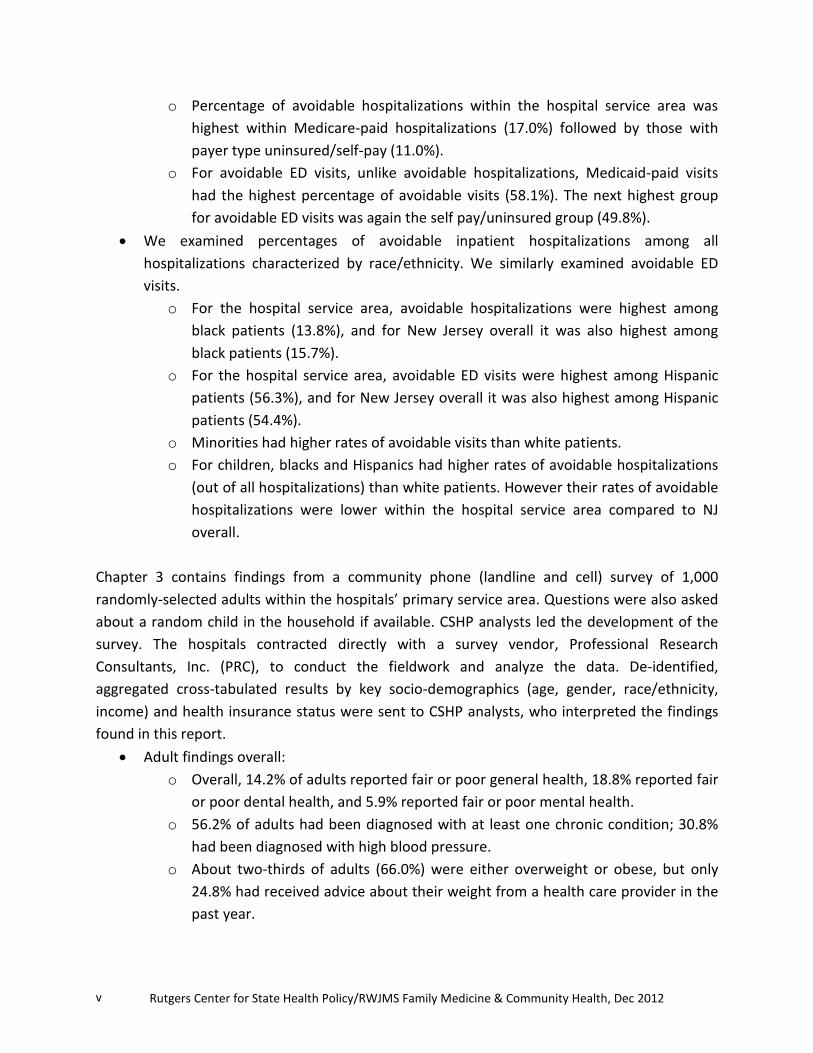
o Percentage of avoidable hospitalizations within the hospital service area was highest within Medicare-paid hospitalizations (17.0%) followed by those with payer type uninsured/self-pay (11.0%).
o For avoidable ED visits, unlike avoidable hospitalizations, Medicaid-paid visits had the highest percentage of avoidable visits (58.1%). The next highest group for avoidable ED visits was again the self pay/uninsured group (49.8%).
• We examined percentages of avoidable inpatient hospitalizations among all hospitalizations characterized by race/ethnicity. We similarly examined avoidable ED visits.
o For the hospital service area, avoidable hospitalizations were highest among black patients (13.8%), and for New Jersey overall it was also highest among black patients (15.7%).
o For the hospital service area, avoidable ED visits were highest among Hispanic patients (56.3%), and for New Jersey overall it was also highest among Hispanic patients (54.4%).
o Minorities had higher rates of avoidable visits than white patients. o For children, blacks and Hispanics had higher rates of avoidable hospitalizations
(out of all hospitalizations) than white patients. However their rates of avoidable hospitalizations were lower within the hospital service area compared to NJ overall.
Chapter 3 contains findings from a community phone (landline and cell) survey of 1,000 randomly-selected adults within the hospitals’ primary service area. Questions were also asked about a random child in the household if available. CSHP analysts led the development of the survey. The hospitals contracted directly with a survey vendor, Professional Research Consultants, Inc. (PRC), to conduct the fieldwork and analyze the data. De-identified, aggregated cross-tabulated results by key socio-demographics (age, gender, race/ethnicity, income) and health insurance status were sent to CSHP analysts, who interpreted the findings found in this report.
• Adult findings overall: o Overall, 14.2% of adults reported fair or poor general health, 18.8% reported fair
or poor dental health, and 5.9% reported fair or poor mental health. o 56.2% of adults had been diagnosed with at least one chronic condition; 30.8%
had been diagnosed with high blood pressure. o About two-thirds of adults (66.0%) were either overweight or obese, but only
24.8% had received advice about their weight from a health care provider in the past year.

vi A Community Health Needs Assessment
o 20.1% of adults had visited the ED in the past year and about a third of those had visited the ED more than once. The majority (81.2%) spent less than 30 minutes in the ED before being seen by a health care provider.
o 80.5% had a physical check-up and 71.7% had a dental check-up in the past year. o About a fourth (27.0%) reported at least one major barrier to wanted care. o Over half (52.9%) reported at least one problem with navigating the health care
system; inconvenient doctor’s hours and having to wait too long to get an appointment were cited most often.
o Prescription medication use was high, with 60.6% of adults taking at least one prescription medicine in the past month and even higher rates among older adults, females, white non-Hispanics, middle-income respondents, and those publicly insured.
• Adults findings by age: o Younger adults reported more problems with health care access and utilization
measures than older adults, but older adults fared worse on the health status measures.
o Younger adults were more likely than older adults to have at least one ED visit, less likely to have either a physical or dental check-up, less likely to have a usual source or care, and more likely to have a long wait in the waiting room when visiting their regular doctor.
• Adult findings by gender: o Males fared worse on health care utilization-related measures and risky health
attitudes and behaviors, while females reported more problems with access. o Females were more likely to be diagnosed with any other chronic condition, to
be obese, and to not get wanted medical care or prescriptions. • Adult findings by race/ethnicity:
o Hispanics and Asian non-Hispanics both had significant access concerns. However, for Asians, most of their concerns deal with issues related to navigating the health care system such as problems with transportation, parking, and convenience of provider hours, while Hispanics were much more likely to report basic access problems such as not getting wanted care, not having a usual source of care, and not getting check-ups.
o Asians fared better on most health status and utilization measures. There are two exceptions: Asians were more likely to have ever been diagnosed with diabetes and less likely to get dental check-ups.
o Blacks were more likely to be uninsured, to have ever been diagnosed with high blood pressure, to be obese, to use the ED as their regular source of care, to not get wanted medical or dental care, and to report being treated worse due to

vii Rutgers Center for State Health Policy/RWJMS Family Medicine & Community Health, Dec 2012
race when seeking medical care. Blacks were less likely to have a dental check-up or dental insurance.
o White non-Hispanics were more likely to have ever been diagnosed with high blood pressure or other chronic condition.
• Adult findings by income: o Both low and middle income respondents fared worse on many measures.
Both groups were less likely to have health or dental insurance or to have had a physical or dental check-up.
Both groups were also more likely to report barriers to needed dental or mental health care or hassles when seeking medical care.
o But there were also some differences between the two lower income groups. The middle income group fared worse on the health status measures and
were more likely to have ever been diagnosed with diabetes or high blood pressure; however, low income respondents were more likely to have been diagnosed with asthma.
Middle income respondents were more likely to be overweight, while low income respondents were more likely to be obese.
Low income respondents were more likely to have at least one ED visit and less likely to have a usual source of care.
• Adult findings by insurance status: o Across nearly all measures, the uninsured fared worse than any other sub-group. o The uninsured had poorer dental health status although they were not
significantly different from the publicly or privately insured for overall health status and mental health status. The uninsured did not report higher diagnosis rates for any of the chronic conditions.
o The uninsured fared worse on most health care utilization measures and access measures (both general and specific).
• Child findings overall: o Over 15% of the children overall had ever been diagnosed with asthma, so this
remains a concern. o Nearly one in five children had at least one ED visit in the past year, and this was
even more likely in several sub-groups of children. o Taking at least one prescription medication in the past month was reported for
nearly one in three children, and was even higher among white non-Hispanic children (44.9%) and children in high-income households (41.9%).
• Child findings by age: o Younger children were less likely than older children to get a dental check-up
and less likely to visit a private dentist’s office for regular dental care.

viii A Community Health Needs Assessment
o Older children were more likely to have ever been diagnosed with asthma or any chronic condition, and were more likely to have sought mental health care.
• Child findings by gender: o Boys were more likely than girls to have had at least one ED visit in the past 12
months and were less likely to visit a private dentist’s office for regular dental care.
• Child findings by race-ethnicity, income, and insurance status: o The number of black non-Hispanic children, Asian non-Hispanic children, children
of other race, low income children, and uninsured children was too low to report results for these sub-groups as they would not be statistically reliable.
Chapter 4 contains findings from a series of in-depth key informant interviews and focus groups with hospital consumers that were conducted to ascertain health needs of a broad array of populations within the hospitals’ catchment area. Findings shown here reflect the opinions and perceptions of both stakeholders and consumers.
• The hospitals’ catchment area has a high concentration of health care resources in New Brunswick, but the distribution of these resources throughout the catchment area is uneven.
o This creates severe access barriers for residents in the outer reaches of the catchment area because public transportation into New Brunswick from many areas is poor.
o In addition, uninsured residents do not benefit from the resource-rich health care environment that New Brunswick, in particular, offers.
o Improved coordination of existing health care resources would help to optimize the utility of these services.
• Because the plethora of needs assessments over the years have not been sufficiently coordinated, there has been duplication of effort and consequently less effectiveness and efficiency.
o It is suggested that the conclusions of the current assessment and the responding interventions be widely publicized throughout the catchment area.
• There are some resources that are inadequate or altogether lacking, even in “resource rich” New Brunswick: resources for dental care, addiction treatment, long-term mental health care, and sources of affordable medication.
o This resource gap results in patients postponing or neglecting medical care, overusing the EDs, and the maintenance of an active black market for prescription medications.

ix Rutgers Center for State Health Policy/RWJMS Family Medicine & Community Health, Dec 2012
• The most prevalent health issues in the represented communities are obesity, mental health issues, and diabetes. All three are complex problems, and socio-economic and cultural issues have bearing on them all.
o The concerns around obesity include its related sequelae of hypertension, heart disease, and diabetes, with particular concern around the many social conditions that contribute to obesity in adults and children.
o Mental health issues are broad in scope but depression and anxiety are most prevalent and are often untreated.
o Diabetes is problematic in all communities but with noted concentrations in the Latino, African American, and South Asian communities. Assuring access to low cost diabetes management supplies is a serious concern for the health of these communities.
• The hospitals’ catchment area is extremely diverse in terms of cultures and languages. This creates particular challenges in navigating the health care system and the hospitals, in particular.
o Most problematic is the communication barrier between non-English speaking patients and their doctors.
o The current signage in the hospitals is not discernable to those who are unable to read English.
• The perceived “antagonistic” relationship between the two hospitals also stands as a barrier to coordinated services in their mutual catchment area.
o Improved communication and coordination between the hospitals may thus serve to advance community health.
• Other areas for hospital improvement include enhanced customer service training for all hospital personnel (particularly around cultural competency), patient advocates, and personnel to help families navigate post-hospitalization care.
• Patient perceptions of the hospitals can be deeply influenced by a single negative experience. These perceptions can endure even decades after the defining experience and can play an important role in shaping patient decisions.
In summary, common themes were evident across all four efforts, both quantitative (BRFSS data, hospital discharge data, community phone survey) and qualitative (key informant interviews, consumer focus groups) methods:
• The uninsured fared poorly in the BRFSS data, the hospital discharge records, and the community survey, and many key informants and focus groups participants highlighted the health care challenges this group faces.
• Low income respondents also had poor health care access in both the BRFSS data and the community survey.

x A Community Health Needs Assessment
• Hispanics, particularly the undocumented, face many access challenges as seen in all four components.
• Navigation of the health care system was highlighted as problematic across several sub-groups (i.e., Asian non-Hispanics, non-English speakers, the undocumented, and the uninsured) in the community survey and qualitative components.
• Problems with dental health and access to dental care were evident in the BRFSS data, community survey, and qualitative components.
• Access to mental health care and mental health problems were highlighted in the BRFSS data, community survey, and qualitative components.
• Asthma, diabetes, and obesity remain as major health concerns across many sub-groups, and this was seen in the BRFSS data, community survey, and qualitative components.
• Emergency department use is high among vulnerable groups (seen in all four components).
On a positive note, most health and access-based indicators in the hospitals’ primary service area were consistently better than benchmark rates for the state of New Jersey overall (found in the BRFSS data and hospital discharge records). However, disparities for the uninsured and low income respondents still remain and are quite large and this is seen in all four components of the study. Some racial-ethnic disparities also remain, although not consistently across all measures. Finally, changing demographics have brought new health challenges, particularly with language barriers and other health care system navigation issues among growing Asian sub-groups and the undocumented.


1 A Community Health Needs Assessment
A Community Health Needs Assessment for Saint Peter’s University Hospital & Robert Wood Johnson University Hospital: Findings from the Behavioral Risk Factor & Surveillance System (BRFSS), Hospital Discharge Data, A Community Survey, Key Informant Interviews, and Community Member Focus Groups Sujoy Chakravarty, Ph.D., Susan Brownlee, Ph.D., Jian Tong, M.S., Maria B. Pellerano, M.A., M.B.A., M.P.H., Jenna Howard, Ph.D., Eric K. Shaw, Ph.D., Sabrina Chase, Ph.D., and Benjamin F. Crabtree, Ph.D.
Introduction Section 9007 (“Additional Requirements for Charitable Hospitals”) of the 2010 Patient Protection and Affordable Care Act (ACA) legislates that non-profit hospitals must complete a community health needs assessment and identify an implementation strategy to address those needs every three years. In order to comply with this requirement, Saint Peter’s University Hospital (SPUH) and Robert Wood Johnson University Hospital (RWJUH) teamed together to conduct a joint community health needs assessment for their primary patient service area (all of Middlesex County and two towns in Somerset County, Somerset and Franklin Park). This effort was funded via a grant, Hospitals Collaborating to Assess and Address Changing Community Health Needs, from The Robert Wood Johnson Foundation’s New Jersey Health Initiatives Program. The hospitals engaged the Rutgers University Center for State Health Policy (CSHP) and the University of Medicine and Dentistry of New Jersey-Robert Wood Johnson Medical School (UMDNJ-RWJMS) Department of Family Medicine and Community Health, Research Division, to complete a series of multi-method analytic activities to inform the community health needs assessment and implementation strategy. As part of that work, CSHP conducted secondary data analyses of the 2010 Behavioral Risk Factor and Surveillance Analysis (BRFSS) data and Uniform Billing (UB) hospital discharge data over the period 2008-2010 and also summarized and interpreted findings from a community telephone survey. The ACA also requires that the community health needs assessment should include “input from persons who represent the broad interests of the community served by the hospital facility, including those with special

2 Rutgers Center for State Health Policy/RWJMS Family Medicine & Community Health, Dec 2012
knowledge of or expertise in public health” (U.S. Congress. 2010. “The Patient Protection and Affordable Care Act, Public Law 111–148.” U.S. Government Printing Office). This was addressed by the qualitative part of the project that was conducted by UMDNJ-RWJMS who reached out to broad constituencies via a series of both key informant interviews and focus groups of hospital consumers. The Institutional Review Boards of Rutgers University, UMDNJ-RWJMS, and SPUH approved this study. Findings from all four of these research efforts are compiled in this report. A brief description of each data source is provided below. Chapter 1: Health Indicators and Risky/Preventive Behaviors: An Analysis of 2010 Behavioral Risk Factor Surveillance System (BRFSS) (analyzed by CSHP). This Centers for Disease Control and Prevention-sponsored survey is conducted annually by the NJ Department of Health and Senior Services. The BRFSS supports analysis of a representative sample of NJ adults and is capable of generating county-level estimates. CSHP analyzed BRFSS data for counties included in the designated service area (Middlesex, Somerset) as well as statewide comparative data. Health topics of interest such as health status, health care access and utilization, risky and preventive behaviors, etc., were analyzed by key demographics (age, gender, race/ethnicity, income, and health insurance status). Chapter 2: Avoidable Hospitalizations and Emergency Department Visits: An Analysis of Hospital Discharge Data (analyzed by CSHP). New Jersey UB data supports examination of ambulatory care sensitive hospital inpatient and emergency department (ED) utilization that reflects inadequacy of primary care within the community. Population-based rates of these indicators were examined along with patient demographic and health insurance payer characteristics. Chapter 3: Health, Health Care Utilization, and Access: An Interpretation of 2012 Community Phone Survey (conducted and analyzed by PRC; survey design and interpretation of findings by CSHP). CSHP analysts led the development of the survey with input from hospital staff and project Steering Committee members. The hospitals contracted directly with a survey vendor, Professional Research Consultants, Inc. (PRC), to conduct the fieldwork and analyze the data. Landline and cell phone interviews were conducted using random-digit-dialing for 1,000 randomly-selected adults within the hospitals’ primary service area. For households with children, questions were also asked about a random child in the household. De-identified, aggregated cross-tabulated tables of responses by key socio-demographics (age, gender, race/ethnicity, income) and health insurance status) were sent to CSHP analysts, who interpreted the findings found in this report. Survey topics covered a broad range of issues including community health concerns, health status, health care access and utilization, health insurance coverage, and others.

3 A Community Health Needs Assessment
Chapter 4: Community Input: 2012 Key Informant Interviews and Consumer Focus Groups (conducted and analyzed by UMDNJ-RWJMS). In-depth interviews were conducted with 26 key informants in the community who had particular knowledge about a topic or setting such as safety net personnel, staff members from community based organizations (CBO), or other experts focused on specific sub-populations or on specific health issues. To enable more public feedback, eight focus groups were conducted with health care consumers in four languages (four in English, two in Spanish, one in Hindi, and one in both Hindi and Gujarati) across the service area (New Brunswick, Perth Amboy, Woodbridge, Spotswood, Somerset, Iselin, and South Brunswick). Chapter 5: Discussion. This chapter summarizes key findings from each of the above chapters, notes common themes across one or more data sources, identifies potential limitations, and discusses the strengths of the project. Supplement: Summary of New Jersey Childhood Obesity Study Findings for New Brunswick, NJ. This contains a brief summary of findings for New Brunswick, NJ, from the 2008-2010 New Jersey Childhood Obesity Study. These past findings are included in this report as they may be relevant to the hospitals’ community health needs assessment. The study was funded by The Robert Wood Johnson Foundation and conducted by CSHP in five New Jersey cities (Camden, Newark, New Brunswick, Trenton, and Vineland). There were four parts to the study: a telephone survey of families with children, public school BMI data, geo-coded maps of the food environment (healthy food outlet, fast food restaurant, etc.), and geo-coded maps of the physical activity environment (exercise facilities, parks, etc.).

4 Rutgers Center for State Health Policy/RWJMS Family Medicine & Community Health, Dec 2012
Chapter 1: Health Indicators and Risky/Preventive Behaviors: An Analysis of 2010 Behavioral Risk Factor Surveillance System (BRFSS)
Introduction This chapter presents findings using data from the 2010 Behavioral Risk Factor Surveillance System (BRFSS) for Middlesex County and Somerset County in New Jersey. The BRFSS is an annual health survey conducted in all 50 states, the District of Columbia, and three territories. It is overseen by the CDC and administered by the individual states. The BRFSS was established in 1984 in a number of states, and New Jersey began data collection in 1991. It is a random-digit-dial telephone survey of non-institutionalized adults ages 18 and over and provides timely data on a number of health-related measures including health status, risk behaviors, preventive behaviors, and health care utilization. Detailed information on the BRFSS can be found at http://www.cdc.gov/brfss/index.htm. The 2010 questionnaire can be found at http://www.cdc.gov/brfss/questionnaires/pdf-ques/2010brfss.pdf. This document contains the core questionnaire plus all the add-on modules that various individual states have contributed. However, many of these items were not analyzed for this report as New Jersey’s version of the 2010 BRFSS contained mainly the core questionnaire items. The 2010 data is the most recent data available at the time of this report.
Methods The findings presented here include data from 619 adults in Middlesex County and 527 adults in Somerset County. Due to cell size limitations in the unweighted data among several racial/ethnic groups and the uninsured (see yellow highlighted cells in Table 1.1), data for the two counties were combined and then analyzed by age, gender, race/ethnicity, income, and non-elderly health insurance coverage groups. In addition, comparisons are provided to data for the state of New Jersey overall. All results shown (with the exception of Table 1.1) use data weighted to population demographics for age, race, and gender for these regions and likelihood of selection based on number of adults and telephones in the household.

5 A Community Health Needs Assessment
Nearly all of the survey questions had item non-response below 5%. For these variables, missing values are excluded from the analysis. For income, a separate “don’t know/refused” category is included as about 15% of the respondents did not provide their income (see green highlighted cell in Table 1.1). Estimates are not shown in the tables if the denominator for the cross-tabulation is less than 50 as the estimate would not be reliable. This primarily impacts all the cross-tabulations by race-ethnicity for the “other non-Hispanic” group, and some of the preventive behavior cross-tabulations which have age or gender restrictions (e.g., mammograms for women ages 50+).
Findings Table 1.2 contains the weighted frequencies for the same five measures used in the cross-tabulations. These are shown for each county separately in order to understand how the counties differ. They are also shown for the combined counties and for New Jersey. Frequencies for the health measures and other demographics are listed in Table 1.3. These are shown for the combined counties and for New Jersey. The cross-tabulations of the health measures by age, gender, race/ethnicity, income, and health insurance coverage are shown in Tables 1.4-1.13, and are provided for the combined counties and New Jersey.
Description of Crosstab Groups (Age, Gender, Race-Ethnicity, Income, Health Insurance Coverage) As shown in Table 1.2 and Figure 1.1 for the combined county sample, 14.3% of the respondents are older adults. The Somerset County group has more older adults than the Middlesex County group (15.8% vs. 13.6%), but both counties have fewer older adults than the state of New Jersey overall (18.0%). For gender, Somerset County is similar to New Jersey overall, with slightly more females than males, while Middlesex County has slightly more males than females.

6 Rutgers Center for State Health Policy/RWJMS Family Medicine & Community Health, Dec 2012
Middlesex County is more diverse than Somerset County and New Jersey overall for race-ethnicity. In Middlesex County, 47.7% are white non-Hispanic, followed by 18.7% Asian non-Hispanic, 17.2% Hispanic, 12.3% black non-Hispanic, and 4.1% other non-Hispanic. Somerset County has a larger white non-Hispanic population and a smaller black non-Hispanic population (58.3% and 8.2% respectively), while New Jersey overall has a larger white non-Hispanic population and a smaller Asian non-Hispanic population (62.1% and 7.6% respectively). Both counties have fewer people with low incomes than New Jersey overall, and Somerset County has higher incomes than Middlesex County. It should be noted that the BRFSS does not look at more detailed higher income ranges so the data shown here is for low and middle income versus all others. Similarly, both counties have fewer uninsured non-elderly adults than the state of New Jersey overall, and Somerset County has less uninsured than Middlesex County.
0 20 40 60 80 100
Uninsured 18-64 Insured 18-64
$50k+ $25k to <$50k
<$25k
Asian non-Hispanic Hispanic
Black non-Hispanic White non-Hispanic
Females Males
Ages 65+ Ages 18-64
Percent
M + S NJ
Figure 1.1: Individual Characteristics Adults Ages 18+, Middlesex + Somerset Counties (M+S) and Total New Jersey (NJ)
Source: Data from 2010 BRFSS; tabulations by Rutgers Center for State Health Policy.

7 A Community Health Needs Assessment
Health Status Three measures of health status were examined: overall health status, number of days in the past 30 days that physical health was not good, and number of days in the past 30 days that mental health was not good (see Table 1.4). For overall health status (also shown in Figure 1.2), respondents were asked “Would you say that in general your health is excellent, very good, good, fair or poor?”. This is a widely-used measure that is a reliable predictor of morbidity and mortality.
• Overall, the combined county sample was slightly less likely to report fair or poor health than the full New Jersey sample (12.1% vs. 14.7% respectively).
• Not surprisingly, older adults were about twice as likely to report fair or poor health compared to adults ages 18-64.
• Women were slightly more likely to report fair or poor health than men, and both men and women were slightly less likely to report fair or poor health in the combined county sample than in the state.
0 5 10 15 20 25 30 35
Uninsured 18-64 Insured 18-64
$50k+ $25k to <$50k
<$25k
Asian non-Hispanic Hispanic
Black non-Hispanic White non-Hispanic
Females Males
Ages 65+ Ages 18-64
Total
Percent Reporting Fair or Poor Health
M + S NJ
Figure 1.2: Percent Reporting Fair or Poor Self-assessed Overall Health Status Adults Ages 18+, Middlesex + Somerset Counties (M+S) and Total New Jersey (NJ)
Source: Data from 2010 BRFSS; tabulations by Rutgers Center for State Health Policy.

8 Rutgers Center for State Health Policy/RWJMS Family Medicine & Community Health, Dec 2012
• Most of the racial-ethnic groups were similar when comparing the combined county sample to the state, with the exception of black non-Hispanics: in the county sample, only 7.8% of black non-Hispanics reported fair or poor health while 20.9% reported fair or poor health in the state overall. In both the county and state samples, Hispanics were the most likely to report fair or poor health and Asian non-Hispanics were the least likely.
• Those with lower incomes and the uninsured were more likely to report fair or poor health, and these rates were lower in the combined county sample than in the state overall.
Respondents were then asked “Now thinking about your physical health, which includes physical illness and injury, for how many days during the past 30 days was your physical health not good?”.
• About 18% reported 4 or more days that their physical health was not good, and for most of the crosstab groups, the rates were similar for the combined county sample versus the state sample.
• The patterns across the crosstab groups were similar to those for the overall health status question, with older adults (25.8%), females (22.2%), Hispanics (22.3%), those with low incomes (27.9%), and the uninsured (25.0%) more likely to report 4 or more days in the past 30 days that their physical health was not good, and Asian non-Hispanics less likely (8.2%).
• However, the lower rate of overall health status reported by black non-Hispanics in the combined county sample was not repeated for number of days physical health not good, with black non-Hispanics reporting similar rates as white non-Hispanics.
A parallel question for mental health was then asked: “Now thinking about your mental health, which includes stress, depression, and problems with emotions, for how many days during the past 30 days was your mental health not good?”.
• Although the overall rate of reported poor mental health days was similar to reported poor physical health days, the patterns across the crosstab groups for this measure differed somewhat from both of the two physical health measures.
• Specifically, older adults were less likely to report 4 or more days of poor mental health, and the gender and racial-ethnic differences were more pronounced for poor mental health.

9 A Community Health Needs Assessment
Chronic Conditions and Disability Each of four chronic conditions (asthma, diabetes, heart attack, stroke) were assessed using the following question: “Have you ever been told by a doctor, nurse, or other health professional that you had …?”. In addition, two measures of disability were asked: “Are you limited in any way in any activities because of physical, mental, or emotional problems?” and “Do you now have any health problem that requires you to use special equipment, such as a cane, a wheelchair, a special bed, or a special telephone? (Include occasional use or use in certain circumstances.)” (see Table 1.5, 2 pages). Overall, 11.7% of the combined county sample reported ever being diagnosed with asthma compared to 13.3% of the New Jersey sample (also shown in Figure 1.3).
• In the combined county sample, younger adults had a higher rate of asthma diagnosis than older adults.
• Females were over twice as likely as males to have been diagnosed with asthma.
0 5 10 15 20 25
Uninsured 18-64 Insured 18-64
$50k+ $25k to <$50k
<$25k
Asian non-Hispanic Hispanic
Black non-Hispanic White non-Hispanic
Females Males
Ages 65+ Ages 18-64
Total
Percent Ever Diagnosed with Asthma
M + S NJ
Figure 1.3: Percent Ever Diagnosed with Asthma Adults Ages 18+, Middlesex + Somerset Counties (M+S) and Total New Jersey (NJ)
Source: Data from 2010 BRFSS; tabulations by Rutgers Center for State Health Policy.

10 Rutgers Center for State Health Policy/RWJMS Family Medicine & Community Health, Dec 2012
• Black non-Hispanics were the most likely to report an asthma diagnosis and Asian non-Hispanics were the least likely.
• Low income respondents were more than twice as likely as high income respondents to have been diagnosed with asthma.
• The uninsured were also almost twice as likely as the insured to have had an asthma diagnosis.
• The state sample, although similar in direction, had much lower differences among the groups. In particular, black non-Hispanics, those with low incomes, and the uninsured in the combined county sample were more likely to have had an asthma diagnosis than in the state sample, while Hispanics and males in the combined county sample were less likely to report an asthma diagnosis than in the state sample.
For diabetes, 7.6% in the combined county sample reported a diagnosis compared to 9.2% in the state sample (also shown in Figure 1.4).
• In the combined county sample, older adults and males were more likely to have been diagnosed with diabetes, as were Asian non-Hispanics.
0 5 10 15 20 25
Uninsured 18-64 Insured 18-64
$50k+ $25k to <$50k
<$25k
Asian non-Hispanic Hispanic
Black non-Hispanic White non-Hispanic
Females Males
Ages 65+ Ages 18-64
Total
Percent Ever Diagnosed with Diabetes
M + S NJ
Figure 1.4: Percent Ever Diagnosed with Diabetes Adults Ages 18+, Middlesex + Somerset Counties (M+S) and Total New Jersey (NJ)
Source: Data from 2010 BRFSS; tabulations by Rutgers Center for State Health Policy.

11 A Community Health Needs Assessment
• Low income respondents were much more likely to report a diagnosis, but the uninsured were only slightly more likely to report having been diagnosed with diabetes.
• Compared to the state sample, older adults and black non-Hispanics in the combined county sample were about half as likely to report a diabetes diagnosis, but Asian non-Hispanics were about 1.5 times more likely to have been diagnosed.
The incidence of heart attack diagnosis was 2.6% in the combined county sample and 3.8% in the state.
• For the counties, older adults and women were more likely to report a heart attack, as were white non-Hispanics and Hispanics.
• Low income respondents were also more likely to have been diagnosed with a heart attack, but the uninsured were only about half as likely as the insured to report a heart attack.
• In the state sample, the pattern reversed for males, black non-Hispanics, and Hispanics: more males and black non-Hispanics reported a heart attack in the state sample, but the rate for Hispanics was lower.
Although the incidence overall was low, stroke diagnoses in the combined county sample were half that of the state (1.2% vs. 2.4%).
• In the counties, older adults and females were much more likely to have had a stroke, as were white non-Hispanics.
• Low and middle income respondents also were more likely to report a stroke diagnosis, but there was little difference between the insured and the uninsured.
• Compared to the state, males and black non-Hispanics in the combined county sample were much less likely to report a stroke.
For the activity limitation question, 15.5% in the county sample reported a limitation compared to 16.9% in the state (also shown in Figure 1.5).
• For the counties, older adults were about twice as likely as younger adults and females about 1.5 times as likely as males to have an activity limitation.
• White non-Hispanics and low income respondents were about 2-3 times more likely to report a limitation compared to the other groups, while the uninsured were only slightly more likely.
• These same patterns held in the state sample with the exception of black non-Hispanics, who reported higher rates in the state (comparable to the white non-Hispanic group).

12 Rutgers Center for State Health Policy/RWJMS Family Medicine & Community Health, Dec 2012
For use of special equipment due to a health problem, 4.9% of respondents in the combined county sample and 6.6% in the state sample indicated that they used such equipment.
• In the county sample, older adults were much more likely to use special equipment, as were females.
• Black non-Hispanics had the highest incidence of special equipment use and Asian non-Hispanics the lowest.
• Low income respondents were much more likely to require special equipment, but the uninsured were much less likely.
• These patterns were similar in the state sample across all groups except for males and the uninsured, who were more likely in the state sample to need special equipment (although still lower than females and the insured).
0 5 10 15 20 25 30
Uninsured 18-64 Insured 18-64
$50k+ $25k to <$50k
<$25k
Asian non-Hispanic Hispanic
Black non-Hispanic White non-Hispanic
Females Males
Ages 65+ Ages 18-64
Total
Percent with an Activity Limitation
M + S NJ
Figure 1.5: Percent with an Activity Limitation Adults Ages 18+, Middlesex + Somerset Counties (M+S) and Total New Jersey (NJ)
Source: Data from 2010 BRFSS; tabulations by Rutgers Center for State Health Policy.

13 A Community Health Needs Assessment
Medical Utilization and Access Three questions were used to measure utilization and access (see Table 1.6). Respondents were asked if they had a “personal doctor or health care provider”. They were then asked if they had any problem accessing care (“Was there a time in the past 12 months when you needed to see a doctor but could not because of cost?”). The third item asked when they had last had a routine check-up. In the combined county sample, 10.7% of the respondents did not have a personal doctor or health care provider, compared to 13.8% of the state sample (also shown in Figure 1.6).
• In the county sample, younger adults were nearly 6 times more likely than older adults to not have a regular doctor.
• Males and females reported similar rates. • Hispanics were much more likely to not have a regular doctor, while black non-Hispanics
were less likely.
0 10 20 30 40 50 60
Uninsured 18-64 Insured 18-64
$50k+ $25k to <$50k
<$25k
Asian non-Hispanic Hispanic
Black non-Hispanic White non-Hispanic
Females Males
Ages 65+ Ages 18-64
Total
Percent Without a Regular Doctor
M + S NJ
Figure 1.6: Percent Without a Regular Doctor Adults Ages 18+, Middlesex + Somerset Counties (M+S) and Total New Jersey (NJ)
Source: Data from 2010 BRFSS; tabulations by Rutgers Center for State Health Policy.

14 Rutgers Center for State Health Policy/RWJMS Family Medicine & Community Health, Dec 2012
• Low income respondents and the uninsured were also much more likely to not have a regular doctor.
• These patterns held in the state sample except that males, black and Asian non-Hispanics, and the uninsured in the state were much more likely to not have a regular doctor compared to the counties.
Cost barriers in not accessing health care in the past year were reported by 12.8% in the combined county sample and 13.1% in the state sample (also shown in Figure 1.7).
• In the counties, older adults and females were much more likely to report a cost barrier. • Black non-Hispanics were about 3 times as likely and Hispanics about twice as likely as
white non-Hispanics and Asian non-Hispanics to report a barrier. • Low income respondents had barrier rates 2.5 to 4.5 times higher than the other income
groups, and the uninsured were about 4.5 times more likely to report a barrier. • These patterns were quite similar in the state, although barrier rates for black non-
Hispanics and low income respondents were lower in the state compared to the counties, but somewhat higher for Hispanics.
0 10 20 30 40 50
Uninsured 18-64 Insured 18-64
$50k+ $25k to <$50k
<$25k
Asian non-Hispanic Hispanic
Black non-Hispanic White non-Hispanic
Females Males
Ages 65+ Ages 18-64
Total
Percent Who Could Not See a Doctor Due to Cost in Past Year
M + S NJ
Figure 1.7: Percent Who Could Not See a Doctor due to Cost in Past Year Adults Ages 18+, Middlesex + Somerset Counties (M+S) and Total New Jersey (NJ)
Source: Data from 2010 BRFSS; tabulations by Rutgers Center for State Health Policy.

15 A Community Health Needs Assessment
In the combined county sample, 10.3% of the respondents had not had a routine check-up in the past 2 years. This rate was nearly identical in the state (10.5%).
• In the counties, younger adults were much more likely than older adults and males were somewhat more likely than females to go without a check-up within the past 2 years.
• Black non-Hispanics were somewhat more likely and Hispanics somewhat less likely to forego a check-up.
• The rates differed much more greatly for the income and coverage groups, with low income respondents about twice as likely and the uninsured over 5 times more likely to not have had a check-up within 2 years.
• These patterns were again quite similar in the state, although black non-Hispanics, low income respondents, and the uninsured were less likely and Hispanics more likely to forego a check-up in the state compared to the counties.
Dental Utilization Two measures assessed dental utilization (see Table 1.7). Last visit to a dentist was measured with the item “How long has it been since you last visited a dentist or a dental clinic for any reason? Include visits to dental specialists, such as orthodontists.” and number of permanent teeth extracted due to decay was measured with the item “How many of your permanent teeth have been removed because of tooth decay or gum disease? Include teeth lost to infection, but do not include teeth lost for other reasons, such as injury or orthodontics. (If wisdom teeth are removed because of tooth decay or gum disease, they should be included in the count for lost teeth)”. Responses were grouped into “dental visit in past year” or not, and 0 versus 1+ teeth extracted. In the combined county sample, 20.6% had not visited a dentist for any reason within the previous year compared to 24.0% in the state sample (also shown in Figure 1.8).
• For the counties, younger adults and males were more likely to have foregone a dental visit in the past year.
• Asian non-Hispanics were most likely to have not seen a dentist in the past year and white non-Hispanics were least likely.
• About a third of low and middle income respondents had not seen a dentist in the previous year, and over 40% of the uninsured had not.
• In the state sample, older adults, black non-Hispanics, and Hispanics were more likely to have not seen a dentist in the past year, but patterns for the income and coverage groups were similar to the counties.

16 Rutgers Center for State Health Policy/RWJMS Family Medicine & Community Health, Dec 2012
For teeth extraction, 41.9% of the combined county sample reported at least one permanent tooth removed due to decay compared to 46.5% of the state sample.
• In the combined county sample, older adults, black non-Hispanics, and low income respondents were much more likely to have had permanent teeth extracted due to decay, while Asian non-Hispanics were least likely to have had teeth extractions.
• The patterns for all the groups were quite similar (though somewhat higher) in the state sample, with the exception of the uninsured who reported a higher prevalence of teeth extractions compared to the counties.
0 10 20 30 40 50
Uninsured 18-64 Insured 18-64
$50k+ $25k to <$50k
<$25k
Asian non-Hispanic Hispanic
Black non-Hispanic White non-Hispanic
Females Males
Ages 65+ Ages 18-64
Total
Percent Who Did Not See a Dentist in Past Year
M + S NJ
Figure 1.8: Percent Who Did Not See a Dentist in Past Year Adults Ages 18+, Middlesex + Somerset Counties (M+S) and Total New Jersey (NJ)
Source: Data from 2010 BRFSS; tabulations by Rutgers Center for State Health Policy.
17 A Community Health Needs Assessment
Risk Behaviors (including BMI) Seven risk behaviors were analyzed in this section, including alcohol and tobacco use, overweight and obesity, lack of exercise, lack of sleep, falls, and seatbelt use (see Tables 1.8-1.10). For alcohol use, binge drinking was assessed. This is a standard alcohol use risk behavior measure that indicates whether males had had 5 or more drinks and females 4 or more drinks on one occasion at least once in the past 30 days. Tobacco use was assessed using current smoking status. Body mass index (calculated from reported height and weight) was used to measure overweight and obesity. Any exercise outside of work in the past month was used to assess exercise as it was the only measure available (“During the past month, other than your regular job, did you participate in any physical activities or exercises such as running, calisthenics, golf, gardening, or walking for exercise?”). Lack of sleep was assessed using the following item “During the past 30 days, for about how many days have you felt you did not get enough rest or sleep?” and respondents were grouped into those who did not get enough sleep for more than 2 days a week versus the others. Falls in the previous 3 months were assessed for adults ages 45 and over, and respondents were grouped into those who had fallen at least once versus the others. Finally, seatbelt use was assessed by grouping those who always used a seatbelt versus those who did not. For the combined county sample, 11.6% of the respondents reported binge drinking in the past 30 days compared to 13.8% of the state sample (see Table 1.8).
• In the counties, younger adults and males were more likely to binge drink. • White non-Hispanics were most likely to binge drink, while Asian non-Hispanics were
least likely. • Higher income respondents were more likely to report binge drinking, as were the
uninsured. • In the state sample, the incidence of reported binge drinking, although slightly higher in
each of the groups, followed the same patterns across all of them. For smoking status, 9.9% of the respondents in the combined county sample were current smokers compared to 14.4% in the state sample (see Table 1.8; also shown in Figure 1.9).
• In the counties, similar to binge drinking, younger adults, males, and white non-Hispanics were more likely to smoke, but Asian non-Hispanics were equally as likely to smoke as black non-Hispanics and Hispanics, and more low income respondents smoked than higher income ones.
• There was little difference among the coverage groups.

18 Rutgers Center for State Health Policy/RWJMS Family Medicine & Community Health, Dec 2012
• There were more smokers in every group in the state sample, but the general patterns held with two exceptions: black non-Hispanics and Hispanics were nearly as likely to smoke as white non-Hispanics and low income respondents and the uninsured were much more likely to smoke in the state compared to the counties.
Rates for overweight and obesity in the combined county sample (35.5% and 22.3%) were slightly lower than in the state (36.8% and 24.8%) (see Table 1.9: combined county data also shown in Figure 1.10).
• For the counties, there was little difference between older and younger adults for either overweight or obesity, but males were about 1.5 times more likely to be overweight and obese than females.
• Black non-Hispanics were more likely to be overweight and Hispanics were more likely to be obese. Asian non-Hispanics reported similar but slightly lower rates of overweight as white non-Hispanics and Hispanics, but reported much lower rates of obesity.
• Middle income respondents were more likely to be overweight, while low income respondents were more likely to be obese.
0 5 10 15 20 25 30
Uninsured 18-64 Insured 18-64
$50k+ $25k to <$50k
<$25k
Asian non-Hispanic Hispanic
Black non-Hispanic White non-Hispanic
Females Males
Ages 65+ Ages 18-64
Total
Percent Current Smokers
M + S NJ
Figure 1.9: Percent Current Smokers Adults Ages 18+, Middlesex + Somerset Counties (M+S) and Total New Jersey (NJ)
Source: Data from 2010 BRFSS; tabulations by Rutgers Center for State Health Policy.

19 A Community Health Needs Assessment
• The insured reported more overweight, but the uninsured reported more obesity. • Age and gender patterns in the state sample were similar, but black non-Hispanics were
less likely to be overweight (and more comparable to the other groups) and the most likely to be obese. Also, unlike in the counties, the incidence of overweight did not differ substantially among the income and coverage groups in the state, but low income respondents and the uninsured were still more likely to be obese.
Over a fourth of respondents in both the county and state samples reported no exercise at all outside of work in the past 30 days (27.9% and 26.6%, respectively) (see Table 1.9).
• In the counties, older adults, females, and Hispanics were more likely to not exercise outside of work, as were low income respondents and the insured.
• The patterns were quite similar in the state, with the exception of black non-Hispanics and the uninsured who were more likely to not exercise in the state sample than in the counties.
0 20 40 60 80
Uninsured 18-64 Insured 18-64
$50k+ $25k to <$50k
<$25k
Asian non-Hispanic Hispanic
Black non-Hispanic White non-Hispanic
Females Males
Ages 65+ Ages 18-64
Total
Percent Overweight and Obese
Overwt Obese
Figure 1.10: Percent Overweight and Obese Adults Ages 18+, Middlesex + Somerset Counties (M+S)
Source: Data from 2010 BRFSS; tabulations by Rutgers Center for State Health Policy.

20 Rutgers Center for State Health Policy/RWJMS Family Medicine & Community Health, Dec 2012
Over a third of respondents in both the county and state samples did not get enough sleep on more than 2 nights a week in the previous 30 days (35.0% and 36.5%, respectively) (see Table 1.10; also shown in Figure 1.11).
• Younger adults and females were more likely to report lack of sleep. • Black non-Hispanics were most likely and Asian non-Hispanics were least likely to report
lack of sleep. • Middle and high income respondents and the insured were more likely to report lack of
sleep. • In the state sample, the patterns for age and gender were similar, but black non-
Hispanics were less likely and Asian non-Hispanics were more likely to report lack of sleep than in the county sample. Also, sleep differed little across income and coverage groups in the state.
0 10 20 30 40 50
Uninsured 18-64 Insured 18-64
$50k+ $25k to <$50k
<$25k
Asian non-Hispanic Hispanic
Black non-Hispanic White non-Hispanic
Females Males
Ages 65+ Ages 18-64
Total
Percent with Not Enough Sleep or Rest (> 2 days/week)
M + S NJ
Figure 1.11: Percent with Not Enough Sleep or Rest More Than 2 Days/Week Adults Ages 18+, Middlesex + Somerset Counties (M+S) and Total New Jersey (NJ)
Source: Data from 2010 BRFSS; tabulations by Rutgers Center for State Health Policy.

21 A Community Health Needs Assessment
Falls in the past 3 months among those ages 45 and over were reported by 12.1% in the counties and 13.2% in the state (see Table 1.10).
• In the combined county sample, older adults, females, and low income respondents were more likely to fall. Due to the age restriction, cell sizes were too small to assess differences among the race-ethnicity and coverage groups.
• The age, gender, and income patterns were similar in the state. Asian non-Hispanics were least likely to report a fall, and there were no differences among the coverage groups.
Not wearing seatbelts all the time was less prevalent in the county sample than in the state (5.9% vs. 9.6%) (see Table 1.10).
• In the combined county sample, males, white non-Hispanics, and higher income respondents were more likely to not wear a seatbelt all the time.
• Although higher across all groups, similar patterns held in the state for age and gender, but black non-Hispanics were equally as likely to not wear a seatbelt as white non-Hispanics, and lower income respondents and the uninsured were more likely to not wear a seatbelt compared to the county sample.
Preventive Behaviors Immunizations, women’s health, and other preventive behaviors were assessed using 11 measures (see Tables 1.11-1.13). Influenza immunization in the past year was examined for all adults (flu shot and flu spray) and for adults ages 65+ (flu shot). For women’s health behaviors, mammogram in the past 2 years (women ages 50+), pap test in the past 3 years (women ages 18+), and ever had a hysterectomy were assessed. Other preventive behaviors included blood stool test in the past 2 years (ages 50+), pneumonia shot ever (ages 65+), ever had a sigmoidoscopy or colonoscopy (ages 50+), PSA test in the past 2 years (men ages 40+), and ever had an HIV test (ages 18-64). Due to the age and gender restrictions in most of the measures, cell sizes in the combined county sample were too small to assess differences among some groups, particularly among the race-ethnicity and coverage groups. About 60% of all adults in both the county and state samples did not receive a flu shot in the previous year (58.3% and 61.8%, respectively) (see Table 1.11).
• In the counties, younger adults and males were more likely to not get a flu shot, as were Hispanics, Asian non-Hispanics, lower income respondents, and the uninsured.
• The patterns were quite similar in the state.

22 Rutgers Center for State Health Policy/RWJMS Family Medicine & Community Health, Dec 2012
• Only 1.1% in the counties and 1.3% in the state received the immunization via the flu spray. Asian non-Hispanics were more likely to receive the flu spray in the county sample, while Hispanics and black non-Hispanics were more likely in the state.
• For older adults, 30.2% in the counties and 34.3% in the state did not receive a flu shot in the previous year (also shown in Figure 1.12). Low income older adults were most likely to not get a flu shot. Cell sizes in the combined county sample were too small to assess differences among the race-ethnicity groups. In the state, white non-Hispanics and high income respondents were the least likely to not get a flu shot.
0 10 20 30 40 50
$50k+ $25k to <$50k
<$25k
Asian non-Hispanic Hispanic
Black non-Hispanic White non-Hispanic
Females Males
Ages 65+ Ages 18-64
Total
Percent of Older Adults Who Did Not Get a Flu Shot in Past Year
M + S NJ
Figure 1.12: Percent of Older Adults Who Did Not Get a Flu Shot in Past Year Adults Ages 65+, Middlesex + Somerset Counties (M+S) and Total New Jersey (NJ) (Data not shown for some groups due to insufficient cell sizes or restricted age)
Source: Data from 2010 BRFSS; tabulations by Rutgers Center for State Health Policy.

23 A Community Health Needs Assessment
For mammograms, 20.2% of the women ages 50 and over in the combined county sample had not had a mammogram in the past 2 years and the rate was similar but slightly higher in the state sample (21.4%) (see Table 1.12; also shown in Figure 1.13).
• For the counties, older and lower income women were more likely to have not had a mammogram within 2 years. Cell sizes in the combined county sample were too small to assess differences among the race-ethnicity and coverage groups.
• In the state sample, older women, white non-Hispanic women, low income women, and uninsured women were more likely to forego a mammogram in the past 2 years.
0 10 20 30 40 50
Uninsured 18-64 Insured 18-64
$50k+ $25k to <$50k
<$25k
Asian non-Hispanic Hispanic
Black non-Hispanic White non-Hispanic
Females Males
Ages 65+ Ages 18-64
Total
Percent of Women (ages 50+) Who Did Not Get a Mammogram in Past 2 Years
M + S NJ
Figure 1.13: Percent of Women Who Did Not Get a Mammogram in Past 2 Years Women Ages 50+, Middlesex + Somerset Counties (M+S) and Total New Jersey (NJ) (Data not shown for some groups due to insufficient cell sizes or restricted gender)
Source: Data from 2010 BRFSS; tabulations by Rutgers Center for State Health Policy.

24 Rutgers Center for State Health Policy/RWJMS Family Medicine & Community Health, Dec 2012
For pap tests, 14.4% of women ages 18+ in the combined county sample and 15.9% in the state sample had not had a pap test in the previous 3 years (see Table 1.12).
• In the counties, older and lower income women were more likely and Hispanics were less likely than white non-Hispanics to have not had a pap test within 3 years. Cell sizes in the combined county sample were too small to assess differences among the other race-ethnicity groups and the coverage groups.
• In the state sample, older women, Asian non-Hispanic women, low income women, and uninsured women were more likely to forego a pap test in the previous 3 years.
Hysterectomy prevalence rates were similar in the combined county and state samples (14.6% and 15.0%, respectively, of women ages 18+) (see Table 1.12).
• In the counties, older women, white non-Hispanic women, and lower income women were more likely to have had a hysterectomy, while Hispanic and Asian non-Hispanic women were less likely. Cell sizes in the combined county sample were too small to assess rates among black non-Hispanics and the uninsured.
• In the state sample, similar patterns emerged for age and income. In addition, black non-Hispanic women and insured women were more likely to report a hysterectomy, while Asian non-Hispanic women were less likely.
For the blood stool test, 80.5% and 82.6% of respondents ages 50 and over in the combined county and state samples respectively had not had one in the previous 2 years (see Table 1.13, first page).
• Younger adults, women, and low income respondents were more likely to have not had a blood stool test in the past 2 years in the counties. Cell sizes in the combined county sample were too small to assess differences among the race-ethnicity and coverage groups.
• In the state sample, older adults and females were again more likely to have not had a blood stool test. Asian non-Hispanics and the uninsured were more likely to have not had a blood stool test within 2 years while black non-Hispanics were less likely. There were no substantial differences among income groups.

25 A Community Health Needs Assessment
Never having had a pneumonia shot was reported by 26.2% of adults ages 65 and over in the counties and by 35.7% in the state sample (see Table 1.13, first page; also shown in Figure 1.14).
• For the counties, males were more likely to have never had a pneumonia shot. Rates differed little among the income groups. Cell sizes in the combined county sample were too small to assess differences among the race-ethnicity groups. Coverage groups were not compared since only non-elderly coverage was analyzed in this report.
• In the state sample, Hispanics, Asian non-Hispanics, black non-Hispanics, and low income respondents were more likely to have never had a pneumonia shot.
0 10 20 30 40 50 60 70
$50k+ $25k to <$50k
<$25k
Asian non-Hispanic Hispanic
Black non-Hispanic White non-Hispanic
Females Males
Ages 65+ Ages 18-64
Total
Percent of Older Adults (ages 65+) Who Have Never Had a Pneumonia Shot
M + S NJ
Figure 1.14: Percent of Older Adults Who Have Never Had a Pneumonia Shot Adults Ages 65+, Middlesex + Somerset Counties (M+S) and Total New Jersey (NJ) (Data not shown for some groups due to insufficient cell sizes or restricted age)
Source: Data from 2010 BRFSS; tabulations by Rutgers Center for State Health Policy.
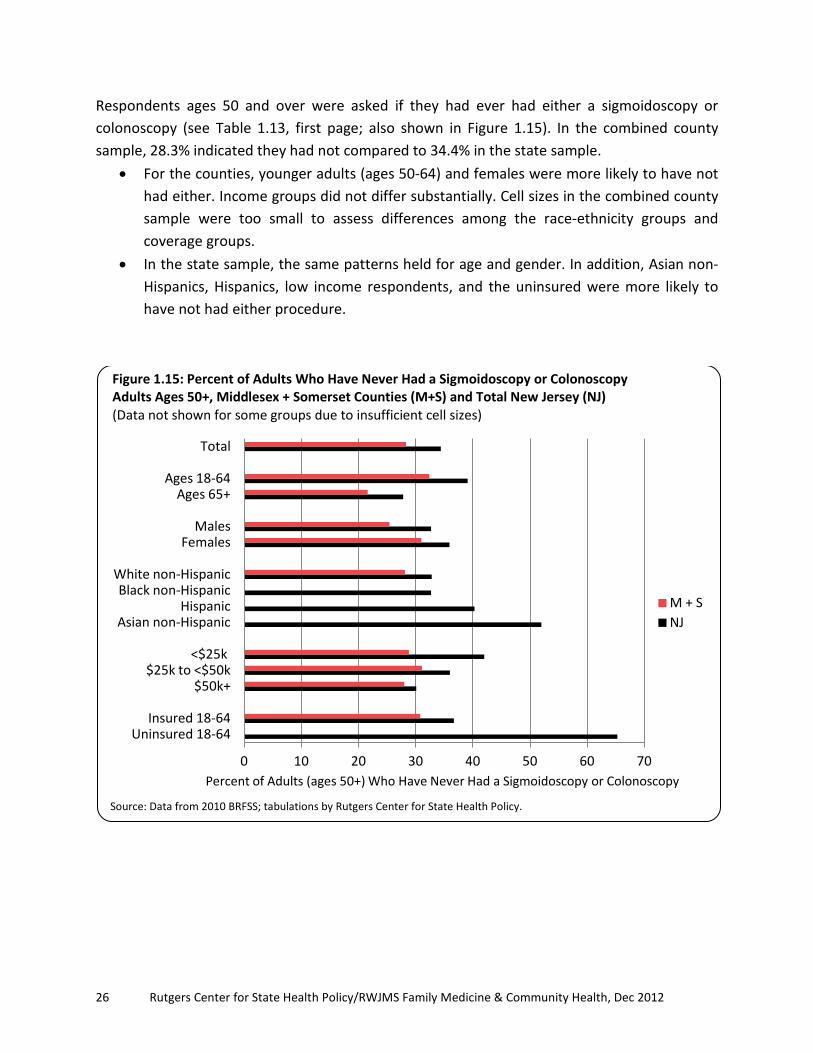
26 Rutgers Center for State Health Policy/RWJMS Family Medicine & Community Health, Dec 2012
Respondents ages 50 and over were asked if they had ever had either a sigmoidoscopy or colonoscopy (see Table 1.13, first page; also shown in Figure 1.15). In the combined county sample, 28.3% indicated they had not compared to 34.4% in the state sample.
• For the counties, younger adults (ages 50-64) and females were more likely to have not had either. Income groups did not differ substantially. Cell sizes in the combined county sample were too small to assess differences among the race-ethnicity groups and coverage groups.
• In the state sample, the same patterns held for age and gender. In addition, Asian non-Hispanics, Hispanics, low income respondents, and the uninsured were more likely to have not had either procedure.
0 10 20 30 40 50 60 70
Uninsured 18-64 Insured 18-64
$50k+ $25k to <$50k
<$25k
Asian non-Hispanic Hispanic
Black non-Hispanic White non-Hispanic
Females Males
Ages 65+ Ages 18-64
Total
Percent of Adults (ages 50+) Who Have Never Had a Sigmoidoscopy or Colonoscopy
M + S NJ
Figure 1.15: Percent of Adults Who Have Never Had a Sigmoidoscopy or Colonoscopy Adults Ages 50+, Middlesex + Somerset Counties (M+S) and Total New Jersey (NJ) (Data not shown for some groups due to insufficient cell sizes)
Source: Data from 2010 BRFSS; tabulations by Rutgers Center for State Health Policy.
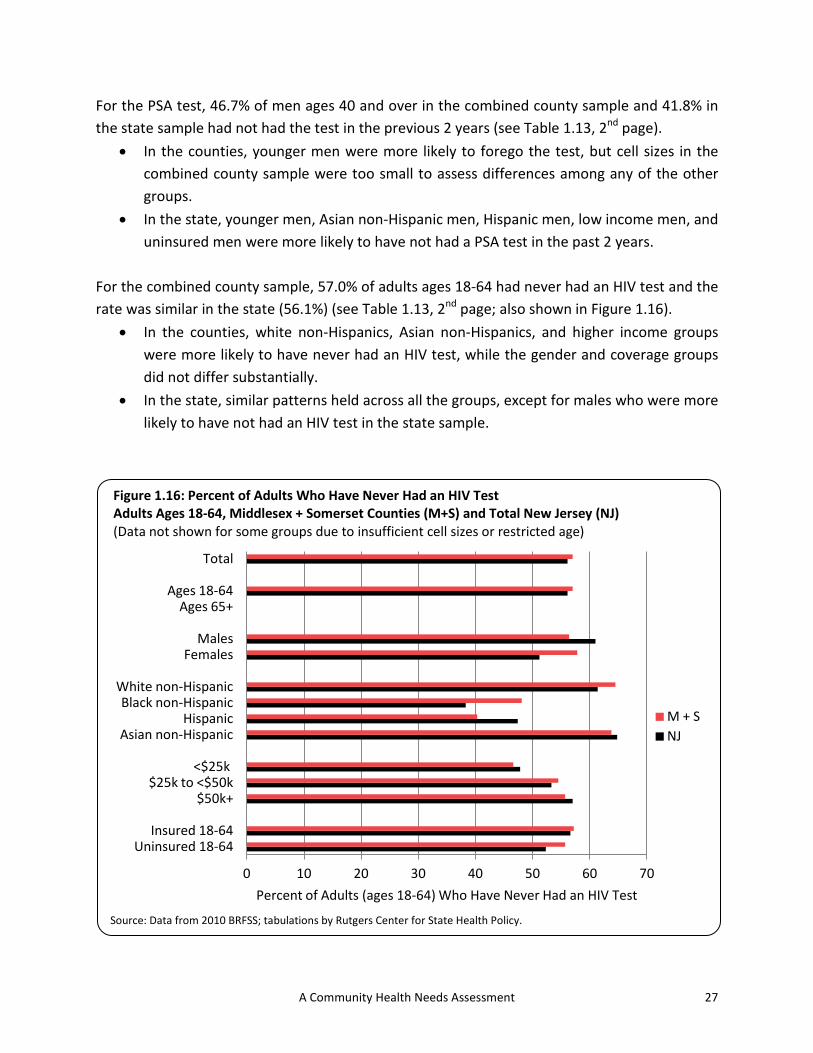
27 A Community Health Needs Assessment
For the PSA test, 46.7% of men ages 40 and over in the combined county sample and 41.8% in the state sample had not had the test in the previous 2 years (see Table 1.13, 2nd page).
• In the counties, younger men were more likely to forego the test, but cell sizes in the combined county sample were too small to assess differences among any of the other groups.
• In the state, younger men, Asian non-Hispanic men, Hispanic men, low income men, and uninsured men were more likely to have not had a PSA test in the past 2 years.
For the combined county sample, 57.0% of adults ages 18-64 had never had an HIV test and the rate was similar in the state (56.1%) (see Table 1.13, 2nd page; also shown in Figure 1.16).
• In the counties, white non-Hispanics, Asian non-Hispanics, and higher income groups were more likely to have never had an HIV test, while the gender and coverage groups did not differ substantially.
• In the state, similar patterns held across all the groups, except for males who were more likely to have not had an HIV test in the state sample.
0 10 20 30 40 50 60 70
Uninsured 18-64 Insured 18-64
$50k+ $25k to <$50k
<$25k
Asian non-Hispanic Hispanic
Black non-Hispanic White non-Hispanic
Females Males
Ages 65+ Ages 18-64
Total
Percent of Adults (ages 18-64) Who Have Never Had an HIV Test
M + S NJ
Figure 1.16: Percent of Adults Who Have Never Had an HIV Test Adults Ages 18-64, Middlesex + Somerset Counties (M+S) and Total New Jersey (NJ) (Data not shown for some groups due to insufficient cell sizes or restricted age)
Source: Data from 2010 BRFSS; tabulations by Rutgers Center for State Health Policy.

28 Rutgers Center for State Health Policy/RWJMS Family Medicine & Community Health, Dec 2012
Conclusions For nearly all measures overall, the combined county sample fared better than the New Jersey sample. The counties fared worse on only 3 of the 33 measures (no exercise past month, no PSA test in the past 2 years, and never had an HIV test). In general, older adults fared worse on the health status measures, with the exception of number of bad mental health days and ever diagnosed with asthma. Younger adults reported more problems with the healthcare access measures such as not having a regular doctor, cost barriers to care, or not having recent medical/dental check-ups. Younger adults also fared worse on the risky behaviors such as binge drinking, smoking, seatbelt use, and lack of sleep, but better on overweight/obesity, exercise, and falls. Older adults generally engaged in more preventive behaviors, with the exception of recent mammograms or pap tests. Females fared worse on the health status measures, with the exception of diabetes. Males reported more problems with two of the healthcare access measures (not having a regular doctor and not having recent medical/dental check-ups), but females reported more problems with cost barriers to care. Males fared worse on the risky behaviors such as binge drinking, smoking, overweight/obesity, and seatbelt use, but females fared worse on exercise, sleep, and falls. Black non-Hispanic and Hispanics fared worse on some of the health status measures than white non-Hispanics, with the exception of heart attack, stroke, and activity limitation where the prevalence among white non-Hispanics was higher. Black non-Hispanics and Hispanics also reported more problems with the healthcare access measures. Asian non-Hispanics fared better on almost all the measures, with the exception of diabetes, heart attack, not having a recent dental visit, flu shot (18+), and HIV test. Low income respondents fared worse across the board. The few exceptions were for binge drinking, overweight (but not obese), lack of sleep, seatbelt use, and ever had an HIV test, where they did better than the other income groups. Similarly, the uninsured fared worse across almost all measures, with the exception of heart attack, health problem requiring special equipment, smoking, overweight (but not obese), exercise, sleep, and HIV test. Although the counties fared better than the state overall and generally across age, gender, and racial-ethnic groups, the disparities among the low income respondents and the uninsured are still quite large for most measures. Some racial-ethnic disparities also remain, although not consistently across all the measures.

29 A Community Health Needs Assessment
Table 1.1: Individual Characteristics, Adults Ages 18+, Middlesex and Somerset Counties (separately and together) (unweighted)
Middlesex County
Somerset County
Both Counties
N
N
N
Total Adult Sample 619
527
1,146
Age 18-64 446
385
831
65+ 162
132
294 Don't know/refused 11
10
21
Gender Male 242
211
453
Female 377
316
693 Don't know/refused 0
0
0
Race-ethnicity White non-Hispanic 418
407
825
Black non-Hispanic 49
25
74 Hispanic 55
43
98
Asian non-Hispanic 76
44
120 Other non-Hispanic 12
6
18
Don't know/refused 9
2
11 Income (household)
<$25k 87
61
148 $25k to < $50k 91
64
155
$50k + 325
319
644 Don't know/refused 116
83
199
Health Insurance (18-64) Insured 403
348
751
Uninsured 43
36
79 Don't know/refused 0
1
1
Source: Data from 2010 BRFSS; tabulations by Rutgers University Center for State Health Policy.

30 Rutgers Center for State Health Policy/RWJMS Family Medicine & Community Health, Dec 2012
Table 1.2: Individual Characteristics, Adults Ages 18+, Middlesex and Somerset Counties (separately and together) and Total New Jersey
Middlesex County
Somerset County
Both Counties
New Jersey
%
N
%
N
%
N
%
N
Total Adult Population 100.0
597,283
100.0
251,160
100.0
848,443
100.0
6,661,016
Age
18-64 86.4
508,858
84.2
208,680
85.7
717,538
82.0
5,402,557 65+ 13.6
80,418
15.8
39,110
14.3
119,528
18.0
1,188,458
Gender Male 52.8
315,080
48.8
122,503
51.6
437,582
48.3
3,216,208
Female 47.2
282,203
51.2
128,657
48.4
410,860
51.7
3,444,808 Race-ethnicity
White non-Hispanic 47.7
282,750
58.3
145,897
50.9
428,647
62.1
4,072,856 Black non-Hispanic 12.3
72,887
8.2
20,609
11.1
93,497
13.1
861,827
Hispanic 17.2
101,696
14.4
36,137
16.4
137,833
14.5
950,368 Asian non-Hispanic 18.7
110,753
16.7
41,789
18.1
152,541
7.6
498,115
Other non-Hispanic 4.1
24,135
2.3
5,849
3.6
29,984
2.7
178,344 Income (household)
<$25k 14.3
85,602
13.3
33,434
14.0
119,036
16.4
1,092,115 $25k to < $50k 12.6
75,227
10.9
27,458
12.1
102,684
17.3
1,149,918
$50k + 55.7
332,982
64.3
161,540
58.3
494,522
49.5
3,298,056 Don't know/refused 17.3
103,472
11.4
28,728
15.6
132,200
16.8
1,120,927
Health Insurance (18-64) Insured 87.5
445,004
89.3
185,835
88.0
630,839
86.3
4,626,612
Uninsured 12.5
63,854
10.7
22,351
12.0
86,205
13.7
737,018
Source: Data from 2010 BRFSS; tabulations by Rutgers University Center for State Health Policy. Note: Don't know and refused responses excluded unless > 5%, so cell sizes may not total full sample size.

31 A Community Health Needs Assessment
Table 1.3: Item Frequencies, Adults Ages 18+, Middlesex + Somerset Counties and Total New Jersey
Middlesex + Somerset Counties New Jersey**
N % Valid %
% Valid %
Total Adult Population 848,443 100.0 100.0
100.0 100.0
Self-assessed health
Valid 1.00 Good or better 745,173 87.8 87.9
85.1 85.3 2.00 Fair or poor 102,747 12.1 12.1
14.7 14.7
Total 847,920 99.9 100.0
99.8 100.0 Missing DK, REF 523 0.1
0.2
Total 848,443 100.0
100.0
Days in past 30 physical health not good
Valid 1.00 None 560,658 66.1 68.7
65.2 67.5 2.00 1-3 days 109,436 12.9 13.4
13.3 13.7
3.00 4+ days 145,757 17.2 17.9
18.1 18.7 Total 815,851 96.2 100.0
96.6 100.0
Missing DK, REF 32,592 3.8
3.4 Total 848,443 100.0
100.0
Days in past 30 mental health not good
Valid 1.00 None 577,914 68.1 70.5
66.5 68.6
2.00 1-3 days 96,859 11.4 11.8
10.8 11.1 3.00 4+ days 145,375 17.1 17.7
19.7 20.3
Total 820,147 96.7 100.0
96.9 100.0 Missing DK, REF 28,295 3.3
3.1
Total 848,443 100.0
100.0
Ever told by doc had asthma
Valid 1.00 Yes 98,782 11.6 11.7
13.3 13.3 2.00 No 748,044 88.2 88.3
86.5 86.7
Total 846,826 99.8 100.0
99.8 100.0 Missing DK, REF 1,617 0.2
0.2
Total 848,443 100.0
100.0
Source: Data from 2010 BRFSS; tabulations by Rutgers University Center for State Health Policy. * System missing due to question restrictions on age or gender.
** 2010 total adult population ages 18+ for New Jersey = 6,661,016.

32 Rutgers Center for State Health Policy/RWJMS Family Medicine & Community Health, Dec 2012
Table 1.3: Item Frequencies, Adults Ages 18+, Middlesex + Somerset Counties and Total New Jersey (continued)
Middlesex + Somerset Counties New Jersey**
N % Valid %
% Valid %
Ever told by doc has diabetes
Valid 1.00 Yes 64,148 7.6 7.6
9.2 9.2 2.00 No 783,280 92.3 92.4
90.7 90.8
Total 847,428 99.9 100.0
99.9 100.0 Missing DK, REF 1,015 0.1
0.1
Total 848,443 100.0
100.0
Ever told by doc had heart attack
Valid 1.00 Yes 22,376 2.6 2.6
3.8 3.8 2.00 No 825,165 97.3 97.4
96.0 96.2
Total 847,541 99.9 100.0
99.7 100.0 Missing DK, REF 902 0.1
0.3
Total 848,443 100.0
100.0
Ever told by doc had stroke
Valid 1.00 Yes 10,458 1.2 1.2
2.4 2.4 2.00 No 835,732 98.5 98.8
97.5 97.6
Total 846,190 99.7 100.0
99.9 100.0 Missing DK, REF 2,253 0.3
0.1
Total 848,443 100.0
100.0
Activity limitation due to phys, ment, or emot probs
Valid 1.00 Yes 131,077 15.4 15.5
16.9 16.9 2.00 No 715,212 84.3 84.5
82.8 83.1
Total 846,289 99.7 100.0
99.6 100.0 Missing DK, REF 2,153 0.3
0.4
Total 848,443 100.0
100.0
Health problems requiring special equipment
Valid 1 Yes 41,365 4.9 4.9
6.6 6.6 2 No 806,465 95.1 95.1
93.4 93.4
Total 847,830 99.9 100.0
99.9 100.0 Missing DK, REF 613 0.1
0.1
Total 848,443 100.0
100.0
Source: Data from 2010 BRFSS; tabulations by Rutgers University Center for State Health Policy. * System missing due to question restrictions on age or gender.
** 2010 total adult population ages 18+ for New Jersey = 6,661,016.

33 A Community Health Needs Assessment
Table 1.3: Item Frequencies, Adults Ages 18+, Middlesex + Somerset Counties and Total New Jersey (continued)
Middlesex + Somerset Counties New Jersey**
N % Valid %
% Valid %
Has regular doctor
Valid 1.00 Yes 757,166 89.2 89.3
86.0 86.2 2.00 No 90,940 10.7 10.7
13.8 13.8
Total 848,106 100.0 100.0
99.8 100.0 Missing DK, REF 337 0.0
0.2
Total 848,443 100.0
100.0
Could not see doctor due to cost in past year
Valid 1 Yes 107,958 12.7 12.8
13.1 13.1 2 No 736,532 86.8 87.2
86.6 86.9
Total 844,490 99.5 100.0
99.7 100.0 Missing DK, REF 3,953 0.5
0.3
Total 848,443 100.0
100.0
Last routine physical checkup
Valid 1.00 Within past year 657,889 77.5 78.7
76.1 77.0 2.00 >1 to 2 years 92,251 10.9 11.0
12.4 12.5
3.00 >2 years 85,911 10.1 10.3
10.4 10.5 Total 836,051 98.5 100.0
98.8 100.0
Missing DK, REF 12,392 1.5
1.2 Total 848,443 100.0
100.0
Dental visit past year
Valid 1.00 Yes 671,722 79.2 79.4
75.6 76.0
2.00 No 174,110 20.5 20.6
23.8 24.0 Total 845,832 99.7 100.0
99.4 100.0
Missing DK, REF 2,611 0.3
0.6 Total 848,443 100.0
100.0
Source: Data from 2010 BRFSS; tabulations by Rutgers University Center for State Health Policy.
* System missing due to question restrictions on age or gender. ** 2010 total adult population ages 18+ for New Jersey = 6,661,016.

34 Rutgers Center for State Health Policy/RWJMS Family Medicine & Community Health, Dec 2012
Table 1.3: Item Frequencies, Adults Ages 18+, Middlesex + Somerset Counties and Total New Jersey (continued)
Middlesex + Somerset Counties New Jersey**
N % Valid %
% Valid %
1+ permanent teeth extracted due to decay
Valid 1.00 Yes 348,035 41.0 41.9
45.5 46.5 2.00 No 482,590 56.9 58.1
52.4 53.5
Total 830,626 97.9 100.0
97.9 100.0 Missing DK, REF 17,817 2.1
2.1
Total 848,443 100.0
100.0
Binge Drinker past 30 days (males 5+, females 4+, 1 occasion)
Valid 1.00 Yes 95,013 11.2 11.6
13.1 13.8 2.00 No 723,578 85.3 88.4
81.5 86.2
Total 818,591 96.5 100.0
94.5 100.0 Missing DK, REF 29,852 3.5
5.5
Total 848,443 100.0
100.0
Smoker
Valid 1.00 Yes 83,377 9.8 9.9
14.4 14.4 2.00 No 762,403 89.9 90.1
85.1 85.6
Total 845,780 99.7 100.0
99.5 100.0 Missing DK, REF 2,663 0.3
0.5
Total 848,443 100.0
100.0
BMI categories
Valid 1.00 Normal 340,815 40.2 42.2
36.0 38.5 2.00 Overweight 286,603 33.8 35.5
34.4 36.8
3.00 Obese 179,738 21.2 22.3
23.2 24.8 Total 807,156 95.1 100.0
93.5 100.0
Missing DK, REF 41,287 4.9
6.5 Total 848,443 100.0
100.0
Source: Data from 2010 BRFSS; tabulations by Rutgers University Center for State Health Policy.
* System missing due to question restrictions on age or gender. ** 2010 total adult population ages 18+ for New Jersey = 6,661,016.

35 A Community Health Needs Assessment
Table 1.3: Item Frequencies, Adults Ages 18+, Middlesex + Somerset Counties and Total New Jersey (continued)
Middlesex + Somerset Counties New Jersey**
N % Valid %
% Valid %
Any exercise past month
Valid 1.00 Yes 612,080 72.1 72.1
73.3 73.4 2.00 No 236,363 27.9 27.9
26.6 26.6
Total 848,443 100.0 100.0
99.9 100.0 Missing DK, REF 0
0.1
Total 848,443 100.0
100.0
Days not enough sleep or rest in past 30 days
Valid 1.00 0 262,863 31.0 31.5
31.4 32.2 2.00 1-8 279,774 33.0 33.5
30.4 31.2
3.00 9-30 292,643 34.5 35.0
35.5 36.5 Total 835,281 98.4 100.0
97.3 100.0
Missing DK, REF 13,162 1.6
2.7 Total 848,443 100.0
100.0
Fallen past 3 months, age 45+
Valid 1.00 Yes 49,117 5.8 12.1
6.6 13.2
2.00 No 357,623 42.2 87.9
43.5 86.8 Total 406,740 47.9 100.0
50.1 100.0
Missing DK, REF 4,827 0.6
1.1
System* 436,875 51.5
48.8
Total 441,703 52.1
49.9 Total 848,443 100.0
100.0
Always wears seatbelt
Valid 1.00 Yes 774,566 91.3 94.1
86.1 90.4
2.00 No 48,395 5.7 5.9
9.1 9.6 Total 822,962 97.0 100.0
95.2 100.0
Missing DK, REF 25,481 3.0
4.8 Total 848,443 100.0
100.0
Source: Data from 2010 BRFSS; tabulations by Rutgers University Center for State Health Policy.
* System missing due to question restrictions on age or gender. ** 2010 total adult population ages 18+ for New Jersey = 6,661,016.

36 Rutgers Center for State Health Policy/RWJMS Family Medicine & Community Health, Dec 2012
Table 1.3: Item Frequencies, Adults Ages 18+, Middlesex + Somerset Counties and Total New Jersey (continued)
Middlesex + Somerset Counties New Jersey**
N % Valid %
% Valid %
Flu shot past 12 months (age 18+)
Valid 1.00 Yes 342,240 40.3 41.7
36.2 38.2 2.00 No 479,077 56.5 58.3
58.6 61.8
Total 821,316 96.8 100.0
94.8 100.0 Missing DK, REF 27,126 3.2
5.2
Total 848,443 100.0
100.0
Flu spray past 12 months (age 18+)
Valid 1.00 Yes 8,951 1.1 1.1
1.3 1.3 2.00 No 817,055 96.3 98.9
94.2 98.7
Total 826,006 97.4 100.0
95.5 100.0 DK, REF 22,437 2.6
4.5
Total 848,443 100.0
100.0
Flu shot past 12 months (age 65+)
Valid 1.00 Yes 80,969 9.5 69.8
11.1 65.7 2.00 No 34,981 4.1 30.2
5.8 34.3
Total 115,950 13.7 100.0
16.8 100.0 Missing DK, REF 14,955 1.8
2.1
System* 717,538 84.6
81.1 Total 732,493 86.3
83.2
Total 848,443 100.0
100.0
Mammogram past 2 years, women age 50+
Valid 1.00 Yes 125,386 14.8 79.8
17.3 78.6 2.00 No 31,735 3.7 20.2
4.7 21.4
Total 157,121 18.5 100.0
22.0 100.0 Missing DK, REF 13,497 1.6
2.1
System* 677,825 79.9
75.9 Total 691,322 81.5
78.0
Total 848,443 100.0
100.0
Source: Data from 2010 BRFSS; tabulations by Rutgers University Center for State Health Policy. * System missing due to question restrictions on age or gender.
** 2010 total adult population ages 18+ for New Jersey = 6,661,016.

37 A Community Health Needs Assessment
Table 1.3: Item Frequencies, Adults Ages 18+, Middlesex + Somerset Counties and Total New Jersey (continued)
Middlesex + Somerset Counties New Jersey**
N % Valid %
% Valid %
Pap test past 3 years, women age 18+
Valid 1.00 Yes 276,041 32.5 85.6
33.9 84.1 2.00 No 46,447 5.5 14.4
6.4 15.9
Total 322,489 38.0 100.0
40.3 100.0 Missing DK, REF 15,053 1.8
1.3
System* 510,902 60.2
58.3 Total 525,954 62.0
59.7
Total 848,443 100.0
100.0
Had hysterectomy, women 18+
Valid 1.00 Yes 55,616 6.6 14.6
7.1 15.0 2.00 No 324,462 38.2 85.4
40.3 85.0
Total 380,077 44.8 100.0
47.4 100.0 Missing DK, REF 4,044 0.5
0.3
System* 464,322 54.7
52.3 Total 468,365 55.2
52.6
Total 848,443 100.0
100.0
Blood stool test past 2 years, age 50+
Valid 1.00 Yes 57,600 6.8 19.5
6.9 17.4 2.00 No 237,864 28.0 80.5
33.0 82.6
Total 295,464 34.8 100.0
39.9 100.0 Missing DK, REF 22,797 2.7
2.0
System* 530,181 62.5
58.1 Total 552,979 65.2
60.1
Total 848,443 100.0
100.0
Source: Data from 2010 BRFSS; tabulations by Rutgers University Center for State Health Policy. * System missing due to question restrictions on age or gender.
** 2010 total adult population ages 18+ for New Jersey = 6,661,016.

38 Rutgers Center for State Health Policy/RWJMS Family Medicine & Community Health, Dec 2012
Table 1.3: Item Frequencies, Adults Ages 18+, Middlesex + Somerset Counties and Total New Jersey (continued)
Middlesex + Somerset Counties New Jersey**
N % Valid %
% Valid %
Pneumonia shot ever (age 65+)
Valid 1.00 Yes 83,671 9.9 73.8
10.5 64.3 2.00 No 29,673 3.5 26.2
5.9 35.7
Total 113,345 13.4 100.0
16.4 100.0 Missing DK, REF 17,560 2.1
2.5
System* 717,538 84.6
81.1 Total 735,098 86.6
83.6
Total 848,443 100.0
100.0
Sigmoidoscopy or colonoscopy ever, age 50+
Valid 1.00 Yes 218,126 25.7 71.7
26.6 65.6 2.00 No 86,220 10.2 28.3
14.0 34.4
Total 304,347 35.9 100.0
40.6 100.0 Missing DK, REF 13,915 1.6
1.3
System* 530,181 62.5
58.1 Total 544,096 64.1
59.4
Total 848,443 100.0
100.0
PSA test past 2 years, men age 40+
Valid 1.00 Yes 127,410 15.0 53.3
15.4 58.2 2.00 No 111,519 13.1 46.7
11.0 41.8
Total 238,929 28.2 100.0
26.4 100.0 Missing DK, REF 16,662 2.0
2.0
System* 592,852 69.9
71.6 Total 609,514 71.8
73.6
Total 848,443 100.0
100.0
Source: Data from 2010 BRFSS; tabulations by Rutgers University Center for State Health Policy. * System missing due to question restrictions on age or gender.
** 2010 total adult population ages 18+ for New Jersey = 6,661,016.

39 A Community Health Needs Assessment
Table 1.3: Item Frequencies, Adults Ages 18+, Middlesex + Somerset Counties and Total New Jersey (continued)
Middlesex + Somerset Counties New Jersey**
N % Valid %
% Valid %
HIV test ever, age 18-64
Valid 1.00 Yes 286,593 33.8 43.0
32.7 43.9 2.00 No 380,447 44.8 57.0
41.8 56.1
Total 667,040 78.6 100.0
74.5 100.0 Missing DK, REF 30,042 3.5
3.1
System* 151,361 17.8
22.5 Total 181,403 21.4
25.5
Total 848,443 100.0
100.0
Age
Valid 1.00 18-64 717,538 84.6 85.7
81.1 82.0 2.00 65+ 119,528 14.1 14.3
17.8 18.0
Total 837,066 98.7 100.0
98.9 100.0 Missing DK, REF 11,377 1.3
1.1
Total 848,443 100.0
100.0
Gender
Valid 1.00 Male 437,582 51.6 51.6
48.3 48.3 2.00 Female 410,860 48.4 48.4
51.7 51.7
Total 848,443 100.0 100.0
100.0 100.0
Race-ethnicity
Valid 1.00 White non-Hisp 428,647 50.5 50.9
61.1 62.1 2.00 Black non-Hisp 93,497 11.0 11.1
12.9 13.1
3.00 Hispanic 137,833 16.2 16.4
14.3 14.5 4.00 Asian non-Hisp 152,541 18.0 18.1
7.5 7.6
5.00 Other 29,984 3.5 3.6
2.7 2.7 Total 842,501 99.3 100.0
98.5 100.0
Missing DK, REF 5,942 0.7
1.5 Total 848,443 100.0
100.0
Source: Data from 2010 BRFSS; tabulations by Rutgers University Center for State Health Policy. * System missing due to question restrictions on age or gender.
** 2010 total adult population ages 18+ for New Jersey = 6,661,016.

40 Rutgers Center for State Health Policy/RWJMS Family Medicine & Community Health, Dec 2012
Table 1.3: Item Frequencies, Adults Ages 18+, Middlesex + Somerset Counties and Total New Jersey (continued)
Middlesex + Somerset Counties New Jersey**
N % Valid %
% Valid %
Household Income
Valid 1.00 < $25k 119,036 14.0 14.0
16.4 16.4 2.00 $25k to < $50k 102,684 12.1 12.1
17.3 17.3
3.00 $50k + 494,522 58.3 58.3
49.5 49.5 9.00 DK, REF 132,200 15.6 15.6
16.8 16.8
Total 848,443 100.0 100.0
100.0 100.0
Health insurance, non-elderly
Valid 1.00 Insured 630,839 74.4 88.0
69.5 86.3 2.00 Uninsured 86,205 10.2 12.0
11.1 13.7
Total 717,044 84.5 100.0
80.5 100.0 Missing DK, REF 131,399 15.5
19.5
Total 848,443 100.0
100.0
Marital status
Valid 1 Married 584,473 68.9 69.1
61.8 62.6 2 Divorced 53,464 6.3 6.3
7.0 7.1
3 Widowed 45,635 5.4 5.4
6.7 6.8 4 Separated 9,342 1.1 1.1
2.2 2.2
5 Never married 133,143 15.7 15.7
17.8 18.1 6 Member of an unmarried
couple 19,578 2.3 2.3
3.1 3.2 Total 845,635 99.7 100.0
98.7 100.0
Missing DK, REF 2,807 0.3
1.3 Total 848,443 100.0
100.0
Education
Valid 1.00 HS grad or less 224,126 26.4 26.5
33.5 33.8
2.00 Some college 179,106 21.1 21.2
24.0 24.3 3.00 College grad+ 442,989 52.2 52.3
41.5 41.9
Total 846,222 99.7 100.0
99.0 100.0 Missing DK, REF 2,221 0.3
1.0
Total 848,443 100.0
100.0
Source: Data from 2010 BRFSS; tabulations by Rutgers University Center for State Health Policy. * System missing due to question restrictions on age or gender.
** 2010 total adult population ages 18+ for New Jersey = 6,661,016.

41 A Community Health Needs Assessment
Table 1.3: Item Frequencies, Adults Ages 18+, Middlesex + Somerset Counties and Total New Jersey (continued)
Middlesex + Somerset Counties New Jersey**
N % Valid %
% Valid %
Employment status
Valid 1 Employed for wages 511,054 60.2 60.5
55.5 56.1 2 Self-employed 55,555 6.5 6.6
6.1 6.1
3 Out of work > 1 year 42,760 5.0 5.1
5.2 5.3 4 Out of work < 1 year 36,589 4.3 4.3
4.3 4.3
5 Homemaker 29,872 3.5 3.5
4.7 4.7 6 Student 36,577 4.3 4.3
4.1 4.2
7 Retired 110,112 13.0 13.0
15.6 15.8 8 Unable to work 22,569 2.7 2.7
3.5 3.5
Total 845,087 99.6 100.0
98.9 100.0 Missing DK, REF 3,356 0.4
1.1
Total 848,443 100.0
100.0
Source: Data from 2010 BRFSS; tabulations by Rutgers University Center for State Health Policy.
* System missing due to question restrictions on age or gender. ** 2010 total adult population ages 18+ for New Jersey = 6,661,016.

42 Rutgers Center for State Health Policy/RWJMS Family Medicine & Community Health, Dec 2012
Table 1.4: Health Status by Individual Characteristics, Adults Ages 18+, Middlesex + Somerset Counties (M+S) and Total New Jersey (NJ)
Self-assessed
Days Physical Health
Days Mental Health Overall Health Status Not Good Past 30 Days Not Good Past 30 Days
M+S NJ
M+S NJ
M+S NJ
% Fair or Poor N
% Fair or Poor
% 4+ Days N
% 4+ Days
% 4+ Days N
% 4+ Days
Total Adult Population 12.1
102,748
14.7
17.9
145,757
18.7
17.7
145,375
20.3
Age
18-64 10.9
77,953
11.9
16.5
114,254
16.8
18.6
129,529
21.6 65+ 20.2
24,102
27.6
25.8
29,126
27.9
12.4
14,169
14.6
Gender Male 11.1
48,517
13.9
13.9
59,039
16.1
11.4
48,404
17.5
Female 13.2
54,231
15.5
22.2
86,718
21.2
24.6
96,971
22.9 Race-ethnicity
White non-Hispanic 13.3
56,907
12.5
20.3
83,395
19.1
18.3
75,608
20.2 Black non-Hispanic 7.8
7,255
20.9
20.1
18,691
20.9
12.4
11,567
21.7
Hispanic 20.3
27,990
22.6
22.3
29,919
21.0
27.3
36,841
22.5 Asian non-Hispanic 3.4
5,182
5.8
8.2
12,178
7.6
11.5
17,169
13.3
Other non-Hispanic --
--
17.8
--
--
22.2
--
--
24.6 Income (household)
<$25k 28.4
33,704
32.5
27.9
32,491
31.5
29.6
34,610
29.9 $25k to < $50k 12.4
12,663
17.6
21.1
20,241
22.8
19.3
18,999
21.5
$50k + 8.4
41,762
7.4
12.5
59,710
13.0
15.1
72,564
16.9 Don't know/refused 11.1
14,619
16.1
26.1
33,315
19.0
15.3
19,201
19.6
Health Insurance (18-64) Insured 10.6
66,544
10.7
15.3
93,057
16.2
18.8
114,775
21.1
Uninsured 13.2
11,409
19.6
25.0
21,197
20.7
17.4
14,754
25.5
Source: Data from 2010 BRFSS; tabulations by Rutgers University Center for State Health Policy. Note: Data not shown (--) if the unweighted sample size for the denominator was < 50.
Note: Don't know and refused responses excluded unless > 5%, so cell sizes may not total full sample size.

43 A Community Health Needs Assessment
Table 1.5: Chronic Conditions by Individual Characteristics, Adults Ages 18+, Middlesex + Somerset Counties (M+S) and Total New Jersey (NJ)
Asthma Diabetes Heart Attack
M+S NJ
M+S NJ
M+S NJ
% Yes N
% Yes
% Yes N
% Yes
% Yes N
% Yes
Total Adult Population 11.7
98,782
13.3
7.6
64,148
9.2
2.6
22,375
3.8
Age
18-64 12.0
86,109
13.9
7.1
50,871
6.5
1.4
10,395
2.1 65+ 9.5
11,307
11.1
10.6
12,585
21.5
10.1
11,981
11.3
Gender Male 7.2
31,381
11.4
8.3
36,391
9.7
1.9
8,160
4.7
Female 16.5
67,401
15.2
6.8
27,757
8.7
3.5
14,215
2.9 Race-ethnicity
White non-Hispanic 13.5
57,560
13.2
6.2
26,482
8.1
3.4
14,734
4.2 Black non-Hispanic 19.6
18,310
15.5
8.4
7,897
14.5
1.2
1,121
4.8
Hispanic 10.8
14,873
15.6
7.9
10,910
9.5
4.0
5,494
2.1 Asian non-Hispanic 3.8
5,836
5.3
11.6
17,646
7.6
0.1
135
1.3
Other non-Hispanic --
--
14.5
--
--
8.2
--
--
3.8 Income (household)
<$25k 19.2
22,813
16.3
10.5
12,494
13.1
6.4
7,621
7.7 $25k to < $50k 15.7
16,014
14.8
2.2
2,211
12.2
5.1
5,251
5.0
$50k + 9.5
46,794
12.2
7.5
37,001
6.4
1.0
4,744
2.1 Don't know/refused 10.0
13,161
12.2
9.5
12,442
10.4
3.6
4,761
3.7
Health Insurance (18-64) Insured 11.0
69,042
14.1
6.9
43,618
6.5
1.5
9,739
2.2
Uninsured 19.8
17,067
12.9
8.4
7,253
6.4
0.8
655
1.6
Source: Data from 2010 BRFSS; tabulations by Rutgers University Center for State Health Policy. Note: Data not shown (--) if the unweighted sample size for the denominator was < 50.
Note: Don't know and refused responses excluded unless > 5%, so cell sizes may not total full sample size.

44 Rutgers Center for State Health Policy/RWJMS Family Medicine & Community Health, Dec 2012
Table 1.5: Chronic Conditions by Individual Characteristics, Adults Ages 18+, Middlesex + Somerset Counties (M+S) and Total New Jersey (NJ) (continued)
Health Problem Requiring Stroke Activity Limitation Special Equipment
M+S NJ
M+S NJ
M+S NJ
% Yes N
% Yes
% Yes N
% Yes
% Yes N
% Yes
Total Adult Population 1.2
10,458
2.4
15.5
131,077
16.9
4.9
41,365
6.6
Age
18-64 0.7
5,318
1.3
13.7
98,057
14.6
3.3
23,386
4.2 65+ 4.3
5,140
7.2
27.5
32,855
28.1
15.0
17,814
17.2
Gender Male 0.6
2,771
2.3
13.0
56,770
15.8
3.3
14,520
6.0
Female 1.9
7,687
2.5
18.1
74,307
18.0
6.5
26,845
7.1 Race-ethnicity
White non-Hispanic 2.0
8,461
2.2
20.6
88,461
18.7
6.1
25,963
6.6 Black non-Hispanic 0.7
655
4.4
10.9
10,218
18.1
8.5
7,945
10.4
Hispanic 0.3
434
1.2
12.9
17,822
12.4
3.2
4,367
4.5 Asian non-Hispanic 0.6
907
1.3
7.7
11,626
7.9
1.2
1,906
1.8
Other non-Hispanic --
--
6.6
--
--
19.1
--
--
7.2 Income (household)
<$25k 3.5
4,089
5.4
27.4
32,609
28.3
11.9
14,111
14.4 $25k to < $50k 2.6
2,693
3.1
15.8
16,192
20.4
4.3
4,466
7.9
$50k + 0.7
3,211
1.0
12.5
61,863
12.3
2.5
12,337
3.2 Don't know/refused 0.4
466
2.6
15.6
20,413
15.8
7.9
10,451
7.4
Health Insurance (18-64) Insured 0.7
4,662
1.3
13.3
83,570
14.4
3.5
22,274
4.3
Uninsured 0.8
655
1.9
16.8
14,487
16.2
1.3
1,113
3.8
Source: Data from 2010 BRFSS; tabulations by Rutgers University Center for State Health Policy. Note: Data not shown (--) if the unweighted sample size for the denominator was < 50.
Note: Don't know and refused responses excluded unless > 5%, so cell sizes may not total full sample size.

45 A Community Health Needs Assessment
Table 1.6: Medical Utilization by Individual Characteristics, Adults Ages 18+, Middlesex + Somerset Counties (M+S) and Total New Jersey (NJ)
Could Not See Doctor Has Regular Doctor Due to Cost Past Year When Last Physical Check-up
M+S NJ
M+S NJ
M+S NJ
% No N
% No
% Yes N
% Yes
>2 Years N
>2 Years
Total Adult Population 10.7
90,940
13.8
12.8
107,959
13.1
10.3
85,912
10.5
Age
18-64 12.0
86,136
15.8
14.6
104,250
15.1
11.3
79,900
11.9 65+ 2.1
2,559
5.1
2.7
3,246
4.5
4.5
5,282
4.6
Gender Male 11.3
49,347
17.2
9.5
41,362
11.8
11.3
49,179
12.5
Female 10.1
41,593
10.6
16.3
66,597
14.4
9.1
36,733
8.6 Race-ethnicity
White non-Hispanic 7.5
31,954
10.2
8.9
38,198
9.7
10.0
42,183
10.5 Black non-Hispanic 2.9
2,714
11.9
26.4
24,679
16.7
13.6
12,349
8.4
Hispanic 27.7
38,144
26.3
19.4
26,671
23.4
8.9
12,007
11.3 Asian non-Hispanic 9.4
14,299
19.6
10.0
14,910
13.0
12.1
18,355
10.7
Other non-Hispanic --
--
20.6
--
--
20.8
--
--
17.3 Income (household)
<$25k 18.2
21,698
23.1
33.5
39,592
28.7
18.9
22,007
13.4 $25k to < $50k 13.7
14,023
15.1
13.1
13,375
16.6
7.9
7,898
10.4
$50k + 9.0
44,679
9.4
7.2
35,399
6.6
9.3
45,902
9.6 Don't know/refused 8.0
10,540
16.4
15.2
19,591
13.6
7.9
10,105
10.3
Health Insurance (18-64) Insured 9.3
58,473
10.1
10.4
64,988
10.0
7.4
46,397
9.5
Uninsured 32.1
27,663
49.0
45.5
39,262
47.1
40.3
33,503
27.0
Source: Data from 2010 BRFSS; tabulations by Rutgers University Center for State Health Policy. Note: Data not shown (--) if the unweighted sample size for the denominator was < 50.
Note: Don't know and refused responses excluded unless > 5%, so cell sizes may not total full sample size.

46 Rutgers Center for State Health Policy/RWJMS Family Medicine & Community Health, Dec 2012
Table 1.7: Dental Utilization by Individual Characteristics, Adults Ages 18+, Middlesex + Somerset Counties (M+S) and Total New Jersey (NJ)
1+ Permanent Teeth When Last Dental Visit Removed Due to Decay
M+S
NJ
M+S
NJ
>1 Year N
>1 Year
% Yes N
% Yes
Total Adult Population 20.6
174,110
24.0
41.9
348,036
46.5
Age
18-64 21.7
155,081
23.6
36.5
257,926
40.2 65+ 15.1
17,875
25.9
75.8
86,950
75.6
Gender Male 22.2
96,977
24.9
40.8
176,843
47.0
Female 18.8
77,133
23.1
43.1
171,193
46.0 Race-ethnicity
White non-Hispanic 17.6
75,214
20.9
44.7
187,321
45.1 Black non-Hispanic 20.6
19,243
31.4
62.4
57,138
61.1
Hispanic 22.9
31,560
29.3
44.1
59,570
45.9 Asian non-Hispanic 28.1
42,625
23.8
19.8
29,751
33.3
Other non-Hispanic --
--
31.8
--
--
43.0 Income (household)
<$25k 36.1
42,952
42.6
63.1
74,195
60.9 $25k to < $50k 32.4
33,315
30.3
49.7
50,214
56.2
$50k + 14.9
73,339
15.7
34.3
166,962
38.0 Don't know/refused 18.7
24,503
23.8
45.1
56,665
47.6
Health Insurance (18-64) Insured 19.0
119,425
20.0
35.7
221,483
39.0
Uninsured 41.6
35,656
46.2
42.5
36,443
49.2
Source: Data from 2010 BRFSS; tabulations by Rutgers University Center for State Health Policy. Note: Data not shown (--) if the unweighted sample size for the denominator was < 50.
Note: Don't know and refused responses excluded unless > 5%, so cell sizes may not total full sample size.

47 A Community Health Needs Assessment
Table 1.8: Alcohol, Tobacco Use by Individual Characteristics, Adults Ages 18+, Middlesex + Somerset Counties (M+S) and Total New Jersey (NJ)
Binge Drinker Past 30 days (males 5+, females 4+, 1 occasion) Current Smoker
M+S
NJ
M+S
NJ
% Yes N
% Yes
% Yes N
% Yes
Total Adult Population 11.6
95,013
13.8
9.9
83,377
14.4
Age
18-64 13.2
91,392
16.1
10.6
75,483
15.9 65+ 3.1
3,621
4.1
6.0
7,202
8.0
Gender Male 13.6
57,264
17.8
10.3
44,889
15.7
Female 9.5
37,749
10.1
9.4
38,488
13.2 Race-ethnicity
White non-Hispanic 14.5
60,903
16.1
14.0
59,902
15.7 Black non-Hispanic 9.6
8,982
10.3
5.6
5,248
15.9
Hispanic 12.8
17,302
13.1
5.5
7,614
12.9 Asian non-Hispanic 4.6
6,516
3.6
5.9
8,937
5.5
Other non-Hispanic --
--
13.3
--
--
11.8 Income (household)
<$25k 10.1
11,713
11.1
12.8
15,144
22.1 $25k to < $50k 3.6
3,668
10.8
12.1
12,420
17.6
$50k + 14.9
70,785
17.3
9.8
48,294
10.6 Don't know/refused 7.0
8,847
8.8
5.7
7,519
15.0
Health Insurance (18-64) Insured 13.0
78,673
15.7
10.7
67,383
14.5
Uninsured 15.2
12,719
19.2
9.5
8,100
25.0
Source: Data from 2010 BRFSS; tabulations by Rutgers University Center for State Health Policy. Note: Data not shown (--) if the unweighted sample size for the denominator was < 50.
Note: Don't know and refused responses excluded unless > 5%, so cell sizes may not total full sample size.

48 Rutgers Center for State Health Policy/RWJMS Family Medicine & Community Health, Dec 2012
Table 1.9: Weight, Exercise by Individual Characteristics, Adults Ages 18+, Middlesex + Somerset Counties (M+S) and Total New Jersey (NJ)
Weight
Any Exercise (BMI Category) Past 30 Days
M+S NJ
M+S NJ
Overweight
Obese
Overweight
Obese
%
N
%
N
%
%
% No N
% No
Total Adult Population 35.5
286,603
22.3
179,738
36.8
24.8
27.9
236,363
26.6
Age
18-64 35.6
242,561
22.2
151,398
36.1
24.8
26.9
192,737
24.7 65+ 36.6
42,203
24.0
27,730
39.8
24.8
32.6
38,948
35.0
Gender Male 42.1
180,161
25.7
109,855
43.3
26.9
23.9
104,492
23.5
Female 28.1
106,442
18.4
69,883
30.3
22.7
32.1
131,871
29.5 Race-ethnicity
White non-Hispanic 36.6
148,801
23.9
97,219
37.2
23.7
22.4
95,919
22.5 Black non-Hispanic 45.0
37,643
23.0
19,232
34.7
33.5
23.0
21,486
31.3
Hispanic 33.9
45,174
32.1
42,703
37.7
30.6
44.9
61,955
37.8 Asian non-Hispanic 31.5
46,760
7.9
11,724
35.2
7.7
28.0
42,696
26.4
Other non-Hispanic --
--
--
--
38.5
21.0
--
--
33.6 Income (household)
<$25k 27.0
30,339
30.9
34,769
34.6
30.3
42.6
50,701
41.1 $25k to < $50k 47.8
46,986
18.9
18,550
35.7
28.2
30.0
30,798
30.6
$50k + 34.7
166,362
22.7
108,716
38.3
22.3
22.3
110,230
18.8 Don't know/refused 36.6
42,915
15.1
17,703
34.9
23.2
33.8
44,634
31.2
Health Insurance (18-64) Insured 36.3
217,611
21.8
130,981
36.4
24.2
27.8
175,183
23.2
Uninsured 30.8
24,949
25.2
20,417
35.5
28.1
20.4
17,554
34.7
Source: Data from 2010 BRFSS; tabulations by Rutgers University Center for State Health Policy. Note: Data not shown (--) if the unweighted sample size for the denominator was < 50.
Note: Don't know and refused responses excluded unless > 5%, so cell sizes may not total full sample size.
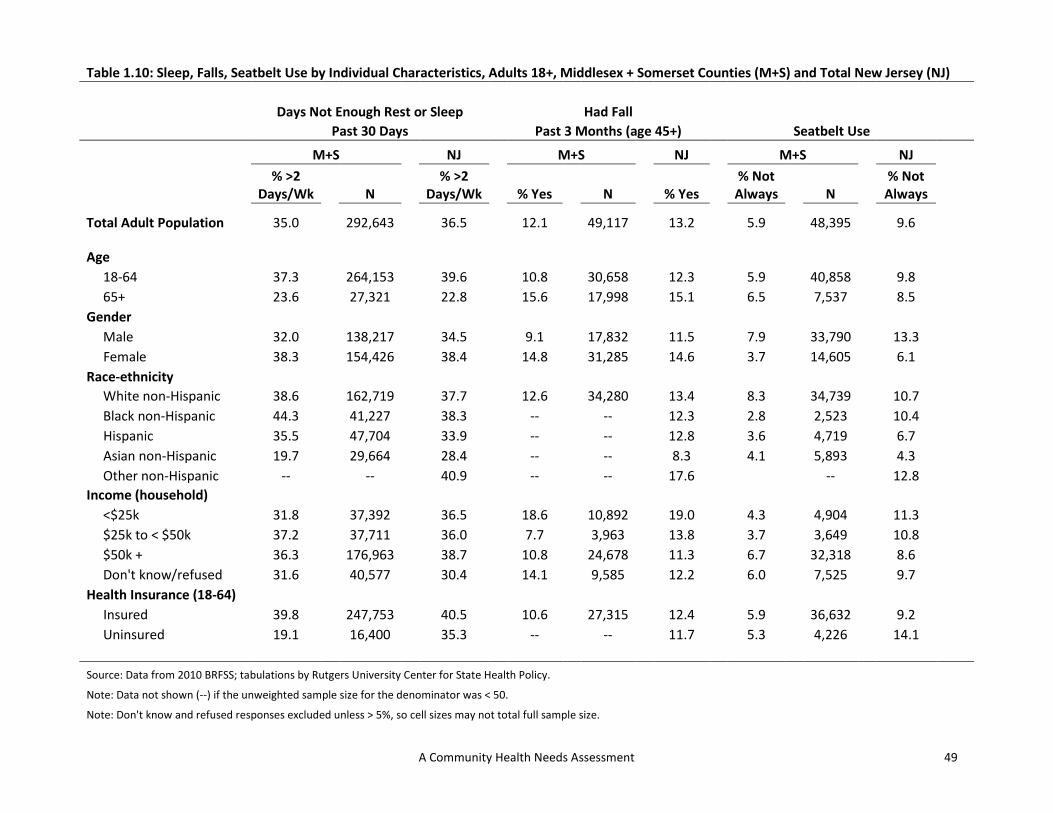
49 A Community Health Needs Assessment
Table 1.10: Sleep, Falls, Seatbelt Use by Individual Characteristics, Adults 18+, Middlesex + Somerset Counties (M+S) and Total New Jersey (NJ)
Days Not Enough Rest or Sleep
Had Fall Past 30 Days Past 3 Months (age 45+) Seatbelt Use
M+S NJ
M+S NJ
M+S NJ
% >2 Days/Wk N
% >2 Days/Wk
% Yes N
% Yes
% Not Always N
% Not Always
Total Adult Population 35.0
292,643
36.5
12.1
49,117
13.2
5.9
48,395
9.6
Age
18-64 37.3
264,153
39.6
10.8
30,658
12.3
5.9
40,858
9.8 65+ 23.6
27,321
22.8
15.6
17,998
15.1
6.5
7,537
8.5
Gender Male 32.0
138,217
34.5
9.1
17,832
11.5
7.9
33,790
13.3
Female 38.3
154,426
38.4
14.8
31,285
14.6
3.7
14,605
6.1 Race-ethnicity
White non-Hispanic 38.6
162,719
37.7
12.6
34,280
13.4
8.3
34,739
10.7 Black non-Hispanic 44.3
41,227
38.3
--
--
12.3
2.8
2,523
10.4
Hispanic 35.5
47,704
33.9
--
--
12.8
3.6
4,719
6.7 Asian non-Hispanic 19.7
29,664
28.4
--
--
8.3
4.1
5,893
4.3
Other non-Hispanic --
--
40.9
--
--
17.6
--
12.8 Income (household)
<$25k 31.8
37,392
36.5
18.6
10,892
19.0
4.3
4,904
11.3 $25k to < $50k 37.2
37,711
36.0
7.7
3,963
13.8
3.7
3,649
10.8
$50k + 36.3
176,963
38.7
10.8
24,678
11.3
6.7
32,318
8.6 Don't know/refused 31.6
40,577
30.4
14.1
9,585
12.2
6.0
7,525
9.7
Health Insurance (18-64) Insured 39.8
247,753
40.5
10.6
27,315
12.4
5.9
36,632
9.2
Uninsured 19.1
16,400
35.3
--
--
11.7
5.3
4,226
14.1
Source: Data from 2010 BRFSS; tabulations by Rutgers University Center for State Health Policy. Note: Data not shown (--) if the unweighted sample size for the denominator was < 50.
Note: Don't know and refused responses excluded unless > 5%, so cell sizes may not total full sample size.

50 Rutgers Center for State Health Policy/RWJMS Family Medicine & Community Health, Dec 2012
Table 1.11: Influenza Immunization by Individual Characteristics, Adults 18+, Middlesex + Somerset Counties (M+S) and Total New Jersey (NJ)
Flu Shot Past Year
Flu Spray Past Year
Flu Shot Past Year (all adults) (all adults) (age 65+)
M+S NJ
M+S NJ
M+S NJ
% No N
% No
% Yes N
% Yes
% No N
% No
Total Adult Population 58.3
479,077
61.8
1.1
8,952
1.3
30.2
34,981
34.3
Age
18-64 63.0
438,355
67.8
1.3
8,774
1.5
n/a
n/a
n/a 65+ 30.2
34,981
34.3
0.2
178
0.7
30.2
34,981
34.3
Gender Male 63.7
272,426
64.4
1.3
5,680
1.6
32.7
16,634
32.6
Female 52.5
206,651
59.4
0.8
3,272
1.0
28.2
18,347
35.4 Race-ethnicity
White non-Hispanic 54.3
226,322
58.1
0.7
2,942
0.8
27.6
27,025
31.4 Black non-Hispanic 58.3
54,529
66.0
0.6
605
2.5
--
--
44.4
Hispanic 63.4
84,960
71.6
0.0
0
3.0
--
--
39.6 Asian non-Hispanic 70.2
99,940
66.2
3.8
5,404
1.2
--
--
39.8
Other non-Hispanic --
--
59.4
--
--
0.2
--
--
47.0 Income (household)
<$25k 64.9
74,182
67.5
1.5
1,656
1.9
41.4
9,742
41.9 $25k to < $50k 65.8
66,494
60.7
0.0
0
1.6
28.4
6,734
32.1
$50k + 57.8
278,137
60.9
1.1
5,377
1.1
24.7
9,601
30.0 Don't know/refused 48.2
60,263
59.9
1.5
1,919
1.1
29.8
8,904
33.9
Health Insurance (18-64) Insured 61.1
374,144
64.9
1.4
8,774
1.6
n/a
n/a
n/a
Uninsured 77.3
63,717
84.3
0.0
0
0.6
n/a
n/a
n/a
Source: Data from 2010 BRFSS; tabulations by Rutgers University Center for State Health Policy. Note: Data not shown (--) if the unweighted sample size for the denominator was < 50.
Note: Don't know and refused responses excluded unless > 5%, so cell sizes may not total full sample size.

51 A Community Health Needs Assessment
Table 1.12: Women's Health by Individual Characteristics, Adults 18+, Middlesex + Somerset Counties (M+S) & Total New Jersey (NJ)
Mammogram Past 2 Years
Pap Test Past 3 Years
Had Hysterectomy (women age 50+) (women age 18+) (women 18+)
M+S NJ
M+S NJ
M+S NJ
% No N
% No
% No N
% No
% Yes N
% Yes
Total Adult Population 20.2
31,735
21.4
14.4
46,447
15.9
14.6
55,616
15.0
Age
18-64 18.5
17,124
18.3
11.2
31,586
12.4
10.2
31,461
9.8 65+ 22.6
14,612
25.2
35.7
14,861
35.1
33.6
21,960
34.0
Gender Male n/a
n/a
n/a
n/a
n/a
n/a
n/a
n/a
n/a
Female 20.2
31,735
21.4
14.4
46,447
15.9
14.6
55,616
15.0 Race-ethnicity
White non-Hispanic 25.5
30,435
22.3
17.2
31,528
15.5
17.1
37,115
15.0 Black non-Hispanic --
--
18.9
--
--
13.1
--
--
21.0
Hispanic --
--
19.3
6.2
3,469
15.7
10.0
6,214
12.2 Asian non-Hispanic --
--
17.7
--
--
24.5
4.6
2,395
7.4
Other non-Hispanic --
--
23.5
--
--
22.5
--
--
11.3 Income (household)
<$25k 24.5
8,634
33.0
22.8
11,793
26.6
23.2
14,575
20.4 $25k to < $50k 23.0
5,343
23.1
19.4
8,210
18.0
14.7
7,331
18.3
$50k + 16.1
11,659
14.8
8.3
15,382
8.4
9.0
18,311
10.5 Don't know/refused 23.3
6,099
20.5
26.0
11,063
25.7
23.9
15,399
18.0
Health Insurance (18-64) Insured 18.4
16,450
15.9
8.1
20,186
9.9
11.1
30,777
10.1
Uninsured --
--
44.5
--
--
28.6
--
--
7.9
Source: Data from 2010 BRFSS; tabulations by Rutgers University Center for State Health Policy. Note: Data not shown (--) if the unweighted sample size for the denominator was < 50.
Note: Don't know and refused responses excluded unless > 5%, so cell sizes may not total full sample size.
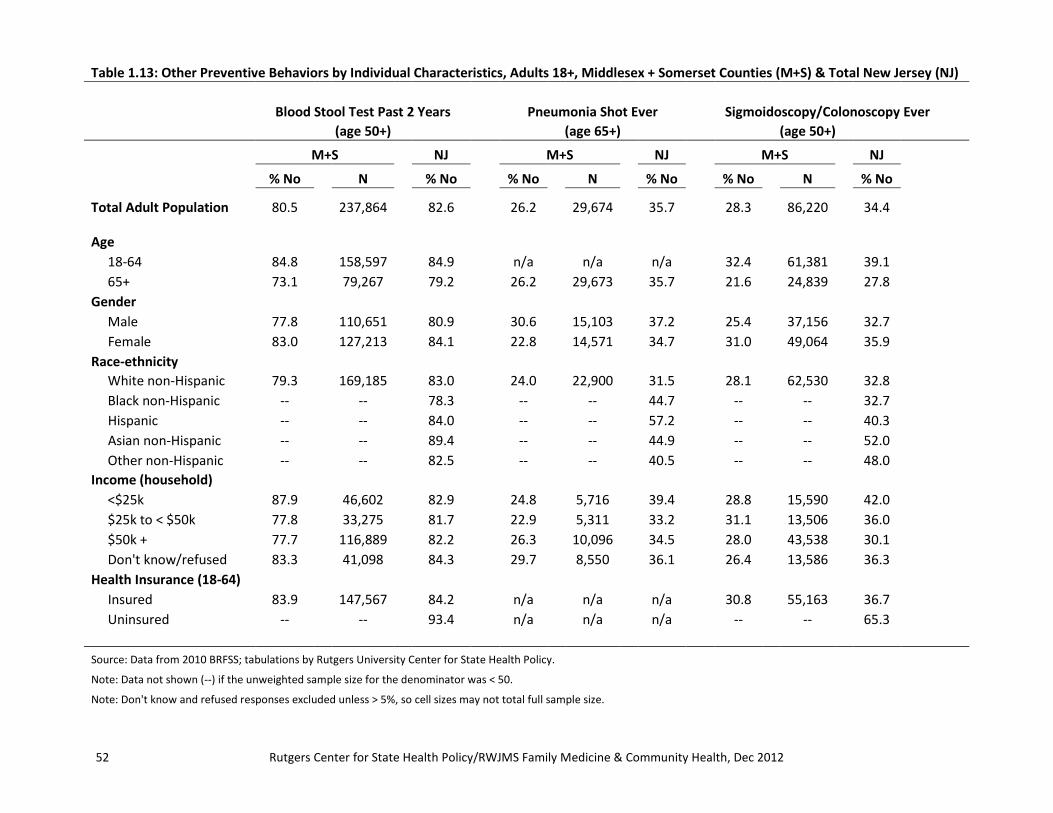
52 Rutgers Center for State Health Policy/RWJMS Family Medicine & Community Health, Dec 2012
Table 1.13: Other Preventive Behaviors by Individual Characteristics, Adults 18+, Middlesex + Somerset Counties (M+S) & Total New Jersey (NJ)
Blood Stool Test Past 2 Years
Pneumonia Shot Ever Sigmoidoscopy/Colonoscopy Ever (age 50+) (age 65+) (age 50+)
M+S NJ
M+S NJ
M+S NJ
% No N
% No
% No N
% No
% No N
% No
Total Adult Population 80.5
237,864
82.6
26.2
29,674
35.7
28.3
86,220
34.4
Age
18-64 84.8
158,597
84.9
n/a
n/a
n/a
32.4
61,381
39.1 65+ 73.1
79,267
79.2
26.2
29,673
35.7
21.6
24,839
27.8
Gender Male 77.8
110,651
80.9
30.6
15,103
37.2
25.4
37,156
32.7
Female 83.0
127,213
84.1
22.8
14,571
34.7
31.0
49,064
35.9 Race-ethnicity
White non-Hispanic 79.3
169,185
83.0
24.0
22,900
31.5
28.1
62,530
32.8 Black non-Hispanic --
--
78.3
--
--
44.7
--
--
32.7
Hispanic --
--
84.0
--
--
57.2
--
--
40.3 Asian non-Hispanic --
--
89.4
--
--
44.9
--
--
52.0
Other non-Hispanic --
--
82.5
--
--
40.5
--
--
48.0 Income (household)
<$25k 87.9
46,602
82.9
24.8
5,716
39.4
28.8
15,590
42.0 $25k to < $50k 77.8
33,275
81.7
22.9
5,311
33.2
31.1
13,506
36.0
$50k + 77.7
116,889
82.2
26.3
10,096
34.5
28.0
43,538
30.1 Don't know/refused 83.3
41,098
84.3
29.7
8,550
36.1
26.4
13,586
36.3
Health Insurance (18-64) Insured 83.9
147,567
84.2
n/a
n/a
n/a
30.8
55,163
36.7
Uninsured --
--
93.4
n/a
n/a
n/a
--
--
65.3
Source: Data from 2010 BRFSS; tabulations by Rutgers University Center for State Health Policy. Note: Data not shown (--) if the unweighted sample size for the denominator was < 50.
Note: Don't know and refused responses excluded unless > 5%, so cell sizes may not total full sample size.

53 A Community Health Needs Assessment
Table 1.13: Other Preventive Behaviors by Individual Characteristics, Adults 18+, Middlesex + Somerset Counties (M+S) & Total New Jersey (NJ) (continued)
PSA Test Past 2 Years
HIV Test Ever (men age 40+) (ages 18-64)
M+S
NJ
M+S
NJ
% No N
% No
% No N
% No
Total Adult Population 46.7
111,519
41.8
57.0
380,447
56.1
Age
18-64 54.3
103,411
49.5
57.0
380,447
56.1 65+ 16.7
8,109
18.6
n/a
n/a
n/a
Gender Male 46.7
111,519
41.8
56.4
201,317
61.0
Female n/a
n/a
n/a
57.8
179,130
51.2 Race-ethnicity
White non-Hispanic 35.9
47,534
38.0
64.5
193,571
61.4 Black non-Hispanic --
--
41.8
48.1
40,581
38.3
Hispanic --
--
51.6
40.3
51,135
47.4 Asian non-Hispanic --
--
67.2
63.8
81,323
64.8
Other non-Hispanic --
--
41.6
--
--
56.0 Income (household)
<$25k --
--
48.5
46.6
40,343
47.8 $25k to < $50k --
--
43.2
54.5
39,188
53.3
$50k + 44.3
62,578
40.1
55.7
235,143
57.0 Don't know/refused 56.0
22,589
41.1
76.0
65,772
65.1
Health Insurance (18-64) Insured 51.8
86,682
46.6
57.2
335,567
56.6
Uninsured --
--
72.3
55.7
44,387
52.3
Source: Data from 2010 BRFSS; tabulations by Rutgers University Center for State Health Policy. Note: Data not shown (--) if the unweighted sample size for the denominator was < 50.
Note: Don't know and refused responses excluded unless > 5%, so cell sizes may not total full sample size.

54 Rutgers Center for State Health Policy/RWJMS Family Medicine & Community Health, Dec 2012
Chapter 2: Avoidable Hospitalizations and Emergency Department Visits: An Analysis of Hospital Discharge Data
Introduction In this chapter, we examine rates of specific inpatient hospitalizations and treat-and-release emergency department (ED) visits by patients that could have been avoided or prevented if these patients had adequate availability of primary care within their communities. We use the all-payer New Jersey uniform billing hospital data to calculate geographic area-level rates of such avoidable hospitalizations and ED visits to assess the extent of primary care available within communities. We examine these within the combined service areas of hospitals (comprising all of Middlesex County along with the townships of Somerset and Franklin Park from Somerset County) and compare to New Jersey overall. We also examine these rates by patient characteristics including age, gender, race/ethnicity and health insurance payer, examine payer, racial, age and gender distribution of avoidable visits, and also illustrate variation in these rates among townships within the hospital’s overall service area. Avoidable hospitalizations have been widely used in previous research to measure access to primary care and disparities in health outcomes (Billings et al. 1993; Basu, Friedman, and Burstin 2004; Bindman et al. 1995; Howard et al. 2007). These hospitalizations can be used to identify unmet community health care needs since these conditions can be avoided by high quality community based primary care (AHRQ 2012a). Based on easily available hospital discharge data, they allow public health agencies, provider/payer systems, and others interested to assess the health care quality in their communities (AHRQ 2012a) and subsequently devise targeted interventions to address gaps. The avoidable/preventable ED visits are also similarly used for identifying gaps in care, but they utilize outpatient, treat-and-release visits that do not result in an overnight hospital stay (Billings, Parikh, and Mijanovich 2000). The methods used here have been applied successfully in several other studies (DeLia 2006; Ballard et al. 2010) and are included in Agency for Healthcare Research and Quality (AHRQ) toolkit for monitoring the healthcare safety net (Billings 2003). Avoidable Hospitalizations: To calculate rates of avoidable hospitalizations (that could have been avoided with sufficient primary care availability), we use a methodology created by the

55 A Community Health Needs Assessment
AHRQ that calculates area-level rates of hospitalizations due to ambulatory care sensitive (ACS) conditions such as asthma or congestive heart failure. As the name suggests, ACS hospitalizations could occur due to insufficient access or poor quality of ambulatory care within the community. AHRQ provides the necessary analytic methodology and clinical information to construct rates of ACS hospitalizations in the population (see methods section for details). The rates constructed on the basis of these methods are known as ‘Prevention Quality Indicators’ (PQI) and we will use this term in this chapter to refer to rates of avoidable hospitalizations. Avoidable Emergency Department Visits: In order to construct rates of preventable/avoidable ED visits, we use an algorithm to assess access to primary care within the primary services areas of the two hospitals. Similar in concept to the Prevention Quality Indicators, these avoidable ED rates are calculated from treat-and-release ED visits that could have been treated in a primary care setting or avoided if the patient had sufficient access to timely and effective primary care. The algorithm was created by researchers from the New York University (NYU) Center for Health and Public Service Research. Details regarding the different categories of these ED visits are provided below in the methods section.
Methods Avoidable Hospitalizations: We use the AHRQ created Prevention Quality Indicators (PQI) which represent rates of avoidable ACS hospitalizations. These ACS hospitalizations are for certain chronic or acute conditions such as diabetes, COPD, angina, heart failure etc., that could have been potentially avoided with adequate level of primary care. We utilize an AHRQ defined overall PQI composite measure that is used to assess the overall rate of potentially avoidable hospitalizations. The individual PQIs are based on rates of hospitalizations for individual conditions. The composite indicator, constructed from the individual condition specific PQIs should be interpreted as the number of discharges indicating any one of the ACS conditions per unit of population in an area. This overall composite measure can be subdivided into an acute as well as a chronic composite measure depending on the nature of the conditions. Detailed methods on calculating the prevention quality indicators (PQIs) can be found at http://www.qualityindicators.ahrq.gov/modules/pqi_resources.aspx and we follow these methods. Appendix 2.B gives a list of all the ACS conditions while Appendix 2.C lists the constituents of the three composite indicators (overall, acute and chronic). While we at places report the rates of individual disease specific conditions and all three composites (overall, chronic and acute), our focus is on the overall composite measure since it gives a comprehensive measure of primary care access within the community and is thus the most useful for making comparisons between different geographic areas. The AHRQ Prevention Quality Indicators are assessed for age groups 18 years and above. As a separate analysis, we

56 Rutgers Center for State Health Policy/RWJMS Family Medicine & Community Health, Dec 2012
report selected rates based on Pediatric Quality Indicators that focus on rates of avoidable hospitalizations within the younger population. Avoidable Emergency Department Visits: Rates of avoidable ED visits are calculated utilizing a detailed algorithm and programming available at http://wagner.nyu.edu/faculty/billings/nyued -background.php. The New York University Center for Health and Public Service Research (based on advice from a panel of ED and primary care physicians) initially developed an algorithm to classify ED utilization based on information from full medical records. ED utilization was classified into a) Non-emergent: immediate medical care was not required within 12 hours; b) Emergent/Primary Care Treatable: treatment was required within 12 hours, but could have been provided in a primary care setting; c) Emergent – ED Care Needed –Preventable/Avoidable: ED care was needed but the emergent nature of the condition was potentially avoidable if timely ambulatory care had been received; d) Emergent – ED Care Needed – Not Preventable/Avoidable: ED care was required and ambulatory care treatment could not have prevented the condition. Only, the first three categories are considered avoidable. Detailed definitions of these classifications are provided with examples in Appendix 2.D. For hospital discharge data, the information in billing records is not sufficient to place ED visits directly into these categories. Therefore, the algorithm uses diagnosis codes from discharge records to impute the probability of a visit belonging to each of these categories. The sum of the probabilities of a visit belonging to the first three categories is the measure of it being avoidable if there was sufficient primary care access within the community. The algorithm allows calculation of these rates for patients of all ages. Data and Analysis: We calculate the above-mentioned area-level rates of avoidable hospitalizations and ED visits for the hospitals’ primary service area and New Jersey overall by using hospital inpatient discharges and ED visits over the period 2008-2010. Pooling of discharges/visits across multiple years ensures stable and reliable rates. For calculating geographic area-level measures, only those discharges with valid zip codes having non-zero population can be used. This zip code information including each zip code’s 2010 population is available from Nielsen Claritas. For PQI/avoidable hospitalization rates, which are applicable for adult populations, we take population in the age range 18 and above as the relevant denominator. For avoidable ED visit rates which are assessed for all ages, we take total population as the denominator for calculating population based rates. We report two other categories of measures. We examine the distribution of patient and payer characteristics within all avoidable hospitalizations and ED visits. We also examine percentages of avoidable hospitalizations and ED visits out of all hospitalizations and ED visits stratified by patient characteristics (age, gender, race) and payer type. All these are assessed for the primary service area of the hospitals that for the purposes of this analysis comprise all of Middlesex county and

57 A Community Health Needs Assessment
the townships of Somerset and Franklin Park from Somerset County (see Appendix 2.A for the complete list of towns and zip codes). We calculate avoidable hospitalizations and ED visits for individual towns within the primary service areas of the hospitals as well as the aggregated combined service area. We compare these to the benchmark New Jersey overall rate. For computing hospitalization/ED visit measures for different geographic areas, the relevant geographic identifier is patient residence, not the location of the hospital where discharge occurred (AHRQ 2012b). The measures for an area are thus based on avoidable hospitalizations and ED visits for patients residing in that area, but the discharge may be from any hospital even those outside that area.
Findings Tables 2.1-2.13 at the end of the chapter contain rates of avoidable hospitalizations and emergency department visits – overall and by patient and payer characteristics, and also distribution of these characteristics for avoidable hospitalizations and ED visits. Charts 2.1-2.10 interspersed within the text highlight some of the overall findings. The tables are followed by appendices 2.A-2.D which contain details related to the data and methods discussed above.
Overall Rates of Avoidable Visits Table 2.1 utilizes the overall Prevention Quality Indicator (PQI) composite measure to examine rates of avoidable hospitalization for adults. It also examines rates of avoidable ED visits for children as well as adults. Higher rates suggest lower access to primary care.
• For the combined service area of the hospitals, the rate of avoidable hospitalizations (calculated for adults of age 18 or older) was 1.43 per 100 population, lower than the 1.73 rate for New Jersey overall (also see Figure 2.1).
• Avoidable hospitalization rates varied from a low of 0.45 in Plainsboro to a high of 2.48 in Keasbey.
• For avoidable ED visits (all ages) - the combined hospital service area had a rate of 12.49 per 100 population, lower than the benchmark New Jersey rate of 14.62 (also see Figure 2.2). Avoidable ED visit rates ranged from a low of 5.34 in Kendall Park to a high of 32.72 in New Brunswick.
• Within the non-adult population (age<18 years) the combined service area had a slightly higher avoidable ED visit rate (16.16) than NJ (16.05). This was more than offset by the lower rate within the adult population of the combined service area (11.39 v 14.18).

58 Rutgers Center for State Health Policy/RWJMS Family Medicine & Community Health, Dec 2012
Table 2.2 examines rates of all hospitalizations and all ED visits out of total population. It further examines avoidable hospitalizations and ED visits as a percentage of all hospitalizations and ED visits.
• Rates of all hospitalizations (per 100 population) were 12.15 and 13.32 for the combined service area and NJ respectively.
• Rates of all ED visits (per 100 population) were 26.24 and 31.14 for the combined service area and NJ respectively.
• The percentage of avoidable hospitalizations (out of all hospitalizations) was lower and the percentage of ED visits (out of all ED visits) was higher for the combined service area compared to NJ overall (11.78% v 12.97% and 47.61% v 46.94% respectively).
1.73 1.43
0.00
0.50
1.00
1.50
2.00
2.50
New Jersey Hospital Service Area
14.62 12.49
0.00
4.00
8.00
12.00
16.00
20.00
New Jersey Hospital Service Area
Figure 2.1: Avoidable Hospitalization Rate (per 100 population)
Note: Numerator: Average annual visits over 2008-10 Denominator: 2010 population from Nielsen Claritas.
Figure 2.2: Avoidable ED Visit Rate (per 100 population)
Note: Numerator: Average annual visits over 2008-10 Denominator: 2010 population from Nielsen Claritas.

59 A Community Health Needs Assessment
Table 2.3 examines the acute and the chronic composite measures (see appendix 2C for the specific conditions) for avoidable hospitalizations that make up the overall composite measure.
• The acute and the chronic PQI rates for the combined service area were 0.53 and 0.90 per 100 population.
• The acute and chronic PQI rates for NJ overall were lower: 0.63 and 1.10 respectively. Table 2.4 reports the individual PQI measures (avoidable hospitalizations for individual conditions) as detailed in appendix 2.B.
• Within the combined service area of the hospitals, the highest rates of avoidable hospitalization were for the conditions - chronic obstructive pulmonary disease (COPD)/asthma in older adults and congestive heart failure (CHF) (0.42 and 0.36 per 100 population)
• For overall NJ, both rates were higher: COPD/asthma was at 0.52 per 100 population while CHF was at 0.41 per 100 population
Table 2.5 reports overall rates of avoidable ED visits as well as the type of visit based on the classification scheme mentioned earlier (also see Figure 2.3).
• Rate of avoidable ED visits per 100 population was 12.49 and 14.62 in the hospital service area and NJ overall respectively.
• Within the hospital service area we examined avoidable ED visits based on whether they were a) Non-emergent; b) Emergent/Primary Care Treatable; c) Emergent/ED care Needed/Preventable/Avoidable. Rates of ED visits based on these respective categories were 5.41, 5.67 and 1.42 per 100 population.
• The corresponding rates for NJ overall were higher at 6.39, 6.46, and 1.76, respectively.

60 Rutgers Center for State Health Policy/RWJMS Family Medicine & Community Health, Dec 2012
Distribution of Avoidable Visits: Patient and Payer Characteristics Tables 2.6-2.9 characterize the avoidable hospitalizations and ED visits by examining distribution of patient and payer characteristics for these avoidable visits. Examining the demographic/payer characteristics of specifically those patients who had avoidable hospitalizations/ED visits may inform interventions within areas which experience high rates signifying barriers in access to care. Tables 2.6a and 2.6b (and also Figure 2.4) examine the payer distribution of avoidable hospitalizations and ED visits. This answers questions such as: out of those hospitalizations that were found to be avoidable, what percentage were Medicare paid, what percentage were Medicaid paid and so on.
• The payer distribution for avoidable hospitalizations, as well as avoidable ED visits was similar between NJ overall and the hospital service area (see Table 2.6a and Figure 2.4).
• For the hospital service area, the majority (62.33%) of avoidable hospitalizations was Medicare-paid and more than a quarter (25.87%) was paid for by private insurance.
• While the dominant payer was Medicare, there was substantial variation across towns in the percentage of avoidable hospitalizations paid by Medicare. This varied from 40.60% in Dayton to 79.86% in Monroe Township; some of this variation was likely
14.62 12.49
6.39 5.41 6.46 5.67
1.76 1.42
0.00
5.00
10.00
15.00
20.00
25.00
30.00
All NJ Hospital Service Area
All Avoidable ED visits Non-Emergent
Emergent/PC Treatable Emergent/ED needed/Avoidable
Figure 2.3: Rates and Composition of Avoidable ED Visits (per 100 population)
Note: Numerator: Average annual visits over 2008-10 Denominator: 2010 population from Nielsen Claritas.

61 A Community Health Needs Assessment
driven by the age distribution within these avoidable hospitalizations (See Table 2.6a for these details).
• The payer distribution for avoidable ED visits was strikingly different from the above (Table 2.6b and Figure 2.4). The majority of the avoidable ED visits were private insurance-paid (53.33% for the combined hospital service area and 47.56% for NJ overall).
• Next to private pay, visits from self-pay/uninsured patients comprised the highest percentage of avoidable ED visits. This was 22.22% for the combined service area and 23.63% for NJ overall.
• The high percentage of self-pay patients among avoidable ED visits highlights the significant barriers to primary care that are faced by the uninsured population who subsequently visit the ED.
• The higher percentage of Medicare-paid discharges within avoidable hospitalizations suggests patients for whom barriers in access resulted in a hospitalization primarily constituted the elderly.
Table 2.7 examines the age distribution of avoidable hospitalizations and ED visits.
• The majority of the avoidable hospitalizations were by the elderly (age 65+) as the results above (relating to Medicare being a primary payer) had suggested.
62.3% 62.9%
10.1% 11.5%
3.2% 4.8%
11.8% 14.7%
25.9% 23.2%
53.3% 47.6%
7.7% 8.4% 22.2% 23.6%
0%
20%
40%
60%
80%
100%
HSA-Avoidable Hospitalizations
NJ-Avoidable Hospitalizations
HSA-Avoidable ED NJ-Avoidable ED
Other
Self-Pay
Private
Medicaid
Medicare
Figure 2.4: Payer Distribution of Avoidable Hospitalizations and ED Visits
Note: HSA: Hospital service area; visits assessed over 2008-2010.

62 Rutgers Center for State Health Policy/RWJMS Family Medicine & Community Health, Dec 2012
• For the combined hospital service area, 61.89% of the discharges representing an avoidable hospitalization was by an elderly person. The corresponding percentage for NJ overall was 60.94%.
• Those who had an avoidable ED visit were less likely to be elderly and more likely to be in the age group 18-39. The percentages of avoidable ED visits that were in this latter age group for the combined hospital service area and NJ overall were 36.64% and 37.73% respectively.
Table 2.8 examines the gender distribution of avoidable hospitalizations and ED visits.
• There was little difference in the gender distribution between the hospital service area and NJ overall.
• For avoidable hospitalizations, the percentage of females were slightly lower for the hospital service area (55.19%) compared to NJ overall (55.86%).
• Similarly for avoidable ED visits, the percentage of females were slightly lower for the hospital service area (58.98%) compared to NJ overall (59.18%).
Tables 2.9a and 2.9b (along with Figure 2.5) examine the race/ethnicity distribution of avoidable hospitalizations and ED visits.
• Within the combined hospital service area, the majority of the avoidable hospitalizations comprised patients who were white (67.33%) followed by blacks (13.08%) and Hispanics (10.94%) (see Table 2.9a and Figure 2.5).
• This was similar to the percentage composition of avoidable hospitalizations for NJ overall for white and Hispanics, but not blacks: - whites comprised 64.07% of avoidable hospitalizations and Hispanics comprised 10.21%, but the percentage of avoidable hospitalizations that constituted blacks was considerably higher in NJ (20.16%) than in the service area (13.08%).
• The racial and ethnic distribution of avoidable ED visits is markedly different from those for avoidable hospitalizations (See Table 2.9b and Figure 2.5). The percentage of whites decreases (35.79% for hospital service area and 41.67% for NJ overall), while the percentage of Hispanics increases sharply to 31.98% for hospital service area and 22.45% for NJ overall.
• The composition of minority patients among avoidable ED visits is different for the hospital service area compared to NJ overall.
o Hispanics comprised the largest segment of minority patients with avoidable ED visits (31.98%) for the combined hospital service area. In fact, this was only marginally lower than the percentage for whites (35.79%).
o For NJ overall, blacks accounted for the largest proportion of avoidable ED visits by minorities (27.89%) followed by Hispanics at 22.45%.

63 A Community Health Needs Assessment
Avoidable Visits Stratified by Patient and Payer Characteristics Tables 2.10-2.12 report percentages of avoidable hospitalizations and ED visits out of all hospitalizations and ED visits during 2008-2010 stratified by patient demographics and payer type. (also see Figures 2.6-2.9 for stratification of these rates by payer category and patient race). These inform us as to which patient groups (based on demographic characteristics and insurance type) have the greatest likelihood of facing barriers to care within the community. This in turn allows better targeting of interventions to vulnerable and high need patient groups.
• For the combined hospital service area, the percentage of avoidable hospitalizations were highest within Medicare-paid hospitalizations -out of all hospitalizations that were Medicare paid, 17.0% were deemed avoidable. This was followed by hospitalizations that belonged to payer type uninsured/self pay (11.0%) (See Table 2.10a and Figure 2.6).
• For NJ overall, the percentages of Medicare and self pay inpatient discharges that were avoidable were similar to the service area, but slightly higher (18.09% and 11.19% respectively).
• For avoidable ED visits (see Table 2.10b and Figure 2.7), unlike avoidable hospitalizations, Medicaid-paid visits had the highest percentage of avoidable visits (58.08% of Medicaid paid visits in the service area and 55.88% in NJ were avoidable).
• The next highest group for avoidable ED visits was again the self pay/uninsured group (49.83% for the combined hospital area and 49.91% for the state).
67.3% 64.1%
35.8% 41.7%
13.1% 20.2%
18.6%
27.9%
10.9% 10.2%
32.0%
22.5%
8.7% 5.6% 13.7% 8.0%
0%
20%
40%
60%
80%
100%
HSA-Avoidable Hospitalizations
NJ-Avoidable Hospitalizations
HSA-Avoidable ED NJ-Avoidable ED
Other
Hispanic
Black
White
Figure 2.5: Race-Ethnicity Distribution of Avoidable Hospitalizations and ED Visits
Note: HSA: Hospital service area; visits assessed over 2008-2010.

64 Rutgers Center for State Health Policy/RWJMS Family Medicine & Community Health, Dec 2012
17.0%
7.2% 7.4% 11.0%
5.0%
18.1%
8.8% 8.3% 11.2%
5.2%
0%
20%
40%
60%
80%
Medicare Medicaid Private Self-Pay Other
Hospital Service Area NJ
41.8%
58.1%
48.8% 49.8%
21.9%
42.5%
55.9%
47.0% 49.9%
23.6%
0%
20%
40%
60%
80%
Medicare Medicaid Private Self-Pay Other
Hospital Service Area NJ
Figure 2.6: Percent of Avoidable Hospitalizations by Payer
Note: Visits assessed over 2008-2010.
Figure 2.7: Percent of Avoidable ED Visits by Payer
Note: Visits assessed over 2008-2010.

65 A Community Health Needs Assessment
Tables 2.11a and Figure 2.8 examine percentages of avoidable hospitalizations among all hospitalizations characterized by race/ethnicity. Similarly Table 2.11b and Figure 2.9 examine percentages of avoidable ED visits among all ED visits characterized by race/ethnicity.
• Percentage of avoidable hospitalizations out of all hospitalizations was highest for black patients (13.82% for the hospital service area and 15.72% for NJ overall) (see Table 2.11a and Figure 2.8).
• This was followed by whites: 12.88% for the hospital service area and 12.95% for NJ overall.
• For the hospital service area, the highest percentages of avoidable ED visits out of all ED visits were for Hispanic and black patients-(56.31% and 52.78% respectively) (see Table 2.11b and Figure 2.9).
• New Brunswick had the highest percentage of avoidable ED visits out of all ED visits in the Hispanic population at 59.32%.
• The percentages of avoidable ED visits (out of all ED visits) for NJ overall were similar, although slightly lower than the combined service area for Hispanics (54.42% v 56.31%) and slightly higher for blacks (54.14% v 52.78%).
• These findings point to racial disparities in access to care within the combined service area as well as NJ overall: being a minority patient increased the likelihood of the ED visit being avoidable.
12.9% 13.8% 10.2%
7.0% 13.0% 15.7%
11.7% 9.2%
0%
20%
40%
60%
80%
White Black Hispanic Other
Hospital Service Area NJ
Figure 2.8: Percent of Avoidable Hospitalizations by Race
Note: Visits assessed over 2008-2010.

66 Rutgers Center for State Health Policy/RWJMS Family Medicine & Community Health, Dec 2012
Table 2.12a examines percentages of avoidable hospitalizations out of all hospitalizations characterized by age and gender. Similarly Table 2.12b examines percentages of avoidable ED visits out of all ED visits characterized by age and gender.
• Avoidable hospitalizations comprised a higher percentage of all hospitalizations for male patients than for female patients in the combined hospital service area as well as NJ overall (see Table 2.12a).
• Examining hospitalizations categorized by age, we find that the percentage of avoidable hospitalizations was highest out of hospitalizations by the elderly population.
• 13.32% of hospitalizations by male patients, 10.77% of hospitalizations belonging to female patients, and 16.84% of hospitalizations belonging to patients in the age group 65 and above were avoidable hospitalizations (for the combined service area).
• Avoidable ED visits showed a different trend for both gender and age (See Table 2.12b). The percentage of avoidable ED visits out of all ED visits was higher for female patients (51.90%) relative to male patients (42.55%) for the combined service area. It was also the highest for the age group of 18-39 (49.36%).
40.3%
52.8% 56.3%
46.8% 40.2%
54.1% 54.4% 47.8%
0%
20%
40%
60%
80%
White Black Hispanic Other
Hospital Service Area NJ
Figure 2.9: Percent of Avoidable ED Visits by Race
Note: Visits assessed over 2008-2010.

67 A Community Health Needs Assessment
Avoidable Pediatric Hospitalizations Tables 2.13 and Figure 2.10 report AHRQ Pediatric Quality Indicators (PDIs) that assess access to and quality of ambulatory care in a given area (Battelle 2012) by examining an overall composite rate for avoidable pediatric hospitalizations. Due to the comparatively fewer number of discharges, we are not able to calculate rates for individual cities and the reported rates must be interpreted with caution. Here, we examine overall rates for the combined service area and compare to overall NJ as benchmark.
• The overall composite rate of avoidable pediatric hospitalizations within the service area of the hospitals was 2.0 per 1000 population - similar to that of NJ overall which was 1.9 per 1000 population.
• There was no difference in avoidable hospitalizations as a percentage of all pediatric hospitalizations between the combined service area and NJ overall (11.49%).
• The majority of the avoidable pediatric hospitalizations were private insurance-paid (77.89% for the combined service area and 71.91% for NJ overall).
• The racial distribution of avoidable hospitalizations within the combined service area was different from NJ overall. Hispanics comprised a higher percentage of avoidable pediatric hospitalizations compared to blacks within the combined hospital service area (26.26% v 19.72%). Whites comprised 39.07% of avoidable hospitalizations. For NJ overall, Hispanics accounted for a lower percentage of avoidable hospitalizations compared to blacks (22.46% v 27.62%). Whites comprised 40.55% of the avoidable hospitalizations.
11.5% 10.7% 13.8% 13.5% 8.8%
11.5% 9.2% 16.6% 14.0%
9.1%
0%
20%
40%
60%
80%
Overall White Black Hispanic Other
Hospital Service Area NJ
Figure 2.10: Percent of Avoidable Hospitalization among Pediatric Hospitalizations - Overall and by Race
Note: Visits assessed over 2008-2010.

68 Rutgers Center for State Health Policy/RWJMS Family Medicine & Community Health, Dec 2012
We also examined percentage of avoidable hospitalizations stratified by payer type and race. This is information such as - what was the percentage of avoidable hospitalizations among all pediatric hospitalizations by black patients or hospitalizations where Medicaid was the primary payer (see Figure 2.10).
• Medicaid-paid pediatric hospitalizations had the highest percentage of avoidable hospitalizations: 16.20% for the combined hospital service area and 12.46% for NJ overall. 10.98% of all private insurance-paid hospitalizations in the hospital service area were avoidable hospitalizations. 11.53% of private-insurance paid hospitalizations in NJ overall were avoidable hospitalizations.
• Hospitalizations belonging to o black children had the highest likelihood of being avoidable (13.80% for the
hospital service area compared to 16.62% for NJ overall); o followed by those belonging to Hispanic children (13.53% for the combined
hospital service area and 13.96% for NJ overall); o and white children (the percentages were 10.72% for the hospital service area
and 9.22% for NJ overall).
Conclusions In this chapter we examined rates of avoidable hospitalizations and ED visits calculated using methodologies provide by AHRQ and New York University Center for Health and Public Service Research and based on New Jersey Uniform Billing hospital discharge data. These are conditions that could have been avoided with ‘high quality community-based primary care’ (AHRQ 2012a). These thus inform us as to the availability of primary care and more generally the quality of community level health services within the combined service area of the hospitals. We further examine the distribution as well as stratify these rates of avoidable hospitalizations and ED visits by patient and health insurance payer characteristics. These sub-group analysis shed light on the composition of patients facing barriers to ambulatory care as well as those who are at the highest risk of facing access problems. Information on these patient and payer characteristics can then help in developing interventions and can also be used to assess how emerging policy initiatives at the state and federal levels will impact these problems. Our results indicate that population-based rates of avoidable hospitalizations and ED visits are lower for the combined service area of the hospitals compared to NJ overall, suggesting higher access to health care resources that ensure adequate primary care. Some of the more granular findings are informative to policy. Outside of Medicare patients, self-pay/uninsured patients had the highest rate of avoidable hospitalizations within the combined service area (11%). For

69 A Community Health Needs Assessment
ED visits within the service area of the hospitals, Medicaid-paid ED visits had the highest percentage of avoidable visits (58.08%) followed by ED visits with payer type self-pay /uninsured (49.83%). For NJ overall too, the payer category with the highest percentage of avoidable ED visits was Medicaid (55.88%) followed by self pay/uninsured (49.91%). These high rates for self-pay patients highlight the significant barriers to primary care that is faced by the uninsured population who subsequently visit the ED. There are several provisions within the Affordable Care Act that are expected to decrease the number of uninsured. These are the mandatory health insurance provision, the provision for Medicaid eligibility expansion to 133% of the Federal Poverty Line and the setting up of health insurance exchanges that are expected to ensure higher access to affordable health insurance. In the long run if these measures successfully provide health insurance to currently uninsured patients who face barriers to care (reflected in high rates of ACS conditions), they may have relatively lower rates of avoidable hospitalizations and ED visits due to improved access to ambulatory care within communities. However several caveats remain. First, significant proportions of the population in the combined hospital service area may not be US citizens and thus not eligible for some of the benefits of the Affordable Care Act. Alongside an increase in health insurance coverage, availability (on the supply side) of primary care is a necessary prerequisite along with community level interventions that address non-insurance related barriers to accessing care. Overall, a consistent multipronged initiative may be necessary to address barriers to primary care that are reflected in high rates of avoidable hospitalizations and ED visits.
70 Rutgers Center for State Health Policy/RWJMS Family Medicine & Community Health, Dec 2012
References AHRQ (Agency for Healthcare Research and Quality). 2012a. “Prevention Quality Indicators
Overview.” Quality Indicators - AHRQ. Accessed June 26. http://www.qualityindicators.ahrq.gov/modules/pqi_overview.aspx.
———– . 2012b. “Prevention Quality Indicators Technical Specifications - Version 4.4, March
2012.” Quality Indicators - AHRQ. Accessed June 26. http://www.qualityindicators.ahrq.gov/Modules/PQI_TechSpec.aspx.
Ballard DW, M Price, V Fung, R Brand, ME Reed, B Fireman, JP Newhouse, JV Selby, and J Hsu.
2010. “Validation of an Algorithm for Categorizing the Severity of Hospital Emergency Department Visits.” Medical Care 48 (1): 58–63.
Basu J, B Friedman, and H Burstin. 2004. “Managed Care and Preventable Hospitalization
among Medicaid Adults.” Health Services Research 39 (3): 489–510. Battelle. 2012. Quality Indicator User Guide: Pediatric Quality Indicators (PDI) Composite
Measures Version 4.4. Rockville, MD: Agency for Healthcare Research and Quality. http://www.qualityindicators.ahrq.gov/Downloads/Modules/PDI/V44/Composite_User_Technical_Specification_PDI%20V4.4.pdf.
Billings J. 2003. “Using Administrative Data To Monitor Access, Identify Disparities, and Assess
Performance of the Safety Net.” Agency for Healthcare Research and Quality Archive. http://archive.ahrq.gov/data/safetynet/billings.htm.
Billings J, N Parikh, and T Mijanovich. 2000. Emergency Department Use: The New York Story.
New York: Commonwealth Fund. http://www.commonwealthfund.org/~/media/Files/Publications/Issue%20Brief/2000/Nov/Emergency%20Room%20Use%20%20The%20New%20York%20Story/billings_nystory%20pdf.pdf.
Billings J, L Zeitel, J Lukomnik, TS Carey, AE Blank, and L Newman. 1993. “Impact of
Socioeconomic Status on Hospital Use in New York City.” Health Affairs (Millwood) 12 (1): 162–73.

71 A Community Health Needs Assessment
Bindman AB, K Grumbach, D Osmond, M Komaromy, K Vranizan, N Lurie, J Billings, and A Stewart. 1995. “Preventable Hospitalizations and Access to Health Care.” Journal of the American Medical Association 274 (4): 305–11.
DeLia D. 2006. Potentially Avoidable Use of Hospital Emergency Departments in New Jersey.
New Brunswick, NJ: Rutgers Center for State Health Policy. http://www.cshp.rutgers.edu/Downloads/6330.pdf.
Howard DL, FB Hakeem, C Njue, T Carey, and Y Jallah. 2007. “Racially Disproportionate
Admission Rates for Ambulatory Care Sensitive Conditions in North Carolina.” Public Health Reports 122 (3): 362–72.
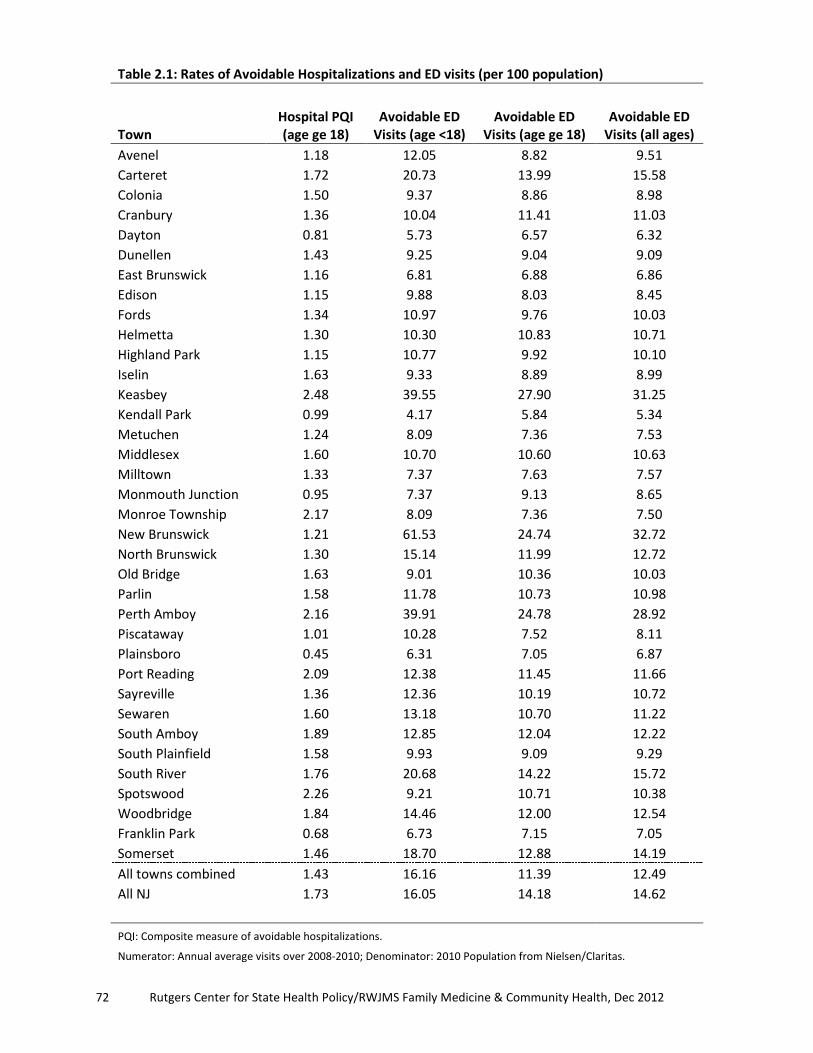
72 Rutgers Center for State Health Policy/RWJMS Family Medicine & Community Health, Dec 2012
Table 2.1: Rates of Avoidable Hospitalizations and ED visits (per 100 population)
Town
Hospital PQI (age ge 18)
Avoidable ED Visits (age <18)
Avoidable ED Visits (age ge 18)
Avoidable ED Visits (all ages)
Avenel 1.18 12.05 8.82 9.51 Carteret 1.72 20.73 13.99 15.58 Colonia 1.50 9.37 8.86 8.98 Cranbury 1.36 10.04 11.41 11.03 Dayton 0.81 5.73 6.57 6.32 Dunellen 1.43 9.25 9.04 9.09 East Brunswick 1.16 6.81 6.88 6.86 Edison 1.15 9.88 8.03 8.45 Fords 1.34 10.97 9.76 10.03 Helmetta 1.30 10.30 10.83 10.71 Highland Park 1.15 10.77 9.92 10.10 Iselin 1.63 9.33 8.89 8.99 Keasbey 2.48 39.55 27.90 31.25 Kendall Park 0.99 4.17 5.84 5.34 Metuchen 1.24 8.09 7.36 7.53 Middlesex 1.60 10.70 10.60 10.63 Milltown 1.33 7.37 7.63 7.57 Monmouth Junction 0.95 7.37 9.13 8.65 Monroe Township 2.17 8.09 7.36 7.50 New Brunswick 1.21 61.53 24.74 32.72 North Brunswick 1.30 15.14 11.99 12.72 Old Bridge 1.63 9.01 10.36 10.03 Parlin 1.58 11.78 10.73 10.98 Perth Amboy 2.16 39.91 24.78 28.92 Piscataway 1.01 10.28 7.52 8.11 Plainsboro 0.45 6.31 7.05 6.87 Port Reading 2.09 12.38 11.45 11.66 Sayreville 1.36 12.36 10.19 10.72 Sewaren 1.60 13.18 10.70 11.22 South Amboy 1.89 12.85 12.04 12.22 South Plainfield 1.58 9.93 9.09 9.29 South River 1.76 20.68 14.22 15.72 Spotswood 2.26 9.21 10.71 10.38 Woodbridge 1.84 14.46 12.00 12.54 Franklin Park 0.68 6.73 7.15 7.05 Somerset 1.46 18.70 12.88 14.19 All towns combined 1.43 16.16 11.39 12.49 All NJ 1.73 16.05 14.18 14.62
PQI: Composite measure of avoidable hospitalizations. Numerator: Annual average visits over 2008-2010; Denominator: 2010 Population from Nielsen/Claritas.

73 A Community Health Needs Assessment
Table 2.2: Rates of Hospitalizations and ED Visits: Total and Avoidable
Inpatient ED Inpatient ED Town Avoidable visits as % of all visits All visits per 100 population Avenel 12.44 45.99 9.48 20.68 Carteret 13.92 50.72 12.35 30.72 Colonia 12.13 41.41 12.36 21.68 Cranbury 11.33 44.88 12.02 24.56 Dayton 9.41 41.98 8.60 15.05 Dunellen 11.43 43.56 12.51 20.86 East Brunswick 10.92 39.10 10.64 17.56 Edison 11.22 44.40 10.28 19.02 Fords 11.72 44.76 11.47 22.41 Helmetta 10.14 40.61 12.79 26.38 Highland Park 11.50 45.78 10.00 22.07 Iselin 12.55 43.53 13.01 20.65 Keasbey 15.73 53.83 15.75 58.06 Kendall Park 10.89 39.98 9.12 13.36 Metuchen 11.15 39.67 11.09 18.98 Middlesex 12.04 45.66 13.27 23.27 Milltown 11.42 39.02 11.64 19.41 Monmouth Junction 10.21 43.55 9.27 19.86 Monroe Township 12.54 38.85 17.32 19.30 New Brunswick 11.20 57.27 10.79 57.14 North Brunswick 11.63 48.87 11.20 26.02 Old Bridge 12.00 41.32 13.55 24.28 Parlin 12.13 44.57 13.05 24.63 Perth Amboy 12.91 55.07 16.72 52.52 Piscataway 10.60 46.40 9.51 17.49 Plainsboro 6.71 41.20 6.76 16.67 Port Reading 14.55 42.44 14.40 27.46 Sayreville 11.39 45.90 11.93 23.35 Sewaren 13.24 43.82 12.06 25.61 South Amboy 12.01 42.30 15.71 28.88 South Plainfield 13.19 44.11 12.00 21.06 South River 12.61 47.56 13.96 33.05 Spotswood 13.84 41.49 16.34 25.01 Woodbridge 13.66 45.30 13.48 27.69 Franklin Park 6.97 44.68 9.81 15.77 Somerset 10.85 49.31 13.48 28.78 All towns combined 11.78 47.61 12.15 26.24 All NJ 12.97 46.94 13.32 31.14
Note: For population based denominator - Numerator: Annual average visits over 2008-10;
Denominator: 2010 Population from Nielsen/Claritas. Otherwise both numerator and denominators are annual average discharges over 2008-2010.

74 Rutgers Center for State Health Policy/RWJMS Family Medicine & Community Health, Dec 2012
Table 2.3: Rates of Overall, Acute and Chronic Composite Indicators of Avoidable Hospitalizations (per 100 population)
Town Overall Composite Acute Composite Chronic Composite Avenel 1.18 0.36 0.82 Carteret 1.72 0.56 1.15 Colonia 1.50 0.53 0.97 Cranbury 1.36 0.58 0.79 Dayton 0.81 0.24 0.57 Dunellen 1.43 0.64 0.79 East Brunswick 1.16 0.48 0.68 Edison 1.15 0.46 0.69 Fords 1.34 0.47 0.87 Helmetta 1.30 -- 0.82 Highland Park 1.15 0.51 0.64 Iselin 1.63 0.64 0.99 Keasbey 2.48 0.65 1.83 Kendall Park 0.99 0.41 0.59 Metuchen 1.24 0.50 0.73 Middlesex 1.60 0.61 0.99 Milltown 1.33 0.56 0.76 Monmouth Junction 0.95 0.36 0.59 Monroe Township 2.17 0.91 1.26 New Brunswick 1.21 0.40 0.80 North Brunswick 1.30 0.45 0.85 Old Bridge 1.63 0.58 1.05 Parlin 1.58 0.52 1.07 Perth Amboy 2.16 0.67 1.49 Piscataway 1.01 0.39 0.62 Plainsboro 0.45 0.19 0.26 Port Reading 2.09 0.80 1.30 Sayreville 1.36 0.43 0.93 Sewaren 1.60 0.64 0.96 South Amboy 1.89 0.77 1.12 South Plainfield 1.58 0.62 0.96 South River 1.76 0.64 1.12 Spotswood 2.26 0.71 1.55 Woodbridge 1.84 0.71 1.13 Franklin Park 0.68 0.25 0.43 Somerset 1.46 0.55 0.91 All towns combined 1.43 0.53 0.90 All NJ 1.73 0.63 1.10
Rates calculated out of 100 population; suppressed when numerator < 30. Numerator: Annual average visits over 2008-2010; Denominator: 2010 Population from Nielsen/Claritas.

75 A Community Health Needs Assessment
Table 2.4: Rates of Individual Ambulatory Care Sensitive Conditions (per 100 population)
Town Diabetes
Short term Perforated Appendix*
Diabetes Long-term
COPD- Older Adults
Avenel -- -- 0.10 0.44 Carteret -- -- 0.15 0.59 Colonia -- -- 0.09 0.30 Cranbury -- -- -- 0.34 Dayton -- -- -- -- Dunellen -- -- 0.15 0.35 East Brunswick -- -- 0.11 0.28 Edison 0.02 3.23 0.08 0.30 Fords -- -- -- 0.32 Helmetta -- -- -- -- Highland Park -- -- -- 0.32 Iselin -- -- 0.10 0.51 Keasbey -- -- -- 1.46 Kendall Park -- -- -- 0.27 Metuchen -- -- 0.09 0.30 Middlesex -- -- 0.14 0.38 Milltown -- -- -- 0.34 Monmouth Junction -- -- 0.10 0.30 Monroe Township -- 2.89 0.11 0.42 New Brunswick 0.06 -- 0.12 0.52 North Brunswick -- -- 0.14 0.35 Old Bridge -- -- 0.14 0.50 Parlin -- -- 0.15 0.53 Perth Amboy 0.09 1.73 0.22 0.82 Piscataway 0.03 -- 0.06 0.30 Plainsboro -- -- -- -- Port Reading -- -- -- 0.57 Sayreville -- -- 0.08 0.40 Sewaren -- -- -- -- South Amboy -- -- 0.15 0.68 South Plainfield 0.06 -- 0.07 0.47 South River -- -- 0.11 0.62 Spotswood -- -- -- 0.83 Woodbridge -- -- 0.12 0.47 Franklin Park -- -- -- -- Somerset 0.05 -- 0.12 0.36 All towns combined 0.04 2.21 0.11 0.42 All NJ 0.05 2.38 0.14 0.52
*out of 10 discharges. Numerator: Annual average visits over 2008-2010; Denominator: 2010 Population from Nielsen/Claritas;
Rates suppressed when numerator < 30.

76 Rutgers Center for State Health Policy/RWJMS Family Medicine & Community Health, Dec 2012
Table 2.4: Rates of Individual Ambulatory Care Sensitive Conditions (per 100 population) (continued)
Town Congestive
Heart Failure Dehydration Bacterial
Pneumonia Urinary Tract
Infection Avenel 0.31 0.09 0.17 0.10 Carteret 0.40 0.12 0.26 0.19 Colonia 0.54 0.14 0.27 0.12 Cranbury 0.31 -- 0.23 0.21 Dayton 0.18 -- -- -- Dunellen 0.30 0.19 0.26 0.19 East Brunswick 0.27 0.12 0.20 0.16 Edison 0.32 0.10 0.23 0.13 Fords 0.41 0.15 0.20 0.12 Helmetta -- -- -- -- Highland Park 0.25 0.16 0.22 0.12 Iselin 0.41 0.17 0.30 0.17 Keasbey -- -- -- -- Kendall Park 0.24 0.09 0.19 0.12 Metuchen 0.28 0.15 0.23 0.12 Middlesex 0.48 0.23 0.25 0.13 Milltown 0.36 -- 0.25 0.18 Monmouth Junction 0.20 0.09 0.17 0.10 Monroe Township 0.65 0.22 0.43 0.26 New Brunswick 0.27 0.09 0.18 0.14 North Brunswick 0.32 0.11 0.22 0.12 Old Bridge 0.41 0.12 0.26 0.20 Parlin 0.35 0.13 0.21 0.18 Perth Amboy 0.44 0.14 0.29 0.24 Piscataway 0.26 0.10 0.18 0.11 Plainsboro 0.07 -- 0.09 -- Port Reading 0.56 -- 0.39 -- Sayreville 0.42 0.14 0.20 0.09 Sewaren 0.59 -- -- -- South Amboy 0.34 0.19 0.37 0.22 South Plainfield 0.45 0.16 0.31 0.16 South River 0.41 0.18 0.29 0.17 Spotswood 0.62 -- 0.34 0.27 Woodbridge 0.51 0.14 0.35 0.22 Franklin Park 0.16 -- -- -- Somerset 0.35 0.14 0.24 0.17 All towns combined 0.36 0.13 0.24 0.16 All NJ 0.41 0.15 0.28 0.20 Numerator: Annual average visits over 2008-2010; Denominator: 2010 Population from Nielsen/Claritas. Rates suppressed when numerator < 30.
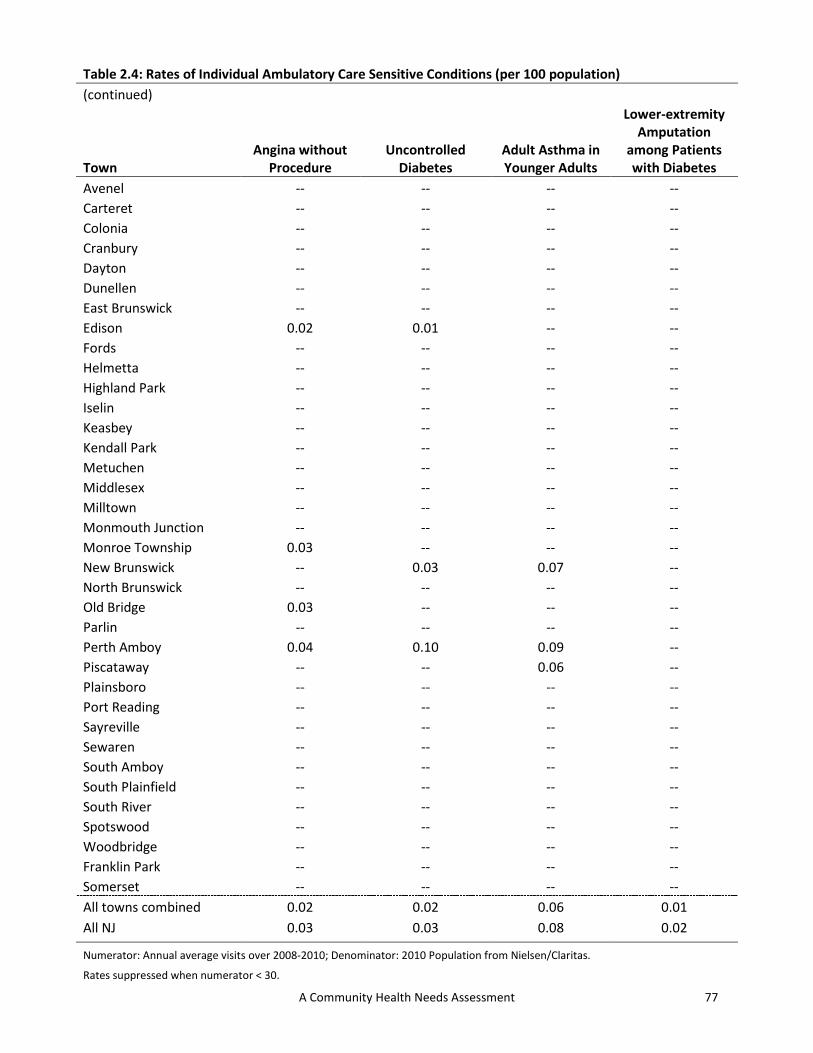
77 A Community Health Needs Assessment
Table 2.4: Rates of Individual Ambulatory Care Sensitive Conditions (per 100 population) (continued)
Town Angina without
Procedure Uncontrolled
Diabetes Adult Asthma in Younger Adults
Lower-extremity Amputation
among Patients with Diabetes
Avenel -- -- -- -- Carteret -- -- -- -- Colonia -- -- -- -- Cranbury -- -- -- -- Dayton -- -- -- -- Dunellen -- -- -- -- East Brunswick -- -- -- -- Edison 0.02 0.01 -- -- Fords -- -- -- -- Helmetta -- -- -- -- Highland Park -- -- -- -- Iselin -- -- -- -- Keasbey -- -- -- -- Kendall Park -- -- -- -- Metuchen -- -- -- -- Middlesex -- -- -- -- Milltown -- -- -- -- Monmouth Junction -- -- -- -- Monroe Township 0.03 -- -- -- New Brunswick -- 0.03 0.07 -- North Brunswick -- -- -- -- Old Bridge 0.03 -- -- -- Parlin -- -- -- -- Perth Amboy 0.04 0.10 0.09 -- Piscataway -- -- 0.06 -- Plainsboro -- -- -- -- Port Reading -- -- -- -- Sayreville -- -- -- -- Sewaren -- -- -- -- South Amboy -- -- -- -- South Plainfield -- -- -- -- South River -- -- -- -- Spotswood -- -- -- -- Woodbridge -- -- -- -- Franklin Park -- -- -- -- Somerset -- -- -- -- All towns combined 0.02 0.02 0.06 0.01 All NJ 0.03 0.03 0.08 0.02
Numerator: Annual average visits over 2008-2010; Denominator: 2010 Population from Nielsen/Claritas. Rates suppressed when numerator < 30.

78 Rutgers Center for State Health Policy/RWJMS Family Medicine & Community Health, Dec 2012
Table 2.5: Rates of Avoidable ED Visits and Various Categories (per 100 population)
Town Total NE* EPCT^ EDCNPA§ Avenel 9.51 4.00 4.32 1.19 Carteret 15.58 6.71 6.99 1.88 Colonia 8.98 3.78 4.13 1.08 Cranbury 11.03 4.97 4.92 1.13 Dayton 6.32 2.81 2.88 0.63 Dunellen 9.09 3.92 4.25 0.91 East Brunswick 6.86 2.98 3.13 0.76 Edison 8.45 3.63 3.82 1.00 Fords 10.03 4.25 4.60 1.18 Helmetta 10.71 4.42 5.07 1.23 Highland Park 10.10 4.54 4.51 1.06 Iselin 8.99 3.86 4.03 1.09 Keasbey 31.25 13.47 14.02 3.76 Kendall Park 5.34 2.26 2.44 0.65 Metuchen 7.53 3.22 3.44 0.87 Middlesex 10.63 4.69 4.78 1.16 Milltown 7.57 3.24 3.54 0.79 Monmouth Junction 8.65 3.89 3.84 0.91 Monroe Township 7.50 3.24 3.50 0.77 New Brunswick 32.72 14.32 14.86 3.54 North Brunswick 12.72 5.63 5.69 1.39 Old Bridge 10.03 4.24 4.61 1.18 Parlin 10.98 4.66 5.05 1.28 Perth Amboy 28.92 12.47 13.11 3.34 Piscataway 8.11 3.47 3.71 0.93 Plainsboro 6.87 3.01 3.14 0.72 Port Reading 11.66 5.02 5.23 1.40 Sayreville 10.72 4.51 4.96 1.25 Sewaren 11.22 4.84 5.10 1.29 South Amboy 12.22 5.30 5.46 1.45 South Plainfield 9.29 3.87 4.28 1.14 South River 15.72 7.06 7.09 1.56 Spotswood 10.38 4.51 4.71 1.16 Woodbridge 12.54 5.33 5.55 1.66 Franklin Park 7.05 3.07 3.30 0.67 Somerset 14.19 6.26 6.31 1.62 All towns combined 12.49 5.41 5.67 1.42 All NJ 14.62 6.39 6.46 1.76
*NE: Non-emergent; ^EPCT: Emergent/Primary Care Treatable; §EDCNPA: Emergent, ED Care Needed, Preventable/Avoidable. Numerator: Annual average visits over 2008-2010; Denominator: 2010 Population from Nielsen/Claritas.
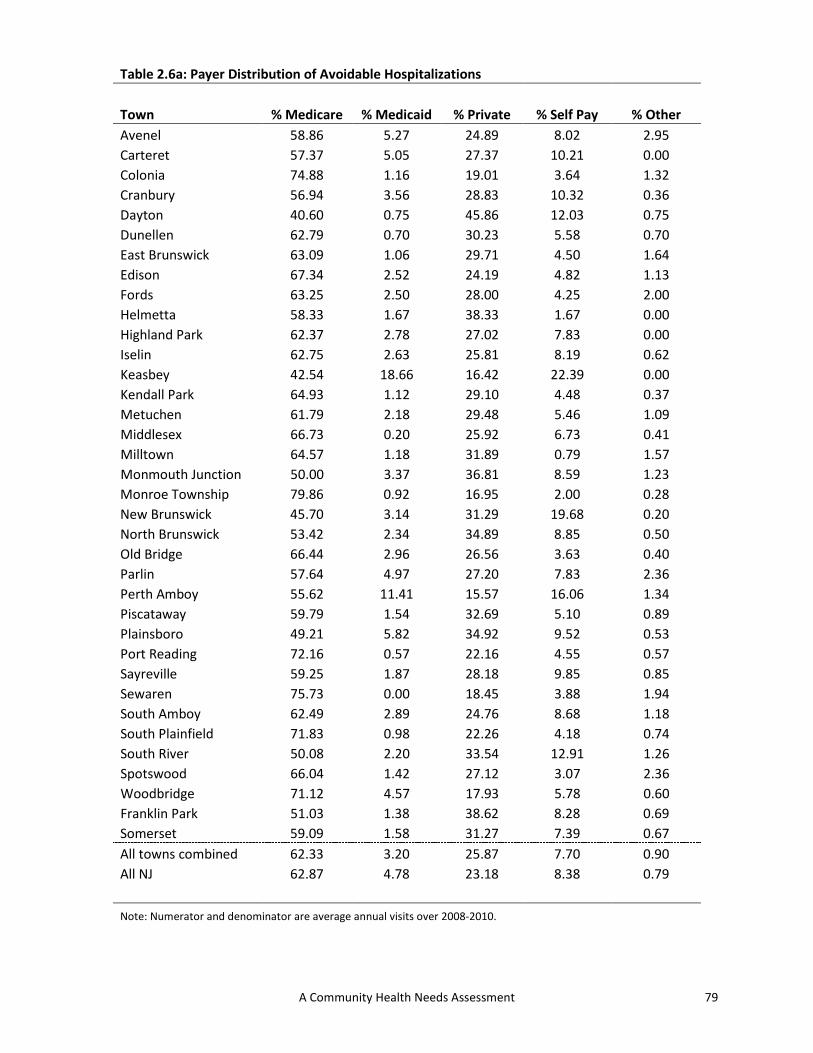
79 A Community Health Needs Assessment
Table 2.6a: Payer Distribution of Avoidable Hospitalizations
Town % Medicare % Medicaid % Private % Self Pay % Other Avenel 58.86 5.27 24.89 8.02 2.95 Carteret 57.37 5.05 27.37 10.21 0.00 Colonia 74.88 1.16 19.01 3.64 1.32 Cranbury 56.94 3.56 28.83 10.32 0.36 Dayton 40.60 0.75 45.86 12.03 0.75 Dunellen 62.79 0.70 30.23 5.58 0.70 East Brunswick 63.09 1.06 29.71 4.50 1.64 Edison 67.34 2.52 24.19 4.82 1.13 Fords 63.25 2.50 28.00 4.25 2.00 Helmetta 58.33 1.67 38.33 1.67 0.00 Highland Park 62.37 2.78 27.02 7.83 0.00 Iselin 62.75 2.63 25.81 8.19 0.62 Keasbey 42.54 18.66 16.42 22.39 0.00 Kendall Park 64.93 1.12 29.10 4.48 0.37 Metuchen 61.79 2.18 29.48 5.46 1.09 Middlesex 66.73 0.20 25.92 6.73 0.41 Milltown 64.57 1.18 31.89 0.79 1.57 Monmouth Junction 50.00 3.37 36.81 8.59 1.23 Monroe Township 79.86 0.92 16.95 2.00 0.28 New Brunswick 45.70 3.14 31.29 19.68 0.20 North Brunswick 53.42 2.34 34.89 8.85 0.50 Old Bridge 66.44 2.96 26.56 3.63 0.40 Parlin 57.64 4.97 27.20 7.83 2.36 Perth Amboy 55.62 11.41 15.57 16.06 1.34 Piscataway 59.79 1.54 32.69 5.10 0.89 Plainsboro 49.21 5.82 34.92 9.52 0.53 Port Reading 72.16 0.57 22.16 4.55 0.57 Sayreville 59.25 1.87 28.18 9.85 0.85 Sewaren 75.73 0.00 18.45 3.88 1.94 South Amboy 62.49 2.89 24.76 8.68 1.18 South Plainfield 71.83 0.98 22.26 4.18 0.74 South River 50.08 2.20 33.54 12.91 1.26 Spotswood 66.04 1.42 27.12 3.07 2.36 Woodbridge 71.12 4.57 17.93 5.78 0.60 Franklin Park 51.03 1.38 38.62 8.28 0.69 Somerset 59.09 1.58 31.27 7.39 0.67 All towns combined 62.33 3.20 25.87 7.70 0.90 All NJ 62.87 4.78 23.18 8.38 0.79
Note: Numerator and denominator are average annual visits over 2008-2010.

80 Rutgers Center for State Health Policy/RWJMS Family Medicine & Community Health, Dec 2012
Table 2.6b: Payer Distribution of Avoidable ED Visits
Town % Medicare % Medicaid % Private % Self Pay % Other Avenel 10.42 13.79 51.99 19.62 4.17 Carteret 8.61 23.05 41.70 23.72 2.93 Colonia 19.04 5.28 59.16 10.97 5.55 Cranbury 9.69 13.92 46.61 27.81 1.97 Dayton 6.54 5.27 71.27 14.09 2.83 Dunellen 11.09 4.84 58.10 22.07 3.89 East Brunswick 12.82 4.43 65.63 14.77 2.35 Edison 13.44 7.54 59.29 15.87 3.86 Fords 11.90 9.69 54.79 18.19 5.44 Helmetta 6.22 6.30 69.94 15.74 1.80 Highland Park 13.13 4.75 60.00 20.76 1.36 Iselin 16.98 8.22 54.58 15.48 4.74 Keasbey 9.10 32.22 34.39 21.28 3.01 Kendall Park 12.43 3.61 69.46 12.62 1.88 Metuchen 14.74 6.30 59.70 14.18 5.09 Middlesex 11.77 3.21 58.76 24.11 2.16 Milltown 14.96 2.12 65.30 15.82 1.80 Monmouth Junction 9.76 5.32 63.00 19.96 1.96 Monroe Township 28.68 5.57 50.82 12.68 2.25 New Brunswick 4.13 4.28 56.89 33.93 0.78 North Brunswick 7.58 4.06 64.73 21.91 1.72 Old Bridge 13.48 9.15 58.72 15.53 3.11 Parlin 9.72 13.72 55.42 17.57 3.56 Perth Amboy 7.36 36.74 27.95 25.55 2.40 Piscataway 9.80 4.99 64.62 17.27 3.32 Plainsboro 6.51 8.07 65.57 17.47 2.38 Port Reading 11.20 11.86 53.38 17.87 5.68 Sayreville 8.03 11.40 56.22 20.97 3.38 Sewaren 9.33 14.88 50.10 19.60 6.09 South Amboy 10.64 15.51 48.88 21.84 3.13 South Plainfield 14.18 7.53 55.74 17.47 5.08 South River 7.84 7.87 53.38 29.33 1.59 Spotswood 14.90 5.84 57.93 17.90 3.43 Woodbridge 14.47 14.54 49.42 17.82 3.75 Franklin Park 6.84 3.40 71.56 15.04 3.16 Somerset 9.49 3.83 63.35 21.80 1.53 All towns combined 10.06 11.82 53.33 22.22 2.57 All NJ 11.46 14.71 47.56 23.63 2.63
Note: Numerator and denominator are average annual visits over 2008-2010.

81 A Community Health Needs Assessment
Table 2.7: Age Distribution of Avoidable Hospitalizations and ED Visits
Avoidable hospitalizations Avoidable ED visits Town % 18 - 39 % 40-64 % 65+ % 0 - 17 % 18 - 39 % 40-64 %65+ Avenel 8.44 35.86 55.70 27.08 35.13 29.79 8.00 Carteret 12.63 32.63 54.74 31.33 37.93 23.87 6.87 Colonia 5.29 19.34 75.37 24.15 29.10 28.98 17.77 Cranbury 9.25 32.38 58.36 25.45 36.30 30.24 8.02 Dayton 8.27 44.36 47.37 27.18 31.37 34.66 6.78 Dunellen 5.12 32.33 62.56 24.90 37.53 29.41 8.15 East Brunswick 7.20 27.00 65.79 22.90 32.54 31.97 12.59 Edison 6.28 25.17 68.55 26.34 35.13 26.51 12.02 Fords 4.75 26.75 68.50 24.64 35.71 29.08 10.57 Helmetta 13.33 20.00 66.67 20.52 43.88 30.69 4.91 Highland Park 4.04 34.34 61.62 22.96 35.78 31.43 9.83 Iselin 6.18 31.68 62.13 22.22 31.70 30.05 16.03 Keasbey 17.16 46.27 36.57 36.43 39.09 21.64 2.84 Kendall Park 5.97 19.03 75.00 23.31 33.71 31.20 11.78 Metuchen 6.11 27.95 65.94 25.01 30.22 30.19 14.59 Middlesex 3.88 25.51 70.61 24.15 37.73 28.57 9.55 Milltown 3.54 26.38 70.08 20.93 35.71 29.98 13.38 Monmouth Junction 14.11 36.81 49.08 23.43 39.60 30.48 6.49 Monroe Township 2.72 16.83 80.46 20.03 26.29 25.79 27.89 New Brunswick 16.14 39.16 44.70 40.80 38.92 17.54 2.74 North Brunswick 9.10 36.81 54.09 27.56 39.77 26.67 6.00 Old Bridge 6.59 29.25 64.16 21.79 36.68 30.04 11.49 Parlin 7.58 35.40 57.02 25.30 37.02 29.42 8.26 Perth Amboy 12.63 39.45 47.92 37.78 36.15 21.15 4.92 Piscataway 9.22 28.07 62.70 27.20 37.57 26.21 9.01 Plainsboro 21.16 35.45 43.39 22.51 44.27 28.47 4.76 Port Reading 5.11 18.18 76.70 23.46 37.42 28.40 10.72 Sayreville 10.02 33.62 56.37 27.92 40.23 24.97 6.88 Sewaren 7.77 24.27 67.96 25.00 37.82 29.09 8.09 South Amboy 8.36 34.41 57.23 23.21 39.18 29.57 8.04 South Plainfield 5.41 21.89 72.69 24.98 33.94 28.53 12.55 South River 10.24 36.06 53.70 30.50 38.59 24.83 6.08 Spotswood 4.95 25.94 69.10 19.72 37.41 30.02 12.85 Woodbridge 9.39 32.97 57.64 25.48 37.03 28.93 8.56 Franklin Park 8.97 35.86 55.17 23.93 39.23 29.82 7.02 Somerset 8.00 28.36 63.64 29.75 37.37 24.52 8.36 All towns combined 8.18 29.93 61.89 29.97 36.64 25.06 8.33 All NJ 7.97 31.09 60.94 25.85 37.73 27.23 9.19
Note: Numerator and denominators denote average annual discharges/visits over 2008-2010.

82 Rutgers Center for State Health Policy/RWJMS Family Medicine & Community Health, Dec 2012
Table 2.8: Gender Distribution of Avoidable Hospitalizations and ED Visits
Inpatient Visits ED visits Town % Male % Female % Male % Female Avenel 46.84 53.16 41.66 58.34 Carteret 41.26 58.74 38.65 61.35 Colonia 50.25 49.75 44.77 55.23 Cranbury 39.15 60.85 41.87 58.13 Dayton 59.40 40.60 41.97 58.03 Dunellen 48.60 51.40 38.17 61.83 East Brunswick 44.35 55.65 41.90 58.10 Edison 44.85 55.15 41.14 58.86 Fords 49.25 50.75 38.46 61.54 Helmetta 33.33 66.67 39.57 60.43 Highland Park 39.90 60.10 38.94 61.06 Iselin 46.37 53.63 43.60 56.40 Keasbey 37.31 62.69 33.86 66.14 Kendall Park 46.27 53.73 43.59 56.41 Metuchen 40.17 59.83 44.11 55.89 Middlesex 46.53 53.47 39.11 60.89 Milltown 40.16 59.84 40.17 59.83 Monmouth Junction 38.65 61.35 38.81 61.19 Monroe Township 47.76 52.24 40.43 59.57 New Brunswick 47.83 52.17 42.58 57.42 North Brunswick 43.82 56.18 40.14 59.86 Old Bridge 44.59 55.41 40.74 59.26 Parlin 46.83 53.17 40.44 59.56 Perth Amboy 43.97 56.03 40.98 59.02 Piscataway 43.28 56.72 41.09 58.91 Plainsboro 45.50 54.50 41.79 58.21 Port Reading 44.32 55.68 39.53 60.47 Sayreville 48.39 51.61 41.41 58.59 Sewaren 63.11 36.89 40.30 59.70 South Amboy 38.59 61.41 41.27 58.73 South Plainfield 47.36 52.64 40.10 59.90 South River 46.30 53.70 41.90 58.10 Spotswood 42.92 57.08 41.13 58.87 Woodbridge 43.44 56.56 41.12 58.88 Franklin Park 32.41 67.59 36.37 63.63 Somerset 43.03 56.97 40.05 59.95 All towns combined 44.81 55.19 41.02 58.98 All NJ 44.14 55.86 40.82 59.18
Note: Numerator and denominator are average annual visits over 2008-2010.

83 A Community Health Needs Assessment
Table 2.9a: Race-Ethnicity Distribution of Avoidable Hospitalizations
Town % White % Black % Hispanic % Other Avenel 73.84 12.03 6.75 7.38 Carteret 55.89 16.63 19.26 8.21 Colonia 83.14 7.77 3.64 5.45 Cranbury 71.53 6.76 11.74 9.96 Dayton 68.42 12.78 3.01 15.79 Dunellen 75.12 3.49 6.05 15.35 East Brunswick 80.93 4.01 3.85 11.21 Edison 72.95 8.88 3.99 14.18 Fords 76.25 4.50 10.75 8.50 Helmetta 96.67 0.00 1.67 1.67 Highland Park 77.02 12.37 5.81 4.80 Iselin 73.57 7.88 3.71 14.84 Keasbey 20.90 16.42 55.22 7.46 Kendall Park 76.12 10.82 1.87 11.19 Metuchen 82.75 5.46 3.93 7.86 Middlesex 86.94 4.49 4.29 4.29 Milltown 97.64 0.79 0.39 1.18 Monmouth Junction 69.02 12.88 4.91 13.19 Monroe Township 89.69 4.24 2.12 3.96 New Brunswick 26.35 46.36 21.41 5.87 North Brunswick 59.52 22.37 8.18 9.93 Old Bridge 82.65 4.51 4.03 8.81 Parlin 73.29 8.70 8.57 9.44 Perth Amboy 28.20 11.65 55.83 4.32 Piscataway 51.70 25.97 4.53 17.80 Plainsboro 50.26 19.05 6.35 24.34 Port Reading 86.93 5.11 6.25 1.70 Sayreville 78.10 10.36 4.58 6.96 Sewaren 77.67 7.77 7.77 6.80 South Amboy 84.89 3.54 5.25 6.32 South Plainfield 80.44 9.35 2.95 7.26 South River 80.79 8.98 4.72 5.51 Spotswood 93.63 2.12 2.83 1.42 Woodbridge 75.93 8.42 8.42 7.22 Franklin Park 47.59 27.59 1.38 23.45 Somerset 50.12 34.73 5.88 9.27 All towns combined 67.33 13.08 10.94 8.65 All NJ 64.07 20.16 10.21 5.56
Note: Numerator and denominator are average annual visits over 2008-2010.

84 Rutgers Center for State Health Policy/RWJMS Family Medicine & Community Health, Dec 2012
Table 2.9b: Race-Ethnicity Distribution of Avoidable ED Visits
Town % White % Black % Hispanic % Other Avenel 42.88 21.22 15.86 20.04 Carteret 25.66 22.07 38.93 13.34 Colonia 68.40 11.36 9.61 10.64 Cranbury 42.31 13.41 31.59 12.69 Dayton 43.20 20.13 7.41 29.26 Dunellen 54.13 10.65 17.55 17.67 East Brunswick 65.02 8.03 8.09 18.86 Edison 45.27 17.17 12.78 24.78 Fords 50.30 11.20 23.65 14.84 Helmetta 84.38 5.07 3.59 6.96 Highland Park 48.23 22.89 14.20 14.68 Iselin 44.11 13.72 10.17 32.00 Keasbey 17.01 14.03 62.14 6.83 Kendall Park 60.65 14.35 4.40 20.60 Metuchen 65.43 11.33 8.96 14.28 Middlesex 65.32 11.49 14.17 9.02 Milltown 81.92 3.44 7.52 7.12 Monmouth Junction 46.36 24.49 9.14 20.00 Monroe Township 77.00 6.65 8.14 8.22 New Brunswick 10.17 22.55 56.20 11.08 North Brunswick 29.71 30.15 24.14 16.00 Old Bridge 70.77 8.35 8.36 12.52 Parlin 52.22 17.33 14.54 15.92 Perth Amboy 9.01 8.36 78.40 4.24 Piscataway 28.59 35.94 12.94 22.53 Plainsboro 42.37 20.83 10.66 26.14 Port Reading 59.65 10.64 19.68 10.04 Sayreville 50.62 20.17 14.81 14.39 Sewaren 56.37 15.09 22.40 6.13 South Amboy 67.94 8.88 13.45 9.73 South Plainfield 52.55 17.31 16.47 13.67 South River 48.29 14.29 25.04 12.38 Spotswood 82.60 4.97 5.40 7.03 Woodbridge 45.85 16.70 23.87 13.57 Franklin Park 32.43 39.02 6.60 21.95 Somerset 22.06 43.45 20.52 13.97 All towns combined 35.79 18.58 31.98 13.65 All NJ 41.67 27.89 22.45 7.99
Note: Numerator and denominator are average annual visits over 2008-2010.

85 A Community Health Needs Assessment
Table 2.10a: Percent of Avoidable Hospitalizations by Type of Payer
Town Medicare Medicaid Private Self Pay Other Avenel 19.84 8.45 7.21 11.01 11.11 Carteret 19.35 7.96 10.55 12.09 0.00 Colonia 17.86 7.95 5.81 8.66 6.25 Cranbury 15.30 12.20 7.61 11.69 -- Dayton 15.13 -- 6.87 15.38 -- Dunellen 16.16 2.83 7.79 9.68 4.41 East Brunswick 15.02 6.99 7.09 9.77 10.42 Edison 17.46 7.97 6.00 9.70 5.24 Fords 17.35 6.13 7.70 7.30 7.69 Helmetta 16.75 -- 7.08 -- -- Highland Park 15.37 11.70 7.53 11.23 -- Iselin 17.52 8.59 7.84 13.12 3.67 Keasbey 22.80 15.92 7.80 22.06 -- Kendall Park 15.66 -- 6.54 14.63 -- Metuchen 15.09 8.13 7.57 11.36 4.72 Middlesex 18.93 1.41 6.67 10.89 3.08 Milltown 18.49 -- 6.92 1.82 -- Monmouth Junction 18.15 12.36 6.36 11.07 6.15 Monroe Township 14.72 9.13 7.99 8.58 2.92 New Brunswick 18.64 2.35 10.99 9.20 1.23 North Brunswick 18.75 7.29 7.79 11.34 2.93 Old Bridge 16.47 10.58 7.74 8.61 2.40 Parlin 18.06 10.58 7.40 12.26 8.80 Perth Amboy 17.57 8.51 8.33 14.01 6.06 Piscataway 17.47 7.04 6.54 8.91 4.14 Plainsboro 17.03 8.53 3.50 8.26 -- Port Reading 20.68 -- 8.46 12.12 -- Sayreville 18.96 5.09 6.45 13.52 4.46 Sewaren 24.00 -- 5.48 -- -- South Amboy 16.20 6.18 8.05 11.77 6.15 South Plainfield 19.99 5.26 6.89 11.00 3.87 South River 16.75 5.43 9.87 13.18 8.25 Spotswood 17.76 9.68 9.67 8.18 12.99 Woodbridge 20.79 12.26 6.20 12.40 3.62 Franklin Park 11.76 -- 4.51 9.38 -- Somerset 14.82 5.68 7.63 10.68 3.99 All towns combined 17.00 7.23 7.40 11.00 4.98 All NJ 18.09 8.81 8.30 11.19 5.18
Note: Numerator and denominator denote annual average discharges over 2008-2010.
Denominator comprises discharges characterized by payer; rates suppressed when denominator < 50.

86 Rutgers Center for State Health Policy/RWJMS Family Medicine & Community Health, Dec 2012
Table 2.10b: Percent of Avoidable ED Visits by Type of Payer
Town Medicare Medicaid Private Self Pay Other Avenel 42.22 48.26 48.21 50.14 24.24 Carteret 44.92 60.06 51.48 52.09 22.37 Colonia 42.66 49.16 42.31 44.28 25.82 Cranbury 37.33 57.13 42.05 55.39 17.23 Dayton 38.45 50.64 44.14 39.82 20.23 Dunellen 36.38 55.09 45.43 48.72 22.80 East Brunswick 37.59 48.79 40.28 41.19 17.10 Edison 41.70 55.51 46.16 45.64 23.83 Fords 43.28 52.90 45.99 48.87 25.54 Helmetta 38.07 43.22 43.93 37.32 12.90 Highland Park 41.36 60.46 47.28 46.07 19.90 Iselin 44.52 52.08 44.78 46.22 23.19 Keasbey 48.45 59.67 55.20 55.14 24.88 Kendall Park 39.27 47.57 41.89 39.90 14.01 Metuchen 39.04 50.78 39.76 43.77 26.22 Middlesex 45.01 49.26 46.51 52.49 15.29 Milltown 37.89 48.33 39.49 43.74 16.53 Monmouth Junction 45.35 50.90 44.30 45.12 17.50 Monroe Township 36.12 49.86 40.06 45.54 18.60 New Brunswick 49.38 55.35 61.88 53.19 27.79 North Brunswick 42.41 55.72 50.89 48.93 22.89 Old Bridge 40.11 49.68 42.16 46.50 18.00 Parlin 41.93 55.07 45.30 47.61 20.98 Perth Amboy 47.71 63.76 56.06 52.98 23.00 Piscataway 44.04 56.70 48.92 45.55 22.96 Plainsboro 38.37 46.32 41.54 47.97 16.87 Port Reading 38.57 49.39 43.44 48.32 25.06 Sayreville 41.72 53.57 46.80 50.93 21.11 Sewaren 41.89 56.81 43.01 48.75 26.42 South Amboy 38.49 51.51 42.58 47.39 17.61 South Plainfield 41.73 53.86 45.96 46.66 25.34 South River 40.35 55.32 49.90 48.48 17.38 Spotswood 40.62 42.97 43.10 43.08 23.19 Woodbridge 40.55 57.22 46.43 48.26 22.99 Franklin Park 38.92 51.38 46.43 46.37 24.21 Somerset 41.42 53.89 51.86 50.61 20.27 All towns combined 41.78 58.08 48.78 49.83 21.93 All NJ 42.51 55.88 46.98 49.91 23.61
Note: Numerator and denominator denote average annual discharges over 2008-2010.
Denominator visits characterized by payer.

87 A Community Health Needs Assessment
Table 2.11a: Percent of Avoidable Hospitalizations by Patient Race
Town White Black Hispanic Other Avenel 15.45 11.29 10.63 4.74 Carteret 15.25 16.12 13.27 7.93 Colonia 12.66 14.07 9.36 7.42 Cranbury 11.61 9.31 11.15 11.20 Dayton 11.70 11.04 4.94 5.25 Dunellen 11.96 6.52 9.74 11.70 East Brunswick 11.48 11.29 10.78 8.02 Edison 13.45 11.99 8.73 6.18 Fords 12.85 11.54 11.29 6.77 Helmetta 11.05 -- -- -- Highland Park 12.17 12.31 13.22 5.22 Iselin 15.42 12.69 10.00 6.72 Keasbey 13.79 18.80 17.41 9.35 Kendall Park 11.47 15.59 7.04 7.06 Metuchen 11.93 11.57 9.09 6.96 Middlesex 12.63 10.78 7.61 9.77 Milltown 12.38 -- 1.35 2.44 Monmouth Junction 12.12 10.42 10.88 5.46 Monroe Township 12.76 15.84 9.76 8.58 New Brunswick 12.96 18.24 6.25 6.32 North Brunswick 13.08 13.97 9.42 6.29 Old Bridge 12.57 12.34 8.82 9.39 Parlin 13.18 13.92 13.02 6.74 Perth Amboy 13.38 16.57 12.66 8.25 Piscataway 12.50 12.15 6.91 7.12 Plainsboro 7.70 10.78 8.05 4.18 Port Reading 15.58 14.75 10.68 4.69 Sayreville 12.92 10.65 7.80 5.92 Sewaren 13.86 11.94 9.20 -- South Amboy 12.64 10.25 9.40 8.95 South Plainfield 14.95 12.04 6.52 7.48 South River 13.72 16.76 5.49 8.56 Spotswood 14.38 -- 12.77 3.57 Woodbridge 15.52 15.09 11.27 6.44 Franklin Park 7.44 7.95 2.94 5.85 Somerset 10.84 13.39 8.46 7.09 All towns combined 12.88 13.82 10.22 6.96 All NJ 12.95 15.72 11.67 9.18
Note: Numerator and denominator are calculated average annual discharges over 2008-2010.
Denominator comprises discharges characterized by race; rates suppressed when denominator < 50.

88 Rutgers Center for State Health Policy/RWJMS Family Medicine & Community Health, Dec 2012
Table 2.11b: Percent of Avoidable ED Visits by Patient Race
Town White Black Hispanic Other Avenel 41.91 49.67 51.87 47.90 Carteret 43.19 53.99 56.08 48.60 Colonia 39.10 52.53 46.75 43.65 Cranbury 36.90 51.68 57.83 46.06 Dayton 37.57 48.56 49.65 43.77 Dunellen 40.13 51.18 49.77 45.79 East Brunswick 36.84 51.15 46.79 40.78 Edison 40.63 52.55 51.88 43.87 Fords 40.99 52.50 48.92 47.86 Helmetta 39.92 47.74 38.34 46.70 Highland Park 39.99 55.04 54.83 48.40 Iselin 39.73 50.48 49.34 45.12 Keasbey 46.53 54.86 56.41 50.64 Kendall Park 38.09 49.13 43.66 39.95 Metuchen 37.23 50.02 44.56 42.54 Middlesex 42.88 51.86 55.77 47.18 Milltown 38.02 51.58 45.15 40.68 Monmouth Junction 40.21 50.95 48.56 42.19 Monroe Township 37.25 44.85 53.96 39.58 New Brunswick 48.40 55.53 59.32 60.73 North Brunswick 41.14 53.99 56.59 47.16 Old Bridge 39.47 50.57 49.36 42.81 Parlin 40.42 54.11 52.38 44.99 Perth Amboy 43.73 54.05 57.11 51.41 Piscataway 40.46 50.51 52.24 46.06 Plainsboro 37.68 50.81 51.44 38.13 Port Reading 39.95 53.06 43.86 46.90 Sayreville 41.56 54.51 52.60 46.62 Sewaren 40.25 51.06 49.08 47.44 South Amboy 39.62 51.83 49.46 47.20 South Plainfield 40.39 49.60 50.36 47.13 South River 42.23 56.23 55.19 49.31 Spotswood 40.64 53.64 47.43 41.00 Woodbridge 39.99 51.37 52.76 47.91 Franklin Park 39.67 51.03 52.57 41.37 Somerset 40.50 51.72 58.62 47.65 All towns combined 40.26 52.78 56.31 46.82 All NJ 40.24 54.14 54.42 47.83
Note: Numerator and denominator are calculated asaverage annual discharges over 2008-2010.
Denominator discharges characterized by race.

89 A Community Health Needs Assessment
Table 2.12a: Percent of Avoidable Hospitalizations by Patient Gender and Age
Town Male Female Age 18 to 39 Age 40-64 Age 65+ Avenel 13.54 11.61 3.58 12.46 19.88 Carteret 14.70 13.42 6.55 12.90 20.08 Colonia 13.94 10.73 3.42 7.69 18.02 Cranbury 11.47 11.24 4.56 10.62 15.56 Dayton 14.03 6.35 2.72 9.80 15.52 Dunellen 13.63 9.91 2.81 10.52 16.21 East Brunswick 11.56 10.45 4.46 9.11 14.36 Edison 13.36 9.92 2.64 9.84 17.23 Fords 13.70 10.28 2.44 9.20 18.63 Helmetta 7.66 12.08 5.00 5.33 19.32 Highland Park 12.07 11.16 2.06 12.84 15.17 Iselin 14.40 11.29 3.34 13.21 16.69 Keasbey 19.08 14.24 6.63 19.38 26.49 Kendall Park 11.95 10.13 3.52 6.63 16.26 Metuchen 11.75 10.78 3.21 10.27 15.18 Middlesex 13.30 11.13 2.33 8.97 18.61 Milltown 11.14 11.61 1.94 8.56 18.20 Monmouth Junction 11.29 9.63 4.19 10.02 17.84 Monroe Township 13.62 11.69 3.57 10.07 14.51 New Brunswick 14.86 9.13 4.14 14.54 19.13 North Brunswick 13.38 10.55 3.49 12.25 18.09 Old Bridge 13.33 11.11 4.06 10.59 16.24 Parlin 13.45 11.16 3.76 11.95 17.45 Perth Amboy 13.88 12.25 5.58 14.15 17.80 Piscataway 12.32 9.59 3.36 9.22 17.21 Plainsboro 9.67 5.35 3.06 6.80 15.62 Port Reading 15.20 14.06 4.02 9.73 20.55 Sayreville 13.57 9.90 3.94 10.71 18.18 Sewaren 16.58 9.84 4.52 8.39 23.10 South Amboy 11.61 12.28 4.73 11.92 15.57 South Plainfield 15.28 11.74 3.34 9.52 19.85 South River 14.29 11.46 5.09 12.87 17.25 Spotswood 14.58 13.33 4.21 11.42 18.29 Woodbridge 15.44 12.55 4.91 13.22 19.79 Franklin Park 7.83 6.63 1.75 7.91 11.76 Somerset 12.50 9.86 3.49 10.23 15.30 All towns combined 13.32 10.77 3.87 11.09 16.84 All NJ 14.08 12.21 4.46 12.12 18.15
Note: Numerator and denominator are calculated as average annual discharges over 2008-2010.
Denominator discharges characterized by patient age or gender.

90 Rutgers Center for State Health Policy/RWJMS Family Medicine & Community Health, Dec 2012
Table 2.12b: Percent of Avoidable ED Visits by Patient Gender and Age
Town Male Female Age 0 to 18 Age 18 to 39 Age 40-64 Age 65+ Avenel 41.84 49.49 45.31 48.02 46.01 40.47 Carteret 45.10 55.04 54.23 51.62 47.92 42.69 Colonia 38.11 44.54 37.57 43.38 42.43 42.48 Cranbury 40.87 48.31 44.13 49.01 44.35 35.02 Dayton 38.34 45.06 41.37 42.74 42.25 39.70 Dunellen 37.33 48.57 44.54 46.99 42.39 33.45 East Brunswick 34.66 43.09 35.67 42.46 39.73 36.57 Edison 39.48 48.64 45.25 46.44 43.16 40.14 Fords 38.82 49.48 45.55 46.33 43.88 40.68 Helmetta 34.61 45.80 36.25 45.43 38.94 34.41 Highland Park 40.67 49.78 47.05 47.67 45.13 39.43 Iselin 39.61 47.13 42.65 44.74 43.49 42.53 Keasbey 49.23 56.54 57.82 52.52 51.68 44.07 Kendall Park 36.09 43.62 37.17 41.53 41.51 37.92 Metuchen 35.93 43.23 37.40 41.78 39.92 39.13 Middlesex 40.02 50.20 44.25 48.58 44.80 41.50 Milltown 33.46 43.91 34.34 43.73 39.67 35.09 Monmouth Junction 38.76 47.25 40.22 47.24 42.52 40.94 Monroe Township 34.64 42.36 36.92 45.01 39.24 35.30 New Brunswick 51.91 62.03 63.94 55.17 50.75 48.23 North Brunswick 44.02 52.76 50.96 50.90 46.31 40.41 Old Bridge 36.33 45.63 37.05 45.32 41.24 39.04 Parlin 39.02 49.35 44.34 46.79 43.90 39.05 Perth Amboy 49.62 59.62 62.51 54.23 48.65 44.68 Piscataway 41.34 50.74 48.26 47.71 43.95 43.41 Plainsboro 36.46 45.43 36.78 43.87 41.66 38.70 Port Reading 36.49 47.51 39.33 46.12 41.91 39.63 Sayreville 41.07 50.07 47.66 48.53 41.91 40.98 Sewaren 38.31 48.53 44.76 43.56 43.32 44.06 South Amboy 37.39 46.60 41.69 45.36 40.96 36.26 South Plainfield 38.46 48.91 44.56 46.37 42.58 41.17 South River 41.98 52.60 53.91 48.20 42.55 39.81 Spotswood 36.15 46.26 35.58 45.65 42.04 39.84 Woodbridge 40.16 49.75 47.39 46.53 43.68 40.44 Franklin Park 38.78 48.93 43.09 47.68 43.94 38.71 Somerset 44.55 53.10 52.01 51.39 47.02 40.35 All towns combined 42.55 51.90 50.90 49.36 44.63 40.04 All NJ 41.81 51.29 47.36 49.74 45.39 40.68
Note: Numerator and denominator are calculated as average annual visits over 2008-2010.
Denominator vists characterized by patient age or gender.

91 A Community Health Needs Assessment
Table 2.13: Total and Avoidable Pediatric Hospitalizations
All Towns All NJ Rates out of 100 population
Composite Inpatient (IP) PQI (age>=6 and age<18) 0.20 0.19 All IP discharges (age>=6 and age<18) 1.78 1.65
Avoidable hospitalizations as % of all discharges (age>=6 and age<18) 11.49 11.49
Payer distribution of avoidable Pediatric discharges (% ) Medicare 0.13 0.09
Medicaid 15.95 22.06 Private 77.89 71.91
Self pay 3.39 4.58 Other 2.64 1.36
Race-ethnicity distribution of avoidable pediatric hospitalizations (%) White 39.07 40.55
Black 19.72 27.62 Hispanic 26.26 22.46
Other 14.95 9.38 Gender distribution of avoidable pediatric hospitalizations (%)
Male 48.37 49.85 Female 51.63 50.15
Avoidable pediatric discharges by payer (%) Medicare -- 5.34
Medicaid 16.20 12.46 Private 10.98 11.53
Self pay 9.75 10.21 Other 9.77 5.85
Avoidable pediatric discharges by race (%) White 10.72 9.22
Black 13.80 16.62 Hispanic 13.53 13.96
Other 8.84 9.06 Avoidable pediatric discharges by gender (%)
Male 10.24 10.69 Female 12.97 12.42
Note: figures suppressed when denominator < 50.

92 Rutgers Center for State Health Policy/RWJMS Family Medicine & Community Health, Dec 2012
Appendix 2.A: 2010 Population from Nielsen/Claritas
Town Zip code
Population with age <18
Population with age >=18 Total population
Avenel 07001 3,640 13,398 17,038 Carteret 07008 5,672 18,414 24,086 Colonia 07067 4,046 13,445 17,491 Cranbury 08512 2,666 6,878 9,544 Dayton 08810 2,341 5,474 7,815 Dunellen 08812 3,247 10,022 13,269 East Brunswick 08816 10,520 35,050 45,570 Edison 08817,08820,08837 22,354 76,870 99,224 Fords 08863 2,885 9,919 12,804 Helmetta 08828 419 1,543 1,962 Highland Park 08904 3,149 11,474 14,623 Iselin 08830 3,599 13,214 16,813 Keasbey 08832 729 1,803 2,532 Kendall Park 08824 3,826 8,992 12,818 Metuchen 08840 3,744 12,345 16,089 Middlesex 08846 3,224 10,218 13,442 Milltown 08850 1,745 6,373 8,118 Monmouth Junction 08852 4,353 11,476 15,829 Monroe Township 08831 8,754 38,413 47,167 New Brunswick 08901 11,464 41,373 52,837 North Brunswick 08902 9,239 30,654 39,893 Old Bridge 08857 9,767 30,488 40,255 Parlin 08859 5,231 16,950 22,181 Perth Amboy 08861 14,283 37,881 52,164 Piscataway 08854 11,161 40,839 52,000 Plainsboro 08536 4,511 13,895 18,406 Port Reading 07064 794 2,801 3,595 Sayreville 08872 4,616 14,444 19,060 Sewaren 07077 582 2,151 2,733 South Amboy 08879 4,666 16,484 21,150 South Plainfield 07080 5,225 17,125 22,350 South River 08882 3,626 12,018 15,644 Spotswood 08884 1,787 6,252 8,039 Woodbridge 07095 4,270 15,047 19,317 Franklin Park 08823 2,359 7,065 9,424 Somerset 08873 10,972 37,631 48,603 All town combined
195,466 648,419 843,885
All NJ
2,050,846 6,661,027 8,711,873

93 A Community Health Needs Assessment
Appendix 2.B: AHRQ PQI Conditions
INDICATOR LABEL PQI 01 Diabetes Short-Term Complications Admission Rate
PQI 02 Perforated Appendix Admission Rate PQI 03 Diabetes Long-Term Complications Admission Rate
PQI 05 Chronic Obstructive Pulmonary Disease (COPD) or Asthma in Older Adults Admission Rate PQI 07 Hypertension Admission Rate
PQI 08 Congestive Heart Failure (CHF) Admission Rate PQI 10 Dehydration Admission Rate
PQI 11 Bacterial Pneumonia Admission Rate PQI 12 Urinary Tract Infection Admission Rate PQI 13 Angina Without Procedure Admission Rate
PQI 14 Uncontrolled Diabetes Admission Rate PQI 15 Asthma in Younger Adults Admission Rate
PQI 16 Rate of Lower-Extremity Amputation Among Patients With Diabetes PQI 90 Overall PQI Composite (PQIs 1, 3, 5, 7, 8, 10, 11, 12, 13,14,15 and 16) PQI 91 Acute PQI Composite (PQIs 10, 11 and 12)
PQI 92 Chronic PQI Composite (PQIs 1, 3, 5, 7, 8, 13,14, 15 and 16)

94 Rutgers Center for State Health Policy/RWJMS Family Medicine & Community Health, Dec 2012
Appendix 2.C: AHRQ PQI Composites and Constituents
Overall Composite (PQI #90) PQI #01 Diabetes Short-Term Complications Admission Rate*
PQI #11 Bacterial Pneumonia Admission Rate
PQI #03 Diabetes Long-Term Complications Admission Rate**
PQI #12 Urinary Tract Infection Admission Rate
PQI #05 Chronic Obstructive Pulmonary Disease (COPD) or Asthma in Older Adults Admission Rate
PQI #13 Angina without Procedure Admission Rate
PQI #07 Hypertension Admission Rate PQI #14 Uncontrolled Diabetes Admission Rate
PQI #08 Congestive Heart Failure (CHF) Admission Rate PQI #15 Asthma in Younger Adults Admission Rate
PQI #10 Dehydration Admission Rate PQI #16 Rate of Lower-Extremity Amputation Among Patients With Diabetes
Acute Composite (PQI #91)
PQI #10 Dehydration Admission Rate PQI #12 Urinary Tract Infection Admission Rate
PQI #11 Bacterial Pneumonia Admission Rate
Chronic Composite (PQI #92)
PQI #01 Diabetes Short-Term Complications Admission Rate
PQI #13 Angina without Procedure Admission Rate
PQI #03 Diabetes Long-Term Complications Admission Rate
PQI #14 Uncontrolled Diabetes Admission Rate***
PQI #05 Chronic Obstructive Pulmonary Disease (COPD) or Asthma in Older Adults Admission Rate
PQI #15 Asthma in Younger Adults Admission Rate
PQI #07 Hypertension Admission Rate PQI #16 Rate of Lower-Extremity Amputation Among Patients With Diabetes
PQI #08 Congestive Heart Failure (CHF) Admission Rate
Note:
*Examples of diabetes short term complications include ketoacidosis, hyperosmolarity.
**Examples of diabetes long term complications include renal, eye, neurological, circulatory, or complications not otherwise specified.
***A discharge is categorized as uncontrolled diabetes when it has a principal diagnosis code for uncontrolled diabetes, without mention of a short-term or long-term complication.
Source: Prevention Quality Indicators Technical Specifications - Version 4.4, March 2012; http://www.qualityindicators.ahrq.gov/Modules/PQI_TechSpec.aspx.

95 A Community Health Needs Assessment
Appendix 2.D: Classification of Emergency Department Visits Type Description Diagnoses Non-Emergent: The patient's initial complaint, presenting symptoms, vital signs, medical history, and age indicated that immediate medical care was not required within 12 hours.
Headache, Dental disorder, Types of migraine
Emergent, Primary Care Treatable: Conditions for which treatment was required within 12 hours, but care could have been provided effectively and safely in a primary care setting. The complaint did not require continuous observation, and no procedures were performed or resources used that are not available in a primary care setting (e.g., CAT scan or certain lab tests)
Acute bronchitis, Painful respiration, etc
Emergent, ED Care Needed, Preventable/Avoidable: Emergency department care was required based on the complaint or procedures performed/resources used, but the emergent nature of the condition was potentially preventable/avoidable if timely and effective ambulatory care had been received during the episode of illness
flare-ups of asthma, diabetes, congestive heart failure, etc
Emergent, ED Care Needed, Not Preventable/Avoidable: Emergency department care was required and ambulatory care treatment could not have prevented the condition
trauma, appendicitis, myocardial infarction
Note: The first three categories are considered to be avoidable/preventable.
Type descriptions taken from http://wagner.nyu.edu/faculty/billings/nyued-background.php.

96 Rutgers Center for State Health Policy/RWJMS Family Medicine & Community Health, Dec 2012
Chapter 3: Health, Health Care Utilization, and Access: An Interpretation of 2012 Community Phone Survey
Introduction This chapter presents an interpretation of findings from the 2012 Community Health Needs Assessment Survey conducted by Professional Research Consultants, Inc. (PRC) for St. Peter’s University Hospital and Robert Wood Johnson University Hospital. The survey instrument was designed by researchers at the Rutgers University Center for State Health Policy with input from hospital staff and the project advisory board. English and Spanish versions of the survey questionnaire can be found at this link: http://www.cshp.rutgers.edu/Downloads/PRC/2012 PRC CHNA Survey.pdf. A detailed report of all survey methods and results can be found at: http://www.cshp.rutgers.edu/Downloads/PRC/2012 PRC CHNA Report Middlesex County NJ.pdf.
Methods The survey was conducted between May 21, 2012, and August 1, 2012. It was a random-digit dial telephone survey of non-institutionalized New Jersey adults ages 18 and over residing in Middlesex County or two zip codes in Somerset County (08873, 08823) that directly border Middlesex County. These two Somerset County zip codes are for the townships of Somerset and Franklin Park. This area was previously defined by hospital staff as their main patient service area. Interviews were completed for 1000 respondents; 750 of the completed interviews were conducted via landline telephone, while 250 were conducted via cellular telephone. Proportionate samples were drawn from each of the zip codes in the sampling area in order to ensure representativeness. Table 3.1 contains the number of interviews completed from each zip code. The overall cooperation rate for the survey was 55.9%. The questionnaire was administered to a randomly selected adult in the household and is representative of adults living in the sampled area. Adults living in the area primarily to attend college were excluded from eligibility. In those households with children, respondents also

97 A Community Health Needs Assessment
answered a subset of the same questions for a randomly selected child. Of the 1000 total interviews, 287 were completed by adults from households with children. A Spanish-translated version of the survey was administered when needed to Spanish-only-speaking adults by a bi-lingual interviewer (13 of the 1000 interviews, 1.3% of the total). The survey averaged 22.15 minutes in length. Fifty pretest interviews were conducted to ensure proper question sequencing and respondent understanding. The data was weighted to 2010 Census population estimates for the geographic area sampled for age, gender, race-ethnicity, and poverty status. These weights adjust for differences in probability of selection of households and for any biases due to non-response or sample frame coverage gaps. The full survey report contains frequencies and cross-tabulations by five measures for most items. The five measures used in the cross-tabulations were:
• Age • Gender • Race-ethnicity • Income (percent of federal poverty level, % FPL) • Health insurance coverage (non-elderly)
o Note: In the full survey report, only a few of the measures were cross-tabulated with health insurance coverage. This chapter also includes additional results of the cross-tabulations by non-elderly insurance status for the remaining variables not included in the full report.
All results shown in the full survey report and reported here use weighted data with the exception of Table 3.1 (unweighted sample sizes for each zip code), Table 3.2 (unweighted frequencies of the five crosstab variables separately by county and both counties combined, adults), Table 3.3 (unweighted crosstabs of these same five demographic variables by the landline/cell phone items, adults), and Table 3.6 (unweighted frequencies of the five crosstab variables, children) at the end of this chapter. These tables are included for reference only in order to fully describe the sample. Estimates are not described if the unweighted denominator for the cross-tabulation is less than 50 as the estimate would not be reliable. For adults, this impacts all the cross-tabulations by race-ethnicity for the “other non-Hispanic” sub-group (see yellow highlighted cell in Table 3.2). For children, this impacts all the cross-tabulations by race-ethnicity for the black non-Hispanic, Asian non-Hispanic, and other non-Hispanic sub-groups, all the cross-tabulations by income for the low income sub-group, and all the cross-tabulations by health insurance coverage for the

98 Rutgers Center for State Health Policy/RWJMS Family Medicine & Community Health, Dec 2012
uninsured sub-group (see yellow highlighted cells in Table 3.6). In addition, this impacts selected other cross-tabulations, particularly in the child results section, so they are not shown. Most of the survey questions had item non-response below 5%. For these variables, missing values are excluded from the analysis and therefore cell sizes may not total 100%. For income, a separate “don’t know/refused” category is included as 23.4% of the respondents did not provide their income (see green highlighted cell in Table 3.2). The results section is divided into two parts: the first part contains key findings for the randomly selected adult and the second for the randomly selected child (households with children only). For each measure, the overall prevalence is presented first and then the statistically significant (p<.05) cross-tabulated results are discussed. All results shown below are for the combined county sample with the exception of Table 3.2 and Table 3.4, which also provide breakdowns by county.
Findings Adults Table 3.1 contains the unweighted sample size for the number of interviews completed in each of the eligible zip codes of the hospitals’ primary service area. Table 3.2 contains the unweighted frequencies for the five measures used in the cross-tabulations. These are shown separately for the two county sub-samples and for both counties combined so that the demographic make-up of the two sub-samples can be observed and small cell sizes can be detected. Table 3.3 contains the unweighted frequencies for the same five measures by the type of telephone (landline or cell) on which the interview was completed. These are shown for the combined county sample. Overall, 75% of the interviews were conducted via landline and 25% were conducted via cell phone.
• Younger adults were more likely than older adults to complete the interview via cell phone.
• Males were more likely than females to complete the interview via cell phone. • Non-white respondents were more likely than white non-Hispanics to complete the
interview via cell phone. There were no differences among black non-Hispanics, Asian non-Hispanics, and Hispanics.
• There were no differences by income or insurance status.
99 A Community Health Needs Assessment
Description of Crosstab Groups (Age, Gender, Race-Ethnicity, Income, Health Insurance Coverage) Table 3.4 contains the weighted frequencies for the five measures used in the cross-tabulations. These are shown separately for Middlesex County and the two zip codes in Somerset County. They are also shown for the combined sample and for New Jersey overall (state data from the 2010 BRFSS). Age. Older adults comprise 18% of the sample, which is identical to that overall for the state of New Jersey in the 2010 state BRFSS data. A further breakdown of the non-elderly age groups (not shown in Table 3.4) reveals that 39.0% are ages 18-39, while 43.0% are ages 40-64. Of the 18% in the older group, about a third are over age 75. The two county samples do not significantly differ by age. Gender. Males and females are about evenly distributed across both of the county samples, the combined sample, and the state. Race-Ethnicity. The racial-ethnic distribution of the combined sample is as follows:
• 51.1% white non-Hispanics • 12.7% black non-Hispanic • 14.9% Asian non-Hispanic • 17.8% Hispanic • 3.4% other
A higher proportion of Hispanics and a lower proportion of white non-Hispanics are in the two zip codes of Somerset County compared to Middlesex County and New Jersey overall. Both county samples have a higher proportion of Asian non-Hispanics than New Jersey overall. Income. Income level is presented as a percentage of the 2011 federal poverty level (% FPL). This measure is calculated from total household income and number of household members. The table below shows the federal poverty level (100% FPL) for households of different sizes using 2011 income:

100 Rutgers Center for State Health Policy/RWJMS Family Medicine & Community Health, Dec 2012
2011 HHS Poverty Guidelines
Persons in Family
Annual Household Income (48 Contiguous States and D.C.)
1 $10,890
2 14,710
3 18,530
4 22,350
5 26,170
6 29,990
7 33,810
8 37,630
For each additional person, add 3,820 Source: Federal Register, Vol. 76, No. 13, January 20, 2011, pp. 3637-3638.
For this survey, the FPL categories used match those of the Patient Protection & Affordable Care Act (the new health reform law) in determining subsidy levels for health insurance purchase in state exchanges. The income distribution of the sample is as follows:
• 11.0% low income (<138% FPL) • 22.7% middle income (139-400% FPL) • 45.6% high income (>400% FPL) • 20.7% refused or did not know their income
(Note: these income levels are referred to as very low, low-mid, and high in the full survey report.)
The county samples do not differ significantly by income.
• Older adults were more likely to be middle income, while younger adults were more likely to be high income.
• Asian non-Hispanics and Hispanics were more likely to be low income, black non-Hispanics and Hispanics were more likely to be middle income, and white non-Hispanics and black non-Hispanics were more likely to be high income.
o 4.8% of black non-Hispanics were low income (0-138% FPL). Note: In the 2010 BRFSS for Middlesex County, 22.5% of black non-
Hispanics had incomes below $25,000 and for Somerset County, 35.7% of black non-Hispanics had incomes below $25,000.
o 21.8% of Asian non-Hispanics were low income (0-138% FPL). Note: For Asian non-Hispanics, the 2010 BRFSS indicates that 6.6% in
Middlesex County and 3.1% in Somerset County had incomes below $25,000.

101 A Community Health Needs Assessment
o Caution should be used in interpreting any results involving low income for both black non-Hispanics and Asian non-Hispanics as they may not be representative.
• The uninsured were more likely to be low or middle income, the publicly insured were more likely than the privately insured to be middle income, and the privately insured were more likely to be high income.
Health Insurance Status. Respondents were asked what type of health insurance they had, if any. Frequencies are provided below for broad coverage categories (public, private, uninsured) separately for all adults and for just the non-elderly. The uninsured rate is lower when older adults are included in the sample as most of them are insured through Medicare (as shown in the two red highlighted cells in the table below). In the combined county sample, 80.1% of older adults were covered by Medicare, and all the remaining older adults except for one person had some other type of coverage (mainly employer-sponsored as some older adults still work past retirement age). Older adults make up 54.4% of those publicly insured when looking at the insurance status of all adults (shown in the green highlighted cell of the table below).
Insurance Status All Adults Non-Elderly
% %
Public (Medicaid, Medicare, Other Public) 28.4 16.1
Private (Employer, Other Private) 64.9 75.8
Uninsured 6.7 8.2 A further breakdown of the insurance categories (not shown in Table 3.4) for all adults (non-elderly and elderly) is as follows:
• 16.1% Medicare • 3.4% Medicaid or New Jersey FamilyCare • 8.9% Other public • 54.1% Employer-sponsored • 10.8% Other private • 6.7% Uninsured
Cross-tabulation results below and throughout the remainder of the chapter are provided for non-elderly insurance status only.
• Middlesex County has a higher non-elderly uninsured rate, while the two Somerset County townships have a higher privately insured rate.
• The non-elderly uninsured rate for the combined county samples (8.2%) is considerably lower than for New Jersey overall (13.7%).

102 Rutgers Center for State Health Policy/RWJMS Family Medicine & Community Health, Dec 2012
o Black non-Hispanics and lower income respondents were more likely to be uninsured. In addition, if adults ages 18-64 are further divided into two groups, those ages 18-39 are more likely to be uninsured.
• The non-elderly publicly insured rate for the combined county samples is 16.1%. o Hispanics and low income respondents were more likely to have public coverage,
while Asian non-Hispanics were least likely to have public coverage. Finally, if respondents indicated that they had “other private” or “other coverage”, they were then asked if that coverage is part of a program such as New Jersey FamilyCare or Medicaid. This reveals that 4.1% of these adults were actually covered by Medicaid or FamilyCare. Community Problem Perception Respondents were asked to rate how big of a problem each of nine issues was in their community: availability of affordable child care, domestic violence, abuse or neglect of older adults, sexually transmitted diseases including HIV-AIDS, unemployment or job security, finding a suitable place for exercise and recreation, finding fresh fruits and vegetables, alcohol or drug abuse, and cancer. In addition, they were asked to rate how safe they felt in their neighborhood.
• About 80% of the respondents perceived that unemployment or job security were problems in their community.
• Cancer, affordable childcare, and alcohol or drug abuse were perceived to be problematic in the community for over 50% of the sample.
• Problem perception varied across issues by gender, age, race-ethnicity, income, and insurance status.
o Concerns with affordable childcare, STDs, and availability of exercise facilities or fresh fruits and vegetables decline with older age.
o Women are more concerned than men about unemployment or job security, cancer, and alcohol or drug abuse in their community.
o Unemployment/job security and cancer were not reported as highly problematic for Asian non-Hispanic respondents but they rated the availability of exercise and recreational facilities as relatively more problematic compared to the other racial-ethnic groups.
o Hispanics were more likely than other groups to be concerned about STDs and elder abuse/neglect in their community.
o White and black non-Hispanics differed little across the nine issues. o Low income participants were more likely than other income groups to rate the
availability of fresh fruits and vegetables as a major problem in the community,

103 A Community Health Needs Assessment
while middle income participants were more likely than other income groups to be concerned with unemployment or job security and alcohol or drug abuse.
o The uninsured were more likely to rate elder abuse, unemployment or job security, and finding fresh fruits and vegetables as problems in their community, and less likely to rate affordable childcare and alcohol or drug abuse as problems. Publicly insured adults were less likely to rate elder abuse or alcohol or drug abuse as problems in their community. Publicly and privately insured adults differed little across most of the issues.
• About a third of participants reported feeling somewhat or very unsafe in their neighborhood.
o This differed little by age or gender. o Hispanics and black and Asian non-Hispanics were more likely to feel unsafe in
their neighborhood. o Low and middle income participants were more likely to feel unsafe in their
neighborhood. o The uninsured were more likely to feel unsafe in their neighborhood.
Health Status Three measures of health status were examined: overall health status, dental health status, and mental health status (each rated as excellent, very good, good, fair, or poor).
• For the full sample, 14.2% reported fair or poor overall health. Older adults and middle income respondents were more likely to report fair or poor health.
• For dental health, 18.9% overall reported fair or poor dental health. Older adults, middle income respondents, and the uninsured were more likely to report fair or poor dental health
• Overall, 5.9% reported fair or poor mental health. Middle-age adults and middle income respondents were more likely to report fair or poor mental health.
Chronic Conditions Each of four chronic conditions (asthma, diabetes, high blood pressure, ‘any other type of medical condition that was serious, long-lasting, or chronic’) were assessed. For example, for asthma, the following question was asked: “Have you ever been told by a doctor, nurse, or other health care professional that you had asthma?”. The same question format was used for the other chronic conditions.
• Overall, 56.2% reported at least one chronic condition. • Asthma: 17.3% reported ever being diagnosed with asthma. Younger adults, low income
respondents, and those publicly insured had higher rates of diagnosis, while Asian non-Hispanics and the uninsured had lower rates.

104 Rutgers Center for State Health Policy/RWJMS Family Medicine & Community Health, Dec 2012
• Diabetes: 14.0% reported ever being diagnosed with diabetes. Older adults, males, Asian non-Hispanics, and middle income respondents were more likely to report having been diagnosed, while Hispanics were less likely.
• High blood pressure: 30.8% reported ever being diagnosed with high blood pressure. Older adults, white non-Hispanics, black non-Hispanics, and middle income respondents had higher diagnosis rates, while Hispanics had lower rates.
• Other chronic condition: 24.8% reported ever being diagnosed with any other serious, long-lasting, or chronic medical condition. Older adults, women, and white non-Hispanics had higher diagnosis rates, while Asian non-Hispanics had lower rates.
Obesity To assess overweight and obesity, body mass index (BMI) was calculated from reported height and weight. Respondents were then grouped into three categories: not overweight (BMI < 25), overweight (BMI 25 to < 30), obese (BMI 30+). Here is an example of weight ranges and BMI categories for someone who is 5’9” as shown on the CDC website:
Height Weight Range BMI Weight Status
5' 9"
124 lbs or less Below 18.5 Underweight
125 lbs to 168 lbs 18.5 to 24.9 Normal
169 lbs to 202 lbs 25.0 to 29.9 Overweight
203 lbs or more 30 or higher Obese
Source: http://www.cdc.gov/healthyweight/assessing/bmi/adult_bmi/index.html#Interpreted.
In addition, respondents were asked to assess their own weight status (very underweight, somewhat underweight, about the right weight, somewhat overweight, very overweight) and whether a doctor, nurse, or other health professional had given them advice about their weight in the previous 12 months.
• Overall, more than a third (38.0%) of the sample was overweight and over a quarter (28.0%) was obese.
o Males, Asian non-Hispanics, Hispanics, and middle income respondents were more likely to be overweight.
o Females, black non-Hispanics, and low income respondents were more likely to be obese, while Asian non-Hispanics were less likely.

105 A Community Health Needs Assessment
• Overall, 59.0% felt they were somewhat or very overweight, slightly less than the proportion of those that were actually overweight or obese. However, very few (10.8%) rated themselves as very overweight, while a much larger percentage thought they were somewhat overweight (48.2%).
o Males, Asian non-Hispanics, Hispanics, and those publicly insured or uninsured were less likely to feel they were overweight.
• Despite about 2/3 of the sample being overweight or obese, only 24.8% reported that a doctor or other health professional had advised them about their weight in the previous year.
o Males, Hispanics, Asian non-Hispanics, and the uninsured were even less likely to report weight advice from a doctor.
Smoking Respondents were asked if smoking was allowed in their home.
• Overall, 10.9% lived in homes where smoking was allowed. Males, adults ages 40-64, low/mid income participants, and Asian non-Hispanics were more likely to live in homes where smoking was allowed, while Hispanics and black non-Hispanics were less likely.
Medical Utilization Respondents were asked how many times in the past 12 months they had been to an emergency department (ED), to a doctor or other health professional for preventive care, to a specialist, or to a doctor or other health professional for any other health care, and how many times they had called a doctor or other health professional. Additional questions assessed the main reason they visited an emergency department and waiting time there before receiving treatment.
• At least one ED visit was reported by 20.1% of the sample. Younger adults and low income respondents, and those publicly insured or uninsured were more likely to report at least one ED visit, while Asian non-Hispanics were less likely.
• 5.9% of the respondents had more than one ED visit in the past year. Black non-Hispanics and those publicly insured or uninsured were over twice as likely to visit the ED more than once in the past year, while middle income participants were about 1.5 times more likely to do so.
• The most common reasons for using the ED instead of a regular doctor were “emergency or life-threatening situation” (63.1%), “after hours or the weekend” (17.6%), and difficulty accessing primary care such as convenience and being uninsured (9.6%).

106 Rutgers Center for State Health Policy/RWJMS Family Medicine & Community Health, Dec 2012
• Among those who visited the ED in the past year, 61.4% reported their waiting time before receiving treatment was 15 minutes or less. An additional 19.7% waited between 16-30 minutes.
• About one in five participants (19.5%) had not had a physical check-up in the past year. Younger adults, males, Hispanics, lower income respondents, and the uninsured were less likely to have had a check-up. Publicly insured respondents were more likely to have had a check-up (94.5%).
• Overall, 52.8% had seen a specialist at least once in the previous year. Older adults, women, white non-Hispanics, Hispanics, and those publicly insured were more likely to see a specialist, while black non-Hispanics and the uninsured were less likely.
• A third (33.3%) had seen a doctor or other health provider at least once in the previous year for care other than check-ups or specialty visits. Older adults, white non-Hispanics, and middle income respondents were more likely to visit a doctor for other care, while Asian non-Hispanics were less likely.
• About one-half of respondents (48.3%) had called a doctor or other health provider at least once about their health in the previous year. Older adults, females, white non-Hispanics, and black non-Hispanics were more likely to call, while Hispanics, Asian non-Hispanics, and the uninsured were less likely.
Dental Utilization Dental utilization was assessed using four measures: number of visits and number of check-ups (including cleaning visits) in the past year, insurance for dental care, and usual source of dental care.
• Three-quarters (75.1%) visited a dentist at least once in the past year and over half (54.0%) had two or more dental visits. Younger adults, males, non-whites, lower income respondents, and those without dental or health insurance were less likely to have seen a dentist in the past year.
• 71.7% had a dental check-up in the past year, and the same groups as above were less likely to have had a check-up.
• 70.5% had some type of dental insurance. Older adults, males, lower income respondents, and the uninsured (health coverage) were less likely to have dental coverage, while those privately insured were more likely. Only 6.2% of those without health insurance had dental coverage.
• The majority of respondents went to a private dentist’s office for their dental care (82.5%). Dental clinics were used by 8.5% of respondents, while 7.0% reported not having a regular dentist. Males, Asian non-Hispanics, low income respondents, and those publicly insured or uninsured were more likely to use some type of clinic for their dental care, while Hispanics were more likely to report not having a regular dentist.

107 A Community Health Needs Assessment
Mental Health Utilization Mental health utilization was assessed using two measures: number of visits to a provider (doctor, therapist, minister, or school counselor) in the past 12 months and insurance for mental health care.
• 8.1% of adults had at least one mental health visit in the previous 12 months. Females, white non-Hispanics, and those who reported fair or poor mental health were more likely to have a mental health visit.
• Of those who visited a mental health professional, 75.0% had insurance that paid for part or all of their mental health care.
Prescription Medicines Respondents were asked if they had taken any prescription medicines in the past month and, if so, how many different prescriptions of medicines had they taken.
• About six in 10 adults (60.6%) reported taking at least one prescription medicine in the previous month.
o About 2/3 (67.0%) of middle-aged adults and nine in 10 older adults (90.0%) took at least one prescription medicine in the past month.
o Older adults, females, white non-Hispanics, and middle income respondents were more likely to have taken at least one prescription medicine in the past month, while Hispanics, Asian non-Hispanics, and the uninsured were less likely.
Sources of Health Information and Health Promotion Events Respondents were asked to rate how often on a four-point scale (never, rarely, sometimes, or often) they used each of five different sources of health information (the Internet, social media such as Facebook, television, friends or family, and church or faith organizations). They were also asked how many organized health promotion events or activities such as health fairs, health screenings, or seminars they had attended in the previous 12 months.
• Overall, the Internet was used most often as a source of health information (62.5% reported sometimes or often using the Internet for health information) followed closely by friends or family (57.8%).
o Younger adults, women, and high income respondents are more likely to use the Internet for health information, while those publicly insured are less likely.
o Younger adults and women were more likely to get health information from friends and family.
• Overall, less than 10% of adults sometimes or often got health information from social media like Facebook or from church or faith organizations.

108 Rutgers Center for State Health Policy/RWJMS Family Medicine & Community Health, Dec 2012
o Younger adults, Hispanics, Asian non-Hispanics, low income respondents, and those publicly insured were more likely to use social media like Facebook for health information.
o Black non-Hispanics were about twice as likely as others to use church or faith organizations for health information.
• Over a third (35.2%) sometimes or often got health information from television. o Older adults and Asian non-Hispanics were more likely to get health information
from television. • 18.3% had attended some type of health promotion event in the past year.
o Black non-Hispanics and high income respondents were more likely to attend. o Hispanics, Asian non-Hispanics, low income respondents, and the uninsured
were less likely to attend. Usual Source of Care Usual source of care was assessed using two items: what type of place and what type of doctor or other health provider they used for regular care. In addition, typical length of time spent in the waiting room at their usual place of care was assessed.
• 13.7% reported that they did not have a usual place of care. Younger adults, males, Hispanics, low income respondents, and the uninsured were less likely to have a usual place of care.
• 76.5% went to a private doctor’s office, 8.3% went to a clinic, and 1.6% went to an emergency department for regular care.
o Males were more likely than females to go to a clinic for regular care. o Non-whites were more likely than white non-Hispanics to go to a clinic for
regular care. o Black non-Hispanics were more likely to go to the ED for regular care. o Low income respondents were more likely than other income groups to go to
either a clinic or the ED for regular care. o The uninsured were much more likely than the insured groups to go the ED for
regular care. o The publicly insured were more likely to go to a clinic for regular care.
• 52.8% of the sample saw a family medicine/general practitioner and 21.6% saw a general internist as their regular doctor, while 9.6% saw a specialist and 3.8% saw an OB/GYN as their regular doctor.
o Older adults were more likely to report that their regular doctor was a specialist. Nearly one in five (19.0%) older adults sees a specialist for regular care.
o White non-Hispanics, low-middle income respondents, and those publicly insured were also more likely to report that their regular doctor was a specialist.

109 A Community Health Needs Assessment
• Over half (57.7%) report spending less than 15 minutes in the waiting room at their regular doctor’s office, and nearly another third (31.7%) wait 16-30 minutes.
o About one in ten (10.5%) wait more than 30 minutes at their regular doctor’s office.
o Younger adults, males, Hispanics, low income respondents, and the uninsured reported longer times spent in the waiting room at their regular doctor’s office.
Barriers to Care Respondents were asked whether in the past year they had not been able to get different types of care when they wanted it (medical care or surgery, mental health care or counseling, dental care, prescription medicines). Then they were asked to rate how much of a problem (major problem, minor problem, or not a problem) for them or their family was each of six reasons why people might not be able to get the care they want (finding transportation, finding day care, finding available parking, finding a health provider who speaks the same language, time when provider is available are inconvenient, and having to wait too long to get an appointment). In addition, respondents were asked how they were treated because of their race while seeking medical care (better than, same as, or worse than others).
• About one in four (27.0%) adults reported at least one barrier to some type of care. Younger adults, females, Hispanics, low income respondents, and the uninsured were more likely to report at least one barrier. Those publicly insured and privately insured did not differ on any of the barrier measures.
• 8.3% reported a barrier to medical care, 3.0% reported a barrier to mental health care, 8.6% reported a barrier to dental care, 15.4% did not get or delayed getting a prescription filled, and 11.3% skipped doses or took smaller doses of a prescribed medication in order to make the prescription last longer and save costs.
o Medical care barriers: younger adults, females, Hispanics, black non-Hispanics, and the uninsured were more likely to report a barrier.
o Mental health care barriers: younger adults, Hispanics, lower income respondents, and the uninsured were more likely to report a barrier.
o Dental care barriers: younger adults, Hispanics, black non-Hispanics, lower income respondents, and the uninsured were more likely to report a barrier.
o Prescribed medicine barrier #1 (did not get or delayed getting): younger adults, females, Hispanics, low income respondents, and the uninsured were more likely to report a barrier.
o Prescribed medicine barrier #2 (skipped doses or took smaller doses to save costs): females, Hispanics, and lower income respondents were more likely to report a barrier.

110 Rutgers Center for State Health Policy/RWJMS Family Medicine & Community Health, Dec 2012
• When seeking medical care, over half (52.9%) reported at least one major or minor problem. Younger adults, females, and Asian non-Hispanics were more likely to report at least one major or minor problem.
o Specifically, 7.6% reported problems finding transportation, 10.7% reported problems finding day care, and 16.0% had difficulty finding available parking when seeking medical care. Problems finding transportation: older adults, Asian non-Hispanics,
lower income respondents, and the uninsured were more likely to report a problem.
Problems finding day care: younger adults, Asian non-Hispanics, and lower income respondents were more likely to report a problem.
Problems finding available parking: Asian non-Hispanics, Hispanics, lower income respondents, and those publicly insured or uninsured were more likely to report a problem.
o Provider characteristics were also cited as reasons why people may not get the medical care they need. 8.0% reported problems finding a health provider who speaks their language, 35.3% said that the provider’s hours did not fit their schedule, and 34.8% said they had to wait too long to get an appointment. Problems finding provider who speaks their language: females were
more likely to report a major problem. Problems with provider’s available hours: younger adults and Asian non-
Hispanics were more likely to report a problem, while those publicly insured were less likely.
Problems waiting too long to get an appointment: younger adults, females, Asian non-Hispanics, and the uninsured were more likely to report a problem.
• Only 1.9% said that they were treated worse due to their race when seeking medical care. Black non-Hispanics, Hispanics, and the uninsured were more likely to report this.
Attitudes about Health and Health Care Respondents reported their level of agreement (strongly agree, somewhat agree, somewhat disagree, or strongly disagree) with seven statements about health and health care:
1. “Having my routine medical needs taken care of at a public or free clinic is just fine with me.”
• Overall, 41.3% agreed with this statement. • Younger adults, males, Asian non-Hispanics, lower income respondents, and
those publicly insured or uninsured were more likely to agree.

111 A Community Health Needs Assessment
2. “Having my routine medical needs taken care of at the emergency room is just fine with me.”
• Overall, 34.2% agreed with this statement. • Males, Hispanics, Asian non-Hispanics, lower income respondents, and those
publicly insured or uninsured were more likely to agree. 3. “If you are healthy, having health insurance is still a necessity.”
• Overall, 96.3% agreed with this statement. • Black non-Hispanics, lower income respondents, and the uninsured were less
likely to agree. 4. “If you wait long enough, most health problems go away by themselves.”
• Overall, 29.7% agreed with this statement. • Younger adults, males, Asian non-Hispanics, and lower income respondents were
more likely to agree. 5. “For the most part, I only go to the doctor when a health problem gets bad.”
• Overall, 57.6% agreed with this statement. • Younger adults, Asian non-Hispanics, Hispanics, lower income respondents, and
the uninsured were more likely to agree, while publicly insured respondents were less likely to agree.
6. “Even when I am sick, I prefer not to take medicines.” • Overall, 40.1% agreed with this statement. • Younger adults were more likely to agree, while Hispanics and those publicly
insured were less likely to agree. 7. “I am a lot more likely to take risks than the average person.”
• Overall, 34.2% agreed with this statement. • Younger adults, males, Asian non-Hispanics, Hispanics, lower income
respondents, and the uninsured were more likely to agree. Emergency Preparedness Two items were used to assess whether respondents were prepared for a disaster such as a major hurricane or terrorist attack. They were asked whether their family had “a specific plan for where to go in the event of an evacuation” and whether they had “essential documents such as birth certificates and insurance policies and other special items you may need such as medicine and baby formula organized and ready to be taken with you during an evacuation”.
• Overall, only 30.0% had a specific plan for where to go in the event of an evacuation. Hispanics and those publicly insured were more likely to have a specific plan, while Asian non-Hispanics and the uninsured were less likely.

112 Rutgers Center for State Health Policy/RWJMS Family Medicine & Community Health, Dec 2012
• About half (49.6%) had essential documents and other special items organized and ready for an evacuation. Older adults, Hispanics, and those publicly insured were more likely to report this, while Asian non-Hispanics and the uninsured were less likely.
Socio-demographics In addition to age, gender, race-ethnicity, and income which were used in the cross-tabulations and were described earlier, several other socio-demographic characteristics were assessed: country of birth, citizenship status, time in US if an immigrant, primary language spoken at home, number of people in the household, own or rent home, marital status, education, employment status, and receipt of government assistance (SSI, SSDI, TANF, food stamps, WIC). The first three were combined into immigration status (US born US citizen, foreign-born US citizen, non-citizen in US more than 5 years, non-citizen in US less than 5 years.)
• 75.2% were US-born US citizens, 19.2% were foreign-born US citizens, 3.6% were non-citizens who had been in the US more than 5 years, and 2.0% were newly immigrated non-citizens.
o Younger adults, males, and Asian non-Hispanics were more likely to be both foreign-born US citizens and non-citizens.
o Hispanics, lower income respondents, and the uninsured were more likely to be foreign-born US citizens.
o Those privately or publicly insured were more likely to be US born US citizens. • English was the primary language spoken at home for 85.8% of respondents.
o 6.9% spoke a South Asian language at home. o 3.8% spoke Spanish at home. o 1.8% spoke a European language at home. o 1.2% spoke an East Asian language at home.
• On average, there were 3.5 people per household overall. Younger adults, males, Hispanics, Asian non-Hispanics, lower income respondents, and the uninsured reported larger households than average, while white non-Hispanics reported smaller households.
o It is possible that the higher number of people in Hispanic and Asian non-Hispanic households may be contributing to higher rates of low income in these two sub-groups. Incomes were expressed as a percentage of the federal poverty level, which is calculated based on household income and number of people in the household.
• 81.1% owned their homes. Younger adults, black non-Hispanics, Hispanics, lower income respondents, and the uninsured were more likely to rent than other groups.

113 A Community Health Needs Assessment
• 64.0% were married or living with a partner, 16.9% were single never married, 8.6% were widowed, and 10.4% were separated or divorced. 90.5% of Asian non-Hispanics were married.
• The sample was highly educated overall, with 53.4% reporting a college degree or higher. 18.3% had a high school diploma or less, while 27.5% had a post-graduate degree.
o Older adults, lower income respondents, and those publicly insured or uninsured had less education.
o Asian non-Hispanics had more education (over half of Asian had post-graduate degrees and another quarter had college degrees).
• 64.1% were employed, 8.9% were unemployed, 2.6% were unable to work, and 24.4% were not looking for work (homemaker, retired, student, etc.).
o Of those who were unemployed, about half had been unemployed for more than a year.
o Younger adults, females, non-whites, lower income respondents, and those publicly insured were more likely to be unemployed.
o The uninsured and those privately insured did not differ as to whether they were employed (87.7% and 86.5% employed, respectively).
• 19.6% received some type of government assistance. Males, lower income respondents, those publicly insured, and the uninsured were more likely to receive assistance.
Cell Phone Usage Researchers have found that, along with demographic differences such as age, gender, and race-ethnicity, some health measures also vary by wireless status (see early estimates of wireless substitution for January-June 2011 as reported by the National Health Interview Survey, NHIS, at http://www.cdc.gov/nchs/data/nhis/earlyrelease/wireless201112.pdf). This report from the CDC-sponsored NHIS shows that those from cell phone only homes were more likely to binge drink, smoke, participate in regular leisure-time physical activity, lack health insurance, experience financial barriers to seeking medical care, or get tested for HIV and less likely to have a usual place for medical care, have ever been diagnosed with diabetes, or receive an influenza immunization than those in landline homes. These are likely due to demographic differences, as cell-phone users are more likely to be younger, males, minorities, and low income respondents. In fact, in the NHIS report, about 6 out of every 10 (58.1%) adults ages 25-29 lived in cell-phone only homes in the first half of 2011. All of these factors point to the importance of including cell phone users in a telephone survey. Respondents here were asked how many different landline and cell phone numbers are in their households. If they had both landline and cell phone numbers, they were asked what percent of

114 Rutgers Center for State Health Policy/RWJMS Family Medicine & Community Health, Dec 2012
calls were received on their cell phone. Non-telephone coverage was estimated by asking respondents about phone service interruptions in the past year. It has been shown that households with transient telephone coverage are much more similar to continuous non-telephone households than to continuous telephone households on both demographic variables and other variables such as health status and health insurance coverage (Keeter, S., 1995, Estimating telephone noncoverage bias with a telephone survey, Public Opinion Quarterly, 59, pp. 196-217). This technique is a cost-effective way to reduce the bias from telephone non-coverage. Overall, 5.9% lived in landline-only households and 4.6% lived in cell phone-only households: the remaining (86.6%) lived in homes with both landlines and cell phones or did not answer the question (2.8%).
• Note: The NHIS report referenced above shows that 31.6% of US households were cell phone-only households, and the rate is 1.5 to 2 times higher for younger adults. 11.2% of US households were landline-only households.
o New Jersey has a lower prevalence of cell phone-only households than the US average (http://www.cdc.gov/nchs/data/nhsr/nhsr039.pdf). This report on the CDC website uses data from the years 2007-2010, so it is not exactly comparable, especially since the percentage of cell phone-only households has been growing 3 to 4 percentage points a year.
o 18.8% of households in the Northeast were cell-phone only households in January-June 2011 according to the NHIS report cited earlier.
• Younger adults, males, Hispanics, and lower income respondents were more likely to live in cell phone-only households. Surprisingly, there were no differences for insurance status.
• Older adults, white non-Hispanics, and the uninsured were more likely to live in landline-only households.
• 30.0% of those with both a landline and cell phone reported that most (>75%) of their calls were received on their cell phone.
o This is nearly identical to the figure reported by the NHIS for cell phone-mostly households for January-June 2011 (29.8%).
• 12.1% reported phone service interruptions of at least a week in the previous week. Younger adults and low income respondents were more likely to report a service interruption.

115 A Community Health Needs Assessment
Children In those households with children, the adult respondent also answered a subset of the same questions about a randomly selected child. This section presents an interpretation of those findings. Detailed descriptions of each item can be found in the adult section of the results. All results shown use weighted data. Description of Crosstab Groups (Age, Gender, Race-Ethnicity, Income, Health Insurance Coverage) Age. Frequencies are provided below for two different age breakdowns for children, while cross-tabulations are provided later for the broad categories:
• Detailed age groups o Ages 0-4 32.0% o Ages 5-9 30.7% o Ages 10-14 23.1% o Ages 15-17 14.1%
• Broad age groups o Ages 0-9 62.7% o Ages 10-17 37.3%
Gender. The gender breakdown for the children was as follows:
• Male 56.3% • Female 43.7%
Race-Ethnicity. The racial-ethnic breakdown for the children was as follows:
• White non-Hispanic 37.8% • Black non-Hispanic 11.1% • Asian non-Hispanic 18.4% • Hispanic 26.3% • Other non-Hispanic 6.5%
As noted before, due to the small number of children in the black non-Hispanic, Asian non-Hispanic, and other non-Hispanic sub-groups, cross-tabulation results for these sub-groups will not be shown as they would not be statistically reliable. Income. The income distribution for the children was as follows:
• Low income 12.2% • Middle income 26.5% • High income 46.4%

116 Rutgers Center for State Health Policy/RWJMS Family Medicine & Community Health, Dec 2012
• Don’t know/refused 14.8% There were no differences in income by age or gender. Hispanic children were more likely to be lower income. Health Insurance Status. Respondents were asked if the child was covered by their own health insurance. If not, the same coverage question was asked that was asked of the adults. Frequencies are provided below for two different health coverage breakdowns for children, while cross-tabulations are provided for the broad categories:
• 91.0% of the children were covered by the adult respondents’ health insurance plans. • Detailed health insurance coverage groups
o Medicare 0.5% o Medicaid 3.8% o NJ FamilyCare 4.0% o Employer-provided 69.4% o Other private 13.4% o Other 9.0% o Uninsured 1.8%
• Broad health insurance coverage groups o Public (Medicare, Medicaid, NJ FamilyCare, Other) 17.1% o Private (employer-provided, other private) 81.1% o Uninsured 1.8%
• Hispanic children were more likely to have public coverage. • Due to the low number of uninsured children, cross-tabulated results for the uninsured
are not shown as they would not be statistically reliable. Health Status Respondents assessed the overall, dental, and mental health status of the randomly selected child. Findings for those in fair or poor health are shown.
• Only 3.2% of the children were reported to be in fair or poor overall health. Cross-tabulated results are not shown as the number of children with fair or poor health (n=12) was too small for statistical reliability.
• Fair or poor dental health was reported for 5.2% of the children overall. Again, cross-tabulated results are not shown as the number of children with fair or poor health (n=20) was too small for statistical reliability.
• Fair or poor mental health was reported for 6.4% of the children. As before, cross-tabulated results are not shown as the number of children with fair or poor health (n=25) was too small for statistical reliability.

117 A Community Health Needs Assessment
Chronic Conditions Despite the low prevalence of fair or poor health reported for children, many of them were reported as having been diagnosed with chronic disease.
• 23.6% of the children had been diagnosed with at least one chronic condition. Older children, children in high income households, and publicly insured children were more likely to have been diagnosed with at least one chronic condition.
• 15.5% of the children had been diagnosed with asthma. Older children were more likely to have been diagnosed with asthma.
• Only 0.9% of the children had been diagnosed with diabetes. Cross-tabulated results are not shown as the number of children diagnosed with diabetes (n=3) was too small for statistical reliability.
• Only 0.2% of the children had been diagnosed with high blood pressure. Cross-tabulated results are not shown as the number of children diagnosed with high blood pressure (n=1) was too small for statistical reliability.
• 10.0% of the children had been diagnosed with some other chronic condition. Cross-tabulated results are not shown as the number of children diagnosed with some other chronic condition (n=39) was too small for statistical reliability.
Medical Utilization Emergency department (ED) visits, doctor visits for preventive care, specialty care, and other care, and calls to the doctor in the past 12 months were also asked of the random child, along with the same follow-up questions to the ED utilization item (main reason for using the ED and waiting time in the ED before treatment).
• 18.9% of the children visited an ED in the past 12 months. o Boys, Hispanic children, and publicly insured children were more likely to have
visited an ED. o Only 2.7% of the children had more than one ED visit in the past 12 months. o Emergency (61.2%) and after hours (30.3%) were cited most often as the main
reason an ED was visited instead of a doctor’s office or clinic. o 37.9% waited less than 15 minutes, 38.7% waited 16-30 minutes, 11.7% waited
31-60 minutes, and 11.7% waited an hour or more in the ED before receiving treatment.
• 91.5% of the children had been to the doctor for at least one well-child visit in the past 12 months. Cross-tabulated results are not shown as the number of children without a well-child visit (n=33) was too small for statistical reliability.
• A third (33.0%) of the children had at least one visit to a specialist in the past 12 months, and nearly two-thirds (63.9%) of those children had more than one specialty visit. Older children, children in higher income households, and privately insured children were

118 Rutgers Center for State Health Policy/RWJMS Family Medicine & Community Health, Dec 2012
more likely to have visited a specialist, and Hispanic children and publicly insured children were less likely.
• 38.7% of the children had been to the doctor for reasons other than check-ups or specialty care in the past 21 months, and nearly three-fourths (73.4%) of those children had two or more other doctor visits. Younger children and white non-Hispanic children were more likely to have had such visits, while publicly insured children were less likely.
• 60.4% reported at least one call to a doctor regarding the child’s health in the past 12 months. Calls to the doctor were more likely among younger children, and children in middle income households, and less likely among publicly insured children.
Dental Utilization The same dental questions asked of the respondent were also asked regarding the child (number of dental visits and number of dental check-ups including cleaning in the past 12 months, times since last dental visit, dental insurance coverage, and usual place for dental care).
• About three-fourths (72.4%) of the children had seen a dentist at least once in the past 12 months. Younger children, Hispanic children, and children in middle income households were less likely to have seen a dentist, while publicly insured children were more likely.
• A nearly-identical percentage (72.1%) of the children had at least one dental check-up in the past 12 months. Again, younger children, Hispanic children, and children in middle income households were less likely to have had a dental check-up, while publicly insured children were more likely to have had a dental check-up.
• 84.9% of the children had insurance that covered at least part of their dental care. Privately-(health) insured children were less likely to have dental insurance, while publicly-(health) insured children were more likely.
• 76.7% of children got their regular dental care at a private dentist’s office, while 8.5% of children went to a dental clinic, 1.9% went a hospital dental clinic, and 12.1% did not have a usual place for dental care. Younger children, boys, and Hispanic children were less likely to use a private dentist’s office.
Mental Health Utilization As for the adults, respondents were asked if the child had received any care for a mental health problem in the past 12 months and if any part of the child’s mental health care was covered by insurance.
• 8.1% had received care for a mental health problem in the past 12 months, and most (82.7%) of those children had 3 or more mental health visits. Older children were more likely to have received such care.

119 A Community Health Needs Assessment
• Of those children who received mental health care, 83.7% had insurance that covered at least part of mental health care.
o Note: this question was only asked of those who sought mental health care. Prescription Medicines Likewise, the same items were asked about the child regarding prescription medication use in the previous month.
• About three in 10 children (29.0%) had taken at least one prescription medicine in the past month. White non-Hispanic children and higher income children were more likely to do so, while Hispanic children were less likely.
Usual Source of Care Respondents were also asked where the child usually went for health care and what type of doctor or other provider was used.
• 12.9% of the children did not have a usual source of care, and 0.3% usually went to the ED for care. 6.7% of children usually went to a clinic of some type.
o Hispanic children and publicly insured children were less likely to have a usual source of care.
o Publicly insured children were more likely to use a clinic. • Only 0.9% of the children did not have a regular doctor.
o Pediatricians (59.2%) were cited by most as the type of doctor they considered their child’s regular doctor, followed by family medicine (29.6%).
o 5.1% considered a specialist to be their child’s regular doctor. Barriers to Care The same five items measuring whether there were barriers to different types of care (medical care or surgery, mental health care or counseling, dental care, and prescription medicines) in the previous 12 months were asked regarding the child. Due to the low number of children with barriers reported, cross-tabulated results are not shown for any of these measures as they would not be statistically reliable.
• Overall, 11.3% had at least one barrier to care. • Medical care barriers were reported for 4.7% of the children overall. • Mental health barriers were reported for only 0.6% of the children overall. • Dental care barriers were reported for 4.0% of the children overall • 2.5% of the children delayed or did not get a prescription filled due to cost, and 2.3% of
the children took less of a prescribed medication in order to make it last longer and save costs.

120 Rutgers Center for State Health Policy/RWJMS Family Medicine & Community Health, Dec 2012
Socio-demographics In addition to age, gender, race-ethnicity, and income which were used in the cross-tabulations and described earlier, some of the additional socio-demographic questions asked of the respondent were also asked regarding the randomly selected child. As before, country of birth, citizenship status, and time in US if an immigrant were combined into immigration status. In addition, receipt of free or reduced-cost school meals was assessed.
• 96.1% of the children were US-born US citizens, 1.1% were foreign-born US citizens, 0.2% were non-citizens who had been in the US more than 5 years, and 2.7% were newly immigrated non-citizens.
• 9.3% of the children received free or reduced-cost breakfast or lunch at school or daycare.
Conclusions Adults Table 3.5 (8 pages) gives a summary of all the adult results. If a group is significantly more likely than the other groups on a measure, then the word “more” appears in the cell. Likewise, if the group is significantly less likely than the other groups on a measure, then the word “less” appears in the cell. For those measures that indicate a health-related vulnerability or health care access concern, color highlighting has been used. Some measures are not highlighted at all as it is unclear whether being more or less likely on these measures indicates a health concern; for example, being more likely to have a specialty visit could indicate poor health but it could also indicate better access to specialty care, so this measure is not highlighted for any sub-group. Similarly, only measures related to personal health or access concerns are highlighted; for example, feeling that cancer is a problem in one’s community would never be highlighted as it does not mean that the respondent has cancer. Each sub-group has the same color highlighting across all measures. At the bottom of the table, the health vulnerabilities/access concerns are summed for each sub-group. For example, adults ages 65 and over are more likely than younger adults to report fair or poor overall health. So the word “more” appears in this cell. It is also highlighted in green, which means that this is a health-related vulnerability or concern. At the bottom of the column for older adults, there is a number “8” which indicates there are 8 total health or access concerns for older adults across all measures. Table 3.5a (4 pages) is an abbreviated version of Table 3.5 that contains only those items that indicate a health-related vulnerability or health care access concern. Overall, 14.2% of adults reported fair or poor general health, 18.8% reported fair or poor dental health, and 5.9% reported fair or poor mental health. Over half (56.2%) of adults had been

121 A Community Health Needs Assessment
diagnosed with at least one chronic condition; 30.8% had been diagnosed with high blood pressure. About two-thirds of adults (66.0%) were either overweight or obese, but only 24.8% had received advice about their weight from a health care provider in the past year. 20.1% of adults had visited the ED in the past year and about a third of those had visited the ED more than once. The majority (81.2%) spent less than 30 minutes in the ED before being seen by a health care provider. 80.5% had a physical check-up and 71.7% had a dental check-up in the past year. About a fourth (27.0%) reported at least one major barrier to wanted care. Over half (52.9%) reported at least one problem with navigating the health care system; inconvenient doctor’s hours and having to wait too long to get an appointment were cited most often. Prescription medication use was high, with 60.6% of adults taking at least one prescription medicine in the past month and even higher rates among older adults, females, white non-Hispanics, middle-income respondents, and those publicly insured. Younger adults had nearly three times as many total areas of concern as older adults. Similar to the BRFSS results, younger adults reported more problems with health care access measures than older adults, but older adults fared worse on the health status measures. There were a few exceptions: younger adults were more likely to have ever been diagnosed with asthma; older adults were less likely to have dental insurance and more likely to have transportation issues when seeking medical care. Younger adults were more likely than older adults to have at least one ED visit, less likely to have either a physical or dental check-up, less likely to have a usual source or care, and more likely to have a long wait in the waiting room when visiting their regular doctor. Younger adults were more likely to report not getting care when they wanted it for all types of care: medical, dental, mental health, and prescription medicines. They were also more likely to report specific barriers when seeking medical care such as daycare, inconvenient doctor’s hours, and having to wait too long to get an appointment. Younger adults also took more chances with their health as they were more likely to agree that health problems will go away if you wait long enough, that they only go to the doctor if a problem gets bad, that they prefer not to take medicines when sick, and that they are more likely to take risks than others. Encouragingly, younger adults ages 18-39 and households with children were less likely to live in a house where smoking was allowed. Older adults were more likely to report fair or poor overall health and fair or poor dental health. Older adults were also more likely to be diagnosed with diabetes, high blood pressure, or other chronic condition. Males had about 1.5 times as many total areas of concern as females. Again similar to the BRFSS results, males fared worse on health care utilization-related measures and risky health attitudes and behaviors, while females reported more problems with access. Males were less likely than females to have a physical or dental check-up, to have a usual source of care, or to perceive themselves as overweight, and more likely to live in a home where smoking is allowed,

122 Rutgers Center for State Health Policy/RWJMS Family Medicine & Community Health, Dec 2012
to be diagnosed with diabetes, or to be overweight. Male were also more likely to agree that they are okay using the ED for routine care, that health problems will go away if you wait long enough, and that they are more likely to take risks than others. Females were more likely to be diagnosed with any other chronic condition, to be obese, and to not get wanted medical care or prescriptions. Females were also more likely to report language problems with the doctor and having to wait too long to get an appointment when seeking medical care. Hispanics and Asian non-Hispanics had the most total areas of concern. However, a close inspection of Table 3.5 reveals that for Asians, most of their concerns deal with issues related to navigating the health care system. Asians are much more likely to report hassles such as finding transportation, child care, or parking when seeking medical care, and are also more likely to report that the doctor’s hours are inconvenient or that they have to wait too long to get an appointment. However, Asians do not report any barriers to getting care when they want it and fare better on most health status and utilization measures. There are two exceptions: Asians are more likely to have ever been diagnosed with diabetes and less likely to get a dental check-up; the same exceptions for Asians were found in the BRFSS data. Hispanics, on the other hand, are much more likely to report basic access problems such as getting any type of wanted care (medical, dental, mental health, or prescription medicines). Hispanics are also less likely to have a usual source of care, less likely to get physical or dental check-ups. Both Hispanics and Asians are more likely to have risky health-related attitudes. As shown on Table 3.5, Black non-Hispanics had a moderate number of concerns, but the total for blacks was about half the number for Hispanics and Asians. It is possible that health disparities may be improving for blacks in some areas. However, it should also be noted that the results for blacks should be interpreted with caution as there were fewer than five black adults in the low income group, which is not sufficient for statistical reliability and so results may not be representative of the low-income black population. There were still some areas of concern, though. Blacks were more likely to be uninsured, to have ever been diagnosed with high blood pressure, to be obese, to use the ED as their regular source of care, to not get wanted medical or dental care, and to report being treated worse due to race when seeking medical care. Blacks were less likely to have a dental check-up or dental insurance. On a positive note, blacks and whites were equally likely to have appropriate health-related attitudes, and blacks were most likely to feel that health insurance is necessary even if healthy. White non-Hispanics fared better on most measures, with the exception that they were more likely to have ever been diagnosed with high blood pressure or other chronic condition. Both low and middle income respondents fared worse on many measures. Both groups were less likely to have health or dental insurance or to have had a physical or dental check-up. Both

123 A Community Health Needs Assessment
groups were also more likely to report barriers to wanted dental or mental health care or hassles such as problems with transportation, day care, and parking when seeking medical care, and both groups had riskier health-related attitudes. But there were also some differences between the two groups. The middle income group fared worse on health status measures. They were more likely to report fair or poor overall health, dental health, and mental health, and also more likely to have ever been diagnosed with diabetes or high blood pressure. However, low income respondents were more likely to have been diagnosed with asthma. Middle income respondents were more likely to be overweight, while low income respondents were more likely to be obese. Low income respondents were more likely to have at least one ED visit and less likely to have a usual source of care. Overall, the uninsured had the most health concerns or vulnerabilities compared to any other sub-group. They fared worse on dental health status although they were not significantly different from the publicly or privately insured for overall health status and mental health status. Surprisingly, they did not report higher diagnosis rates for any of the chronic conditions. This could be due to lower illness, but it could also be due to less opportunity for diagnosis since this group was much less likely to have had check-ups. The uninsured also fared worse on most health care utilization measures and access measures (both general and specific), and had riskier health-related attitudes. Similar to the BRFSS findings, the health-related disparities among the lower income respondents and the uninsured are quite large, and it appears that some racial-ethnic disparities seem to be improving. However, many disparities remain, and there are new challenges with the growing Asian non-Hispanic population who seem to be facing specific problems with navigating the health care system. Children Table 3.8 (6 pages) gives a similar summary of all the results for children. Due to the low number of children in some sub-groups and for certain responses to some measures, cross-tabulation results for these groups or items are not displayed due to lack of statistical reliability. This limits the interpretation of results for these sub-groups and measures. For those comparisons that were able to be made, Hispanic children and publicly insured children had the most health or access concerns, followed by children from middle income households. The number of uninsured children, low income children, black non-Hispanic children, Asian non-Hispanic children, and children of other race was too low to conduct cross-tabulations for any of the measures, but it is likely that many in these sub-groups also have more health or access concerns.

124 Rutgers Center for State Health Policy/RWJMS Family Medicine & Community Health, Dec 2012
Younger children (ages 0-9) were less likely than older children to get a dental check-up and less likely to visit a private dentist’s office for regular dental care. Older children (ages 10-17) were more likely to have ever been diagnosed with asthma or any chronic condition, and were more likely to have sought mental health care. Boys were more likely than girls to have had at least one ED visit in the past 12 months and were less likely to visit a private dentist’s office for regular dental care. Boys were also more likely to receive free or reduced cost breakfast or lunch at school. Hispanic children were more likely to live in low-income households and to receive free or reduced cost breakfast or lunch at school, and were more likely to have had at least one ED visit in the past 12 months. Hispanic children were less likely to have a usual source for medical care, and were also less likely to have had a dental visit in the past year or to visit a private dentist’s office for regular dental care. Children in middle-income households were more likely than those in high-income households to receive free or reduced cost breakfast or lunch at school, and were less likely to have a usual source for medical care, to have had a dental check-up in the past 12 months, or to have dental insurance. Children in high-income households were more likely to have ever been diagnosed with asthma. Publicly insured children were more likely to live in low-income households, to receive free or reduced cost breakfast or lunch at school, and to have had at least one ED visit in the past 12 months, and were less likely to have a usual source for medical care. They were also more likely to have ever been diagnosed with any chronic condition. However, publicly insured children fared well in the dental utilization measures as they were more likely to have had a dental check-up in the previous year and to have dental insurance. Privately insured children were less likely to have dental insurance. In summary, not having a usual source for medical care was a problem across many sub-groups of children. One or more dental utilization measures were also problematic for nearly all groups. Over 15% of the children overall had ever been diagnosed with asthma, so this remains a concern. Nearly one in five children had at least one ED visit in the past year, and this was even more likely in several sub-groups of children. Taking at least one prescription medication in the past month was reported for nearly one in three children, and was even higher among white non-Hispanic children (44.9%) and children in high-income households (41.9%).

125 A Community Health Needs Assessment
Table 3.1: Sample Size for Each Zip Code, Middlesex County and Two Somerest County Zip Codes (unweighted)
Zip Code
N
07001
21
07008
22
07064
4
07067
24
07077
4
07080
30
07095
20
08512
14
08536
20
08810
10
08812
17
08816
54
08817
53
08818
1
08820
45
08823
16
(Somerset County)
08824
12
08828
5
08830
21
08831
54
08832
3
08837
18
08840
19
08846
20
08850
11
08852
21
08854
72
08855
1
08857
46
08859
20
08861
49
08863
16
08872
22
08873
63
(Somerset County)
08879
30
08882
18
08884
8
08901
54
08902
42
08903
2
08904 18
Total
1,000 Source: Data from 2012 SPUH/RWJUH Community Health Needs Assessment Survey;
fieldwork & analysis by PRC; tabulations by Rutgers Center for State Health Policy.

126 Rutgers Center for State Health Policy/RWJMS Family Medicine & Community Health, Dec 2012
Table 3.2: Individual Characteristics, Adults Ages 18+, Middlesex County and Two Zip Codes in Somerset County (separately and together) (unweighted)
Middlesex County
2 Somerset County Zips
Combined Sample
N
N
N
Total Adult Sample 895
105
1,000
Age 18-64 660
79
739
65+ 219
25
244 Don't know/refused 16
1
17
Gender Male 294
39
333
Female 559
62
621 Don't know/refused 42
4
46
Race-ethnicity White non-Hispanic 638
64
702
Black non-Hispanic 71
20
91 Hispanic 78
9
87
Asian non-Hispanic 70
7
77 Other non-Hispanic 20
3
23
Don't know/refused 18
2
20 Income (household)
Low 126
13
139 Middle 207
21
228
High 355
44
399 Don't know/refused 207
27
234
Health Insurance (18-64) Public 103
14
117
Private 498
64
562 Uninsured 55
1
56
Don't know/refused 4
0
4
Source: Data from 2012 SPUH/RWJUH Community Health Needs Assessment Survey; fieldwork & analysis by PRC; tabulations by Rutgers Center for State Health Policy.

127 A Community Health Needs Assessment
Table 3.3: Phone Characteristics, Adults Ages 18+, Middlesex County and Two Zip Codes in Somerset County (unweighted)
Landline
Cell Phone
%
N
%
N
Total 75.0
750
25.0
250
Age 18-64 72.5
536
27.5
203
65+ 83.6
204
16.4
40 Gender
Male 64.9
216
35.1
117 Female 78.6
468
21.4
133
Race-ethnicity White non-Hispanic 78.2
549
21.8
153
Black non-Hispanic 65.9
60
34.1
31 Hispanic 64.4
56
35.6
31
Asian non-Hispanic 67.5
52
32.5
25 Other non-Hispanic 73.9
17
26.1
6
Income (household) Low 74.8
104
25.2
35
Middle 75.0
171
25.0
57 High 74.2
296
25.8
103
Don't know/refused 76.8
179
23.2
54 Health Insurance (18-64)
Public 72.6
85
27.4
32 Private 72.6
408
27.4
154
Uninsured 71.4
40
28.6
16
Source: Data from 2012 SPUH/RWJUH Community Health Needs Assessment Survey; fieldwork & analysis by PRC; tabulations by Rutgers Center for State Health Policy.
Note: Don't know and refused responses excluded unless > 5%, so cell sizes may not total full sample size.

128 Rutgers Center for State Health Policy/RWJMS Family Medicine & Community Health, Dec 2012
Table 3.4: Individual Characteristics, Adults Ages 18+, Middlesex County and Two Zip Codes in Somerset County and Total New Jersey
Middlesex County
2 Somerset County Zips
Combined Sample
New Jersey*
%
N
%
N
%
N
%
Total Adult Population 89.7
897
10.3
103
100.0
1,000
100.0
Age 18-64 81.5
719
86.4
89
82.0
808
82.0
65+ 18.5
163
13.6
14
18.0
177
18.0 Gender
Male 48.9
417
52.9
54
49.3
470
48.3 Female 51.1
436
47.1
48
50.7
484
51.7
Race-ethnicity White non-Hispanic 53.0
466
35.0
36
51.1
502
62.1
Black non-Hispanic 12.8
113
11.7
12
12.7
125
13.1 Hispanic 15.5
136
37.9
39
14.9
175
14.5
Asian non-Hispanic 15.0
132
14.6
15
17.8
147
7.6 Other non-Hispanic 3.8
33
1.0
1
3.4
34
2.7
Income (household)** Low 11.6
103
5.8
6
11.0
109
16.4
Middle 23.3
207
18.4
19
22.7
225
17.3 High 44.5
395
54.4
56
45.6
451
49.5
Don't know/refused 20.6
183
21.4
22
20.7
205
16.8 Health Insurance (18-64)
Public 16.0
113
16.7
15
16.1
128 86.3*** Private 74.9
529
82.2
74
75.8
603
Uninsured 9.1
64
1.1
1
8.2
65
13.7
Source: Data from 2012 SPUH/RWJUH Community Health Needs Assessment Survey; fieldwork & analysis by PRC; tabulations by Rutgers Center for State Health Policy.
* Data from 2010 BRFSS. ** Survey data based on % Federal Poverty Level; state BRFSS data based on income only.
*** BRFSS reports only insured and uninsured. Note: Don't know and refused responses excluded unless > 5%, so cell sizes may not total full sample size.

129 A Community Health Needs Assessment
Table 3.5: Summary of Results - Adults, 2012 Phone Survey, Middlesex County and Two Zip Codes in Somerset County * more = more likely, less = less likely than overall %
** highlighted cells indicate health access concern
Age Gender Race-Ethnicity
Measure Overall % 18-64 65+ Male Female White Black Asian Hispanic Age 18-64 82.0 65+ 18.0 Gender Males 49.3 Females 50.7 Race-Ethnicity White non-Hispanic 51.1 Black non-Hispanic 12.7 Asian non-Hispanic 14.9 Hispanic 17.8 Other 3.4 Income (% FPL) Low 11.0 more more Middle 22.7 more more more High 45.6 more more more Don't know/Refused 20.7 Health Insurance Coverage Public 28.4 less more Private 64.9 Uninsured 6.7 more Community Concerns Affordable childcare 58.8 less Domestic violence 49.8 Elder abuse/neglect 46.2 more STDs 40.9 less more Unemployment/job security 78.8 more less Places to exercise 32.1 less more Finding fresh fruits/veggies 24.6 Alcohol/drug abuse 62.8 more Cancer 70.9 more less

130 Rutgers Center for State Health Policy/RWJMS Family Medicine & Community Health, Dec 2012
Table 3.5: Summary of Results - Adults, 2012 Phone Survey, Middlesex County and Two Zip Codes in Somerset County (continued)
* more = more likely, less = less likely than overall % ** highlighted cells indicate health access concern
Age Gender Race-Ethnicity
Measure Overall % 18-64 65+ Male Female White Black Asian Hispanic Unsafe in Neighborhood 33.1 more more more Health Status Overall health fair/poor 14.2 more Dental health fair/poor 18.8 more Mental health fair/poor 5.9 Chronic Conditions Asthma 17.3 more Diabetes 14.0 more more more High blood pressure 30.8 more more more less Other chronic condition 24.8 more more more less Any chronic condition 56.2 Obesity Overweight 38.0 more more more Obese 28.0 more more Perceived overweight 60.0 less less less Doc advice about weight 24.8 less less less Smoking Allowed in Home 10.9 more less more less Medical Utilization ED visits 20.1 more >1 ED visit 5.9 Main reason for ED visit was emerg 63.1 -- -- -- -- -- -- -- -- Waiting time in ED 81.2% <30 min -- -- -- -- -- -- -- -- Check-ups 80.5 less less less Specialty visits 52.8 more more less more Other doctor visits 33.3 more more less Calls to doctor 48.3 more more more more less less Dental Utilization Dental visits 75.1 less less less less less Dental check-ups 71.7 less less less less less Dental insurance 70.5 less** less Usual Source of Dental Care Dental clinic 8.5 more more No regular source of dental care 7.0 more

131 A Community Health Needs Assessment
Table 3.5: Summary of Results - Adults, 2012 Phone Survey, Middlesex County and Two Zip Codes in Somerset County (continued)
* more = more likely, less = less likely than overall % ** highlighted cells indicate health access concern
Age Gender Race-Ethnicity
Measure Overall % 18-64 65+ Male Female White Black Asian Hispanic Mental Health Utilization Mental health visits 8.1 more more Mental health coverage 75.0 who got care -- -- -- -- -- -- -- -- Prescription Medicines Rx past month 60.6 more more more less less Health Information Source Internet 62.4 more more Social media 8.1 more more more Television 35.2 more more Friends or family 57.8 more more Church 9.9 more Health Promotion Events 18.3 more less less Usual Source of Medical Care Has usual place 86.3 less less less Clinic is usual place 8.3 more more more more ED is usual place 1.6 more Reg doc is a specialist 9.6 more more Long wait time at reg doc office 10.5 >30 min more more more Barriers to Care At least one barrier 27.0 more more more Medical care 8.3 more more more more Mental health care 3.0 more more Dental care 8.6 more more more Prescription meds - did not get 15.4 more more more Prescription meds - reduce dose 11.3 more more Specific Barriers to Medical Care Any problem 52.9 Transportation 7.6 more more Day care (childcare) 10.7 more more Parking 16.0 more more Doc doesn't speak same language 8.0 more Doc's hours inconvenient 35.3 more more Wait too long to get appt 34.8 more more more Treated worse due to race 1.9 more more

132 Rutgers Center for State Health Policy/RWJMS Family Medicine & Community Health, Dec 2012
Table 3.5: Summary of Results - Adults, 2012 Phone Survey, Middlesex County and Two Zip Codes in Somerset County (continued)
* more = more likely, less = less likely than overall % ** highlighted cells indicate health access concern
Age Gender Race-Ethnicity
Measure Overall % 18-64 65+ Male Female White Black Asian Hispanic Attitudes re Health, Healthcare Public clinics ok 41.3 more more more ER ok for routine care 34.2 more more more Health insur nec, even if healthy 96.3 less Wait, health probs go away 29.7 more more more Only go to doc if prob gets bad 57.6 more more more Prefer not to take meds if sick 40.1 more less More likely to take risks 34.2 more more more more Emergency Preparedness Evacuation plan 30.0 less more Documents & essentials organized 49.6 less less more Socio-Demographics Immigration status US born US citizen 75.2 Foreign-born US citizen 19.2 more more more more Non-citizen 5.6 more more more English spoken at home 84.7 -- -- -- -- -- -- -- -- Number of adults in HH -- -- -- -- -- -- -- -- Number of children in HH -- -- -- -- -- -- -- -- Total number in HH -- -- -- -- -- -- -- -- Own home (vs rent) 81.8 less less less Married 64.0 more Education 53.4 college+ less more Employed 64.1 emp, 9.0 unemp less less less less less Government assistance 19.6 more Phone Status Landline only 5.9 more more Cell only 4.6 more more more Landline + cell 86.6 Service interruption 12.1 more Total Health-Related Concerns 23 8 15 9 2 12 22 24

133 A Community Health Needs Assessment
Table 3.5: Summary of Results - Adults, 2012 Phone Survey, Middlesex County and Two Zip Codes in Somerset County (continued)
(Income and Insurance Coverage Groups) * more = more likely, less = less likely than overall % ** highlighted cells indicate health access concern
Income (% FPL) Health Insurance Coverage
Measure Overall % Low Middle High Public Private Uninsured Age
18-64 82.0 65+ 18.0 Gender Males 49.3 Females 50.7 Race-Ethnicity White non-Hispanic 51.1 Black non-Hispanic 12.7 Asian non-Hispanic 14.9 Hispanic 17.8 Other 3.4 Income (% FPL) -- -- -- Low 11.0 more
Middle 22.7 more more High 45.6 more
Don't know/Refused 20.7 Health Insurance Coverage -- -- --
Public 28.4 more Private 64.9 Uninsured 6.7 more more Community Concerns Affordable childcare 58.8 less
Domestic violence 49.8 Elder abuse/neglect 46.2 less more
STDs 40.9 Unemployment/job security 78.8 more more
Places to exercise 32.1 Finding fresh fruits/veggies 24.6 more more
Alcohol/drug abuse 62.8 more less less Cancer 70.9

134 Rutgers Center for State Health Policy/RWJMS Family Medicine & Community Health, Dec 2012
Table 3.5: Summary of Results - Adults, 2012 Phone Survey, Middlesex County and Two Zip Codes in Somerset County (continued)
(Income and Insurance Coverage Groups) * more = more likely, less = less likely than overall % ** highlighted cells indicate health access concern
Income (% FPL) Health Insurance Coverage
Measure Overall % Low Middle High Public Private Uninsured Unsafe in Neighborhood 33.1 more more more Health Status
Overall health fair/poor 14.2 more more Dental health fair/poor 18.8 more more
Mental health fair/poor 5.9 more Chronic Conditions Asthma 17.3 more more less
Diabetes 14.0 more High blood pressure 30.8 more Other chronic condition 24.8 Any chronic condition 56.2 Obesity Overweight 38.0 more Obese 28.0 more Perceived overweight 60.0 less less
Doc advice about weight 24.8 less Smoking Allowed in Home 10.9 more
Medical Utilization ED visits 20.1 more more more
>1 ED visit 5.9 more more Main reason for ED visit was emerg 63.1 -- -- -- -- -- -- Waiting time in ED 81.2% <30 min -- -- -- -- -- -- Check-ups 80.5 less less more less Specialty visits 52.8 more less Other doctor visits 33.3 more
Calls to doctor 48.3 less Dental Utilization
Dental visits 75.1 less less less Dental check-ups 71.7 less less less Dental insurance 70.5 less less more less Usual Source of Dental Care
Dental clinic 8.5 more more more No regular source of dental care 7.0

135 A Community Health Needs Assessment
Table 3.5: Summary of Results - Adults, 2012 Phone Survey, Middlesex County and Two Zip Codes in Somerset County (continued)
(Income and Insurance Coverage Groups) * more = more likely, less = less likely than overall % ** highlighted cells indicate health access concern
Income (% FPL) Health Insurance Coverage
Measure Overall % Low Middle High Public Private Uninsured Mental Health Utilization
Mental health visits 8.1 Mental health coverage 75.0 who got care -- -- -- -- -- --
Prescription Medicines Rx past month 60.6 more more less
Health Information Source Internet 62.4 more less Social media 8.1 more more Television 35.2 Friends or family 57.8 Church 9.9 Health Promotion Events 18.3 less more less
Usual Source of Medical Care Has usual place 86.3 less less
Clinic is usual place 8.3 more more ED is usual place 1.6 more more
Reg doc is a specialist 9.6 more more Long wait time at reg doc office 10.5 >30 min more more
Barriers to Care At least one barrier 27.0 more more
Medical care 8.3 more Mental health care 3.0 more more more Dental care 8.6 more more more Prescription meds - did not get 15.4 more more Prescription meds - reduce dose 11.3 more more
Specific Barriers to Medical Care Any problem 52.9 Transportation 7.6 more more more
Day care (childcare) 10.7 more more Parking 16.0 more more more more
Doc doesn't speak same language 8.0 Doc's hours inconvenient 35.3 less Wait too long to get appt 34.8 more
Treated worse due to race 1.9 more

136 Rutgers Center for State Health Policy/RWJMS Family Medicine & Community Health, Dec 2012
Table 3.5: Summary of Results - Adults, 2012 Phone Survey, Middlesex County and Two Zip Codes in Somerset County (continued)
(Income and Insurance Coverage Groups) * more = more likely, less = less likely than overall % ** highlighted cells indicate health access concern
Income (% FPL) Health Insurance Coverage
Measure Overall % Low Middle High Public Private Uninsured Attitudes re Health, Healthcare
Public clinics ok 41.3 more more more more ER ok for routine care 34.2 more more more more Health insur nec, even if healthy 96.3 less less less Wait, health probs go away 29.7 more more
Only go to doc if prob gets bad 57.6 more more less more Prefer not to take meds if sick 40.1 less
More likely to take risks 34.2 more more more Emergency Preparedness
Evacuation plan 30.0 more less Documents & essentials organized 49.6 more less Socio-Demographics
Immigration status US born US citizen 75.2 more more Foreign-born US citizen 19.2 more more more
Non-citizen 5.6 English spoken at home 84.7 -- -- -- -- -- --
Number of adults in HH -- -- -- -- -- -- Number of children in HH -- -- -- -- -- -- Total number in HH -- -- -- -- -- -- Own home (vs rent) 81.8 less less less Married 64.0
Education 53.4 college+ less less less less Employed 64.1 emp, 9.0 unemp less less less
Government assistance 19.6 more more more more Phone Status
Landline only 5.9 more Cell only 4.6 more more
Landline + cell 86.6 Service interruption 12.1 more Total Health-Related Concerns 30 27 0 10 0 32

137 A Community Health Needs Assessment
Table 3.5a: Access Concerns from Summary of Results - Adults, 2012 Phone Survey, Middlesex County + Two Zip Codes in Somerset County * more = more likely, less = less likely than overall %
** highlighted cells indicate health access concern
Age Gender Race-Ethnicity
Measure Overall % 18-64 65+ Male Female White Black Asian Hispanic Low income 11.0 more more Uninsured 6.7 more Unsafe in Neighborhood 33.1 more more more Overall health fair/poor 14.2 more Dental health fair/poor 18.8 more Mental health fair/poor 5.9 Asthma 17.3 more Diabetes 14.0 more more more High blood pressure 30.8 more more more less Other chronic condition 24.8 more more more less Any chronic condition 56.2 Overweight 38.0 more more more Obese 28.0 more more Perceived overweight 60.0 less less less Doc advice about weight 24.8 less less less Smoking Allowed in Home 10.9 more less more less ED visits 20.1 more >1 ED visit 5.9 Check-ups 80.5 less less less Dental check-ups 71.7 less less less less less Dental insurance 70.5 less** less No regular source of dental care 7.0 more Health Promotion Events 18.3 more less less Usual Source of Medical Care Has usual place 86.3 less less less ED is usual place 1.6 more Long wait time at reg doc office 10.5 >30 min more more more

138 Rutgers Center for State Health Policy/RWJMS Family Medicine & Community Health, Dec 2012
Table 3.5a: Access Concerns from Summary of Results - Adults, 2012 Phone Survey, Middlesex County + Two Zip Codes in Somerset County (continued)
* more = more likely, less = less likely than overall % ** highlighted cells indicate health access concern
Age Gender Race-Ethnicity
Measure Overall % 18-64 65+ Male Female White Black Asian Hispanic Barriers to Care At least one barrier 27.0 more more more Medical care 8.3 more more more more Mental health care 3.0 more more Dental care 8.6 more more more Prescription meds - did not get 15.4 more more more Prescription meds - reduce dose 11.3 more more Specific Barriers to Medical Care Any problem 52.9 Transportation 7.6 more more Day care (childcare) 10.7 more more Parking 16.0 more more Doc doesn't speak same language 8.0 more Doc's hours inconvenient 35.3 more more Wait too long to get appt 34.8 more more more Treated worse due to race 1.9 more more Attitudes re Health, Healthcare ER ok for routine care 34.2 more more more Health insur nec, even if healthy 96.3 less Wait, health probs go away 29.7 more more more Only go to doc if prob gets bad 57.6 more more more Prefer not to take meds if sick 40.1 more less More likely to take risks 34.2 more more more more Emergency Preparedness Evacuation plan 30.0 less more Documents & essentials organized 49.6 less less more Socio-Demographics Non-citizen 5.6 more more more Own home (vs rent) 81.8 less less less Education 53.4 college+ less more Employed 64.1 emp, 9.0 unemp less less less less less Government assistance 19.6 more Phone service interruption 12.1 more Total Health-Related Concerns 23 8 15 9 2 12 22 24

139 A Community Health Needs Assessment
Table 3.5a: Access Concerns from Summary of Results - Adults, 2012 Phone Survey, Middlesex County + Two Zip Codes in Somerset County (continued)
(Income and Insurance Coverage Groups) * more = more likely, less = less likely than overall % ** highlighted cells indicate health access concern
Income (% FPL) Health Insurance Coverage
Measure Overall % Low Middle High Public Private Uninsured Low income 11.0 more Uninsured 6.7 more more Unsafe in Neighborhood 33.1 more more more Overall health fair/poor 14.2 more more Dental health fair/poor 18.8 more more Mental health fair/poor 5.9 more Asthma 17.3 more more less Diabetes 14.0 more High blood pressure 30.8 more Other chronic condition 24.8 Any chronic condition 56.2 Overweight 38.0 more Obese 28.0 more Perceived overweight 60.0 less less Doc advice about weight 24.8 less Smoking Allowed in Home 10.9 more ED visits 20.1 more more more >1 ED visit 5.9 more more Check-ups 80.5 less less more less Dental check-ups 71.7 less less less Dental insurance 70.5 less less more less No regular source of dental care 7.0 Health Promotion Events 18.3 less more less Usual Source of Medical Care Has usual place 86.3 less less ED is usual place 1.6 more more Long wait time at reg doc office 10.5 >30 min more more
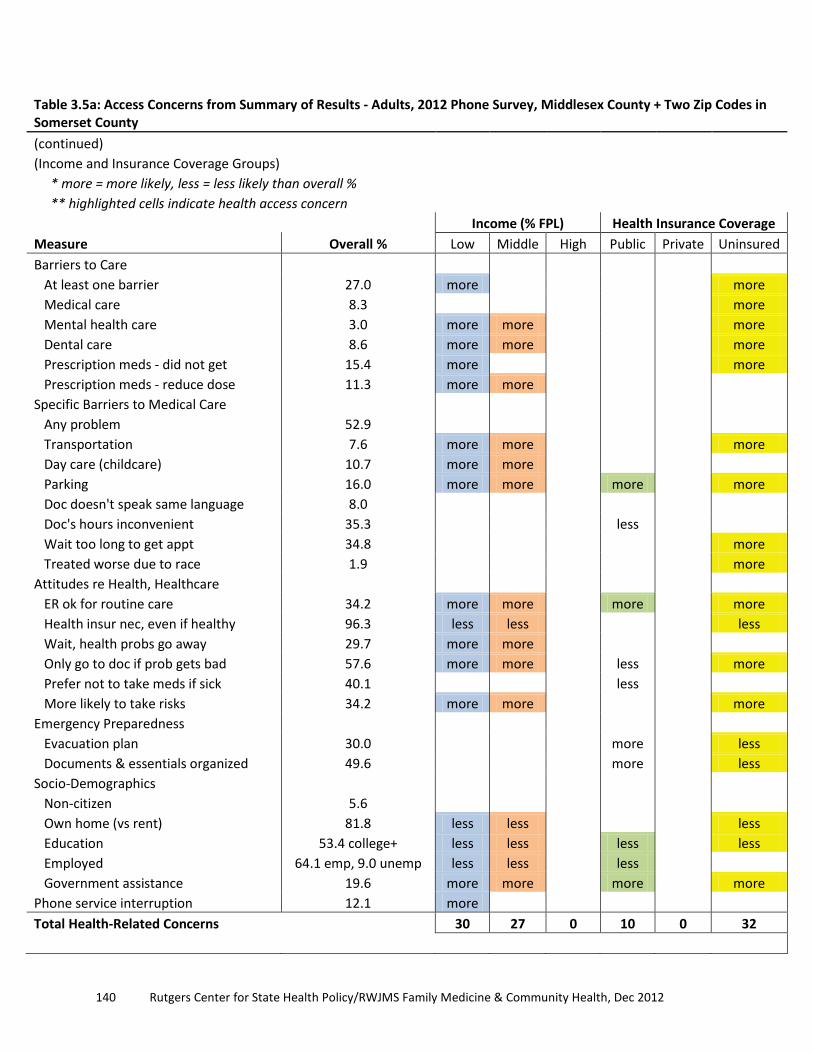
140 Rutgers Center for State Health Policy/RWJMS Family Medicine & Community Health, Dec 2012
Table 3.5a: Access Concerns from Summary of Results - Adults, 2012 Phone Survey, Middlesex County + Two Zip Codes in Somerset County (continued)
(Income and Insurance Coverage Groups) * more = more likely, less = less likely than overall % ** highlighted cells indicate health access concern
Income (% FPL) Health Insurance Coverage
Measure Overall % Low Middle High Public Private Uninsured Barriers to Care At least one barrier 27.0 more more Medical care 8.3 more Mental health care 3.0 more more more Dental care 8.6 more more more Prescription meds - did not get 15.4 more more Prescription meds - reduce dose 11.3 more more Specific Barriers to Medical Care Any problem 52.9 Transportation 7.6 more more more Day care (childcare) 10.7 more more Parking 16.0 more more more more Doc doesn't speak same language 8.0 Doc's hours inconvenient 35.3 less Wait too long to get appt 34.8 more Treated worse due to race 1.9 more Attitudes re Health, Healthcare ER ok for routine care 34.2 more more more more Health insur nec, even if healthy 96.3 less less less Wait, health probs go away 29.7 more more Only go to doc if prob gets bad 57.6 more more less more Prefer not to take meds if sick 40.1 less More likely to take risks 34.2 more more more Emergency Preparedness Evacuation plan 30.0 more less Documents & essentials organized 49.6 more less Socio-Demographics Non-citizen 5.6 Own home (vs rent) 81.8 less less less Education 53.4 college+ less less less less Employed 64.1 emp, 9.0 unemp less less less Government assistance 19.6 more more more more Phone service interruption 12.1 more Total Health-Related Concerns 30 27 0 10 0 32

141 A Community Health Needs Assessment
Table 3.6: Individual Characteristics, Children Ages 0-17, Middlesex County and Two Zip Codes in Somerset County (combined) (unweighted)
Combined Sample
N
Total Child Sample 287
Age 0-9 142
10-17 145 Don't know/refused 0 Gender
Male 151 Female 136 Don't know/refused 0 Race-ethnicity
White non-Hispanic 142 Black non-Hispanic 30 Hispanic 50 Asian non-Hispanic 37 Other non-Hispanic 17 Don't know/refused 11 Income (household)
<$25k 36 $25k to < $50k 84 $50k + 114 Don't know/refused 53 Health Insurance (18-64)
Public 56 Private 222 Uninsured 3 Don't know/refused 6
Source: Data from 2012 SPUH/RWJUH Community Health Needs Assessment Survey; fieldwork & analysis by PRC; tabulations by Rutgers Center for State Health Policy.

142 Rutgers Center for State Health Policy/RWJMS Family Medicine & Community Health, Dec 2012
Table 3.7: Individual Characteristics, Children Ages 0-17, Middlesex County and Two Zip Codes in Somerset County (combined)
Combined Sample
%
N
Total Child Sample 100.0
397
Age 0-9 62.7
243
10-17 37.3
144 Gender
Male 56.3
223 Female 43.7
174
Race-ethnicity White non-Hispanic 37.8
139
Black non-Hispanic 11.1
41 Hispanic 26.3
96
Asian non-Hispanic 18.4
68 Other non-Hispanic 6.5
24
Don't know/refused 8.6
30 Income (household)
<$25k 12.2
48 $25k to < $50k 26.5
105
$50k + 46.4
184 Health Insurance (18-64)
Public 17.1
64 Private 81.1
305
Uninsured 1.8
7
Source: Data from 2012 SPUH/RWJUH Community Health Needs Assessment Survey; fieldwork & analysis by PRC; tabulations by Rutgers Center for State Health Policy.

143 A Community Health Needs Assessment
Table 3.8: Summary of Results - Children, 2012 Phone Survey, Middlesex County and Two Zip Codes in Somerset County * more = more likely, less = less likely than overall %
** highlighted cells indicate health access concern (--) data suppressed, denominator <50
Age Gender Race-Ethnicity Measure Overall % 0-9 10-17 Boys Girls White Black Asian Hispanic Age 0-9 62.7 10-17 37.3 Gender Boys 56.3 Girls 43.7 Race-Ethnicity White non-Hispanic 37.8 Black non-Hispanic 11.1 Asian non-Hispanic 6.5 Hispanic 26.3 Other 6.5 Income (% FPL) Low 12.2 -- more Middle 26.5 -- more High 46.4 more -- -- Don't know/Refused 14.8 Health Insurance Coverage Public 17.1 -- -- more Private 81.1 Uninsured 1.8 -- -- -- -- -- -- -- -- Health status Overall health fair/poor 3.2 -- -- -- -- -- -- -- -- Dental health fair/poor 5.2 -- -- -- -- -- -- -- -- Mental health fair/poor 6.4 -- -- -- -- -- -- -- -- Chronic Conditions Asthma 15.5 more -- -- Diabetes 0.9 -- -- -- -- -- -- -- -- High blood pressure 0.2 -- -- -- -- -- -- -- -- Other chronic condition 10.0 -- -- -- -- -- -- -- -- Any chronic condition 23.6 more

144 Rutgers Center for State Health Policy/RWJMS Family Medicine & Community Health, Dec 2012
Table 3.8: Summary of Results - Children, 2012 Phone Survey, Middlesex County and Two Zip Codes in Somerset County (continued)
* more = more likely, less = less likely than overall % ** highlighted cells indicate health access concern (--) data suppressed, denominator <50
Age Gender Race-Ethnicity Measure Overall % 0-9 10-17 Boys Girls White Black Asian Hispanic Medical Utilization ED visits 18.9 more -- more >1 ED visit 2.7 -- -- -- -- -- -- -- -- Main reason for ED visit was emerg 61.2 Waiting time in ED 76.6% <30 min Check-ups 91.5 -- -- Specialty visits 33.0 more -- -- less Other doctor visits 38.7 more more -- Calls to doctor 60.4 more -- -- Dental Utilization Dental visits 72.4 less -- -- less Dental check-ups 72.1 less -- -- less Dental insurance 84.9 Usual Source of Dental Care Private dentist office 76.7 less less -- -- less Dental clinic 8.5 -- -- -- -- -- -- -- -- Hospital dental clinic 1.9 -- -- -- -- -- -- -- -- No regular source of dental care 12.1 -- -- Mental Health Utilization Mental health visits 8.1 more -- -- Mental health coverage 83.7 who got care -- -- Prescription Medicines Rx past month 29.0 more -- -- less Usual Source of Medical Care Has usual place 87.1 -- -- less Clinic is usual place 6.7 -- -- -- -- -- -- -- -- ED is usual place 0.3 -- -- -- -- -- -- -- -- Reg doc is a specialist 5.1 -- -- -- -- -- -- -- --
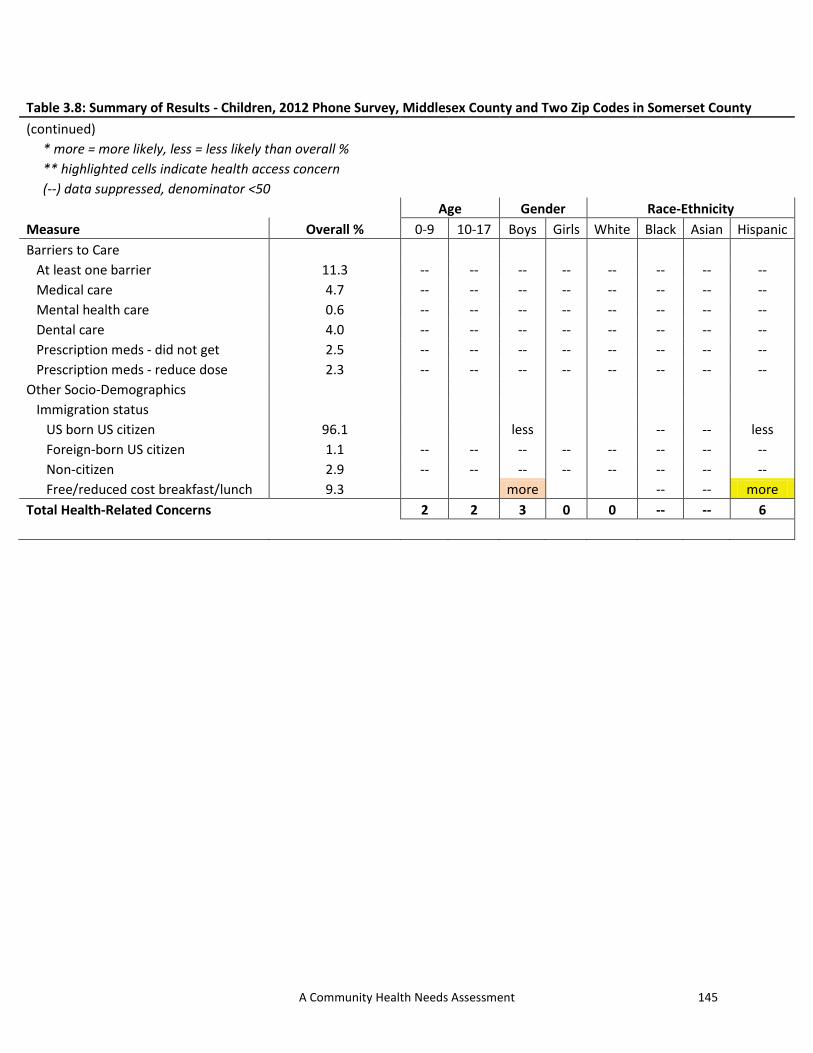
145 A Community Health Needs Assessment
Table 3.8: Summary of Results - Children, 2012 Phone Survey, Middlesex County and Two Zip Codes in Somerset County (continued)
* more = more likely, less = less likely than overall % ** highlighted cells indicate health access concern (--) data suppressed, denominator <50
Age Gender Race-Ethnicity Measure Overall % 0-9 10-17 Boys Girls White Black Asian Hispanic Barriers to Care At least one barrier 11.3 -- -- -- -- -- -- -- -- Medical care 4.7 -- -- -- -- -- -- -- -- Mental health care 0.6 -- -- -- -- -- -- -- -- Dental care 4.0 -- -- -- -- -- -- -- -- Prescription meds - did not get 2.5 -- -- -- -- -- -- -- -- Prescription meds - reduce dose 2.3 -- -- -- -- -- -- -- -- Other Socio-Demographics Immigration status US born US citizen 96.1 less -- -- less Foreign-born US citizen 1.1 -- -- -- -- -- -- -- -- Non-citizen 2.9 -- -- -- -- -- -- -- -- Free/reduced cost breakfast/lunch 9.3 more -- -- more Total Health-Related Concerns 2 2 3 0 0 -- -- 6
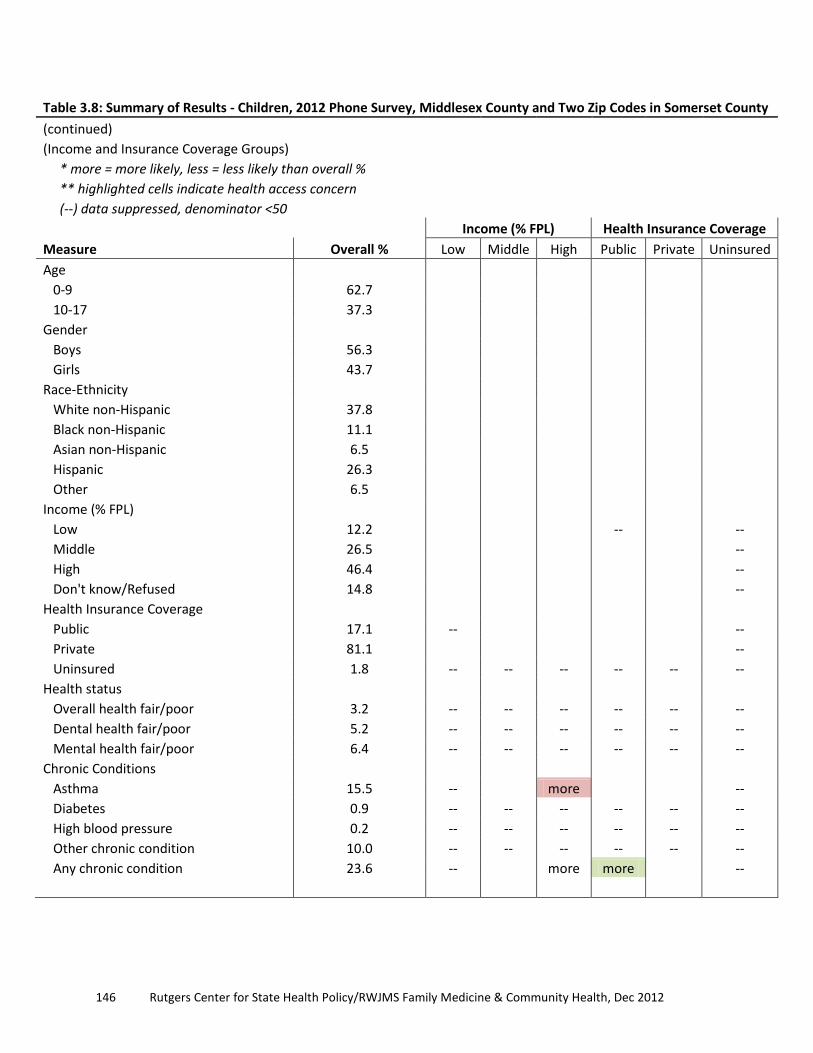
146 Rutgers Center for State Health Policy/RWJMS Family Medicine & Community Health, Dec 2012
Table 3.8: Summary of Results - Children, 2012 Phone Survey, Middlesex County and Two Zip Codes in Somerset County (continued)
(Income and Insurance Coverage Groups) * more = more likely, less = less likely than overall % ** highlighted cells indicate health access concern (--) data suppressed, denominator <50
Income (% FPL) Health Insurance Coverage Measure Overall % Low Middle High Public Private Uninsured Age 0-9 62.7 10-17 37.3 Gender Boys 56.3 Girls 43.7 Race-Ethnicity White non-Hispanic 37.8 Black non-Hispanic 11.1 Asian non-Hispanic 6.5 Hispanic 26.3 Other 6.5 Income (% FPL) Low 12.2 -- -- Middle 26.5 -- High 46.4 -- Don't know/Refused 14.8 -- Health Insurance Coverage Public 17.1 -- -- Private 81.1 -- Uninsured 1.8 -- -- -- -- -- -- Health status Overall health fair/poor 3.2 -- -- -- -- -- -- Dental health fair/poor 5.2 -- -- -- -- -- -- Mental health fair/poor 6.4 -- -- -- -- -- -- Chronic Conditions Asthma 15.5 -- more -- Diabetes 0.9 -- -- -- -- -- -- High blood pressure 0.2 -- -- -- -- -- -- Other chronic condition 10.0 -- -- -- -- -- -- Any chronic condition 23.6 -- more more --

147 A Community Health Needs Assessment
Table 3.8: Summary of Results - Children, 2012 Phone Survey, Middlesex County and Two Zip Codes in Somerset County (continued)
(Income and Insurance Coverage Groups) * more = more likely, less = less likely than overall % ** highlighted cells indicate health access concern (--) data suppressed, denominator <50
Income (% FPL) Health Insurance Coverage Measure Overall % Low Middle High Public Private Uninsured Medical Utilization ED visits 18.9 -- more -- >1 ED visit 2.7 -- -- -- -- -- -- Main reason for ED visit was emerg 61.2 -- Waiting time in ED 76.6% <30 min -- Check-ups 91.5 -- -- Specialty visits 33.0 -- more less more -- Other doctor visits 38.7 -- less -- Calls to doctor 60.4 -- more less -- Dental Utilization Dental visits 72.4 -- less more -- Dental check-ups 72.1 -- less more -- Dental insurance 84.9 -- less more less -- Usual Source of Dental Care Private dentist office 76.7 -- -- Dental clinic 8.5 -- -- -- -- -- -- Hospital dental clinic 1.9 -- -- -- -- -- -- No regular source of dental care 12.1 -- Mental Health Utilization Mental health visits 8.1 -- -- Mental health coverage 83.7 who got care -- -- Prescription Medicines Rx past month 29.0 -- more -- Usual Source of Medical Care Has usual place 87.1 -- less less -- Clinic is usual place 6.7 -- -- -- -- -- -- ED is usual place 0.3 -- -- -- -- -- -- Reg doc is a specialist 5.1 -- -- -- -- -- --
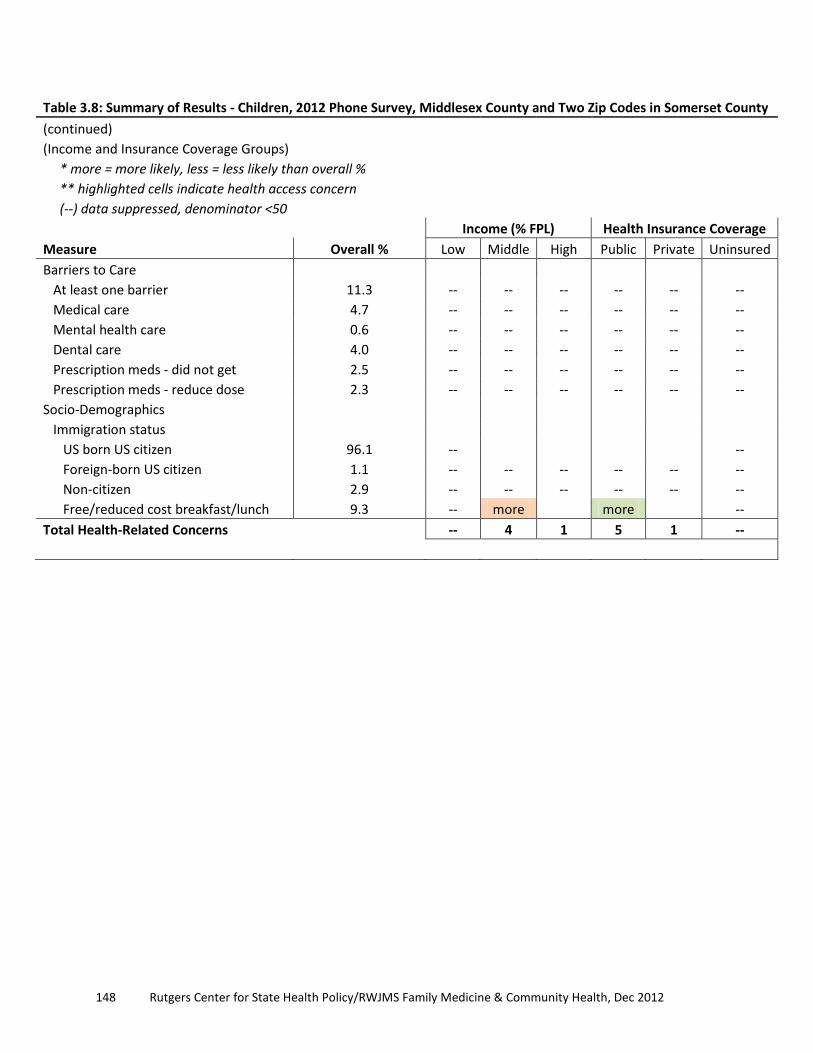
148 Rutgers Center for State Health Policy/RWJMS Family Medicine & Community Health, Dec 2012
Table 3.8: Summary of Results - Children, 2012 Phone Survey, Middlesex County and Two Zip Codes in Somerset County (continued)
(Income and Insurance Coverage Groups) * more = more likely, less = less likely than overall % ** highlighted cells indicate health access concern (--) data suppressed, denominator <50
Income (% FPL) Health Insurance Coverage Measure Overall % Low Middle High Public Private Uninsured Barriers to Care At least one barrier 11.3 -- -- -- -- -- -- Medical care 4.7 -- -- -- -- -- -- Mental health care 0.6 -- -- -- -- -- -- Dental care 4.0 -- -- -- -- -- -- Prescription meds - did not get 2.5 -- -- -- -- -- -- Prescription meds - reduce dose 2.3 -- -- -- -- -- -- Socio-Demographics Immigration status US born US citizen 96.1 -- -- Foreign-born US citizen 1.1 -- -- -- -- -- -- Non-citizen 2.9 -- -- -- -- -- -- Free/reduced cost breakfast/lunch 9.3 -- more more -- Total Health-Related Concerns -- 4 1 5 1 --

149 A Community Health Needs Assessment
Chapter 4: Community Input: 2012 Key Informant Interviews and Consumer Focus Groups
Introduction The qualitative study described in this report was conducted by researchers from Robert Wood Johnson Medical School (RWJMS) Department of Family Medicine and Community Health, Research Division. The primary objectives of the qualitative study were pursued through three questions:
1. What is the experience of Somerset/Middlesex County residents in accessing medical care?
2. What are the health services and resources most needed now to improve community member’s health?
3. What are the barriers to accessing health care? The Patient Protection Affordable Care Act requires that the community health needs assessment “takes into account input from persons who represent the broad interests of the community served by the hospital facility, including those with special knowledge of or expertise in public health” (U.S. Congress 2010). To meet the objectives of the assessment and the requirements of the law, this qualitative study employed two data collection strategies: 1) key informant interviews with community stakeholders and leaders from Somerset/Middlesex Counties, and 2) focus groups with health care consumers (sometimes referred to as participants) who live in Somerset/Middlesex Counties. Because these two strategies entailed different subjects and different methods, we outline details of each separately below.
Methods Key Informant Interviews From mid-June to early August 2012, four field researchers (including one bi-lingual in Spanish/English) conducted key informant interviews with community stakeholders to develop a deeper understanding of health care needs and gaps in care in Middlesex and Somerset Counties. The field researchers used a semi-structured guide, which included key “grand tour” questions (see Appendix A) to ensure data collection consistency. This format allowed for
150 Rutgers Center for State Health Policy/RWJMS Family Medicine & Community Health, Dec 2012
questions or probes to emerge during the conversation to elicit more in-depth responses to the three primary research questions (noted above). Researchers interviewed 26 key informants who had particular knowledge about a topic (e.g., drug abuse) or setting (e.g., local health clinic) and were willing to serve as information sources for the researchers (DiCicco-Bloom and Crabtree 2006). All key informants were age 18 or older and had pertinent knowledge about health care service delivery in Middlesex and/or Somerset Counties. The two hospitals provided three community collaborators to the project. The RWJMS researchers used a purposive sampling strategy, for which the hospital collaborators provided contact information and helped facilitate subject recruitment. A purposive sampling strategy is an established qualitative method for recruiting key informants (Kuzel 1999). Researchers and hospital collaborators attempted to cover both a broad range of issues as well as the geographic areas served by both hospitals. Subjects were interviewed in an iterative fashion with ongoing analysis of interview data informing subsequent interviews. Key informant subject recruitment included:
• Three safety net personnel • Four staff members from community based organizations (CBO) • Four government officials and health department personnel • One staff member from a CBO focused on drug-alcohol addiction • One staff member from a CBO focused on domestic violence • One emergency medical personnel • Two staff members from a CBO focused on mental health • One staff member from higher education focused on developmental disabilities • Four health care providers • One pastor a community based church • Two school nurses • Two senior center directors
Subjects were interviewed at their preferred location, mostly in the subjects’ personal offices. Field researchers on this project were trained to ensure privacy and confidentiality and obtained signed informed consent and audio consent forms from all subjects. All interviews were digitally audio-recorded (voice only) and professionally transcribed.

151 A Community Health Needs Assessment
Focus Groups Focus group facilitators conducted eight focus group discussions with health care consumers in order to develop a deeper understanding of health care needs and gaps in care in Middlesex/Somerset Counties. Four facilitators (two English language, one Spanish language, and one Hindi and Gujarati languages) were trained to guide the discussion, to probe for additional information, to be sensitive to subjects’ concerns, and to manage group dynamics. Facilitators used a semi-structured guide, which included nine “grand tour” questions (see Appendix B) to ensure data collection consistency and to elicit perspectives from community members regarding the three primary research questions (posed in the Introduction). Each group contained between eight and 15 participants who have utilized health care services in the hospitals’ catchment area. A total of 94 individuals participated in these focus groups. All participants were age 18 and over, resided in Somerset or Middlesex County, and were able to answer questions and participate in the group discussion. Four focus groups were conducted in English, two in Spanish, one in Hindi, and one was conducted where participants spoke both Gujarati and Hindi. Observational data indicated that of the 94 participants, 71% were female and 29% male; 19% were African-American, 26% Hispanic, 32% South Asian, and 23% Caucasian. Subjects were recruited from community organizations in Middlesex/Somerset counties. Hospital personnel organized and recruited participants for the English and Spanish language focus groups, and personnel from a community-based organization organized and recruited participants for the Hindi and Gujarati focus groups. Recruitment flyers (see Appendix C for a sample flyer) were posted and distributed, directing interested consumers to call a dedicated phone line for further information. When an individual called this number, the coordinators described the research study, explained the eligibility criteria, and answered any questions. If the individual was interested and eligible, they then coordinated the day/time and other logistics for the person to participate in a focus group. Subjects were picked sequentially as they met the study criteria. The focus groups were held at eight different sites around the two counties:
• Mt. Zion AME Church, New Brunswick • Offices of PRAB (Puerto Rican Action Board), Perth Amboy (conducted in Spanish) • Offices of PRAB, New Brunswick (conducted in Spanish) • Offices of the Woodbridge Department of Health and Human Service, Woodbridge • Spotswood Middle School, Spotswood • First Baptist Church of Lincoln Gardens, Somerset • Offices of ParamCare, Iselin (conducted in Hindi)

152 Rutgers Center for State Health Policy/RWJMS Family Medicine & Community Health, Dec 2012
• Banquet Room at Chutney Mary, South Brunswick (participants spoke Gujarati and Hindi)
Focus group facilitators and note takers were trained to ensure privacy and confidentiality and obtained signed informed consent and audio consent forms from all participants. Consent forms were available in English, Spanish, Hindi, or Gujarati (translated by certified translators). The focus groups lasted one and a half hours, usually with a short break midway. During each focus group, a field researcher took notes, which were used to facilitate data analysis. Each focus group was digitally audio-recorded (voice only) and professionally transcribed (and translated into English when necessary).
Data Analysis The Institutional Review Boards of UMDNJ-Robert Wood Johnson Medical School and St. Peter’s University Hospital, New Brunswick approved this study. All key informant interview and focus group documents were de-identified and imported into ATLAS.ti™ – a qualitative analysis software program. Researchers used a grounded theory approach – an inductive process of identifying themes as they emerge from the data (Strauss and Corbin 1990) – which resulted in a codebook of 34 codes (see Appendix D). Data from 20 key informant interviews were coded by two investigators. Data from the remaining 6 key informant interviews and 8 focus groups were then distributed to three group members for coding. Codes were merged into a single database and several immersion-crystallization cycles were conducted to identify themes and patterns in the data (Borkan 1999). Immersion-crystallization is a process in which the researchers immerse themselves in the data then step back and reflect on the data to identify and articulate patterns or themes that emerged during the immersion process. These cycles allowed the researchers to identify similar and discordant patterns across interviews and focus groups and to develop a robust understanding of the data.
Findings The findings are grouped into four themes or sections each reflecting the range of information community stakeholder interview respondents and focus group participants shared. The first theme, “Perceptions of health care and community health,” reports community stakeholder respondents’ and focus group participants‘ understandings of the meaning of health care as well as their perceptions of the health status and common health conditions in their communities. The second theme, “Health care resources,” outlines both the existing resources that emerged as well as suggestions for needed resources and resources that needed improvement. The third theme, “Barriers to health care,” highlights a variety of obstacles both

153 A Community Health Needs Assessment
community stakeholders and focus group participants described to receiving adequate health care, including navigating and accessing the health system, and coping with cultural issues and doctor-patient communication. The last theme, “Community perceptions of hospitals,” concludes with perceptions of the two hospitals.
Theme 1: Perceptions of Health Care and Community Health Meaning of Health Care: Patient Perspective To gain insight into how community members define health care, focus group moderators began each focus group with the question, “What does health care mean to you?” A dominant perspective expressed in all of the focus groups was that health care meant having access to professional medical care when one needed it and, concomitantly, being able to pay for that care. Frequently, respondents equated ‘health care’ with insurance. For example, one focus group participant commented:
“If you don’t have health care, you don’t know what type of care you’re going to get when you go to a hospital. I mean, you can go to a hospital and get some type of care, but if you’ve got health care – Medicare, Aetna, or whatever health care you got – you seem to get better. You seem to get taken care of better than if you didn’t have any.” (Focus group participant)
Although this type of sentiment was frequently expressed, there was considerable breadth in how this was portrayed. Focus group participants spoke about health care in terms of living a healthy lifestyle including eating a nutritious diet, exercising, getting plenty of rest, having routine doctor visits, and engaging in preventive health behaviors. Overall, there was a distinction between those who defined health care as something ‘done to you’ vs. those who view it as something in which one has an active role. Health Status Some community stakeholders and focus group participants expressed that they believe the health status of their community is “pretty good” or “better than other communities,” citing proximity to numerous health care facilities as a contributing factor. However, the “connection between the needs of people and health care resources” was highlighted as a primary obstacle to health and health care for uninsured residents, as many of these resources are perceived to be inaccessible to them.

154 Rutgers Center for State Health Policy/RWJMS Family Medicine & Community Health, Dec 2012
Others believe that the health status in their communities is “not the best” because residents are “not taking as good care of themselves as they ought to.” Obesity and lack of physical activity are commonly seen by community stakeholders and focus group participants as primary causes for their communities’ subpar health status. Many interpret such observations in terms of social determinants of health1
, noting a variety of structural influences: the unavailability and unaffordability of fresh fruits and vegetables in some communities; the lack of transportation to get to grocery stores where fresh produce is available; living in dwellings without a kitchen or refrigerator, thus making fast food daily fare because it is the only affordable way to eat out. As one community stakeholder pointed out, “It is very expensive to eat a nutritious meal every day.” These factors were raised in relation to both adult and childhood obesity, but several community stakeholders spoke repeatedly about two additional contributors to childhood obesity: the absence of parental supervision after school (when parents are working) thus allowing children to have “free reign” over the refrigerator and television, and the lack of safe places to play outside due to gang violence. For the undocumented community, there are additional negative impacts on their health status, including their transient lifestyle and the common occurrence of the breadwinner of the family being deported; the remaining parent is often unable to earn a living because there are young children to tend. One community stakeholder pointed out that community projects to address social determinants of health tend to “come and go” because of funding issues. This individual suggested that there ought to be a “cadre of people” whose permanent job is to work on these issues, as the longitudinal nature of such an approach may help to make the progress that is needed.
Primary Health Conditions Our sample of community stakeholders and focus group participants was very diverse in terms of educational background, current fields of employment, and race/ethnicity. Given this diversity, there were striking commonalities in responses to questions pertaining to their 1 According to the World Health Organization, “The social determinants of health are the conditions in which people are born, grow, live, work and age, including the health system. These circumstances are shaped by the distribution of money, power and resources at global, national and local levels. The social determinants of health are mostly responsible for health inequities - the unfair and avoidable differences in health status seen within and between countries” (World Health Organization 2012).
“I think we (in New Brunswick) fare better than most urban centers. I think that’s because of the commitment that the health care community has made to New Brunswick. But because of the transitional nature of a large segment of our population – the immigrant population that’s here, and the lower socio-economic aspects of some of our residents – that we could do a better job with the delivery of health care services and assisting folks to learn to better take care of themselves.”
Community stakeholder, 2012

155 A Community Health Needs Assessment
perception of the primary health conditions ‘in their communities’.2
Our analysis yielded three perceived primary health conditions across Middlesex and Somerset counties: obesity, poor mental health, and diabetes.
The perception of obesity as a predominant health problem in their communities was strong and was discussed by focus group participants (mostly health care consumers) and community stakeholders who specialized in very different fields including nursing, community-based organizations, social services, senior centers/aging, emergency medicine, and public health. Many stakeholders specified that childhood obesity was a particular problem. Furthermore, most of these respondents articulated related sequelae of obesity including hypertension, heart disease, and diabetes.3
Poor mental health was another prominent area that was perceived by community stakeholders and focus group participants to be problematic. They spoke about this broad topic in different ways – some specified specific mental health conditions while others used the concept more generally. When specific mental health conditions were discussed, the most common included depression, anxiety, bi-polar disorder, and post-traumatic stress disorder. Depression and anxiety were clearly emphasized much more than the others. In addition, according to several community stakeholders people with mental health issues often have co-occurring disorders including obesity, cardiovascular disease, diabetes, and hypertension, which sometimes result from the anti-psychotic medications that cause significant weight gain. Diabetes was also emphasized as a significant problem in stakeholder and focus group participants’ communities. They typically spoke about this health condition being evident across the age spectrum in all communities, and some community stakeholders noted the concentration of diabetics in the Latino and African-American populations of their communities. In the South Asian focus groups diabetes was noted as one of the most prevalent health conditions in their communities. Similar to discussions of obesity, discussions of diabetes also frequently articulated the various consequences of the condition such as vision loss or amputations. In addition to these three major health conditions, several other conditions were discussed with considerable frequency and emphasis: dental issues, hypertension, cancer, substance
2 Questions on this topic for both the interviews and focus groups allowed individuals to respond based on their own definition of their community and based on their own framework for understanding the health status of this community. 3 Diabetes was such a prominent response that we gave it its own section as one of the major conditions.

156 Rutgers Center for State Health Policy/RWJMS Family Medicine & Community Health, Dec 2012
abuse/addictions, and communicable and infectious diseases such as HIV/AIDS, whooping cough, and sexually transmitted diseases.
Theme 2: Health Care Resources Existing Resources Community stakeholders and focus group participants named over 80 specific resources (see Appendix E). Researchers were able to sort these resources into three broad categories: physical well-being, mental well-being, and those that aid the social determinants of health (e.g., food pantries). Many of these resources are concentrated in the New Brunswick area with fewer found in the further reaches of the hospitals’ catchment area. Many community stakeholders have developed strong in-house programming to assist their particular community members. For example, a local church has created a number of programs for its youngest to oldest community members, providing services that address many issues including wellness, self-care, mental health, and cyber bullying. Focus group participants indicated that there are many resources that are not well known. Physical Well-Being. Resources for physical well-being include hospitals, clinical care sites, and programs leveraging assistance for special populations and aimed at specific diseases. Community stakeholders and focus group participants named many of the local hospitals (RWJUH, SPUH, Children’s Specialized Hospital, and Bristol-Myers Squibb Children’s Hospital) and their mobile units as good resources. Some focus group participants use other hospitals (e.g., JFK Medical Center and Raritan Bay Medical Center) because they are geographically closer to where they live. New Brunswick-based outpatient clinical care sites are all recommended and widely used: Eric B. Chandler Health Center, Family Medicine at Monument Square, the How Lane Clinic, Promise Clinic, and St. John’s Family Health Center. Community stakeholders and focus
“Well, obviously we have a lot of resources, and that’s a strength. We have some of the largest and highest quality health care providers in the state, and probably the nation, right here in our community. And, you know, who could ask for more than that? We have on the part of the hospitals tremendous outreach efforts. They’re out in the community; they’ve been terrific supporters of what happens here. You know, we have regular and ongoing interactions with RWJUH health promotion; SPUH mobile unit. The Promise Clinic, which is, you know, the medical school student-run health clinic, was created and operates across the street in St. John’s, about to move down to Chandler, which services the patrons of the soup kitchen exclusively, that fall through the cracks. So, you know, we’ve got this really resource-rich outreach-oriented kind of health care system in town, and clearly health care providers that value outreach and connecting with populations. So that piece is there, and you know, they do a wonderful job.”
Community stakeholder, 2012

157 A Community Health Needs Assessment
group participants could name only a few outpatient clinical sites outside the New Brunswick area, including urgent care centers in Kendall Park and East Brunswick and a part time clinic in Zarephath – the Zarephath Health Center. Some community stakeholders have developed relationships to leverage resources that address specific needs. For example, community stakeholders developed relationships with Lenscrafter and Walmart so children from low-income families could receive eye exams and purchase
affordable eyeglasses. Other resources address specific diseases. For example, the Middlesex County Department of Public Health sponsors the CEED (Cancer Education and Early Detection) program for its residents. Mental Well-Being (including mental health, domestic violence, substance abuse, and addiction). According to the community stakeholders and focus group participants, there are a number of good programs addressing mental health, but they are difficult to access because many of the existing programs are concentrated in the New Brunswick area. For example, the New Brunswick Methadone Maintenance Treatment Program assists individuals with heroin addiction including those who are uninsured. The two other methadone treatment programs mentioned are in South Amboy and Perth Amboy and require insurance or are self-pay. Some resources in the community were developed in response to particular contemporary issues. For example, there is a church organization that conducts a
workshop on cyber bullying and a community coalition that provides assistance to affected students in response to mass killings that dramatically unfold on television and in cyberspace.
“The For Keeps program, again being a partial day hospitalization program, is good for one end of the spectrum, kids that have severe issues – where they can get into it…With the patients we’ve sent them – they’ve been remarkable. Really done a nice job. And their program is, instead of a locked inpatient unit, the kids go during the week you know, 9:00 to 5:00…they have a great wealth, if that’s the word, of services. They have child psychiatrists there, child psychologists, clinical social workers and counselors. They do individual counseling, group counseling. They have a nurse who does medication management, not just with the kids, but the parents come and do that. And they have all sorts of art therapy and pet therapy. They have teachers and tutors that come there so they can keep up their academics. And I think the kids wind up staying in that program around 8 weeks, 12 weeks, depending on how they’re doing and what they need. I’m not sure the exact ages. I think it’s probably 5 to 15…So that’s a great resource, but you know, it’s hard if you have someone who’s really decompensated and they have to go on the waiting list and wait three months to get in.”
Community stakeholder, 2012

158 Rutgers Center for State Health Policy/RWJMS Family Medicine & Community Health, Dec 2012
Some organizations such as the Domestic Violence Coalition in New Brunswick have developed social norm campaigns that address issues of abuse. Both community stakeholders and focus group participants noted the social diversity of the communities served by St. Peter’s University Hospital and Robert Wood Johnson University Hospital. Some organizations such as the Multicultural Family Institute in Highland Park are designed to serve this diverse population while others have developed resources within their organization to address the population’s diversity. For example, NCADD of Middlesex County (National Council on Alcoholism and Drug Dependence) has board members who speak seven different languages. Both school nurses and senior center directors have developed programs addressing mental well-being in response to emerging issues in their respective communities. For example one school nurse described programs that her school has developed to address eating disorders, panic attacks, and students who are affected by sudden parental job loss. Senior center directors have instituted programs to address the mental health needs of their community. For example, one focus group participant noted: “At our senior center, we have social workers that you can go in and talk about anything and they are able to farm [sic] you out to what you need.” Social Determinants of Health. Many resources, particularly those noted by focus group participants, address the social determinants of health. Resources include food pantries, soup kitchens, community gardens, farmers’ markets, transportation services, exercise classes and spaces, baby equipment loan programs, and arts programming. Unlike many of the resources addressing physical and mental well-being that are focused in New Brunswick, these resources are found throughout the hospitals’ catchment area. Many of these programs are sponsored by community-based organizations, but local governments sponsor some as well. For example, focus group participants noted how involved the local Woodbridge Health Department was in developing programs such as the Mayor’s Wellness Coalition, which sponsors regular walks with the mayor, and Drop A Ton, a weight loss campaign in which the mayor challenged residents to lose more weight than he did during a three month period. Needed Resources or Resources Needing Improvements Our analysis of resources that reportedly are either needed or exist but need improvement revealed three primary themes. First, community stakeholders and focus group participants overwhelmingly requested resources for one primary health condition – obesity. Second, many

159 A Community Health Needs Assessment
wanted educational programs and awareness campaigns on a variety of topics for both patients and providers. Lastly, both community stakeholders and focus group participants wanted comprehensive medical and mental health services. A common thread of all three themes was that resources be developed locally and not concentrated in the New Brunswick area, as they believe is currently the case. Obesity. Community stakeholders and focus group participants highlighted the need for a broad range of resources to address obesity. They specifically called for safe places to exercise and play that were easily accessible. For example, Spotswood residents drive to other towns to reach safe walking spaces because their town does not have sidewalks, has locked school facilities (e.g., tracks), and has vandalized play spaces. Some health care providers identified the need for on-site exercise equipment at work to combat the deleterious effects of working long hours and eating convenience store food or fast food. Community stakeholders in New Brunswick and Franklin noted that people stayed in their homes because they perceived that town facilities (e.g., parks) and streets were unsafe because of drug- and gang-related violence. Both community stakeholders and focus group participants described a broad range of needed nutrition and food-related programming. These included educational programs that teach the nutritional value of various foods, trainings on reading and understanding nutrition labels and portion size, and guided walks through grocery stores explaining healthy eating on a budget. Some noted “food deserts” that are heavily concentrated with fast food establishments (e.g., the Route 27 corridor in New Brunswick and Franklin Township) and recommended that new educational resources would help people make better food choices. Education and Awareness. Most focus group participants wanted education programs and awareness campaigns for community members, and some community stakeholders described the need for training to assist health care providers. Education and awareness programming for community members included when to call the EMS or use the ER, prevention education, particularly as related to keeping people from getting sick (e.g., hand washing campaigns), coping with loneliness particularly for senior citizens, physical abuse awareness campaigns, substance abuse and cessation, as well as effects of social media and the Internet on children. Some community stakeholders suggested new delivery modes for these programs. For example, one community stakeholder suggested capitalizing on existing services by providing educational information and training while people are waiting in line for social services (e.g., while applying for WIC or Social Security benefits). Another community stakeholder suggested that educational programming be conducted regularly in churches and senior centers as well as at health fairs. Many focus group participants wanted educational programs to be conducted

160 Rutgers Center for State Health Policy/RWJMS Family Medicine & Community Health, Dec 2012
locally and at various times (including evenings and weekends) so that more people have access. Community stakeholders wanted training programs to assist health care providers because they felt that many providers are unable to properly diagnose and refer for mental health issues, developmental disabilities, domestic violence and abuse, and substance abuse and addiction, as well as to help providers learn how to work with community resource providers. One stakeholder suggested trainings on recognition of the early signs of addiction and referral for treatment so that addicts would be healthier and health care costs reduced. Another community stakeholder believed that health care providers were often unaware of the many services available in the local community to augment medical care and suggested “community resource rotations” to help providers understand the available resources and how to work with and refer to these resources. One health care provider believed that health literacy training would be beneficial to both patients and providers. This provider often had to explain complex concepts to patients after seeing a physician. As an example, this provider described an interaction with a woman who had been diagnosed with chlamydia by a physician. She thought the word sounded like a flower so she assumed she got it while working as a farm hand. The provider then had to explain to the woman that this was a sexually transmitted disease. Comprehensive Medical and Mental Health Services. In general, community stakeholders and focus group participants described the need for local comprehensive medical and mental health services. Many services are covered in the “Access” section of this report, so this section focuses on different resources that community stakeholders and focus group participants need to be extended, replicated, or created. Many wanted to see elderly home-based health care extended. Most reported that they do not have access to reasonably priced home-based health care ranging from assistance with cooking and housekeeping chores to medication management. Many community stakeholders felt that these resources would ameliorate long-term costs resulting from poor nutrition, falls, and medication errors. In addition, some thought that some unique programs should be replicated in other areas. For example, one community provider wanted to see the Parent Infant Care Center program in New Brunswick schools replicated as a centralized Middlesex County program because most schools deal with teenage parents who drop out or have high absenteeism rates. Some wanted new resources to be created; for example, several community stakeholders wanted a “sick-child daycare” so parents would not have to choose between exposing other children to illness and losing their jobs.

161 A Community Health Needs Assessment
Funding Community stakeholders described how funding levels affect services. In general, many community stakeholders discussed how the loss of funding reduced services or how they have tried to address complex needs with inadequate resources. In addition, service providers mentioned increased pressure on services by people living outside the area they serve. In addition, several stakeholders noted the existence of unique funding sources in certain limited geographical areas. Community stakeholders primarily discussed how the loss of funding curtailed services. In many cases services were lost completely, but sometimes limited funding was used for interventions that providers deemed inadequate. An example of lost services is Legal Services of New Jersey, which provided free legal services for patients (e.g., help accessing public benefits or help with immigration issues) until the program ended; now a similar program is about to end. As funding diminished, sometimes service providers obtained one-year grants to “fill the gap” but, as one service provider noted, one-year interventions for complex issues such as obesity are inadequate. A few service providers have “filled the gap” by going “above and beyond” and helping clients and their families obtain additional services outside of their purview. For example, one service provider helped families of low-income children access the local food bank so that the family could get additional food or free meals. Other service providers found inventive ways to extend services. One service provider manages a thrift shop and uses the proceeds to purchase grocery store gift cards, which she gives to fixed-income clients. Several community stakeholders found that people outside their service area were increasingly seeking their services. For example, one church started limiting its services to “members only” after noticing an increase in people outside their church accessing their services. A women’s health clinic experienced an increasing number of men seeking services. Service providers’ comments reflect that they are keenly aware of the inability to meet the need. Community stakeholders also noted that funding tends to be more available for greater New Brunswick area programming, including resources provided by federal, state, and local governments, local health departments, major philanthropic organizations, and community-based organizations.
Theme 3: Barriers to Health Care Health System Navigation A common response from both the community stakeholders and community members was that New Brunswick (in particular) is a very health resource-rich area in terms of the number and kinds of health services and health information available; however, there are various barriers

162 Rutgers Center for State Health Policy/RWJMS Family Medicine & Community Health, Dec 2012
that inhibit many people from being aware of these resources or understanding the system well enough to navigate it effectively. Several structural and cultural barriers were noted that shape how people use (or fail to use) the health care system, including language differences, lack of coordination between the hospitals and other health care facilities, insurance and ability to pay for services, and financial disincentives or penalties that work against effective/efficient use of the health care system. Some community stakeholders voiced perspectives that the New Brunswick immigrant population often does not feel entitled to health care and has a distrust of the health care system. Moreover, because many of these individuals are not familiar with how to navigate the health care system, the typical entry point is the emergency room. Focus group participants added perspectives that had not been expressed by the community stakeholders about how they work around barriers to get their medical needs addressed. For example, one participant noted how she has found a “trick” for gaining access to emergency medical services by using certain trigger words during triage. Other participants spoke about how people in need of prescription medications will seek out community members who will sell prescription medicine for a discounted rate compared to what one would pay at a pharmacy. It was noted that the ‘sellers’ may in fact be ill themselves (and therefore obtain their prescription legitimately) but choose to sell it out of financial need. Some focus group participants commented that it is possible to purchase prescription medications from local bodegas or online. Extended discussions about the pitfalls of these strategies revealed that community members are aware of the potential dangers, yet often financial pressures shape decisions to take these risks. Multiple participants also discussed how they (or their family or friends) have sought health care outside of the U.S. – typically in their country of origin (e.g., Dominican Republic and India). These participants described how, even though the costs of traveling to their home country would be great, it would still be less than what they would pay for health care if they received treatment in the U.S. Moreover, they perceived the care in their home country to be comparable or even better than that in the U.S. Health Care Information An important part of health care system navigation is having adequate information (see Appendix F for Sources of Health Care Information). There was evidence suggesting mixed perspectives regarding how participants trusted certain sources of information. Importantly, some participants commented that they do not rely solely on their physician for information. Participants voiced varying reasons for this. For example, one participant commented: “I truly believe that doctors are just human and they can’t do everything, and you need to research yourself. You need to do it yourself.” Other participants have had bad experiences with their physicians, which have created distrust in the doctor-patient relationship. In some cases,

163 A Community Health Needs Assessment
participants maintained a sense that physicians tend to make decisions about their patients’ health care for financial reasons and not necessarily the health of the patient. Frequently, community members cited the use of the Internet to acquire information about diseases, medications, or physicians/medical facilities. Health Care Access The most pronounced barrier to care – discussed commonly by both community stakeholders and focus group participants – was access. A prominent perception was that primary and subspecialty care was accessible for insured patients, with the two hospitals, Cancer Institute of New Jersey, Child Health Institute, University Behavioral Health Care, and several walk-in urgent care centers cited as valuable local resources. Some insured patients, however, reported difficulty finding specialists in their local area who take their insurance. Additionally, outpatient addiction rehabilitation is considered to be scarce regardless of insurance status. According to one stakeholder, this is a statewide problem, suggesting that the state can meet only a fraction of the demand for such services and even less of the actual need. Some mentioned that it is unfortunate that the addiction resources that used to be offered by the two hospitals are no longer available. A similar scarcity was highlighted related to group homes and supervised apartments for adults with developmental disabilities. For uninsured patients, access problems are prolific in all types of care. Many talked about the difficulty of getting timely care, outside of using the hospitals’ EDs. The clinics that accept
uninsured and Medicaid patients are considered to be “maxed out,” making it difficult to be seen by a doctor in a timely manner. One suggested solution to this problem was that perhaps the hospitals could expand their outpatient clinics to accommodate the overflow from the community clinics. Others suggested that “more low income clinics” are needed and that they should be “spread throughout the area” because transportation to the clinics is an important barrier to access. As one community member pointed out, “New Brunswick is one of the hardest places to get to, transportation-wise.” A community stakeholder suggested that one of the local clinics is actually under-utilized because of
transportation issues. Transportation barriers were also noted to be of particular concern for the elderly (highlighting the need for more home care) and children whose working parents are unavailable to take them for medical care (suggesting more health care services in school
“Accessing treatment, just having to get there, is a huge barrier… Having a full continuum of care available locally would be huge. Because as soon as people hear that they have to go a distance, that’s a discouragement to go to treatment…If you know that you’re going to have to go out of county for it, that’s a barrier. “
Community stakeholder, 2012

164 Rutgers Center for State Health Policy/RWJMS Family Medicine & Community Health, Dec 2012
settings as a part of the solution). In a similar vein, the inability of some children to get sports/camp physicals prevents them from participation in these health-promoting activities. Accessing specialty care using Charity Care was also described as potentially prohibitive. As one community stakeholder articulated: “If you have Charity Care, you can wait for months or even a year for an appointment with a specialist… so they (uninsured patients) end up using the ED.” Some, however, “will never qualify for Charity Care . . . they’re really out on a limb.” This is particularly true for undocumented immigrants, who do not qualify for a variety of services. This population was commonly mentioned as having the poorest health status, due to their having the least access to health care. Adding to the complexity of the situation, one stakeholder pointed out that these families often have unequal access to health care services within their own family: they may have children born in the U.S. who are eligible for services and other children born out of the country who are not eligible. Mental health care and dental care are widely considered to be the most difficult services to access for the uninsured. Several stakeholders complained about the mental health resources that have been cut in recent years, and pointed out that those that exist are plagued by “long waits” and transportation barriers. In addition, these services tend to “treat and release” and there are “very few options for long term care.” The largest unmet mental health need is for the Spanish-speaking population: “There are virtually no services for Spanish-speaking, no insurance, low income [patients] for mild mental health issues such as depression, anxiety, etc.” This is considered by many community stakeholders to be a “huge need” that has an impact on the health of families. Dental care is considered by many to be equally difficult to access for the uninsured. The general sentiment was expressed by one focus group participant: “If you don’t have money, you can kiss your teeth goodbye.” While some expressed awareness of the university dental service in Newark, the transportation issue was believed to be unmanageable. One community member shared how he waited many months to get a tooth filled because he first had to save the $371 it would cost. The danger of this behavior was pointed out by a community stakeholder: because of the expense, the uninsured “tend to disregard dental care, and that can lead to other health conditions down the road.” An additional aspect of health care access that was reported to be of concern was having access to affordable medication. Several spoke about a common strategy of uninsured patients who are on medications that they cannot afford – taking half of the medication “to conserve,” or

165 A Community Health Needs Assessment
minimizing the frequency with which a diabetic checks his/her blood sugar (“the strips are expensive”). The danger of taking medications irregularly was noted as a health risk within the community. This issue was perceived to be intensified by the fact that it is often possible to acquire new medications for free, but once they “go generic,” the “freebies” are no longer available. One of the consequences of the lack of access to affordable medication included getting medications on the black market. Senior citizens were highlighted as a population that has unique challenges acquiring affordable medications, especially when on a fixed income and “in the donut hole”4
with respect to their Medicare coverage. One individual also pointed out that “the elderly also often don’t understand their medical plans… thinking that it’s a co-pay when it’s cost-sharing; so they get big bills.”
Unmet Health Needs Several examples of patients postponing or forgoing needed care were also highlighted as a consequence of inadequate insurance coverage. Specifically mentioned were eye exams, glasses, hearing aids, cancer screening tests (even when there is a family history of specific cancers), physicals, and dental care. Some focus group participants also talked about going to their country of origin for care. Commonly, stakeholders and focus group participants related individuals’ unmet health needs to their impact on the larger community. As a focus group participant articulated it, “The lack of insurance causes people to neglect their health care . . . this is not leading to a healthy community at all.” Cultural Issues Our analysis revealed that the hospitals’ catchment area is very diverse with people of multiple races and ethnicities, originating from many countries, and speaking a broad range of languages. Community stakeholders and focus group participants described immigrant populations coming from Southeast Asia, India, South Korea, the Philippines, the Middle East, Mexico, Taiwan, Puerto Rico, the Dominican Republic, and other Caribbean countries. Languages spoken include Mandarin, Cantonese, Spanish, Korean, Mixtec, Russian, Urdu, Hindi, Gujarati, African (not specifically described), Haitian, Portuguese, and Hebrew. Language barriers create challenges for both providers and patients. Many stakeholders noted a paucity of bilingual therapists, clinicians, and medical and support staff in health care
4 The “donut hole” refers to the coverage gap in Medicare Part D insurance for prescriptions between the initial coverage limit and the catastrophic coverage threshold. Once the Medicare recipient uses up the initial coverage limit, s/he is responsible for a higher cost of prescription drugs until s/he reaches the catastrophic coverage threshold.

166 Rutgers Center for State Health Policy/RWJMS Family Medicine & Community Health, Dec 2012
facilities. Often providers are unable to offer services in a person’s first language and must rely on translation services of bilingual staff, medical interpreters, or telephone-based interpreters. One community stakeholder noted that this is not ideal because interpreters or interpreter services introduce a stranger into the room thus changing the provider-patient dynamic. Some providers noted that even when patients or clients speak English, the health system often works differently from the one in their home country and they need to spend extra time explaining how things work. Another language barrier revealed in our analysis was related to health literacy. Providers often speak in a manner that is confusing. For example, some stakeholders noted that people from other countries may not understand the concept of primary care, so asking a question such as, “Who is your primary care provider?” might not elicit a response or may elicit an incorrect response. Patients are often unable to find providers (e.g., home health aides) who speak their language or find specialized health information (e.g., about diabetes or dialysis) in their first language and therefore find it difficult to request and advocate for services if they do not speak English well. Focus group participants in Perth Amboy noted that even though there is a large Spanish-speaking population in their city, local providers often do not speak Spanish or have Spanish-speaking staff. Participants interpreted this as local providers not caring about them, which had deleterious effects on their health care. Many of the Perth Amboy focus group participants either receive their health care at local health fairs sponsored by PRAB and RWJUH or seek care in other cities, particularly New Brunswick. Hindi focus group participants requested that the hospitals consider putting information on their websites in multiple languages. Community stakeholders highlighted ways in which cultural beliefs often affect health behaviors and health care choices. A common example within the Hispanic community was the belief that plump children are healthy. In some cases this was a cultural norm and in others it was because they associated the opposite condition, being thin, with the malnourishment they experienced in their country of origin. Other health behaviors that affected health were the use of cures that could be harmful. For example, one service provider described finding that herbal remedies were causing childhood lead poisoning, but convincing parents to stop administering these remedies was difficult. In another case, a health care provider found ways to convince parents to move amulets (often a small stone on a bracelet) used to ward off evil spirits from a child’s wrist to the ankle to help prevent choking. Cultural beliefs were also understood to impact people’s choices for health care. For example, one service provider explained that some women diagnosed with breast or cervical cancer did not seek treatment because they needed permission from their husband. Another provider said that for some cultures health care is not a priority and people do not seek assistance until it is

167 A Community Health Needs Assessment
an emergency. Some focus group participants noted that they do not seek health care services because they do not trust doctors, and some said that many men in their community do not share knowledge of illness even with family members. Some service providers have found culturally appropriate interventions that help bridge some of these barriers. For example, one group working with the community-oriented primary care program at RWJMS developed a health ambassador program. They trained matriarchs and patriarchs within the South Asian community who in turn made recommendations to other community members about health issues such as flu immunizations. In addition, learning that Spanish women in domestic abuse situations were reluctant to seek assistance at women’s shelters, PRAB collaborated with Women Aware (a domestic violence service provider) and placed a bilingual, bicultural counselor at PRAB's offices so that women could seek domestic abuse services in a comfortable setting. As community stakeholders noted, these interventions were successful because they were based on cultural norms and designed after consulting with the affected communities. Doctor-Patient Communication Most of the focus groups raised the role of communication with their doctors as an important factor in their feelings about the quality of their health care. One of the ways good communication was described involved how easily patients felt they could reach their doctors
by phone. Those who felt they could reach their doctors easily expressed satisfaction. For example, a doctor who returned phone calls to explain procedures and help make decisions while the patient was in the hospital was referred to as “a saint.” On the other hand, patients who felt their doctors were inaccessible by phone had a negative assessment of their doctors and often of their health care in general. Referring to experiences with several doctors, one individual recalled: “[In] all my experiences, you couldn’t reach them (the doctors); they didn’t call you back. There was not enough communication. When I tried to ask questions, they cut you off.” Participants also evaluated the communication with their doctors in terms of how they feel about the doctor’s “bedside manner.” A common sentiment was articulated by one participant: with a good bedside manner, a doctor
I’m waiting and waiting until the doctor arrives…He comes in and asks, ‘What’s wrong?’ My knee was swollen…He half-heartedly touches it, says I’m fine and that he’s going to give me something. That’s it…My husband goes and tells the receptionist he wants another appointment but that he does not want the same doctor seeing his wife…It’s not right to treat us this way just because we’re Hispanic and don’t have insurance…Because you don’t have insurance you don’t get good service.
Focus group participant, 2012

168 Rutgers Center for State Health Policy/RWJMS Family Medicine & Community Health, Dec 2012
“can almost talk you out of some portions of the illness and make you feel a lot better.” In contrast, “A doctor who seems indifferent to your situation makes you feel hopeless.” This sentiment was echoed by several others in the Spanish-speaking focus group who felt that some doctors have a “superiority complex” and treat them disrespectfully. One participant elaborated, “They are out of touch with the community and don’t care to be in touch with the community.” One patient admitted that at times she even postpones taking her son to the doctor when she knows she should take him because of the disrespectful treatment she feels she receives from the doctors. Another patient expressed the belief that Medicaid patients systematically receive less attention from doctors: “Because you’re on Medicaid, you’re timed.” An additional instance of perceived poor bedside manner and inadequate communication had to do with the numerous doctors that often attend to patients in the hospital. As one participant complained, so many different doctors would “pop their head in…for two minutes” during the hospital stay “and they would start writing” without ever explaining who they were. “When you get their bill, you know who they were.” Two general suggestions were offered as ways to help the experience of seeing a doctor feel “more personable”: one participant suggested having a “greeter” who meets patients at the door, says hello and welcomes them in. “Just that little touch . . . That helps you get better.” Another participant made a case for the role of a designated nurse who could “do the assessment, who could do some teaching, who would be available for the patient.” The belief was that it would give the patient more communication with a health care professional as well as help the doctors with their “time management.”
Theme 4: Community Perceptions of Hospitals Both focus group participants and community stakeholders spoke about their perceptions of the two hospitals. Focus group participants tended to give evaluations of the hospitals based on memorable experiences as patients, while community stakeholders tended to offer suggestions for ways that the hospitals could improve their relationships with the community and with each other. Many of the positive statements patients made about both hospitals were expressed as general statements, such as “excellent care,” “great experience,” “no complaints,” etc. Patients also expressed specific appreciation for minimal wait times, “professional” and “personable” medical staff, receiving a follow-up phone call after discharge, and when the hospitals’ appearance is clean and organized. Patients tended to be critical of one or both of the hospitals if they had had a particularly negative experience as a patient. Such experiences included: medication and procedural errors,

169 A Community Health Needs Assessment
“inattentive” or “uncompassionate” medical staff, insufficient communication about one’s medical condition or discharge date, and particular difficulty clearing a medical bill. Memories of negative hospital experiences seemed to have the power to color the patient’s perception of that hospital long after the experience. Among community stakeholders, there was a perception that the two hospitals are competitors. One individual expressed that the “antagonism” between the hospitals is not only because they are “competing for the same health care dollar” but also because of an inherent imbalance, due to the fact that only one of the hospitals owns an ambulance service. Commonly, community stakeholders suggested needed improvement in communication and coordination: between the two hospitals; between academia, health care and public health (with the suggestion that public health students do rotations in the hospitals, as well as in other areas in the community); and between the hospitals, community medical offices, and home care. Regarding transition of care from the hospital, there were two specific suggestions: one was to have a dedicated staff person meet with patients before discharge to answer questions and verify that patients have what is needed; the other is to loosen the restrictions on when a patient can be admitted into sub-acute, so it could be used more for transitional care (i.e., more family involvement while still under nurse supervision). Finally, while community stakeholders praised the hospitals for their “great programs” (including educational and support groups as well as free screening events), they recommended that the hospitals should “be more involved in the community” by offering such programs at satellite sites and regularly having mobile care units in various communities to reduce unnecessary ED utilization.
Conclusions The hospitals’ catchment area has a high concentration of health care resources in New Brunswick, but the distribution of these resources throughout the area is uneven. This creates severe access barriers for residents in the outer reaches of the catchment area because public transportation into New Brunswick from many areas is poor. In addition, uninsured residents do not benefit from the resource-rich health care environment that New Brunswick, in particular, offers. While health care access for the uninsured is a national problem and not unique to this local region, our analysis suggests that there are some specific aspects of the local health care landscape in which there is potential for improvement. Improved coordination of existing health care resources would help to optimize the utility of these services.

170 Rutgers Center for State Health Policy/RWJMS Family Medicine & Community Health, Dec 2012
Better coordination would also prevent the residents and stakeholders in the hospitals’ catchment area from feeling “over-assessed.” Because the plethora of needs assessments over the years have not been sufficiently coordinated, there has been duplication of effort and consequently less effectiveness and efficiency. It is suggested that the conclusions of the current assessment and the responding interventions be widely publicized throughout the catchment area. In addition to the uneven distribution and limited coordination of resources, there are some resources that are inadequate or altogether lacking, even in “resource rich” New Brunswick: resources for dental care, addiction treatment, long-term mental health care, and sources of affordable medication. This resource gap results in patients postponing or neglecting medical care, overusing the EDs, and the maintenance of an active black market for prescription medications. The most prevalent health issues in the represented communities are obesity, mental health issues, and diabetes. All three are complex problems, and socio-economic and cultural issues have bearing on them all. The concerns around obesity include its related sequelae of hypertension, heart disease, and diabetes, with particular concern around the many social conditions that contribute to obesity in adults and children. Mental health issues are broad in scope but depression and anxiety are most prevalent and are often untreated. Diabetes is problematic in all communities but with noted concentrations in the Latino, African American, and South Asian communities. Assuring access to low cost diabetes management supplies is a serious concern for the health of these communities. The hospitals’ catchment area is extremely diverse in terms of cultures and languages. This creates particular challenges in navigating the health care system and the hospitals, in particular. Most problematic is the communication barrier between non-English speaking patients and their doctors, as well as the current signage in the hospitals which is not discernable to those who are unable to read English. The perceived “antagonist” relationship between the two hospitals also stands as a barrier to coordinated services in their mutual catchment area. Improved communication and coordination between the hospitals may thus serve to advance community health. Other areas for hospital improvement include enhanced customer service training for all hospital personnel (particularly around cultural competency), patient advocates, and personnel to help families navigate post-hospitalization care. Patient perceptions of the hospitals can be deeply influenced by a single negative experience. These perceptions can endure even decades after the defining experience and can play an important role in shaping patient decisions.

171 A Community Health Needs Assessment
References Borkan J. 1999. “Immersion/Crystallization.” In Doing Qualitative Research, 2nd ed, edited by
BF Crabtree, and WL Miller, 179–94. Thousand Oaks, CA: Sage. DiCicco-Bloom B, and BF Crabtree. 2006. “The Qualitative Research Interview.” Medical
Education 40 (4): 314–21. Kuzel AJ. 1999. “Sampling in Qualitatitve Inquiry.” In Doing Qualitative Research, 2nd ed, edited
by BF Crabtree, and WL Miller, 33–45. Thousand Oaks, CA: Sage. Strauss A, and J Corbin. 1990. Basics of Qualitative Research: Grounded Theory Procedures and
Techniques. Newbury Park, CA: Sage. U.S. Congress. 2010. “The Patient Protection and Affordable Care Act, Public Law 111–148.”
U.S. Government Printing Office. http://www.gpo.gov/fdsys/pkg/PLAW-111publ148/pdf/PLAW-111publ148.pdf.
World Health Organization. 2012. “Social Determinants of Health.” World Health Organization.
Accessed October 20. http://www.who.int/social_determinants/en/.

172 Rutgers Center for State Health Policy/RWJMS Family Medicine & Community Health, Dec 2012
Appendix 4.A: Questions Used for the Community Stakeholder Interviews Background/role:
1. Please tell me your name, the organization you work for, and your job title/role. a. Probe for details on background on the organization, e.g., length of existence,
mission, engagement in the community it serves. b. Probe for details on interviewee’s background, e.g., education, how long s/he
has been with organization. “Grand tour questions”:
1. How would you describe the overall status of health and health care in your community?
2. What do you see as the major health problems in your community today? 3. What do you see as the major strengths/resources in your community relative to health
and health care? What health resources are not being used well? What health resources could be used differently to improve peoples’ health in your community?
4. What kinds of things do you think could be done or programs developed to improve health and health care in your community?

173 A Community Health Needs Assessment
Appendix 4.B: Questions Used for Focus Groups “Grand tour questions”:
1. What does health care mean to you? (Probe for pro-active or reactive kinds of health care seeking behaviors).
2. How would you describe the overall status of health and health care in your community?
3. What do you see as the major health problems in your community today? 4. What do you see as the major strengths/resources in your community relative to health
and health care? What health resources are not being used well? What health resources could be used differently to improve peoples’ health in your community?
5. Have you ever tried to obtain health care at RWJUH or SPUH in New Brunswick? (If yes), what has that experience been like for you? (If neither, probe for places they have received care).
6. Do you have health needs that you have not tried to get help for or that are not being met? (Probe for details).
7. Where do you typically get information about health and health care? 8. What kinds of things affect your ability to get health care? (Probe for specifics on, e.g.,
costs/insurance, child care, transportation, access, others). 9. What kinds of things do you think could be done or programs developed to improve
health and health care in your community?

174 Rutgers Center for State Health Policy/RWJMS Family Medicine & Community Health, Dec 2012
Would You Like to Help with a Research Study?
Appendix 4.C: Sample Recruitment Flyer
If you live in Somerset or Middlesex County, we would like to invite you to a focus group to hear about your experiences of getting health care. The focus group will be conducted by the Robert Wood Johnson Medical School, Department of Family Medicine & Community Health. The focus group will include up to 15 adults and will last approximately 2 hours. After the focus group is done you will receive $25 as a thank you gift for participating. If you are interested, please call this number for additional information:
732-418-8056
Date: June 27, 2012 Time: 6:00 PM-8:00 PM Location: Woodbridge Health Department 2 George Frederick Plaza, Woodbridge, NJ 07095 From Rte 1 North Proceed north on Rte 1 past Woodbridge Center Mall, Green St. Miller Pontiac intersections until you reach the exit Rte 35 south Past the traffic light and over the railroad tracks. Make the second left Hand turn past the tracks and into the parking lot. (Health Center is Located between Woodbridge High School and the Library). From Rte 1 South Proceed south until you reach the exit for Rte 35 south. Proceed past the traffic light and over the railroad tracks. Make the second left Hand turn past the tracks and into the parking lot. (Health Center is located between Woodbridge High School and the Library). From Rte 9 North Take Rte 9 north to its intersection with rte 1 north to the exit for Rte 35 south. (Less than 1 mile). Proceed past the traffic light and over the railroad tracks make the second left hand turn past the railroad tracks and into the parking lot.

175 A Community Health Needs Assessment
Appendix 4.D: Qualitative Analysis Code Book Access Background Context that impacts community Cultural issues Doctor-patient relationship Funding Health system navigation Health care - patient meaning Health care information - patients Hospitals - relationships with Insurance Medical conditions - abuse Medical conditions - cancer Medical conditions - cardiac Medical conditions - cognitive Medical conditions - dental Medical conditions - diabetes Medical conditions - immunizations Medical conditions - mental health Medical conditions - obesity Medical conditions - other Medical conditions - physical handicap Medical conditions - reproductive Medical conditions - respiratory Medical conditions - vision Patient hospital experiences Population served Primary health conditions Resources - barriers to utilization Resources - existing - good Resources - existing - requires improvement Resources - facilitators to utilization Resources - needed Social determinants of health

176 Rutgers Center for State Health Policy/RWJMS Family Medicine & Community Health, Dec 2012
Appendix 4.E: Good Existing Resources Following is a list of good existing resources mentioned by community stakeholders during depth interviews and participants of the eight focus groups. The first section includes specifically named resources and the second section includes more general resources. We have included web site URLs where possible. Specifically Named Resources
Alpine Learning Group, Paramus, NJ, URL: http://pcdi.org Anshe Emeth Community Development Corporation, New Brunswick, NJ, URL: http://www.aecdc.org Autism New Jersey, Robbinsville, NJ, URL: http://www.autismnj.org Babé BELL (Baby Equipment Lovingly Loaned) Program see Anshe Emeth Community Development Corporation Body & Soul, Cancer Institute of New Jersey, Robert Wood Johnson Medical School, New Brunswick, NJ, URL: http://www.cinj.org/outreach/BodySoulProgram.html Brain Injury Alliance of New Jersey, North Brunswick, NJ, URL: http://bianj.org The Bristol-Myers Squibb Children’s Hospital at Robert Wood Johnson University Hospital, New Brunswick, NJ, URL: http://www.bmsch.org Cancer Education and Early Detection Program, Middlesex County Health Dept., New Brunswick, NJ, URL: http://www.co.middlesex.nj.us/publichealth/adult.asp Cancer Institute of New Jersey, UMDNJ-Robert Wood Johnson Medical School, New Brunswick, NJ, URL: http://www.cinj.org Carrier Clinic, BelleMead, NJ, URL: http://www.carrierclinic.org Central Jersey Community Development Corporation, Somerset, NJ, URL: http://cjcdc.org

177 A Community Health Needs Assessment
Children’s Specialized Hospital, New Brunswick, NJ, URL: http://www.childrens-specialized.org Commission for the Blind and Visually Impaired, Department of Human Services, State of New Jersey, Newark, NJ, URL: http://www.nj.gov/humanservices/cbvi/home/index.html Community Health Promotion Program, Robert Wood Johnson University Hospital, New Brunswick, NJ Community Mobile Health Services, St. Peter’s University Healthcare System, New Brunswick, NJ, URL: http://www.saintpetershcs.com/Community-Mobile-Health-Services/ Community Oriented Primary Care (COPC) Summer Assistantship, UMDNJ-Robert Wood Johnson Medical School, Piscataway, NJ, URL: http://rwjms.umdnj.edu/departments_institutes/family_medicine/pre_doctoral/summer/community.html Comprehensive Services on Aging (COPSA), University Behavioral Healthcare, Piscataway, NJ, URL: http://www.umdnj.edu/copsa/copsa.html CUP (Communities United for People) Food Pantry, Spotswood, NJ, URL: http://www.stpetersspotswood.org/cohm.htm Division on Aging, Institute for Health, Health Care Policy and Aging Research, Rutgers, The State University of New Jersey, New Brunswick, NJ, URL: http://www.ihhcpar.rutgers.edu/org_units/default.asp?v=2&o=1 Dorothy B. Hersh Regional Child Protection Center (CPC), St. Peter’s Healthcare System, New Brunswick, NJ, URL: http://www.saintpetershcs.com/DBHersh-Child-Protection-Center/ Drop a Ton, Woodbridge, NJ, URL: http://www.facebook.com/pages/Woodbridge-Drop-a-Ton/160909757309625?fref=ts Elijah's Promise, New Brunswick, NJ, URL: http://www.elijahspromise.org Eric B. Chandler Health Center, UMDNJ-Robert Wood Johnson Medical School, New Brunswick, NJ, URL: http://rwjms.umdnj.edu/patient_care/chandler/index.html

178 Rutgers Center for State Health Policy/RWJMS Family Medicine & Community Health, Dec 2012
Family Health Center, St. Peter’s Healthcare System, New Brunswick, NJ, URL: http://www.saintpetershcs.com/Family-Health-Center/ Family Medicine at Monument Square, UMDNJ-Robert Wood Johnson Medical School, New Brunswick, NJ, URL: http://umg.umdnj.edu/Public/clinical_services/division.asp?division=pccms First Baptist Church of Lincoln Gardens, Somerset, NJ, URL: http://fbcsomerset.com/index.php For KEEPS program (Kids Embraced and Empowered through Psychological Services), St. Peter’s Healthcare System, New Brunswick, NJ, URL: http://www.saintpetershcs.com/ForKEEPS/ Fresh Grocer, New Brunswick, NJ, URL: http://www.thefreshgrocer.com/new-store.aspx Healing Through the Arts: Artists Mentoring Against Racism, Drugs and Violence Summer Camp collaboration between Suydam Street Reformed Church, Robert Wood Johnson University Hospital – Community Health Promotion Program, and the Rutgers University Center for Latino Arts and Culture Healthier Somerset In Action, Somerville, NJ, URL: http://healthiersomerset.com/healthier-somerset-in-action House of Manna, First Reformed Church, New Brunswick, NJ, URL: http://firstreformedchurch.net/house-of-manna-4/ Hyacinth AIDS Foundation, New Brunswick, NJ, URL: http://www.hyacinth.org/hyacinth/home/index.jsp Intensive Family Support Services, Middlesex County, University Behavioral Health Care, Piscataway, NJ, URL: http://ubhc.umdnj.edu/adult/ICMS.htm Intensive Family Support Services, Somerset County, Easter Seals NJ, East Brunswick, NJ, URL: http://nj.easterseals.com/site/PageServer?pagename=NJDR_IntensiveFamilySupportServicesIFSS Johnson & Johnson, Corporate Giving, New Brunswick, NJ, URL: http://www.jnj.com/connect/caring/corporate-giving/ LensCrafters OneSight Program, URL: http://www.lenscrafters.com/lc-us/onesight

179 A Community Health Needs Assessment
Live for Life Program, Johnson & Johnson, New Brunswick, NJ Middlesex County Area Wide Transit, New Brunswick, NJ, URL: http://www.co.middlesex.nj.us/awts/ Middlesex County Division of Addictions and Mental Health Planning, New Brunswick, NJ, URL: http://www.co.middlesex.nj.us/humanservices/men-add-serv.asp Mobile Health Unit, Robert Wood Johnson University Hospital, New Brunswick, NJ Mt. Zion AME Church, Health Ministry, New Brunswick, NJ Multicultural Family Institute, Highland Park, NJ, URL: http://multiculturalfamily.org NAMI (National Alliance of Mental Illness) New Jersey, North Brunswick, NJ, URL: http://www.co.somerset.nj.us/scootdash.html National Council on Alcoholism and Drug Dependence (NCADD), Robbinsville, NJ, URL: http://www.ncaddnj.org New Brunswick Community Farmers Market, New Brunswick, NJ, URL: http://www.nbcfarmersmarket.com New Brunswick Community Food Alliance, New Brunswick, NJ, URL: http://www.nbfood.org New Brunswick Dial-A-Ride, New Brunswick, NJ, URL: http://njfindaride.com/?action=display_provider_details&provider_id=401 New Brunswick Domestic Violence Awareness Coalition, New Brunswick, NJ, URL: http://nbdvac.blogspot.com New Brunswick Methadone Maintenance Treatment Program, New Brunswick, NJ New Brunswick Tomorrow, New Brunswick, NJ, URL: http://nbtomorrow.org New Jersey Partnership for Healthy Kids, New Brunswick, NJ, URL: http://www.njhealthykids.org/communities/new-brunswick/

180 Rutgers Center for State Health Policy/RWJMS Family Medicine & Community Health, Dec 2012
New Jersey Vaccine for Children, URL: https://njiis.nj.gov/njiis/html/vfc.html New Jersey WIC Services, URL: http://www.nj.gov/health/fhs/wic/index.shtml On-Time Transport, Roselle, NJ, URL: http://www.ontimetransport.com Parent Infant Care Center (PIC-C) Program, New Brunswick High School, New Brunswick, NJ, URL: http://ubhc.umdnj.edu/childrenfamily/carri_picc.html Pharmaceutical Assistance Programs, URL: http://www.medicare.gov/pharmaceutical-assistance-program/index.aspx?AspxAutoDetectCookieSupport=1 Play S.A.F.E. Program, New Brunswick, NJ PRAB (Puerto Rican Action Board), New Brunswick and Perth Amboy, NJ, URL: http://www.prab.org PRAB and Women Aware – Esperanza Domestic Violence Project Princeton Child Development Institute, Princeton, NJ, URL: http://pcdi.org Promise Clinic, UMDNJ-Robert Wood Johnson Medical School, New Brunswick, NJ, URL: http://rwjms3.umdnj.edu/promise_clinic/index.html Robert Wood Johnson Medical School, New Brunswick and Piscataway, NJ, URL: http://rwjms.umdnj.edu Robert Wood Johnson University Hospital (RWJUH), New Brunswick, NJ, URL: http://www.rwjuh.edu RWJUH Health & Wellness Center, New Brunswick, NJ, URL: http://www.rwjfitnessnewbrunswick.com Salvation Army, New Brunswick Corps., New Brunswick, NJ, http://www.use.salvationarmy.org/use/www_use_nj.nsf/vw-sublinks/85621D058D8D182F8525748F0050AA42?openDocument Sister's Network of Central New Jersey, New Brunswick, NJ, URL: http://www.sncnj.org

181 A Community Health Needs Assessment
Somerset County Mental Health Administrator, Somerville, NJ, URL: http://www.co.somerset.nj.us/hservices/index.html Somerset County Transportation Services, Somerville, NJ, URL: http://www.co.somerset.nj.us/scootdash.html Somerset Learning Institute, Bedminster, NJ, URL: http://www.somerset-hills.org Special Child Health Services, Department of Health, State of New Jersey, Trenton, NJ, URL: http://www.nj.gov/health/fhs/sch/ Spotswood Senior Center, Spotswood, NJ, URL: http://www.spotswoodboro.com/officeonagingpage01.html St. John's Health and Family Center, Catholic Charities, Diocese of Metuchen, New Brunswick, NJ, URL: http://www.ccdom.org/locations/st-johns-health-family-center St. Peter’s University Hospital, St. Peter’s Healthcare System, New Brunswick, NJ, URL: http://www.saintpetershcs.com/saintpetersuh/ Unity Square, Sacred Heart Church, New Brunswick, NJ, URL: http://hub4sacredheart.org/unitysq_programs.aspx University Behavioral Healthcare (UBHC), University of Medicine & Dentistry of New Jersey, Piscataway, NJ, URL: http://ubhc.umdnj.edu Visiting Nurse Association of Central New Jersey, Red Bank, NJ, URL: http://www.vnahg.org/visiting-nurse-association-of-central-jersey.aspx We Feed Food Drive, Woodbridge, NJ, URL: http://www.twp.woodbridge.nj.us/Departments/HealthandHumanServices/Information/WeFeedFoodDrive/tabid/372/Default.aspx Women Aware, New Brunswick, NJ, URL: http://www.womenaware.net/contact.html Women's Health & Counseling Center, Somerville, NJ, URL: http://www.womenandhealth.org

182 Rutgers Center for State Health Policy/RWJMS Family Medicine & Community Health, Dec 2012
Woodbridge Mayor's Wellness Coalition, Woodbridge, NJ, URL: http://www.mayorswellnesscampaign.org/woodbridge-named-new-jersey-healthy-town/ Zarephath Health Center, Zarephath, NJ, URL: http://www.zhcenter.org General Resources
Community Gardens Farmers Markets Food Banks and Pantries Health Fairs Holistic Alternatives Med Emerges / Urgent Care Centers Mutual Assistance Partnerships with Local Businesses School Nurses Teenage / Senior Interactions Transportation Services Walking and Exercise Facilities

183 A Community Health Needs Assessment
Appendix 4.F: Sources of Health Care Information Health Care Facilities Robert Wood Johnson University Hospital Community Outreach St. Peter’s University Hospital Eric B. Chandler Health Center Cancer Institute of New Jersey Agencies/Community Organizations Office on Aging State Health Department Medicare Senior Center Municipal Center (senior group) PRAB (Puerto Rican Action Board) YMCA Internet WebMD Wikipedia Search on Google (“I type in key words like ‘cheap health care’”) Middlesex County website (includes CEED program) Pamphlets Medical facilities Pharmacies Pharmaceutical companies Insurance company Other Newspaper ads Health fairs Health related magazines/newsletters Library Doctor TV promotions Word of mouth (family/friends)

184 Rutgers Center for State Health Policy/RWJMS Family Medicine & Community Health, Dec 2012
Chapter 5: Discussion
Conclusions A multi-pronged analytic approach, including both quantitative and qualitative components, was employed in this project to inform the community health needs assessment and implementation strategy required from all non-profit hospitals under the 2010 Affordable Care Act. Quantitative methods included analysis of both BRFSS data and hospital discharge records for the hospitals’ primary service area compared to statewide findings, and interpretation of findings from a community phone survey conducted in the service area. Qualitative methods included focus groups of health care consumers and key informant interviews with local stakeholders, providers, and representatives from safety net and other community-based organizations. Taken together, this rich array of data provides a wealth of information on the health needs of the community and should help inform the hospitals’ implementation strategy to address those needs. Common themes were evident across the different study components. The uninsured face substantial challenges with regards to access to care; this was seen in all components of the study. Other demographic groups facing similar access challenges were low income respondents (BRFSS data, community survey), Hispanics, and non-Hispanic blacks (all four components); also, the qualitative components specifically highlighted the particular challenges of undocumented Hispanics. New areas of concern are found among the growing Asian population in the community (BRFSS data, community survey, qualitative components). These issues are not about basic access to health care, but rather are related to navigating the health system (transportation, language barriers, parking, etc.); non-English speakers, the undocumented, and the uninsured face similar challenges navigating the health system. Poor dental care is a problem among Asians as is diabetes, particularly among South Asians (BRFSS data, community survey). Diabetes is also a concern among black non-Hispanics (BRFSS data, community survey, qualitative components). Other major health concerns included asthma, obesity, mental health, dental health, and access to dental care (BRFSS data, community survey, qualitative components). Emergency department use is high among vulnerable groups (seen in all four components). Other key findings were specific to each component. Those include:
• BRFSS data

185 A Community Health Needs Assessment
o In general, older adults fared worse on the health status measures, while younger adults reported more problems with the healthcare access measures. Younger adults also fared worse on risky behaviors, whereas older adults generally engaged in more preventive behaviors.
o Females fared worse on most health status measures, with the exception of diabetes. Males were less likely to have a regular doctor and medical or dental check-ups, while females reported more problems with cost barriers to care.
o Black non-Hispanic and Hispanics fared worse on some of the health status measures than white non-Hispanics, but white non-Hispanics were more likely to report heart attack, stroke, and activity limitation. Black non-Hispanics and Hispanics reported more problems with the healthcare access measures. Asian non-Hispanics fared better on almost all the measures; notable exceptions included diabetes and not having a recent dental visit.
o Low income respondents and the uninsured fared worse on nearly all measures. • Hospital discharge records
o Population-based rates of avoidable hospitalizations and ED visits were lower for the service area of the hospitals compared to NJ overall, suggesting relatively higher adequacy of primary care.
o Percentage of avoidable hospitalizations within the hospital service area was highest within Medicare-paid hospitalizations (17.0%) followed by those with payer type uninsured/self-pay (11.0%).
o Unlike inpatient hospitalizations, Medicaid-paid ED visits had the highest percentage of avoidable visits (58.1%) followed by ED visits with payer type self-pay /uninsured (49.8%).
o Blacks were more likely to have avoidable hospitalizations, while Hispanics were more likely to have avoidable ED visits.
o For children, blacks and Hispanics had higher rates of avoidable hospitalizations (out of all hospitalizations) than white patients.
• Community phone survey o 56.2% of adults had been diagnosed with at least one chronic condition; 30.8%
had been diagnosed with high blood pressure. o About two-thirds of adults (66.0%) were either overweight or obese, but only
24.8% had received advice about their weight from a health care provider in the past year.
o 20.1% of adults had visited the ED in the past year and about a third of those had visited the ED more than once. The majority (81.2%) spent less than 30 minutes in the ED before being seen by a health care provider.
o About a fourth (27.0%) reported at least one major barrier to wanted care.

186 Rutgers Center for State Health Policy/RWJMS Family Medicine & Community Health, Dec 2012
o Over half (52.9%) of adults reported at least one problem with navigating the health care system; inconvenient doctor’s hours and having to wait too long to get an appointment were cited most often.
o Younger adults reported more problems with health care access and utilization measures than older adults, but older adults fared worse on the health status measures. Younger adults also took more chances with their health.
o Males fared worse on health care utilization-related measures and risky health attitudes and behaviors, while females reported more problems with chronic conditions, basic access to care, and health care system navigation concerns.
o Hispanics and Asian non-Hispanics were more likely to report access problems. However, for Asians, most of their concerns related to navigating the health care system (transportation, language issues, etc.), while Hispanics were much more likely to report basic access problems such as not getting wanted care. Black non-Hispanics had a moderate number of concerns, about half the number for Hispanics and Asians. White non-Hispanics were more likely to have ever been diagnosed with high blood pressure or other chronic condition.
o Prescription medication use is high, with 60.6% of adults taking at least one prescription medicine in the past month and even higher rates among older adults, females, white non-Hispanics, middle-income respondents, and those publicly insured. Taking at least one prescription medication in the past month was reported for nearly one in three children, and was even higher among white non-Hispanic children (44.9%) and children in high-income households (41.9%).
o The number of black non-Hispanic children, Asian non-Hispanic children, children of other race, low income children, and uninsured children was too low to report cross-tabulated results for any of the measures, but it is likely that many in these sub-groups also have more health or access concerns.
o Publicly insured children fared well in the dental measures; they were more likely to have had a dental check-up in the previous year and to have dental insurance.
o Over 15% of the children overall had ever been diagnosed with asthma, so this remains a concern. Nearly one in five children had at least one ED visit in the past year, and this was even more likely in several sub-groups of children.
• Key informant interviews and consumer focus groups o The hospitals’ catchment area has a high concentration of health care resources
in New Brunswick, but the distribution of these resources throughout the catchment area is uneven.

187 A Community Health Needs Assessment
o Because the plethora of needs assessments over the years have not been sufficiently coordinated, there has been duplication of effort and consequently less effectiveness and efficiency.
o There are some resources that are inadequate or altogether lacking, even in “resource rich” New Brunswick: resources for dental care, addiction treatment, long-term mental health care, and sources of affordable medication.
o The most prevalent health issues in the represented communities are obesity, mental health issues, and diabetes. All three are complex problems, and socio-economic and cultural issues have bearing on them all.
o The hospitals’ catchment area is extremely diverse in terms of cultures and languages. This creates particular challenges in navigating the health care system and the hospitals, in particular.
o The perceived “antagonist” relationship between the two hospitals also stands as a barrier to coordinated services in their mutual catchment area.
o Other areas for hospital improvement include enhanced customer service training for all hospital personnel (particularly around cultural competency), patient advocates, and personnel to help families navigate post-hospitalization care.
o Patient perceptions of the hospitals can be deeply influenced by a single negative experience. These perceptions can endure even decades after the defining experience and can play an important role in shaping patient decisions.
On a positive note, most health and access-based indicators in the hospitals’ primary service area were consistently better than benchmark rates for the state of New Jersey overall (found in the BRFSS data and hospital discharge records). However, disparities for the uninsured and low income respondents still remain and are quite large for many measures. Some racial-ethnic disparities also remain, although not consistently across all the measures. Finally, changing demographics have brought new health challenges, particularly with language barriers among growing Asian sub-groups and other system navigation issues.
Interpretation, Generalizability of Findings, and Study Strengths There are several points that should be noted when interpreting the findings from the various analytic activities described here or generalizing them to the community as a whole. The BRFSS data and community phone survey have potential limits inherent to any survey data. These limits primarily deal with the problem of not being able to reach some sub-groups of the

188 Rutgers Center for State Health Policy/RWJMS Family Medicine & Community Health, Dec 2012
population such as those without telephones or those suspicious of research. While survey questions were constructed as unambiguously as possible, it is possible that some participants did not understand all questions. Also, the sample sizes for some sub-groups, particularly among children, were too small and so results for these sub-groups were not reported as they would not be statistically reliable. The findings from the hospital discharge records are based on avoidable hospitalizations and ED visits. These measures identify unmet community health care needs since these visits could be avoided by high quality community based primary care (AHRQ 2012a). However, there are other factors related to poor environment or patient non-adherence to treatment that could also result in these hospitalizations. Notwithstanding, these measures provide a good starting point for assessing quality of health services in the community (AHRQ, 2012a). The qualitative data collection strategies posed certain strengths and limitations. Including both focus groups and interviews provided rich information from a broad array of community stakeholders regarding their experiences, opinions, and perspectives on the health and healthcare in their communities. However, time and resource constraints inhibited the ability to include all cultural, ethnic, racial, and geographic sub-groups in the study. As is common with qualitative studies, key stakeholders were purposefully selected for the interviews. This helped to ensure broad representation of healthcare services and perspectives. However, there are likely certain areas of healthcare that are not represented in this report. Moreover, the purposive nature of this sampling strategy inhibits the ability to generalize to the larger population of healthcare stakeholders in these communities. Additionally, the interpretive nature of the qualitative analysis can raise questions of validity. Systematic steps were taken to minimize researcher biases throughout the data collection and analysis process and rigorous qualitative techniques were used to verify our interpretations and conclusions. However, there are multiple strengths to this study which help mitigate many of these limitations. By using four different data sources, both quantitative and qualitative, it is possible to see if common themes emerge across the different methods. The fact that many common themes did emerge strengthens the reliability and generalizability of the findings. Another strength of this project is that input was collected from both the public (BRFSS, hospital discharge data, community phone survey, consumer focus groups) and also from providers and other experts in the field (key informant interviews). Thus we were able to identify need from both perspectives and again examine where findings converge. Data sources included both self-report (BRFSS, community survey, and qualitative components) and administrative data (hospital discharge records); again, converging themes across both types of data strengthen these findings. The hospital discharge records had detailed information on patient and payer

189 A Community Health Needs Assessment
characteristics that shed light on the composition of patients facing barriers to ambulatory care as well as those who are at the highest risk of facing access problems. Such information captured in administrative records can then help in developing interventions to ensure primary care adequacy within the community. Similarly, the BRFSS data and community survey have detailed information on patient demographics and health insurance that allow stratification of findings by these characteristics. The community survey and the qualitative components allowed tailored investigation by customizing the questions based on study objectives. Additionally, having focus groups conducted in multiple languages (English, Spanish, Hindi, and Gujarati), including cell phone interviews in the community survey, and a highly diverse hospital service area resulted in a good racial-ethnic representation in all components of the study. This ensured that viewpoints and perspectives of many members of the community were heard. Finally, the qualitative findings in this report represent a summary of personal experiences, opinions, and perspectives. These can be important for understanding peoples’ healthcare behaviors and decisions as well as gaining insights into the context of health and healthcare in Middlesex and Somerset counties.

190 Rutgers Center for State Health Policy/RWJMS Family Medicine & Community Health, Dec 2012
Supplement: Summary of New Jersey Childhood Obesity Study Findings for New Brunswick, NJ
Introduction This appendix presents a brief summary of findings for New Brunswick, NJ, from the 2008-2010 New Jersey Childhood Obesity Study. These findings are included in this report as they may be relevant to the hospitals’ community health needs assessment. The study was funded by the Robert Wood Johnson Foundation and conducted by the Rutgers Center for State Health Policy (CSHP) in five New Jersey cities (Camden, Newark, New Brunswick, Trenton, and Vineland). The goal of the study was to provide information to the cities to help them design, implement, and evaluate interventions that target childhood obesity and its prevention. A study has recently been funded by the NIH in which the same families will be followed for four years after the original telephone survey in order to evaluate the impact of changes in the physical activity and food environment (whether intended or not) on change in children’s weight status and associated behaviors. Links to all reports for New Brunswick and other related study publications are provided at the end of this appendix. For more information about the study, please contact the principal investigator, Michael Yedidia, PhD, at [email protected].
Methods There were four parts to the study:
1. Telephone Survey. A comprehensive, random-digit-dial telephone survey of families with children ages 3-18 conducted in 2008-2009. The adult who makes most decisions about food shopping for the family answered detailed questions on obesity-related measures for him/herself and a randomly selected child. This person was the parent of the child in 94% of the cases. All measures were analyzed by age, gender, and race-ethnicity for each city.
2. Public School BMI Data. Height and weight measurements collected from public schools during the 2008-2009 school year, converted to BMI scores, and analyzed by age, gender, and race-ethnicity for each city.

191 A Community Health Needs Assessment
3. Food Environment Maps. Creation of geo-coded food environment maps from commercial food outlet data, which were then converted into food outlet density maps for each city, classified by type of food outlet (healthy food outlet, fast food restaurant, etc.), and presented at the census block level using Census data by percent of households below the poverty level, race-ethnicity, percent of households with children, and schools by grade level.
4. Physical Activity Maps. Creation of geo-coded physical activity environment maps from commercial and city data, which were then converted into density maps for each city, classified by type of physical activity outlet (private and public facilities for children ages 3-18, parks), and presented at the census block level using Census data by poverty level, race-ethnicity, percent of households with children, and crime.
Findings Unless otherwise noted, all findings reported below are for New Brunswick only. Reports for the other four cities can be found on the main CSHP obesity study page linked at the end of this appendix.
Telephone Survey The findings presented here are based on data collected from telephone surveys of 208 families in New Brunswick. Four areas related to childhood obesity were analyzed: food behaviors, food shopping environment, physical activity, and physical activity environment. Cross-tabulations were conducted for each measure by gender and by race-ethnicity (Hispanic and black non-Hispanic children only). Due to sample size limitations, separate estimates for age groups and for non-Hispanic white children and children of “other race” were not provided. The overall response rate was 49%. Food Behaviors Data were collected on how often the child consumed specific types of foods.
• Healthy People 2010 guidelines (US Dept of Health & Human Services) recommend that children eat vegetables three times a day. Only 12% of New Brunswick children meet this recommendation. About a quarter of children do not eat one vegetable a day.
• Healthy People 2010 guidelines recommend that children eat fruit or 100% juice two times a day. Just over half of New Brunswick children meet this recommendation.
• Black non-Hispanic children in New Brunswick are most likely to drink two or more sugar-sweetened beverages a day or eat sweet or salty snacks daily.

192 Rutgers Center for State Health Policy/RWJMS Family Medicine & Community Health, Dec 2012
• Girls are more likely to snack on sweets, while boys are more likely to consume sugar-sweetened beverages.
• About half the children do not snack on fruits and vegetables regularly. Boys and Hispanic children are even less likely to snack on fruits and vegetables.
• Despite these findings, 90% of New Brunswick parents think their children “eat healthy”. Food Shopping Environment Parents were asked to describe features of the store where they do most of the food shopping for their families.
• Overall, the majority of New Brunswick families shop at supermarkets for most of their food shopping. However, about a fourth of Hispanic parents do most of their food shopping at corner stores or bodegas.
• About 40% of parents shop outside of their neighborhood for food, mainly due to cost, quality, or the lack of food stores in their neighborhoods.
• Nearly a fourth of Hispanic parents said there is not a food store in their neighborhood (defined as the area within a 20 minute walk, a 5 minute drive, or about 1 mile in all directions around the respondent’s home).
• About half of the parents said their main food store had a limited selection of fruits, vegetables, and low-fat foods. About half also cite cost as a barrier to purchasing these items.
• More than a fourth of the parents report that they sometimes or often do not have enough food to eat (termed ‘food insecure”). Hispanic households with children are even more likely to be food insecure (39%).
Physical Activity Parents reported how often the child was physically active and how much time the child spent on the computer and watching television or playing video games.
• The 2008 Physical Activity Guidelines for Americans (US Dept of Health & Human Services) recommend children should be physically active at least 60 minutes every day. Only 19% of New Brunswick children meet this recommendation, and Hispanic children are even less likely to meet it.
• However, 90% of parents think that their children get enough physical activity. • Black non-Hispanic children are less likely to walk, bike, etc., to school, but Hispanic
children are less likely to get physical activity at school. • The American Academy of Pediatrics recommends that children spend no more than
two hours per day on television, computers, and video games (defined as “screen time”). Overall, 18% of the children spend more than two hours per day during
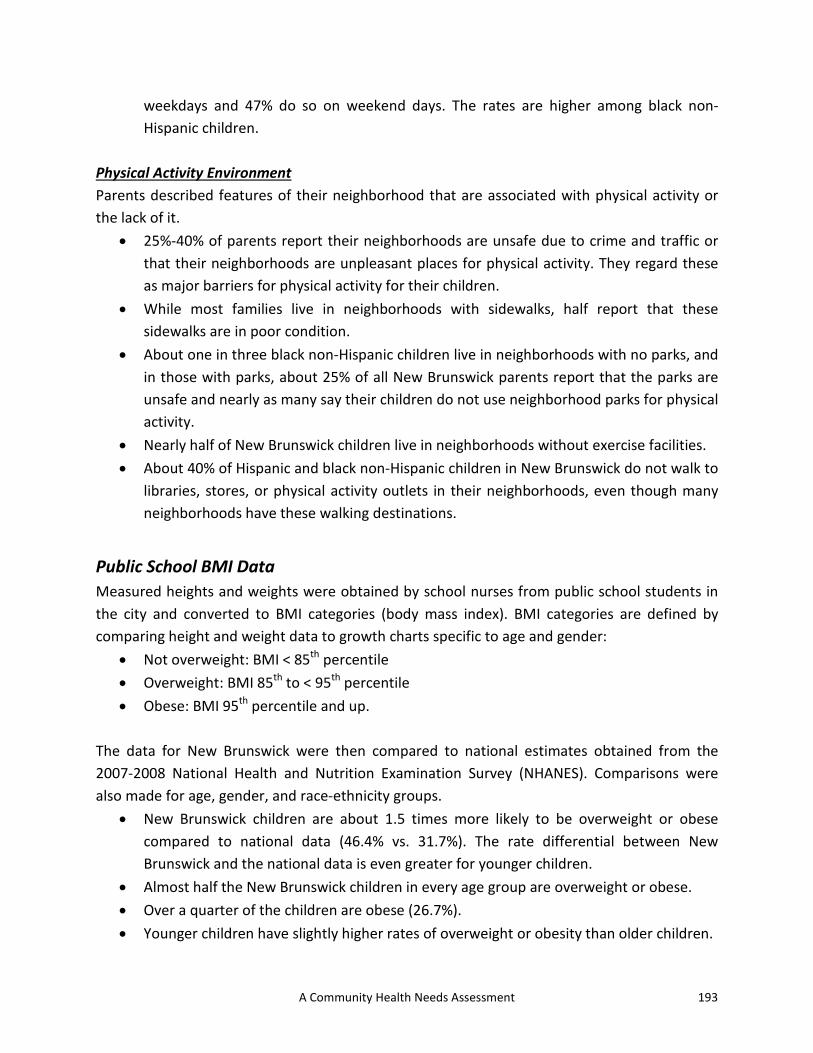
193 A Community Health Needs Assessment
weekdays and 47% do so on weekend days. The rates are higher among black non-Hispanic children.
Physical Activity Environment Parents described features of their neighborhood that are associated with physical activity or the lack of it.
• 25%-40% of parents report their neighborhoods are unsafe due to crime and traffic or that their neighborhoods are unpleasant places for physical activity. They regard these as major barriers for physical activity for their children.
• While most families live in neighborhoods with sidewalks, half report that these sidewalks are in poor condition.
• About one in three black non-Hispanic children live in neighborhoods with no parks, and in those with parks, about 25% of all New Brunswick parents report that the parks are unsafe and nearly as many say their children do not use neighborhood parks for physical activity.
• Nearly half of New Brunswick children live in neighborhoods without exercise facilities. • About 40% of Hispanic and black non-Hispanic children in New Brunswick do not walk to
libraries, stores, or physical activity outlets in their neighborhoods, even though many neighborhoods have these walking destinations.
Public School BMI Data Measured heights and weights were obtained by school nurses from public school students in the city and converted to BMI categories (body mass index). BMI categories are defined by comparing height and weight data to growth charts specific to age and gender:
• Not overweight: BMI < 85th percentile • Overweight: BMI 85th to < 95th percentile • Obese: BMI 95th percentile and up.
The data for New Brunswick were then compared to national estimates obtained from the 2007-2008 National Health and Nutrition Examination Survey (NHANES). Comparisons were also made for age, gender, and race-ethnicity groups.
• New Brunswick children are about 1.5 times more likely to be overweight or obese compared to national data (46.4% vs. 31.7%). The rate differential between New Brunswick and the national data is even greater for younger children.
• Almost half the New Brunswick children in every age group are overweight or obese. • Over a quarter of the children are obese (26.7%). • Younger children have slightly higher rates of overweight or obesity than older children.

194 Rutgers Center for State Health Policy/RWJMS Family Medicine & Community Health, Dec 2012
• Hispanic and black non-Hispanic children have higher rates of overweight or obesity than white non-Hispanic children.
• Overall, more boys than girls are overweight or obese across all age groups. However, when looking at racial-ethnic groups by age and gender, this only holds for Hispanic and white non-Hispanic children. For older black non-Hispanic children, girls are slightly more likely to be overweight or obese.
• Despite the high prevalence of overweight and obese children, over 80% of parents of children ages 3-18 in New Brunswick think that their children are not overweight (from the telephone survey).
Maps: Food Environment and Physical Activity These maps are basically descriptive tools that enable the viewer to locate pockets of “food deserts” (low availability of affordable healthy food outlets), high density areas for convenience stores and fast-food restaurants, low density areas for physical activity, high crime rates, and high poverty rates. They also enable the viewer to see the proximity of food and physical activity outlets to schools and neighborhoods with more children, and among different racial-ethnic groups.
• In New Brunswick, high density areas for convenience stores and fast-food restaurants are located in close proximity to schools, particularly elementary and middle schools.
• The majority of schools are near the downtown part of the city, which contains few physical activity centers and parks.
The geo-coded data used to generate these maps was converted into distance measures from the residences of the telephone survey respondents. Analyses of these data are underway, but a few preliminary results are included below. There was insufficient power to examine each of the cities separately, so data for four of the cities was combined (Vineland was excluded as its architectural and demographic landscape differs substantially from the other four cities).
• Children who live within a ¼ mile radius of a convenience store are almost twice as likely to be overweight or obese.
• Children who live within a ½ mile radius of a large park are about half as likely to be overweight or obese.
• Proximities to supermarkets, small grocery stores, smaller physical activity outlets, or fast-food restaurants were not significantly related to children’s weight status.
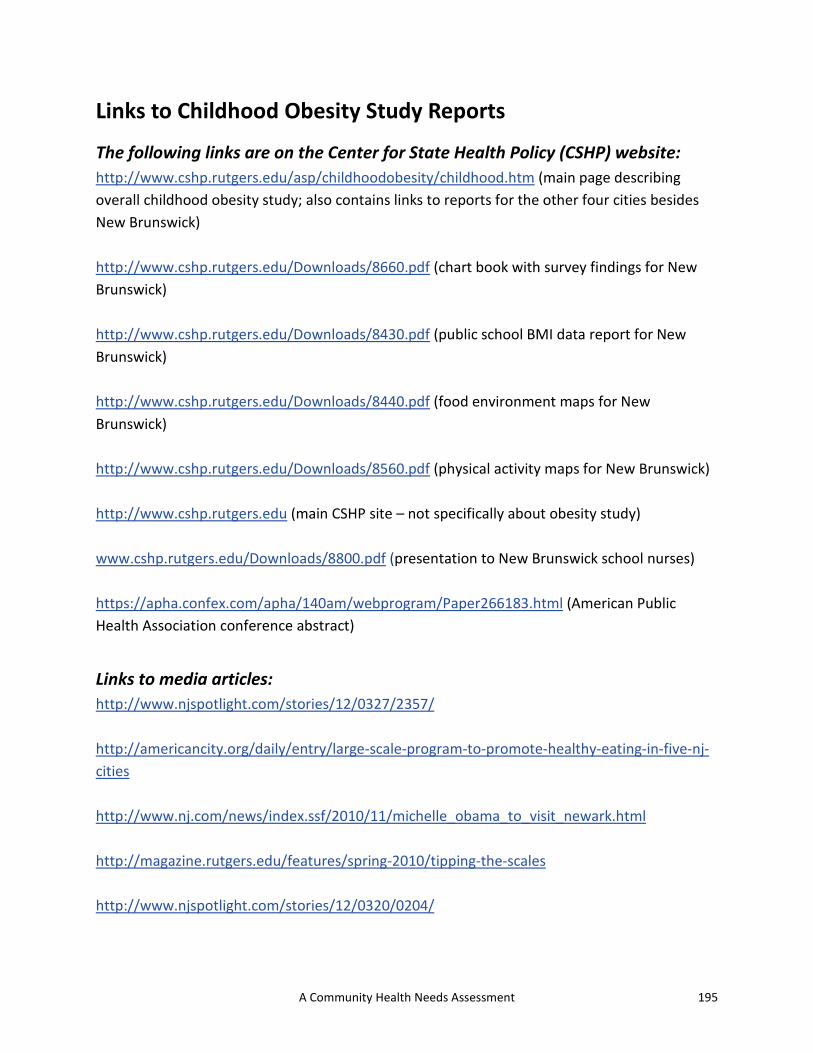
195 A Community Health Needs Assessment
Links to Childhood Obesity Study Reports
The following links are on the Center for State Health Policy (CSHP) website: http://www.cshp.rutgers.edu/asp/childhoodobesity/childhood.htm (main page describing overall childhood obesity study; also contains links to reports for the other four cities besides New Brunswick) http://www.cshp.rutgers.edu/Downloads/8660.pdf (chart book with survey findings for New Brunswick) http://www.cshp.rutgers.edu/Downloads/8430.pdf (public school BMI data report for New Brunswick) http://www.cshp.rutgers.edu/Downloads/8440.pdf (food environment maps for New Brunswick) http://www.cshp.rutgers.edu/Downloads/8560.pdf (physical activity maps for New Brunswick) http://www.cshp.rutgers.edu (main CSHP site – not specifically about obesity study) www.cshp.rutgers.edu/Downloads/8800.pdf (presentation to New Brunswick school nurses) https://apha.confex.com/apha/140am/webprogram/Paper266183.html (American Public Health Association conference abstract)
Links to media articles: http://www.njspotlight.com/stories/12/0327/2357/ http://americancity.org/daily/entry/large-scale-program-to-promote-healthy-eating-in-five-nj-cities http://www.nj.com/news/index.ssf/2010/11/michelle_obama_to_visit_newark.html http://magazine.rutgers.edu/features/spring-2010/tipping-the-scales http://www.njspotlight.com/stories/12/0320/0204/

196 Rutgers Center for State Health Policy/RWJMS Family Medicine & Community Health, Dec 2012
http://www.prnewswire.com/news-releases/mayor-cory-a-booker-and-lets-move-newark-announce-innovative-program-with-nestle-and-newark-now-139112064.html http://www.pressofatlanticcity.com/news/breaking/vineland-trying-to-improve-children-s-health-as-percent-are/article_efc1b082-81ca-11e1-b6a7-0019bb2963f4.html?cid=xrs_rss-nd http://www.nj.com/mercer/index.ssf/2011/11/childhood_obesity_is_a_call_to.html


Dept. of Family Medicine and Community Health, Research Division UMDNJ - Robert Wood Johnson Medical School 1 Worlds Fair Drive, Suite 1500 Somerset, NJ 08873
p. 732-743-3222 http://rwjms.umdnj.edu/departments_institutes/family_medicine/ divisions/research/index.html
Center for State Health Policy Rutgers, The State University of New Jersey 112 Paterson Street, 5th Floor New Brunswick, NJ 08901
p. 848-932-3105 f. 732-932-0069 [email protected] www.cshp.rutgers.edu