Embed Size (px)
DESCRIPTION
การวิเคราะห์สมการโครงสร้าง ( SEM) ด้วยโปรแกรม SPSS AMOS เบื้องต้น. สำนักวิจัย สถาบันบัณฑิตพัฒนบริหารศาสตร์. ทบทวนเกี่ยวกับสถิติ Regression และ Factor analysis. 1. แนะนำโปรแกรม AMOS. 2. การวิเคราะห์ข้อมูลด้วยโปรแกรม AMOS. 3. แบบฝึกหัด. 4. หัวข้อ. - PowerPoint PPT Presentation
Citation preview

การวิ�เคราะห์สมการโครงสร�าง (SEM) ด้�วิยโปรแกรม SPSS AMOS เบื้��องต้�น
ส�าน�กวิ�จั�ย สถาบื้�นบื้�ณฑิ�ต้พั�ฒนบื้ร�ห์ารศาสต้ร

ห์�วิข้�อ
ทบทวนเกี่��ยวกี่บสถิ ติ Regression และ Factor analysis1
แนะน��โปรแกี่รม AMOS2
กี่�รว เคร�ะห์�ข้�อม�ลด้�วยโปรแกี่รม AMOS3
แบบฝึ"กี่ห์ด้4
2

ทบื้ทวินเก&'ยวิก�บื้สถ�ต้� Regression และ Factor analysis
Multiple Linear Regression
จ�กี่ข้�อม�ล Diaper-English.sav ท��กี่�รว เคร�ะห์� ด้�วยว ธี�ด้งน�&
EnterStepwiseBackward
3

ทบื้ทวินเก&'ยวิก�บื้สถ�ต้� Regression และ Factor analysis
Multiple Linear Regression (Enter)
4
Variables Entered/Removeda
Model Variables Entered Variables Removed Method
1
tape, Value, style,
absorb, Size,
Comfort, price,
unisex, leakageb
. Enter
Model Summary
Model R R Square Adjusted R Square Std. Error of the
Estimate
1 .870a .756 .749 .983
ANOVAa
Model Sum of Squares df Mean Square F Sig.
1
Regression 857.721 9 95.302 98.661 .000b
Residual 276.265 286 .966
Total 1133.986 295

ทบื้ทวินเก&'ยวิก�บื้สถ�ต้� Regression และ Factor analysis
Multiple Linear Regression (Enter)
5
Coefficientsa
Model Unstandardized Coefficients Standardized
Coefficients
t Sig. Collinearity Statistics
B Std. Error Beta Tolerance VIF
1
(Constant) -3.590 .307 -11.694 .000
Size .524 .113 .280 4.644 .000 .234 4.274
price .124 .122 .063 1.009 .314 .216 4.626
Value -.027 .074 -.016 -.369 .712 .442 2.263
unisex .430 .089 .329 4.819 .000 .183 5.469
style -.014 .097 -.010 -.148 .882 .197 5.086
absorb .370 .149 .221 2.479 .014 .107 9.372
leakage .271 .157 .159 1.731 .085 .100 9.966
Comfort .074 .081 .045 .910 .363 .345 2.899
tape .031 .066 .018 .467 .641 .547 1.828

ทบื้ทวินเก&'ยวิก�บื้สถ�ต้� Regression และ Factor analysis
Multiple Linear Regression (Stepwise)
6
Variables Entered/Removeda
Model Variables Entered Variables Removed Method
1 absorb .
Stepwise (Criteria:
Probability-of-F-to-
enter <= .050,
Probability-of-F-to-
remove >= .100).
2 unisex .
Stepwise (Criteria:
Probability-of-F-to-
enter <= .050,
Probability-of-F-to-
remove >= .100).
3 Size .
Stepwise (Criteria:
Probability-of-F-to-
enter <= .050,
Probability-of-F-to-
remove >= .100).
4 leakage .
Stepwise (Criteria:
Probability-of-F-to-
enter <= .050,
Probability-of-F-to-
remove >= .100).
Model Summary
Model R R Square Adjusted R Square Std. Error of the
Estimate
1 .723a .522 .521 1.358
2 .824b .679 .676 1.115
3 .866c .750 .747 .986
4 .868d .754 .751 .979

ทบื้ทวินเก&'ยวิก�บื้สถ�ต้� Regression และ Factor analysis
Multiple Linear Regression (Stepwise)
7
ANOVAa
Model Sum of Squares df Mean Square F Sig.
1
Regression 592.152 1 592.152 321.303 .000b
Residual 541.834 294 1.843
Total 1133.986 295
2
Regression 769.545 2 384.773 309.346 .000c
Residual 364.441 293 1.244
Total 1133.986 295
3
Regression 850.232 3 283.411 291.646 .000d
Residual 283.755 292 .972
Total 1133.986 295
4
Regression 855.051 4 213.763 223.008 .000e
Residual 278.936 291 .959
Total 1133.986 295

ทบื้ทวินเก&'ยวิก�บื้สถ�ต้� Regression และ Factor analysis
Multiple Linear Regression (Stepwise)
8
Coefficientsa
Model Unstandardized Coefficients Standardized
Coefficients
t Sig. Collinearity Statistics
B Std. Error Beta Tolerance VIF
1(Constant) -.748 .276 -2.711 .007
absorb 1.209 .067 .723 17.925 .000 1.000 1.000
2
(Constant) -1.713 .241 -7.116 .000
absorb .825 .064 .493 12.892 .000 .749 1.336
unisex .597 .050 .457 11.942 .000 .749 1.336
3
(Constant) -3.387 .281 -12.048 .000
absorb .684 .059 .409 11.656 .000 .696 1.436
unisex .437 .048 .334 9.174 .000 .646 1.548
Size .603 .066 .322 9.112 .000 .685 1.459
4
(Constant) -3.484 .283 -12.332 .000
absorb .380 .147 .227 2.580 .010 .109 9.190
unisex .424 .048 .325 8.909 .000 .637 1.570
Size .614 .066 .328 9.311 .000 .682 1.467
leakage .332 .148 .195 2.242 .026 .112 8.964
ทบื้ทวินเก&'ยวิก�บื้สถ�ต้� Regression และ Factor analysis
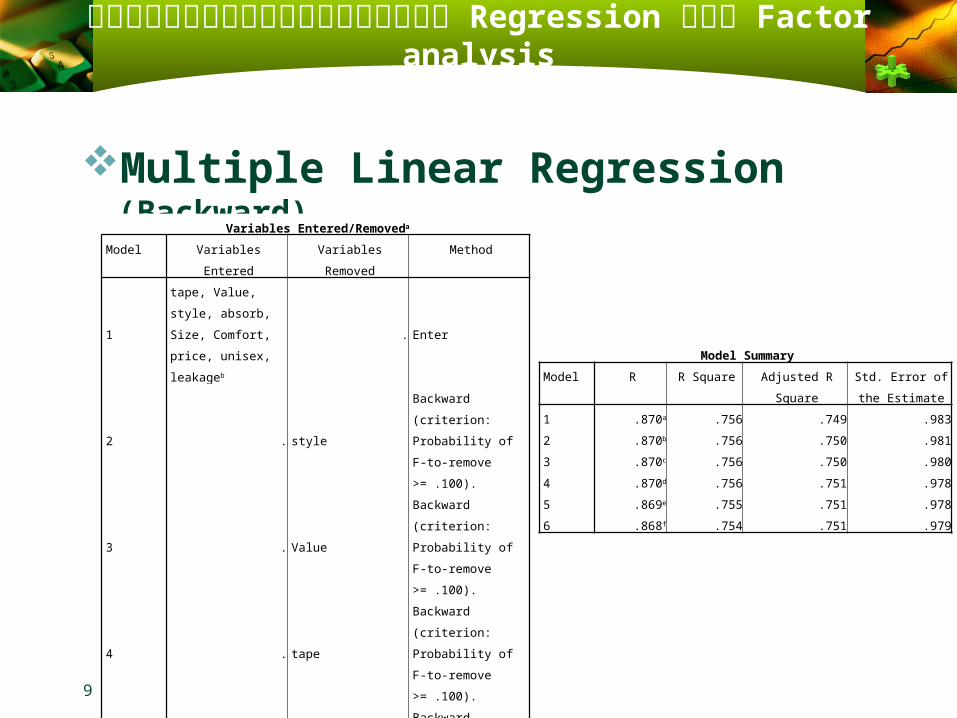
Multiple Linear Regression (Backward)
9
Variables Entered/Removeda
Model Variables Entered Variables Removed Method
1
tape, Value, style,
absorb, Size,
Comfort, price,
unisex, leakageb
. Enter
2 . style
Backward (criterion:
Probability of F-to-
remove >= .100).
3 . Value
Backward (criterion:
Probability of F-to-
remove >= .100).
4 . tape
Backward (criterion:
Probability of F-to-
remove >= .100).
5 . price
Backward (criterion:
Probability of F-to-
remove >= .100).
6 . Comfort
Backward (criterion:
Probability of F-to-
remove >= .100).
Model Summary
Model R R Square Adjusted R
Square
Std. Error of the
Estimate
1 .870a .756 .749 .983
2 .870b .756 .750 .981
3 .870c .756 .750 .980
4 .870d .756 .751 .978
5 .869e .755 .751 .978
6 .868f .754 .751 .979

ทบื้ทวินเก&'ยวิก�บื้สถ�ต้� Regression และ Factor analysis
Multiple Linear Regression (Backward)
10
ANOVAa
Model Sum of Squares df Mean Square F Sig.
1
Regression 857.721 9 95.302 98.661 .000b
Residual 276.265 286 .966
Total 1133.986 295
2
Regression 857.700 8 107.213 111.370 .000c
Residual 276.286 287 .963
Total 1133.986 295
3
Regression 857.570 7 122.510 127.644 .000d
Residual 276.416 288 .960
Total 1133.986 295
4
Regression 857.343 6 142.890 149.272 .000e
Residual 276.644 289 .957
Total 1133.986 295
5
Regression 856.434 5 171.287 178.968 .000f
Residual 277.553 290 .957
Total 1133.986 295
6
Regression 855.051 4 213.763 223.008 .000g
Residual 278.936 291 .959
Total 1133.986 295
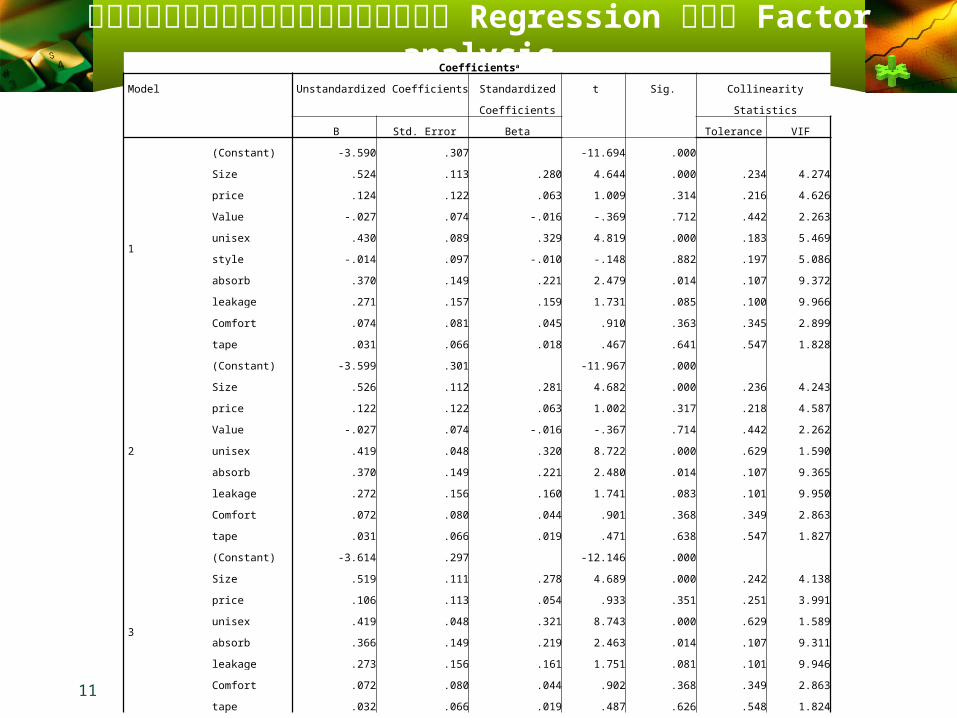
ทบื้ทวินเก&'ยวิก�บื้สถ�ต้� Regression และ Factor analysis
11
Coefficientsa
Model Unstandardized Coefficients Standardized
Coefficients
t Sig. Collinearity Statistics
B Std. Error Beta Tolerance VIF
1
(Constant) -3.590 .307 -11.694 .000
Size .524 .113 .280 4.644 .000 .234 4.274
price .124 .122 .063 1.009 .314 .216 4.626
Value -.027 .074 -.016 -.369 .712 .442 2.263
unisex .430 .089 .329 4.819 .000 .183 5.469
style -.014 .097 -.010 -.148 .882 .197 5.086
absorb .370 .149 .221 2.479 .014 .107 9.372
leakage .271 .157 .159 1.731 .085 .100 9.966
Comfort .074 .081 .045 .910 .363 .345 2.899
tape .031 .066 .018 .467 .641 .547 1.828
2
(Constant) -3.599 .301 -11.967 .000
Size .526 .112 .281 4.682 .000 .236 4.243
price .122 .122 .063 1.002 .317 .218 4.587
Value -.027 .074 -.016 -.367 .714 .442 2.262
unisex .419 .048 .320 8.722 .000 .629 1.590
absorb .370 .149 .221 2.480 .014 .107 9.365
leakage .272 .156 .160 1.741 .083 .101 9.950
Comfort .072 .080 .044 .901 .368 .349 2.863
tape .031 .066 .019 .471 .638 .547 1.827
3
(Constant) -3.614 .297 -12.146 .000
Size .519 .111 .278 4.689 .000 .242 4.138
price .106 .113 .054 .933 .351 .251 3.991
unisex .419 .048 .321 8.743 .000 .629 1.589
absorb .366 .149 .219 2.463 .014 .107 9.311
leakage .273 .156 .161 1.751 .081 .101 9.946
Comfort .072 .080 .044 .902 .368 .349 2.863
tape .032 .066 .019 .487 .626 .548 1.824
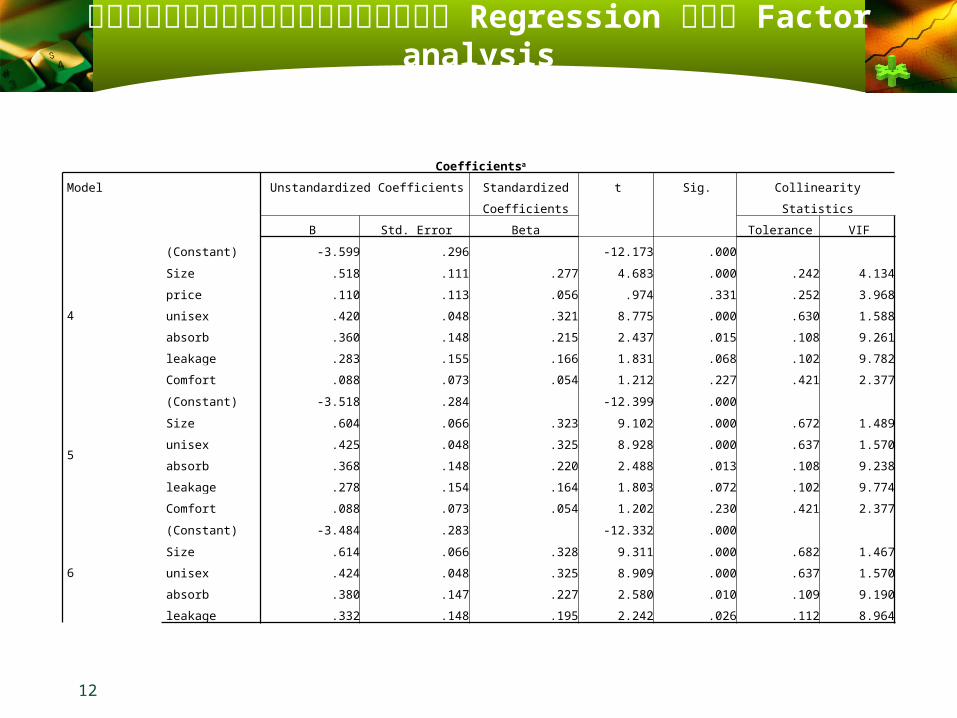
ทบื้ทวินเก&'ยวิก�บื้สถ�ต้� Regression และ Factor analysis
12
Coefficientsa
Model Unstandardized Coefficients Standardized
Coefficients
t Sig. Collinearity Statistics
B Std. Error Beta Tolerance VIF
4
(Constant) -3.599 .296 -12.173 .000
Size .518 .111 .277 4.683 .000 .242 4.134
price .110 .113 .056 .974 .331 .252 3.968
unisex .420 .048 .321 8.775 .000 .630 1.588
absorb .360 .148 .215 2.437 .015 .108 9.261
leakage .283 .155 .166 1.831 .068 .102 9.782
Comfort .088 .073 .054 1.212 .227 .421 2.377
5
(Constant) -3.518 .284 -12.399 .000
Size .604 .066 .323 9.102 .000 .672 1.489
unisex .425 .048 .325 8.928 .000 .637 1.570
absorb .368 .148 .220 2.488 .013 .108 9.238
leakage .278 .154 .164 1.803 .072 .102 9.774
Comfort .088 .073 .054 1.202 .230 .421 2.377
6
(Constant) -3.484 .283 -12.332 .000
Size .614 .066 .328 9.311 .000 .682 1.467
unisex .424 .048 .325 8.909 .000 .637 1.570
absorb .380 .147 .227 2.580 .010 .109 9.190
leakage .332 .148 .195 2.242 .026 .112 8.964

ทบื้ทวินเก&'ยวิก�บื้สถ�ต้� Regression และ Factor analysis
Factor analysis Exploratory Factor Analysis : EFA(กี่�รศึ(กี่ษ�คว�มสมพันธี�เพั+�อท��จะสร��งติวแปรโด้ยท��เร�ไม-ทร�บม�กี่-อน)
- Principal Component Analysis (กี่�รว เคร�ะห์�องค�ประกี่อบห์ลกี่)
- กี่�รห์ม.นแกี่นด้�วยว ธี� Varimax (องค�ประกี่อบท��ได้�ม�คว�มแติกี่ติ-�งกี่นท��ส.ด้)
Confirmative Factor Analysis : CFA- Confirm hypothesis relationship structure.
13

ทบื้ทวินเก&'ยวิก�บื้สถ�ต้� Regression และ Factor analysis
Exploratory Factor Analysis : EFA
14
Component 1 / Factor 1
Component 2
Varible1
Varible2
Varible3
Varible4
Varible5
Varible6
Varible7
ทบื้ทวินเก&'ยวิก�บื้สถ�ต้� Regression และ Factor analysis
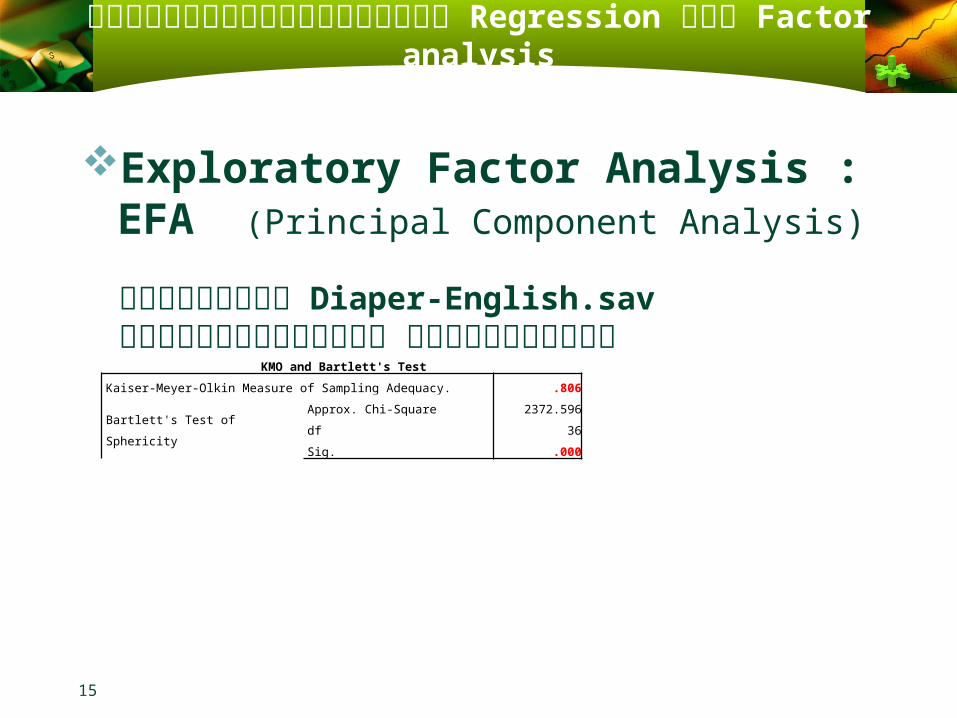
Exploratory Factor Analysis : EFA (Principal Component Analysis)
15
KMO and Bartlett's Test
Kaiser-Meyer-Olkin Measure of Sampling Adequacy. .806
Bartlett's Test of Sphericity
Approx. Chi-Square 2372.596
df 36
Sig. .000
จัากข้�อม)ล Diaper-English.sav ท�าการวิ�เคาะห์ ได้�ผลด้�งน&�
ทบื้ทวินเก&'ยวิก�บื้สถ�ต้� Regression และ Factor analysis
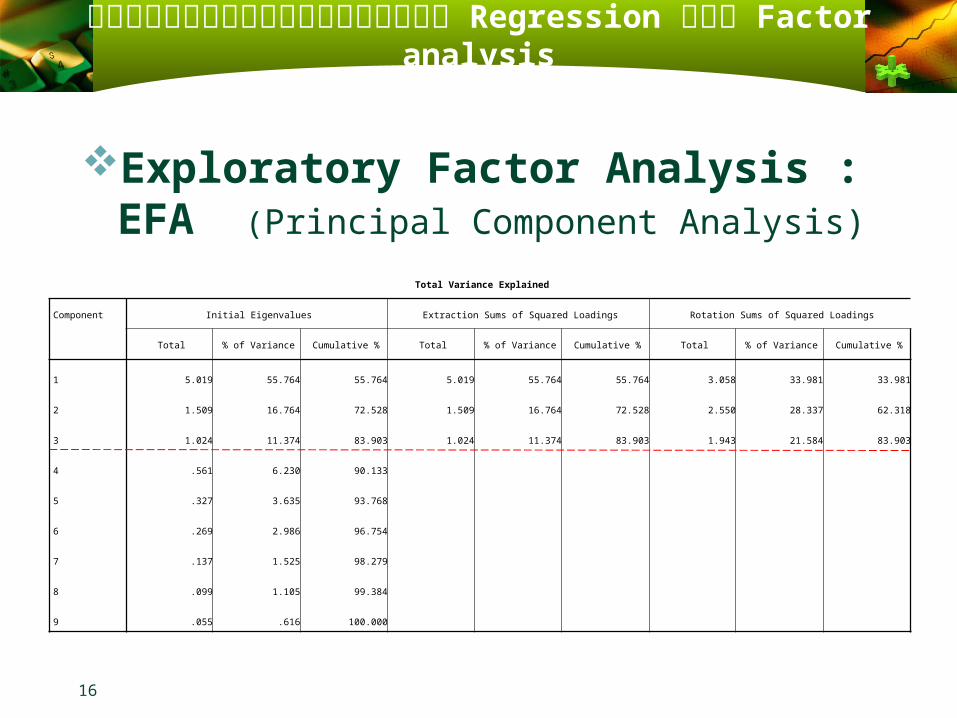
Exploratory Factor Analysis : EFA (Principal Component Analysis)
16
Total Variance Explained
Component Initial Eigenvalues Extraction Sums of Squared Loadings Rotation Sums of Squared Loadings
Total % of Variance Cumulative % Total % of Variance Cumulative % Total % of Variance Cumulative %
1 5.019 55.764 55.764 5.019 55.764 55.764 3.058 33.981 33.981
2 1.509 16.764 72.528 1.509 16.764 72.528 2.550 28.337 62.318
3 1.024 11.374 83.903 1.024 11.374 83.903 1.943 21.584 83.903
4 .561 6.230 90.133
5 .327 3.635 93.768
6 .269 2.986 96.754
7 .137 1.525 98.279
8 .099 1.105 99.384
9 .055 .616 100.000

ทบื้ทวินเก&'ยวิก�บื้สถ�ต้� Regression และ Factor analysis
Exploratory Factor Analysis : EFA (Principal Component Analysis)
17
Component Matrixa
Component
1 2 3
ข้น�ด้ข้องกี่ล-อง .761 .485 .217
ร�ค� .751 .524 .227
คว�มค.�มค-� .669 .487 .316
สองเพัศึ .752 .148 -.596
ร�ปแบบ/ส�สน .726 .126 -.633
กี่�รซึ(มซึบ .828 -.383 .085
กี่�รร�ว .820 -.439 .070
คว�มสบ�ย .757 -.454 .158
เทป .636 -.423 .179
Rotated Component Matrixa
Component
1 2 3
ข้น�ด้ข้องกี่ล-อง .226 .865 .247
ร�ค� .194 .891 .239
คว�มค.�มค-� .187 .858 .118
สองเพัศึ .253 .272 .897
ร�ปแบบ/ส�สน .242 .226 .913
กี่�รซึ(มซึบ .845 .239 .264
กี่�รร�ว .874 .189 .265
คว�มสบ�ย .864 .181 .157
เทป .767 .143 .085
ทบื้ทวินเก&'ยวิก�บื้สถ�ต้� Regression และ Factor analysis
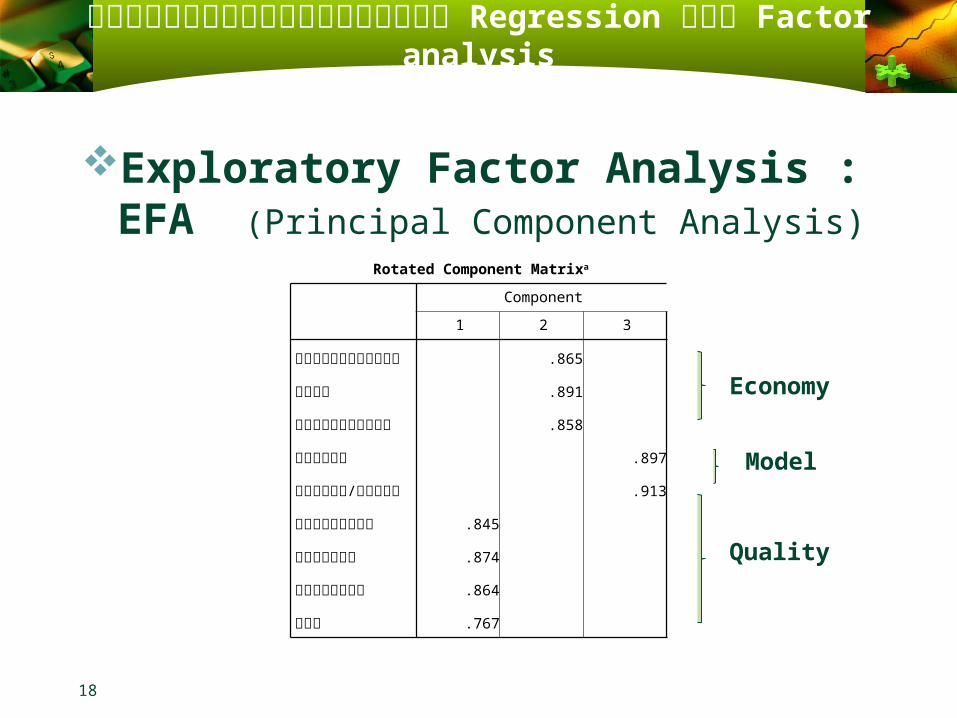
Exploratory Factor Analysis : EFA (Principal Component Analysis)
18
Rotated Component Matrixa
Component
1 2 3
ข้น�ด้ข้องกี่ล-อง .865 ร�ค� .891 คว�มค.�มค-� .858 สองเพัศึ .897
ร�ปแบบ/ส�สน .913
กี่�รซึ(มซึบ .845 กี่�รร �ว .874 คว�มสบ�ย .864 เทป .767
Economy
Model
Quality

แนะน�าโปรแกรม AMOS
19
แนะน�าโปรแกรม AMOS
20
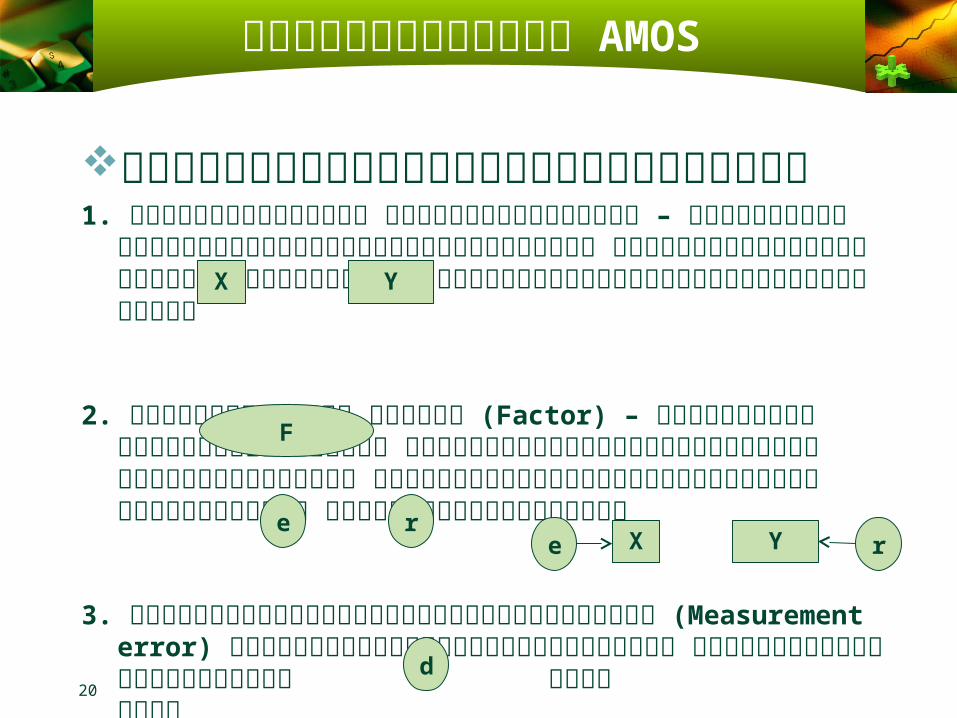
ประเภทและส�ญล�กษณข้องต้�วิแปร1. ต้�วิแปรส�งเกต้ได้� ห์ร�อต้�วิแปรบื้/งชี้&� – เป1นข้�อม)ลท&'ผ)�วิ�จั�ยสามารถเก2บื้ได้�
โด้ยต้รง ส�ญล�กษณท&'แสด้งถ3งต้�วิแปรบื้/งชี้&� ค�อ ส&'เห์ล&'ยมผ�นผ�าห์ร�อจั�ต้4ร�สก2ได้�
2. ต้�วิแปรแฝง ห์ร�อ ป6จัจั�ย (Factor) – ในท&'น&�จัะเร&ยกวิ/าต้�วิแปรแฝง เป1นต้�วิแปรท&'ไม/สามารถเก2บื้ข้�อม)ลได้�โด้ยต้รง แต้/เป1นต้�วิแปรท&'สร�างข้3�นจัากต้�วิแปรบื้/งชี้&� ส/วินให์ญ/น�ยมใชี้�วิงร&
3. ต้�วิแปรแสด้งควิามคลาด้เคล�'อนในการวิ�ด้ (Measurement error) ข้องต้�วิแปรบื้/งชี้&�ห์ร�อส�งเกต้ได้� ส/วินให์ญ/น�ยมใชี้�ร)ปวิงกลม ห์ร�อ เชี้/น
4. ต้�วิแปรแสด้งค/าคลาด้เคล�'อน (Distturbance) ข้องต้�วิแปรแฝงห์ร�อป6จัจั�ย ใชี้�ส�ญล�กษณวิงร& ห์ร�อวิงกลม ส/วินให์ญ/น�ยมใชี้�วิงกลม
d
X Y
F
e rXe Y r

การวิ�เคราะห์ข้�อม)ลด้�วิยโปรแกรม AMOS
21
ประเภทข้องโมเด้ลสมการโครงสร�าง
โด้ยท�'วิไปจัะสามารถแบื้/งโมเด้ลสมการโครงสร�างออกได้�เป1น 4 ประเภท ด้�งน&�
1. การวิ�เคราะห์เส�นทาง (Path Analysis)*2. การวิ�เคราะห์ป6จัจั�ยเชี้�งย�นย�น (Confirmatory Factor Analysis: CFA)*3. โมเด้ลโครงสร�าง (Structural Regression Model: SR)4. โมเด้ลโค�งการพั�ฒนา (Latent Growth Model: LGM)
ห์มายเห์ต้4: * ฝ8กอบื้รมในวิ�นน&� (ใน SEM ส/วินให์ญ/จัะเป1นการรวิม CFA และ SR)

22
การวิ�เคราะห์ป6จัจั�ยเชี้�งย�นย�น (Confirmatory Factor Analysis: CFA)
การวิ�เคราะห์ข้�อม)ลด้�วิยโปรแกรม AMOS

23
Output การวิ�เคราะห์ป6จัจั�ยเชี้�งย�นย�น (Confirmatory Factor Analysis: CFA)
การวิ�เคราะห์ข้�อม)ลด้�วิยโปรแกรม AMOS

24
Output การวิ�เคราะห์ป6จัจั�ยเชี้�งย�นย�น (Confirmatory Factor Analysis: CFA)
การวิ�เคราะห์ข้�อม)ลด้�วิยโปรแกรม AMOS
25
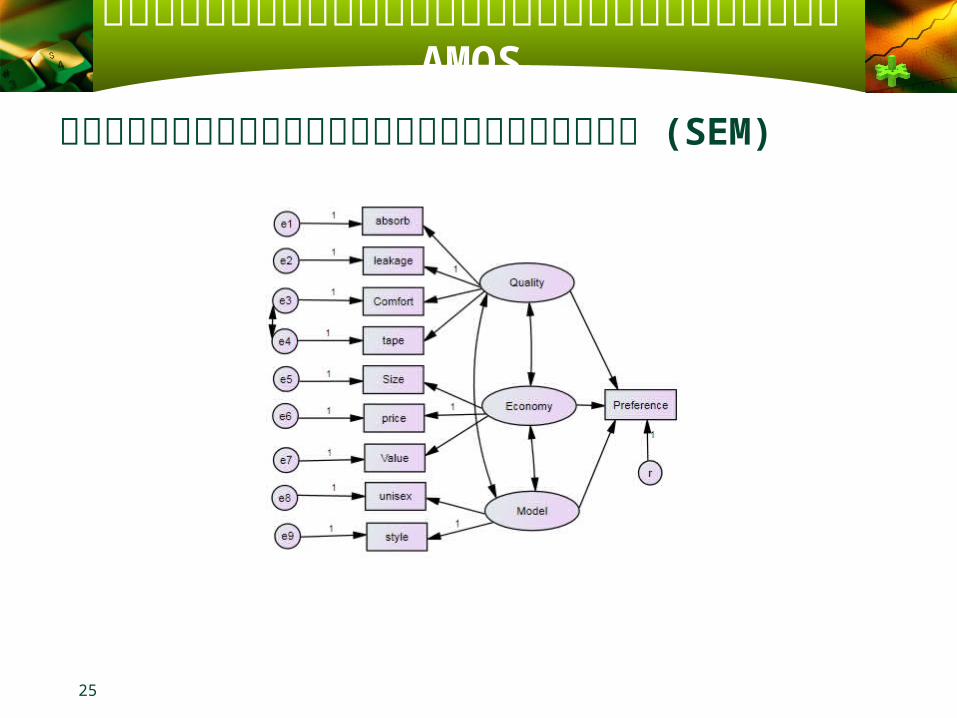
การวิ�เคราะห์สมการโครงสร�าง (SEM)
การวิ�เคราะห์ข้�อม)ลด้�วิยโปรแกรม AMOS
26
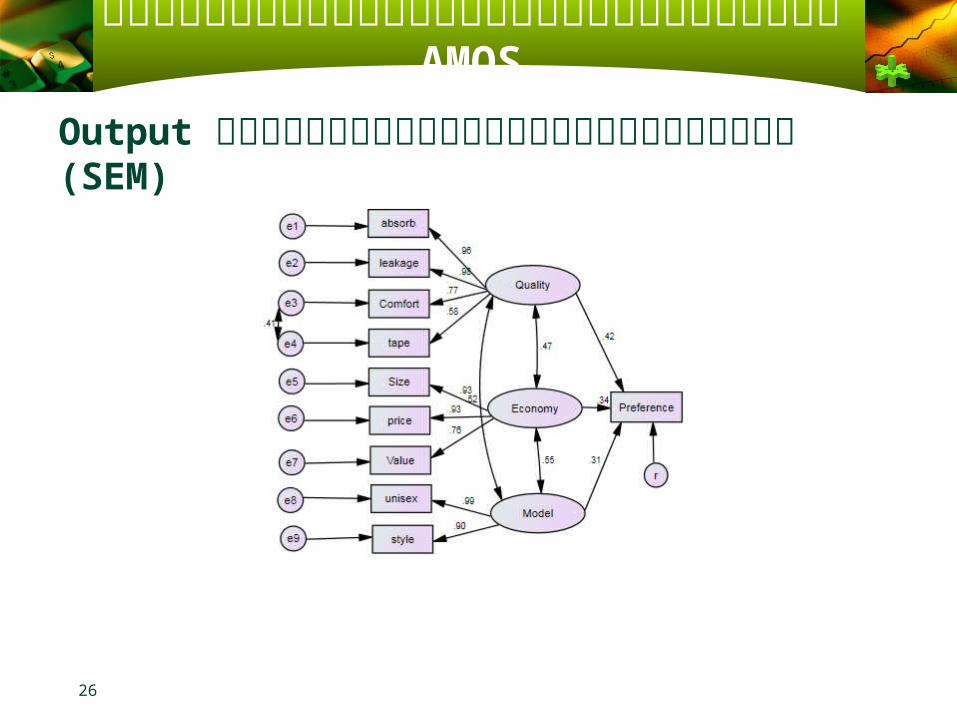
Output การวิ�เคราะห์สมการโครงสร�าง (SEM)
การวิ�เคราะห์ข้�อม)ลด้�วิยโปรแกรม AMOS

27
Output การวิ�เคราะห์สมการโครงสร�าง (SEM)
การวิ�เคราะห์ข้�อม)ลด้�วิยโปรแกรม AMOS

28
ต้�วิอย/าง การวิ�เคราะห์ป6จัจั�ยเชี้�งย�นย�นล�าด้�บื้ท&'สอง
การวิ�เคราะห์ข้�อม)ลด้�วิยโปรแกรม AMOS

29
แบื้บื้ฝ8กห์�ด้
ให์�ใชี้�ข้�อม)ล Daimler-SEM.sav ท�าการวิ�เคราะห์ป6จัจั�ยเชี้�งส�ารวิจั (EFA) และท�าการวิ�เคราะห์ป6จัจั�ยเชี้�งย�นย�น (CFA)