Embed Size (px)
Citation preview
ULSTER COUNTY 2020 Real Property Data Report
Ulster County Department of Finance Division of Real Property Tax Service
Tracey Williams, Director of Real Property http://ulstercountyny.gov/real-property
Report Data Based On 2020 Assessment Roll
and includes 2020-21 School Tax Rates and
2021 County, Town and Special District Tax Rates
Presented To: Patrick K. Ryan, County Executive
and the
Ulster County Legislature
and the NYS Department of Taxation and Finance
Office of Real Property Tax Services

DISCLAIMER
While every effort is made to ensure the accuracy of the data and information contained herein, Ulster County does not warrant that they are complete, comprehensive or accurate.
In no event shall Ulster County be liable for any incidental, indirect, consequential or special damages of any kind, or any damages whatsoever, including, without limitation, those resulting from loss of profit, loss of contracts, goodwill, data, information, income, expected savings or business relationships, whether or not advised of the possibility of such damage, arising out of or in connection with the use of this data.
Page 1
2020 Real Property Data Report Table of Contents
Page
Letter of Submittal ........................................................................................ 2 Introduction ................................................................................................... 3 Real Property Responsibilities and Services ............................................... 4 Property Transfer Reports ............................................................................ 6 Fee Schedule .............................................................................................. 7 Ulster County Assessors .............................................................................. 8 Assessment Calendar .................................................................................. 9 Reassessment Activity by Town ................................................................... 10 Equitable Assessment Administration .......................................................... 11 2021 Real Property Budget .......................................................................... 12 Largest Ulster County Taxpayers ................................................................. 14 2020 Residential Assessment Ratios and Equalization Rates ..................... 15 2020 New York State and New York City Owned Properties ....................... 16-17 Tax Rates Introduction ................................................................................ 18 City and Village Tax Rates .......................................................................... 19 2021 County Tax Rates ............................................................................... 20 2021 Town Tax Rates ................................................................................. 21 2021 Special District Tax Rates ................................................................... 22-31 School District Tax Rates ............................................................................. 32-33 Town Tax Bill Comparison ........................................................................... 34 Assessment Vs. Taxes: What's the Difference? .......................................... 35 Tax Apportionment ....................................................................................... 36-38 Combined and Effective Tax Rates .............................................................. 39-41 Exemption Reports ....................................................................................... 42-56

Page 2
ULSTER COUNTY DEPARTMENT OF FINANCE DIVISION OF REAL PROPERTY TAX SERVICE
PO Box 1800, 244 Fair Street, Kingston, New York 12402
Telephone (845) 340-3490 Fax (845) 340-3499
Burton Gulnick, Jr. Tracey Williams Commissioner of Finance Director of Real Property Tax Service Deputy Commissioner of Finance
February 10, 2021
Honorable Patrick K. Ryan, Ulster County Executive David B. Donaldson, Chairman, Ulster County Legislature Michael R. Schmidt, Commissioner New York State Department of Taxation and Finance Office of Real Property Tax Services
Pursuant to the Real Property Tax Law, Section 1532, Paragraph 2, Sub-Paragraph C, the Director of the Real Property Tax Services shall , "prepare and furnish an annual report to the legislat ive body of the county, a copy of which will be sent to the commissioner" of the New York State Department of Taxation and Finance, and pursuant to the departmental requirements as established by the Ulster County Charter. Accordingly, I hereby submit the Ulster County 2020 Real Property Data Report.
Respectfully,
Tracey Will iams
Director of Real Property Tax Service
"Our Professional Goal – To Create And Preserve Tax Equity Within And Between All Municipalities” Ulster County Website: www.ulstercountyny.gov

Page 3
Ulster County
2020 Real Property Data Report
Introduction The Ulster County Division of Real Property Tax Service is a
statutory agency that exists to provide services that assist local
government off icials to achieve and maintain equitable assessment
administration. We provide the resources and expertise to accomplish
this function.
The goal of equitable assessment administration is to provide a
sound, reliable, fair, and easily understood foundation for the
determination of the Real Property tax.
This report is prepared for use by county departments, local
governments and the general public. It is a compilation of data that is
used in determining and apportioning real property taxes, including
current county, town, special district and school tax rates and
assessment and exemption information.
Real Property Staff Tracey Will iams, Director of Real Property
Taryn Hilowitz, Real Property Tax Service Specialist
Heidi Clark, Real Property Tax Service Specialist
Wil liam Peetoom, Senior Tax Map Specialist
Mark Kluberdanz, Senior Tax Map Specialist
Other Department of Finance staff play a critical role in
Real Property functions throughout the year

Page 4
Responsibilities of and Services Provided by Ulster County Real Property Tax Service
On September 6, 2012, Ulster County Executive Mike Hein signed Local Law Number 10 of 2012 to reorganize the Real Property Tax Service Agency as an independent Division of Real Property Tax Service within the Department of Finance under the direction of a Deputy Commissioner of Finance/Director of Real Property Tax Service.
The Real Property office is open to the public from 9:00 A.M. to 5:00 P.M. Monday through Friday. Staff is available to assist the public with questions about tax mapping, property assessments and exemptions. We also provide the public with contact information for the NYS Office of Real Property Tax Services, and other agencies that may be able to assist.
The powers and duties of the Director of Real Property Tax Service are prescribed in NYS Real Property Tax Law (RPTL) Section 1532, which describes the services that shall be provided to all cities and towns within the county.
During 2020, the services provided pursuant to this statute included: • Processing a total of 5,296 RPS 5217 Real Property Transfer Reports for the
conveyance of properties throughout the county. • Maintaining tax maps to reflect changes to the configuration of parcels resulting from
filed subdivision maps, deeds of transfer with new survey descriptions and corrections. A total of 315 tax map revisions were processed in 2020 and provided to Assessors for their use in updating assessment data.
• Advising municipal assessors on procedures for the preparation and maintenance of assessment rolls and other records relating to real property assessment and taxation.
• Processing a total of 85 applications for correction of errors and tax refunds per RPTL Article 5.
• Providing administrative support, cooperation and assistance to Boards of Assessment Review, including the annual certification training for BAR members from Ulster County municipalities.
• Providing such other related services pertaining to the assessment and taxation of real property as may be authorized by the county.
• Assisting in the disposition and sale of real property acquired by the county as a result of tax sale.
• Preparing an annual report, as required by Real Property Tax Law 1532(2)(c) for submission to the Ulster County Executive, the Ulster County Legislature and the Commissioner of the New York State Department of Taxation and Finance.

Page 5
Responsibilities and Services (continued) Other related services authorized by the county include: • Maintenance of an electronic database of ownership records for all properties in the
county. • Preparation of the County, Town and Special District tax extension, resulting in the
computed tax rates used in the preparation of tax bills. • Preparation of Tax Warrant Abstracts utilized by municipal Tax Collectors. • Participation in special projects requested by the County Executive, county departments
and municipalities. • Provide for the centralized calculation of Payments in Lieu of Tax (PILOT) amounts. Special projects during 2020 included: • Research and evaluation of county owned properties to help determine upset prices. • Provided administrative assistance to the Towns. • Scanned 77 Building Schematic Sheets for the Department of the Environment on our
OCE Printer. • Researched railroad property for the City of Kingston Engineer on the Ulster &
Delaware Spur Line at the Kingston Maritime Center. • Worked with the Rondout Valley School District on Disability Income Limits.
Real Property Service Statistics • Ulster County total area: (according to U.S. Census Bureau)
Land - 1,124.2 square miles or 719,488 acres Water - 36.5 square miles or 23,360 acres Total - 1,160.7 square miles or 742,848 acres
• Total municipalities served: 20 Towns, 3 Villages and 1 City
• Total number of parcels on tax maps: 86,630
• Total tax map sheets: 828
• 2020 tax map revisions processed: 315
• 2020 survey & subdivision map certifications: 294
• Total 2020 real property parcel transfers: 5,685
• Total 2020 RPS 5217’s processed: 5,296
• Total 2020 applications for correction of errors & refunds: 85

Page 6
SWIS Towns / City 2015 2016 2017 2018 2019 2020510800 Kingston, City 568 625 670 689 623 579512000 Denning 40 30 30 49 37 32512200 Esopus 222 237 283 264 261 246512400 Gardiner 151 154 198 178 186 168512600 Hardenburgh 20 21 12 20 24 32512800 Hurley 203 228 210 239 206 225513000 Kingston, Town 31 29 38 35 30 31513200 Lloyd 242 271 310 310 326 281513400 Marbletown 209 211 263 228 214 196513600 Marlborough 197 259 273 336 290 273513800 New Paltz 264 271 258 284 263 282514000 Olive 159 167 194 200 191 172514200 Plattekill 202 214 245 221 236 196514400 Rochester 260 299 333 320 318 315514600 Rosendale 168 184 200 188 165 159514800 Saugerties 547 628 617 616 649 588515000 Shandaken 167 201 193 193 172 181515200 Shawangunk 238 279 335 359 364 328515400 Ulster 267 321 366 377 333 291515600 Wawarsing 363 422 464 417 401 387515800 Woodstock 271 324 283 252 313 334510000 County Total 4,789 5,375 5,775 5,775 5,602 5,296
The New York State Office of Real Property Services mandates that real property transfer reports (RPS 5217 Forms) accompany all deeds recorded in the Ulster County Clerk's
Office. Appearing below is a chart illustrating a six-year transfer history.
Ulster County Real Property Transfer Reports

Page 7
Tax Map Copies FeeFull-size tax map sheet (30"x42") 9.00$
Fee per sheet for entire town 7.00$ Half-size tax map sheet (17"x22") 6.00$
Fee per sheet for entire town 4.00$ Letter size portion of tax map (8.5"x11') 2.00$
with color aerial overlay 5.00$ Entire town in digital format (CD) 25.00$
plus cost per CD 10.00$ Tax Maps are also available online at http://ulstercountyny.gov/real-property
Other Map CopiesRailroad maps (not all are available to copy) 9.00$ Unfiled maps (available with FOIL request only) 9.00$
As authorized by NYS Real Property Tax Law Section 503.7 and Ulster County LegislatureResolution No. 112 of 1992, Real Property is responsible for reviewing subdivision mapsto be filed and certifying that the authorized fee is paid. This process also includes assigningnew tax map numbers and approving any new street names.
2 & 3 lot subdivision, alteration, abandonment and condominium map 25.00$ 4 thru 9 lot subdivision, alteration, abandonment and condominium map 50.00$ 10 or more lot subdivision, alteration, abandonment and condominium map 100.00$
Subdivision Map filing requirements are available on the Ulster County Clerk website at http://co.ulster.ny.us/countyclerk/landrecords.html#subdivision
Ulster County Real Property Tax Service
Fee Schedule
The fees authorized by RPTL 503.7 are as follows:
Certification fees for maps to be filed in the County Clerk's Office
The Ulster County Web Map is available for viewing online at http://gis.co.ulster.ny.usWe look forward to the ongoing exchange of maps with Land Surveyors at no charge.
Copies of filed maps and deeds are available from the County Clerk's Office.

Page 8
Ulster County Assessors
Sect ion 1532 of the New York State Real Proper ty Tax Law states that the Director of the Real Proper ty Tax Serv ice Agency wi l l adv ise assessors regarding the procedures for equitable assessment administrat ion. Uls ter County Real Proper ty prov ides ongoing ass istance and tra in ing to assessors in a wide range of assessment adminis trat ion topics. Four Ulster County assessors have achieved I .A.O. ( Inst i tu te of Assess ing Of f icers) s tatus. They are: Michael Sommer, Town of Denning; Cindy Hilbert , Towns of Hardenburgh and Marlborough; Michael Dunham, Towns of Marbletown, Rochester and Rosendale; and Frank V. Or lando, Town of Saugert ies. We are proud of their accomplishments and apprec iat ive of the Ulster County Assessor ’s Associat ion, which plays such an integra l ro le in our implementat ion of new programs for modern assess ing pract ice.
Town Name And Address Phone
Denning Michael Sommer, IAO, 28 Cooper St., Accord, NY 12404 (845) 626-4342
Esopus Vacant, P.O. Box 700, Port Ewen, NY 12466 (845) 331-5546
Gardiner Vacant, P.O. Box 1, Gardiner, NY 12525 (845) 255-9675
Hardenburgh Cindy Hilbert, IAO, 51 Rider Hollow Rd., Arkville, NY 12406 (845) 586-2320
Hur ley Brittany Balfe, P.O. Box 569, Hurley, NY 12443 (845) 331-7474
Kingston-Ci ty Daniel Baker, 420 Broadway, Kingston, NY 12401 (845) 334-3912
Kingston-Town Miranda Bernholz, 906 Sawkill Rd. Kingston, New York 12401 (845) 706-5909
L loyd Ann Feo, 12 Church St., Highland, NY 12528 (845) 691-2197
Marbletown Michael Dunham, IAO, P.O. Box 217, Stone Ridge, NY 12484 (845) 687-7500
Marlborough Cindy Hilbert, IAO, P.O. Box 305, Milton, NY 12547 (845) 795-6167
New Paltz Tricia Masterson, P.O. Box 550, New Paltz, NY 12561 (845) 255-0103
Ol ive Dianna Carchidi, P.O. Box 180, West Shokan, NY 12494 (845) 657-8118
Plattek i l l Matt Sabia, P.O. Box 45, Modena, NY 12548 (845) 883-7331
Rochester Michael Dunham, IAO P.O. Box 65, Accord, NY 12404 (845) 626-0920
Rosendale Michael Dunham, IAO, 1915 Lucas Ave., Cottekill, NY 12419 (845) 658-3159
Saugert ies Frank Orlando, IAO, 4 High St., Saugerties, NY 12477 (845) 246-2800
Shandaken
( three e lec ted)
Peter Dimodica, Chair, P.O. Box 134, Shandaken, NY 12480
Janet Klugiewicz, P.O. Box 134, Shandaken, NY 12480
Dave Channon, P.O. Box 134, Shandaken, NY 12480
(845) 688-5003
Shawangunk Curt Schoeberl, P.O. Box 247, Wallkill, NY 12589 (845) 895-2143
Uls ter Daniel Baker, 584 E. Chester St. Bypass, Kingston, NY (845) 331-1317
Wawars ing Renee Ozomek, 108 Canal St., Ellenville, NY 12428 (845) 647-6965
Woodstock Marc Plate, 45 Comeau Dr., Woodstock, NY 12498 (845) 679-2113

Page 9
Assessment Calendar
Key dates that affect the assessment process are:
Valuation Date………………July 1st of the preceding year
Taxable Status Date…………March 1st
Tentative Roll Filed…………May 1st
Grievance Day………………4th Tuesday in May (date may vary so check with local assessor)
Final Roll Filed……………..July 1st

Page 10
SWIS City / Town 2010 2011 2012 2013 2014 2015 2016 2017 2018 2019 2020 2021510800 City of Kingston CR-R CR-PRO CR-PRO PRO PRO PRO PRO PRO PRO PRO PRO512000 Denning512200 Esopus CR-R CR-PRO CR-PRO PRO
512400 Gardiner CR-R CR-PRO CR-PRO512600 Hardenburgh 512800 Hurley PRO
513000 Town of Kingston513200 Lloyd CR-R CR-PRO CR-PRO PRO PRO PRO PRO PRO PRO PRO513400 Marbletown PRO PRO PRO PRO CR-R CR-PRO CR-PRO
513600 Marlborough CR-R CR-PRO CR-PRO PRO PRO513800 New Paltz CR-R CR-PRO CR-PRO PRO PRO514000 Olive PRO PRO
514200 Plattekill CR-R CR-PRO CR-PRO514400 Rochester CR-R R CR-PRO CRPRO514600 Rosendale CR-R CR-PRO CR-PRO CR-PRO PRO PRO PRO CY-R CR-PRO CR-PRO
514800 Saugerties CR-R CR-PRO CR-PRO CR-PRO PRO PRO PRO PRO PRO PRO PRO515000 Shandaken515200 Shawangunk
515400 Ulster515600 Wawarsing D D D R515800 Woodstock CR-RExplanation of Codes: AR = Annual Reassessment U = Update Subsequent to Reassessment
D = Data Collection PRO = Projects to maintain 100% (non-reappraisal reassessment)R = Initial Reassessment CR = Cyclical Reassessment
Reassessment Activity in Ulster County 2010 through 2021

Page 11
Equitable Assessment Administration
The foundation of a fair system of property taxation is an effective program of equitable assessment administration. NYS Real Property Tax Law Section 305.2 provides that all real property in each assessing unit shall be assessed at a uniform percentage of value.
The New York State Board of Real Property Services adopted Uniform Assessment Standards on February 9, 2010. These standards are intended to provide a general blueprint for local government assessing units to establish equitable and transparent assessments. The full text of the uniform assessment standards is available online at: http://www.tax.ny.gov/research/property/reports/ratio/uniformassmntstd/index.htm
The mission of Ulster County Real Property Tax Service is to provide services that assist local governments to achieve and maintain equitable assessment administration. The chart on Page 10 of this report shows the reassessment activity of each municipality in Ulster County over the past twelve years.

Page 12

Page 13

Page 14
Largest Taxpayers
For the 2020 Assessment Roll
Based on total equalized taxable value of combined properties under same ownership.
Equalized
Name Taxable Value
1. New York City Bureau of Water 1,282,956,209
2. Central Hudson Gas & Electric 449,137,407
3. New York State 374,824,542
4. UH US Hudson Valley 2019 (includes Walmart, 62,309,618 Sam’s Club, Lowe’s, Marriot, etc.)
5. Verizon New York Inc. 35,901,368 6. Tech City (includes AG Prop of Kingston, 33,372,871
Ulster County Business Complex)
7. Smiley Brothers Inc (Hotel Resort Complex) 31,417,778
8. CSX Transportation Inc (Railroad) 25,736,233
9. Kingston Mall LLC 22,245,331
10. Kingston Village 19,966,667
Page 15
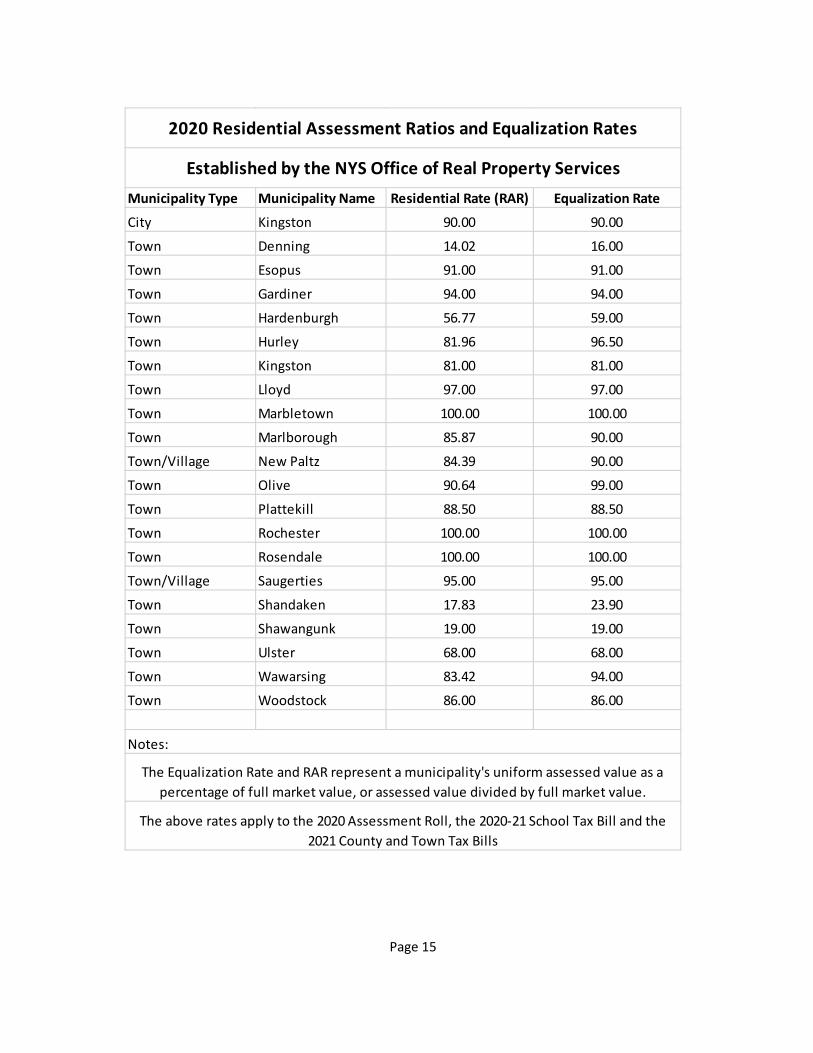
Municipality Type Municipality Name Residential Rate (RAR) Equalization Rate
City Kingston 90.00 90.00
Town Denning 14.02 16.00
Town Esopus 91.00 91.00
Town Gardiner 94.00 94.00
Town Hardenburgh 56.77 59.00
Town Hurley 81.96 96.50
Town Kingston 81.00 81.00
Town Lloyd 97.00 97.00
Town Marbletown 100.00 100.00
Town Marlborough 85.87 90.00
Town/Village New Paltz 84.39 90.00
Town Olive 90.64 99.00
Town Plattekill 88.50 88.50
Town Rochester 100.00 100.00
Town Rosendale 100.00 100.00
Town/Village Saugerties 95.00 95.00
Town Shandaken 17.83 23.90
Town Shawangunk 19.00 19.00
Town Ulster 68.00 68.00
Town Wawarsing 83.42 94.00
Town Woodstock 86.00 86.00
Notes:
The Equalization Rate and RAR represent a municipality's uniform assessed value as a percentage of full market value, or assessed value divided by full market value.
The above rates apply to the 2020 Assessment Roll, the 2020-21 School Tax Bill and the 2021 County and Town Tax Bills
2020 Residential Assessment Ratios and Equalization Rates
Established by the NYS Office of Real Property Services

Page 16
Ulster County Total Acreage (according to U.S Census Bureau)Square Miles Acres
Land 1,124.2 719,488Water 36.5 23,360Total 1,160.7 742,848
% of total countyTotal Acreage of NYS Owned Land 186,318 25.1%
Total State StateTaxable Owned Owned
SWIS Town/City Parcels Parcels Acreage510800 Kingston, City 8,205 0 0.00512000 Denning 1,127 301 42,298.25512200 Esopus 4,210 11 698.01512400 Gardiner 2,926 34 2,888.58512600 Hardenburgh 771 190 27,750.06512800 Hurley 3,467 25 932.55513000 Kingston, Town 646 55 1,665.25513200 Lloyd 4,323 0 0.00513400 Marbletown 3,761 4 17.25513600 Marlborough 3,760 1 38.00513800 New Paltz 4,106 0 0.00514000 Olive 3,107 36 8,179.41514200 Plattekill 3,900 27 303.05514400 Rochester 4,742 62 14,803.35514600 Rosendale 2,720 5 5.30514800 Saugerties 9,367 13 1,505.39515000 Shandaken 3,363 222 55,718.38515200 Shawangunk 4,578 26 2,222.28515400 Ulster 5,239 5 61.50515600 Wawarsing 6,170 41 19,481.39515800 Woodstock 4,658 81 7,749.87510000 County Total 85,146 1,139 186,317.87
New York State Owned Land in Ulster County2020 Assessment Roll

Page 17
Ulster County Total Acreage (according to U.S Census Bureau)Square Miles Acres
Land 1,124.2 719,488Water 36.5 23,360Total 1,160.7 742,848
% of total countyTotal Acreage of NY City Owned Land 37,521 5.1%
Total NY City NY CityTaxable Owned Owned
SWIS Town/City Parcels Parcels Acreage510800 Kingston, City 8,205 3 7.62512000 Denning 1,127 66 2,798.23512200 Esopus 4,210 0 0.00512400 Gardiner 2,926 1 143.20512600 Hardenburgh 771 15 915.34512800 Hurley 3,467 26 6,579.30513000 Kingston, Town 646 1 5.90513200 Lloyd 4,323 0 0.00513400 Marbletown 3,761 11 776.06513600 Marlborough 3,760 0 0.00513800 New Paltz 4,106 2 112.00514000 Olive 3,107 137 11,403.57514200 Plattekill 3,900 2 7.82514400 Rochester 4,742 2 16.60514600 Rosendale 2,720 0 0.00514800 Saugerties 9,367 0 0.00515000 Shandaken 3,363 86 3,083.62515200 Shawangunk 4,578 2 201.80515400 Ulster 5,239 0 0.00515600 Wawarsing 6,170 75 6,369.92515800 Woodstock 4,658 100 5,100.36
County Total 85,146 529 37,521.34
New York City Owned Land in Ulster County2020 Assessment Roll

Page 18
Tax Rates For the 2020 Tax Extension
The tax rates shown on the following pages were utilized in the preparation of property tax bills to compute the amount of taxes due. The rates are expressed as a dollar amount per $1,000 of assessed value, for example:
Computed taxes for a property with an assessed value of $100,000 at a tax rate of $5.00 would be $500 (or $100,000/1,000 x $5.00 = $500.00)
The tax rates for each taxing jurisdiction take into account the budget amount to be raised by taxes (tax levy), the total taxable assessed value within the jurisdiction and municipal equalization rates.
The tax extension data shown on the following pages is based on the following:
• The 2020 Municipal Assessment Rolls • The 2020-21 School District Tax Levies (9/01/20 tax bills) • The 2021 County, Town and Special District Tax levies (1/01/21 tax bills)
Page 19
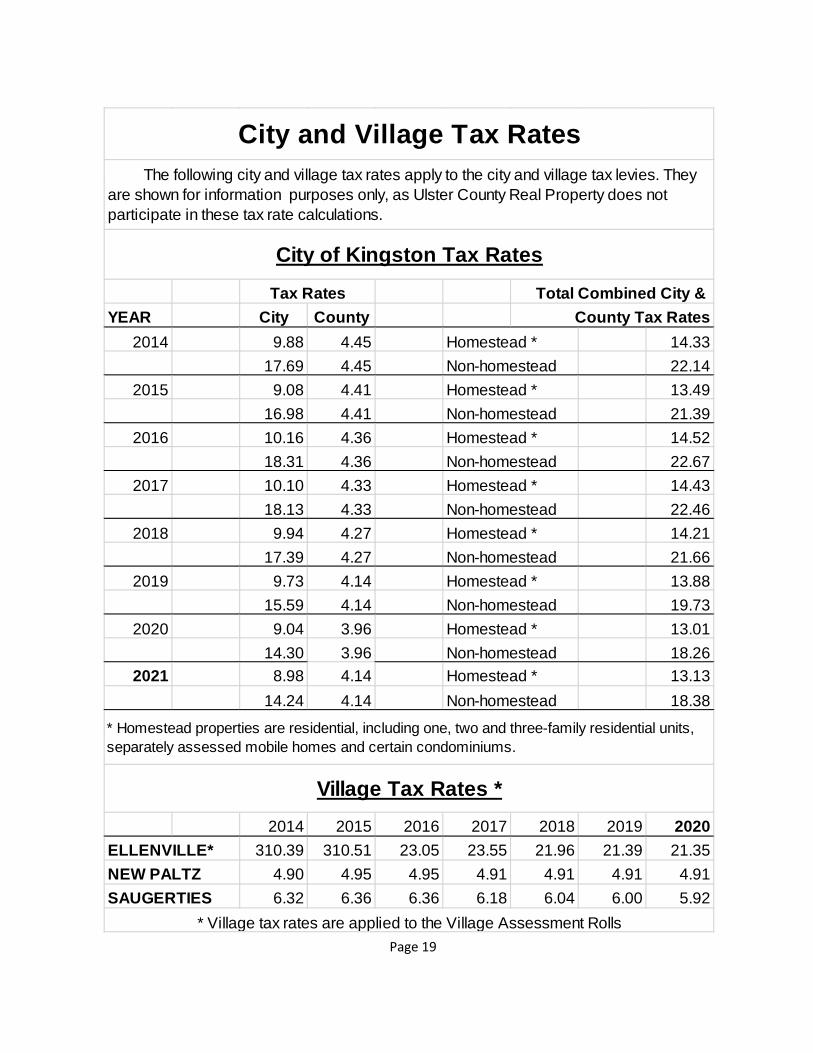
YEAR City County2014 9.88 4.45 Homestead * 14.33
17.69 4.45 Non-homestead 22.142015 9.08 4.41 Homestead * 13.49
16.98 4.41 Non-homestead 21.392016 10.16 4.36 Homestead * 14.52
18.31 4.36 Non-homestead 22.672017 10.10 4.33 Homestead * 14.43
18.13 4.33 Non-homestead 22.462018 9.94 4.27 Homestead * 14.21
17.39 4.27 Non-homestead 21.662019 9.73 4.14 Homestead * 13.88
15.59 4.14 Non-homestead 19.732020 9.04 3.96 Homestead * 13.01
14.30 3.96 Non-homestead 18.262021 8.98 4.14 Homestead * 13.13
14.24 4.14 Non-homestead 18.38
2014 2015 2016 2017 2018 2019 2020310.39 310.51 23.05 23.55 21.96 21.39 21.35
4.90 4.95 4.95 4.91 4.91 4.91 4.916.32 6.36 6.36 6.18 6.04 6.00 5.92
NEW PALTZ
Village Tax Rates *
* Village tax rates are applied to the Village Assessment Rolls
* Homestead properties are residential, including one, two and three-family residential units, separately assessed mobile homes and certain condominiums.
Total Combined City &
The following city and village tax rates apply to the city and village tax levies. They are shown for information purposes only, as Ulster County Real Property does not participate in these tax rate calculations.
County Tax Rates
City and Village Tax Rates
City of Kingston Tax RatesTax Rates
SAUGERTIES
ELLENVILLE*
Page 20
Column 1 (Column 1a) + Column 2 add to Col 1
+ Column 3 = Column 4 Divide by Column 5
= Column 6 Column 7 Column 8 Column 9 Column 10 Column 11
County Taxable Equalized Value of Value of State Equalized Percent Apportioned Other Net Col 10 / Col 1Assessed Taxable Clergy Veterans Apportionment Equalization Apportionment Share of Share of Adjust- County x 1,000 =
Municipalities Value Value Exemption Exemptions Value Rate Value County Tax County Tax ments Charges Tax Rate
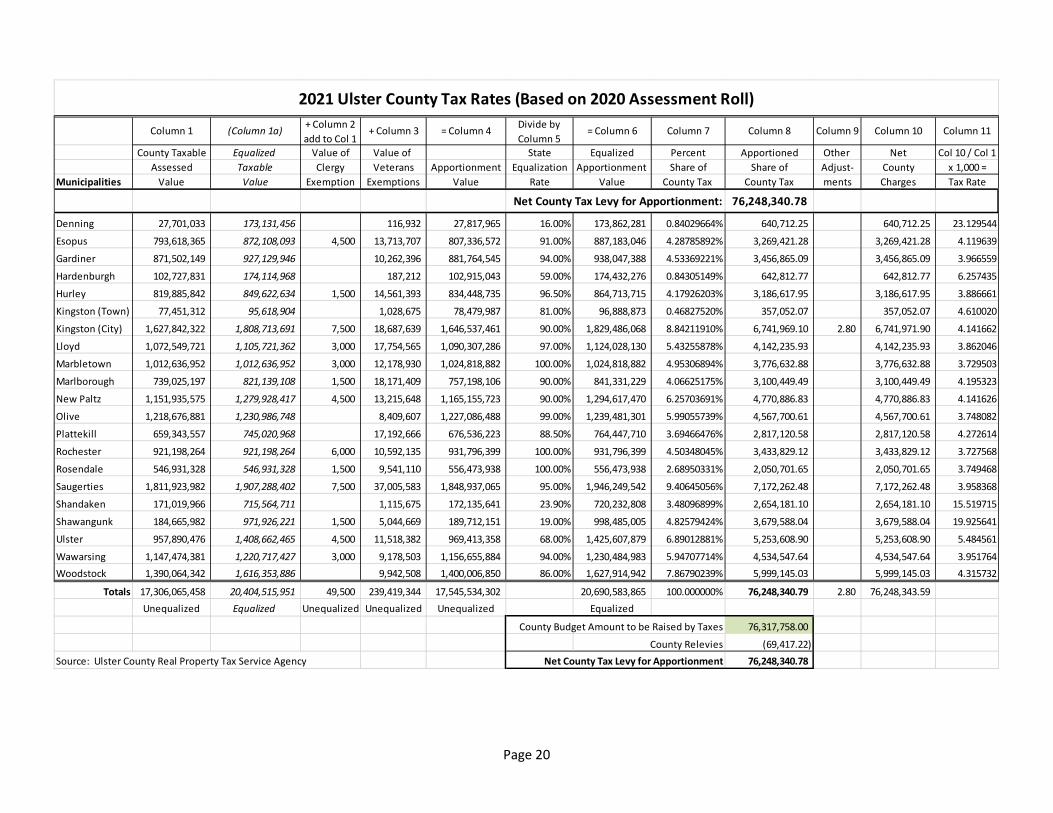
Net County Tax Levy for Apportionment: 76,248,340.78
Denning 27,701,033 173,131,456 116,932 27,817,965 16.00% 173,862,281 0.84029664% 640,712.25 640,712.25 23.129544
Esopus 793,618,365 872,108,093 4,500 13,713,707 807,336,572 91.00% 887,183,046 4.28785892% 3,269,421.28 3,269,421.28 4.119639
Gardiner 871,502,149 927,129,946 10,262,396 881,764,545 94.00% 938,047,388 4.53369221% 3,456,865.09 3,456,865.09 3.966559
Hardenburgh 102,727,831 174,114,968 187,212 102,915,043 59.00% 174,432,276 0.84305149% 642,812.77 642,812.77 6.257435
Hurley 819,885,842 849,622,634 1,500 14,561,393 834,448,735 96.50% 864,713,715 4.17926203% 3,186,617.95 3,186,617.95 3.886661
Kingston (Town) 77,451,312 95,618,904 1,028,675 78,479,987 81.00% 96,888,873 0.46827520% 357,052.07 357,052.07 4.610020
Kingston (City) 1,627,842,322 1,808,713,691 7,500 18,687,639 1,646,537,461 90.00% 1,829,486,068 8.84211910% 6,741,969.10 2.80 6,741,971.90 4.141662
Lloyd 1,072,549,721 1,105,721,362 3,000 17,754,565 1,090,307,286 97.00% 1,124,028,130 5.43255878% 4,142,235.93 4,142,235.93 3.862046
Marbletown 1,012,636,952 1,012,636,952 3,000 12,178,930 1,024,818,882 100.00% 1,024,818,882 4.95306894% 3,776,632.88 3,776,632.88 3.729503
Marlborough 739,025,197 821,139,108 1,500 18,171,409 757,198,106 90.00% 841,331,229 4.06625175% 3,100,449.49 3,100,449.49 4.195323
New Paltz 1,151,935,575 1,279,928,417 4,500 13,215,648 1,165,155,723 90.00% 1,294,617,470 6.25703691% 4,770,886.83 4,770,886.83 4.141626
Olive 1,218,676,881 1,230,986,748 8,409,607 1,227,086,488 99.00% 1,239,481,301 5.99055739% 4,567,700.61 4,567,700.61 3.748082
Plattekill 659,343,557 745,020,968 17,192,666 676,536,223 88.50% 764,447,710 3.69466476% 2,817,120.58 2,817,120.58 4.272614
Rochester 921,198,264 921,198,264 6,000 10,592,135 931,796,399 100.00% 931,796,399 4.50348045% 3,433,829.12 3,433,829.12 3.727568
Rosendale 546,931,328 546,931,328 1,500 9,541,110 556,473,938 100.00% 556,473,938 2.68950331% 2,050,701.65 2,050,701.65 3.749468
Saugerties 1,811,923,982 1,907,288,402 7,500 37,005,583 1,848,937,065 95.00% 1,946,249,542 9.40645056% 7,172,262.48 7,172,262.48 3.958368
Shandaken 171,019,966 715,564,711 1,115,675 172,135,641 23.90% 720,232,808 3.48096899% 2,654,181.10 2,654,181.10 15.519715
Shawangunk 184,665,982 971,926,221 1,500 5,044,669 189,712,151 19.00% 998,485,005 4.82579424% 3,679,588.04 3,679,588.04 19.925641
Ulster 957,890,476 1,408,662,465 4,500 11,518,382 969,413,358 68.00% 1,425,607,879 6.89012881% 5,253,608.90 5,253,608.90 5.484561
Wawarsing 1,147,474,381 1,220,717,427 3,000 9,178,503 1,156,655,884 94.00% 1,230,484,983 5.94707714% 4,534,547.64 4,534,547.64 3.951764Woodstock 1,390,064,342 1,616,353,886 9,942,508 1,400,006,850 86.00% 1,627,914,942 7.86790239% 5,999,145.03 5,999,145.03 4.315732
Totals 17,306,065,458 20,404,515,951 49,500 239,419,344 17,545,534,302 20,690,583,865 100.000000% 76,248,340.79 2.80 76,248,343.59 Unequalized Equalized Unequalized Unequalized Unequalized Equalized
County Budget Amount to be Raised by Taxes 76,317,758.00
County Relevies (69,417.22) Source: Ulster County Real Property Tax Service Agency Net County Tax Levy for Apportionment 76,248,340.78
2021 Ulster County Tax Rates (Based on 2020 Assessment Roll)

Page 21
Column 1 Column 2 + Column 3 + Column 4 - Column 5 = Column 6 Column 7 Column 8 Column 9
Town Add Add Deduct Total Town Town Total Town TownTaxable Town Erroneous Public Town Share General Charges General Rate Highway Charges Highway Rate
Assessed Value General Charge Taxes Library of Relevies (sum of columns (column 6 divided (column 8 divided Municipalities (unequalized) 2, 3 & 4 , minus 5) by column 1 X 1,000) by column 1 X 1,000)Denning 27,870,731 227,122.00 0.03 438.09 226,683.94 8.133405 765,833.00$ 27.478038Esopus 802,225,108 1,176,000.00 268.88 1,828.94 1,174,439.94 1.463978 1,851,000.00$ 2.307332Gardiner 875,984,056 614,558.07 (0.14) 275,076.00 1,383.96 888,249.97 1.014002 1,243,083.00$ 1.419070Hardenburgh 103,025,068 301,955.00 (0.03) 301,954.97 2.930888 718,685.00$ 6.975827Hurley 833,979,539 871,600.00 (1.13) 4,302.97 867,295.90 1.039949 1,430,600.00$ 1.715390Kingston (Town) 78,307,974 359,291.00 0.03 734.86 358,556.17 4.578795 319,552.00$ 4.080708Kingston (City) 1,639,611,452 Lloyd 1,073,105,661 3,820,776.93 1,310.57 3,978.32 3,818,109.18 3.557999 1,840,407.72$ 1.715029Marbletown 1,016,462,089 738,674.00 1,052.28 406.99 739,319.29 0.727346 1,426,000.00$ 1.402905Marlborough 746,253,067 4,005,021.00 2,549.24 13,991.49 3,993,578.75 5.351507 2,197,359.00$ 2.944523New Paltz
Town rate within village 1,156,229,493 7,730,409.00 4,282.59 556,000.00 2,458.36 8,288,233.23 7.168329 160,692.00$ 0.138979+ additional town rate 847,667,871 186,904.00 186,904.00 0.220492 1,612,525.00$ 1.902308
Town rate outside village 7.388821 2.041287Olive 1,224,907,274 1,987,101.00 1,427.43 148,142.00 709.03 2,135,961.40 1.743774 2,001,336.00$ 1.633867Plattekill 664,647,460 1,169,866.00 80.35 1,692.87 1,168,253.48 1.757704 1,370,462.00$ 2.061938Rochester 922,275,196 622,747.00 1,323.57 2,249.59 621,820.98 0.674225 1,328,927.00$ 1.440922Rosendale 547,359,640 1,852,662.00 160.53 1,953.92 1,850,868.61 3.381449 1,140,347.00$ 2.083360Saugerties
Town rate within village 1,819,403,565 7,184,704.00 9,986.55 649.65 7,194,040.90 3.954066 0.000000+ additional town rate 1,519,328,867 425,956.00 425,956.00 0.280358 3,099,530.00$ 2.040065
Town rate outside village 4.234424 2.040065Shandaken 171,508,101 2,395,470.00 (0.24) 2,923.41 2,392,546.35 13.950049 1,761,100.00$ 10.268320Shawangunk 189,212,906 1,573,431.00 70.43 1,511.10 1,571,990.33 8.308050 1,934,689.00$ 10.224931Ulster 968,421,867 6,160,937.00 4,364.30 11,061.22 6,154,240.08 6.354916 2,764,008.00$ 2.854136Wawarsing
Town rate within village 1,161,328,370 2,621,242.00 12,830.02 1,606.13 2,632,465.89 2.266771 0.000000+ additional town rate 1,014,714,314 80,374.00 80,374.00 0.079209 3,419,783.00$ 3.370193
Town rate outside village 2.345980 3.370193Woodstock 1,393,092,454 4,247,291.00 0.76 3,624.94 4,243,666.82 3.046221 2,072,598.00$ 1.487768
Totals 17,415,211,071 50,354,092.00 39,706.02 979,218.00 57,505.84 51,315,510.18 34,458,516.72$
Note: Column 4 Public Library includes non-special district libraries for which the Town is required to levy a tax amount approved by voter referendum per NYS Education Law 259
2021 Town Tax Rates (Based on 2020 Assessment Roll)
Page 22
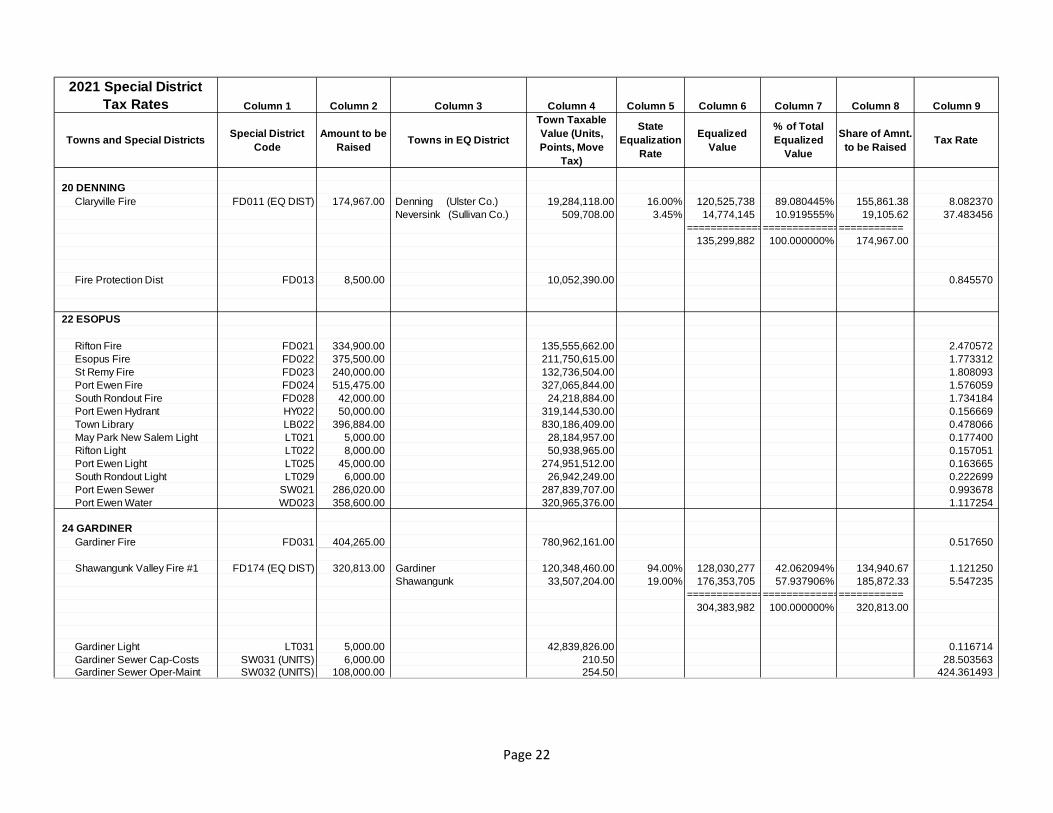
2021 Special District Tax Rates Column 1 Column 2 Column 3 Column 4 Column 5 Column 6 Column 7 Column 8 Column 9
Towns and Special Districts Special District Code
Amount to be Raised Towns in EQ District
Town Taxable Value (Units, Points, Move
Tax)
State Equalization
Rate
Equalized Value
% of Total Equalized
Value
Share of Amnt. to be Raised Tax Rate
20 DENNING Claryville Fire FD011 (EQ DIST) 174,967.00 Denning (Ulster Co.) 19,284,118.00 16.00% 120,525,738 89.080445% 155,861.38 8.082370
Neversink (Sullivan Co.) 509,708.00 3.45% 14,774,145 10.919555% 19,105.62 37.483456=====================================
135,299,882 100.000000% 174,967.00
Fire Protection Dist FD013 8,500.00 10,052,390.00 0.845570
22 ESOPUS
Rifton Fire FD021 334,900.00 135,555,662.00 2.470572 Esopus Fire FD022 375,500.00 211,750,615.00 1.773312 St Remy Fire FD023 240,000.00 132,736,504.00 1.808093 Port Ewen Fire FD024 515,475.00 327,065,844.00 1.576059 South Rondout Fire FD028 42,000.00 24,218,884.00 1.734184 Port Ewen Hydrant HY022 50,000.00 319,144,530.00 0.156669 Town Library LB022 396,884.00 830,186,409.00 0.478066 May Park New Salem Light LT021 5,000.00 28,184,957.00 0.177400 Rifton Light LT022 8,000.00 50,938,965.00 0.157051 Port Ewen Light LT025 45,000.00 274,951,512.00 0.163665 South Rondout Light LT029 6,000.00 26,942,249.00 0.222699 Port Ewen Sewer SW021 286,020.00 287,839,707.00 0.993678 Port Ewen Water WD023 358,600.00 320,965,376.00 1.117254
24 GARDINER Gardiner Fire FD031 404,265.00 780,962,161.00 0.517650
Shawangunk Valley Fire #1 FD174 (EQ DIST) 320,813.00 Gardiner 120,348,460.00 94.00% 128,030,277 42.062094% 134,940.67 1.121250 Shawangunk 33,507,204.00 19.00% 176,353,705 57.937906% 185,872.33 5.547235
=====================================304,383,982 100.000000% 320,813.00
Gardiner Light LT031 5,000.00 42,839,826.00 0.116714 Gardiner Sewer Cap-Costs SW031 (UNITS) 6,000.00 210.50 28.503563 Gardiner Sewer Oper-Maint SW032 (UNITS) 108,000.00 254.50 424.361493

Page 23
2021 Special District Tax Rates Column 1 Column 2 Column 3 Column 4 Column 5 Column 6 Column 7 Column 8 Column 9
Towns and Special Districts Special District Code
Amount to be Raised Towns in EQ District
Town Taxable Value (Units, Points, Move
Tax)
State Equalization
Rate
Equalized Value
% of Total Equalized
Value
Share of Amnt. to be Raised Tax Rate
26 HARDENBURGH Middletown Hardenburgh Fire FD041 (EQ DIST) 347,900.00 Hardenburgh (Ulster Co.) 29,186,340.00 59.00% 49,468,373 9.774437% 34,005.26 1.165109
Middletown (Delaware Co.) 457,111,767.00 102.00% 448,148,791 88.549545% 308,063.87 0.673936 Roxbury (Delaware Co.) 8,482,320.00 100.00% 8,482,320 1.676018% 5,830.87 0.687414
=====================================506,099,484 100.000000% 347,900.00
Beaverkill Valley Fire FD042 (EQ DIST) 85,605.00 Hardenburgh (Ulster Co.) 53,232,826.00 59.00% 90,225,129 62.319349% 53,348.48 1.002173 Rockland (Sullivan Co.) 33,584,619.00 63.50% 52,889,164 36.531045% 31,272.40 0.931152 Colchester (Delaware Co.) 48,600.00 2.92% 1,664,384 1.149605% 984.12 20.249378
=====================================144,778,676 100.000000% 85,605.00
Arena Fire Dist FD043 (EQ DIST) 36,572.00 Hardenburgh (Ulster Co.) 10,309,043.00 59.00% 17,472,954 18.662347% 6,825.19 0.662059 Middletown (Delaware Co.) 37,404,215.00 102.00% 36,670,799 39.166998% 14,324.15 0.382956 Andes (Delaware Co.) 39,483,027.00 100.00% 39,483,027 42.170656% 15,422.65 0.390615
=====================================93,626,780 100.000000% 36,572.00
Fire Protection Dist #1 FD044 1,000.00 13,777,937.00 0.072580
Hardenburgh Insurance Prem. FD043 2,562.53 10,309,043.00 0.248571 Hardenburgh Insurance Prem. FD041 7,254.90 29,186,340.00 0.248572 Hardenburgh Ambulance AD300 2,600.00 39,495,383.00 0.065830
28 HURLEY Hurley Fire FD051 465,000.00 287,550,474.00 1.617107 West Hurley Fire FD052 579,559.88 565,111,276.00 1.025568 West Hurley Library LB052 221,954.00 565,374,276.00 0.392579 West Hurley Lib Bond LB050 40,940.00 564,437,986.00 0.072532 Hurley Library LB053 185,269.00 287,550,474.00 0.644301 Rolling Meadows Light LT051 10,000.00 39,085,734.00 0.255848
30 KINGSTON Sawkill Fire FD061 159,925.00 80,998,716.00 1.974414

Page 24
2021 Special District Tax Rates Column 1 Column 2 Column 3 Column 4 Column 5 Column 6 Column 7 Column 8 Column 9
Towns and Special Districts Special District Code
Amount to be Raised Towns in EQ District
Town Taxable Value (Units, Points, Move
Tax)
State Equalization
Rate
Equalized Value
% of Total Equalized
Value
Share of Amnt. to be Raised Tax Rate
32 LLOYD Highland Ambulance Dist AD400 223,218.00 1,109,703,399.00 0.201151 Mountainside Woods Drain DD040 (FE) 2,364.57 2,364.57 Highland Fire FD072 1,167,185.00 1,046,182,407.00 1.115661
Clintondale Fire FD121 (EQ DIST) 374,174.00 LLoyd 65,117,607.00 97.00% 67,131,554 26.662200% 99,763.02 1.532044 Plattekill 163,418,743.00 88.50% 184,653,947 73.337800% 274,410.98 1.679189
=====================================251,785,501 100.000000% 374,174.00
Highland Light LT071 174,965.00 985,052,183.00 0.177620 Highland Sewer SW071 264,616.40 413,775,168.00 0.639517 Highland Sewer Cap Cost SW073 397,713.70 434,137,689.00 0.916100 Sewer Hook Up SW076(MOVE TAX) 0.00 0.00 Highland Water WD072 42,675.95 471,478,921.00 0.090515 Highland Water Cap Cost WD074 236,571.50 508,571,029.00 0.465169
34 MARBLETOWN Stone Ridge Fire FD081 372,668.00 237,638,053.00 1.568217
High Falls Fire FD082 (EQ DIST) 336,792.00 Marbletown 183,632,401.00 100.00% 183,632,401 78.492763% 264,357.35 1.439601 Rosendale 50,315,791.00 100.00% 50,315,791 21.507237% 72,434.65 1.439601
=====================================233,948,192 100.000000% 336,792.00
Cottekill Fire FD083 (EQ DIST) 135,378.00 Marbletown 47,548,920.00 100.00% 47,548,920 58.357762% 79,003.57 1.661522 Rosendale 33,929,393.00 100.00% 33,929,393 41.642238% 56,374.43 1.661522
=====================================81,478,313 100.000000% 135,378.00
Marbletown Fire FD084 78,375.00 43,076,001.00 1.819459 Lomontville Fire FD085 129,748.00 178,803,452.00 0.725646 Kripplebush Fire FD086 154,110.00 208,086,967.00 0.740604 Vly Atwood Fire FD087 59,355.00 158,410,215.00 0.374692 Stone Ridge Library LB081 277,964.00 1,057,196,006.00 0.262926 Stone Ridge Light LT081 3,000.00 45,780,682.00 0.065530 High Falls Light LT082 3,000.00 39,617,733.00 0.075724
High Falls Water Dist WD082 (EQ DIST) 10,400.00 Marbletown 35,505,240.00 100.00% 35,505,240 77.164856% 8,025.14 0.226027Rosendale 10,506,950.00 100.00% 10,506,950 22.835144% 2,374.86 0.226027
=====================================46,012,190 100.000000% 10,400.00

Page 25
2021 Special District Tax Rates Column 1 Column 2 Column 3 Column 4 Column 5 Column 6 Column 7 Column 8 Column 9
Towns and Special Districts Special District Code
Amount to be Raised Towns in EQ District
Town Taxable Value (Units, Points, Move
Tax)
State Equalization
Rate
Equalized Value
% of Total Equalized
Value
Share of Amnt. to be Raised Tax Rate
36 MARLBOROUGH Winston Est - Dist 1 DD020 (MOVE TAX) 500.00 500.00 Orchard Ridge - Dist 3 DD021 (MOVE TAX) 2,500.00 2,500.00 Oakwood Mills - Dist 4 DD022 (MOVE TAX) 1,000.00 1,000.00 Lucky Seven - Dist 2 DD023 (MOVE TAX) 750.00 750.00 Meadow View Est Dist 5 DD024 (MOVE TAX) 2,500.00 2,500.00 Quaker Hill Drainage DD025 (MOVE TAX) 1,500.00 1,500.00 Marlborough Chase Dist DD026 (MOVE TAX) 1,500.00 1,500.00 Prospect Ridge Manor Dist DD027 (MOVE TAX) 2,500.00 2,500.00 Sunrise Ridge Drainage DD030 (MOVE TAX) 750.00 750.00 Marlborough Fire FD091 733,400.00 491,505,427.00 1.492150 Milton Fire FD092 646,800.00 294,330,090.00 2.197533 Riverview Dr Improv HD120(MOVE TAX) 31,173.00 31,173.00 Marlborough Light LT091 26,000.00 131,953,761.00 0.197039 Milton Light LT092 14,000.00 60,475,533.00 0.231499 McLaughlin Light LT093 1,800.00 9,954,300.00 0.180826 Marlborough Sewer SW091 18,250.00 95,781,702.00 0.190537 Milton Sewer #1 SW098 22,400.00 17,344,022.00 1.291511 Milton Sewer Ext #1 SW099 (MOVE TAX) 19,500.00 19,500.00 0.000000 Marlborough Water WD091 0.00 324,538,788.00 0.000000
38 NEW PALTZ Storm Water District #1 DD002(MOVE TAX) 1,470.00 1,470.00 Storm Water District #2 DD015 (MOVE TAX) 1,834.00 1,834.00 Storm Water District #3 DD016 (MOVE TAX) 1,688.00 1,688.00 Storm Water District #4 DD017 (MOVE TAX) 2,385.00 2,385.00 New Paltz Fire Protection FD101 434,442.00 876,006,406.00 0.495935 Cherry Hill Sewer #5 (Adval) SW101 4,135.20 17,022,000.00 0.242933 Cherry Hill Sewer #5 (Pts.) SW101 (POINTS) 1,033.80 630.00 1.640952 New Paltz Sewer (Fr. Ft.) SW102 (UNITS) 0.00 9,317.20 0.000000 New Paltz Sewer (AdVal) SW102 0.00 52,470,738.00 0.000000 Ohioville Sewer #6 (Adval) SW103 7,990.40 11,261,700.00 0.709520 Ohioville Sewer #6 (Pts.) SW103 (POINTS) 1,997.60 1,065.00 1.875681 New Paltz Water #1 WD101 19,385.00 88,000,516.00 0.220283 New Paltz Water #2 WD102 4,224.00 27,304,322.00 0.154701 New Paltz Water #3 WD103(MOVE TAX) 4,350.00 4,350.00 Water District #4 WD104 (MOVE TAX) 0.00 0.00

Page 26
2021 Special District Tax Rates Column 1 Column 2 Column 3 Column 4 Column 5 Column 6 Column 7 Column 8 Column 9
Towns and Special Districts Special District Code
Amount to be Raised Towns in EQ District
Town Taxable Value (Units, Points, Move
Tax)
State Equalization
Rate
Equalized Value
% of Total Equalized
Value
Share of Amnt. to be Raised Tax Rate
40 OLIVE Olive Fire Protection FD111 687,700.00 1,246,264,556.00 0.551809 Onteora Court Light LT111 750.00 4,188,513.00 0.179061 Olive Sewer District #1 SW010 (FE) 0.00 0.00
42 PLATTEKILL Clintondale Fire FD121 (EQ DIST) 374,174.00 Lloyd 65,117,607.00 97.00% 67,131,554 26.662200% 99,763.02 1.532044
Plattekill 163,418,743.00 88.50% 184,653,947 73.337800% 274,410.98 1.679189=====================================
251,785,501 100.000000% 374,174.00
Modena Fire FD122 345,460.00 231,231,383.00 1.494001
Plattekill Fire FD123 (EQ DIST) 780,000.00 Plattekill (Ulster Co.) 300,744,164.00 88.50% 339,823,914 62.947551% 490,990.90 1.632587 Newburgh (Orange Co.) 59,908,555.00 29.95% 200,028,564 37.052449% 289,009.10 4.824171
=====================================539,852,478 100.000000% 780,000.00
Hunt Road Drain DD001 (MOVE TAX) 800.00 800.00 Spring Meadows 1 DD003 (MOVE TAX) 1,935.00 1,935.00 Patura Gardens Drain DD004 (MOVE TAX) 2,240.00 2,240.00 Glen Rock Drainage DD005 (MOVE TAX) 8,382.00 8,382.00 Huckleberry Ridge Drain DD006 (MOVE TAX) 3,234.00 3,234.00 Peters Place Drain DD007 (MOVE TAX) 1,128.00 1,128.00 Finn Estates Drainage DD008 (MOVE TAX) 1,088.00 1,088.00 Quaker Street Drainage DD009 (MOVE TAX) 0.00 0.00 Arcadia Estates Drainage DD010 (MOVE TAX) 0.00 0.00
Plattekill Library District LB042 459,548.00 562,386,222.00 0.817140 Clintondale Light LT121 10,350.00 28,626,401.00 0.361554 Modena Light LT122 18,000.00 32,035,571.00 0.561875
44 ROCHESTER Accord Fire FD131 760,839.00 959,821,971.00 0.792688
Kerhonkson Fire FD191 (EQ DIST) 278,503.75 Rochester 71,654.00 100.00% 71,654 0.066503% 185.21 2.584824 Wawarsing 101,213,616.00 94.00% 107,674,060 99.933497% 278,318.54 2.749813
=====================================107,745,714 100.000000% 278,503.75
Barry Lane HD344 (MOVE TAX) 0.00 0.00 Kerhonkson Light #2 LT132 1,680.00 9,388,376.00 0.178945 Accord Light LT133 2,520.00 11,876,396.00 0.212186 Berme Road Light LT134 600.00 2,547,735.00 0.235503

Page 27
2021 Special District Tax Rates Column 1 Column 2 Column 3 Column 4 Column 5 Column 6 Column 7 Column 8 Column 9
Towns and Special Districts Special District Code
Amount to be Raised Towns in EQ District
Town Taxable Value (Units, Points, Move
Tax)
State Equalization
Rate
Equalized Value
% of Total Equalized
Value
Share of Amnt. to be Raised Tax Rate
46 ROSENDALE High Falls Fire FD082 (EQ DIST) 336,792.00 Marbletown 183,632,401.00 100.00% 183,632,401 78.492763% 264,357.35 1.439601
Rosendale 50,315,791.00 100.00% 50,315,791 21.507237% 72,434.65 1.439601=====================================
233,948,192 100.000000% 336,792.00
Cottekill Fire FD083 (EQ DIST) 135,378.00 Marbletown 47,548,920.00 100.00% 47,548,920 58.357762% 79,003.57 1.661522 Rosendale 33,929,393.00 100.00% 33,929,393 41.642238% 56,374.43 1.661522
=====================================81,478,313 100.000000% 135,378.00
Tillson Fire FD143 274,213.00 207,315,452.00 1.322685
Bloomington Fire FD149 433,000.00 Rosendale 152,675,095.00 100.00% 152,675,095 81.143687% 351,352.16 2.301306Ulster 24,125,658.00 68.00% 35,478,909 18.856313% 81,647.84 3.384274
=======================================188,154,004 100.000000% 433,000.00
Rosendale Fire FD148 230,400.00 129,822,119.00 1.774736 Rosendale Library LB141 320,475.00 571,119,217.00 0.561135 High Falls Light LT141 1,200.00 7,142,543.00 0.168007 High Falls Park Light LT142 2,000.00 12,881,008.00 0.155267 Rosendale Light LT143 27,000.00 100,921,249.00 0.267535 Rosendale Sewer SW141 0.00 69,547,155.00 0.000000
High Falls Water Dist WD082 (EQ DIST) 10,400.00 Marbletown 35,505,240.00 100.00% 35,505,240 77.164856% 8,025.14 0.226027Rosendale 10,506,950.00 100.00% 10,506,950 22.835144% 2,374.86 0.226027
=====================================46,012,190 100.000000% 10,400.00
Rosendale Water WD141 23,018.00 102,001,149.00 0.225664

Page 28
2021 Special District Tax Rates Column 1 Column 2 Column 3 Column 4 Column 5 Column 6 Column 7 Column 8 Column 9
Towns and Special Districts Special District Code
Amount to be Raised Towns in EQ District
Town Taxable Value (Units, Points, Move
Tax)
State Equalization
Rate
Equalized Value
% of Total Equalized
Value
Share of Amnt. to be Raised Tax Rate
48 SAUGERTIES Saugerties Ambulance AD100 795,919.00 1,909,237,706.00 0.416878 Glasco Fire FD151 564,810.00 440,181,110.00 1.283131 Centerville Fire FD152 755,944.00 653,352,347.00 1.157023 Malden-West Camp Fire FD153 215,660.00 157,375,034.00 1.370357 Mt Marion Fire FD154 208,482.88 127,075,753.00 1.640619 Saxton Fire FD155 312,438.00 198,738,527.00 1.572106 Fire Prot. Dist. FD156 1,000.00 14,287,000.00 0.069994 Town Library LB048 617,796.00 1,905,748,133.00 0.324175 Library Bond LB049 429,563.00 1,905,748,133.00 0.225404 Glasco Light LT151 27,830.00 110,940,253.00 0.250856 Malden Light LT152 14,520.00 67,987,343.00 0.213569 Quarryville Light LT153 4,235.00 19,511,011.00 0.217057 Mt Marion Light LT154 10,104.00 28,628,402.00 0.352936 Garden Place Light Dist LT155 1,876.00 5,256,500.00 0.356891 Barclay Lane Light LT156 1,271.00 5,513,000.00 0.230546 Windmere Light LT157 10,104.00 32,100,000.00 0.314766 Barclay Hgts Light #1 LT158 5,808.00 28,349,000.00 0.204875 Barclay Hght Light #2 LT159 13,855.00 60,984,000.00 0.227191 Village Drive Light LT160 2,000.00 9,529,809.00 0.209868 Barclay Hght Sewer Op-Maint SW151 (UNITS) 0.00 924.50 0.000000 Barclay Hgts Sewer Cap-Costs SW154 (UNITS) 0.00 953.70 0.000000 Glasco Sewer Cap-Cost SW152 (UNITS) 2,346.00 1,586.16 1.479044 Malden Sewer Cap-Cost SW153 (UNITS) 0.00 411.65 0.000000 Glasco Sewer O & M SW155 (UNITS) 0.00 1,257.30 0.000000 Malden Sewer O & M SW156 (UNITS) 0.00 328.45 0.000000 Kings Hway Sewer SW157 (UNITS) 22,056.00 488.15 45.182833 Kings Hway Sewer SW157 22,056.00 17,671,500.00 1.248111 Kings Hway Water WD155 19,819.00 16,127,600.00 1.228887 Bluestone Park Water WD156 (UNITS) 4,898.00 29.06 168.547832 Glasco Water WD151 48,232.00 325,775,875.00 0.148053 Glasco Water Ext (Spaulding) WD154 (UNITS) 3,267.00 67.25 48.579926 Cafaldo Water WD152 14,294.00 16,477,500.00 0.867486 Malden Water WD153(UNITS) 75,000.00 424.80 176.553672

Page 29
2021 Special District Tax Rates Column 1 Column 2 Column 3 Column 4 Column 5 Column 6 Column 7 Column 8 Column 9
Towns and Special Districts Special District Code
Amount to be Raised Towns in EQ District
Town Taxable Value (Units, Points, Move
Tax)
State Equalization
Rate
Equalized Value
% of Total Equalized
Value
Share of Amnt. to be Raised Tax Rate
50 SHANDAKEN Phoenicia Fire FD161 270,000.00 101,731,885.00 2.654035 Big Indian Oliverea Fire FD162 117,619.00 53,100,003.00 2.215047 Highmount Fire Protection FD163 54,546.00 12,085,571.00 4.513316 Pine Hill Fire Protection FD164 52,310.00 10,022,789.00 5.219106 Phoenicia Light LT161 10,500.00 11,847,835.00 0.886238 Chichester Light LT162 1,575.00 3,177,839.00 0.495620 Pine Hill Light LT163 6,350.00 6,768,778.00 0.938131 Phoenicia Water WD161 60,550.00 12,615,933.00 4.799486 Pine Hill Water WD162 50,000.00 23,563,724.00 2.121906
52 SHAWANGUNK Wallkill Ambulance Dist. AD002 85,271.00 85,069,773.00 1.002365 Maple Ridge Drainage DD095 750.00 1,026,600.00 0.730567 Plains Estates Drainage DD096 (MOVE TAX) 1,200.00 1,200.00 Orange County Ent. Drain DD097 (MOVE TAX) 250.00 250.00 Rolling Hills Est. Drainage DD098 (MOVE TAX) 1,200.00 1,200.00 Titus Drainage Dist. DD099 (MOVE TAX) 0.00 0.00 Prospect Hgts Drainage DD100 (MOVE TAX) 1,150.00 1,150.00
Wallkill Fire FD171 665,855.00 84,658,789.00 7.865161 Prospect Fire Prot. FD172 111,153.00 18,086,569.00 6.145610
Shawangunk Valley Fire FD174 (EQ DIST) 320,813.00 Gardiner 120,348,460.00 94.00% 128,030,277 42.062094% 134,940.67 1.121250 Shawangunk 33,507,204.00 19.00% 176,353,705 57.937906% 185,872.33 5.547235
=====================================304,383,982 100.000000% 320,813.00
Walker Valley Fire Prot FD176 386,218.00 57,160,842.00 6.756688
Pine Bush Area Pub Library LB153 305,856.00 Crawford (Orange Co.) 345,905,382.00 35.13% 984,643,843 66.712741% 204,044.92 0.589887Shawangunk 93,347,358.00 19.00% 491,301,884 33.287259% 101,811.08 1.090669
=================================1,475,945,727 100.000000% 305,856.00
Wallkill Library LB152 359,272.00 96,686,777.00 3.715834 Wallkill Light LT171 19,500.00 15,247,506.00 1.278898 Wallkill Sidewalk SD175 (UNITS) 24,000.00 36,790.00 0.652351 Wallkill Sewer SW171 0.00 24,194,148.00 0.000000 Wallkill Water Dist WD172 33,575.00 26,779,858.00 1.253741

Page 30
2021 Special District Tax Rates Column 1 Column 2 Column 3 Column 4 Column 5 Column 6 Column 7 Column 8 Column 9
Towns and Special Districts Special District Code
Amount to be Raised Towns in EQ District
Town Taxable Value (Units, Points, Move
Tax)
State Equalization
Rate
Equalized Value
% of Total Equalized
Value
Share of Amnt. to be Raised Tax Rate
54 ULSTER
Ulster Fire #5 FD181 1,574,561.00 733,800,890.00 2.145761 Ulster Fire #5 Bond FD185 0.00 622,715,439.00 0.000000 Ruby Fire FD182 180,500.00 79,085,039.00 2.282353 East Kingston Fire Prot. FD183 198,395.00 97,165,601.00 2.041823
Bloomington Fire FD149 433,000.00 Rosendale 152,675,095.00 100.00% 152,675,095 81.143687% 351,352.16 2.301306Ulster 24,125,658.00 68.00% 35,478,909 18.856313% 81,647.84 3.384274
=======================================188,154,004 100.000000% 433,000.00
Ulster Fire #1 FD186 287,085.00 139,129,387.00 2.063439 Town Library LB181 322,695.00 1,070,548,791.00 0.301430 East Kingston Light LT181 8,664.00 6,812,335.00 1.271811 Albany Avenue Light LT182 35,238.00 149,600,237.00 0.235548 Whittier Light LT183 6,232.00 15,552,624.00 0.400704 Krauss Light LT184 11,456.00 11,916,586.00 0.961349 Elem Hghts Light LT185 3,512.00 9,769,620.00 0.359482 Spring Lake Light LT186 2,811.00 6,897,663.00 0.407529 Ulster Sewer SW181 905,619.00 585,950,373.00 1.545556 Whittier Sewer SW182 161,370.00 31,595,956.00 5.107299 Washington Ave Sewer SW183 109,365.00 8,311,307.00 13.158580 Ulster Water WD181 696,793.00 609,060,322.00 1.144046 Halcyon Pk Water Units WD182 (FE) 56,995.00 163.00 349.662577 Spring Lake Water WD183 41,033.00 17,548,514.00 2.338261 Cherry Hill Water WD184 101,100.00 29,623,766.00 3.412800 Bright Acres Water WD185 67,900.00 15,408,627.00 4.406622 Glenerie Water WD186 143,100.00 25,681,122.00 5.572186 East Kingston Water District WD187 68,735.00 7,186,522.00 9.564432

Page 31
2021 Special District Tax Rates Column 1 Column 2 Column 3 Column 4 Column 5 Column 6 Column 7 Column 8 Column 9
Towns and Special Districts Special District Code
Amount to be Raised Towns in EQ District
Town Taxable Value (Units, Points, Move
Tax)
State Equalization
Rate
Equalized Value
% of Total Equalized
Value
Share of Amnt. to be Raised Tax Rate
56 WAWARSING Wawarsing Ambulance Dist. AD200 258,800.00 1,078,061,942.00 0.240060
Kerhonkson Fire FD191 (EQ DIST) 278,503.75 Rochester 71,654.00 100.00% 71,654 0.066503% 185.21 2.584824 Wawarsing 101,213,616.00 94.00% 107,674,060 99.933497% 278,318.54 2.749813
===================================== 107,745,714 100.000000% 278,503.75
Napanoch Fire FD192 490,600.00 587,202,010.00 0.835488 Ellenville Fire FD193 883,200.00 412,143,676.00 2.142942 Cragsmoor Fire FD194 119,367.00 78,985,503.00 1.511252 Spring Glen Light #1 LT191 7,000.00 12,303,757.00 0.568932 Napanoch Light LT192 35,000.00 69,298,049.00 0.505065 Kerhonkson Light LT193 20,000.00 35,911,143.00 0.556930 Spring Glen Light #2 LT194 2,000.00 5,900,757.00 0.338940 Mooney Light LT195 5,000.00 3,305,957.00 1.512421 Wawarsing Light LT196 9,000.00 21,385,207.00 0.420852 Napanoch O & M Sewer SW191 0.00 52,551,567.00 0.000000 Kerhonkson O & M Sewer SW192 136,155.00 33,692,197.00 4.041143 Napanoch Water WD191 187,794.00 84,227,289.00 2.229610 Kerhonkson Water WD192 89,920.00 29,401,200.00 3.058379
58 WOODSTOCK Woodstock Fire FD201 1,590,564.00 1,429,353,477.00 1.112786 Woodstock Library LB201 585,544.00 1,428,576,399.00 0.409879 Woodstock Light LT202 19,500.00 123,797,220.00 0.157516 Woodstock Gardens Light LT204 1,900.00 9,633,316.00 0.197232 Woodstock Water WD203 0.00 217,715,745.00 0.000000 On-Site Sewer System SW203 (MOVE TAX) 51,228.00 51,228.00 On-Site/Generic SW501 (FIXED EX) 0.00 0.00 0.000000 Hamlet Sewer District HS101 (UNITS) 0.00 10,973.00 0.000000 On-Site/Non Sys SW801 (UNITS) 0.00 19,351.00 0.000000

Page 32
2020-21 Rates 2019-20 Rates 2018-19 RatesEllenville CentralRochester 20.886490 21.671125 24.108967 Library 0.803871 0.845512 0.944035Wawarsing 22.219736 21.671189 21.385021 Library 0.855184 0.845515 0.837374Fallsburgh CentralWawarsing 24.425917 25.057202 24.084279 Library 0.521171 0.53464 0.513881Highland CentralEsopus 24.968132 24.287015 23.625656 Library 0.731322 0.733064 0.700887Lloyd 23.423777 23.072797 23.625761 Library 0.686088 0.696415 0.70089Marlboro 25.245555 24.287015 23.625656 Library 0.739448 0.733064 0.700887New Paltz 25.245555 24.287015 23.625656 Library 0.739448 0.733064 0.700887Plattekill 25.673446 24.034026 23.625656 Library 0.751981 0.725428 0.700887Kingston Consolidated Hmstd Non-Hmstd Hmstd Non-Hmstd Hmstd Non-HmstdEsopus 21.50762 28.06880 21.94670 28.88121 21.89269 28.99530 Library 0.00961 0.01254 0.00998 0.01313 0.01010 0.01338Hurley 20.39359 25.66699 20.92992 27.46154 21.90569 28.98668 Library 0.00912 0.01183 0.00952 0.01251 0.01011 0.01337Kingston 24.03353 32.46829 23.91711 32.47154 24.45139 31.63874 Library 0.01074 0.01449 0.01088 0.01476 0.01127 0.01460Marbletown 19.07351 25.09772 20.3059 26.93503 21.32349 28.35427 Library 0.00867 0.00000 0.00883 0.02285 0.01012 0.02276New Paltz 21.55744 38.04542 21.74032 38.63475 21.68577 38.88808 Library 0.00972 0.01521 0.00971 0.01894 0.01020 0.01906Rosendale 19.67563 25.21778 20.91797 26.95321 22.02571 28.51468 Library 0.00880 0.01126 0.00952 0.01226 0.01016 0.01316Saugerties 20.88115 26.15371 21.12621 26.71117 22.23372 28.22081 Library 0.00931 0.01186 0.00961 0.01185 0.01029 0.01321Ulster 28.61543 39.14055 28.43302 39.14549 27.83384 38.49046 Library 0.01280 0.01749 0.01294 0.01780 0.01285 0.01775Woodstock 22.50326 29.07448 22.40233 29.09838 22.94013 30.01760 Library 0.01007 0.01298 0.01019 0.01325 0.01058 0.01386City of Kingston 21.56953 31.60971 20.69254 30.10048 21.79352 31.61718 Library 0.00964 0.01412 0.00942 0.01370 0.01006 0.01463Livingston ManorHardenburgh 27.532244 28.719295 27.048824 Library 0.443252 0.474128 0.426950Margaretville CentralHardenburgh 14.706242 15.911694 14.929797Shandaken 36.304113 36.191304 35.714416Marlboro CentralMarlborough 29.097990 29.675249 27.736820 Library 0.752261 0.783084 0.732670Plattekill 29.591115 29.271102 27.736820 Library 0.765011 0.772441 0.732670
School District Tax Rates

Page 33
2020-21 Rates 2019-20 Rates 2018-19 RatesNew Paltz CentralEsopus 23.344143 23.196211 22.308078 Library 0.004100 0.004164 0.004164Gardiner 22.599117 22.036400 22.308078 Library 0.003970 0.003956 0.004164Lloyd 21.900175 22.036400 22.308078 Library 0.003847 0.003956 0.004164New Paltz 23.603614 23.196302 22.308167 Library 0.004146 0.004164 0.004164Plattekill 24.003582 22.954584 22.308078 Library 0.004216 0.004121 0.004164Rochester 21.243170 22.036400 23.858907 Library 0.003731 0.003956 0.004453Rosendale 21.243170 22.036400 22.308078 Library 0.003731 0.003956 0.004164Onteora CentralHurley 12.043843 11.923988 11.779389 Library 0.005386 0.005470 0.005534Lexington 11.622308 11.923988 11.779389 Library 0.005198 0.005470 0.005534Marbletown 11.622308 11.923988 11.779389 Library 0.005198 0.005470 0.005535Olive 11.739705 11.924002 11.894783 Library 0.005250 0.005470 0.005589Shandaken 48.628904 46.760736 46.193684 Library 0.021748 0.021450 0.021704Woodstock 13.514312 12.925732 12.464980 Library 0.006044 0.005929 0.005857Pine Bush CentralGardiner 23.001470 22.742380 23.455570Shawangunk 113.798630 117.230720 111.695070Rondout Valley CentralMarbletown 17.228981 17.563983 17.405234Rochester 17.229043 17.564049 18.615305Rosendale 17.228930 17.563926 17.405177Wawarsing 18.328649 17.563926 16.511884Saugerties CentralSaugerties 20.053214 19.749627 19.901041Ulster 28.016087 27.054796 25.352745Woodstock 22.151715 21.408687 21.059178Tri-Valley CentralDenning 109.421872 114.818185 115.966618 Library 2.290244 2.403191 2.426831Rochester 17.507499 18.370910 19.844555 Library 0.366439 0.384511 0.415287Wawarsing 18.624999 18.370910 17.602371 Library 0.389829 0.384511 0.368364Valley CentralShawangunk 111.549829 113.785530 111.196101Wallkill CentralGardiner 26.137544 25.660948 26.618758Plattekill 27.761911 26.730155 26.618758Shawangunk 129.312058 132.27293 126.757989
School District Tax Rates

Page 34
Market Equalization Estimated General General Highway Highway Combined TotalTown Value Rate Assessment Tax Rate Tax Bill Tax Rate Tax Bill Tax Rate Tax BillRochester 200,000 100.00% 200,000 0.674225 134.85$ 1.440922 288.18$ 2.11515 423.03$ Marbletown 200,000 100.00% 200,000 0.727346 145.47$ 1.402905 280.58$ 2.13025 426.05$ Gardiner 200,000 94.00% 188,000 1.014002 190.63$ 1.419070 266.79$ 2.43307 457.42$ Hurley 200,000 96.50% 193,000 1.039949 200.71$ 1.715390 331.07$ 2.75534 531.78$ Olive 200,000 99.00% 198,000 1.743774 345.27$ 1.633867 323.51$ 3.37764 668.77$ Plattekill 200,000 88.50% 177,000 1.757704 311.11$ 2.061938 364.96$ 3.81964 676.08$ Esopus 200,000 91.00% 182,000 1.463978 266.44$ 2.307332 419.93$ 3.77131 686.38$ Shawangunk 200,000 19.00% 38,000 8.308050 315.71$ 10.224931 388.55$ 18.53298 704.25$ Woodstock 200,000 86.00% 172,000 3.046221 523.95$ 1.487768 255.90$ 4.53399 779.85$ Lloyd 200,000 97.00% 194,000 3.557999 690.25$ 1.715029 332.72$ 5.27303 1,022.97$ Wawarsing 200,000 94.00% 188,000 2.345980 441.04$ 3.370193 633.60$ 5.71617 1,074.64$ Rosendale 200,000 100.00% 200,000 3.381449 676.29$ 2.083360 416.67$ 5.46481 1,092.96$ Denning 200,000 16.00% 32,000 8.133405 260.27$ 27.478038 879.30$ 35.61144 1,139.57$ Shandaken 200,000 23.90% 47,800 13.950049 666.81$ 10.268320 490.83$ 24.21837 1,157.64$ Hardenburgh 200,000 59.00% 118,000 2.930888 345.84$ 6.975827 823.15$ 9.90672 1,168.99$ Saugerties 200,000 95.00% 190,000 4.234424 804.54$ 2.040065 387.61$ 6.27449 1,192.15$ Ulster 200,000 68.00% 136,000 6.354916 864.27$ 2.854136 388.16$ 9.20905 1,252.43$ Kingston (town) 200,000 81.00% 162,000 4.578795 741.76$ 4.080708 661.07$ 8.65950 1,402.84$ Marlborough 200,000 90.00% 180,000 5.351507 963.27$ 2.944523 530.01$ 8.29603 1,493.29$ New Paltz 200,000 90.00% 180,000 7.388821 1,329.99$ 2.041287 367.43$ 9.43011 1,697.42$
Average Tax Bill $510.92 $441.50 $952.42
Tax bill comparison is based on an example property in each town with an equalized 2020 assessed value, or market value, of 200,000.
2021 Town Tax Bill Comparison

Page 35

Page 36
School and County Tax Apportionment An explanation of the apportionment process and the effect of changes in total taxable value on the apportionment of property taxes between towns sharing a common school or county tax levy.
In an individual town, if assessments are unchanged from the prior year, property tax bill amounts will rise or fall according to the percentage of increase or decrease in the budget amount to be raised by taxes (tax levy).
However, when a taxing jurisdiction is shared among towns, taxes are distributed by the apportionment of the percentage of total taxable value that each town represents of the whole taxing jurisdiction. As an example:
Town A’s value is 20,000,000
Town B’s value is 40,000,000
Town C’s value is 10,000,000
Total combined value is 70,000,000
Therefore, Town A is apportioned 28.57% of the tax levy;
Town B is apportioned 57.14% and
Town C is apportioned 14.29%.
The apportionment percentages vary from year to year, as the total taxable value of each town changes due to new construction, demolition and equalization rate adjustments to reflect differing market values. As an example, the following apportionments are shown for the same towns in the following year, after changes occur to their total taxable values:
Town A’s value is 19,500,000 (major loss due to fire reduces full value)
Town B’s value is 40,500,000 (new construction increases full value)
Town C’s value is 9,900,000 (equalization rate change reduces full value)
Total value is 69,900,000
Therefore, Town A is apportioned 27.90% of the tax levy;
Town B is apportioned 57.94% and
Town C is apportioned 14.16%.
The apportionment of shared tax levies is a major component of the calculation of tax rates.

Page 37
Towns/City 2012 2013 2014 2015 2016 2017 2018 2019 2020 2021Denning 0.8% 0.8% 0.8% 0.8% 0.9% 0.9% 0.9% 0.9% 0.9% 0.8%Esopus 4.6% 4.5% 4.5% 4.5% 4.5% 4.5% 4.4% 4.3% 4.4% 4.3%Gardiner 4.4% 4.4% 4.4% 4.4% 4.4% 4.4% 4.6% 4.5% 4.5% 4.5%
Hardenburgh 0.9% 0.9% 0.9% 1.0% 0.9% 0.9% 0.9% 0.9% 0.9% 0.8%Hurley 4.6% 4.3% 4.5% 4.7% 4.6% 4.5% 4.5% 4.4% 4.3% 4.2%Kingston (town) 0.5% 0.5% 0.5% 0.4% 0.5% 0.5% 0.5% 0.5% 0.5% 0.5%
Kingston (city) 8.5% 8.4% 8.0% 7.8% 7.8% 7.8% 7.9% 8.1% 8.4% 8.8%Lloyd 5.7% 5.6% 5.7% 5.7% 5.7% 5.7% 5.7% 5.6% 5.5% 5.4%Marbletown 4.7% 5.0% 5.1% 5.2% 5.2% 5.2% 5.2% 5.0% 4.8% 5.0%
Marlborough 4.1% 4.2% 4.0% 4.0% 4.1% 4.1% 4.1% 4.0% 4.0% 4.1%New Paltz 6.3% 6.4% 6.4% 6.4% 6.3% 6.4% 6.4% 6.2% 6.3% 6.3%Olive 6.3% 6.5% 6.7% 6.7% 6.7% 6.7% 6.7% 6.6% 6.3% 6.0%
Plattekill 3.6% 3.7% 3.8% 3.7% 3.7% 3.7% 3.6% 3.6% 3.6% 3.7%Rochester 4.1% 4.2% 4.3% 4.3% 4.3% 4.3% 4.5% 4.6% 4.5% 4.5%Rosendale 2.8% 2.7% 2.7% 2.7% 2.7% 2.7% 2.7% 2.7% 2.7% 2.7%
Saugerties 9.7% 9.7% 9.5% 9.4% 9.4% 9.4% 9.5% 9.6% 9.5% 9.4%Shandaken 3.6% 3.6% 3.5% 3.5% 3.6% 3.6% 3.7% 3.6% 3.4% 3.5%Shawangunk 4.9% 4.8% 4.6% 4.6% 4.6% 4.6% 4.7% 4.8% 5.0% 4.8%
Ulster 6.7% 7.0% 7.0% 7.0% 6.9% 7.0% 6.6% 6.7% 6.9% 6.9%Wawarsing 6.1% 5.9% 5.9% 5.9% 5.9% 5.8% 5.7% 5.8% 5.9% 5.9%Woodstock 7.2% 6.9% 7.2% 7.3% 7.4% 7.4% 7.5% 7.7% 7.7% 7.9%
Total 100%
County Tax Levy Ten Year Apportionment Comparison

Page 38
County-Wide Comparison of Total Tax Levies2020-2021 School 403,609,168 65.25%
2021 County 76,248,341 12.33%2021 Town 85,774,027 13.87%2021 Special District 34,269,780 5.54%2021 City 18,635,776 3.01%
Total 618,537,092 100.00%
65%12%
14%
6% 3%
2021 Tax Levy Comparison
0
50,000,000
100,000,000
150,000,000
200,000,000
250,000,000
300,000,000
350,000,000
400,000,000
450,000,000
School Town City
Dol
lars

Page 39
Combined Tax Rates and Effective Tax Rates
The variables used to calculate tax rates include assessed value,
total taxable value, equalizat ion rates, apportionment value and tax levy
amounts. The chart on Page 40 shows the combined county, town and
school tax rates, expressed as a rate per $1,000 of assessed value, as
well as a rate per $1,000 of market value.
Property taxes can also be est imated by uti l iz ing the Effective Tax Rate , which expresses the amount of taxes as a percentage of market
value. A combined total Effective Tax Rate of 3.0% applied to a property
with a market value of $100,000 results in est imated property taxes of
$3,000. Effective Tax Rates do not include special district taxes such as a
fire or water distr ict.
The chart on Page 41 shows the Effective Tax Rate for each
municipal ity in Ulster County and can be used as a simple method of
estimating property taxes. An over-assessment wil l result in a higher tax
bil l and an under- assessment will result in a lower tax bi l l than
determined by using the Effective Tax Rate.

Page 40
Tax Rates per Thousand Town/County School Unequalized Equalized or Full Value Rate Equalization Equalization Town/City Town Tot. Town Primary Combined Town Town Tot. Town Primary Combined
MUNICIPALITY Rate Rate County General H'way & County School Total County General H'way & County School Total
Denning 16.00% 16.00% $23.13 $8.13 27.48$ $58.74 $111.71 $170.45 $3.70 $1.30 $4.40 $9.40 $17.87 $27.27 Esopus 91.00% 91.00% $4.12 $1.46 $2.31 $7.89 $21.52 $29.41 $3.75 $1.33 $2.10 $7.18 $19.58 $26.76 Gardiner 94.00% 94.00% $3.97 $1.01 $1.42 $6.40 $22.60 $29.00 $3.73 $0.95 $1.33 $6.02 $21.25 $27.26
Hardenburgh 59.00% 59.00% $6.26 $2.93 $6.98 $16.16 $27.98 $44.14 $3.69 $1.73 $4.12 $9.54 $16.51 $26.04 Hurley 96.50% 96.50% $3.89 $1.04 $1.72 $6.64 $20.40 $27.04 $3.75 $1.00 $1.66 $6.41 $19.69 $26.10 Kingston 81.00% 81.00% $4.61 $4.58 $4.08 $13.27 $24.04 $37.31 $3.73 $3.71 $3.31 $10.75 $19.48 $30.22
Kingston (c) 90.00% 90.00% $4.14 $8.98 $0.00 $13.13 $21.58 $34.70 $3.73 $8.09 $0.00 $11.81 $19.42 $31.23 Lloyd 97.00% 97.00% $3.86 $3.56 $1.72 $9.14 $24.11 $33.24 $3.75 $3.45 $1.66 $8.86 $23.39 $32.25 Marbletown 100.00% 100.00% $3.73 $0.73 $1.40 $5.86 $17.23 $23.09 $3.73 $0.73 $1.40 $5.86 $17.23 $23.09
Marlborough 90.00% 90.00% $4.20 $5.35 $2.94 $12.49 $29.85 $42.34 $3.78 $4.82 $2.65 $11.24 $26.87 $38.11 New Paltz 90.00% 90.00% $4.14 $7.39 $2.04 $13.57 $23.61 $37.18 $3.73 $6.65 $1.84 $12.21 $21.25 $33.46 Olive 99.00% 99.00% $3.75 $1.74 $1.63 $7.13 $11.74 $18.87 $3.71 $1.73 $1.62 $7.05 $11.63 $18.68
Plattekill 88.50% 88.50% $4.27 $1.76 $2.06 $8.09 $27.76 $35.85 $3.78 $1.56 $1.82 $7.16 $24.57 $31.73 Rochester 100.00% 100.00% $3.73 $0.67 $1.44 $5.84 $17.23 $23.07 $3.73 $0.67 $1.44 $5.84 $17.23 $23.07 Rosendale 100.00% 100.00% $3.75 $3.38 $2.08 $9.21 $17.23 $26.44 $3.75 $3.38 $2.08 $9.21 $17.23 $26.44
Saugerties 95.00% 95.00% $3.96 $4.23 $2.04 $10.23 $20.05 $30.29 $3.76 $4.02 $1.94 $9.72 $19.05 $28.77 Shandaken 23.90% 23.90% $15.52 $13.95 $10.27 $39.74 $48.65 $88.39 $3.71 $3.33 $2.45 $9.50 $11.63 $21.12 Shawangunk 19.00% 19.00% $19.93 $8.31 $10.22 $38.46 $129.31 $167.77 $3.79 $1.58 $1.94 $7.31 $24.57 $31.88
Ulster 68.00% 68.00% $5.48 $6.35 $2.85 $14.69 $28.63 $43.32 $3.73 $4.32 $1.94 $9.99 $19.47 $29.46 Wawarsing 94.00% 94.00% $3.95 $2.35 $3.37 $9.67 $23.07 $32.74 $3.71 $2.21 $3.17 $9.09 $21.69 $30.78 Woodstock 86.00% 86.00% $4.32 $3.05 $1.49 $8.85 $13.52 $22.37 $3.71 $2.62 $1.28 $7.61 $11.63 $19.24
COUNTY Average 79.90% 79.90% $6.41 $4.33 $4.26 $15.01 $32.47 $47.48 $3.74 $2.82 $2.10 $8.66 $19.11 $27.76 Maximum 100.00% 100.00% $23.13 $13.95 $27.48 $58.74 $129.31 $170.45 $3.79 $8.09 $4.40 $12.21 $26.87 $38.11 Minimum 16.00% 16.00% $3.73 $0.67 $0.00 $5.84 $11.74 $18.87 $3.69 $0.67 $0.00 $5.84 $11.63 $18.68
Source: Ulster County Real Property Tax Service AgencyPrimary school rates are those rates from the major school district within that town. Please verify your school district tax rate on the charts on Page 32 & 33. To use this chart for Unequalized: Assessed Value / 1,000 X Combined Total Tax Rate = Estimated Amount of TaxesTo use this chart for Equalized Full Value: Market value / 1,000 X Combined Total Tax Rate = Estimated Amount of TaxesSpecial District rates are not included in these totals Homestead Tax Rate used for Kingston City General
Combined Property Tax RatesMunicipal & County (FY 2021) - School (FY2020-2021)

Page 41
Taxes as a Percent of Combined Total Taxes of Property Value - "Effective Tax Rate"
Town/City Town Primary Town Town Primary
MUNICIPALITY County General H'way School County General H'way School Total
Denning 13.57% 4.77% 16.12% 65.54% 0.37% 0.13% 0.44% 1.79% 2.73% Esopus 14.01% 4.98% 7.85% 73.17% 0.37% 0.13% 0.21% 1.96% 2.68% Gardiner 13.68% 3.50% 4.89% 77.93% 0.37% 0.10% 0.13% 2.12% 2.73%
Hardenburgh 14.18% 6.64% 15.80% 63.38% 0.37% 0.17% 0.41% 1.65% 2.60% Hurley 14.37% 3.85% 6.34% 75.44% 0.38% 0.10% 0.17% 1.97% 2.61% Kingston 12.35% 12.27% 10.94% 64.44% 0.37% 0.37% 0.33% 1.95% 3.02%
Kingston (c) 11.93% 25.89% - 62.18% 0.37% 0.81% 0.00% 1.94% 3.12% Lloyd 11.62% 10.70% 5.16% 72.52% 0.37% 0.35% 0.17% 2.34% 3.22% Marbletown 16.15% 3.15% 6.08% 74.62% 0.37% 0.07% 0.14% 1.72% 2.31%
Marlborough 9.91% 12.64% 6.95% 70.50% 0.38% 0.48% 0.27% 2.69% 3.81% New Paltz 11.14% 19.87% 5.49% 63.50% 0.37% 0.66% 0.18% 2.12% 3.35% Olive 19.86% 9.24% 8.66% 62.24% 0.37% 0.17% 0.16% 1.16% 1.87%
Plattekill 11.92% 4.90% 5.75% 77.43% 0.38% 0.16% 0.18% 2.46% 3.17% Rochester 16.16% 2.92% 6.25% 74.68% 0.37% 0.07% 0.14% 1.72% 2.31% Rosendale 14.18% 12.79% 7.88% 65.15% 0.37% 0.34% 0.21% 1.72% 2.64%
Saugerties 13.07% 13.98% 6.74% 66.21% 0.38% 0.40% 0.19% 1.91% 2.88% Shandaken 17.56% 15.78% 11.62% 55.04% 0.37% 0.33% 0.25% 1.16% 2.11% Shawangunk 11.88% 4.95% 6.09% 77.08% 0.38% 0.16% 0.19% 2.46% 3.19%
Ulster 12.66% 14.67% 6.59% 66.08% 0.37% 0.43% 0.19% 1.95% 2.95% Wawarsing 12.07% 7.16% 10.29% 70.47% 0.37% 0.22% 0.32% 2.17% 3.08% Woodstock 19.29% 13.62% 6.65% 60.44% 0.37% 0.26% 0.13% 1.16% 1.92%
COUNTY Average 13.88% 9.92% 8.11% 68.48% 0.37% 0.28% 0.21% 1.91% 2.78% Maximum 19.86% 25.89% 16.12% 77.93% 0.38% 0.81% 0.44% 2.69% 3.81% Minimum 9.91% 2.92% 4.89% 55.04% 0.37% 0.07% 0.00% 1.16% 1.87%
Source: Ulster County Real Property Tax Service AgencyTo estimate property taxes, multiply the Market Value of a property times the Effective Tax RateHomestead Tax Rate used for Kingston City General
Effective Tax Rate AnalysisMunicipal & County (FY 2021) - School (FY 2020 - 2021)
Page 42
Common Exemptions
Veterans
Cold War Veterans Paraplegic
Aged (Senior Citizen) Grandparent’s Living Quarters
Physical Disabilities Agricultural
Horse Boarding Labor Camps Farm Building
Forest Land Fisher Forest
Business Investment Solar Wind
Clergy County Tax Sale
State Owned Exempt Wholly Exempt
Miscellaneous Exemptions
Summary descriptions of the above exemptions appear on the following pages

Page 43
Exemption Summaries
Veterans (Local Option) Section 458 of the Real Property Tax Law provides for an exemption of up to
$7,500 of assessed value for “eligible funds.” However, no new “eligible funds” exemption may be granted on or after March 2, 1986. Local Governments now have an option to increase the eligible funds exemption of veterans in direct proportion to the general increase in assessments throughout the community – what is referred to as the “Change in Level of Assessment.” Section 458-a of the Real Property Tax Law provides for a 15% exemption for duty during war time and 10% for combat duty in addition to one–half of the service–connected disability rating.
Cold War Veterans (Local Option) Section 458-b of the Real Property Tax Law provides for an exemption from real
property for qualified residential real property owned by Cold War veterans or certain members of their family based on a percentage of assessed value. This exemption was adopted by the Ulster County Legislators in 2008 and went into effect for the 2009 assessment roll.
Paraplegics (Mandatory) In addition to any exemption from taxation provided for in Section 458 1 and 2 of
the Real Property Tax Law, on real property which may be allowed to veterans, the primary residence of any seriously disabled veteran of World War I, World War II, the hostilities that began on January 1, 1950, or the hostilities that began January 1, 1963, who has received pecuniary assistance toward the acquisition of a suitable housing unit with special fixtures or moveable facilities made necessary by the veteran’s disability, and the necessary land thereof, shall be fully exempt from taxation. The same exemption may also be allowed on such housing units owned by the un – remarried surviving spouse of such veteran or by such veteran and spouse while occupying said premises as a residence. If an exemption has already been granted pursuant to the provisions of such foregoing subdivisions, application for a further exemption as herein provided may be made and action taken thereon in the same manner as set forth in Subdivision 1 of this Section.
Aged (Local Option) New York State Law (section 467 of the Real Property Tax Law) gives local
governments and public school districts the option of granting a reduction on the amount of property taxes paid by qualifying senior citizens. This is accomplished by reducing the assessed value of RESIDENTIAL property owned by seniors by 50%. To qualify, seniors must be 65 years of age or older and meet certain income limitations and other requirements. For the 50% exemption, the law allows each county, city, town, village, or school district to set the maximum income limit at any figure between $3,000 and $29,000. Localities have the further option of granting an exemption of less than 50% to senior citizens whose income exceeds $29,000. Under this option, called the “sliding-scale” option, a qualifying owner can have a yearly income as high as $37,400 and get a 5% exemption in places that are using the maximum limit. Please check with your local assessor or clerk of the local government and school district to determine which local options are in effect.

Page 44
Grandparents Living Quarters (Local Option) New York State Law (Section 469 of the Real Property Tax Law) gives local
governments and public school districts the option of granting an exemption for the increase in value to residential property for the construction or reconstruction of living quarters for a parent or grandparent who is at least 62 years of age.
Disability (Local Option) New York State Law (Section 459-C of the Real Property Tax Law) gives local
governments and public school districts the option of granting a reduction in the amount of property taxes paid by qualifying persons with disabilities. To qualify, persons with disabilities generally must have certain documented evidence of their disability and meet certain income limitations and other requirements. They also must file the exemption application with their local assessor by the appropriate filing date. The basic exemption is a 50% reduction in the assessed value of the legal residence of the qualifying disabled person. For the basic exemption, the law allows each county, city, town, village, or school district to set the maximum income limit at any figure between $3,000 and $29,000.
Localities have the further option of giving exemption of less than 50% to persons with qualifying disabilities whose incomes are more than $29,000. Under this option, called the “sliding-scale” option, a qualifying owner can have a yearly income as high as $37,400 and get a 5% exemption in places that are using the maximum limit. Check with Real Property or your local assessor to determine which local options, if any, are in effect.
Agriculture (Mandatory) The portion of the value of land utilized for agricultural production within an
agricultural district which represents an excess above the agricultural value ceiling as determined in accordance with Section 305 of the Agricultural and Markets Law shall not be subject to real property taxation. Such excess amount shall be exempt from taxation.
Horse Boarding (Mandatory) Subject to the approval of the county legislative body, land used in the preceding
two years to support a commercial horse boarding operation may qualify for an agricultural assessment. To be eligible the land must consist of at least 10 acres and the commercial horse boarding operation which the land supports must be boarding at least 10 horses regardless of ownership with annual gross receipts of $10,000 or more in each of the preceding two years generated through fees from the boarding of horses, through production for sale of crops, livestock or livestock products, or a combination of both. Fees from riding lessons, horse training, and other similar activities cannot be included when calculating whether the operation has generated at least $10,000 in annual gross receipts. Additionally, the statute now explicitly states that operations whose primary on site function is horse racing are not included within the definition of commercial horse boarding operation.

Page 45
Labor Camps (Mandatory) Certain farm or food labor camps and commissaries, and any other structures
used to improve the health, living and working conditions for farm laborers are exempt from taxation, special ad valorem levies, and special assessments. RPTL Section 483-d.
Farm Building (Mandatory) Provides for the exemption on new structures and building essential to the
operation of lands actively devoted to agricultural or horticultural use and actually used and occupied to carry out such operation as outlined in the Real Property Tax Law, Section 483.
Forest Lands (Mandatory) Section 480 – A provides for an exemption for eligible tracts of forest land that
may be granted an exemption from taxation. “Eligible tract” means a privately owned forest land or tract of forest land which is owned by a municipal corporation and which was first certified as an eligible tract by the department pursuant to this section no later than May 1979 and was found to be eligible for exemption pursuant to this section on the basis of application filed no later than such date and in the case of both privately owned and municipally owned forest is a tract which comprises at least 50 contiguous acres, exclusive of any portion thereof not devoted to the production of forest crops. Land divided by state, county or town roads, energy transmission corridors, and similar facilities, but not limited access highways, will be considered contiguous for the purposes of this section.
Fisher Forest (Mandatory) Replaced by Forest Land Exemption Section 480 – A, effective September 1,
1974. Few parcels still remain as exemptions under this former section of law. Business Investment (Local Option) Section 485–b of the Real Property Tax Law authorizes a partial exemption from
real property taxation for commercial, business, and industrial real property constructed, altered, installed, or improved subsequent to July 1, 1976 where the construction, alteration, installation, or improvement was commenced subsequent to January 1, 1976. The cost of such construction, alteration, installation, or improvement must exceed the sum of $10,000. Ordinary maintenance and repairs are not included. The exemption continues over a period of ten years with an exemption of 50% of the increase in assessed value the first year, and decreasing 5% each year thereafter. Unless reduced as prescribed below, the exemption applies to charges imposed on upon the real property by or on behalf of a county, city, town, village, or school district for municipal or school district purposes and to special ad valorem levies and service charges. The statute authorizes any county, city, town, village, or school district to act independently on its own behalf to reduce the percentage of exemption otherwise allowed pursuant to this section. The exemption does not apply to costs incurred for ordinary maintenance and repairs, or to property used primarily for residential purposes other than hotels and motels.

Page 46
Solar Wind (Mandatory) The intent of the legislation providing the real property tax exemption is to
encourage the use of alternate energy sources: solar and wind. By providing tax exemptions for these systems, property owners installing them will be assured of no penalty in the form of increased real property assessment based upon their system’s value. At the outset, it should be noted that the exemption prohibits any increase in assessed value attributable to the solar or wind energy system. The purchase cost of the system is not the basis for exemption. The possible increased value resulting from installing such a system is the determining factor.
The basic definitions are distinct from the guidelines. The definitions identify solar and wind systems that qualify for exemption. The guidelines suggest the interpretation of these definitions for use by the homeowner and assessor.
Clergy (Mandatory) Real property owned by a minister of the gospel, priest, or rabbi of any
denomination, an actual resident and inhabitant of this state, who is engaged in the work assigned to him by the church of denomination of which he or she is a member, or who is unable to perform such work due to impaired health or is over seventy years of age, and real property owned by his unremarried surviving spouse while an actual resident and inhabitant of this state, shall be exempt from taxation to the extent of $1,500 pursuant to Section 460 of the Real Property Tax Law.
County Tax Sale (Mandatory) Real property owned by a municipal corporation acquired by a tax deed, by
Referee’s deed in tax foreclosure, pursuant to Article 11 of Section 406 of the Real Property Tax Law or pursuant to a deed made in lieu of tax foreclosure shall be deemed to be held by it for public use for a period of three years from the date of the deed and during such period shall be exempt from taxation and special ad valorem levies but shall be liable for taxes to school purposes and special assessments. Any such property from which a municipal corporation is receiving revenue on the date of taxable status, however, shall not be so exempt.
State – Owned (Mandatory) Real property owned by the State of New York or any of its departments or
agencies is wholly exempt from taxation pursuant to Real Property Tax Law Sections 402, 404, 490, 532, 534, 536, 542, and 545. This category includes Cultural Resources, Higher Education, Medical Care facilities, State and Local Police, Housing Finance Agencies and subsidiaries, etc.
Wholly Exempt Property Defined under Section 420 – A and Section 420 – B of the Real Property Tax
Law. This category includes exemptions on properties owned by municipalities, schools, religious organizations, hospitals, charities, etc.
Miscellaneous Exemptions Municipal Housing Authorities, Temporary Greenhouses, Conservation
Easements, Redevelopment Housing, and Condo Exemptions, Volunteer Firefighters and First Time Homebuyers.

Page 47
Disabled Veteran War Veteran Combat Zone Veteran %Assessed=to 1/2 of
SWIS Town 15% Assessed to Max 10% Assessed to Max serv con dis rating510800 Kingston, City 24,000.00 16,000.00 80,000.00 512000 Denning 12,000.00 8,000.00 40,000.00 512200 Esopus 18,000.00 12,000.00 60,000.00 512400 Gardiner 27,000.00 18,000.00 90,000.00 512600 Hardenburgh no exemption no exemption no exemption512800 Hurley 21,000.00 14,000.00 70,000.00 513000 Kingston, Town 27,000.00 18,000.00 90,000.00 513200 Lloyd 45,000.00 30,000.00 150,000.00 513400 Marbletown 27,000.00 18,000.00 90,000.00 513600 Marlborough 27,000.00 18,000.00 90,000.00 513800 New Paltz 36,000.00 24,000.00 120,000.00 514000 Olive 27,000.00 18,000.00 90,000.00 514200 Plattekill 24,000.00 16,000.00 80,000.00 514400 Rochester 36,000.00 24,000.00 120,000.00 514600 Rosendale 36,000.00 24,000.00 120,000.00 514800 Saugerties 27,000.00 18,000.00 90,000.00 515000 Shandaken 27,000.00 18,000.00 90,000.00 515200 Shawangunk 12,000.00 8,000.00 40,000.00 515400 Ulster 27,000.00 18,000.00 90,000.00 515600 Wawarsing 12,000.00 8,000.00 40,000.00 515800 Woodstock 27,000.00 18,000.00 90,000.00
510000 Ulster County 45,000.00 30,000.00 150,000.00
District War Veteran Combat Zone Veteran Disabled Veteran
Ellenville 12,000 8,000 40,000Fallsburgh 12,000 8,000 40,000Highland 12,000 8,000 40,000Kingston Cons. 12,000 8,000 40,000Livingston Manor 12,000 8,000 40,000Margaretville no exemption no exemption no exemptionMarlboro 27,000 18,000 90,000New Paltz 12,000 8,000 40,000Onteora 12,000 8,000 40,000Pine Bush 12,000 8,000 40,000Rondout Valley 12,000 8,000 40,000Saugerties 12,000 8,000 40,000Tri-Valley 12,000 8,000 40,000Valley Central 12,000 8,000 40,000Wallkill 12,000 8,000 40,000
Alternative Veterans Exemption (RPTL458a)(As of January, 2021)
School Districts

Page 48
SWIS Town 10% Option 15% Option Disability510800 City of Kingston 8,000 40,000512000 Denning 8,000 40,000512200 Esopus 45,000512400 Gardiner 12,000 40,000512600 Hardenburgh512800 Hurley 12,000 40,000513000 Town of Kingston 12,000 40,000513200 Lloyd 45,000 150,000513400 Marbletown513600 Marlborough 12,000 40,000513800 New Paltz514000 Olive514200 Plattekill 12,000 40,000514400 Rochester 12,000 40,000514600 Rosendale 36,000 120,000514800 Saugerties 8,000 40,000515000 Shandaken 10,000 50,000515200 Shawangunk515400 Ulster 12,000 40,000515600 Wawarsing515800 Woodstock 12,000 40,000
510000 Ulster County 45,000 150,000
Cold War Veterans(RPTL 458-b)(as of January, 2021)

Page 49
SWIS Town Amount 50% Sliding Scale
510800 Kingston, City* $20,000 $28,399/5%512000 Denning* $12,025 $17,724.99/20%512200 Esopus* $16,000 $21,699.99/20%512400 Gardiner* $26,000 $34,399.99/5%512600 Hardenburgh $8,500 none512800 Hurley* $15,000 $20,699.99/20%513000 Kingston, Town* $15,000 $20,699.99/20%513200 Lloyd* $29,000 $37,399.99/5%513400 Marbletown * $29,000 $37,399.99/5%513600 Marlborough* $21,000 $29,399.99/5%513800 New Paltz* $21,500 $29,899.99/5%514000 Olive* $24,000 $32,399.99/5%514200 Plattekill * $28,000 $36,399.99/5%514400 Rochester * $29,000 $37,399.99/5%514600 Rosendale* $29,000 $37,399.99/5%514889 Saugerties* $29,000 $37,399.99/5%514801 Village of Saugerties* $21,500 $29,899.99/5%515000 Shandaken* $24,000 $32,399.99/5%515200 Shawangunk* $17,500 $24,999.99/10%515400 Ulster* $24,000 $32,399.99/5%515600 Wawarsing* $17,500 $24,999.99/10%515800 Woodstock * $29,000 $37,399.99/5%510000 Ulster County * $29,000 $37,399.99/5%
District Amount 50% District Amount 50%
Ellenville* $29,000 $37,399.99/5% Onteora * $29,000 $37,399.99/5%Fallsburgh* $17,500 $23,199.99/20% Pine Bush* $29,000 $37,399.99/5%Highland* $29,000 $37,399.99/5% Rondout Valley* $19,500 $27,899.99/5%Kingston Cons.* $20,000 $25,699.99/20% Saugerties* $21,500 $29,899.99/5%Livingston Manor* $17,500 $23,199.99/20% Tri - Valley* $17,500 $23,199.99/20%Margaretville* $10,600 $16,299.99/20% Valley Central* $16,500 $23,999.99 10%Marlboro* $29,000 $37,399.99/5% Wallkill* $22,749 $31,148.99/5%New Paltz* $29,000 $37,399.99/5%
Aged (Senior Citizen) Exemption
NOTE: * Indicates Sliding Scale Option
School Districts
Maximum Income Allowed For Senior Exemption(As of January, 2021)

Page 50
SWIS Town Amount 50% 5%
510800 Kingston, City No exemption512000 Denning No exemption512200 Esopus No exemption512400 Gardiner No exemption512600 Hardenburgh No exemption512800 Hurley* $15,000 $23,399.99513000 Kingston, Town No exemption513200 Lloyd No exemption513400 Marbletown * $29,000 $37,399.99513600 Marlborough No exemption513800 New Paltz* $17,500 $24,999.99/10%514000 Olive No exemption514200 Plattekill * $28,000 $36,399.99514400 Rochester * $29,000 $37,399.99514600 Rosendale* $29,000 $37,399.99514889 Saugerties $29,000 $37,399.99514801 Village of Saugerties* $21,500 $29,899.99515000 Shandaken* $24,000 $32,399.99515200 Shawangunk No exemption515400 Ulster* $15,000 $23,399.99515600 Wawarsing No exemption515800 Woodstock * $29,000 $37,399.99
510000 Ulster County * $29,000 $37,399.99
District Amount 50% -5% District Amount 50% -5%
Ellenville No exemption Onteora * $29,000/$37,399.99Fallsburgh No exemption Pine Bush No exemptionHighland No exemption Rondout Valley No exemptionKingston Cons. No exemption Saugerties* $21,500/$29,899.99Livingston Manor No exemption Tri - Valley No exemptionMargaretville No exemption Valley Central No exemptionMarlboro* $29,000/$37,399.99 Wallkill No exemptionNew Paltz* $29,000/$37,399.99
(As of January 2021)
School Districts
NOTE: * Indicates Sliding Scale Option
Disability Exemption (RPTL459c)
Maximum Income Allowed

Page 51
Disabilities
County Tax Exemption Revenue Revenue Revenue Revenue Revenue
Town Rate Value Foregone Value Foregone Value Foregone Value Foregone Value Foregone
Denning 23.129544 116,932 2,705$ 0 -$ 126,236 2,920$ 0 -$ 0 -$
Esopus 4.119639 13,713,707 56,496$ 254,140 1,047$ 4,085,320 16,830$ 0 -$ 175,716 724$
Gardiner 3.966559 10,262,396 40,706$ 0 -$ 7,628,429 30,259$ 206,347 818$ 177,563 704$
Hardenburgh 6.257435 187,212 1,171$ 0 -$ 61,500 385$ 0 -$ 48,525 304$
Hurley 3.886661 14,561,393 56,595$ 0 -$ 14,563,271 56,602$ 0 -$ 637,675 2,478$
Kingston, Town 4.610020 1,028,675 4,742$ 0 -$ 1,034,170 4,768$ 0 -$ 0 -$
Kingston, City 4.141662 18,687,639 77,398$ 0 -$ 17,247,428 71,433$ 0 -$ 1,190,823 4,932$
Lloyd 3.862046 17,754,565 68,569$ 0 -$ 10,386,398 40,113$ 0 -$ 568,940 2,197$
Marbletown 3.729503 12,178,930 45,421$ 341,000 1,272$ 14,701,855 54,831$ 390,600 1,457$ 522,100 1,947$
Marlborough 4.195323 18,168,409 76,222$ 0 -$ 6,740,981 28,281$ 0 -$ 640,403 2,687$
New Paltz 4.141626 13,215,648 54,734$ 367,000 1,520$ 7,318,512 30,311$ 0 -$ 688,324 2,851$
Olive 3.748082 8,409,607 31,520$ 0 -$ 16,244,089 60,884$ 0 -$ 1,053,938 3,950$
Plattekill 4.272614 17,192,666 73,458$ 0 -$ 8,437,346 36,050$ 0 -$ 934,250 3,992$
Rochester 3.727568 10,592,135 39,483$ 0 -$ 14,495,927 54,035$ 14,800 55$ 1,089,275 4,060$
Rosendale 3.749468 9,512,925 35,668$ 0 -$ 11,074,979 41,525$ 0 -$ 335,810 1,259$
Saugerties 3.958368 36,931,958 146,190$ 0 -$ 29,217,939 115,655$ 0 -$ 3,107,213 12,299$
Shandaken 15.519715 1,115,675 17,315$ 0 -$ 1,693,239 26,279$ 0 -$ 90,573 1,406$
Shawangunk 19.925641 5,039,269 100,411$ 0 -$ 2,260,179 45,036$ 0 -$ 166,900 3,326$
Ulster 5.484561 11,518,382 63,173$ 0 -$ 7,628,428 41,839$ 0 -$ 647,328 3,550$
Wawarsing 3.951764 9,178,503 36,271$ 0 -$ 10,773,232 42,573$ 0 -$ 671,850 2,655$
Woodstock 4.315732 9,942,508 42,909$ 0 -$ 19,857,196 85,698$ 30,000 129$ 1,401,635 6,049$
Totals: 239,309,134 1,071,159$ 962,140 3,839$ 205,576,654 886,304$ 641,747 2,460$ 14,148,841 61,371$
Exemption values represent the exempt portion of assessed valueRevenue Forgone is the dollar value of the impact of county property tax exemptions which is distributed to non-exempt owners
(Senior Citizen) Living Quarters
Grandparent'sVeterans
including Cold War Vets Paraplegic
Aged
Total Assessed Value of Exemptions and Total Revenue Forgone
For 2021 County Taxes
Physical
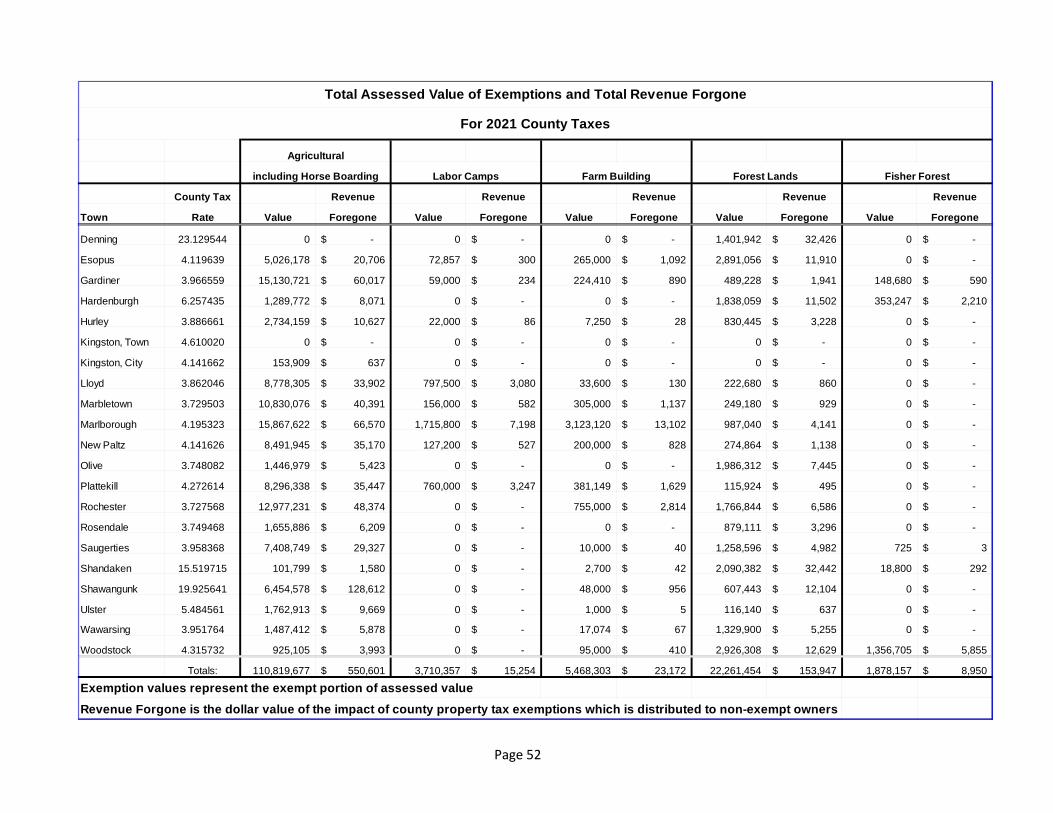
Page 52
County Tax Revenue Revenue Revenue Revenue Revenue
Town Rate Value Foregone Value Foregone Value Foregone Value Foregone Value Foregone
Denning 23.129544 0 -$ 0 -$ 0 -$ 1,401,942 32,426$ 0 -$
Esopus 4.119639 5,026,178 20,706$ 72,857 300$ 265,000 1,092$ 2,891,056 11,910$ 0 -$
Gardiner 3.966559 15,130,721 60,017$ 59,000 234$ 224,410 890$ 489,228 1,941$ 148,680 590$
Hardenburgh 6.257435 1,289,772 8,071$ 0 -$ 0 -$ 1,838,059 11,502$ 353,247 2,210$
Hurley 3.886661 2,734,159 10,627$ 22,000 86$ 7,250 28$ 830,445 3,228$ 0 -$
Kingston, Town 4.610020 0 -$ 0 -$ 0 -$ 0 -$ 0 -$
Kingston, City 4.141662 153,909 637$ 0 -$ 0 -$ 0 -$ 0 -$
Lloyd 3.862046 8,778,305 33,902$ 797,500 3,080$ 33,600 130$ 222,680 860$ 0 -$
Marbletown 3.729503 10,830,076 40,391$ 156,000 582$ 305,000 1,137$ 249,180 929$ 0 -$
Marlborough 4.195323 15,867,622 66,570$ 1,715,800 7,198$ 3,123,120 13,102$ 987,040 4,141$ 0 -$
New Paltz 4.141626 8,491,945 35,170$ 127,200 527$ 200,000 828$ 274,864 1,138$ 0 -$
Olive 3.748082 1,446,979 5,423$ 0 -$ 0 -$ 1,986,312 7,445$ 0 -$
Plattekill 4.272614 8,296,338 35,447$ 760,000 3,247$ 381,149 1,629$ 115,924 495$ 0 -$
Rochester 3.727568 12,977,231 48,374$ 0 -$ 755,000 2,814$ 1,766,844 6,586$ 0 -$
Rosendale 3.749468 1,655,886 6,209$ 0 -$ 0 -$ 879,111 3,296$ 0 -$
Saugerties 3.958368 7,408,749 29,327$ 0 -$ 10,000 40$ 1,258,596 4,982$ 725 3$
Shandaken 15.519715 101,799 1,580$ 0 -$ 2,700 42$ 2,090,382 32,442$ 18,800 292$
Shawangunk 19.925641 6,454,578 128,612$ 0 -$ 48,000 956$ 607,443 12,104$ 0 -$
Ulster 5.484561 1,762,913 9,669$ 0 -$ 1,000 5$ 116,140 637$ 0 -$
Wawarsing 3.951764 1,487,412 5,878$ 0 -$ 17,074 67$ 1,329,900 5,255$ 0 -$
Woodstock 4.315732 925,105 3,993$ 0 -$ 95,000 410$ 2,926,308 12,629$ 1,356,705 5,855$
Totals: 110,819,677 550,601$ 3,710,357 15,254$ 5,468,303 23,172$ 22,261,454 153,947$ 1,878,157 8,950$
Exemption values represent the exempt portion of assessed valueRevenue Forgone is the dollar value of the impact of county property tax exemptions which is distributed to non-exempt owners
Agricultural
including Horse Boarding Labor Camps Forest Lands Fisher ForestFarm Building
Total Assessed Value of Exemptions and Total Revenue Forgone
For 2021 County Taxes

Page 53
Clergy County Tax Sale
County Tax Revenue Revenue Revenue Revenue Revenue
Town Rate Value Foregone Value Foregone Value Foregone Value Foregone Value Foregone
Denning 23.129544 0 -$ 0 -$ 0 -$ 0 -$ 0 -$
Esopus 4.119639 15,000 62$ 537,640 2,215$ 4,500 19$ 27,744 114$ 1,173,100 4,833$
Gardiner 3.966559 296,609 1,177$ 0 -$ 0 -$ 0 -$ 629,300 2,496$
Hardenburgh 6.257435 0 -$ 0 -$ 0 -$ 0 -$ 0 -$
Hurley 3.886661 0 -$ 18,065 70$ 1,500 6$ 0 -$ 410,000 1,594$
Kingston, Town 4.610020 50,000 231$ 1,438,500 6,632$ 0 -$ 0 -$ 253,750 1,170$
Kingston, City 4.141662 1,938,722 8,030$ 1,728,700 7,160$ 7,500 31$ 0 -$ 9,842,000 40,762$
Lloyd 3.862046 1,725,515 6,664$ 41,600 161$ 3,000 12$ 126,000 487$ 17,445,656 67,376$
Marbletown 3.729503 0 -$ 2,960,000 11,039$ 3,000 11$ 147,000 548$ 412,500 1,538$
Marlborough 4.195323 972,172 4,079$ 431,000 1,808$ 1,500 6$ 517,000 2,169$ 0 -$
New Paltz 4.141626 1,647,575 6,824$ 1,357,751 5,623$ 4,500 19$ 0 -$ 407,496,000 1,687,696$
Olive 3.748082 0 -$ 0 -$ 0 -$ 200 1$ 0 -$
Plattekill 4.272614 404,475 1,728$ 0 -$ 0 -$ 76,500 327$ 96,800 414$
Rochester 3.727568 0 -$ 0 -$ 6,000 22$ 0 -$ 111,200 415$
Rosendale 3.749468 432,500 1,622$ 496,000 1,860$ 1,500 6$ 300 1$ 242,000 907$
Saugerties 3.958368 361,700 1,432$ 0 -$ 7,500 30$ 61,000 241$ 9,206,500 36,443$
Shandaken 15.519715 0 -$ 0 -$ 0 -$ 0 -$ 709,800 11,016$
Shawangunk 19.925641 64,860 1,292$ 0 -$ 1,500 30$ 0 -$ 2,108,622 42,016$
Ulster 5.484561 9,937,900 54,505$ 0 -$ 4,500 25$ 15,156,380 83,126$ 250,400 1,373$
Wawarsing 3.951764 2,613,001 10,326$ 4,612,000 18,226$ 3,000 12$ 0 -$ 14,727,300 58,199$
Woodstock 4.315732 777,078 3,354$ 65,000 281$ 0 -$ 0 -$ 2,128,700 9,187$
Totals: 21,237,107 101,323$ 13,686,256 55,074$ 49,500 227$ 16,112,124 87,014$ 467,243,628 1,967,434$
Exemption values represent the exempt portion of assessed valueRevenue Forgone is the dollar value of the impact of county property tax exemptions which is distributed to non-exempt owners
State OwnedSolar WindBusiness Investment
Total Assessed Value of Exemptions and Total Revenue Forgone
For 2021 County Taxes

Page 54
Total Exemptions
County Tax Revenue Revenue Revenue
Town Rate Value Foregone Value Foregone Value Foregone
Denning 23.129544 3,682,885 85,183$ 0 -$ 5,327,995 123,234$
Esopus 4.119639 209,451,949 862,866$ 21,901,617 90,227$ 259,595,524 1,069,440$
Gardiner 3.966559 18,092,700 71,766$ 0 -$ 53,345,383 211,598$
Hardenburgh 6.257435 5,597,800 35,028$ 0 -$ 9,376,115 58,670$
Hurley 3.886661 14,712,479 57,182$ 90,000 350$ 48,588,237 188,846$
Kingston, Town 4.610020 4,108,000 18,938$ 0 -$ 7,913,095 36,480$
Kingston, City 4.141662 480,358,175 1,989,481$ 42,983,100 178,021$ 574,137,996 2,377,886$
Lloyd 3.862046 55,100,300 212,800$ 0 -$ 112,984,059 436,350$
Marbletown 3.729503 56,708,784 211,496$ 353,000 1,317$ 100,259,025 373,916$
Marlborough 4.195323 43,821,000 183,843$ 0 -$ 92,986,047 390,107$
New Paltz 4.141626 145,594,105 602,996$ 2,700 11$ 586,786,124 2,430,249$
Olive 3.748082 23,613,074 88,504$ 0 -$ 52,754,199 197,727$
Plattekill 4.272614 18,008,700 76,944$ 0 -$ 54,704,148 233,730$
Rochester 3.727568 49,938,300 186,148$ 0 -$ 91,746,712 341,992$
Rosendale 3.749468 28,890,300 108,323$ 21,000 79$ 53,542,311 200,755$
Saugerties 3.958368 128,971,455 510,516$ 0 -$ 216,543,335 857,158$
Shandaken 15.519715 6,635,767 102,985$ 0 -$ 12,458,735 193,356$
Shawangunk 19.925641 43,649,570 869,746$ 0 -$ 60,400,921 1,203,527$
Ulster 5.484561 171,387,890 939,987$ 17,670,000 96,912$ 236,081,261 1,294,802$
Wawarsing 3.951764 140,305,971 554,456$ 0 -$ 185,719,243 733,919$
Woodstock 4.315732 60,005,670 258,968$ 1,316,400 5,681$ 100,827,305 435,144$
Totals: 1,708,634,874 8,028,159$ 84,337,817 372,598$ 2,916,077,770 13,388,884$
Exemption values represent the exempt portion of assessed valueRevenue Forgone is the dollar value of the impact of county property tax exemptions
Miscellaneous
ExemptionsWholly Exempt Property
Total Assessed Value of Exemptions and Total Revenue Forgone
For 2021 County Taxes

Page 55
Grandparents Physical LaborVeterans Paraplegics Aged Living Quarters Disability Agricultural Camps Farm Building Forest land Fisher ForestRevenue Revenue Revenue Revenue Revenue Revenue Revenue Revenue Revenue Revenue
Year Foregone Foregone Foregone Foregone Foregone Foregone Foregone Foregone Foregone Foregone2003 752,615 2,887 377,130 19,897 332,973 7,520 20,332 70,566 6,3202004 733,274 2,940 401,443 24,085 359,206 8,373 37,867 75,398 6,7442005 1,119,802 3,263 561,050 32,396 475,188 8,233 43,541 112,236 8,8082006 1,064,073 4,736 585,367 36,732 511,511 8,879 48,043 107,675 8,9322007 1,018,088 4,686 530,046 1,233 41,349 512,465 9,167 41,899 137,284 9,2042008 1,025,059 4,874 515,329 2,211 36,891 495,100 10,235 49,696 116,136 8,9922009 1,061,609 4,020 884,138 2,568 56,425 515,927 10,189 52,607 126,769 9,5012010 1,078,315 4,042 871,014 2,649 64,078 502,599 10,994 50,599 128,324 9,2552011 1,129,156 4,141 905,287 3,309 64,791 540,393 12,298 50,516 138,546 9,7232012 1,110,262 4,099 892,312 3,196 73,454 536,901 14,141 53,567 140,752 9,2312013 1,279,204 4,110 1,256,798 2,746 81,192 546,345 15,508 57,682 146,417 9,4462014 1,233,281 4,085 1,097,910 2,747 75,880 543,995 15,445 55,979 152,204 9,4662015 1,166,772 4,017 1,077,850 3,446 71,575 549,847 15,736 54,141 158,825 9,3552016 1,151,036 3,999 1,082,757 3,903 68,099 554,276 15,621 48,820 166,443 9,2782017 1,172,209 3,953 1,024,610 3,864 63,127 552,515 15,252 27,496 166,033 9,1862018 1,139,692 3,862 985,517 3,108 58,973 555,539 16,032 22,320 160,953 9,2212019 1,103,790 3,825 956,342 2,716 60,363 557,830 15,841 26,379 158,798 9,0792020 1,071,159 3,839 886,304 2,460 61,371 550,601 15,254 23,172 153,947 8,950
Revenue forgone represents the dollar amount of taxes exempted.These amounts are distributed to non-exempt properties through the tax rate process.
Exemption Comparison by Year

Page 56
Business Solar County State Wholly Exempt TotalInvestment Wind Clergy Tax Sale Owned Property Miscellaneous ExemptionsRevenue Revenue Revenue Revenue Revenue Revenue Revenue Revenue
Year Foregone Foregone Foregone Foregone Foregone Foregone Foregone Foregone2003 146,988 342 1,558 4,070 936,278 5,351,601 8,031,0762004 121,126 327 2,025 4,573 910,309 5,809,524 8,497,2142005 110,297 330 1,281 4,769 1,106,981 5,754,502 9,342,6772006 125,529 319 1,038 2,151 1,167,449 7,673,285 11,345,7182007 120,825 48 1,128 1,009 1,040,976 7,979,713 11,449,1202008 119,897 39 1,041 576 935,090 6,640,294 9,961,4592009 92,447 162 1,042 1,828 1,237,233 7,046,152 11,102,6162010 104,126 2,122 1,034 717 1,932,516 7,417,325 12,179,7102011 537,374 3,696 1,098 2,234 2,113,180 6,758,616 12,274,3582012 84,947 5,500 1,470 2,645 2,037,480 7,834,743 89,309 12,894,0092013 64,863 6,495 1,477 6,631 2,098,190 7,913,117 247,675 13,737,8962014 82,634 8,409 1,131 7,152 2,061,228 7,995,482 252,485 13,599,5132015 70,806 9,646 369 5,449 2,022,042 7,712,357 241,993 13,174,2262016 68,185 13,060 339 3,168 2,037,101 7,624,241 279,701 13,130,0272017 95,161 14,938 315 5,907 2,017,196 7,643,114 313,181 13,128,0572018 96,010 17,203 305 13,666 1,964,577 7,721,058 320,333 13,088,3692019 104,992 26,432 260 13,146 1,976,189 7,920,367 332,514 13,268,8632020 101,323 55,074 227 87,014 1,967,434 8,028,159 372,598 13,388,886
Revenue forgone represents the dollar amount of taxes exempted.These amounts are distributed to non-exempt properties through the tax rate process.
Exemption Comparison by Year