Embed Size (px)
Citation preview

ULSTER COUNTY, NEW YORK (ALL JURISDICTIONS)
VOLUME 1 OF 4
REVISED: 1 No Special Flood Hazard Areas Identified
COMMUNITY NAME
COMMUNITY NUMBER
DENNING, TOWN OF ELLENVILLE, VILLAGE OF
361439 360975
ESOPUS, TOWN OF 360855
GARDINER, TOWN OF 360856 HARDENBURG, TOWN OF HURLEY, TOWN OF KINGSTON, CITY OF
361578 360857 360858
KINGSTON, TOWN OF 361218
LLOYD, TOWN OF 361012
MARBLETOWN, TOWN OF 361219
MARLBOROUGH, TOWN OF 361220
NEW PALTZ, TOWN OF 360859
NEW PALTZ, VILLAGE OF 361544OLIVE, TOWN OF PLATTEKILL,TOWN OF1
360860 361221
ROCHESTER, TOWN OF 360861
ROSENDALE, TOWN OF 360862
SAUGERTIES, TOWN OF 360863
SAUGERTIES, VILLAGE OF 361504
SHANDAKEN, TOWN OF SHAWANGUNK, TOWN OF
360864 360865
ULSTER, TOWN OF WAWARSING, TOWN OF WOODSTOCK, TOWN OF
360866 360867 360868
Federal Emergency Management Agency
FLOOD INSURANCE STUDY NUMBER 36111CV001B
NOTICE This preliminary FIS report includes only revised Flood Profiles and Floodway Data tables. See “Notice to Flood Insurance Users” page for additional details.
PRELIMINARY May 24, 2013
NOTICE TO FLOOD INSURANCE STUDY USERS
Communities participating in the National Flood Insurance Program have established repositories of flood hazard data for floodplain management and flood insurance purposes. This Flood Insurance Study (FIS) report may not contain all data available within the Community Map Repository. Please contact the Community Map Repository for any additional data.
The Federal Emergency Management Agency (FEMA) may revise and republish part or all of this FIS report at anytime. In addition, FEMA may revise part of this FIS report by the Letter of Map Revision process, which does not involve republication or redistribution of the FIS report. Therefore, users should consult with community officials and check the Community Map Repository to obtain the most current FIS report components.
Selected Flood Insurance Rate Map (FIRM) panels for this community contain information that was previously shown separately on the corresponding Flood Boundary and Floodway Map (FBFM) panels (e.g., floodways and cross sections). In addition, former flood hazard zone designations have been changed as follows:
Old Zone New Zone A1 through A30 AE V1 through V30 VE B X C X Initial FIS Effective Date: September 25, 2009 (partial countywide) Revised FIS Dates: This preliminary FIS report does not include unrevised Floodway Data Tables or unrevised Flood Profiles. These Floodway Data Tables and Flood Profiles will appear in the final FIS report.

i
TABLE OF CONTENTS - Volume 1
1.0 INTRODUCTION 1
1.1 Purpose of Study 1
1.2 Authority and Acknowledgments 1
1.3 Coordination 6
2.0 AREA STUDIED 6
2.1 Scope of Study 6
2.2 County Description 9
2.3 Principal Flood Problems 10
2.4 Flood Protection Measures 11
3.0 ENGINEERING METHODS 12
3.1 Hydrologic Analyses 13
3.2 Hydraulics Analyses 28
3.3 Vertical Datum 36
4.0 FLOODPLAIN MANAGEMENT APPLICATIONS 37
4.1 Floodplain Boundaries 38
4.2 Floodways 38
5.0 INSURANCE APPLICATIONS 64
6.0 FLOOD INSURANCE RATE MAP 64
7.0 OTHER STUDIES 65
8.0 LOCATION OF DATA 67
9.0 BIBLIOGRAPHY AND REFERENCES 67

ii
Table of Contents – Volume 1- Continued
FIGURES
FIGURE 1 – FLOODWAY SCHEMATIC 39
TABLES
TABLE 1 - INITIAL AND FINAL CCO MEETING DATES 6
TABLE 2 - FLOODING SOURCES STUDIED BY DETAILED METHODS 7
TABLE 3 - SCOPE OF REVISION 7
TABLE 4 - SUMMARY OF DISCHARGES 22
TABLE 5 - SUMMARY OF STILLWATER ELEVATIONS 27
TABLE 6 - MANNING'S "N" VALUES 32
TABLE 7 - LIMITED DETAILED (ENHANCED A-ZONES) FLOOD HAZARD DATA 34
TABLE 8 - FLOODWAY DATA TABLES 40
TABLE 9 - COMMUNITY MAP HISTORY 66
TABLE OF CONTENTS - Volume 2
EXHIBITS
Exhibit 1 – Flood Profiles Alton Creek Panels 001P-008P Alton Creek Tributary Panels 009P-014P Beaver Kill Panels 015P-023P Birch Creek Panels 024P-030P Black Creek Panels 031P-036P Broadstreet Hollow Panels 037P-040P Bush Kill Panels 041P-051P Bushnellsville Creek Panels 052P-057P Cross Mountain Hollow Panel 058P Dry Brook Panels 059P-067P Dwaar Kill East Panels 068P-072P Dwaar Kill West Panels 073P-076P East Branch Neversink River Panels 077P-078P Englishmans Creek Panel 079P Esopus Creek Reach 1 Panels 080P-089P

iii
Table of Contents – Volume 3
EXHIBITS – continued
Exhibit 1 – Flood Profiles (continued)
Esopus Creek Reach 2 Panels 090P-100P Fox Hollow Panels 111P-114P Kate Yaeger Kill Panels 115P-166P Little Beaver Kill Panel 117P Maltby Hollow Brook Panels 118P-120P Mara Kill Panels 121P-142P Mill Brook Panels 0143P-0144P Mink Hollow Panels 0145P-0152P Muddy Brook Panel 0153P Preymaker Brook Panels 0154P-0155P Rochester Creek Panels 0156P-0157P Rondout Creek Reach 1 Panels 0158P-0179P Rondout Creek Reach 2 Panels 0180P-0181P Sandburg Creek Panels 0182P-0184P
Table of Contents – Volume 4 Saw Kill Panels 0185P-0195P Shawangunk Kill Panels 0196P-0199P Shawangunk River Panel 0200P Stony Clove Creek Panels 0201P-0204P Stony Creek Panel 0205P Sundown Creek Panels 0206P-0211P Tannery Brook Panels 0212P-0213P Tributary 1 to Mill Brook Panel 0214P Tributary 1 to Rochester Creek Panel 0215P Tributary 2A Panel 0216P Tributary No. 18 to Esopus Creek Panels 0217P-0218P Twaalfskill Brook Panels 0219P-0221P Twaalfskill Creek Panels 0222P-0226P Verkeerder Kill Panels 0227P-0228P Vernooy Kill Panel 0229P Wagner Creek Panels 0230P-0233P Wallkill River Panels 0234P-0243P Warner Creek Panels 0244P-0248P Woodland Creek Panels 0249P-0251P Woodland Creek Tributary Panel 0252P
Exhibit 2 – Flood Insurance Rate Map Index Flood Insurance Rate Map

1
FLOOD INSURANCE STUDY ULSTER COUNTY, NEW YORK (ALL JURISDICTIONS)
1.0 INTRODUCTION
1.1 Purpose of Study
This countywide Flood Insurance Study (FIS) revises and supersedes the FIS reports and/or Flood Insurance Rate Maps (FIRMs) in the geographic area of Ulster County, New York, including the Towns of Denning, Esopus, Gardiner, Hardenburg, Hurley, Kingston, Lloyd, Marbletown, Marlborough, New Paltz, Olive, Plattekill, Rochester, Rosendale, Saugerties, Shanadaken, Shawangunk, Ulster, Wawarsing, and Woodstock; the Villages of Ellenville, New Paltz, and Saugerties; and the City of Kingston (hereinafter referred to collectively as Ulster County).
This FIS aids in the administration of the National Flood Insurance Act of 1968 and the Flood Disaster Protection Act of 1973. This study has developed flood risk data for various areas of the community that will be used to establish actuarial flood insurance rates. This information will also be used by Ulster County – Outside the New York City Watershed to update existing floodplain regulations as part of the Regular Phase of the National Flood Insurance Program (NFIP), and by local and regional planners to further promote sound land use and floodplain development. Minimum floodplain management requirements for participation in the NFIP are set forth in Title 44 of the Code of Federal Regulations, Section 60.3 (44 CFR 60.3).
In some States or communities, floodplain management criteria or regulations may exist that are more restrictive or comprehensive than those on which these federally-supported studies are based. These criteria take precedence over the minimum Federal criteria for purposes of regulating development in the floodplain, as set forth in 44 CFR 60.3(d). In such cases, however, it shall be understood that the State (or other jurisdictional agency) shall be able to explain these requirements and criteria.
Please note that on the effective date of this study, the Town of Plattekill has no identified Special Flood Hazard Areas (SFHA). This does not preclude future determinations of SFHAs that could be necessitated by changed conditions affecting the community (i.e. annexation of new lands) or the availability of new scientific or technical data about flood hazards.
1.2 Authority and Acknowledgments
The sources of authority for this FIS are the National Flood Insurance Act of 1968 and the Flood Disaster Protection Act of 1973.
This study was prepared to include all jurisdictions within Ulster County into a countywide FIS. Information on the authority and acknowledgments for each jurisdiction included in this countywide FIS, as compiled from their previously printed FIS reports, is provided below:
Ellenville, Village of: The hydrologic analyses for this study were prepared by the U.S. Army Corps of Engineers (USACE). The hydraulic analyses were prepared by the Gannet Fleming Corddry and Carpenter, Inc., for the USACE. That work was completed in April 1981.

2
Esopus, Town of: The hydrologic and hydraulic analyses for this study were prepared by the New York State Department of Environmental Conservation (NYSDEC) and Dewberry & Davis for the Federal Emergency Management Agency (FEMA), under contract No. H-4624. That work was completed in March 1983.
Gardiner, Town of: For the original March 30, 1982, FIS report and September 30, 1982, FIRM, the hydrologic and hydraulic analyses were prepared by Urbitran Associates, Inc., for FEMA, under Contract No. H-4825. That work was completed in November 1980.
For the FIS dated July 16, 1997, revised hydrologic and hydraulic analyses for the Mara Kill were prepared by Kozma Associates Consulting Engineers, P.C., for FEMA, under Contract No. EMW-94-C-4379. That work was completed in July 1995.
Planimetric base map information was derived from U.S. Geological Survey (USGS) 1:000,000 scale Digital Line Graphs. Additional information may have been derived from other sources. The Digital Flood Insurance Rate Map (DFIRM) was produced in Universal Transverse Mercator (UTM) coordinates referenced to the North American Datum of 1927 and the Clarke 1866 Spheroid.
Hurley, Town of: The hydrologic and hydraulic analyses for the original study was performed by Dewberry & Davis for FEMA based on the data used to prepare the FIS for the City of Kingston and the Town of Ulster. That work was completed in June 1984.
The hydrologic and hydraulic analyses for the August 18, 1992 FIS were prepared by Kozma Associates Consulting Engineers, P.C. for FEMA, under Contract No. EMW-87-C-2449. That work was completed in October 1990.
Kingston, City of: The hydrologic and hydraulic analyses for this FIS were prepared by the NYSDEC and Dewberry & Davis for FEMA, under Contract No. H-4624. That work was competed in May 1984.
Kingston, Town of: The hydrologic and hydraulic analyses for the April 5, 1988, FIS represent a revision of the original analyses prepared for FEMA. The hydrologic and hydraulic analyses for the April 5, 1988 study were prepared using the USACE Flood Plain Technical Services report on Saw Kill. The hydrologic analysis for that study was prepared by USACE. The hydraulic analysis for that study was prepared by Leonard Jackson Associates under subcontract to USACE. That work was completed in March 1985.
Lloyd, Town of: For the revision of the January 18, 1985, FIS report and the July 18, 1985, FIRM, the hydrologic and hydraulic analyses

3
for the Hudson River were performed by Harris-Toups Associates during the preparation of the FIS for the Town of Poughkeepsie, New York. The Poughkeepsie study was completed in August 1977.
For the July 5, 2000, revision the hydrologic and hydraulic analyses for Black Creek and Twaalfskill Creek were prepared by Leonard Jackson Associates for FEMA, under Contract No. EMW-C-4692. This work was completed in February 1998.
Planimetric base map information was derived by scanning and vectorizing the previously published FIRM for the Town of Lloyd, New York. Additional information may have been derived from other sources. The DFIRM was produced using UTM coordinates referenced to the North American Datum of 1927 and the Clarke 1866 spheroid.
Marbletown, Town of: The hydrologic and hydraulic analyses for this study were prepared by Kozma Associates Consulting Engineers, P.C., for FEMA under Inter-Agency Agreement No. EMW-86-C-2244. This work was completed in December 1989.
Marlborough, Town of: The hydrologic and hydraulic analyses for this study were performed by Harris-Toups Associates during the preparation of the FIS for the Town of Poughkeepsie, New York. The Poughkeepsie study was completed in August 1977.
New Paltz, Town of: The hydrologic and hydraulic analyses for this study represent a revision of the original analyses by NYSDEC for FEMA under Contract No. H-4547. The original work was completed in May 1980. An updated version prepared by Dewberry & Davis under agreement with FEMA was completed in July 1983. The hydrologic and hydraulic analyses for the Wallkill River were again revised by Dewberry & Davis; the second revision was completed in December 1984.
New Paltz, Village of: The hydrologic and hydraulic analyses for this study represent a revision of the original analyses by NYSDEC for FEMA, under Contract No. H-4547. The original work was completed in May 1980. An updated version prepared by Dewberry & Davis under agreement with FEMA was completed in July 1983. The hydrologic and hydraulic analyses for the Wallkill River were again revised by Dewberry & Davis; the second revision was completed in December 1984.
Olive, Town of: The hydrologic and hydraulic analyses for this study were performed by the New York District of USACE, during the Report on Technical Services for Esopus Creek. The report was completed in November 1982.

4
Rochester, Town of: The hydrologic analyses for the original study were performed by USACE and hydraulic analyses were performed by Gannett Fleming Corddry and Carpenter for FEMA. The work for the original study was completed in April 1981.
For the updated study, additional hydrologic and hydraulic analyses for Rondout Creek, and hydrologic and hydraulic analyses for the other streams studied by detailed methods, were prepared by Edwards and Kelcey Engineers, Inc., for FEMA, under Contract No. EMW-85-C-1887. This work was completed in March 1989.
Rosendale, Town of: The hydrologic and hydraulic analyses for the original study were prepared by NYSDEC and Dewberry & Davis for FEMA, under Contract No. H-4624. This work was completed in March 1983. The hydrologic and hydraulic analyses for the Wallkill River were revised by Dewberry & Davis. The revised work was completed in December 1984.
Saugerties, Town of: The hydrologic and hydraulic analyses for the original study were prepared by Dewberry & Davis for FEMA during the preparation of FISs for the City of Kingston and the Town of Ulster. The work for the original study was completed in June 1984.
In the first revision, the hydraulic and hydrologic analyses were performed by the Buffalo District of USACE for FEMA under Inter-Agency Agreement No. EMW-88-E-2768, Project Order Nos. 1A and 1B. The work for the first revision was completed in June 1989. In the next revision, the hydraulic analyses were prepared by Dewberry & Davis. The work for the second revision as completed in July 1991.
Saugerties, Village of: The hydrologic and hydraulic analyses in the February 5, 1985, study represent a revision of the analyses done by the original contractor for FEMA. The updated version was prepared by Dewberry & Davis for FEMA during the course of preparing the FISs for the City of Kingston and the Town of Ulster. This work was completed in June 1984.
Shandaken, Town of: The hydrologic and hydraulic analyses for this study were performed by the New York District of USACE during the Report on Technical Services for Esopus Creek. The report was completed in November 1982.
Shawangunk, Town of: The hydrologic and hydraulic analyses for the original study were prepared by Urbitran Associates, Inc. for FEMA, under Contract No. H-4825. This work was completed in November 1980.

5
Ulster, Town of: The hydrologic and hydraulic analyses for the original study were prepared by NYSDEC and Dewberry & Davis for FEMA, under Contract No. H-4624. This work was completed in May 1984.
Wawarsing, Town of: The hydrologic for the original study were performed by USACE. The hydraulic analyses were prepared by Gannett Fleming and Carpenter, Inc., for USACE. The work was completed in April 1981.
Woodstock, Town of: The hydrologic for the original study were performed by Leonard Jackson Associates for FEMA, under Contract No. EMW-88-C-2600. The work was completed in September 1989.
No FIS reports were previously prepared for the Towns of Denning, Hardenburgh and Plattekill in Ulster County.
For the September 25, 2009, FIS, NYSDEC and FEMA entered into a Cooperative Technical Partners Agreement to collaboratively produce this countywide FIS. Revised hydrologic and hydraulic analyses for all approximate studies and for detailed studies on the Saw Kill, Twaalfskill Brook, and Rondout Creek were prepared by Gomez and Sullivan Engineers, P.C. and PAR Government Services for NYSDEC. This work was completed in September 2007.
For this revision, the hydrologic and hydraulic analyses was revised for Alton Creek, Alton Creek Tributary, Beaver Kill, Birch Creek, Broadstreet Hollow, Bush Kill, Bushnellsville Creek, Cross Mountain Hollow, Dry Brook, East Branch Neversink River, Esopus Creek Reach 2, Fox Hollow, Little Beaver Kill, Maltby Hollow Brook, Mink Hollow, Muddy Brook, Rondout Creek Reach 2, Stony Clove Creek, Sundown Creek, Wagner Creek, Warner Creek, Woodland Creek, and Woodland Creek Tributary.
This work was performed for FEMA by Risk Assessment, Mapping, and Planning Partners (RAMPP), a joint venture of Dewberry & Davis LLC, URS Group Inc., and ESP Associates. This work was completed in April 2013.
The digital base map information shown on the FIRMs for the September 25, 2009 partial countywide was provided by NYSDEC. This information was derived from the New York State Office of Cyber Security and Critical Infrastructure Coordination from aerial photography dated April 2004.
The digital base map information shown on the FIRMs under this revision was provided by NYSDEC. This information was derived from the New York State Office of Cyber Security and Critical Infrastructure Coordination from aerial photography dated April 2009.
The projection used for the preparation of the DFIRMs was UTM Zone 18. The horizontal datum was the North American Datum of 1983, GRS1980 spheroid. Differences in datum, spheroid, projection, or UTM zones used in the production of FIRMs for adjacent jurisdictions may result in slight positional differences in map features across jurisdiction boundaries. These differences do not affect the accuracy of the FIRMs.

6
1.3 Coordination
The purpose of an initial Consultation Coordination Officer’s (CCO) meeting is to discuss the scope of the FIS. A final CCO meeting is held to review the results of the detailed study.
The dates of the initial and final CCO meetings held for prior FISs for the incorporated communities within Ulster County, are shown in Table 1.
TABLE 1 - INITIAL AND FINAL CCO MEETING DATES
Community Name Initial CCO Meeting Final CCO Meeting
Ellenville, Village of June 12, 1980 August 9, 1982 Esopus, Town of May 25, 1977 August 10, 1983 Gardiner, Town of June 1978 November 12, 1981 Hurley, Town of May 1986 * Kingston, City of May 25, 1977 April 18, 1983 Kingston, Town of September 18, 1986 April 20, 1987 Lloyd, Town of * August 29, 1984 Marbletown, Town of October 11, 1990 January 24, 1991 Marlborough, Town of * July 16, 1984 New Paltz, Town of May 26, 1977 May 5, 1981 New Paltz, Village of May 26, 1977 May 5, 1981 Olive, Town of * November 18, 1983 Rochester, Town of September 25, 1984 March 8, 1990 Rosendale, Town of May 26, 1977 August 10, 1983 Saugerties, Town of * * Saugerties, Village of * * Shandaken, Town of * February 8, 1984 Shawangunk, Town of June 1978 November 6, 1981 Ulster, Town of May 25, 1977 April 18, 1983 Wawarsing, Town of June 12, 1980 September 2, 1982 Woodstock, Town of May 1987 October 18, 1990 *Data Not Available
Initial CCO meetings for the September 25, 2009, FIS were held in 2004, with representatives of the NYSDEC and local officials and the Town of Plattekill.
Initial CCO meetings for this countywide FIS were held on November 15, 2011, with representatives of the NYSDEC, FEMA, RAMPP, and local officials. Flood Risk Review Meetings were held on March 20, 2013.
2.0 AREA STUDIED
2.1 Scope of Study
This FIS covers the geographic areas of Ulster County, New York.
The areas studied by detailed methods were selected with priority given to all known flood hazard areas and areas of projected development and proposed construction. All or portions of the flooding sources listed in Table 2, “Flooding Sources Studied by Detailed

7
Methods,” were studied by detailed methods. Limits of detailed study are indicated on the Flood Profiles (Exhibit 1) and on the FIRM (Exhibit 2).
TABLE 2 - FLOODING SOURCES STUDIED BY DETAILED METHODS
Alton Creek Preymaker Brook Alton Creek Tributary Rochester Creek Beaver Kill Rondout Creek Reach 1 Birch Creek Rondout Creek Reach 2 Black Creek Sandburg Creek Broadstreet Hillow Saw Kill Bush Kill Shawangunk Kill Bushnellsville Creek Shawangunk River Cross Mountain Hollow Stony Clove Creek Dry Brook Stony Creek Dwaar Kill East Sundown Creek Dwaar Kill West Tannery Brook East Branch Neversink River Tributary 1 to Mill Brook Englishmans Creek Tributary 1 to Rochester Creek Esopus Creek Reach 1 Tributary 2A Esopus Creek Reach 2 Tributary No. 18 to Esopus Creek Fox Hollow Twaalfskill Brook Hudson River Twaalfskill Creek Kate Yaeger Kill Verkeerder Kill Little Beaver Kill Wallkill River Maltby Hollow Brook Wagner Creek Mara Kill Warner Creek Mill Brook Woodland Creek Mink Hollow Woodland Creek Tributary Muddy Brook
As part of this countywide FIS, updated analyses were included for the flooding sources shown in Table 3, “Scope of Revision.”
TABLE 3 - SCOPE OF REVISION
Stream Limits of Revised or New Detailed Study Alton Creek From its confluence with Birch Creek to approximately 2 miles
upstream of Bonnieview Avenue Alton Creek Tributary From its confluence with Alton Creek to approximately 520 feet
upstream of State Highway 28 Beaver Kill From its confluence with Esopus Creek Reach 2 to
approximately 0.6 miles upstream of Sickler Road Birch Creek From its confluence with Esopus Creek Reach 2 to
approximately 0.3 miles upstream of Academy Street

8
TABLE 3 - SCOPE OF REVISION (CONT’D) Broadstreet Hollow From its confluence with Esopus Creek Reach 2 to
approximately 0.7 miles upstream of Broadstreet Hollow Road Bush Kill From its confluence with Ashokan Reservoir to approximately
495 feet upstream of Watson Hollow Road Bushnellsville Creek From its confluence with Esopus Creek Reach 2 to
approximately 250 feet upstream of State Route 42 Cross Mountain Hollow From its confluence with Woodland Creek to approximately 500
feet upstream of Morning Dove Road Dry Brook From its confluence with Bush Kill to approximately 2.2 miles
upstream of Hillside Drive East Branch Neversink River From its confluence with Neversink River Reach 2 to
approximately 0.2 miles upstream of Denning Road Esopus Creek Reach 2 From its confluence with the Ashokan Reservoir to
approximately 125 feet upstream of Maben Hollow Road Fox Hollow From its confluence with Esopus Creek Reach 2 to
approximately 0.2 miles upstream of Fox Hollow Road Little Beaver Kill From its confluence with Esopus Creek Reach 2 to
approximately 0.5 miles upstream of State Route 28 Maltby Hollow Brook From its confluence with Bush Kill to approximately 0.3 miles
upstream of Shultis Lane Mink Hollow From its confluence with Beaver Kill to approximately 1.2 miles
upstream of Van Hoogland Road Muddy Brook From its confluence with Woodland Creek to approximately 310
feet upstream of Woodland Valley Road Rondout Creek Reach 2 From its confluence with the Rondout Reservoir to
approximately 0.3 miles upstream of Slater Road Stony Clove Creek From its confluence with Esopus Creek Reach 2 to
approximately 0.3 miles of Grubman Road Sundown Creek From its confluence with Rondout Creek Reach 2 to
approximately 0.7 feet upstream of William Way Wagner Creek From its confluence with Beaver Kill to approximately 130 feet
upstream of Cross Patch Road

9
TABLE 3 - SCOPE OF REVISION (CONT’D) Warner Creek From its confluence with Stony Clove Creek to approximately
1.4 miles upstream of Silver Hollow Road Woodland Creek From its confluence with Esopus Creek Reach 2 to
approximately 500 feet upstream of Tonisgah Road Woodland Creek Tributary From its confluence with Woodland Creek to approximately 700
feet upstream of Woodland Valley Road
The areas studied by detailed methods were selected with priority given to all flood hazard areas and areas of projected development and proposed construction. 3
In addition, several streams are studied by limited detailed and approximate methods. Section 3.2 provides a comprehensive definition of limited detailed and approximate flood hazard designations.
2.2 County Description
Ulster County is located in southeastern New York, approximately 75 miles north of the New York City metropolitan area. It is bordered on the north by Delaware and Greene Counties, on the south by Orange County, on the east by Dutchess and Columbia Counties, and on the west by Sullivan County. Ulster County has the Hudson River as its eastern county line.
The largest city in Ulster County is the county seat, Kingston, with a population of 23,893. The total 2010 Census population of Ulster County is 182,493 (Reference 30).
The climate in southeast New York is humid continental, characterized by short, mild summers and long, cold winters. The varied terrain induces numerous microclimates with variations in temperature, wind channeling, vertical currents, relative humidity, and precipitation. The mean temperature is 25.2 degrees Fahrenheit (°F) in January and 70.8 °F in July. The annual precipitation is typically between 40 and 50 inches. The average annual snowfall is approximately 62 inches.
The Hudson River flows in a southerly direction along the eastern border of Ulster County. The Hudson River originates near Mt. Marcy in Essex County in northeast New York and flows south for 315 miles to Upper New York Bay, in the southeast corner of New York State. The drainage area of the Hudson River at the northern portion of Ulster County (near the Esopus Creek confluence) is approximately 10,500 square miles.
Other major streams in Ulster County are Rondout Creek, the Wallkill River, Saw Kill, and Esopus Creek. Rondout Creek originates in the New York State Catskill Mountains adjacent to Peekamoose Mountain. The creek flows southwest to southeast for 25 miles to Napanock and the foothills of the Shawangunk Mountains. The valley has steeply wooded slopes and an average width of 700 to 1,500 feet. Beyond this point, the creek then turns northeast and meanders along the base of the Shawangunk Mountains to High Falls then through a narrow, steep banked valley to Rosendale, where it crosses the mountains at Lefevre Falls and flows to its confluence with the Wallkill River. The creek continues to Kingston where it joins the Hudson River.
The Wallkill River originates at the outlet of Lake Mohawk at Sparta, New Jersey. The river generally flows northwest through northern New Jersey into southeast New York

10
State. In Ulster County, the Wallkill River flows through the Towns of Shawangunk, Gardiner, New Paltz, Rosendale, and Esopus before emptying into Rondout Creek.
Esopus Creek originates at the outlet of Winnisook Lake in the Catskill Mountains. The stream flows north to Big Indian, New York, where it joins Birch Creek and turns to the east. Esopus Creek then flows approximately 4.2 miles to Allaben, New York, which is the location of the Shandaken Tunnel discharge chamber. After receiving discharges from the tunnel at Allaben, the creek flows southeast for 11.8 miles where it enters the Ashokan Reservoir (drainage area – 256 square miles; storage capacity – 130.5 billion gallons). The creek continues southeast and then turns to the northeast where it flows through the Towns of Marbletown, Hurley, Ulster, and Saugerties, eventually discharging into the Hudson River. The main channel of Esopus Creek is lined with trees and consists of wooded areas interspersed with areas of short grasses and brush or cropland.
The Ashokan Reservoir is located on Esopus Creek. The reservoir, completed in 1915, was designed to provide drinking water for New York City. It also acts as a detention basin, thus significantly reducing the potential for flooding downstream, and serves as an important recreation facility for the surrounding communities.
2.3 Principal Flood Problems
Flooding can occur in Ulster County during any season of the year, but is most likely to occur in the late winter-early spring months when severe or long-duration precipitation events combine with melting snow. Late summer flooding is also a possibility due to thunderstorms and tropical storms/hurricanes carrying abundant amounts of rain as they travel up the eastern seaboard.
Portions of Esopus Creek are silty, which may cause a reduction in capacity during flooding. During the winter, the reduction in flow capacity may cause ice to form in the channel, blocking the flow of water (ice jam) and creating severe flooding. Ice jams have been reported in some locations on Esopus Creek.
Some of the major storms of record in Ulster County occurred December 29-31, 1948; October 14-18, 1955; August 17-19, 1955; and March 21-22, 1980. Discharges for major floods occurring in the study area were obtained from the USGS gaging station on Esopus Creek. The USGS gage (No. 01362500) on Esopus Creek is located at Coldbrook, New York, above the Ashokan Reservoir and has a drainage area of 192 square miles. The Kingston Flood Control Project on Esopus Creek is located at Kingston, New York, below the Ashokan Reservoir and has a drainage area of 319 square miles..
A significant ice jam occurred on Esopus Creek in February 1976. The area subject to the most damage in the City of Kingston consisted of a portion of Esopus Creek approximately 7,000 feet in length, from Old Route 28 to approximately 3,500 feet downstream of State Route 199. Along this portion of the stream are two trailer parks and several residential and commercial structures. Although the flood level caused by the ice jam was lower than the flows of the storms in 1951 and 1955, damage to structures was extensive.
Floods in Rondout Reservoir Watershed can occur anytime during the year. Flooding that occurs in the summer and fall seasons is caused mainly by heavy rainfall produced by hurricanes and tropical storms. Flooding occurring in winter and spring mainly results from snowmelt caused by rising temperatures and/or mixing of rain with snow. The largest storm on record in Rondout Creek occurred during Hurricane Irene in August

11
2011. The measured peak discharge at the Rondout Creek gage during Hurricane Irene was 7,970 cubic feet per second (cfs). The flooding that occurred as a result of Hurricane Irene had a recurrence interval between a 25-year and 50-year storm at the Rondout Creek gage.
In the Neversink Watershed, storm events in the latter part of summer and early fall of 2011 resulted in record peaks within the watershed. The second highest flood peak, approximately 21,300 cfs, was recorded at USGS Gage 01435000, on the Neversink River near Claryville, New York. Additionally, record peaks were observed on the East Branch of the Neversink River at USGS Gage 0143400680 near Denning, and USGS Gage 01434017 near Claryville, as well as on the West Branch Gage at Claryville. High-water marks were collected as part of FEMA’s rapid response riverine high-water mark collection for Hurricane Irene (Reference 36). Where available, these high-water marks were used in calibration of streams studied by detailed and limited detail models.
2.4 Flood Protection Measures
Several communities within Ulster County have constructed flood-control structures to mitigate flooding. The following paragraphs describe some of the more significant measures.
Kingston Flood Control Project – (Esopus Creek)
This improvement to the right bank of Esopus Creek is located between State Route 28 / Interstate Route 587 and Washington Avenue and was constructed in 1978. The levee design flow is 37,400 cfs, which at the time represented the 100-year flood and is 10-percent greater than the largest known flood, with a discharge of 34,000 cfs. Current hydrology has put the 100-year discharge at 45,452 cfs. Documentation provided by the NYSDEC indicates the Kingston Levee does not meet the freeboard requirements of 44 CFR 65.10 of the NFIP Regulations. Accordingly, the levee has been mapped as not providing protection against the 1-percent-annual-chance flood. Ellenville Flood Control Project - (Sandburg Creek) As a result of the extensive damage inflicted on the Village of Ellenville during the 1955 flooding, a local flood protection project for North Ellenville, Beer Kill, and Fantine Kill was initiated by USACE. This project, as authorized by the 1962 Flood Control Act, provides local works for the protection of Ellenville from the overflow of Beer Kill and Fantine Kill. Flooding in this area is the result of the closeness with which the streams discharge into Sandburg Creek, thereby causing their waters to sweep over the low-lying ground that separates the mouths of these streams. The improvement is designed to protect part of North Ellenville against a recurrence of a flood greater than the flood of 1955. Total protective works along Beer Kill and Fantine Kill extend approximately 16,130 feet, with 7,440 feet on the right bank of Beer Kill, 3,860 feet on the left bank of Beer Kill, 280 feet of flume near Main Street, and 275 feet of channel improvement. The protective works along Fantine Kill include 380 feet of channel improvement, a new channel 1,200 feet in length, and levees of 1,400 feet in length on the left bank and 1,300 feet in length on the right bank. Protective works consist of levees, walls, concrete flume, channel improvement, interior drainage and diversion ditches, ponding areas, the raising or replacement of bridges, abutments and approaches to the bridges, the removal of a dam, and the relocation of utility facilities and other structures. This flood-control project is not mapped as providing protection against the 1-percent-annual-chance flood.
12
Rosendale Flood Control Project – (Rondout Creek)
The Rosendale flood-control project consists of channel improvements, walls, levees, interior structures, ponding areas, a pumping station, road raising, and removal of buildings. The channel excavation consisted of deepening and widening for 11,300 feet, starting 1,000 feet upstream of the New York State thruway bridge and terminating 450 feet upstream of the James Street Bridge. The existing channel was widened and deepened through the gorge at Lefevre Falls for a distance of approximately 500 feet. This flood-control project is not mapped as providing protection against the 1-percent-annual-chance flood. Ashokan Reservoir – (Esopus Creek)
The Ashokan Reservoir, although not specifically designed for flood control, has historically provided some storage during floods. The reservoir is located on Esopus Creek 1.6 miles south of Ashokan and 9.1 miles northwest of the City of Kingston in Ulster County. The reservoir drains 256 square miles of land and has had water levels recorded daily since 1913. The Ashokan Reservoir is formed by the masonry Olive Bridge Dam across Esopus Creek and a series of earthen embankments between hills. The reservoir is divided into two basins separated by a weir containing a gate house. The initial filling of the reservoir began on September 9, 1913. Usable capacity of the west basin is 47,180 million gallons between a minimum operating level of 495.5 feet and the crest of the spillway to the east basin at an elevation of 590.0 feet. Dead storage below the minimum operating level is 2,237 million gallons. The east basin operates at a minimum level of 500.0 feet to the spillway crest elevation at 587.1 feet. Usable capacity of the east basin is 80,678 million gallons, with no dead storage. The reservoir impounds water for diversion into Catskill Aqueduct for the New York City water supply system.
Rondout Reservoir – (Rondout Creek)
The reservoir is located at the release chamber at Merriman Dam on Rondout Creek, 1.1 miles upstream from Brandy Brook, and 1.3 miles northwest of Lackawack in Ulster County. The reservoir drains 94.4 square miles of land and the water levels have been recorded since 1851. Rondout Reservoir is formed by an earthfill rockfaced dam. The reservoir was initially filled to capacity (crest of spillway) on March 28, 1955, approximately 4 years after its storage began on May 10, 1951. The minimum operating level elevation of 720.0 feet and crest of spillway elevation of 840 feet will yield a usable storage capacity of 50,048 million gallons. The dead storage below the minimum operating level is approximately 2,387 million gallons. The reservoir impounds water from the following sources: Rondout Creek; the Cannonsville Reservoir diverted through the West Delaware Tunnel; the Pepacton Reservoir diverted through the East Delaware Tunnel; and the Neversink Reservoir diverted through the Neversink-Grahamsville Tunnel. Water is also diverted from Rondout Reservoir for the New York City water supply through the West Tunnel of the Delaware Aqueduct.
3.0 ENGINEERING METHODS
For the flooding sources studied by detailed methods in the county, standard hydrologic and hydraulic study methods were used to determine the flood hazard data required for this FIS. Flood events of a magnitude that are expected to be equaled or exceeded once on the average during any 10-, 50-, 100-, or 500-year period (recurrence interval) have been selected as having special significance for floodplain management and for flood insurance rates. These events, commonly termed the 10-, 50-, 100-, or 500-year floods, have a 10-, 2-, 1-, and 0.2-percent

13
chance, respectively, of being equaled or exceeded during any year. Although the recurrence interval represents the long-term, average period between floods of a specific magnitude, rare floods could occur at short intervals or even within the same year. The risk of experiencing a rare flood increases when periods greater than 1 year are considered. For example, the risk of having a flood that equals or exceeds the 1-percent-annual-chance flood in any 50-year period is approximately 40 percent (4 in 10); for any 90-year period, the risk increases to approximately 60 percent (6 in 10). The analyses reported herein reflect flooding potentials based on conditions existing in the community at the time of completion of this study. Maps and flood elevations will be amended periodically to reflect future changes.
3.1 Hydrologic Analyses
Hydrologic analyses were carried out to establish peak discharge-frequency relationships for each flooding source studied by detailed or limited detailed methods in the county.
Precountywide Analyses
In the Town of Hurley, discharges for Esopus Creek were previously developed by the USACE—New York District and NYSDEC, using a USACE HEC-1 model of the entire Esopus Creek basin. One of the key assumptions in this USACE HEC-1 model was that the Ashokan Reservoir would be full or nearly full during the occurrence of a major storm. When this assumption is input into the USACE HEC-1 model, very large discharges for respective recurrence intervals in the lower Esopus Creek basin were created. When considering worst case flooding and determining a Standard Project Storm or a Probable Maximum Flood (PMF), the assumption is that the reservoir is full approximately 2 to 3 months out of the year; however, in developing a statistical analysis of past flooding, this assumption cannot be made because the reservoir has not been full during any of the large historic floods. A more appropriate method for determining the discharge-frequency relationship for the reservoir outflow is to perform a log-Pearson Type III analysis of the outflows from the Ashokan Reservoir. This leaves out any assumptions concerning the initial water-surface elevation (WSEL) in the reservoir and models what has actually occurred in the past for the lower Esopus Creek basin. Therefore, a log-Pearson Type III analysis was performed using the last 42 years of peak recorded outflows from the Ashokan Reservoir. Using these revised peak discharges (determined from the log-Pearson Type III analysis), hydrographs for the 10-, 50-, 100-, and 500-year floods were then estimated using the previously determined hydrographs (from the original USACE HEC-1 model) as a guide. These hydrographs were then routed using the USACE HEC-1 models (1981 version) through the study area. For streams studied by detailed methods in the FIS for the Town of Hurley, dated August 18, 1992, the peak discharges of the 100-year recurrence interval were determined using the procedures and regression equations outlined in gaged streams. For the southeastern region of New York State, the following equation was used:
Q = K(DA)XSY(P-20)Z
Where Q is the stream discharge: DA is the drainage area; S is the main channel slope; and K, x, y, and z are functions of the frequency. The value used for (K) was 0.138, for (x) 1.06, for (y) 0.447, and for (z) 1.57.

14
In the Towns of Olive and Shandaken, the NYSDEC developed a model of the Esopus Creek basin using the USACE HEC-1 computer program. The model was modified by the USACE—New York District to reflect the flood of March 21-22, 1980, at the Coldbrook gaging station. Hypothetical storms with recurrence intervals of 10, 50, 100, and 500 years were then developed using Technical Memorandum HYDRO-35 and Technical Paper 40. By computing the 10-, 50-, and 100-year floods on the model and adjusting the constant loss rate of rainfall to a reasonable value, peak discharges were produced at Coldbrook in close agreement with the peak discharge-frequency relations based on a 49-year record of flood peaks observed at Coldbrook. However, no agreement between the hypothetical 500-year flood and the peak discharge versus frequency curve based on observed flood peaks was possible. Peak discharges were required at Coldbrook and four points upstream to the Town of Shandaken for the 10-, 50-, 100-, and 500-year hypothetical floods and the flood of March 21-22, 1980. The procedure used to define these discharges is as follows. Peak discharges at Coldbrook for the 10-, 50-, 100-year flood were computed by the USACE HEC-1 computer model using the hypothetical storms. The 500-year peak discharge at Coldbrook was taken from the peak discharge-frequency curve based on observed floods. These discharges were plotted, and the curve was adjusted for partial duration and then used as the peak discharge-frequency relation for Coldbrook. For the four points upstream of Coldbrook, the 10-, 50- and 100-year peak discharges computed by the USACE HEC-1 model from the hypothetical storms were plotted, and curves were drawn. The curves were extended to a 500-year recurrence interval by making them parallel to the curve for Coldbrook. They were also adjusted for partial duration. In the Town of Wawarsing hydrologic analyses were made to determine the peak discharges for the 10-, 50-, 100-, and 500-year floods and the June 1972 and March 1980 floods at various points of interest along Rondout Creek and Sandburg Creek. The hydrologic analyses were based on a study done by Water Resources Engineers, Inc. Modifications were made to the basic model as necessary to provide information at the required locations. The revised model was then calibrated to updated discharge-frequency relationships for the hypothetical events and to observed data for the June 1972 and March 1980 storms. Updated discharge-frequency relationships were developed according to current Water Resources Council guidelines by using a USACE computer program for four USGS gages. The gages included USGS gage No. 01365000 on Rondout Creek near Lowes Corners (1937-1979), USGS gage No. 01365500 on Chestnut Creek at Grahamsville (1939-1979), USGS gage No. 01366650 on Sandburg Creek at Ellenville (1957-1977), and USGS gage No. 01367500 on Rondout Creek at Rosendale (1910, 1915-1918, and 1927-1980). Data for the gages were obtained from the USGS in the form of annual peak discharges. The calibration of the model was accomplished by the utilization of the USACE HEC-1 computer program. In the Town of Woodstock, two regional analysis methods were used to compute peak discharges for the FIS dated September 27, 1991. A USGS analysis, “Techniques for Estimating Magnitude and Frequency of Floods on Rural Unregulated Streams in New

15
York,” utilized gage data throughout New York State to formulate regression equations for use on ungaged streams. The Stankowski Method utilized the parameters of drainage area, channel slope, and impervious area in regression equations. Peak discharges were also computed using an SCS method.
September 25, 2009, FIS
Rondout Creek
In the previous effective studies, the hydrologic analysis for Rondout Creek was performed in two parts. These parts consisted of the portions above and below the confluence of the Wallkill River with Rondout Creek.
Above the confluence of the Wallkill River, the previous effective study for Rondout Creek was performed using a log-Pearson Type III analysis based on USGS gage No. 01367500 on Rondout Creek at Rosendale, New York using the period of record from 1927 to 1981. The previous study also performed a log-Pearson Type III analysis using only the 38 years of regulated record (1944 to 1981) to reflect the operation of the Rondout Reservoir, located approximately 35 stream miles upstream of the Rosendale gage. The results of the regulated-only analysis were almost identical to the analysis of the entire record. Therefore, the effects of regulation or diversion were deemed negligible at the gage site.
As described in the previous study for the Town of Rosendale:
“The hydrologic analysis below the confluence of the Wallkill River is complicated by the fact that the Wallkill River basin is approximately twice as large as the Rondout Creek basin at the confluence of the two streams, but the discharges of the Wallkill River are lower due to the geologic conditions in the basin (Reference 1). Therefore, a drainage area-discharge transfer using the Rosendale gage would not be reliable, and a different method of analysis was required. The methodology in a regional frequency study by the COE was selected for this application (Reference 2). Basin characteristics for each stream were averaged using information from USGS gages Nos. 01367500 on Rondout Creek at Rosendale and 01371500 on the Wallkill River at Gardiner, New York. Discharges for Rondout Creek were then developed and modified to closely relate to the August 1955 and October 1955 floods, which are the floods of record for Rondout Creek and the Wallkill River.”
The previous study for the Town of Rosendale also mentions that the discharges on the Wallkill River are influenced by topographic constrictions in the Perrine’s Bridge area and large amounts of available storage upstream of Perrine’s Bridge. As described in that report:
“Discharges for the Wallkill River were developed using the HEC-1 Modified Puls storage routing model. The flood of October 1955 at the USGS gage in Gardiner, New York, was assigned a recurrence interval of 100 years in the USGS Report No. 78-322 (Reference 3). Discharge ratios used in deriving the discharges for the different frequencies in the HEC-1 analysis were taken from the information provided in the above mentioned report. Surveyed cross-section data and USGS topographic maps were used to determine the storage-elevation

16
relationships for the Wallkill River. A rating curve of elevation-discharge was developed from the COE HEC-2 model. The October 1955 hydrograph, discharge ratios, storage-elevation relationships, and the elevation-discharge rating curve were incorporated into the HEC-1 model. The derived discharges were then used in the HEC-2 model, and the model was adjusted to match the observed elevations of the October 1955 flood.”
For the present study, the hydrological analysis of Rondout Creek is divided into two parts—upstream and downstream of the confluence with the Wallkill River—as it was in the previous study. Rondout Creek upstream of the confluence with the Wallkill River: A Log-Normal Graphical Analysis was conducted for USGS Gage 1367500, located at Rosendale on Rondout Creek. This analysis was performed graphically because the record includes the possible effects of regulation by the Rondout Reservoir. The graphical analysis was performed for the period of record after 1943, when the Rondout Reservoir became operational. The contributing area at the Rosendale gage is 383 square miles, and the regulated period of record consists of 61 years (1944 to 2004). In addition, two log-Pearson Type III analyses were conducted for the regulated period (1944 to 2004), and for the entire period of record (1927 to 2004). The results of these two new analyses are similar, indicating that the effects of regulation appear to be negligible, as the previous FIS concluded. The effective discharges are more conservative than the newly computed discharges and the regulated results vary by less than 15 percent. Therefore, the effective discharges are nominated for new Hydraulic Studies at the Rosendale USGS gage location. Additional nominations were transferred from the Rosendale gage location using a discharge-area relationship derived from the 1991 USGS regression equations, or by interpolation based on relative drainage areas. Rondout Creek downstream of the confluence of the Wallkill River: There is no USGS gage record at or below the confluence of the Wallkill River with Rondout Creek. To obtain a relationship for the combined contribution of the drainage areas (1,173 square miles), a timing analysis was conducted using 15-minute interval hydrographs for two USGS gages. The gage at Rosendale on Rondout Creek (383 square miles of drainage area at Rosendale) is near the confluence. However, the gage at Gardiner on the Wallkill River (695 square miles of drainage area at Gardiner) is roughly 15 miles upstream of the confluence, and has a difference of approximately 91 square miles of contributing drainage area (695 vs. 786 square miles). The results of the gage analysis at Gardiner were transferred downstream using the discharge-area relationship derived from the USGS Regression Equation for NYS Region 4. Peak flows for Rondout Creek below the confluence with the Wallkill River were estimated by combining hydrographs from the two streams. An estimate of the lag time between the arrivals of the two hydrographs at the confluence is required to combine the two hydrographs. Ranges of lag times were estimated from general channel and flood conditions. These estimates were applied to 15-minute interval hydrographs from the Rosendale and Gardiner gages for a November 2005 event. The 15-minute interval

17
hydrograph for Gardiner was transferred downstream, taking into consideration the additional 91 square miles of contributing area. Various lag times were assumed and graphically combined with the 15-minute interval hydrograph for Rosendale. This resulted in the combined peak discharges equal to a fraction (between 0.91 and 0.99) times the sum of the peak discharges of each hydrograph. These relationships were applied to the updated gage analyses for Rosendale and Gardiner to estimate the 10-, 2-, 1-, and 0.2-percent-annual-chance discharges. The previous effective discharges compare well with the newly estimated discharges for the confluence of the Wallkill River with Rondout Creek, and the previous effective discharges are the more conservative estimates. Therefore, the previous effective discharges are nominated for the reach of Rondout Creek below the confluence with the Wallkill River. The results of the analysis were transferred downstream using the discharge area relationship derived from the USGS regression equations New York State Region 4 (Reference 4). The nominated discharges for Rondout Creek are presented in Table 4, “Summary of Discharges.” Esopus Creek This countywide FIS includes a Limited Detailed Study on Esopus Creek of approximately 7.3 miles, proceeding immediately downstream from the Ashokan Reservoir. This reach was mapped previously as an approximate study; therefore, discharges were not reported. In the previous FIS, a detailed study was carried out for locations farther downstream on Esopus Creek, and flow nominations were reported at several locations, including the Mount Marion gage site (USGS 01364500), the City of Kingston, and the downstream corporate limits of the Town of Hurley. Peak flow nominations were also reported for the 100-year return period at the downstream corporate limit of the Town of Marbletown. These effective flows were determined using a HEC-1 analysis, which was a revision of an earlier HEC-1 analysis used in the original FEMA FIS. The original modeling was based on the assumption that the Ashokan Reservoir would be at spillway crest at the time of the flooding event. However, subsequent observations of reservoir levels during actual flooding events suggested that the full-reservoir scenario was less likely than first assumed. Therefore, the HEC-1 model was updated in the previous FIS to anticipate some storage capacity in the reservoir. Printouts of the revised HEC-1 model for Esopus Creek were obtained from NYSDEC and compared to the effective discharges obtained from the previous FIS reports. This FIS compares the previous effective flows, based on the revised HEC-1 model, to an analysis of three gage records. The comparison is based on records for the Mount Marion gage on Esopus Creek (USGS 01364500), the Coldbrook gage (USGS 01362500), which provides a record of inflow to the Ashokan Reservoir, and the spill and release records for the Ashokan Reservoir (NYCDEP). The analysis provides an estimate of probable reservoir storage, based on inflow and outflow from the reservoir, recorded for several of the larger events. The drainage area at Coldbrook is 192 square miles, the drainage area for the Ashokan Reservoir is 256 square miles, and the drainage area at Mount Marion is 419 square miles. For the larger events that are available at all three locations, the available storage capacity of the Ashokan Reservoir appears to be a key factor in the resulting discharge below the reservoir.

18
The Mount Marion gage record provides historic flows for the years of 1908 to1915 and 1971 to 2004. It does not include the years between 1915 and 1971. The Coldbrook gage record was used to estimate the historical inflows to the Ashokan Reservoir for the years of 1932 to 2004. The probability-peak discharge analyses for both the Mount Marion gage and the Ashokan Reservoir spill and release data used graphical plotting techniques in consideration of the influence of regulation from the Ashokan Reservoir. The updated analysis for the Mount Marion gage indicates peak flows considerably lower than the HEC-1 analysis used in the FIS study. These results again suggest that the contribution of the regulation at the Ashokan Reservoir is significant. This supports the assumptions and revisions of the HEC-1 model, as presented in the 1992 Saugerties FIS, that attempted to take into account the available storage capacity of the Ashokan Reservoir. To determine the validity of the 1992 Saugerties FIS, an analysis of 18 large flood events was conducted. This analysis compared the gage records for Coldbrook (estimate of the inflows to the reservoir) and the spill and release records for the Ashokan Reservoir (estimate of outflows of the reservoir) to determine the effect of reservoir storage on flood events. This storage effect analysis was then used to determine the reservoir outflow discharges for the 10-, 2-, 1-, and 0.2-percent annual-chance events for the corresponding inflows at the Coldbrook USGS gage. The resulting values are consistent with the modeled outflows of the Ashokan Reservoir obtained from the revised HEC-1 model printouts. Printouts of the revised HEC-1 model output for Esopus Creek were obtained from the NYSDEC. The modeled flows were extracted from those printouts and used to develop discharge nominations for the Limited Detailed Study on Esopus Creek. The modeled outflows for the Ashokan Reservoir are nominated at the upstream end of the Limited Detail Study. The effective discharge, from the Town of Marbletown FIS, is nominated for the downstream end of the Limited Detail Study at Hurley Mountain Road. A portion of Esopus Creek upstream of the confluence with the East Ashokan Reservoir Spillway is not affected by reservoir outflows. Peak flows for this upstream section were nominated using the USGS regression equations for New York State. The nominated discharges for Esopus Creek are presented in Table 4, “Summary of Discharges.” Twaalfskill Brook Twaalfskill Brook in the City of Kingston was formerly mapped as an approximate study, and no discharges were reported. In the present study, Twaalfskill Brook is studied by detailed methods. Discharges were determined using the 1991 USGS regression equations for New York State. This method is applicable since the stream is unregulated, and urbanization is minor (less than 15 percent of the contributing drainage area is classified as impervious). The nominated discharges for Twaalfskill Brook are presented in Table 4, “Summary of Discharges.”

19
Saw Kill Previous studies of Saw Kill are mentioned in the FIS reports for the Towns of Kingston (1988) and Woodstock (1991). Saw Kill also passes through the Town of Ulster (1984), where it has a confluence with Esopus Creek, but no mention is made of it and no nominations are given in the Town of Ulster FIS. The Woodstock FIS indicates that two older methods, based on regional regression analyses, were used to nominate peak flows within the community – the Stankowski Method and the 1979 USGS Regression Equations for New York. However, it was not stated which method was used to make specific peak flow nominations along the Saw Kill. Nominations were given for only the 1-percent-annual-chance event. The Kingston FIS lists nominations based on a USACE HEC-1 study of the Saw Kill basin in the Towns of Kingston, Ulster, and Woodstock. The present study compares previous nominations from the Kingston FIS (which were obtained using the USACE HEC-1 model) to peak flows estimated using the 1991 USGS Regression Equations for New York State. At a location with approximately 35 square miles of drainage area, regression equation peak flows were within 13 percent of the previously nominated values. The 95 percent confidence interval for Region 4 of the regression equations is 56.6 percent. Since the regression equation estimates are within the recommended confidence limits, and considering the greater level of detail used in the USACE HEC-1 analysis, the previous peak flows were nominated for Saw Kill. Unfortunately, the peak flows in the previous study as reported in the Kingston FIS were shown for only two locations and for only the 100-year return period. Records of a HEC-2 run from the previous study for the Saw Kill 100-year event were used to determine in detail the locations and discharge values used for the 1-percent-annual-chance event in the present study. These locations and discharges were duplicated in the updated hydraulic modeling for the present study. Also, discharges for the 10-, 2-, and 0.2-percent-annual-chance discharges were taken from archived engineering notes listing the 100-year discharges and locations consistent with those in the HEC-2 model run, along with the discharges for the 10-, 50-, and 500-year return periods. These notes were presumed to document discharges and locations from the HEC-1 study. This Revision Hydrologic computations and analyses consist of determining the discharges for the 10-percent, 4-percent, 2-percent, 1-percent, and 0.2-percent-annual-chance flood events for streams studied using detailed methods, and 1-percent-annual-chance flood events for limited detail and approximate study streams within the watersheds. The hydraulic methods used for this analysis include steady flow analysis using HEC-RAS version 4.1. RAMPP will determine peak flood discharges for the 1-percent-annual-chance flood event that uses the effective New York State USGS regression equations (area only) and gage analysis, if applicable. For drainage areas where a regression analysis is not appropriate, the latest hydrologic analyses guidance found in the NY State Department of Transportation (NYDOT) Highway Drainage Manual will be used. Per the NYDOT guidance, for areas up to 200 acres, the Rational Method with higher runoff coefficients for steeper slopes will be used, while TR-55 will be used for drainage areas up to 640 acres. Small lakes on detailed study reaches that were not constructed as flood-controls structures and that do not have sufficient storage to affect the 100-year WSEL will use the appropriate and most recent

20
full versions of the USGS regression equations to determine a 10-, 4-, 2-, 1-, and 0.2-percent-annual-chance flood event. A rainfall/runoff model will not be completed for these reaches. For detailed study reaches on lakes with significant storage, an inflow hydrograph based on a hydrograph created by the USGS’s National Streamflow Statistics program for New York State will be used. An inflow hydrograph will be hydraulically routed (using a program like HEC-HMS 3.3) through the lake and the outlet structures (principal, emergency spillways) to determine 10-, 4-, 2- ,1-, and 0.2-percent-annual-chance WSELs. For the approximate and limited detail hydrologic analyses, full parameter regression equations from USGS’s Magnitude and Frequency of Floods in New York, SIR 2006-5112, were used to compute the 1-percent-annual-chance flood discharges. The New York USGS’s StreamStats web application (Reference 5) of the regression equations was used to compute desired flood discharges. For watersheds with specific modeling approaches, details are shown below: Esopus Watershed: Flood flow frequencies for all the study streams were developed using a calibrated rainfall-runoff model of Esopus Creek watershed. The model was developed following the criteria outlined in Appendix C of the FEMA Guidelines and Specificatons. The Rainfall-Runoff model was developed using the HEC-HMS 3.5 computer model (Reference 42). Hydrologic losses were based on the Natural Resource Conservation Service’s (NRCS) Curve Number method; rainfall-runoff transformations were based on NRCS (unit hydrograph) procedures; and reach routing was based on the Muskingum-Cunge method. Reservoir routing for the Ashokan Reservoir was based on the curves developed by NYCDEP for a Dam Break study (Reference 43). The model calibration and verification were performed by simulating historic flood events. Calibration was performed for Hurricane Irene, which occurred in August 2011, and verifications were performed for Tropical Storm Lee, which occurred in September 2011 and another storm that occurred in October 2005.
Hypothetical rainfall data (frequency storm) are used to develop peak flow hydrographs for the five return intervals scoped for the project. The frequencies considered for this study are 10-Year (10 percent), 25-year (4 percent), 50-Year (2 percent), 100-Year (1percent) and 500-Year (0.2 percent). The hypothetical rainfall used in this study was based on National Oceanic and Atmospheric Administration Atlas 14 data and was obtained from the Northeast Regional Climate Center – Cornell University. The duration chosen for the frequency storm is 24-hour and the type of distribution chosen is SCS Type-2. Neversink Watershed: The peak discharge computation procedure is presented in the USGS Scientific Investigations Report (SIR) 2006-5112, Magnitude and Frequency of Floods in New York. The methodology outlines the following steps, which were performed to determine peak discharge rates. Step 1 was the only step performed for ungaged streams. Gage weighting was performed for ungaged flow breakpoint locations within the drainage area

21
influence of the USGS gage on gaged streams. Gage selection and influence criteria is further discussed in section 2.2.3 of the SIR report.. SIR 2006-5112 sub-divided New York into six hydrologic regions by considering regional differences in physiographic and geologic conditions. These delineations were evaluated using statistical tests to compare regression residuals among the six regions. In regions where the mean residuals did not differ statistically, other factors such as topography, geology, climate, and hydrologic judgment were used. The Neversink Watershed is in hydrologic region 3. The regional regression equations used for peak discharge computations, presented in SIR 2006-5112, are listed below.
Q10 = 0.103 (A) 0.963 (LAG+1) -0.228 (RUNF) 0.658 (MXSNO) 1.794 Q 25 = 0.117 (A) 0.957 (LAG+1) -0.239 (RUNF) 0.524 (MXSNO) 2.016 Q50 = 0.119 (A) 0.953 (LAG+1) -0.244 (RUNF) 0.430 (MXSNO) 2.195 Q100 = 0.115 (A) 0.951 (LAG+1) -0.249 (RUNF) 0.341 (MXSNO) 2.375 Q500 = 0.105 (A) 0.948 (LAG+1) -0.258 (RUNF) 0.147 (MXSNO) 2.759
Where,
Q is flow, in cubic feet per second A is drainage area, in square miles LAG is basin lag factor calculated as L / [(SL_UP + 1) (SL_LO + 1)] 0.5 RUNF is mean annual runoff, in inches MXSNO is seasonal maximum snow depth, 50th percentile, in inches.
A summary of the drainage area-peak discharge relationships for the streams studied by detailed methods is shown in Table 4, "Summary of Discharges.

22
TABLE 4 - SUMMARY OF DISCHARGES
Flooding Source Location
Drainage Area
Peak Discharges (cubic feet per second)
10-Percent- 2-Percent- 1-Percent- 0.2-Percent- square miles
Annual Chance
Annual Chance
Annual Chance
Annual Chance
Alton Creek
Above Alton Creek Tributary 1.08 248 531 698 1,274
Above confluence with Birch Creek 2.43 563 1,220 1,615 2,989
Alton Creek Tributary Above confluence with Alton Creek 0.54 140 300 394 718
Beaver Kill
Above confluence with Mink Hollow 1.45 234 448 583 1,002
Above confluence with Wagner Creek 13.59 2,601 5,232 6,942 12,666
Confluence of Beaver Kill and Hoyt Hollow 20.58 3,683 7,583 10,109 18,446
Above confluence with Esopus Creek 25.06 4,613 9,583 12,764 23,147
Birch Creek
Birch Creek at intersection of Birch Creek Rd and Lower Birch Creek Rd 3.05 602 1,348 1,797 3,365
Above confluence withAlton Creek 4.96 936 2,060 2,738 5,094
Above confluence with Giggle Hollow 7.96 1,564 3,433 4,570 8,484
Above confluence with Rochester Hollow 10.24 1,838 4,033 5,390 10,016
Above confluence with Esopus Creek 12.86 2,253 4,937 6,569 12,348
Broad Street Hollow Above confluence with Esopus Creek 7.29 1,772 3,628 4,810 8,598
Bush Kill
Above confluence with Kanape Brook 1.11 215 503 695 1,319
Above confluence with Mine Hollow 5.16 464 1,110 1,557 3,058
Above confluence with South Hollow 6.3 647 1,537 2,150 4,193
Above confluence with Maltby Hollow Brook 10.09 1,255 3,046 4,271 8,319
Above confluence with Dry Brook 17.51 2,485 6,058 8,484 16,492
Above oulet into Ashokan Reservoir 19.66 2,835 6,938 9,725 18,904
Bushnellsville Creek
2000 ft Upstream of Gossoo Rd 8.59 1,823 3,787 4,944 8,930
Above confluence with Esopus Creek 11.12 2,200 4,654 6,114 11,213

23
TABLE 4 - SUMMARY OF DISCHARGES (CONT’D)
Flooding Source Location
Drainage Area
Peak Discharges (cubic feet per second)
10-Percent- 2-Percent- 1-Percent- 0.2-Percent- square miles
Annual Chance
Annual Chance
Annual Chance
Annual Chance
Cross Mountain Hollow Above confluence with Woodland Creek 2.5 537 1,260 1,740 3,301
Dry Brook
Near upstream end of Dry Brook Rd 1.36 244 600 843 1,647
Above confluence with Bush Kill 2.01 336 832 1,174 2,310
Esopus Creek Reach 2
Above confluence with Elk Bush Kill 11.8 2,711 5,390 6,943 12,199
Above confluence with McKinley Hollow 16.14 3,539 7,051 9,104 16,133
Above confluence with Hatchery Hollow 20.66 4,393 8,919 11,611 20,869
Above confluence with Lost Clove 26.66 5,439 11,397 15,007 27,333
Above confluence with Birch Creek 29.95 5,886 12,406 16,312 30,206
Above confluence with Bushnellsville Creek 47.57 8,716 18,444 24,287 45,372
Above confluence with Peck Hollow 63.71 11,390 24,274 31,925 60,210
Above confluence with Broad Street Hollow 69.95 12,600 26,827 35,214 66,342
Above confluence with Woodland Creek 83.98 15,173 31,970 42,159 79,494
Above confluence with Stony Clove Creek 105.3 18,209 38,121 51,036 97,916
Above confluence with Beaver Kill 144.23 24,183 50,173 68,362 134,869
Above confluence with Little Beaver Kill 173.1 28,476 59,272 80,683 158,630
Above Ashokan Reservoir 193.64 30,440 63,747 86,781 169,597
Fox Hollow At Herdmand Rd 2.36 691 1,401 1,814 3,216
Little Beaver Kill
At Yankeetown Pond Outlet 4.04 735 955 1,279 2,261
At 6000 ft downstream of Coldbrook Rd 7.43 740 1,416 1,940 3,806
At Woodstock-Olive corporate boundary 13.38 1,455 3,185 4,351 8,361
Above confluence with Esopus Creek 16.73 1,839 4,038 5,520 10,553

24
TABLE 4 - SUMMARY OF DISCHARGES (CONT’D)
Flooding Source Location
Drainage Area
Peak Discharges (cubic feet per second)
10-Percent- 2-Percent- 1-Percent- 0.2-Percent- square miles
Annual Chance
Annual Chance
Annual Chance
Annual Chance
Maltby Hollow Brook
Above confluence with Unnamed Tributary 3.3 553 1,321 1,837 3,531
Above confluence with Bush Kill 6.85 1,192 2,919 4,067 7,864
Mink Hollow
Above confluence with Unnamed Tributary 3.11 1,006 2,069 2,746 4,876
Above confluence with Beaver Kill 9.46 2,605 5,314 7,058 12,583
Muddy Brook Above confluence with Woodland Creek 1.42 312 729 1,006 1,926
Rondout Creek Reach 2
At county line 33.4 5,030 8,020 9,470 13,300
Downstream of confluence of Sundown Creek 33.1 5,000 7,980 9,420 13,300
At Bridge 26.3 4,260 6,840 8,100 11,400
Downstream of confluence of High Falls Brook 24.4 4,260 6,840 8,100 1,140
Upstream of confluence of High Falls Brook 22.3 4,260 6,840 8,100 11,400
Stony Clove Creek
Above confluence with Warner Creek 17.51 4,772 10,569 14,324 26,694
Above confluence with Ox Clove 27.06 5,807 12,979 17,606 32,650
Above confluence with Esopus Creek 32.44 6,966 15,463 20,895 38,759
Sundown Creek
At confluence with Rondout Creek 6.77 1,320 2,320 2,840 4,320
Downstream of confluence of Unnamed Tributary 1 5.8 1,150 2,020 2,840 3,770
Upstream of confluence of Unnamed Tributary 1 5 995 1,750 2,150 3,270
Downstream of confluence of Unnamed Tributary 2 4.66 934 1,650 2,020 3,080
Upstream of confluence of Unnamed Tributary 2 3.1 633 1,120 1,370 2,090
Downstream of confluence of Unnamed Tributary 3 3.05 623 1,100 1,350 2,050
Upstream of confluence of Unnamed Tributary 3 1.73 375 665 816 1,250
Downstream of confluence of Unnamed Tributary 4 1.34 297 528 649 994
Upstream of confluence of Unnamed Tributary 4 0.76 176 313 385 591

25
TABLE 4 - SUMMARY OF DISCHARGES (CONT’D)
Flooding Source Location
Drainage Area
Peak Discharges (cubic feet per second)
10-Percent- 2-Percent- 1-Percent- 0.2-Percent- square miles
Annual Chance
Annual Chance
Annual Chance
Annual Chance
Wagner Creek Above confluence with Beaver Kill 3.87 532 1,230 1,702 3,249
Warner Creek Above confluence with Stony Clove Creek 9.04 1,448 3,162 4,281 7,915
Woodland Creek
Above confluence with Mount Hollow 9.63 1,930 4,442 6,103 11,485
Above confluence with Woodland Creek Tributary 1 12.9 2,555 5,920 8,143 15,398
Above confluence with Panther Kill 15.14 2,938 6,868 9,501 18,113
Above confluence with Muddy Brook 18.76 3,698 8,598 11,934 22,655
Above confluence with Esopus Creek 20.58 3,991 9,352 13,011 24,747 Woodland Creek Tributary
1 Above confluence with Woodland Creek 0.37 113 257 353 668

26
For the Hudson River, stillwater elevations were taken from the prior FISs. Stage-frequency relationships for the Hudson River were developed by the USACE at Catskill, Spuyten Duyvil, and the mouth of Wappinger Creek. The USACE basic data covers recurrence periods from 1 year to 200 years and has been extrapolated to a 500-year frequency on log-probability paper. Tidal stages for points between the mouth of Wappinger Creek and Catskill were obtained by interpolation. Some stillwater elevations were taken from the FIS for the Town of Catskil. Rondout Reservoir 100- and 500-year WSELs are based on a HEC-1 model of the PMF completed for the Rondout Reservoir, by GZA GeoEnvironmental of New York, Buffalo, New York, (2005), Final Hydrology Study Report for the Merriman Dam and Rondout Reservoir, Contract CAT-146, Capital Project No.WM-30, Detailed Study/Investigation for the Reconstruction of the Dams in the Catskill & Delaware Watersheds. Prepared for the New York DEP, Bureau of Environmental Engineering Watershed Facilities Design, Corona, New York. This model was converted to HEC-HMS. Rainfall data for 100- and 500-year frequency based storms in the converted model are based on the values for the centroid of the Rondout Watersheds from: Extreme Precipitation in New York & New England. Elevations for floods of the selected recurrence intervals are shown in Table 5, “Summary of Stillwater Elevations.”

27
TABLE 5 - SUMMARY OF STILLWATER ELEVATIONS
ELEVATION (FEET NAVD 88)
FLOODING SOURCE AND LOCATION 10-Yr. 25r. 50-Yr. 100-Yr. 500-Yr.
ASHOKAN RESERVOIR
West Basin (Ashokan Reservoir) 592.6 593.9 595.1 596.5 600.7
East Basin (Ashokan Reservoir) 588.8 589.7 590.5 591.4 594.4
HUDSON RIVER At Newburgh, New York 5.5 * 6.6 7.2 8.7 At Poughkeepsie, New York 5.9 * 7.1 7.9 9.7 In the Vicinity of Hyde Park 5.8 * 7.2 7.9 9.7 At Kingston Point 6.0 * 7.5 8.9 10.4 In the Vicinity of Tivoli 6.1 * 7.8 8.5 10.6 At upstream Town of Saugerties corporate limits 6.2 * 7.9 8.5 10.8
KENOZIA LAKE
Generic Junction 693.9 694.7 695.4 696.4 699.1
LITTLE BEAVER KILL
Little Beaver Kill at Yankeetown Pond Outlet 843.5 843.5 844.2 844.9 846.6 PEEKAMOOSE LAKE Entire shoreline * * * 1453.9 * RONDOUT POND Entire shoreline * * * 1944.8 * RONDOUT RESERVOIR Entire shoreline * * * 844.2 846.3 *Data Not Available

28
3.2 Hydraulics Analyses
Analyses of the hydraulic characteristics of flooding from the stream sources studied were carried out to provide estimates of the elevations of floods of the selected recurrence intervals. Users should be aware that flood elevations shown on the \FIRM represent rounded whole-foot elevations and may not exactly reflect the elevations shown on the Flood Profiles or in the Floodway Data Table in this FIS report. Flood elevations shown on the FIRM are primarily intended for flood insurance rating purposes. For construction and/or floodplain management purposes, users are cautioned to use the flood elevation data presented in this FIS report in conjunction with the data shown on the FIRM.
Cross-section elevations were extracted from a Digital Elevation Model (DEM). The DEM was generated by combining overbank elevation data from an aerial Light Detection and Ranging (LiDAR) survey with data from a traditional field survey of the stream channel and the immediate overbank areas. For detailed studies, cross sections were field surveyed at close intervals just upstream and downstream of bridges, culverts, dams, and other hydraulic obstructions, at natural control sections along the stream length, and at significant changes in ground relief, land use, or land cover. Detailed structural geometry for bridges and culverts was also obtained from NYDOT as-built drawings where they were available.
The hydraulic analyses for this study were based on unobstructed flow. The flood elevations shown on the Flood Profiles (Exhibit 1) are thus considered valid only if hydraulic structures remain unobstructed, operate properly, and do not fail. Precountywide Analyses In the Town of Hurley, WSELs of floods of the selected recurrence intervals were computed using the USACE HEC-2 step-backwater computer program. For this August 18, 1992, FIS, the computer model was calibrated using historic floodwater profiles. Flood profiles were drawn showing computed WSELs for floods of the selected recurrence intervals. Starting WSELs for Esopus Creek were taken from the FIS for the Town of Ulster. Starting WSELs for the remaining streams studied in detail were calculated using the slope-area method. The approximate analyses for the Ashokan Reservoir, First Lake, and Kenozia Lake were taken from the USGS publication, Determination of Approximate 100-Year Flood Boundaries for Streams in New York State. In the Towns of Olive and Shandaken, WSELs of floods of the selected recurrence intervals were computed using the USACE HEC-2 step-backwater computer program Flood profiles were drawn showing computed WSELs for floods of the selected recurrence intervals. Starting WSELs for Esopus Creek were calculated by the slope/area method. In the Town of Wawarsing, the WSELs of floods of the selected recurrence intervals were computed using the USACE HEC-2 step-backwater computer program. The hydraulic model was adjusted using available high-water marks of the March 1980 flood. The USGS gaging station rating table for Sandburg Creek was also used when adjusting the hydraulic model for Sandburg Creek. Starting WSELs for the streams studied by detailed methods were determined using the slope/area method.

29
In the Town of Woodstock, the WSELs of floods of the selected recurrence intervals were computed using the USACE HEC-2 step-backwater computer program. The starting WSEL for Saw Kill was determined by coincident peak. The starting WSEL for Beaver Kill and West Branch Tannery Brook were determined by critical depth. The starting WSEL for East Branch Tannery Brook was determined by the slope/area method. September 25, FIS WSELs for floods of the selected recurrence intervals for detailed, limited detail, and approximate studies were computed using the USACE Hydrologic Engineering Center River Analysis System (HEC-RAS) river modeling software program (Version 3.1.3). The HEC-RAS model for each flooding source is based on cross-section geometry generated using manual and semi-automated methods derived from GIS techniques and data. In accordance with FEMA’s Guidelines and Specifications, starting WSELs for the hydraulic models were determined using normal depth. For reaches where the hydraulic analysis indicated supercritical flow conditions, critical depth was assumed for the flood elevations. Rondout Creek This detailed restudy begins at the confluence with the Hudson River in the City of Kingston/Town of Esopus, and extends upstream approximately 12.5 miles to the Lawrenceville Road Bridge in the Town of Rosendale. Twaalfskill Brook Prior to this countywide analysis, Twaalfskill Brook was studied by approximate methods. For this new detailed study, the reach begins at the confluence with Rondout Creek and extends upstream approximately one half mile to the Brook Street crossing in the City of Kingston Saw Kill Prior to this countywide analysis, Saw Kill Creek was studied by approximate methods in the Town of Ulster, and detailed methods in the Towns of Kingston and Woodstock. This detailed study/restudy for Saw Kill begins at the confluence with Esopus Creek in the Town of Ulster, extends upstream approximately 8.46 miles, and ends approximately 2,020 feet above the dam at Kingston Reservoir #2. This FIS only covers the 3.48-mile portion of the stream between its confluence with Esopus Creek and the Town of Kingston/Town of Woodstock corporate limits. Esopus Creek (Limited Detailed) Prior to this countywide analysis, this reach of Esopus Creek was studied by approximate methods. This new limited detailed (enhanced approximate) study begins approximately 350 feet downstream of the County Route 5 (Hurley Mountain Road) bridge (Town of Marbletown) and extends upstream approximately 7.5 miles into the Town of Olive to a

30
location approximately 350 feet upstream of the covered bridge on the State University of New York New Paltz – Ashokan Field Campus. Roughness factors (Manning’s “n”) used in the hydraulic model were chosen by engineering judgment and are based on field observations and semi-automated methods supported by GIS-based techniques. Table 6 provides a summary of the Manning’s “n” values used in the hydraulic computations for the channel and overbank areas. This Revision Hydraulic analyses were completed for flooding sources identified in the Technical Proposal for Task Order HSFE02-11-J-0001 (subsequently changed to Task Order HSFE02-11-J-0001, upon signing), dated August 31, 2010, prepared by RAMPP. The analyses consisted of determining WSELs for the 10-, 4-, 2-, 1-, and 0.2-percent-annual-chance flood events and floodways for detailed study streams, and 1-percent-annual-chance flood events for limited detail and approximate study methods within the watershed. The hydraulic methods used for this analysis include steady flow analysis using HEC-RAS version 4.1. The most recent versions of the USGS regression equations were used to determine the peak discharges for small lakes on limited detailed study reaches. Regulatory floodway widths were determined using the equal-conveyance reduction approach on both overbanks. All floodways were confirmed to be outside of the current boundaries of NYSDEC’s polygon shapefile defining freshwater wetlands. The encroachments on the 1-percent-annual-chance flood event were applied such that a positive surcharge less than or equal to 1.0 foot for all cross sections. RAMPP computed 50- and 1-percent-annual-chance peak discharges for approximate and limited detail study streams and 50-, 10-, 4-, 2-, 1-, and 0.2-percent-annual-chance peak discharges for detailed study streams. These peak discharges were used for the hydraulic analyses of study streams. Normal depth, which was computed using ground profile slope, was used as the downstream boundary condition for all streams tying into the backwater of a main-stem. For cases where a stream was divided into multiple reaches to accommodate different levels of study detail, the WSEL transition was made continuous by using Known WSEL as the downstream boundary conditions for the upstream reach. Known WSEL was also used for streams determined to have coincident peak with the main stem at their confluence. Coincident peaks were used for confluencing streams where the ratio of the two drainage areas is between 0.6 and 1.4, the shapes of the drainage areas are similar, and there is a high likelihood of a single storm covering both areas. Applicable situations for split flow analyses were assessed for detailed and limited detail study reaches only. A split flow was modeled for significant flow separation and mixing between two limited detail study streams: West Branch Neversink River and West Branch Neversink River Tributary 3. The land use in this area is primarily forest. The situation is being captured using split flow junctions at the upstream and downstream ends, with lateral weirs to allow flow exchange where flow is overtopping from one stream to the other. There is a diversion structure into West Branch Neversink River Tributary 3, upstream of the scope of West Branch Neversink River, but there is significant overtopping of the diversion structure and it is not affecting the flow balance. Because this diversion is upstream of the study limit of the limited detailed study stream,

31
no survey was available. To test the sensitivity of the model to the opening width, flow through the opening was tested with an assumed opening of 2-foot diameter and 0.2-foot diameter, both as a circular culvert. The opening only conveyed 19 cfs for the 1-percent-annual-chance event for the 2-foot diameter opening and 0.06 cfs for the 0.2-foot diameter opening. The flows at the downstream junction do not have coincident peaks, so the main stem flow is used as the primary flow. The split flows into West Branch Neversink River Tributary 3 are higher than the calculated peak flows, except where cross sections for West Branch Neversink River Tributary 3 would not contain the flow for either case. Calibration is the final phase of the modeling process that serves as verification that the model adequately represents the physical system. For floodplain studies, this is often accomplished by comparing the WSELs of a recent significant flood event with the results of a model simulation under the same conditions. Additionally, measured flow rates and flow depths at USGS streamgage locations can be compared to the various flow profiles of a model simulation. For the current study, the significant flood event used as the benchmark for comparison to model outputs was Hurricane Irene. The flooding in the Esopus Watershed caused by Hurricane Irene was severe enough to wash out bridges and shift channel centerlines in some locations. The stage and discharge of this event was recorded at several locations by several USGS streamgages in the watershed. High-water marks were also collected at several locations. All streamgages and high-water marks were considered in the calibration of the study reaches. However, some study reaches did not have any calibration data available. Roughness factors (Manning’s “n”) used in the hydraulic model were chosen by engineering judgment and were based on field observations of the streams and floodplain areas Table 6 provides a summary of the Manning’s “n” values used in the hydraulic computations for the channel and overbank areas

32
TABLE 6 - MANNING'S "N" VALUES
Flooding Source Channel “n” Values Overbank “n” Values Alton Creek Alton Creek Tributary Beaver Kill Birch Creek Black Creek
0.065 - 0.070 0.050 - 0.065 0.048 - 0.059 0.040 - 0.059 0.044 - 0.055
0.013 - 0.100 0.016 - 0.120 0.016 - 0.110 0.013 - 0.100 0.060 - 0.070
Broadstreet Hollow Bush Kill Bushnellsville Creek Cross Mountain Hollow Dry Brook Englishmans Creek
0.044 - 0.055 0.050 - 0.080 0.050-0.085 0.058-0.067 0.055-0.060
0.030 – 0.040
0.016 - 0.100 0.016 - 0.100 0.016-0.100 0.016-0.100 0.016-0.100
0.080 East Branch Neversink River
0.032-0.045 0.030-0150
Esopus Creek Reach 1 Esopus Creek Reach 2
0.030-0.045 0.030-0.063
0.020-0.080 0.016-0.120
Esopus Creek (LD) 0.035 – 0.065 0.060 – 0.200 Fox Hollow Dwaar Kill
0.045-0.065 0.030 – 0.040
0.016-0.100 0.060 – 0.080
Kate Yaeger Kill 0.030 – 0.040 0.040 – 0.100 Little Beaver Kill Maltby Hollow Brook Mink Hollow Muddy Brook Preymaker Brook
0.048-0.065 0.060-0.080
0.050 0.068-0.073
0.030 – 0.040
0.016-0.100 0.016-0.100 0.016-0.100 0.016-0.100
0.080 Rondout Creek Reach 1 0.029 – 0.100 0.050 – 0.198 Rondout Creek Reach 2 Sandburg Creek
0.055-0.062 0.038-0.042
0.020-0150 0.045-0.060
Saw Kill 0.034 – 0.064 0.049 – 0.180
Shawangunk Kill 0.030 – 0.040 0.060 – 0.080 Stony Clove Creek Stony Creek
0.048-0.080 0.030-0.040
0.016-0.100 0.080
Sundown Creek Twaalfskill Brook
0.055-0.062 0.030 – 0.070
0.020-0.150 0.030 – 0.178
Tannery Brook 0.035 0.060 – 0.120
Vernooy Kill 0.040-0.045 0.050-0.083 Wagner Creek Wallkill River Warner Creek
0.040-0.068 0.015 – 0.065 0.058-0.083
0.016-0.100 0.060 – 0.080 0.016-0.120
West Branch Tannery Brook
0.035 0.060-0.120
Woodland Creek 0.054-0.059 0.016-0.100 Woodland Creek Tributary
0.065 0.016-0.100
As discussed previously, certain flooding sources were studied using limited detailed and approximate methods. These methods are discussed below. Limited Detail “Enhanced approximate floodplains”: This category is assigned to areas where “unnumbered” A Zones are shown on the effective maps, and communities have requested new/upgraded studies, but the level of projected development does not warrant

33
a detailed study. It is also applied to lakes that do not have level gage data, and will be included in a hydraulic model. The level of effort includes collection of orthophotos, LiDAR, and limited survey of structures, nomination of flow rates, and the development of HEC-RAS hydraulic models. For the purposes of this document “limited survey” refers to the survey of man-made hydraulic obstructions, such as dams, bridges and culverts, and to the survey of the outlet channels of lakes with natural outlet controls. The purpose of collecting limited survey data is to enhance the accuracy of the hydraulic model, thus allowing the development and publication of “Advisory Base Flood Elevations (ABFEs).” Engineering drawing plans and Department of Transportation (DOT) hydraulic studies may be substituted for limited survey, where appropriate and available. For the Esopus Creek Limited Detail study, two bridges were surveyed and modeled in the study reach. The structures were located at the downstream and upstream segments of the study reach. In addition to the two man-made structures surveyed, a survey of the Esopus Creek channel was performed to further enhance the accuracy of the hydraulic model. The 1-percent-annual-chance ABFEs for selected modeled cross sections of Esopus Creek are provided in Table 7, “Limited Detailed Flood Hazard Data.” These cross sections will also be shown on the FIRM. Because the BFEs are “advisory,” the published values need not be used to enforce floodplain management ordinances as outlined in 44 CFR 60.3(c)(10), but should be used as BFE data according to 44 CFR 60.3(b)(4). Development in Special Flood Hazard Areas that are designated Zone A, but which have ABFEs, should comply with the elevation standards, but may not require analysis of WSEL increases, unless required by the local community. Approximate (A) “A Zones”: This category is assigned where “unnumbered” A Zones are shown on the effective maps, but the anticipated level of development does not warrant the collection of field survey; or where communities have requested an approximate study where there was currently no study at all. The desktop analysis approach to be applied to approximate studies is defined in Appendix C, Section 4.3 of FEMA’s Guidelines and Specifications for Flood Hazard Mapping Partners. The level of effort includes orthophoto collection, LiDAR and stream breakline collection, use of engineering drawing plans and DOT studies (where appropriate and available), nomination of flow rates, and the development of HEC-RAS hydraulic models.

34
TABLE 7 - LIMITED DETAILED (ENHANCED A-ZONES) FLOOD HAZARD DATA
Cross Section Number & Stream Distance from
Flood Discharge (cfs)
1% Annual Chance Advisory Base Flood
Elevation (Feet NAVD 88)
FIRM Panel Number
Confluence with Esopus Creek Reach 2
BIRCH CREEK
1 (24,855ft ) 2,738 1,717.2 40
2 (34,765 ft) 1,797 2,103.5 40
DRY BROOK 1 (5,507 ft) 9,633 1,595.3 200
2 (6,578 ft) 9,174 1,611.3 200
3 (10,436 ft) 6,507 1,656.8 200
4 (15,5758 ft) 5,777 1,732.4 200
5 (18,716 ft) 5,261 1,771.1 200
6 (19,200 ft) 5,047 1,778.6 200
7 (23,261 ft) 3,574 1,856.6 200
8 (25,711 ft) 3,350 1,903.2 200
9 (27,944 ft) 3,042 1,945.5 200
10 (30,940 ft) 2,451 2,008.6 200
11 (33,530 ft) 2,108 2,079.1 200
12 (34,071 ft) 1,773 2,093.5 200
13 (35,980 ft) 1,395 2,167.6 200
14 (36,926 ft) 1,338 2,196 200
15 (38,272 ft) 744 2,252.8 200
16 (28,832 ft) 668 2,287.9 200
17 (40,923 ft) 498 2,430.5 200
18 (14,407 ft) 437 2,451.3 200
19 (42,411 ft) 234 2,577.3 200
20 (43,524 ft) 209 2,811.8 200
21 (44,482 ft) 126 2,902.1 200

35
TABLE 7 - LIMITED DETAILED (ENHANCED A-ZONES) FLOOD HAZARD DATA (CONT’D)
Flood Discharge (cfs)
1% Annual Chance Advisory Base Flood
Elevation (Feet NAVD 88)
FIRM Panel Number
Cross Section Number & Stream Distance from Limit of
Study
EAST BRANCH NEVERSINK RIVER 1 (1,345 ft) 8,400 1,762.3 370
2 (2,845 ft) 8,330 1,776.1 370
3 (3,345 ft) 8,280 1,780.1 370
4 (4,468 ft) 8,070 1,796.1 370
5 (6,386 ft ) 8,050 1,809.3 370/375
6 (6,945 ft ) 7,930 1,817 375 7 (12,407 ft) 7,747 1,874.7 370/375
8 (12,917 ft) 7,747 1,881.2 370/375
9 (13,864 ft) 7,553 1,890.5 375
10 (15,375 ft) 7,159 1,897.2 375 11 (16,376 ft ) 7,035 1,908.2 400
12 (20,390 ft) 6,632 1,956.3 400
13 (22,396 ft) 6,252 1,978.3 400
14 (24,392 ft) 6,101 2,008.4 400
15 (24,892 ft) 5,873 2,015.4 400
16 (27,921 ft) 5,790 2,054 400
HATCHERY HOLLOW 1 (2,605 ft) 4,506 1,368 205
LITTLE BEAVER KILL 1 (7,895 ft) 5,520 767.3 265 2 (18,667 ft) 4,351 804.9 265 3 (25,553 ft) 1,940 817.9 265 4 (34,114 ft) 1,279 825.6 270

36
TABLE 7 - LIMITED DETAILED (ENHANCED A-ZONES) FLOOD HAZARD DATA (CONT’D)
Flood Discharge (cfs)
1% Annual Chance Advisory Base Flood
Elevation (Feet NAVD 88)
FIRM Panel Number
Cross Section Number & Stream Distance from
Confluence with Dry Brook
MCKINELEY HOLLOW 1 (1,402 ft) 2,532 1,453 205
RIDER HOLLOW 1 (2,607 ft) 2109 1,647.1 200
2 (4,003 ft) 2,066 1,672.7 200
3 (6,483 ft) 1,641 1,728 200
4 (9,053 ft) 1,449 1,795.1 200
5 (10,593 ft) 1,169 1,839.2 200
6 (12,879 ft) 1,056 1,913.6 200
7 (13,040 ft) 889 1,919.2 200
8 (15,189ft) 672 1,997 200
9 (15,744 ft) 639 2,018.3 200
10 (16,781 ft) 566 2,062.9 200
11 (18,371 ft) 412 2,139 200
12 (20,134 ft) 352 2,252.8 200
WEST BRANCH NEVERSINK RIVER 1 (15 ft) 8,680 1,895.8 375
2 (1,118 ft) 7,650 1,905 375
3 (3,147 ft) 7,290 1,918.8 375
4 (6,518 ft) 7,290 1,958.9 375
5(6,647 ft) 7,290 1,962.6 375
6 (7,651 ft) 7,000 1,974.8 375
7 (11,566 ft) 4,240 2,022.3 400 WEST BRANCH NEVERSINK RIVER TRIBUTARY 4 1 (4,788 ft) 5 1,960.5 375
3.3 Vertical Datum
All FIS reports and FIRMs are referenced to a specific vertical datum. The vertical datum provides a starting point against which flood, ground, and structure elevations can be referenced and compared. Until recently, the standard vertical datum in use for newly created or revised FIS reports and FIRMs was the National Geodetic Vertical Datum of 1929 (NGVD 29). With the finalization of the North American Vertical Datum of 1988

37
(NAVD 88), many FIS reports and FIRMs are being prepared using NAVD 88 as the referenced vertical datum. All flood elevations shown in this FIS report and on the FIRM are referenced to NAVD 88. Structure and ground elevations in the community must, therefore, be referenced to NAVD 88. It is important to note that adjacent communities may be referenced to NGVD 29. This may result in differences in Base Flood Elevations (BFEs) across the corporate limits between the communities. As noted above, the elevations shown in the FIS report and on the FIRM for Ulster County are referenced to NAVD 88. For this revision ground, structure, and flood elevations may be compared and/or referenced to NGVD 29 by applying a standard conversion factor. The conversion factor to NGVD 29 is +0.614. The conversion between the datums may be expressed as an equation:
NGVD 29 = NAVD 88 +0.614 foot The BFEs shown on the FIRM represent whole-foot rounded values. For example, a BFE of 102.4 will appear as 102 on the FIRM and 102.6 will appear as 103. Therefore, users that wish to convert the elevations in this FIS to NGVD 29 should apply the stated conversion factor(s) to elevations shown on the Flood Profiles and supporting data tables in the FIS report, which are shown at a minimum to the nearest 0.1 foot. For more information on NAVD 88, see the FEMA publication entitled Converting the National Flood Insurance Program to the North American Vertical Datum of 1988, FEMA Publication FIA-20 / June 1992, or contact the Vertical Network Branch, National Geodetic Survey, Coast and Geodetic Survey, National Oceanic and Atmospheric Administration in Rockville, Maryland 20910 (Internet address http://www.ngs.noaa.gov). Temporary vertical monuments are often established during the preparation of a flood hazard analysis for the purpose of establishing local vertical control. Although these monuments are not shown on the FIRM, they may be found in the Technical Support Data Notebook associated with the FIS report and FIRM for this county. Interested individuals may contact FEMA to access these data.
4.0 FLOODPLAIN MANAGEMENT APPLICATIONS
The NFIP encourages State and local governments to adopt sound floodplain management programs. Therefore, each FIS provides 1-percent-annual-chance flood elevations and delineations of the 1- and 0.2-percent-annual-chance floodplain boundaries and 1-percent-annual-chance floodways to assist communities in developing floodplain management measures. This information is presented on the FIRM and in many components of the FIS report, including Flood Profiles, Floodway Data Tables, and Summary of Stillwater Elevations Table. Users should reference the data presented in the FIS report, as well as additional information that may be available at the local map repository before making flood elevation and/or floodplain boundary determinations.
38
4.1 Floodplain Boundaries To provide a national standard without regional discrimination, the 1-percent-annual-chance flood has been adopted by FEMA as the base flood for floodplain management purposes. The 0.2-percent-annual-chance flood is employed to indicate additional areas of flood risk in the community. For each stream studied by detailed methods, the 1- and 0.2-percent-annual-chance floodplain boundaries have been delineated using the flood elevations determined at each cross section. Between cross sections, the boundaries were interpolated using a DEM prepared from LiDAR data provided by the NYSDEC. LiDAR data for the West of Hudson River Watersheds, including the Rondout Watershed, was acquired by the New York City Department of Environmental Protection (NYCDEP). The LiDAR acquisition was completed in 2009 with a 1-meter resolution. Breaklines were developed for the inside low channel, bottom of bank, stream centerline, and bridges as part of the terrain model development. The terrain model was projected to “NAD_1983_StatePlane_New_York_East_FIPS_3101_Feet”. All topographic data was referenced to the vertical datum of NAVD88. The 1- and 0.2-percent-annual-chance floodplain boundaries are shown on the FIRM. On this map, the 1-percent-annual-chance floodplain boundary corresponds to the boundary of the areas of special flood hazards (Zones A and AE); and the 0.2-percent-annual-chance floodplain boundary corresponds to the boundary of areas of moderate flood hazards. In cases where the 1- and 0.2-percent-annual-chance floodplain boundaries are close together, only the 1-percent-annual-chance floodplain boundary has been shown. Small areas within the floodplain boundaries may lie above the flood elevations, but cannot be shown because of limitations of the map scale and/or lack of detailed topographic data. For streams studied by approximate methods, only the 1-percent-annual-chance floodplain boundary is shown on the FIRM.
4.2 Floodways
Encroachment on floodplains, such as structures and fill, reduces flood-carrying capacity, increases flood heights and velocities, and increases flood hazards in areas beyond the encroachment itself. One aspect of floodplain management involves balancing the economic gain from floodplain development against the resulting increase in flood hazard. For purposes of the NFIP, a floodway is used as a tool to assist local communities in this aspect of floodplain management. Under this concept, the area of the 1-percent-annual-chance floodplain is divided into a floodway and a floodway fringe. The floodway is the channel of a stream, plus any adjacent floodplain areas, that must be kept free of encroachment so that the 1-percent-annual-chance flood can be carried without substantial increases in flood heights. FEMA’s minimum standards limit such increases in flood heights to 1.0 foot, provided that hazardous velocities are not produced. The floodways in this study are presented to local agencies as minimum standards that can be adopted directly or used as a basis for additional floodway studies. The floodways presented in this FIS report and on the FIRM were computed for certain stream segments on the basis of equal conveyance reduction from each side of the floodplain. Floodway widths were computed at cross sections. Between cross sections, the floodway boundaries were interpolated. The results of the floodway computations

39
have been tabulated for selected cross sections (Table 8). The computed floodway is shown on the FIRM (Exhibit 2). In cases where the floodway and 1-percent-annual-chance floodplain boundaries are either close together or collinear, only the floodway boundary has been shown. Encroachment into areas subject to inundation by floodwaters having hazardous velocities aggravates the risk of flood damage and heightens potential flood hazards by further increasing velocities. A listing of stream velocities at selected cross sections is provided in Table 8, “Floodway Data.” To reduce the risk of property damage in areas where the stream velocities are high, the community may wish to restrict development in areas outside the floodway. Near the mouths of streams studied in detail, floodway computations are made without regard to flood elevations on the receiving water body. Therefore, “Without Floodway” elevations presented in Table 8 for certain downstream cross sections of Englishmans Creek and Preymaker Brook are lower than the regulatory flood elevations in that area, which must take into account the 1-percent-annual-chance flooding due to backwater from other sources. The area between the floodway and the 1-percent-annual-chance floodplain boundaries is termed the floodway fringe. The floodway fringe encompasses the portion of the floodplain that could be completely obstructed without increasing the WSELs of the 1-percent-annual-chance flood more than 1.0 foot at any point. Typical relationships between the floodway and the floodway fringe, and their significance to floodplain development, are shown in Figure 1.
Figure 1 – Floodway Schematic

FLOODING SOURCE FLOODWAY BASE FLOOD
WATER-SURFACE ELEVATION (FEET NAVD)
CROSS SECTION DISTANCE1
WIDTH (FEET)
SECTIONAREA
(SQUAREFEET)
MEAN VELOCITY(FEET PERSECOND)
REGULATORY WITHOUT
FLOODWAY WITH
FLOODWAY INCREASE
Alton Creek A 378 26 129 12.5 1,484.8 1,484.8 1,484.8 0.0 B 953 50 238 6.8 1,514.4 1,514.4 1,514.4 0.0 C 1,485 60 196 8.2 1,529.6 1,529.6 1,529.6 0.0 D 2,033 30 135 12.0 1,550.5 1,550.5 1,550.6 0.1 E 3,088 33 146 11.0 1,594.4 1,594.4 1,594.4 0.0 F 4,032 41 184 8.8 1,624.7 1,624.7 1,624.7 0.0 G 4,830 16 63 11.2 1,668.1 1,668.1 1,668.2 0.1 H 5,984 25 73 9.6 1,758.5 1,758.5 1,758.5 0.0 I 7,240 32 103 6.8 1,816.0 1,816.0 1,816.3 0.3 J 8,591 18 73 9.6 1,879.3 1,879.3 1,879.8 0.5 K 10,336 21 68 10.3 2,070.7 2,070.7 2,070.7 0.0 L 11,966 23 71 9.9 2,217.0 2,217.0 2,217.0 0.0 M 13,186 14 60 11.7 2,379.9 2,379.9 2,380.0 0.1 N 14,585 47 89 7.9 2,586.2 2,586.2 2,586.2 0.0
1 Feet above confluence with Birch Creek
TA
BL
E 8
FEDERAL EMERGENCY MANAGEMENT AGENCY
ULSTER COUNTY, NY (ALL JURISDICTIONS)
FLOODWAY DATA
ALTON CREEK

FLOODING SOURCE FLOODWAY BASE FLOOD
WATER-SURFACE ELEVATION (FEET NAVD)
CROSS SECTION DISTANCE1
WIDTH (FEET)
SECTIONAREA
(SQUAREFEET)
MEAN VELOCITY(FEET PERSECOND)
REGULATORY WITHOUT
FLOODWAY WITH
FLOODWAY INCREASE
Alton Creek Tributary A 471 13 39 10.0 1,667.8 1,667.8 1,668.1 0.3 B 921 18 44 8.9 1,695.0 1,695.0 1,695.0 0.0 C 1,657 32 55 7.2 1,755.5 1,755.5 1,755.5 0.0 D 2,657 56 79 5.0 1,828.6 1,828.6 1,829.4 0.8 E 3,490 18 44 8.9 1,900.3 1,900.3 1,900.3 0.0 F 4,095 19 46 8.6 1,962.3 1,962.3 1,962.3 0.0 G 4,872 14 41 9.6 2,044.3 2,044.3 2,044.3 0.0 H 5,662 30 55 7.1 2,107.9 2,107.9 2,108.7 0.8 I 6,757 24 49 8.1 2,229.8 2,229.8 2,229.8 0.0 J 7,695 41 58 6.8 2,350.1 2,350.1 2,350.7 0.6 K 8,327 13 44 8.9 2,443.0 2,443.0 2,443.7 0.7 L 8,773 60 85 4.6 2,501.7 2,501.7 2,501.7 0.0
1 Feet above confluence with Alton Creek
TA
BL
E 8
FEDERAL EMERGENCY MANAGEMENT AGENCY
ULSTER COUNTY, NY (ALL JURISDICTIONS)
FLOODWAY DATA
ALTON CREEK TRIBUTARY

FLOODING SOURCE FLOODWAY BASE FLOOD
WATER-SURFACE ELEVATION (FEET NAVD)
CROSS SECTION DISTANCE1
WIDTH (FEET)
SECTIONAREA
(SQUAREFEET)
MEAN VELOCITY(FEET PERSECOND)
REGULATORY WITHOUT
FLOODWAY WITH
FLOODWAY INCREASE
Beaver Kill A 548 240 2,387 5.4 706.2 706.2 706.6 0.4 B 2,020 177 981 13.0 723.7 723.7 724.1 0.4 C 3,728 126 1,179 10.8 752.6 752.6 753.2 0.6 D 5,238 132 1,089 11.7 778.0 778.0 778.9 0.9 E 6,491 61 738 17.3 811.6 811.6 812.1 0.5 F 8,206 100 825 15.5 848.4 848.4 849.0 0.6 G 9,743 105 801 15.9 883.8 883.8 883.8 0.0 H 11,032 114 1,442 8.9 914.9 914.9 915.3 0.4 I 12,811 563 1,919 7.0 933.2 933.2 933.7 0.5 J 14,168 78 689 14.7 950.5 950.5 950.8 0.3 K 15,928 130 1,200 8.4 979.7 979.7 980.4 0.7 L 17,061 79 711 14.2 995.3 995.3 995.6 0.3 M 18,428 90 795 12.7 1,018.1 1,018.1 1,018.6 0.5 N 20,169 283 2,007 5.0 1,040.6 1,040.6 1,041.5 0.9 O 21,615 847 6,850 1.5 1,047.5 1,047.5 1,047.8 0.3 P 25,887 1,041 3,449 2.0 1,048.9 1,048.9 1,049.2 0.3 Q 27,709 1,031 1,770 3.9 1,053.9 1,053.9 1,054.3 0.4 R 29,609 372 1,637 4.2 1,068.2 1,068.2 1,068.4 0.2 S 30,846 99 442 1.3 1,075.1 1,075.1 1,075.1 0.0 T 32,261 149 451 1.3 1,077.2 1,077.2 1,077.5 0.3 U 33,519 71 203 2.9 1,082.9 1,082.9 1,083.0 0.1 V 34,002 92 248 2.4 1,085.0 1,085.0 1,085.2 0.2 W 34,248 70 183 3.2 1,086.3 1,086.3 1,086.5 0.2
1 Feet above confluence with Esopus Creek Reach 2
TA
BL
E 8
FEDERAL EMERGENCY MANAGEMENT AGENCY
ULSTER COUNTY, NY (ALL JURISDICTIONS)
FLOODWAY DATA
BEAVER KILL

FLOODING SOURCE FLOODWAY BASE FLOOD
WATER-SURFACE ELEVATION (FEET NAVD)
CROSS SECTION DISTANCE1
WIDTH (FEET)
SECTIONAREA
(SQUAREFEET)
MEAN VELOCITY(FEET PERSECOND)
REGULATORY WITHOUT
FLOODWAY WITH
FLOODWAY INCREASE
Birch Creek A 860 253 1026 6.4 1,219.4 1,219.4 1,219.9 0.5 B 2,026 52 458 14.3 1,240.1 1,240.1 1,240.1 0.0 C 3,008 139 991 6.6 1,256.9 1,256.9 1,257.9 1.0 D 3,832 53 427 15.4 1,267.1 1,267.1 1,267.8 0.7 E 4,969 97 587 9.2 1,287.4 1,287.4 1,287.6 0.2 F 6,006 87 490 11.0 1,304.5 1,304.5 1,304.7 0.2 G 7,002 103 535 10.1 1,321.6 1,321.6 1,321.6 0.0 H 8,166 81 456 11.8 1,343.6 1,343.6 1,343.6 0.0 I 9,144 59 431 12.5 1,363.3 1,363.3 1,363.3 0.0 J 10,084 137 642 8.4 1,382.5 1,382.5 1,382.5 0.0 K 11,404 29 276 16.6 1,409.5 1,409.5 1,410.2 0.7 L 12,530 120 528 8.7 1,427.6 1,427.6 1,428.5 0.9 M 13,239 65 377 12.1 1,444.0 1,444.0 1,444.0 0.0 N 14,172 127 738 6.2 1,461.0 1,461.0 1,461.7 0.7 O 15,312 39 219 12.5 1,488.5 1,488.5 1,488.5 0.0 P 16,313 85 305 9.0 1,518.0 1,518.0 1,,518.0 0.0 Q 17,496 50 248 11.1 1,550.0 1,550.0 1,550.4 0.4
1 Feet above confluence with Esopus Creek Reach 2
TA
BL
E 8
FEDERAL EMERGENCY MANAGEMENT AGENCY
ULSTER COUNTY, NY (ALL JURISDICTIONS)
FLOODWAY DATA
BIRCH CREEK

FLOODING SOURCE FLOODWAY BASE FLOOD
WATER-SURFACE ELEVATION (FEET NAVD)
CROSS SECTION DISTANCE1
WIDTH (FEET)
SECTIONAREA
(SQUAREFEET)
MEAN VELOCITY(FEET PERSECOND)
REGULATORY WITHOUT
FLOODWAY WITH
FLOODWAY INCREASE
Broad Street Hollow A 255 93 424 11.4 967.9 967.9 968.1 0.2 B 1,402 93 431 11.2 990.5 990.5 990.9 0.4 C 2,971 117 574 8.4 1,028.9 1,028.9 1,028.9 0.0 D 3,838 84 699 6.9 1,058.2 1,058.2 1,059.0 0.8 E 4,935 70 462 10.4 1,093.1 1,093.1 1,093.1 0.0 F 5,916 80 522 9.2 1,116.4 1,116.4 1,117.3 0.9 G 7,215 71 372 12.9 1,148.0 1,148.0 1,148.0 0.0 H 8,348 142 476 10.1 1,177.3 1,177.3 1,177.3 0.0
1 Feet above confluence with Esopus Creek Reach 2
TA
BL
E 8
FEDERAL EMERGENCY MANAGEMENT AGENCY
ULSTER COUNTY, NY (ALL JURISDICTIONS)
FLOODWAY DATA
BROAD STREET HOLLOW

FLOODING SOURCE FLOODWAY BASE FLOOD
WATER-SURFACE ELEVATION (FEET NAVD)
CROSS SECTION DISTANCE1
WIDTH (FEET)
SECTIONAREA
(SQUAREFEET)
MEAN VELOCITY(FEET PERSECOND)
REGULATORY WITHOUT
FLOODWAY WITH
FLOODWAY INCREASE
Bush Kill A 862 688 2,070 4.7 606.4 606.4 606.6 0.2 B 1,895 403 1,779 5.5 622.3 622.3 622.4 0.1 C 4,564 139 739 11.5 653.2 653.2 653.4 0.2 D 6,523 73 592 14.3 684.4 684.4 684.8 0.4 E 8,523 133 663 6.4 715.5 715.5 716.1 0.6 F 9,650 137 482 8.9 731.7 731.7 732.0 0.3 G 11,679 88 409 10.4 769.3 769.3 769.4 0.1 H 13,972 180 779 5.5 813.9 813.9 814.8 0.9 I 15,129 130 560 7.6 833.4 833.4 833.9 0.5 J 16,738 99 408 10.5 865.0 865.0 865.0 0.0 K 18,356 43 148 10.5 909.1 909.1 909.1 0.0 L 20,190 51 228 6.8 958.6 958.6 958.9 0.3 M 21,863 52 167 9.3 1,008.1 1,008.1 1,008.1 0.0 N 23,780 43 159 9.8 1,086.5 1,086.5 1,086.7 0.2 O 25,160 36 82 8.5 1,165.0 1,165.0 1,165.0 0.0 1 Feet above confluence with the Ashokan Reservoir
TA
BL
E 8
FEDERAL EMERGENCY MANAGEMENT AGENCY
ULSTER COUNTY, NY (ALL JURISDICTIONS)
FLOODWAY DATA
BUSH KILL

FLOODING SOURCE FLOODWAY BASE FLOOD
WATER-SURFACE ELEVATION (FEET NAVD)
CROSS SECTION DISTANCE1
WIDTH (FEET)
SECTIONAREA
(SQUAREFEET)
MEAN VELOCITY(FEET PERSECOND)
REGULATORY WITHOUT
FLOODWAY WITH
FLOODWAY INCREASE
Bushnellsville Creek A 443 75 478 12.8 1,072.5 1,072.5 1,072.7 0.2 B 1,695 80 525 11.7 1,097.7 1,097.7 1,097.7 0.0 C 2,755 142 659 9.3 1,123.7 1,123.7 1,123.7 0.0 D 4,173 53 416 14.7 1,157.3 1,157.3 1,157.5 0.2 E 5,403 40 381 16.1 1,185.6 1,185.6 1,185.6 0.0 F 6,470 49 403 15.2 1,211.3 1,211.3 1,211.4 0.1 G 7,438 122 664 9.2 1,239.8 1,239.8 1,239.8 0.0 H 8,489 43 354 14.0 1,267.0 1,267.0 1,267.7 0.7 I 11,372 115 486 10.2 1,353.8 1,353.8 1,353.8 0.0 J 12,494 84 489 10.1 1,382.5 1,382.5 1,383.1 0.6 K 14,087 71 431 11.5 1,426.6 1,426.6 1,426.7 0.1 1 Feet above confluence with Esopus Creek Reach 2
2Elevation computed without consideration of backwater effects from Weasel Brook
TA
BL
E 8
FEDERAL EMERGENCY MANAGEMENT AGENCY
ULSTER COUNTY, NY (ALL JURISDICTIONS)
FLOODWAY DATA
BUSHNELLSVILLE CREEK
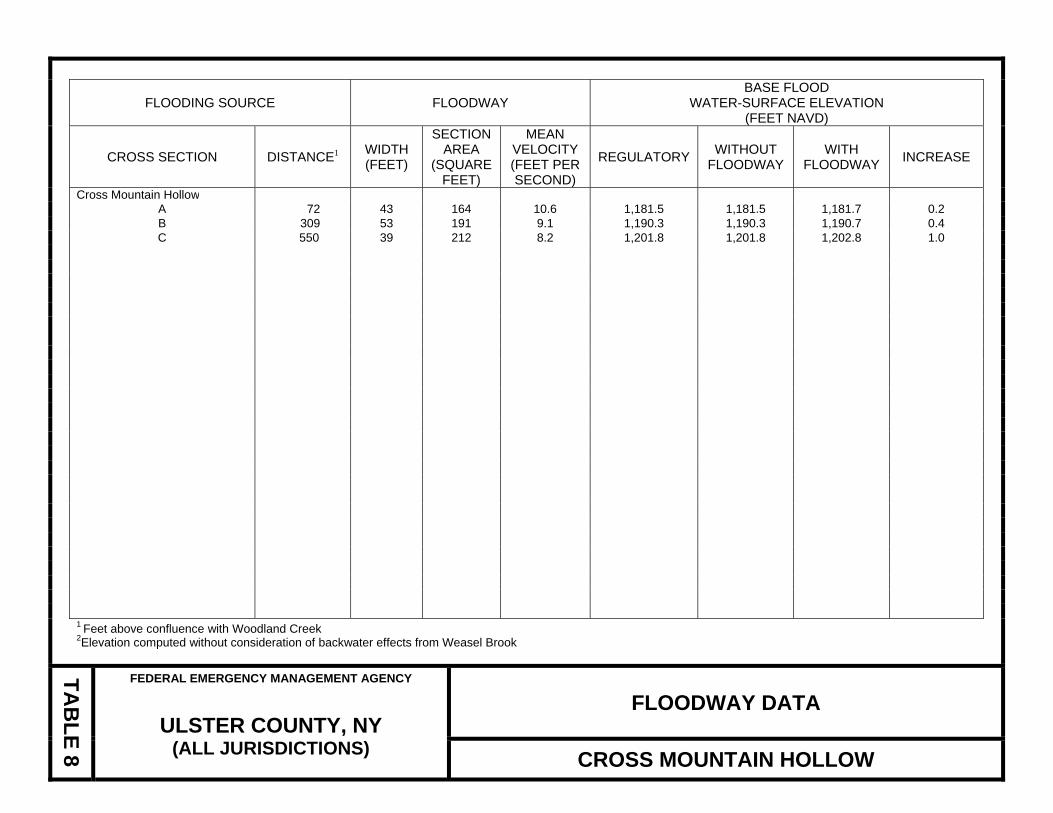
FLOODING SOURCE FLOODWAY BASE FLOOD
WATER-SURFACE ELEVATION (FEET NAVD)
CROSS SECTION DISTANCE1
WIDTH (FEET)
SECTIONAREA
(SQUAREFEET)
MEAN VELOCITY(FEET PERSECOND)
REGULATORY WITHOUT
FLOODWAY WITH
FLOODWAY INCREASE
Cross Mountain Hollow A 72 43 164 10.6 1,181.5 1,181.5 1,181.7 0.2 B 309 53 191 9.1 1,190.3 1,190.3 1,190.7 0.4 C 550 39 212 8.2 1,201.8 1,201.8 1,202.8 1.0 1 Feet above confluence with Woodland Creek
2Elevation computed without consideration of backwater effects from Weasel Brook
TA
BL
E 8
FEDERAL EMERGENCY MANAGEMENT AGENCY
ULSTER COUNTY, NY (ALL JURISDICTIONS)
FLOODWAY DATA
CROSS MOUNTAIN HOLLOW

FLOODING SOURCE FLOODWAY BASE FLOOD
WATER-SURFACE ELEVATION (FEET NAVD)
CROSS SECTION DISTANCE1
WIDTH (FEET)
SECTIONAREA
(SQUAREFEET)
MEAN VELOCITY(FEET PERSECOND)
REGULATORY WITHOUT
FLOODWAY WITH
FLOODWAY INCREASE
Dry Brook A 266 77 153 7.7 628.12 622.5 622.5 0.0 B 1,966 31 128 9.1 663.6 663.6 664.1 0.5 C 2,873 72 144 8.2 686.6 686.6 686.7 0.1 D 4,225 29 112 10.5 733.6 733.6 733.6 0.0 E 5,186 40 120 9.8 770.9 770.9 770.9 0.0 F 6,389 45 124 9.5 833.6 833.6 833.6 0.0 G 7,448 27 106 11.1 897.5 897.5 897.5 0.0 H 8,542 48 142 8.3 961.5 961.5 962.2 0.7 I 9,935 15 69 12.3 1,039.1 1,039.1 1,039.6 0.5 J 10,977 24 81 10.4 1,113.9 1,113.9 1,114.0 0.1 K 12,012 14 68 12.4 1,193.1 1,193.1 1,193.3 0.2 L 13,119 25 82 10.2 1,288.3 1,288.3 1,288.3 0.0 M 14,326 20 77 11.0 1,414.3 1,414.3 1,414.4 0.1 N 15,616 54 113 7.5 1,599.5 1,599.5 1,599.5 0.0 O 16,822 18 78 10.8 1,907.6 1,907.6 1,907.7 0.1 P 17,197 14 68 12.4 2,045.3 2,045.3 2,045.8 0.5 1 Feet above confluence with Bush Kill
2 Flooding controlled by Bush Kill
TA
BL
E 8
FEDERAL EMERGENCY MANAGEMENT AGENCY
ULSTER COUNTY, NY (ALL JURISDICTIONS)
FLOODWAY DATA
DRY BROOK

FLOODING SOURCE FLOODWAY BASE FLOOD
WATER-SURFACE ELEVATION (FEET NAVD)
CROSS SECTION DISTANCE1
WIDTH (FEET)
SECTIONAREA
(SQUAREFEET)
MEAN VELOCITY(FEET PERSECOND)
REGULATORY WITHOUT
FLOODWAY WITH
FLOODWAY INCREASE
East Branch Neversink River A 5,316 225 1,055 9.3 1,661.5 1,661.5 1,661.9 0.4 B 6,300 190 1,080 8.8 1,672.0 1,672.0 1,672.7 0.7 C 7,697 123 790 12.0 1,686.0 1,686.0 1,686.1 0.1 D 8,660 297 1,665 5.7 1,697.6 1,697.6 1,698.6 1.0 E 9,757 117 853 11.1 1,707.0 1,707.0 1,707.5 0.5 F 11,917 227 1,156 7.8 1,729.4 1,729.4 1,730.0 0.6 G 12,849 240 1,033 8.3 1,737.7 1,737.7 1,738.4 0.7 H 13,422 88 925 9.1 1,744.5 1,744.5 1,745.1 0.6 I 14,081 155 875 9.6 1,749.0 1,749.0 1,749.9 0.9 1 Feet above confluence with Neversink River Reach 2
TA
BL
E 8
FEDERAL EMERGENCY MANAGEMENT AGENCY
ULSTER COUNTY, NY (ALL JURISDICTIONS)
FLOODWAY DATA
EAST BRANCH NEVERSINK RIVER

FLOODING SOURCE FLOODWAY BASE FLOOD
WATER-SURFACE ELEVATION (FEET NAVD)
CROSS SECTION DISTANCE1
WIDTH (FEET)
SECTIONAREA
(SQUAREFEET)
MEAN VELOCITY(FEET PERSECOND)
REGULATORY WITHOUT
FLOODWAY WITH
FLOODWAY INCREASE
Esopus Creek Reach 2 A 780 605 6,132 14.2 598.9 598.9 598.9 0.0 B 2,788 701 11,103 7.8 616.6 616.6 616.6 0.0 C 5,092 422 4,622 18.8 623.5 623.5 623.5 0.0 D 6,855 320 5,407 16.1 632.2 632.2 632.8 0.6 E 8,533 214 3,743 23.2 637.4 637.4 637.6 0.2 F 10,238 279 5,237 15.4 648.3 648.3 648.4 0.1 G 12,261 332 3,788 18.1 653.1 653.1 653.1 0.0 H 13,816 1,326 12,718 5.4 661.8 661.8 661.8 0.0 I 16,399 452 4,594 14.9 671.5 671.5 671.6 0.1 J 17,818 253 4,672 14.6 679.5 679.5 679.6 0.1 K 19,327 664 9,598 7.1 686.1 686.1 686.4 0.3 L 20,660 776 6,285 11.2 687.0 687.0 687.2 0.2 M 24,680 1,379 7,819 6.5 699.9 699.9 700.1 0.2 N 27,168 503 4,173 12.2 712.7 712.7 712.7 0.0 O 28,817 581 5,727 8.9 722.2 722.2 722.2 0.0 P 31,493 860 6,293 8.1 734.6 734.6 734.8 0.2 Q 33,364 1,183 7,936 6.4 745.4 745.4 745.4 0.0 R 35,278 1,044 8,021 6.4 756.4 756.4 756.4 0.0 S 38,249 1,262 7,020 7.3 773.4 773.4 773.5 0.1 T 39,710 853 5,428 9.4 782.1 782.1 782.6 0.5 U 42,283 796 5,291 9.7 799.7 799.7 799.7 0.0 V 46,064 337 2,871 14.7 827.4 827.4 828.1 0.7 W 47,531 459 3,704 11.4 842.8 842.8 843.2 0.4 X 50,195 229 2,167 16.3 864.5 864.5 864.5 0.0 Y 52,190 589 3,824 9.2 882.8 882.8 882.8 0.0 Z 54,419 229 2,177 16.2 898.9 898.9 898.9 0.0 AA 57,266 541 3,274 10.8 915.7 915.7 916.2 0.5 AB 60,144 707 3,093 8.0 935.4 935.4 935.5 0.1 1 Feet above confluence with the Ashokan Reservoir
TA
BL
E 8
FEDERAL EMERGENCY MANAGEMENT AGENCY
ULSTER COUNTY, NY (ALL JURISDICTIONS)
FLOODWAY DATA
ESOPUS CREEK REACH 2

FLOODING SOURCE FLOODWAY BASE FLOOD
WATER-SURFACE ELEVATION (FEET NAVD)
CROSS SECTION DISTANCE1
WIDTH (FEET)
SECTIONAREA
(SQUAREFEET)
MEAN VELOCITY(FEET PERSECOND)
REGULATORY WITHOUT
FLOODWAY WITH
FLOODWAY INCREASE
Esopus Creek Reach 2 (cont’d) AC 63,592 694 3,093 11.4 956.8 956.8 956.8 0.0 AD 65,769 546 2,729 11.7 972.0 972.0 972.0 0.0 AE 67,540 397 2,449 14.2 988.0 988.0 988.2 0.2 AF 69,503 419 2,960 10.8 1,003.3 1,003.3 1,003.4 0.1 AG 71,883 869 4,664 6.8 1,021.8 1,021.8 1,021.8 0.0 AH 73,719 508 3,636 8.3 1,037.6 1,037.6 1,037.6 0.0 AI 76,755 585 3,580 8.4 1,060.7 1,060.7 1,061.0 0.3 AJ 79,148 209 1,644 14.8 1,084.6 1,084.6 1,084.6 0.0 AK 81,253 107 1,255 19.4 1,100.6 1,100.6 1,100.6 0.0 AL 82,849 373 2,765 8.1 1,111.7 1,111.7 1,112.6 0.9 AM 85,450 385 2,999 8.8 1,136.5 1,136.5 1,137.3 0.8 AN 87,135 150 1,462 16.6 1,147.8 1,147.8 1,147.8 0.0 AO 89,190 399 2,786 8.7 1,166.4 1,166.4 1,166.4 0.0 AP 92,006 458 2,932 8.3 1,192.7 1,192.7 1,192.7 0.0 AQ 95,008 767 2,949 8.2 1,213.1 1,213.1 1,213.1 0.0 AR 98,638 248 1,401 10.7 1,245.6 1,245.6 1,245.9 0.3 AS 101,050 724 2,328 6.5 1,273.2 1,273.2 1,273.2 0.0 AT 103,324 596 1,964 7.6 1,295.9 1,295.9 1,296.4 0.5 AU 106,170 247 1,312 8.9 1,334.8 1,334.8 1,335.1 0.3 AV 107,584 528 1,561 7.4 1,350.1 1,350.1 1,350.1 0.0 AW 109,320 615 2,060 5.6 1,371.6 1,371.6 1,372.2 0.6 AX 111,374 748 2,305 5.1 1,399.6 1,39,9.6 1,399.6 0.0 AY 112,398 293 1,431 8.1 1,412.4 1,412.4 1,413.2 0.8 AZ 114,060 365 1,362 6.7 1,432.8 1,432.8 1,432.8 0.0 BA 115,717 303 1,244 7.3 1,456.4 1,456.4 1,456.5 0.1 BB 117,132 406 1,312 6.9 1,474.9 1,474.9 1,475.1 0.2 BC 117,792 161 634 11.0 1,484.0 1,484.0 1,484.1 0.1 BD 120,421 159 609 11.4 1,526.6 1,526.6 1,526.6 0.0 1 Feet above confluence with the Ashokan Reservoir
TA
BL
E 8
FEDERAL EMERGENCY MANAGEMENT AGENCY
ULSTER COUNTY, NY (ALL JURISDICTIONS)
FLOODWAY DATA
ESOPUS CREEK REACH 2

FLOODING SOURCE FLOODWAY BASE FLOOD
WATER-SURFACE ELEVATION (FEET NAVD)
CROSS SECTION DISTANCE1
WIDTH (FEET)
SECTIONAREA
(SQUAREFEET)
MEAN VELOCITY(FEET PERSECOND)
REGULATORY WITHOUT
FLOODWAY WITH
FLOODWAY INCREASE
Fox Hollow A 297 57 254 11.3 1,023.3 1,023.3 1,023.9 0.6 B 1,122 52 428 6.7 1,057.0 1,057.0 1,057.8 0.8 C 2,246 26 187 15.3 1,112.1 1,112.1 1,112.3 0.2 D 3,075 63 279 10.3 1,167.5 1,167.5 1,168.1 0.6 E 4,086 37 242 11.9 1,213.9 1,213.9 1,214.1 0.2 F 4,658 58 403 7.1 1,232.8 1,232.8 1,233.3 0.5 G 5,700 40 174 10.4 1,254.0 1,254.0 1,254.7 0.7 H 6,820 22 131 13.8 1,296.3 1,296.3 1,296.4 0.1 I 7,839 55 298 6.1 1,332.5 1,332.5 1,333.3 0.8 J 8,862 41 160 11.4 1,376.3 1,376.3 1,376.4 0.1 K 9,632 35 189 9.6 1,418.9 1,418.9 1,419.2 0.3 L 9,974 25 183 9.9 1,439.8 1,439.8 1,440.1 0.3 M 10,533 53 180 10.1 1,469.4 1,469.4 1,469.7 0.3 1 Feet above confluence with Esopus Creek Reach 2
TA
BL
E 8
FEDERAL EMERGENCY MANAGEMENT AGENCY
ULSTER COUNTY, NY (ALL JURISDICTIONS)
FLOODWAY DATA
FOX HOLLOW

FLOODING SOURCE FLOODWAY BASE FLOOD
WATER-SURFACE ELEVATION (FEET NAVD)
CROSS SECTION DISTANCE1
WIDTH (FEET)
SECTIONAREA
(SQUAREFEET)
MEAN VELOCITY(FEET PERSECOND)
REGULATORY WITHOUT
FLOODWAY WITH
FLOODWAY INCREASE
Little Beaver Kill A 498 118 495 11.2 652.5 651.82 651.8 0.0 B 908 72 554 10.0 658.7 658.7 658.7 0.0 C 1,761 61 431 12.8 670.4 670.4 670.7 0.3 D 2,474 118 575 9.6 684.7 684.7 685.3 0.6 E 3,069 87 488 11.3 695.7 695.7 696.0 0.3 1 Feet above confluence with Esopus Creek Reach 2
2Elevation computed without consideration of backwater effects from Esopus Creek
TA
BL
E 8
FEDERAL EMERGENCY MANAGEMENT AGENCY
ULSTER COUNTY, NY (ALL JURISDICTIONS)
FLOODWAY DATA
LITTLE BEAVER KILL

FLOODING SOURCE FLOODWAY BASE FLOOD
WATER-SURFACE ELEVATION (FEET NAVD)
CROSS SECTION DISTANCE1
WIDTH (FEET)
SECTIONAREA
(SQUAREFEET)
MEAN VELOCITY(FEET PERSECOND)
REGULATORY WITHOUT
FLOODWAY WITH
FLOODWAY INCREASE
Maltby Hollow Brook A 277 79 344 11.8 707.4 707.4 707.6 0.2 B 1,306 65 326 12.5 734.9 734.9 735.0 0.1 C 2,343 113 392 10.4 764.2 764.2 764.2 0.0 D 3,373 56 357 11.4 792.7 792.7 793.0 0.3 E 4,147 106 515 7.9 811.9 811.9 812.6 0.7 F 5,675 73 373 10.9 861.1 861.1 861.6 0.5 G 8,203 90 423 9.6 931.2 931.2 931.5 0.3 H 9,344 35 159 11.6 969.3 969.3 969.3 0.0 I 9,956 61 219 8.4 994.1 994.1 994.6 0.5 J 10,818 39 166 11.1 1,031.5 1,031.5 1,032.0 0.5 1 Feet above confluence with Bush Kill
TA
BL
E 8
FEDERAL EMERGENCY MANAGEMENT AGENCY
ULSTER COUNTY, NY (ALL JURISDICTIONS)
FLOODWAY DATA
MALTBY HOLLOW BROOK

FLOODING SOURCE FLOODWAY BASE FLOOD
WATER-SURFACE ELEVATION (FEET NAVD)
CROSS SECTION DISTANCE1
WIDTH (FEET)
SECTIONAREA
(SQUAREFEET)
MEAN VELOCITY(FEET PERSECOND)
REGULATORY WITHOUT
FLOODWAY WITH
FLOODWAY INCREASE
Mink Hollow A 837 184 914 7.7 1,080.7 1,080.7 1,081.0 0.3 B 2,170 108 552 12.8 1,101.9 1,101.9 1,102.0 0.1 C 3,862 77 505 14.0 1,137.2 1,137.2 1,137.2 0.0 D 5,266 111 945 7.5 1,168.8 1,168.8 1,169.6 0.8 E 6,440 109 652 10.8 1,189.5 1,189.5 1,189.9 0.4 F 8,197 133 594 11.9 1,224.8 1,224.8 1,224.9 0.1 G 9,879 167 560 12.6 1,268.8 1,268.8 1,268.8 0.1 H 11,272 89 612 11.5 1,302.8 1,302.8 1,303.1 0.3 I 12,883 78 601 11.8 1,339.9 1,339.9 1,339.9 0.0 J 14,475 139 718 9.8 1,382.6 1,382.6 1,382.7 0.1 K 16,106 105 309 8.9 1,420.2 1,420.2 1,420.4 0.2 L 18,521 50 255 10.8 1,504.6 1,504.6 1,504.6 0.0 1 Feet above confluence with Beaver Kill
TA
BL
E 8
FEDERAL EMERGENCY MANAGEMENT AGENCY
ULSTER COUNTY, NY (ALL JURISDICTIONS)
FLOODWAY DATA
MINK HOLLOW

FLOODING SOURCE FLOODWAY BASE FLOOD
WATER-SURFACE ELEVATION (FEET NAVD)
CROSS SECTION DISTANCE1
WIDTH (FEET)
SECTIONAREA
(SQUAREFEET)
MEAN VELOCITY(FEET PERSECOND)
REGULATORY WITHOUT
FLOODWAY WITH
FLOODWAY INCREASE
Muddy Brook A 150 41 116 8.7 908.2 908.2 909.1 0.9 B 326 31 100 10.1 920.3 920.3 920.3 0.0 C 563 24 91 11.0 931.6 931.6 931.8 0.2 Preymaker Brook A 8402 35 113 9.5 164.2 164.2 164.2 0.0 B 2,0752 38 129 8.3 188.7 188.7 189.3 0.6 C 3,6302 42 189 5.7 230.7 230.7 231.0 0.3 D 5,3002 50 139 7.7 247.1 247.1 247.4 0.3 E 6,4002 44 276 3.9 253.5 253.5 254.5 1.0 F 7,6602 42 66 7.2 255.4 255.4 255.4 0.0 G 9,9802 18 50 9.5 300.1 300.1 300.1 0.0 H 12,8902 74 216 2.2 403.0 403.0 403.3 0.3 I 14,9852 200 648 0.7 420.3 420.3 421.0 0.8 J 16,7402 160 396 1.2 420.4 420.4 421.4 1.0 1 Feet above confluence with Woodland Creek
2 Feet above confluence with Englishmans Creek
TA
BL
E 8
FEDERAL EMERGENCY MANAGEMENT AGENCY
ULSTER COUNTY, NY (ALL JURISDICTIONS)
FLOODWAY DATA
MUDDY BROOK – PREYMAKER BROOK

FLOODING SOURCE FLOODWAY BASE FLOOD
WATER-SURFACE ELEVATION (FEET NAVD88)
CROSS SECTION DISTANCE1 WIDTH (FEET)
SECTION AREA
(SQUARE FEET)
MEAN VELOCITY (FEET PER SECOND)
REGULATORY WITHOUT FLOODWAY
WITH FLOODWAY INCREASE
Rondout Creek Reach 2
A 23,648 213 1,255 7.6 972.0 972.0 972.0 0.0 B 25,673 440 1,588 5.1 991.6 991.6 992.3 0.7 C 28,843 272 1,330 6.1 1,027.3 1,027.3 1,028.0 0.7 D 30,914 390 1,636 5.0 1,051.6 1,051.6 1,052.5 0.9 E 32,259 100 813 10.0 1,066.5 1,066.5 1,066.6 0.1 F 34,544 185 1,179 6.9 1,096.4 1,096.4 1,096.9 0.5 G 35,949 329 1,246 6.5 1,114.4 1,114.4 1,115.4 1.0
1 Feet above the confluence with the Rondout Reservoir
TA
BL
E 8
FEDERAL EMERGENCY MANAGEMENT AGENCY
ULSTER COUNTY, NY (ALL JURISDICTIONS)
FLOODWAY DATA
RONDOUT CREEK REACH 2

FLOODING SOURCE FLOODWAY BASE FLOOD
WATER-SURFACE ELEVATION (FEET NAVD)
CROSS SECTION DISTANCE1
WIDTH (FEET)
SECTIONAREA
(SQUAREFEET)
MEAN VELOCITY(FEET PERSECOND)
REGULATORY WITHOUT
FLOODWAY WITH
FLOODWAY INCREASE
Stony Clove Creek A 288 221 1,628 12.8 816.0 816.0 816.4 0.4 B 2,183 206 2,025 10.3 842.1 842.1 842.1 0.0 C 3,697 179 1,581 13.2 863.5 863.5 864.4 0.9 D 5,189 214 1,871 11.2 884.7 884.7 885.3 0.6 E 6,829 91 1,258 16.6 907.6 907.6 908.4 0.8 F 8,341 130 1,646 12.7 937.0 937.0 937.0 0.0 G 9,875 126 1,552 13.5 968.5 968.5 968.6 0.1 H 11,861 217 2,254 7.8 985.5 985.5 986.4 0.9 I 13,009 306 1,820 9.7 1,003.4 1,003.4 1,003.4 0.0 J 14,252 103 1,805 9.8 1,033.3 1,033.3 1,033.7 0.4 K 15,985 165 1,167 12.3 1,078.7 1,078.7 1,078.9 0.2 L 17,237 208 1,258 11.4 1,096.9 1,096.9 1,096.9 0.0 M 18,652 168 1,616 8.9 1,117.9 1,117.9 1,118.6 0.7 N 20,668 107 950 15.1 1,146.0 1,146.0 1,146.4 0.4 O 21,860 214 1,278 11.2 1,162.8 1,162.8 1,162.9 0.1 1 Feet above confluence with Woodland Creek
TA
BL
E 8
FEDERAL EMERGENCY MANAGEMENT AGENCY
ULSTER COUNTY, NY (ALL JURISDICTIONS)
FLOODWAY DATA
STONY CLOVE CREEK

FLOODING SOURCE FLOODWAY BASE FLOOD
WATER-SURFACE ELEVATION (FEET NAVD)
CROSS SECTION DISTANCE1
WIDTH (FEET)
SECTIONAREA
(SQUAREFEET)
MEAN VELOCITY(FEET PERSECOND)
REGULATORY WITHOUT
FLOODWAY WITH
FLOODWAY INCREASE
Sundown Creek A 50 150 406 7.0 982.6 982.6 982.8 0.2 B 181 135 349 8.2 985.7 985.7 985.7 0.0 C 837 38 238 11.9 1,003.2 1,003.2 1,003.4 0.2 D 1,690 38 220 12.9 1,024.7 1,024.7 1,024.8 0.1 E 2,533 43 227 12.5 1,053.3 1,053.3 1,053.3 0.0 F 3,643 49 279 10.2 1,086.6 1,086.6 1,087.1 0.5 G 4,469 29 162 13.3 1,120.7 1,120.7 1,120.7 0.0 H 5,885 82 343 6.3 1,193.6 1,193.6 1,194.0 0.4 I 7,023 32 170 12.7 1,229.8 1,229.8 1,230.0 0.2 J 7,734 40 203 10.6 1,250.5 1,250.5 1,250.8 0.3 K 8,702 48 189 11.4 1,284.1 1,284.1 1,284.1 0.0 L 9,888 24 80 10.2 1,329.6 1,329.6 1,329.6 0.0 M 10,956 39 105 7.8 1,454.0 1,454.0 1,454.0 0.0 N 11,611 56 115 7.1 1,479.8 1,479.8 1,480.4 0.6 O 12,500 29 96 8.5 1,511.8 1,511.8 1,511.8 0.0 P 13,701 26 49 7.8 1,562.5 1,562.5 1,562.5 0.0 Q 14,226 16 43 9.1 1,591.4 1,591.4 1,591.6 0.2 R 14,784 18 43 8.9 1,619.0 1,619.0 1,619.0 0.0 1 Feet above confluence with Rondout Creek Reach 2
TA
BL
E 8
FEDERAL EMERGENCY MANAGEMENT AGENCY
ULSTER COUNTY, NY (ALL JURISDICTIONS)
FLOODWAY DATA
SUNDOWN CREEK

FLOODING SOURCE FLOODWAY BASE FLOOD
WATER-SURFACE ELEVATION (FEET NAVD)
CROSS SECTION DISTANCE
WIDTH (FEET)
SECTIONAREA
(SQUAREFEET)
MEAN VELOCITY(FEET PERSECOND)
REGULATORY WITHOUT
FLOODWAY WITH
FLOODWAY INCREASE
VernooyKill A 8161 66 504 10.7 268.0 257.6 258.6 1.0 B 2,3201 124 758 7.1 268.0 266.1 266.7 0.6 C 4,2481 74 465 11.6 279.6 279.6 280.0 0.4 D 4,5201 78 436 12.4 283.8 283.8 283.8 0.0 Wagner Creek A 5112 106 368 4.6 1,055.4 1,055.4 1,056.0 0.6 B 1,4042 39 152 11.2 1,068.8 1,068.8 1,068.8 0.0 C 2,5422 38 157 10.9 1,095.4 1,095.4 1,095.5 0.1 D 3,3742 55 211 8.1 1,121.3 1,121.3 1,121.7 0.4 E 4,4012 47 172 9.9 1,149.3 1,149.3 1,149.3 0.0 F 5,5722 82 215 7.9 1,184.5 1,184.5 1,184.6 0.1 G 6,7832 69 187 9.1 1,217.9 1,217.9 1,217.9 0.0 H 7,9782 73 205 8.3 1,262.4 1,262.4 1,262.4 0.0 1 Feet above confluence with Rondout Creek
2 Feet above confluence with Beaver Kill
TA
BL
E 8
FEDERAL EMERGENCY MANAGEMENT AGENCY
ULSTER COUNTY, NY (ALL JURISDICTIONS)
FLOODWAY DATA
VERNOOY KILL – WAGNER CREEK

FLOODING SOURCE FLOODWAY BASE FLOOD
WATER-SURFACE ELEVATION (FEET NAVD)
CROSS SECTION DISTANCE1
WIDTH (FEET)
SECTIONAREA
(SQUAREFEET)
MEAN VELOCITY(FEET PERSECOND)
REGULATORY WITHOUT
FLOODWAY WITH
FLOODWAY INCREASE
Warner Creek A 476 62 329 13.0 1,073.4 1,073.4 1,073.4 0.0 B 1,886 63 482 8.9 1,106.2 1,106.2 1,106.8 0.6 C 3,198 263 1,103 3.9 1,126.4 1,126.4 1,126.4 0.0 D 4,198 166 740 5.8 1,136.1 1,136.1 1,136.5 0.4 E 5,385 99 488 8.8 1,153.9 1,153.9 1,154.3 0.4 F 6,961 111 441 9.7 1,172.2 1,172.2 1,172.3 0.1 G 9,071 112 459 9.3 1,200.4 1,200.4 1,200.4 0.0 H 10,861 68 358 12.0 1,228.5 1,228.5 1,228.8 0.3 1 Feet above confluence with Stony Clove Creek
TA
BL
E 8
FEDERAL EMERGENCY MANAGEMENT AGENCY
ULSTER COUNTY, NY (ALL JURISDICTIONS)
FLOODWAY DATA
WARNER CREEK

FLOODING SOURCE FLOODWAY BASE FLOOD
WATER-SURFACE ELEVATION (FEET NAVD)
CROSS SECTION DISTANCE1
WIDTH (FEET)
SECTIONAREA
(SQUAREFEET)
MEAN VELOCITY(FEET PERSECOND)
REGULATORY WITHOUT
FLOODWAY WITH
FLOODWAY INCREASE
Woodland Creek A 188 101 1,269 10.3 863.8 863.8 863.8 0.0 B 1,481 103 850 15.3 882.7 882.7 883.2 0.5 C 2,572 113 1,363 9.6 904.9 904.9 905.5 0.6 D 4,137 151 1,284 7.4 923.9 923.9 924.2 0.3 E 5,205 97 747 12.7 939.3 939.3 939.8 0.5 F 6,512 185 1,190 8.0 957.9 957.9 958.8 0.9 G 7,929 301 1,857 5.1 979.3 979.3 980.1 0.8 H 9,382 139 1,036 9.2 1,005.3 1,005.3 1,005.5 0.2 I 10,815 116 898 10.6 1,033.0 1,033.0 1,033.8 0.8 J 12,214 69 584 16.3 1,058.7 1,058.7 1,058.7 0.0 K 14,140 152 740 11.0 1,104.9 1,104.9 1,105.5 0.6 L 15,866 81 737 11.1 1,139.4 1,139.4 1,140.2 0.8 M 17,346 179 1,096 7.4 1,166.8 1,166.8 1,166.9 0.1 N 18,223 81 550 14.8 1,184.4 1,184.4 1,184.4 0.0 1 Feet above confluence with Esopus Creek Reach 2
TA
BL
E 8
FEDERAL EMERGENCY MANAGEMENT AGENCY
ULSTER COUNTY, NY (ALL JURISDICTIONS)
FLOODWAY DATA
WOODLAND CREEK

FLOODING SOURCE FLOODWAY BASE FLOOD
WATER-SURFACE ELEVATION (FEET NAVD)
CROSS SECTION DISTANCE1
WIDTH (FEET)
SECTIONAREA
(SQUAREFEET)
MEAN VELOCITY(FEET PERSECOND)
REGULATORY WITHOUT
FLOODWAY WITH
FLOODWAY INCREASE
Woodland Creek Tributary A 126 23 45 7.8 1,105.1 1,105.1 1,105.1 0.0 B 655 25 46 7.8 1,152.2 1,152.2 1,152.2 0.0 1 Feet above confluence with Woodland Creek
TA
BL
E 8
FEDERAL EMERGENCY MANAGEMENT AGENCY
ULSTER COUNTY, NY (ALL JURISDICTIONS)
FLOODWAY DATA
WOODLAND CREEK TRIBUTARY

64
5.0 INSURANCE APPLICATIONS For flood insurance rating purposes, flood insurance zone designations are assigned to a community based on the results of the engineering analyses. These zones are as follows: Zone A Zone A is the flood insurance risk zone that corresponds to the 1-percent-annual-chance floodplains that are determined in the FIS by approximate methods. Because detailed hydraulic analyses are not performed for such areas, no BFEs or base flood depths are shown within this zone. Zone AE Zone AE is the flood insurance risk zone that corresponds to the 1-percent-annual-chance floodplains that are determined in the FIS by detailed methods. In most instances, whole-foot BFEs derived from the detailed hydraulic analyses are shown at selected intervals within this zone. Zone AO Zone AO is the flood insurance risk zone that corresponds to the areas of 1-percent-annual-chance shallow flooding (usually sheet flow on sloping terrain) where average depths are between 1 and 3 feet. Average whole-foot base flood depths derived from the detailed hydraulic analyses are shown within this zone. Zone X Zone X is the flood insurance risk zone that corresponds to areas outside the 0.2-percent-annual-chance floodplain, areas within the 0.2-percent-annual-chance floodplain, areas of 1-percent-annual-chance flooding where average depths are less than 1 foot, areas of 1-percent-annual-chance flooding where the contributing drainage area is less than 1 square mile, and areas protected from the 1-percent-annual-chance flood by levees. No BFEs or base flood depths are shown within this zone.
6.0 FLOOD INSURANCE RATE MAP
The FIRM is designed for flood insurance and floodplain management applications. For flood insurance applications, the map designates flood insurance risk zones as described in Section 5.0 and, in the 1-percent-annual-chance floodplains that were studied by detailed methods, shows selected whole-foot BFEs or average base flood depths. Insurance agents use the zones and BFEs in conjunction with information on structures and their contents to assign premium rates for flood insurance policies. For floodplain management applications, the map shows by tints, screens, and symbols, the 1- and 0.2-percent-annual-chance floodplains, floodways, and the locations of selected cross sections used in the hydraulic analyses and floodway computations. The current FIRM presents flooding information for the geographic areas of Ulster County that lie outside the New York City Watershed area. Previously, separate Flood Hazard Boundary Maps and/or FIRMs were prepared for each identified flood-prone incorporated community. Historical data relating to the maps prepared for each community are presented in Table 9, “Community Map History.”

65
7.0 OTHER STUDIES
FIS reports and FIRMs have been published for the following communities in Ulster County that lie outside the New York City Watershed: the City of Kingston; the Villages of Ellenville, Saugerties, and New Paltz; and the Towns of Esopus, Gardiner, Kingston, Lloyd, Marbletown, Marlborough, New Paltz, Plattekill, Rochester, Rosendale, Saugerties, Shawangunk, and Ulster. Because it is based on more up-to-date analyses, this FIS supersedes previously printed FISs for the listed communities in Ulster County that lie outside the New York City Watershed. This FIS also supersedes the Flood Boundary and Floodway Maps for Ulster County that were printed as part of previous FISs. The information from the superseded Flood Boundary and Floodway Maps has been added to the revised FIRM accompanying this FIS. This report either supersedes or is compatible with all previous studies published on the streams studied in this report and should be considered authoritative for the purposes of the NFIP.

COMMUNITY
NAME INITIAL
IDENTIFICATION
FLOOD HAZARDBOUNDARY MAP REVISIONS DATE
FIRM EFFECTIVE DATE
FIRM REVISIONS DATE
Ellenville, Village of May 24, 1974 June 18, 1976 July 5, 1983
Esopus, Town of May 31, 1974 January 9, 1976 July 5, 1984
Gardiner, Town of May 31, 1974 July 30, 1976 September 30, 1982 July 16, 1997
Kingston, City of May 17, 1974 November 28, 1975
January 18, 1980 May 1, 1985
Kingston, Town of October 20, 1974 May 14, 1976 August 27, 1982 April 5, 1988
Lloyd, Town of September 6, 1974 July 9, 1976 September 17, 1982 July 18, 1985 July 5, 2000
Marbletown, Town of September 20, 1974 July 9, 1976 October 22, 1982 August 5, 1991
Marlborough, Town of December 6, 1974 December 5, 1984
New Paltz, Town of May 17, 1974 January 2, 1976 August 6, 1976
September 30, 1982 November 1, 1985
New Paltz, Village of January 24, 1975 April 15, 1982 October 15, 1985
Plattekill, Town of 1, 2 N/A N/A N/A N/A
Rochester, Town of June 21, 1974 July 8, 1977 March 16, 1983 February 6, 1991
Rosendale, Town of May 31, 1974 July 2, 1976 November 1, 1985
Saugerties, Town of May 31, 1974 May 21, 1976 August 19, 1985 February 15, 1991
September 30, 1992
Saugerties, Village of November 15, 1974 June 18, 1976 September 10, 1982 August 5, 1985
Shawangunk, Town of June 21, 1974 May 14, 1976 September 30, 1982
Ulster, Town of May 3, 1974 May 28, 1976 May 1, 1985
1 No Special Flood Hazard Areas Identified 2 This community did not have a FIRM prior to the first countywide FIRM for Ulster County
TA
BL
E 9
FEDERAL EMERGENCY MANAGEMENT AGENCY
ULSTER COUNTY, NY (ALL JURISDICTIONS)
COMMUNITY MAP HISTORY
TABLE 9 – COMMUNITY MAP HISTORY

67
8.0 LOCATION OF DATA
Information concerning the pertinent data used in the preparation of this study can be obtained by contacting the Flood Insurance and Mitigation Division, Federal Emergency Management Agency, 26 Federal Plaza, Rm. 1337, New York, NY 10278-0002.
9.0 BIBLIOGRAPHY AND REFERENCES
1. Urbitran Associates, Inc., Hydrologic Analysis Performed for the Flood Insurance Studies of the Towns of Crawford, Gardiner, and Shawangunk, New York, October 1979.
2. U.S. Army Corps of Engineers, Hydrologic Engineering Center, Regional Frequency
Study, Upper Delaware and Hudson River Basins, New York District, New York, November 1974.
3. U.S. Department of the Interior, Geological Survey, Report No. 78-332, Discharge Gage
Height and elevation of 100-year Floods in the Hudson River Basin, Albany, New York, April 1978.
4. U.S. Geological Survey. Regionalization of Flood Discharges for Rural, Unregulated
Streams in New York, Excluding Long Island. Water Resources Investigations Report 90-9147. Richard Lumia, Author. Albany, New York, 1991.
5. U.S. Army Corps of Engineers, New York District, Flood Plain and Technical Services,
Saw Kill, Towns of Kingston, Ulster and Woodstock, Ulster County, New York, New York, New York, March 1985.
6. Interagency Advisory Committee on Water Data, Office of Water Data Coordination,
Hydrology Subcommittee, Bulletin No. 17B, Guidelines for Determining Flood Flow Frequency. September 1981, revised March 1982.
7. Federal Emergency Management Agency, Flood Insurance Study, Town of Catskill, New
York, February 16, 1990. 8. Federal Emergency Management Agency, Flood Insurance Study, Village of Ellenville,
New York, January 5, 1983.
9. Federal Emergency Management Agency, Flood Insurance Study, Town of Gardiner, New York, March 30, 1982.
10. Federal Emergency Management Agency, Flood Insurance Study, Town of Hurley, New
York, August 18, 1992.
11. Federal Emergency Management Agency, Flood Insurance Study, City of Kingston, New York, November 1, 1984.
12. Federal Emergency Management Agency, Flood Insurance Study, Town of Kingston,
New York, April 5, 1988.
13. Federal Emergency Management Agency, Flood Insurance Study, Town of Lloyd, New York, July 5, 2000.

68
14. Federal Emergency Management Agency, Flood Insurance Study, Town of Marbletown,
New York, August 5, 1991.
15. Federal Emergency Management Agency, Flood Insurance Study, Town of Marlborough, New York, November 21, 1984.
16. Federal Emergency Management Agency, Flood Insurance Study, Town of New Paltz,
New York, November 1, 1985.
17. Federal Emergency Management Agency, Flood Insurance Study, Village of New Paltz, New York, October 15, 1985.
18. Federal Emergency Management Agency, Flood Insurance Study, Town of Rochester,
New York, February 6, 1991.
19. Federal Emergency Management Agency, Flood Insurance Study, Town of Rosendale, New York, November 1, 1985.
20. Federal Emergency Management Agency, Flood Insurance Study, Town of Shandaken,
New York, February 17, 1989.
21. Federal Emergency Management Agency, Flood Insurance Study, Town of Shawangunk, New York, March 30, 1982.
22. Federal Emergency Management Agency, Flood Insurance Study, Village of Saugerties,
New York, February 5, 1985.
23. Federal Emergency Management Agency, Flood Insurance Study, Town of Saugerties, New York, September 30, 1992.
24. Federal Emergency Management Agency, Flood Insurance Study, Town of Ulster, New
York, November 1, 1984.
25. Federal Emergency Management Agency, Flood Insurance Study, Town of Wawarsing, New York, March 15, 1984.
26. Federal Emergency Management Agency, Flood Insurance Study, Town of Woodstock,
New York, September 27, 1991.
27. Official Ulster County Website, Ulster County, New York, [Online WWW] Available URL: www.co.ulster.ny.us., [Accessed 07/30/07]
28. MuniNetGuide.com, RICIC, L.L.C. MuniNet Guide, P.O. Box 533, Hinsdale, IL 60522,
[Online WWW] Available URL: www.muninetguide.com. [Accessed 07/30/07]
29. U.S. Army Corps of Engineers, New York District, Stage Frequency Curves, Hudson River Tides, Spuyten Duyvil to Albany, New York, 1975.
30. U.S. Department of Commerce. 2010 U.S. Department of Commerce, United States
Census Bureau, April 2013.

69
31. Chow, V.T., D.R., Maidment, and L.W. Mays. Applied Hydrology. McGraw-Hill, N.Y.,
1988. 32. Dewberry, “Technical Memorandum: NY LiDAR, June 22, 2012.” 33. Federal Emergency Management Agency. Guidelines and Specifications for Flood
Hazard Mapping Partners, as amended, Washington, DC, 2003. 34. Lumia, Richard, D.A. Freehafer, and M.J. Smith. 2006. “Magnitude and Frequency of
Floods in New York” U.S. Geological Survey Scientific Investigations Report 2006–5112, 152
35. New York City Department of Environmental Protection (NYCDEP). Abstract:
Upgraded Geographic Information Systems Digital Orthoimagery and LiDAR Data., March 2010.
36. Risk Assessment, Mapping, and Planning Partners (RAMPP). Rapid Response – New
York West of Hudson Watershed Riverine High Water Marks Hurricane/Tropical Storm Irene FEMA-DR-5000-NY, Germantown, Md. November 3, 2011.
37. Suro, T.P. and G.D. Firda. 2006, “Flood of April 2–3, 2005, Neversink River Basin, New
York.” U.S. Geological Survey Open-File Report 2006–1319, 98 38. U.S. Department of the Interior. Guidelines for Determining Flood Flow Frequency
(Bulletin 17B of the Hydrology Subcommittee), March 1982. 39. Coon, William F. 1998. “Estimation of Roughness Coefficients for Natural Stream
Channels with Vegetated Banks.”, Water-Supply Paper 2441. Prepared by New York State Department of Transportation and U.S. Geological Survey. U.S. Geological Survey, Denver, Colo.
40. GZA GeoEnvironmental. 2005. “Final Hydrology Study Report for the Merriman Dam
and Rondout Reservoir.” Contract CAT-146 Capital Project No.WM-30 Detailed Study/Investigation of the Dams in the Catskill and Delaware Watersheds. .
41. DeGaetano, Dr. Art, and Dan Zarrow. “Extreme Precipitation in New York and New
England [http://www.precip.net]” Northeast Regional Climate Center, Cornell University, Ithaca, N.Y. Accessed 3/13/2013.,
42. U.S. Army Corps of Engineers, Hydrologic Engineering Center, Hydrologic
Modeling System HEC-HMS, Version: 3.5 Build: 1417 Date: 10Aug2010. 43. New York City Department of Environmental Protection (NYCDEP), Prepared by
GZA Buffalo, NY. Draft Hydrologic Study of Olive Bridge Dam and Dikes and Ashokan Reservoir. February 2000