Embed Size (px)
Citation preview

Ethylene perception by ETR3 determines
plant interaction with plant growth
promoting bacteria in tomato
(Solanum lycopersicum)
Pablo Ibort Pereda
Tesis Doctoral
2017
DO
CT
OR
AL
TH
ES
IS 2
017
PA
BL
O I
BO
RT
PE
RE
DA
Programa Oficial de
Doctorado en
Biología
Fundamental
y de
Sistemas
Some are leavessome are branches
I and I are the roots ...
Robert Nesta Marley
Ethylene perception by ETR3 determines plant
interaction with plant growth promoting bacteria
in tomato (Solanum lycopersicum)
Pablo Ibort Pereda
Doctoral Thesis
Granada, 2017

Editor: Universidad de Granada. Tesis Doctorales Autor: Pablo Ibort PeredaISBN: 978-84-9163-644-1 URI: http://hdl.handle.net/10481/48633

Universidad de Granada
Facultad de Ciencias
Programa de Doctorado en Biología Fundamental y de Sistemas
Consejo Superior de Investigaciones Científicas
Estación Experimental del Zaidín
Departamento de Microbiología del Suelo y Sistemas Simbióticos
Memoria presentada por Pablo Ibort Pereda,
Licenciado en Biotecnología, para optar al grado de Doctor
(con la mención “Doctor Internacional”)
Fdo.: Pablo Ibort Pereda
VºBº del director de la Tesis Doctoral
Fdo.: Ricardo Aroca Álvarez
Cientifico Titular del CSIC
Granada 2017


Esta Tesis Doctoral ha sido realizada en el Departamento de
Microbiología del Suelo y Sistemas Simbióticos de la Estación
Experimental del Zaidín (EEZ) del Consejo Superior de
Investigaciones Científicas (CSIC) de Granada en el grupo de
investigación de Micorrizas.
Este trabajo ha sido financiado mediante la beca de Formación de
Personal Investigador (Ref. ayuda FPI: BES-2012-058155) concedida
por el Ministerio de Economía y Competitividad (Ref. Proyecto
AGL2011-25403).
Parte de los resultados expuestos en la tesis han sido logrados durante
las Estancias Breves concedidas por el Ministerio de Economía y
Competitividad realizadas en el Departamento de Ciencias Aplicadas
de la Universidad de Cranfield (Reino Unido) bajo la supervisión del
Dr. Andrew Thompson (Ref. EEBB-I-14-08205) y en el Departamento
de Fisiología Vegetal de la Facultad de Agricultura de la Universidad
de Iwate (Japón) bajo la supervisión del Dr. Matsuo Uemura (Ref.
EEBB-I-15-10354). También gracias a la colaboración de los doctores
José María García-Mina y Ángel María Zamarreño del Departamento
de Biología Ambiental de la Facultad de Ciencias de la Universidad de
Navarra (Pamplona, España) y el Dr. Bernard R. Glick del
Departamento de Biología de la Universidad de Waterloo (Canadá).

This Doctoral Thesis has been performed in the Department of
Microbiology and Symbiotic Systems of Estación Experimental del
Zaidín (EEZ) from the Spanish National Research Council (CSIC) of
Granada within the research group of Mycorrhizas.
This work has been funded via the fellowship of research staff training
(Ref. grant FPI: BES-2012-058155) granted by Spanish Ministry of
Economy and Competitiveness (Ref. Project AGL2011-25403).
Part of results exposed in the thesis has been achieved during the short
Stays granted by Spanish Ministry of Economy and Competitiveness
and carried out in Department of Applied Sciences of Cranfield
University (United Kingdom) under supervision of Dr. Andrew
Thompson (Ref. EEBB-I-14-08205) and in Department of Plant
Physiology of Faculty of Agriculture of Iwate University (Japan) under
supervision of Dr. Matsuo Uemura (Ref. EEBB-I-15-10354). Also,
thanks to collaboration of doctors José María García-Mina and Ángel
María Zamarreño from Department of Environmental Biology of
Navarra University (Pamplona, Spain) and Dr. Bernard R. Glick from
Department of Biology of Waterloo University (Canada).

Los resultados presentados en esta Tesis Doctoral han sido publicados
en las siguientes revistas internacionales o están en vías de publicación
/ The results presented in this Doctoral Thesis have been published in
the following international journals or are in the process of being
published:
Autores/Authors: Pablo Ibort, Sonia Molina, Rafael Núñez, Ángel María
Zamarreño, José María García-Mina, Juanma Manuel
Ruiz-Lozano, Maria del Carmen Orozco-Mosqueda,
Bernard R. Glick, Ricardo Aroca
Título/Title: Tomato ethylene sensitivity determines interaction with
plant growth-promoting bacteria
Fecha/Date: 2017
Revista/Journal: Annals of Botany doi:10.1093/aob/mcx052
Autores/Authors: Pablo Ibort, Hiroyuki Imai, Matsuo Uemura, Ricardo
Aroca
Título/Title: Ethylene perception determines the outcome of plant-
bacteria interaction resulting in reshaping of phosphorus
nutrition and antioxidant status
Fecha/Date: En preparación/In process
Autores/Authors: Pablo Ibort, Sonia Molina, Juan Manuel Ruiz-Lozano,
Ricardo Aroca
Título/Title: Molecular insights of the involvement of never ripe
receptor in the interaction between two soil bacteria
(Bacillus megaterium and Enterobacter sp) and tomato
plants under well watered and drought conditions
Fecha/Date: En preparación/In process

Asimismo, parte de los resultados obtenidos durante esta Tesis
Doctoral han sido presentados en los siguientes congresos y reuniones
científicas / Also, part of the results obtained during this Doctoral
Thesis have been presented at the following congresses and scientific
meetings:
Autores/Authors: Pablo Ibort, Ricardo Aroca
Título/Title: Implicación de la diferente sensibilidad al etileno en
la respuesta de plantas de tomate a rizobacterias
promotoras del crecimiento vegetal (PGPR) en
condiciones de Sequía
Contribution/Journal: Comunicación Oral/ Oral communication
Congreso/Congress: XIII Simposium sobre Fitohormonas: Metabolismo y
Modo de Acción. Sociedad Española de Fisiologia
Vegetal (SEFV)
Lugar/Place: Murcia (España/ Spain)
Fecha/Date: 2014 Abril/ April
Autores/Authors: Pablo Ibort, Ricardo Aroca
Título/Title: Ethylene role in tomato plant response to plant
growth promoting rhizobacteria (PGPR) under
drought stress conditions
Contribution/Journal: Presentación de Postér/ Poster presentation
Congreso/Congress: 6th European Plant Science Retreat
Lugar/Place: Amsterdam (Holanda/ Netherlands)
Fecha/Date: 2014 Julio/ July
Autores/Authors: Pablo Ibort, Ricardo Aroca
Título/Title: To grow or not to grow: a complex story about
tomatoes, bacteria and ethylene
Contribution/Journal: Comunicación Oral/ Oral communication
Congreso/Congress: Cranfield Research Student Forum. Cranfield
University.
Lugar/Place: Cranfield (Reino Unido/ United Kigdom)
Fecha/Date: 2014 Diciembre/ December

Autores/Authors: Pablo Ibort, Juanma Manuel Ruiz-Lozano, Ricardo
Aroca
Título/Title: A transcriptomic analysis of tomato plant sensitivity
to ethylene and its response to two different Plant
Growth-Promoting Rhizobacteria (PGPR) strains
Contribution/Journal: Comunicación Oral/ Oral communication
Congreso/Congress: XXI Congreso annual de la Sociedad Española de
Fisiología Vegetal (SEFV)
Lugar/Place: Toledo (España/ Spain)
Fecha/Date: 2015 Junio/ June
Autores/Authors: Pablo Ibort, Hiroyuki Imai, Juanma Manuel Ruiz-
Lozano, Matsuo Uemura, Ricardo Aroca
Título/Title: Proteomic analysis of tomato plant sensitivity to
ethylene and its response to two different Plant
Growth-Promoting Rhizobacteria (PGPR) strains
Contribution/Journal: Presentación de Postér/ Poster presentation
Congreso/Congress: Plant Biology Europe (EPSO/FESPB) 2016
Lugar/Place: Praga (Chequía/ Czechia)
Fecha/Date: 2016 Junio/ June
Autores/Authors: Pablo Ibort, Ricardo Aroca
Título/Title: Implicación de la percepción de etileno en la
interación de plantas de tomate con rizobacterias
promotoras del crecimiento vegetal (PGPR)
Contribution/Journal: Comunicación Oral/ Oral communication
Congreso/Congress: YouR Science Young Researchers’ Science
Symposium.
Lugar/Place: Granada (España/ Spain)
Fecha/Date: 2016 December/ December


El doctorando Pablo Ibort Pereda y el director de la tesis Ricardo Aroca
Álvarez. Garantizamos, al firmar esta tesis doctoral que el trabajo ha
sido realizado por el doctorando bajo la dirección del director de tesis y
hasta donde nuestro conocimiento alcanza, en la realización del trabajo,
se han respetado los derechos de otros autores a ser citados, cuando se
han utilizado sus resultados o publicaciones.
/
The doctoral candidate Pablo Ibort Pereda and the thesis supervisor
Ricardo Aroca Álvarez. Guarantee, by signing this doctoral thesis, that
the work has been done by the doctoral candidate under the direction
of the thesis supervisor and, as far as our knowledge reaches, in the
performance of the work, the rights of other authors to be cited (when
their results or publication have been used) have been respected.
Granada, a 21de Mayo de 2017 / May 21st
2017
Director de la Tesis /Thesis
supervisor:
Firma/Signed
Ricardo Aroca Álvarez
Doctorando/ Doctoral
candidate:
Firma/Signed
Pablo Ibort Pereda


Agradecimientos
Quiero aprovechar este espacio para agradecer a todas aquellas
personas que de una u otra manera me han ayudado a lo largo de estos
“duros” y “largos” años de tesis, que ahora se han pasado volando.
Aunque debido a su carácter internacional la tesis doctoral ha sido
escrita en inglés, mi intención es reflejar mis agradecimientos de la
manera más fiel posible a mis sentimientos, y por ello he decidido
hacerlo en mi lengua materna.
Gracias en primer lugar a mi familia, ya que ellos son la
principal razón por la que he llegado hasta aquí. Mi padre me enseñó
a amar y convivir con la naturaleza que me rodeaba siendo consciente
del mundo pero con un toque soñador. Mi madre me enseñó a confiar
en mis instintos y a conocer el mundo con una mirada crítica. Entre
ambos me enseñaron que el esfuerzo merece la pena y que los hechos
valen más que las palabras. Gracias también a mi “pequeña” gran
hermana ya que has sido mi compañera más cercana en lo bueno y en
lo malo. Creo que me has aportado grandes conocimientos, sobre todo
a través de nuestras “discusiones”. Por ello, mi familia me llevó a vivir
con entusiasmo y pensamiento crítico y así aplicarlo en mi trabajo, la
ciencia.
Gracias a Ricardo, ya que me dio la oportunidad de realizar la
tesis doctoral en su laboratorio y durante el paso de los años ha
confiado en mí y en mis ideas. Gracias a todos los compañeros de
laboratorio. A Sonia por su imprescindible ayuda para realizar esta
tesis doctoral y por hacer de “madrecilla” granadina. A Mónica por
enseñarme a lidiar con la vida de laboratorio y por los buenos

momentos de risas. Gracias a los compañeros que han trabajando a mi
lado en el laboratorio y han hecho más llevaderos y amenos los largos
días (Gorka, Rosa, Elisabeth, Miguel Ángel, Gabriel, Beat ori, Mari
Carmen, Bea, José Luis, etc.). A Nicolasa por intentar animarme cada
día. A Javier y Domingo por las interesantes conversaciones durante
los desayunos. Gracias a todo el departamento de Micorrizas por
acogerme y arroparme en el inicio de mi camino científico. También
quiero agradecer aquellas personas que me hicieron la vida más fácil y
agradable durante mis estancias en Cranfield (Demetryus, Zoltan,
Antonio, etc.) y Morioka (Matsuo, Hiro, Hayato, Maki, Laura, Mei,
etc.).
Además quiero agradecer a todas aquellas personas que la
ciencia trajo a mi vida y se convirtieron en amigos. A Sara, Gloria, Eli,
Fani, Noemí y Rocío que desde el primer día en Granada, me
adoptaron en su seno “matriarcal”. A mis compañeros de
“promoción” Javi, Tamara y Tania por la ayuda en estos años de
peleas científicas y burocráticas. A Antonia, Marina, Ramona, Dante y
Vicky por su amistad a pesar de nuestro corto tiempo de convivencia. A
la “familia” mexicana (Alicia, Omar, Citlalli, Ali, etc.) por acogerme y
enseñarme algo más que pinche inglés. A Leyre, Gabriela, Jorge, Lidoy
y Niall por aguantarme en los últimos momentos de escritura de tesis.
A todos ellos gracias por todas las cosas que hemos disfrutado juntos y
por las cervezas que faltan todavía.
No quiero olvidarme de agradecer a todos aquellos amigos
ajenos a la ciencia que me han ayudado muchísimo permitiéndome
realizarme como ente social (Cesar, Borjita, Chabo, Nerea, Gonzalo,
Ana Tecla, Annita Potts, Ruth, Lola, Miguel, Pelu, etc.). A Ane por

comprenderme en el estrés y por los maravillosas “distracciones”. A
Drako por su apoyo incondicional en los días malos en Granada.
Gracias por vuestros ánimos y apoyo.
“Deberíamos vivir tantas
veces como los árboles,
que pasado un año malo
echan nuevas hojas y
vuelven a empezar”
José Luis Sampedro


Index

Index
Index
Abbreviations …………………………………………………… 1
Summary/Resumen ………………………………………… 5
Introduction …………………………………………………… 21
Study contex …………………………………………………… 22
Plant growth and development ……………………………… 24
Ethylene ……………………………………………………… 29
Ethylene biosynthesis ……………………………………… 33
Ethylene transduction pathway …………………………… 35
Ethylene receptors ……………………………………… 36
Ethylene signaling ……………………………………… 40
Ethylene response ………………………………………. 42
Plant nutrition ………………………………………………… 43
Biotic and abiotic stresses ……………………………………. 48
Drought stress ……………………………………………… 49
Biotic interactions …………………………………………. 51
Plant interaction with pathogenic organisms …………. 51
Plant interaction with beneficial organisms …………… 52
Tomato as model plant ……………………………………….. 54
Beneficial soil microorganisms ……………………………… 55
Plant growth promoting bacteria …………………………. 57
PGPB action mechanisms ………………………………… 59

Index
Direct action mechanisms ……………………………… 60
Resource uptake facilitation ………………………… 60
Phosphate solubilization ………………………… 60
Iron sequestration ………………………………… 61
Nitrogen fixation …………………………………. 62
Phytohormone modulation …………………………. 62
Ethylene modulation ……………………………… 63
Cytokinis and gibberellins modulation …………… 63
Auxins modulation ………………………………… 64
Indirect action mechanisms ……………………………… 64
Competition for niches …………………………………64
Siderophore production ……………………………… 64
Production of antibiotics and lytic enzymes ………… 65
Ethylene response reduction ………………………… 65
Induced systemic resistance ………………………… 66
Promotion of establishment of beneficial plant-microbe
symbiosis ……………………………………………… 66
Ethylene and PGPB ………………………………………… 67
Methodologies to widely study plant-PGPB interaction ……… 68
Transcriptomics ……………………………………………… 70
Proteomics …………………………………………………… 72
Metabolomics ………………………………………………. 75
Interest of study ………………………………………………… 77
Index
Aims of the study ……………………………………………… 79
Materials and Methods……………………………………… 83
Biological material …………………………………………… 84
Seed sterilization and germination …………………………… 84
Seedling inoculation with PGPB strains ……………………… 84
Colonization of tomato root system …………………………… 85
Plant growth conditions ………………………………………… 85
Watering for well watered and drought treatments ………. 86
Differential phosphorus conditions bioassay …………… 86
Biomass production determination ………………………… 87
Relative growth rate ……………………………………… 87
Bacterial ACC deaminase activity bioassay ………………… 87
Gene expression analysis …………………………………… 88
Transcriptomic analysis ……………………………………… 91
Sample preparation for microarray ………………………… 91
Microarray validation ………………………………………. 92
Microarray data analysis …………………………………… 93
Physiological Parameters ……………………………………… 93
Stomatal conductance ……………………………………… 93
Photosynthetic efficiency …………………………………… 93
Leaf chlorophyll concentration ……………………………… 94
Nutrient measurement ………………………………………… 94

Index
Phytohormone analysis ………………………………………. 94
Ethylene determination …………………………………… 94
Ethylene production by tomato tissues ………………… 95
Ethylene production by bacterial strains ……………… 95
Ethylene production by bacterial-inoculated seedlings… 96
Other phytohormones determination ……………………… 96
Metabolite analysis …………………………………………… 99
Proteomic analysis …………………………………………… 100
Microsomal fraction preparation ………………………… 100
Sample preparation for nano-LC-MS/MS analysis ……… 101
Nano-LC−MS/MS analysis and data acquisition ………… 101
Phosphate solubilization bioassay …………………………… 103
Antioxidant enzymatic activities ……………………………… 104
Antioxidant compounds determination ……………………… 105
Statistical analyses …………………………………………… 106
Statistical analyses in chapter 1 …………………………… 107
Statistical analyses in chapter 2 …………………………… 108
Statistical analyses in chapter 3 …………………………… 108
Index
Chapter 1: Ethylene sensitivity by ETR3 is essential in
tomato interaction with Bacillus megaterium but not with
Enterobacter C7 ………………………………………………. 109
Objective ……………………………………………………… 110
Experimental design ………………………………………… 111
Results ………………………………………………………… 112
Discussion …………………………………………………… 145
Conclusions …………………………………………………. 160
Chapter 2: PGPB inoculation modifies photosynthetic
traits and root metabolites as well as nutritional and
hormonal statuses with strong influence of ethylene
sensitivity ………………………………………………………. 161
Objective ……………………………………………………… 162
Experimental design ………………………………………… 163
Results ………………………………………………………… 164
Discussion …………………………………………………… 188
Conclusions …………………………………………………. 200
Chapter 3: Ethylene perception determines the outcome
of plant-bacteria interaction resulting in reshaping of
phosphorus nutrition and antioxidant status …………… 203
Objective ……………………………………………………… 204
Index
Experimental design ………………………………………… 205
Main experiment ………………………………………… 205
Differential phosphorus conditions bioassay …………… 205
Results ………………………………………………………… 207
Discussion …………………………………………………… 234
Conclusions ………………………………………………… 253
General Discussion …………………………………………. 255
Conclusions …………………………………………………… 273
References …………………………………………………… 277

1
Abbreviations
1O2: Singlet oxygen
50SL11: Ribosomal proteim 50SL11
AAP: Aspartyl aminopeptidase
AAT: Aspartate aminotransferase
ABA: Abscisic acid
ACC: 1-aminocyclopropane1-
carboxylate
ACCd: ACC deaminase
ACO: ACC oxidase
ACS: ACC synthase
AMF: Arbuscular mycorrhizal fungi
ANOVA: Analysis of variance
AOS: Allene oxide synthase
AP2: Apetala 2
APX: Ascorbate peroxidase
ASS: Argininosuccinate synthase
ATP: Adenosine triphosphate
b-CHI: Basic chitinase
BCP: Blue copper protein
Bm: Bacillus megaterium
BRs: Brassinosteroids
C7: Enterobacter C7
Ca3: Carbonic anhydrase 3
CaPF1: Capsicum annuum pathogen
and freezing tolerance-related protein1
CAT: Catalase
Cc: Cytochrome c
CFU: Colony-forming unities
CO2: Carbon dioxide
COPI: Coat complex protein I
Ct: Threshold cycle
CTR1: Constitutive triple response 1
cv: Cultivar
Cyt b6/f: Cytochrome b6/f
Cytb5: Cytochrome b5
DFv/Fm’: Photosynthetic efficiency
DHA: Dehydroascorbic acid
DHAR: Dehydroascorbate reductase
DRE: Dehydration responsive
elements
DREB: Dehydration-responsive
element-binding protein
DW: Dry weight
EBF: EIN3-binding F-box
EDS1: Enhanced disease
susceptibility 1
EF: Elongation factor
EIL: EIN3-like
EIN2: Ethylene-insensitive protein 2
EIN3: Ethylene-insensitive protein 3
EIN4: Ethylene-insensitive protein 4
EIN5: Ethylene-insensitive protein 5
ePGPB: Extracellular PGPB
ER: Endoplasmic reticulum
ER21: Ethylene responsive 21
ER24: Ethylene responsive 24
ER5: Ethylene responsive 5
ERD7: Early response to dehydration
ERF: Ethylene response factor
ERF1: Ethylene responsive factor 1
ERS1: Ethylene sensor 1
ERS2: Ethylene sensor 2
ESI: Electrospray ionization
ETI: Effector-triggered immunity
ETP: EIN2-targeting protein
ETR1: Ethylene receptor 1
ETR2: Ethylene receptor 2
Fer: bHLH transcriptional regulator
Fsm1: SANT/MYB domain protein 1
FW: Fresh weight
GAs: Gibberelins
GC: Gas chromatography
GR: Glutathione reductase
GR: Green ripe protein
GRL: Green ripe-like protein
gs: Stomatal conductance
GSH: Reduced glutathione
GSL7: Glucan synthase-like7
GSSG: Oxidized gluthatione
GST: Glutathione S-transferase

2
H202: Hydrogen peroxide
HPLC: High performance liquid
chromatography
HRMS: High-resolution accurate MS
Hsp: Heat-shock protein
IAA: Indolacetic acid
iPGPB: Intracellular PGPB
ISR: Induced systemic resistance
JA: Jasmonic acid
JA-Ile: Jasmonoyl-isoleucine
JAs: Jasmonates
LC: Liquid chromatography
LDOX: Leucoanthocyanidin
dioxygenase
LOX: Lipoxygenase
LPS: Lipopolisaccharides
LSD: Least significant difference
Mal d 1: Major allergen Mal d 1
MAMPs: Microbe-associated
molecular patterns
MS: Mass spectrometry
MTA: 5'-methylthioadenosine
Myc: Mycorrhization factor
NADP: Nicotinamide adenine
NADPH: Reduced nicotinamide
adenine dinucleotide phosphate
Nod: Nodulation factor
NR: Never ripe
Nramp: Natural resistance-associated
macrophage protein
nsLTPs: Non-specific lipid-transfer
proteins
O2-: Superoxide anion
OD600: Optical density at 600 nm
OH-: Hydroxyl radicals
PAD4: Phytoalexin deficient 4
PAMP: Pathogen-associated
molecular pattern
PC1: Principal component 1
PC2: Principal component 2
PCA: Principal component analysis
PCD: Programmed cell death
PCR: Polymerase chain reaction
PDF: Plant defensin
PGPB: Plant growth promoting
bacteria
PGPR: Plant growth promoting
rhizobacteria
PM: Plasma membrane
PR-10: Pathogenesis related group 10
PsbF: Cytochrome b559 beta chain
PSI: Photosystem I
PSII: Photosystem II
PTI: PAMP-triggered immunity
QRT-PCR: Quantitative Reverse
transcription PCR
RAN1: Responsive to antagonist 1
RD2: Responsive to dessication 2
RD20: Responsive to dessication 20
RD29B: Responsive to dessication
29B
RGR: Relative growth rate
RLK: Receptor like kinase
RNA-seq: RNA sequencing
ROS: Reactive oxygen species
RPL4-B: Ribosomal protein L4-B
RPP3: 60S acidic ribosomal protein
P3
RTE1: Reversion to ethylene
sensitivity 1
Rubisco: Ribulose-1,5-bisphosphate
carboxylase/oxygenase
SA: Salicylic acid
SAM: S-adenosylmethionine
SAR: Systemic acquired resistance
SlCTR: Solanum lycopersicum
constitutive triple response
SlETR: Solanum lycopersicum
ethylene receptor
SOD: Superoxide dismutase
SW: Substrate weight
TCTR1: Tomato CTR1
TPI: Triosephosphate isomerase
TSRF1: Tomato stress-responsive
factor 1
TTSS: Type III secrtion systems
UHPLC: Ultra-HPLC
UV: Ultraviolet

3
V-ATPase: V-type proton ATPase
VHA: Vacuolar-type proton ATPases
VWRE: Vascular wounding responsive elements
WHC: Water-holding capacity
wpi: Weeks post-inoculation
wt: Wild type

4

5
Summary/Resumen

6
Summary
Summary/Resumen
La percepción de etileno a través de ETR3 determina la
interacción de las plantas con bacterias promotoras del
crecimiento vegetal en tomate (Solanum lycopersicum)
Pablo Ibort Pereda
Introducción
La intensificación sostenible de la agricultura persigue
proporcionar seguridad alimentaria a una población mundial creciente y
al mismo tiempo reducir los efectos negativos medioambientales de la
agricultura (Tilman et al. 2011). Por ello, se deben desarrollar nuevas
estrategias con el objetivo de incrementar la eficiencia de los cultivos
en la utilización de recursos manteniendo los rendimientos actuales
(Dodd and Ruiz-Lozano 2012). El manejo de microorganismos
rizosféricos es una buena estrategia para inducir el crecimiento vegetal
(Berg 2009; Singh et al. 2011), y podría disminuir la utilización de
productos químicos en agricultura (Bhattacharyya and Jha 2012). Sin
embargo, es necesaria una mayor investigación para comprender
completamente la interacción entre plantas y microorganismos, así
como los mecanismos de acción bacterianos, y utilizar dichos
microorganismos de manera adecuada y efectiva a gran escala en los
sistemas de agricultura integrada (Berg 2009).
Los microorganismos rizosféricos se encuentran asociados con
los ciclos biogeoquímicos de los nutrientes (Barea et al. 2005), y la
interacción planta-bacteria es esencial para una mejor nutrición vegetal
(Ryan et al. 2009). Además, la homeostasis nutricional y hormonal de

7
Summary
la plantas se encuentran estrechamente relacionadas regulando
finamente el crecimiento y desarrollo de la planta (Krouk et al. 2011).
Las bacterias promotoras del crecimiento vegetal (PGPB) pueden
actuar bien directamente o indirectamente (Ortíz-Castro et al. 2009) y
existen varios mecanismos implicados en la modulación de los niveles
de etileno. El etileno es una hormona vegetal inducida típicamente en
respuesta a estreses ambientales como la sequía (Pierik et al. 2007).
Algunas cepas de PGPB han sido definidas como reguladores del estrés
(Lugtenberg and Kamilova 2009), ya que contienen la actividad 1-
aminociclopropano-1-carboxílico deaminasa (ACCd) y son capaces de
reducir los niveles de etileno, y en consecuencia disminuir sus efectos
inhibidores del crecimiento (Abeles et al. 1992; Glick 2014).
Recientemente las técnicas -ómicas han contribuido a esclarecer
la interacción entre plantas y bacterias, pero se requerire más
investigación ya que los mecanismos de acción de las PGPB son a
menudo específicos de cada cepa bacteriana (Long et al. 2008) y se
encuentran poco caracterizados (Pühler et al. 2004). Además, las raíces
son el nicho bacteriano dónde tiene lugar la interacción directa entre
plantas y bacterias (Benizri et al. 2001). Las aproximaciones
transcriptómicas y proteómicas, así como la información metabólica,
han contribuido con información valiosa para desentrañar la interacción
planta-bacteria así como para predecir cambios fisiológicos (van de
Mortel et al. 2012; Feussner and Polle 2015; Su et al. 2016).
La presente Tesis Doctoral persigue principalmente arrojar luz
sobre la interacción entre dos bacterias promotoras del crecimiento
vegetal y plantas de tomate en relación con la sensibilidad a etileno
mediante el uso de diferentes metodologías con el objetivo de elucidar

8
Summary
los mecanismos de acción bacteriana. En consecuencia, el mutante
insensible a etileno never ripe (nr) (incapaz de percibir etileno debido a
una mutación en el receptor de etileno SlETR3) (Lanahan et al. 1994;
Wilkinson et al. 1995), y su parental isogénico de tipo silvestre (wild-
type; wt) de tomate (Solanum lycopersicum) cultivar Pearson fueron
seleccionados para ser inoculados con cepas PGPB aisladas de suelos
áridos de la zona sur de España: Bacillus megaterium (Bm)
(Marulanda-Aguirre et al. 2008) y Enterobacter sp. (en adelante
Enterobacter C7 (C7)). Debido a que la mayoría de los estudios sobre
el papel del etileno en la actividad PGPB se han centrado en bacterias
que son capaces de reducir los niveles de ACC (Glick 2014), este
estudio pretende utilizar bacterias sin actividad ACC deaminasa o la
capacidad de producir etileno para evitar cualquier perturbación directa
del metabolismo del etileno de la planta.
Capítulo 1: La sensibilidad a etileno a través de ETR3 es
esencial en la interacción de tomate con Bacillus
megaterium pero no con Enterobacter C7.
El primer capítulo tiene como objetivo establecer si la percepción
de etileno a través de SlETR3 es crítica para la inducción del
crecimiento promovida por dos cepas PGPB diferentes y evaluar los
efectos bacterianos en la emisión de etileno y la expresión génica en
plantas de tomate adultas. Se cultivaon plantas never ripe y de tipo
silvestre inoculadas con B. megaterium o Enterobacter C7 hasta el
estadío adulto (10 semanas de edad; 8 semanas post-inoculación; inicio
de la floración) bajo condiciones de buen riego y sequía con el objetivo
de analizar la promoción del crecimiento así como los efectos de la

9
Summary
inoculación bacteriana sobre la producción de etileno, la expresión de
genes relacionados con el etileno y los perfiles transcriptómicos de la
raíz.
La inoculación de Enterobacter C7 promovió el crecimiento de
las plantas independientemente de la sensibilidad a etileno, mientras
que la actividad PGPB de B. megaterium fue observada únicamente en
plantas de tipo silvestre. Además, ambas cepas PGPB disminuyeron la
expresión de genes de biosíntesis de etileno dando lugar a la mitigación
de los efectos de la sequía en plantas de tipo silvestre. Sin embargo, la
insensibilidad a etileno comprometió la interacción con B. megaterium,
el cual indujo la transcripción de genes de biosíntesis y respuesta a
etileno causando un ligero estrés biótico (Timmusk and Wagner 1999).
La inoculación de PGPB afectó los perfiles transcriptómicos
dependiendo de la cepa bacteriana, el genotipo de la planta y la sequía
alterando genes implicados en respuesta frente a estrés oxidativo y la
acumulación de metabolitos además del estado hormonal y nutricional
de la planta. Por ello, la sensibilidad a etileno se ha propuesto como
determinante para la adecuada interacción entre PGPB y las plantas de
tomate. Enterobacter C7 podría modular el metabolismo amino acídico
independientemente de la percepción de etileno. No obstante, la
mutación never ripe causa una interacción no completamente funcional
con B. megaterium, produciéndose un mayor estrés oxidativo y la
pérdida de la actividad PGPB. De ese modo, la percepción de etileno
mediante el receptor SlETR3 es crucial para la actividad promotora del
crecimiento de B. megaterium, y afecta sólo levemente a los efectos de
Enterobacter C7.

10
Summary
Capítulo 2: La inoculación de cepas PGPB modifica
características fotosintéticas y el perfil metabólico de la
raíz además de los estados nutricionales y hormonales de
la planta con una fuerte influencia de la sensibilidad a
etileno.
El segundo capítulo tiene como objetivo establecer si la
percepción de etileno es determinante para la interacción planta-
bacteria y la inducción del crecimiento mediado por ambas cepas
PGPB en plantas juveniles, así como evaluar los efectos fisiológicos de
dichas cepas en plantas de tomate juveniles y adultas. Se cultivaron
plantas never ripe y de tipo silvestre inoculadas con B. megaterium o
Enterobacter C7 hasta los estadíos juvenil (6 semanas de edad; 4
semanas post-inoculación) y adulto cuando se evaluó la biomasa,
conductancia estomática y características fotosintéticas además de los
estados nutricionales, hormonales y metabólicos.
No se observó promoción del crecimiento en plantas juveniles.
Sin embargo, la inoculación de Bm y C7 disminuyó y aumentó la tasa
de crecimiento relativo en plantas never ripe, respectivamente.
Además, la inoculación de PGPB afectó los parámetros fisiológicos
medidos y el contenido en metabolitos de la raíz en plantas juveniles,
mientras que la nutrición vegetal fue fuertemente alterada dependiendo
de la sensibilidad a etileno en plantas en estadío adulto. La inoculación
de B. megaterium mejoró la asimilación de carbono en plantas de tipo
silvestre. Sin embargo, la insensibilidad a etileno comprometió la
actividad PGPB de B. megaterium afectando a la eficiencia
fotosintética, la nutrición vegetal y el contenido en azúcares de la raíz.

11
Summary
No obstante, la inoculación de Enterobacter C7 modificó el contenido
en amino ácidos de la raíz además de la conductancia estomática y la
nutrición vegetal. Por ello, la sensibilidad a etileno determina la
interacción de las plantas con las PGPB y perjudica gravemente a la
interacción de B. megaterium con las plantas de tomate dando lugar a
modificaciones fisiológicas y la pérdida de la actividad promotora del
crecimiento. En cambio, la inoculación de Enterobacter C7 estimuló el
crecimiento de la planta independientemente de la percepción de
etileno y podría mejorar la asimilación de nitrógeno en plantas
insensibles a etileno.
Capítulo 3: La percepción de etileno determina el
resultado de la interacción planta-bacteria dando lugar a
una reestructuración de la nutrición de fósforo y el estado
antioxidante de la planta.
El presente capítulo tiene como objetivo arrojar luz sobre la
interacción planta-bacteria y los mecanismos de acción PGPB en
relación con la percepción del etileno utilizando una aproximación
proteómica. Se cultivaron plantas never ripe y de tipo silvestre
inoculadas con B. megaterium o Enterobacter C7 hasta el estadío
adulto para analizar la promoción del crecimiento así como los efectos
de la inoculación bacteriana sobre los perfiles proteómicos
microsomales de la raíz, los cuales pueden aportar información útil
sobre procesos de interacción, señalización y transporte.
Los resultados de la promoción del crecimiento vegetal fueron
acordes con los obtenidos en anteriores capítulos. Además, la

12
Summary
inoculación de PGPB afectó al perfil proteómico de una manera
dependiente de la cepa bacteriana y la sensibilidad a etileno de la planta
modificando niveles de proteínas de interacción y relacionadas con el
estrés. Además, la inoculación bacteriana afectó el estado antioxidante
y la capacidad de adquisición de fósforo de la planta. De hecho, se
evaluaron el estado redox y la nutrición de fósforo y se realizó un
ensayo con condiciones de bajo fósforo en base a los resultados
proteómicos obtenidos. La inoculación de B. megaterium incrementó y
disminuyó la capacidad antioxidante en plantas de tipo silvestre y never
ripe, respectivamente, mientras que la inoculación de C7 aumentó el
estrés oxidativo en ambos genotipos de plantas. Por ello, la percepción
a etileno es esencial para el adecuado reconocimiento de B. megaterium
y su promoción del crecimiento, la cual es mediada en parte por niveles
elevados de glutatión reducido mejorando la capacidad antioxidante de
la planta. En cambio, Enterobacter C7 es capaz de mejorar la nutrición
de fósforo de la planta independientemente de la sensibilidad a etileno,
modulando la respuesta de estrés inducida por el bajo fósforo
disponible y manteniendo de esta forma las plantas en crecimiento.
Discusión General
La inoculación con PGPB modificó los pérfiles nutricionales,
transcriptómicos, metabólicos y proteómicos de una manera específica
de cada cepa PGPB inoculada y dependiente de la sensibilidad a etileno
de la planta en concordancia con interacciones específicas entre plantas
hospedadoras y cepas PGPB (Walker et al. 2011; Weston et al. 2012),
así como de mecanismos de acción también específicos de cepa y
dependientes de las condiciones de crecimiento de las plantas (Ryu et

13
Summary
al. 2005; Long et al. 2008). La inoculación de PGPB modificó
directamente los metabolitos de la raíz incluyendo amino ácidos,
azúcares y ácidos orgánicos como se había descrito anteriormente
(Weston et al. 2012; Su et al. 2016), los cuales podrían intervenir en la
promoción del crecimiento vegetal así como en la interacción planta-
bacteria. Además, la insensibilidad a etileno causó mayores diferencias
que la inoculación bacteriana ya que el etileno está involucrado en
varios procesos importantes en la fisiología de la planta así como en la
plasticidad fenotípica (Dugardeyn and Van Der Straeten 2008).
El presente estudio describe por primera vez un mecanismo
dependiente de etileno en bacterias sin actividad ACC deaminasa.
Ambas PGPB (Bm y C7) fueron capaces de colonizar el sistema
radicular independientemente de la sensibilidad a etileno, lo cual es
determinante para la interacción con las plantas (Benizri et al. 2001).
Sin embargo, aunque la sensibilidad a etileno determina la interacción
de las plantas con ambas cepas PGPB, se propone la percepción del
etileno a través de SlETR3 como esencial para la promoción del
crecimiento mediada por Bm pero no por C7. Además, la inoculación
con PGPB mejoró su eficiencia de promoción del crecimiento en
plantas de tipo silvestre bajo condiciones de sequía, sugiriendo la
mitigación del estrés como previamente ha sido descrito con otras
cepas PGPB (Aroca and Ruiz-Lozano 2009), y la mejora de la
eficiencia en la utilización de recursos (Dodd and Ruiz-Lozano 2012).
El análisis hormonal vegetal mostró que la inoculación de C7
modula el contenido de ácido abscísico (ABA) en plantas never ripe
juveniles suprimiendo la respuesta mediada por ácido salicílico (SA)
y/o ácido jasmónico (JA)/etileno (Anderson et al. 2004; Sánchez-Vallet

14
Summary
et al. 2012). En cambio, los niveles de ABA endógeno podrían ser
esenciales para la promoción del crecimiento mediada por Bm
manteniendo la producción de etileno en niveles bajos (Porcel et al.
2014). Los mayores niveles de SA, JA y jasmónico-isoleucina bajo la
inoculación de Bm en plantas never ripe respecto a plantas de tipo
silvestre sugiere que Bm activa defensas en plantas never ripe (Browse
2009; Vlot et al. 2009). Por ello, los efectos bacterianos sobre los
niveles hormonales descritos en plantas juveniles predisponen a las
plantas al crecimiento futuro ya que existe un balance entre crecimiento
y defensa, el cual implica una interferencia entre las diferentes
hormonas vegetales (Karasov et al. 2017).
La inoculación de B. megaterium en plantas never ripe aumentó
la expresión de genes relacionados con etileno apuntando a una
producción local de etileno, cómo la descrita en la interacción de las
plantas con bacterias patógenas (van Loon et al. 2006), y sugiriendo
que la plantas never ripe podrían reconocer a Bm como un
microorganismo tipo patogénico. Sin embargo, se observó una
regulación negativa de la señalización del etileno (Tieman et al. 2000),
y la inoculación de Bm produjo una respuesta de estrés en plantas never
ripe probablemente debido a un fallo en el reconocimiento (Zamioudis
and Pieterse 2012), pero sin desencadenar completamente mecanismos
de defensa que causan una reducción en el crecimiento de la planta.

15
Summary
Actividad promotora del crecimiento vegetal de B.
megaterium
Los análisis transcriptómicos y proteómicos mostraron que la
inoculación de Bm en plantas de tipo silvestre podría favorecer la
interacción planta-bacteria y mejorar la capacidad antioxidante. Sin
emabergo, la insensibilidad a etileno daña la interacción de la planta
con Bm percibiéndolo como un microorganismo patogénico que
aumenta el estrés oxidativo y dando lugar a una asociación que no es
completamente funcional pero sin desencadenar completamente una
respuesta inmune. Además, el análisis de los metabolitos de la raíz
sugiere que la inoculación de Bm principalmente modifica el
metabolismo de azúcares aumentando la supresión de la fotosíntesis
causada por los niveles endógenos de glucosa en plantas never ripe
(Paul and Pellny 2003). Por otro lado, los niveles reducidos de ácido
fumárico (necesario para la formación del biofilm (Yuan et al. 2015))
en raíces never ripe inoculadas con Bm, y la competencia por el hierro
propuesta en la rizosfera (Pii et al. 2015), también apoyan el fallo en la
interacción funcional. La percepción de PGPB como un ligero estrés
biótico ha sido descrita anteriormente (Timmusk and Wagner 1999)
viéndose involucrado el etileno en este proceso (Hontzeas et al. 2004).
En conformidad con lo anterior, el presente estudio apunta a la
sensibilidad a etileno como regulador de la interacción de las plantas
con B. megaterium.
El análisis de metabolitos antioxidantes confirmó los resultados
transcriptómicos y proteómicos mostrando que la inoculación de Bm
aumentó los niveles de glutatión reducido (GSH) en plantas de tipo
silvestre. Este mecanismo había sido descrito previamente por la

16
Summary
inoculación de Sphingomonas sp. LK11 en tomate (Halo et al. 2015).
Por ello, la actividad PGPB de B. megaterium propuesta como
dependiente de la percepción de etileno a través de SlETR3 es mediada
por niveles altos de glutatión reducido afectando al estado redox
celular, y en consecuencia, a la capacidad antioxidante necesaria para
mejorar la tolerancia frente a estreses. Sin embargo, la interacción entre
B. megaterium y plantas never ripe no fue completamente establecida
causando estrés oxidativo en las plantas insensibles a etileno.
Actividad promotora del crecimiento vegetal de
Enterobacter C7
Los análisis transcriptómicos y proteómicos mostraron que la
sensibilidad a etileno también determina la interacción de las plantas
con Enterobacter C7. La presencia de Enterobacter C7 en raíces de
tipo silvestre causó un leve estrés, pero las plantas fueron capaces de
reconocer a C7 minimizando la respuesta de defensa. Además, la
inoculación de C7 en plantas never ripe podría mejorar la nutrición
vegetal, contrarrestando los efectos de estrés, ya que las plantas never
ripe atenúan la interacción con C7 modulando proteínas implicadas en
su reconocimiento. La inoculación de C7 podría mejorar la eficiencia
en el uso del nitrógeno y/o modular el metabolismo amino acídico
independientemente de la sensibilidad a etileno, como se observó en los
resultados de metabolitos y ha sido previamente descrito para varias
PGPB (Mantelin and Touraine 2004; Carvalho et al. 2014). Además, el
análisis de antioxidantes mostró que la inoculación de C7 aumenta el
estrés oxidativo en ambos genotipos de planta a la vez que promueve el
crecimiento vegetal indicando que el mecanismo de acción de

17
Summary
Enterobacter C7 es independiente de la percepción del etileno y el
estrés oxidativo.
El análisis proteómico también sugirió que la nutrición de fósforo
está implicada en el mecanismo de acción PGPB de C7 y que la
percepción de etileno a través de SlETR3 determina la interacción
planta-C7. La inoculación de C7 mejoró la nutrición de plantas de tipo
silvestre y never ripe mediado por los transportadores de fosfato SlPT1
y SlPT2, respectivamente, evitando la respuesta de estrés por bajo
fósforo y manteniendo el crecimiento de las plantas (Hermans et al.
2006). Por ello, Enterobacter C7 es capaz de promover el crecimiento
vegetal mejorando la nutrición de fósforo y sorteando la insensibilidad
a etileno a través de SlETR3 modulando dos transportadores de fosfato
diferentes.
Trabajo futuro
Aunque los efectos de la inoculación de PGPB sobre la fisiología
de las plantas representan una información útil para la aplicación en los
sistemas de cultivo, es necesaria más investigación para elucidar
completamente los mecanismos de acción de B. megaterium y
Enterobacter C7, así como abordar otros posibles mecanismos de
acción que puedan mejorar simultáneamente el crecimiento de las
plantas (Martínez-Viveros et al. 2010). También los mecanismos de
acción descritos deberían ser corroborados bajo condiciones de sequía.
Además, la asociación beneficiosa entre plantas y PGPB requiere
reconocimiento mutuo (Zamioudis and Pieterse 2012), y por ello la
investigación de las características y fisiología bacterianas podría

18
Summary
ayudar a esclarecer la interacción planta-bacteria. Por otra parte, el gen
TCTR1 (Tomato Constitutive Triple Response 1) está implicado en la
regulación negativa del etileno (Tieman et al. 2000), y podría participar
en la respuesta inicial después de la inoculación de Bm. Por ello, se
están obteniendo líneas transgénicas de silenciamiento y
sobreexpresión de TCTR1 para evaluar el crecimiento de las plantas así
como la interacción con B. megaterium.
La utilización de PGPB se encuentra pobremente representada en
la agricultura mundial (Banerjee et al. 2006; Timmusk 2017), pero un
consorcio de microorganismos beneficiosos en combinación con la
planta adecuada bajo determinadas condiciones ambientales podrá
producir efectos positivos y reales dando lugar a una alternativa viable
para la intensificación sostenible de la agricultura.
Conclusiones
La percepción del etileno a través de SlETR3 es esencial para la
actividad promotora del crecimiento vegetal de Bacillus
megaterium en plantas de tomate, mientras que el mecanismo
PGPB de Enterobacter C7 parecer ser independiente de SlETR3.
Los efectos de la inoculación de PGPB sobre la fisiología vegetal
son específicos de la cepa bacteriana y dependientes de la
sensibilidad a etileno así como de las condiciones de crecimiento
de la planta.
19
Summary
La inoculación con PGPB afecta a la fotosíntesis, fitohormonas y
metabolitos de la raíz en plantas juveniles predisponiendo a la
plantas para el futuro crecimiento.
Ambas cepas bacterianas actúan como PGPB en condiciones de
buen riego y sequía en plantas de tomate sensible al etileno dando
lugar a una mejora en el estado fisiológico de la planta y
mitigación del estrés.
La mutación de SlETR3 perjudica la interacción entre Bacillus
megaterium y plantas de tomate never ripe, resultando en un
reconocimiento no completamente funcional y causando un
incremento del estrés oxidativo y la pérdida de la actividad
promotora del crecimiento.
La actividad PGPB de Bacillus megaterium en plantas de tomate
podría estar mediada por niveles altos de glutatión reducido, y por
tanto por una mejora del estado antioxidante vegetal.
La mutación de SlETR3 determina la interacción de las plantas con
Enterobacter C7, cuyo mecanismo PGPB implica la mejora de la
nutrición de fósforo mediada por los transportadores de fosfato
SlPT1 y SlPT2 en plantas de tipo silvestre y never ripe,
respectivamente, evitando así la respuesta de estrés por bajo
fósforo.

20

21
Introduction

22
Introduction
Introduction
Study context
Global population is exponentially increasing and probably
worldwide inhabitants will be about 9 billion by 2050 (FAO 2013).
Agriculture is a key factor to provide food security (Pardey et al. 2014).
Food consumption patterns are quantitatively and qualitatively varying
towards diets with more food and meat. Thus, there is a increased
competition for inputs, which are often overexploited, in short supply
and/or used unsustainably, such as arable land and water as well as
other inputs needed for food production as energy and nutrients (Foley
et al. 2005; FAO 2013). From local farming communities to countries
and worldwide, sustainability is a prerequisite to achieve human
development (Folke et al. 2005; UN 2012).
The intensive agriculture demands for inputs which can
negatively impact on environment. The intensification of agriculture,
which started in the 1960s designated as “The Green revolution”, was
mainly based on management of crop lands with high-yielding crop
varieties, chemical fertilizers and pesticides, irrigation, and
mechanization (Naylor 1996). Although fertilizers provide essential
nutrients to meet plant growth and development, chemical fertilization
has been generally overused causing unexpected environmental
impacts. For instance, nutrient washing from fertilized farms caused
oxygen starvation in rivers and lakes, leading to an almost lifeless area
called “the dead zone” (Malakoff 1998; Rabalais et al. 2002).
Pesticides also contaminate soil and water affecting to non-target
beneficial organisms including humans (Hallberg 1987; Aktar et al.

23
Introduction
2009), and thereby diminishing biodiversity and/or soil health (Giller et
al. 1997; Kibblewhite et al. 2008; Scherr et al. 2008). Moreover,
performed crop practices usually resulted in soil degradation, which is a
global problem especially serious in the tropics and sub-tropics (Lamb
et al. 2005). In fact, the dry land surface becoming semi-arid or arid is
progressively increasing during last decades (Herrmann and
Hutchinson 2005), and thereby crops suffer drought periods and
demands for higher water inputs. Moreover, a large amount of solid
residues and plastic waste was generally produced by agriculture
(Hemphill 1993), and these debris should be reduced. In addition,
agriculture approximately produces a quarter of anthropogenic
greenhouse gas emissions involved in climate change, which also
reciprocally implies extra challenges to agriculture (Vermeulen et al.
2012). In consequence, it could be said that intensive farming practices
damage the environment causing global problems.
Thus, new methodologies which can counteract negative impacts
of intensive agriculture and provide food security to a growing up
global population should be developed. The aim of sustainable
intensification of agriculture is to simultaneously increase food
production and minimize pressure of crops on the environment (Tilman
et al. 2011; Garnett et al. 2013). Food production should be enhanced
using existing farmlands in an environmentally-friendly way in order to
do not undermine further future crop production and avoid problems
caused by non-sustainable intensification (Foley et al. 2005; Bennett
2014). The new farming practices should improve efficiency use for
nutrients and water without sacrificing actual yields (Ghanem et al.
2011; Dodd and Ruiz-Lozano 2012). In addition, sustainable
intensification of agriculture implies a radical rethinking in systems of

24
Introduction
food production in order to increase human and animal nutrition and
welfare, as well as support rural economies and sustainable
development (Garnett et al. 2013).
A plethora of soil microorganisms can establish association with
plants (Gray and Smith 2005), and beneficial ones are able to stimulate
plant growth (Lucy et al. 2004; Adesemoye and Kloepper 2009;
Nadeem et al. 2014). These microorganisms modulate plant growth and
physiology acting generally from roots (Barea et al. 2005) and some of
them can even enhance plant tolerance to stresses (Aroca and Ruiz-
Lozano 2009; Dimkpa et al. 2009; Glick 2014). Moreover, certain soil
microorganisms can be used as biofertilizers, phytostimulators as well
as biopesticides, and thereby they were pointed as an interesting way to
reduce or even replace use of chemicals in agriculture (Bhattacharyya
and Jha 2012). In consequence, the management of microbial
populations was proposed as a cheap, versatile, and environmentally-
friendly method to simultaneously enhance plant growth and reduce
crop negative impacts on environment (Berg 2009; Singh et al. 2011).
Plant growth and development
Total growth of plant as biomass production results from
conjunction of fixated carbon dioxide (CO2) by photosynthesis, carbon
loss by respiration processes, and mineral nutrition (Poorter 2002).
Furthermore, cell expansion, which is produced by turgor pressure in
response to the osmotic influx of water (Lodish et al. 2000), plays a
determinant role at cellular level since cell growth determine organ
25
Introduction
growth and morphological refinements which optimize plant growth
depending on external and/or internal stimuli (Bashline et al. 2014).
Plant photosynthesis starts in chloroplast thylakoid membrane,
which is enzymatically able to oxidize water dependently of light,
reduce NADP and produce ATP via photosystems I and II (PSI and
PSII) and ATP synthase (F-ATPase) with the cytochrome-b6 f complex
transporting electrons between PSII and PSI (Nelson and Ben-Shem
2004). Chlorophylls are magnesium-tetrapyrrole molecules essential in
photosynthesis. Several types of chlorophyll have been described due
to substitutions on the side chains of chlorophyll a, resulting in
different absorption properties to harvest sunlight at different
wavelengths (Chen 2014). Chlorophylls and other pigments are
contained in both photosystems and harvest light initiating the electron
translocation from pigments to electron acceptors in order to provide
energy for the photosynthetic process (Nelson and Ben-Shem 2004).
Indeed, photosynthesis is related with chlorophyll content (Richardson
et al. 2002), although the photosynthetic process is also influenced by
other factors such as opening of stomata (Tanaka et al. 2005) and
mesophyll conductance to CO2 (Galmés et al. 2013; Tomás et al. 2013)
as well as Rubisco (ribulose-1,5-bisphosphate carboxylase/oxygenase)
catalytic properties (Prins et al. 2016) and other rate-limiting Calvin
cycle enzymes (Zhu et al. 2007).
Photosynthesis is also affected by CO2 concentration. CO2 is
fixed by Rubisco, which catalyzes the combination of ribulose-1,5-
bisphosphate with CO2 to yield two molecules of 3-phosphoglyceric
acid. However, Rubisco also reacts with oxygen leading to
photorespiration and decreasing photosynthesis efficiency (Cleland et

26
Introduction
al. 1998). CO2 is sensed by guard cells of stomata, which can open or
close in response to CO2 levels (Mott 1988; Assmann 1999). Abscisic
acid (ABA) induces stomata closure, while ethylene can modify
photosynthesis by inhibiting ABA-induced stomatal closure with a
dose-dependent mechanism (Tanaka et al. 2005). Moreover, stomatal
opening is induced by light (Assmann 1999). Several messengers were
reported in stomatal response to CO2 (such as apoplastic and cytosolic
pH gradients, free cytosolic calcium and membrane potential), which
overlap with stomatal response to ABA and light suggesting that guard
cell signaling is organized as a complex network and multiple
components regulate stomatal response to environmental stimuli
(Hetherington and Woodward 2003; Roelfsema et al. 2006; Munemasa
et al. 2015).
Additionally, plant growth and development require integration
of many external and internal stimuli which in combination with the
plant genetic program determine the plant phenotype. Plant hormones
or phytohormones are growth regulators, which act at low
concentrations, fundamental to finely orchestrate plant physiology
(Gray 2004). Phytohormones include auxins, cytokinins, ethylene,
ABA, gibberelins (GAs), jasmonates (JAs), brassinosteroids (BRs),
salicylic acid (SA), and strigolactones. Furthermore, several cross-talk
processes between phytohormones have been reported during plant
development and response to environmental stimuli (Munné-Bosch and
Müller 2013). As the present thesis is focused in ethylene, the functions
of the other phytohormones are slightly described reporting only their
main effects.

27
Introduction
Auxins were found in plants, and indolacetic acid (IAA) is the
most common and the most studied. Indeed, literature considers auxin
and IAA as interchangeable terms. IAA plays crucial functions in
several developmental processes such as gametogenesis,
embryogenesis, seedling growth and flower development, being
identified as a plant growth hormone. IAA affects plant cell division,
extension and differentiation, initiates lateral and adventitious root
formation and increase resistance to stress among other functions (Zhao
2010; Spaepen and Vanderleyden 2011)
Cytokinins trigger cell differentiation and thereby they are
essential in several aspects of plant growth and development such as
embryogenesis, vascular development and maintenance of meristems in
roots and shoots as well as in response to environmental stimuli
modulating root elongation, lateral root number, nodule formation, and
apical dominance (Osugi and Sakakibara 2015).
Abscisic acid was firstly described as growth inhibitor. Despite
of its name, ABA induces abscission zone formation but it does not
control directly abscission. Abscission is controlled by auxins which
control the ethylene sensitivity of abscission zone (Abeles et al. 1992;
Al-Khalifah and Alderson 1999). ABA regulates several processes in
plant growth and development such as cell division and elongation,
embryo maturation, seed dormancy, germination, stomatal aperture,
floral induction, and responses to environmental stresses such as cold,
drought, salinity, UV radiation, and pathogen attack (Finkelstein 2013).
Furthermore, endogenous ABA is determinant in limiting production of
ethylene maintaining rather than reducing plant growth (Sharp 2002).

28
Introduction
Gibberellins are tetracyclic diterpenoid molecules which
stimulate determinant processes of plant growth and development
including seed germination, stem elongation, leaf expansion, trichome
development, pollen maduration and flowering (Achard and Genschik
2009).
Jasmonates are oxylipins which regulate several aspects of plant
biology that range from stress responses to development being
jasmonoyl-isoleucine (JA-Ile) a significant active form. Jasmonates are
involved in carbon partitioning, reproductive development and
senescence in healthy tissues as well as in environmental responses
including defense against microbial pathogens (specially necrotrophic)
and insects (herbivores), and responses to abiotic stresses such as UV
radiation, drought, and ozone among others (Browse 2009). They also
regulate stomatal aperture (Munemasa et al. 2011) and root water
uptake (Sánchez-Romera et al. 2014).
Brassinosteroids are polyhydroxylated steroidal molecules
which participate in several processes of plant growth and development
including cellular expansion and proliferation, morphogenesis,
differentiation of vascular tissues, development of leaves, male fertility,
and time of senescence as well as improve tolerance to various stresses
such as heat, salinity, drought and heavy metals (Fariduddin et al.
2014).
Salicylic acid is a phenolic compound mainly involved in plant
immune response. SA is important in defense signaling pathways,
which induced systemic acquired resistance (SAR) protecting plant
form a wide spectrum of pathogen in a long term (Vlot et al. 2009).
Furthermore, SA also plays a role in plant response to abiotic stresses

29
Introduction
as well as in regulation of physiological and biochemical processes
such as germination, flowering, photosynthesis, redox status and
senescence (Rivas-San Vicente and Plasencia 2011).
Strigolactones are carotenoid derived molecules which inhibits
branching in shoot tissues, stimulate symbiosis establishment with
mycorrhizae and also trigger the germination of parasitic plants seeds
(Gomez-Roldan et al. 2008).
Ethylene
Ethylene is a gaseous phytohormone with several roles in plant
growth and development. The ethylene biosynthesis and response
pathways are key players in nodulation in symbiotic nitrogen fixation
(Goormachtig et al. 2004), defense against pathogens (Glazebrook
2005), regulation of flowering, fruit ripening and senescence (Abeles et
al. 1992), plant architecture and regulation of the phenotypic plasticity
in an environment changing continuously (Dugardeyn and Van Der
Straeten 2008). Indeed, ethylene is a key player involved in response to
environmental stresses such as nutritional stresses (Iqbal et al. 2013),
drought (Pan et al. 2012), salinity (Tao et al. 2015), flooding response
(Hattori et al. 2009), and oxidative stress (Asgher et al. 2014) among
others.
Ethylene is typically reported as growth inhibitor (Abeles et al.
1992). The triple response to ethylene (inhibition of root and
hypocotyls elongation, thickened hypocotyls and exaggerated apical
hook formation) was firstly discovered in pea (Pisum sativum)
seedlings growing in dark conditions, and then also described in

30
Introduction
Arabidopsis (Fig. I1) (Guzman and Ecker 1990). Nevertheless, ethylene
induction of plant growth was also reported such as strong shoot
elongation of semi-aquatic plants (Vosenek and Van der Veen 1994).
Figure I1. Morphological features of the triple response in wild type arabidopsis.
Each panel is composed of two photomicrographs of an etiolated arabidopsis
seedling; the upper part shows the apical region of the hypocotyl and the lower part
shows the complete seedling. (A) Wild type displaying the triple response in the
presence of 10 ml l-1
ethylene. (B) Wild type incubated without ethylene. Figure
taken and adapted from Guzman and Ecker (1990).
The triple response to ethylene in dark-grown seedlings was very
useful to identify ethylene insensitive mutants (Bleecker et al. 1988;
Guzman and Ecker 1990; Kieber et al. 1993; Roman et al. 1995).
Growth inhibitory effects mediated by ethylene were reported in
several species in roots (Visser et al. 1997; Pierik et al. 1999; Swarup et
al. 2007; Negi et al. 2010; Ma et al. 2014) and shoots (Smalle and
Straeten 1997; Knoester et al. 1997; Fiebig and Dodd 2016). Moreover,

31
Introduction
constitutive ethylene signaling mutants shows dwarf phenotypes with
unexpanded and severely reduced cell growth (Kieber et al. 1993).
Meanwhile, ethylene-insensitive mutants were considerably larger than
wild type plants with larger expanded leaves resulting from enhanced
cell growth (Bleecker et al. 1988; Hua et al. 1995).
On the other hand, growth stimulation of hypocotyls mediated by
ethylene was reported in arabidopsis seedlings growing in light
conditions. Shortage of nutrients enhanced seedling growth stimulation
pointing to ethylene response is dependent on external conditions
(Smalle and Straeten 1997). Moreover, light quality can also influence
on ethylene responses (Pierik et al. 2004). Ethylene is able to stimulate
plant growth at relatively low concentrations in several species (Smalle
and Straeten 1997; Suge and Nishizawa 1997; Pierik et al. 2003).
Furthermore, growth stimulation was also reported at high ethylene
levels in other plant species that generally live in often flooded habitats
(Voesenek et al. 1997; Kende et al. 1998; Voesenek and Sasidharan
2013).
Growth inhibition and induction produced by ethylene suggested
an action mechanism with low and higher ethylene levels promoting
and inhibiting plant growth, respectively, so a biphasic model was
proposed (Lee and Reid 1997). The ethylene concentration required for
growth stimulation or inhibition depends on integrative result of
internal and external stimuli, and specific traits of plant species related
in principle with their habitat (Pierik et al. 2006). One extreme in the
biphasic model would be represented by aquatic and semi-aquatic
plants, which showed growth promotion even at high ethylene
concentrations, while the other extreme would be represented by plants

32
Introduction
showing only inhibitory growth effects mediated by ethylene (Pierik et
al. 2006). The ethylene response curves to ethylene dose usually show
two phases (Fig. I2) (Lee and Reid 1997; Suge and Nishizawa 1997;
Hua and Meyerowitz 1998; Fiorani et al. 2002).
A
B C
D E
Figure I2. Ethylene biphasic response model. (A) Hypothetical dose-response curves
might be shifted along the x-axis because of environmental conditions, species-
specific characteristics and internal signals. Curves I–IV show variation in ethylene
dose-response relationships, which are illustrated in (B-E) with examples of
published data on different species and traits. Control values are set at 5×10⁻³
μl l-1
ethylene as the ambient ethylene concentration, but this control concentration was
even lower in (C) and (D) as ethylene was experimentally removed from the air. (B)
Root elongation in cucumber; (C) Hypocotyl length in dark-grown arabidopsis
seedlings; (D) Coleoptile length in the wheat Hong Mang Mai cultivar; (E) Petiole
elongation in Rumex palustris. Figure taken from Pierik et al. (2006).

33
Introduction
Ethylene biosynthesis
Ethylene is biosynthesized from methionine via S-
adenosylmethionine (SAM) and 1-aminocyclopropane1-carboxylate
(ACC), which is the ethylene immediate precursor (Fig. I3).
Methionine plays several physiological roles in plants including
ethylene biosynthesis, sulfation, protein biosynthesis and methylation
of proteins and nucleic acids. A recycling mechanism to maintain
methionine pool was described in plants and it is called Yang cycle
(Baur and Yang 1972).
SAM was converted to ACC releasing 5'-methylthioadenosine
(MTA), which is subsequently recycled to methionine allowing
continuously ethylene production without depleting the methionine
pool (Miyazaki and Yang 1987). This reaction is catalyzed by ACC
synthase (ACS) (Boller et al. 1979) and ACC oxidase (ACO) resulting
in ethylene, carbon dioxide and cyanide (Yang and Hoffman 1984;
Kende 1993), although ACC can be also conjugated in several forms
such as malonyl-ACC, γ-glutamyl-ACC and jasmonyl-ACC (Fig. I3)
(Van de Poel and Van Der Straeten 2014). In tomato, ACS and ACO
genes were encoded by two gene families and at least nine ACS and six
ACO isoforms have been described (Barry et al. 1996; Blume and
Grierson 1997; Nakatsuka et al. 1998; Jiang and Fu 2000; Alexander
and Grierson 2002; Sell and Hehl 2005).

34
Introduction
Figure I3. Structural scheme of ethylene biosynthesis and 1-aminocyclopropane-1-
carboxylic acid (ACC) conjugation/metabolism. The amino acid methionine is
converted to S-adenosyl-L-methionine (SAM) by SAM-synthetase (SAMS) with the
requirement of ATP. The general precursor SAM is then converted to ACC by ACC-
synthase (ACS). This reaction also involves the cleavage of 5′-methylthioadenosine
(MTA), which is recycled back to methionine by the Yang cycle (dotted line indicates
multiple enzymatic steps). ACC can be converted to ethylene by ACC-oxidase (ACO)
in the presence of oxygen. ACC can also be converted to its major conjugate 1-
malonyl-ACC (MACC) by the yet uncharacterized ACC-N-malonyl transferase (AMT)
with the requirement of malonyl-Coenzyme-A. A second derivate of ACC is γ-
glutamyl-ACC (GACC) which is formed by γ-glutamyl-transpeptidase (GGT) with the
requirement of glutathione (GSH). Another novel derivate of ACC is jasmonyl-ACC
(JA-ACC), which is formed by jasmonic acid resistance 1 (JAR1). ACC can also be
metabolized by the bacterial (and plant) ACC deaminase into ammonium and α-
ketobutyrate. Figure taken from Van de Poel and Van Der Straeten (2014).
35
Introduction
The limiting step for ethylene biosynthesis is mainly ACS (Wang
et al. 2002), but recent studies suggest that ACO could be the rate-
limiting enzyme under particular conditions as low oxygen
concentration (Dorling and McManus 2012). Throughout plant growth
and development, ACS genes are expressed with cell- and tissue-
specific patterns differentially regulated in function of developmental
stage and in response to internal and external stimuli, in order to finely
control ethylene production (Tsuchisaka et al. 2009; Dorling and
McManus 2012). Furthermore, two ethylene regulatory systems were
proposed in case of tomato. Basal ethylene levels were negatively
feedback regulated during vegetative growth with involvement of ACS1
and ACS6 genes, while high ethylene levels were positively feedback
regulated during fruit ripening with involvement of ACS2 and ACS4
genes (Barry et al. 2000; Alexander and Grierson 2002; Alba et al.
2005).
Additionally, previous studies correlated spatiotemporal ACS
expression with ethylene production (Zarembinski and Theologis 1994;
Wang et al. 2002; Sobeih et al. 2004). Nevertheless, ACS genes present
a strong post-transcriptional regulation by phosphorylation processes
(McClellan and Chang 2008; Lyzenga et al. 2012; Xu and Zhang
2014), and thereby expression patterns of ACS genes were not always
in accordance with ethylene production.
Ethylene transduction pathway
The first step in ethylene signal transduction is the binding of
ethylene to its receptors. Ethylene receptors are predominantly
localized into the endoplasmic reticulum (ER), since ethylene is a

36
Introduction
lipophilic molecule and freely diffuse up to endomembrane-located
receptors (Grefen et al. 2008). Moreover, this localization might be
involved in interactions with other cellular components and/or signal
integration with other pathways (Ju and Chang 2012). Ethylene signal
transduction is triggered when ethylene bind to its receptors via a
copper cofactor (Rodríguez 1999; Woeste and Kieber 2000),
diminishing the activity of a serine/threonine kinase, called CTR1
(constitutive triple response 1) which inhibits further signaling (Kieber
et al. 1993; Clark et al. 1998) by ethylene-insensitive protein 2 (EIN2)
and EIN3 (Chao et al. 1997; Alonso et al. 1999). Ethylene perception
finally results in transcriptional changes denominated as ethylene
response (Ju and Chang 2012; Vandenbussche et al. 2012; Merchante et
al. 2013). The transduction pathway of ethylene is almost completely
described in Arabidopsis thaliana since it is a model plant in basic
research. Thus, ethylene transduction pathway is described in the
present thesis mainly based in research performed in arabidopsis, but
also the main differences found in tomato plants were detailed.
Ethylene receptors
In Arabidopsis, ethylene is perceived trough a family of receptors
with similarity to bacterial two-component regulators called ethylene
receptor 1 and 2 (ETR1, ETR2 respectively), ethylene sensor 1 and 2
(ERS1, ERS2 respectively), and ethylene insensitive 4 (EIN4)
(Bleecker et al. 1988; Hua et al. 1995; Hua et al. 1998; Sakai et al.
1998). By sequence comparisons, these receptors have been classified
into two subfamilies: subfamily I consisting of ETR1 and ERS1 and
subfamily II consisting of ETR2, EIN4 and ESR2. All ethylene
receptors present a similar N-terminal domain and a histidine kinase-

37
Introduction
like domain, while only subfamily II presents additional amino acids
which could act as a signal peptide or form an additional
transmembrane helix (Fig. I4).
Figure I4. The domain structures of the ethylene receptors from Arabidopsis
thaliana. Each receptor contains an ethylene binding, GAF, and kinase domains as
shown. Three of the five also contain a receiver domain. ETR1 and ERS1 are in
subfamily 1 and subfamily 2 includes ETR2, EIN4, and ERS2. Subfamily 2 receptors
are characterized by additional amino acids at the N-terminus that may form a
fourth transmembrane helix or act as a signal peptide. Figure taken from Wilson et
al. (2015).
In tomato, a family of six ethylene receptors was found (SlETR1-
6). They were also classified in two subfamilies according to its
structure in subfamily I (SlETR1-3) and subfamily II (SlETR4-6)
(Wilkinson et al. 1995; Lashbrook et al. 1998; Tieman and Klee 1999).
Subfamily I contains all the essential residues for histidine kinase
function, while subfamily II lack some kinase residues that are
conserved in others. SlETR3 was also named Never Ripe (NR) since its
mutation result in an easily recognized phenotype characterized by fruit
inability to undergo ripening, delayed flower, leaf senescence and
pedicel abscission, although some residual responsiveness is conserved.

38
Introduction
Moreover, SlETR3 corresponds to ETR1 of Arabidopsis thaliana
(Lanahan et al. 1994; Wilkinson et al. 1995).
In Arabidopsis, functional redundancy was proposed for ethylene
receptors because a single receptor loss of function does not have a
major effect upon ethylene signaling. However, reduction in either
SlETR4 or SlETR6 mRNA levels produces hypersensitivity to ethylene
in tomato (Tieman et al. 2000). Reduction of SlETR3 expression by
transgenic approach (antisense strategy) produced a proportionally
increase in expression of SlETR4 suggesting that tomato plants
compensate for the loss of function of SlETR3 by increasing SlETR4
expression, while SlETR3 overexpression in lines with decreased
SlETR4 gene expression remove the ethylene-sensitive phenotype,
pointing to these ethylene receptors are functionally redundant, despite
pronounced structural differences (Tieman et al. 2000; Kevany et al.
2007). Thus, functional redundancy was noticed in arabidopsis, while
functional compensation and redundancy were observed for some
tomato ethylene receptors.
In addition to ethylene receptors, several described genes are
essential for the proper function of these receptors. The first identified
gene was RAN1 (responsive to antagonist 1), a cooper transporter
required for ethylene receptor biogenesis (Hirayama et al. 1999;
Woeste and Kieber 2000). Another ethylene receptor regulator is RTE1
(reversion to ethylene sensitivity 1), whose mutation suppressed the
weak insensitivity to ethylene in etr1 mutant in arabidopsis (Resnick et
al. 2006), probably because RTE1 is involved in activation of ETR1 by
conformational changes (Resnick et al. 2008), and needed for signaling
of the N-terminal domain of ETR1 (Qiu et al. 2012). In tomato, the

39
Introduction
green-ripe (gr) mutant also shows a dominant defect in fruit ripening
with ethylene insensitivity or slight decrease in sensitivity to ethylene.
Green ripe (GR) and green ripe-like proteins (GRL1 and GRL2) are
homolog to RTE1 (Barry and Giovannoni 2006; Ma et al. 2012).
Furthermore, cytochrome b5 (Cytb5) was identified as RTE1-
interacting protein suggesting that Cytb5 could regulate ETR1
oxidative folding via RTE1 (Chang et al. 2014) (Fig I5).
Cytoplasm
NucleusEthylene responsivegenes
(ERFs, EBF1/2…etc)
Figure I5. Ethylene signaling cascade. Figure taken and adapated from Wen et al.
(2015).

40
Introduction
Ethylene signaling
In arabidopsis, only one CTR1 gene constitutively expressed has
been found (Kieber et al. 1993). The ethylene-insensitive phenotype of
the ETR1 family members was suppressed by ctr1 mutation (Bleecker
et al. 1988; Kieber et al. 1993; Hua et al. 1998; Sakai et al. 1998). In
addition, direct interaction between CTR1 and ETR1 was reported
pointing to CTR1 direct regulation by ethylene receptors (Clark et al.
1998).
However, four CTR1-like genes (SlCTR1-4) were reported in
tomato (Leclercq et al. 2002; Adams-Phillips et al. 2004). All of them
show sequence conservation of the CN motif on the N-terminal regions,
which is important for interaction with ethylene receptors (Huang et al.
2003), and SlCTR1, SlCTR3 and SlCTR4 are able to restore ethylene
transduction signal in arabidopsis (Adams-Phillips et al. 2004). All
ethylene receptors could activate CTR1 in arabidopsis in absence of
ethylene to suppress downstream responses, while the multiple ethylene
receptors and CTRs are differentially regulated in response to stimuli
and during development in tomato. Thus, possible specific interactions
between tomato receptors and CTRs can regulate different ethylene
responses (Zhong et al. 2008).
In addition, the phenotype of ctr1 mutant was suppressed by ein2
and ein3 mutations (Roman et al. 1995). EIN2 is the next step in
ethylene signaling pathway (Fig I5) (Alonso et al. 1999). EIN2 N-
terminal domain shows similarity to the metal ion transporters Nramp
family, while C-terminal domain overexpression caused a constitutive
ethylene response. Full-length expression does not produce this
constitutive phenotype pointing to regulation role for N-terminal

41
Introduction
domain and ethylene response activation function for C-terminal
domain (Alonso et al. 1999). In fact, EIN2 stability is regulated via
26S-proteasome by two F-box proteins called EIN2-targeting protein 1
(ETP1) and 2 (ETP2) (Fig I5). Ethylene down-regulates ETP1/2
expression for further signaling, so their over-expression caused
ethylene insensitivity (Qiao et al. 2009).
The next signaling protein involved in ethylene transduction
pathway is EIN3 (Roman et al. 1995; Chao et al. 1997). After EIN2 is
processed and activated, the C-terminal domain is transported to the
nucleus activating EIN3, which acts a transcriptional regulator of
ethylene response (Fig I5) (Chao et al. 1997). Furthermore, three EIN3-
like genes (EIL1-3) were also identified in arabidopsis and EIL1 and
EIL2 rescue ethylene insensitivity in ein3 mutant. EIN3 and EIL1
showed enough capacity to induce ethylene responses (Chao et al.
1997). Furthermore, the level of EIN3 protein is regulated by
proteolysis via 26-proteasome pathway, and two ethylene-induced F-
box proteins (EIN3-binding F-box1 (EBF1) and F-box2 (EBF2))
directly interact with EIN3 in order to mediate protein degradation (Fig
I5). Ebf1 and ebf2 mutants showed hypersensitivity to ethylene, while
the double mutant showed constitutive ethylene response pointing to
their function as negative regulators of ethylene signaling via EIN3 and
EIL1 degradation (Guo and Ecker 2003; Potuschak et al. 2003).
In addition, EIN5 gene encodes a 5’-3’ exoribonuclease XRN4,
which mutation affected expression of several genes including EBF1/2
(Fig I5). Thus, EIN5 function as EIN3 positive regulator by negative
regulation of EBF1/2 (Olmedo et al. 2006; Potuschak et al. 2006).
EIN3 can directly target the promoter of ethylene response factors

42
Introduction
(ERFs) inducing the ethylene-response (Solano et al. 1998), which
includes a transcriptional cascade which leads to differentially
expression of hundreds of genes (An et al. 2010).
Ethylene response
ERFs are trans-acting factors which specifically promoters of
ethylene-responsive genes (Solano et al. 1998). The ERF family
belongs to the superfamily containing the apetala 2 (AP2) domain. The
ERF family is composed by 122 genes in arabidopsis (Nakano et al.
2006) and 155 in Solanum spp. (Charfeddine et al. 2014). Additionally,
the ERF type family is formed by two subfamilies: the dehydration-
responsive element-binding proteins (DREB) and ethylene responsive
factor (ERF) (Riechmann et al. 2000; Sakuma et al. 2002).
The ERF family is involved in multiple responses in plants such
as developmental processes (Banno et al. 2001; Pirrello et al. 2006),
phytohormone signaling pathways (Müller and Munné-Bosch 2015),
and regulation of metabolic pathways (Broun et al. 2004; Zhang et al.
2005). ERF proteins expression results in tolerance to biotic stresses via
GCC box elements, while DREB proteins were involved in tolerance to
abiotic stresses such as dehydration, cold and salt stress via DRE
elements (Gu et al. 2000; Guo and Ecker 2004; Huang et al. 2008).
However, ERF-type bound to promoters without GCC box was also
described in tomato (Chakravarthy et al. 2003), as well as ERF-type
binding to vascular wounding responsive elements (VWRE) (Sasaki et
al. 2007). The ERF proteins activation dependent on different stimuli or
differential binding activity as well as signaling pathways crosstalk
processes could simultaneously mediate regulation of multiple

43
Introduction
responses by ERF proteins (Phukan et al. 2017). In case of tomato, ERF
proteins selectively bind to GCC-box elements depending on their
flanking regions displaying a specific tissue patterns enabling finely
ethylene regulation of a broad range of physiological processes
(Pirrello et al. 2012).
Plant nutrition
Several environmental factors are required for optimal plant
growth and development including the mineral nutrients in order to
meet metabolic demands. Nutrients availability is often limited in soils,
and thereby several plant responses have been developed affecting the
whole plant morphology and metabolism in order to cope with low
availability of nutrients (López-Bucio et al. 2002). A wide range of
transport proteins regulate nutrient acquisition in root cells and
translocation within the plant. Moreover, nutrient bioavailability
determines transporter gene expression at transcriptional and post-
transcriptional level, and transporter activity is usually controlled by
post-translational modifications to maintain nutrient homeostasis
(Aibara and Miwa 2014). Several nutrients are acquired by transporters
located in the plasma membrane and induced under limited nutritional
conditions such as nitrogen (Lezhneva et al. 2014), phosphorus
(Raghothama and Karthikeyan 2005), potassium (Caballero et al.
2012), magnesium (Mao et al. 2014), and manganese (Sasaki et al.
2012).
Furthermore, plant physiology is finely regulated by
phytohormones, whose biosynthesis is in turn influenced by nutritional

44
Introduction
status. In consequence, a close interrelation between nutritional and
phytohormonal homeostasis as well as coordination between their
signaling pathways is required for proper plant growth and
development (Krouk et al. 2011). Ethylene plays a prominent role in
mineral nutrition and response to low nutrient availability. Indeed,
ethylene is involved in root responses to nutrient toxicities and
deficiencies (Iqbal et al. 2013; García et al. 2015). Several cross-talk
processes has been studied in case of nitrogen (Iqbal et al. 2011),
calcium (Lau and Yang 1976), iron (Lucena et al. 2006), and potassium
(Benlloch-González et al. 2010) among others. Furthermore, important
processes to cope with low nutrient availability such as root elongation,
lateral root proliferation and cell fate determination are regulated by
ethylene (Lynch and Brown 1997). Plant nutrition includes
macronutrients coming from water and photosynthesis as carbon,
oxygen and hydrogen and mineral macronutrients and micronutrients,
whose main functions in plants are described as follows.
Nitrogen is essential for plants because it is involved in biomass
production and metabolism. Most of plant nitrogen forms part of amino
acids, proteins and nucleic acids and its deficiency causes chlorosis of
leaves and stunted growth. Ethylene is involved in plant response to
nitrogen. Ethylene effects on plant physiology can be dependent on
available nitrogen since ethylene is able to suppress root hair branching
stimulated by ammonium, which in turn is enhanced by methyl
jasmonate (Yang et al. 2011). Moreover, ethylene sensitivity and
subsequent aerenchyma formation was increased during nitrogen
deficiency in maize (He et al. 1992) showing the interrelation between
ethylene and nitrogen.
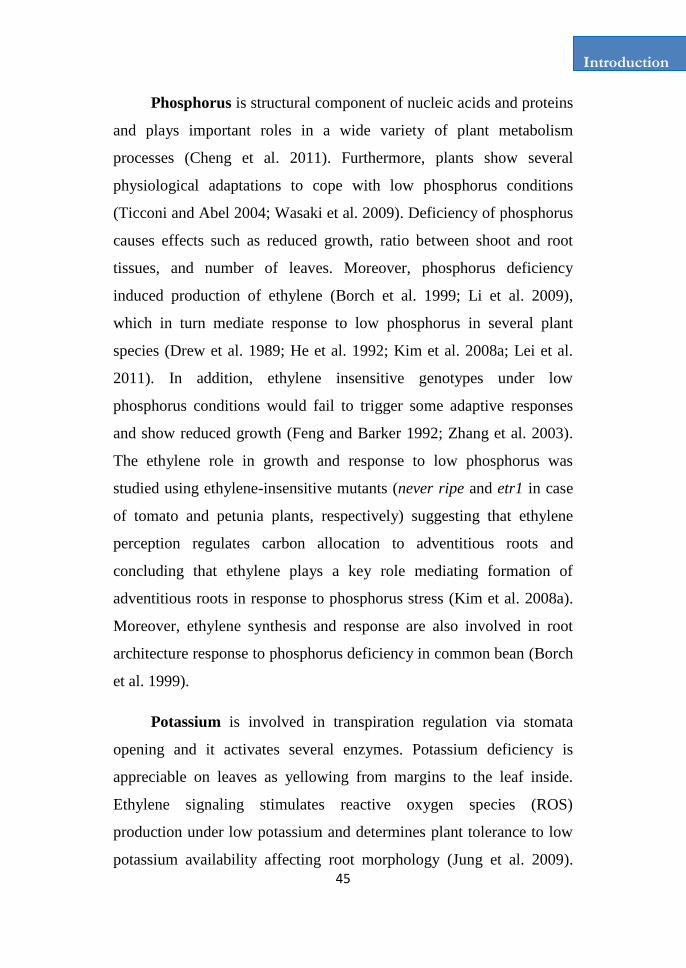
45
Introduction
Phosphorus is structural component of nucleic acids and proteins
and plays important roles in a wide variety of plant metabolism
processes (Cheng et al. 2011). Furthermore, plants show several
physiological adaptations to cope with low phosphorus conditions
(Ticconi and Abel 2004; Wasaki et al. 2009). Deficiency of phosphorus
causes effects such as reduced growth, ratio between shoot and root
tissues, and number of leaves. Moreover, phosphorus deficiency
induced production of ethylene (Borch et al. 1999; Li et al. 2009),
which in turn mediate response to low phosphorus in several plant
species (Drew et al. 1989; He et al. 1992; Kim et al. 2008a; Lei et al.
2011). In addition, ethylene insensitive genotypes under low
phosphorus conditions would fail to trigger some adaptive responses
and show reduced growth (Feng and Barker 1992; Zhang et al. 2003).
The ethylene role in growth and response to low phosphorus was
studied using ethylene-insensitive mutants (never ripe and etr1 in case
of tomato and petunia plants, respectively) suggesting that ethylene
perception regulates carbon allocation to adventitious roots and
concluding that ethylene plays a key role mediating formation of
adventitious roots in response to phosphorus stress (Kim et al. 2008a).
Moreover, ethylene synthesis and response are also involved in root
architecture response to phosphorus deficiency in common bean (Borch
et al. 1999).
Potassium is involved in transpiration regulation via stomata
opening and it activates several enzymes. Potassium deficiency is
appreciable on leaves as yellowing from margins to the leaf inside.
Ethylene signaling stimulates reactive oxygen species (ROS)
production under low potassium and determines plant tolerance to low
potassium availability affecting root morphology (Jung et al. 2009).

46
Introduction
However, ethylene is involved in inhibition of stomatal closure
mediated by potassium under water stress (Benlloch-González et al.
2010).
Calcium is involved in regulation of a wide range of plant
processes via calmodulins as well as a key component of plant cell wall
conferring rigidity (Hepler 2005; Yang et al. 2011). External addition
of calcium (Ca2+
) was specifically able to enhance ethylene production
in mung bean, although also showed synergistic effects with copper
(Cu2+
) and kinetin (citokinin) which causes Ca2+
uptake on a par with
ethylene production (Lau and Yang 1976). In addition, apoplastic
calcium content was positively correlated with ACC oxidase induction
in pea seedlings (Kwak and Lee 1997).
Magnesium is essential in photosynthesis and plays a
determinant role in plant metabolism acting as cofactor of several
enzymes as well as structural component in a wide variety of
molecules. Magnesium deficiency results in chlorophyll degradation
and thereby reduced photosynthesis and enhances enzyme inactivation
(Guo et al. 2016). Under low magnesium availability or deficiency,
ethylene synthesis was reported since four ACC synthase genes were
strongly induced (Hermans et al. 2010).
Iron forms part of a wide range of enzymes including those in
redox systems, apart from playing a key role in respiration and
photosynthesis. Iron deficiency causes leaf chlorosis and stunted
growth (Rout and Sahoo 2015). Response to low iron in cucumber was
repressed by inhibitors of ethylene synthesis or action (Romera and
Alcántara 1994). Moreover, ACC addition induced expression of genes
involved in low iron response and mediated iron acquisition and

47
Introduction
assimilation in several species including arabidopsis and tomato
(Lucena et al. 2006). Indeed, ethylene biosynthesis and signaling was
induced by iron deficiency in arabidopsis (García et al. 2010).
Copper plays a determinant function in protein and carbohydrate
metabolism as well as acts as catalyst in photosynthesis and respiration,
although it is also potentially toxic for plant cells (Yruela 2005).
Copper deficiency result in plant chlorosis and finally necrosis, and
high copper concentrations caused leaf toxicity and high ethylene
production (Yruela 2005; Franchin et al. 2007). As abovementioned,
copper is a key element of ethylene receptor functionality (Hirayama et
al. 1999; Woeste and Kieber 2000), and thereby its deficiency could
also result in lower ethylene responsiveness. High levels of copper are
able to induce ethylene production in several species (Maksymiec
2007; Arteca and Arteca 2007). In addition, two ethylene biosynthesis
and receptor genes were induced by abiotic stress caused by excessive
copper in potato and broccoli (Schlagnhaufer et al. 1997; Jakubowicz et
al. 2010).
Manganese plays a protective role in photosynthetic tissues and
increases antioxidant capacity in root tissues (Zornoza et al. 2010).
However, high levels of manganese are toxic producing necrotic
lesions on par with increased ethylene levels (Fowler and Morgan
1972). Furthermore, it was reported that manganese deficiency
enhanced the ozone-induced ethylene and decreased the ascorbic acid
content of leaves (Mehlhorn and Wenzel 1996).

48
Introduction
Biotic and abiotic stresses
ERFs plays a key role in tolerance to abiotic stresses such as
drought, salinity, light stress, cold and heat in several species including
arabidopsis (Dubois et al. 2013; Vogel et al. 2014), tomato (Hu et al.
2014; Severo et al. 2015), tobacco (Guo et al. 2004; Wu et al. 2007),
and wheat (Rong et al. 2014; Djemal and Khoudi 2015). In addition,
common ERF gene expression was reported under several abiotic
stresses (Müller and Munné-Bosch 2015).
As abovementioned, ERF genes are able to bind to dehydration
responsive elements (DRE) and GCC box. In arabidopsis, ERF1 binds
to DRE elements of several genes including early response to
dehydration 7 (ERD7), responsive to dessication 29B (RD29B) and
RD20 (Cheng et al. 2013) conferring tolerance to various stresses
including drought, heat and salinity. In addition, ERF1 is also able to
bind to GCC box in promoters of jasmonic- and ethylene-responsive
plant defensin (PDF1.2) and basic chitinase (b-CHI) (Solano et al.
1998), also conferring resistance to pathogens. In potato, the expression
induction of pathogen and freezing tolerance-related protein1 from
pepper (CaPF1; ERF pepper transcription factor) resulted in resistance
to heat, freezing, heavy metal, and oxidative stress (Youm et al. 2008).
Furthermore, the expression of transcriptional activator of tomato
(TSRF1; ERF transcription factor) regulates osmotic stress tolerance
and pathogen stress tolerance in tobacco (Zhang et al. 2007). In
addition, plant response and adaptation to stress conditions need a
finely coordinated phytohotmone crosstalk in order to regulate gene
expression and specifically response. Unfortunately, the molecular

49
Introduction
mechanisms underlying pathway crosstalk are still only partially
unraveled (Müller and Munné-Bosch 2015).
Drought stress
Drought stress is able to induce ethylene production (Pierik et al.
2007). Drought stress causes important losses in crops since drought
largely reduce plant growth, which depends on cell growth and
differentiation. In addition, drought affects to a wide range of
physiological processes such as stomatal conductance, respiration,
transpiration, photosynthesis, and membrane functions among others
(Hasanuzzaman et al. 2014). Plant mechanisms to cope water deficit
are mainly mediated by ethylene and ABA (Sharp et al. 2000; Pierik et
al. 2007) acting as antagonists since accumulation of ABA could
modulate growth response to ethylene and vice versa (Wilkinson and
Davies 2010; Wilkinson et al. 2012).
Root system is a key player in drought stress response (Steudle
2000; Chaves et al. 2003). Drought primarily diminishes aerial
vegetative growth as well as produces physiological effects as gas
exchange inhibition, but is mainly sensed by roots affecting root-to-
shoot signaling (Deblonde and Ledent 2001; Anjum et al. 2011).
Additionally, drought affected expression of several genes involved in
osmotic stress showing also cross-linking with other abiotic stresses
(Yamaguchi-Shinozaki and Shinozaki 2006; Shinozaki and
Yamaguchi-Shinozaki 2007). ACC is transported from roots to shoots
via xylem (Else and Jackson 1998), and leaf ethylene evolution was
associated with ACC transport in tomato under drought stress (Sobeih

50
Introduction
et al. 2004). In consequence, ACC was pointed as root-sourced signal
and ethylene as key player in growth inhibition of leaves (Schachtman
and Goodger 2008).
As observed with other abiotic stresses, drought induced the
production of reactive oxygen species (ROS) such as hydrogen
peroxide (H202), superoxide anion (O2-), singlet oxygen (
1O2), and
hydroxyl radicals (OH-) in different subcellular compartments causing
oxidative stress that damage cellular components and thereby cells
(Mittler 2002). In addition, ROS production under stress triggers
specific defense or adaptation responses with H202 as secondary
messenger. When plants are unable to scavenge high ROS levels,
several essential processes can be affected resulting even in plant death.
However, the enhanced production of ROS is kept under control
through a flexible and cooperative antioxidant system, which modulates
ROS concentration within the cell and adjust the redox status (Cruz de
Carvalho 2008).
The main mechanism of ROS scavenging includes several
enzymes and metabolites. Superoxide dismutase (SOD) quickly
scavenges O2- radical producing oxygen and H202 (Bowler et al. 1992).
Catalase (CAT) and ascorbate peroxidase (APX) are the major
enzymatic scavengers of H202 (Willekens et al. 1997; Noctor and Foyer
1998). CAT does not require reductant and shows lower affinity (mM
range) for H202 scavenging, while APX needs ascorbate acting at 1000-
fold lower range (Mittler 2002). Other important enzyme is glutathione
reductase (GR) which participates in the ascorbate/glutathione cycle.
GR maintains the glutathione pool within the cell in the reduced state
(reduced glutathione; GSH) (Noctor and Foyer 1998). As ascorbic acid,
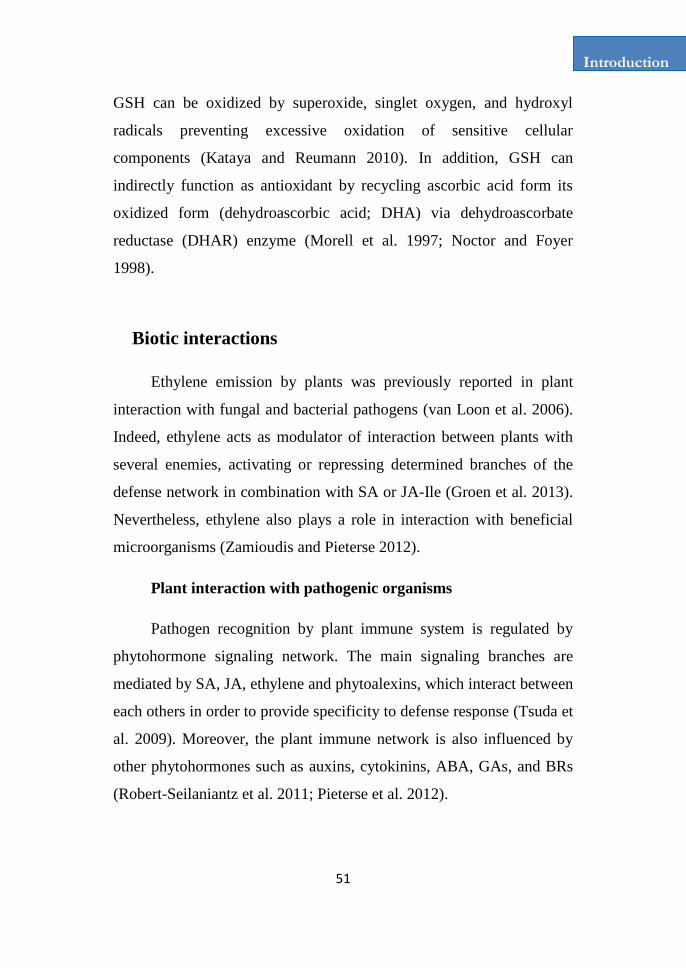
51
Introduction
GSH can be oxidized by superoxide, singlet oxygen, and hydroxyl
radicals preventing excessive oxidation of sensitive cellular
components (Kataya and Reumann 2010). In addition, GSH can
indirectly function as antioxidant by recycling ascorbic acid form its
oxidized form (dehydroascorbic acid; DHA) via dehydroascorbate
reductase (DHAR) enzyme (Morell et al. 1997; Noctor and Foyer
1998).
Biotic interactions
Ethylene emission by plants was previously reported in plant
interaction with fungal and bacterial pathogens (van Loon et al. 2006).
Indeed, ethylene acts as modulator of interaction between plants with
several enemies, activating or repressing determined branches of the
defense network in combination with SA or JA-Ile (Groen et al. 2013).
Nevertheless, ethylene also plays a role in interaction with beneficial
microorganisms (Zamioudis and Pieterse 2012).
Plant interaction with pathogenic organisms
Pathogen recognition by plant immune system is regulated by
phytohormone signaling network. The main signaling branches are
mediated by SA, JA, ethylene and phytoalexins, which interact between
each others in order to provide specificity to defense response (Tsuda et
al. 2009). Moreover, the plant immune network is also influenced by
other phytohormones such as auxins, cytokinins, ABA, GAs, and BRs
(Robert-Seilaniantz et al. 2011; Pieterse et al. 2012).

52
Introduction
Ethylene can produce antagonistic effects on SA signaling
blocking its production (Chen et al. 2009). In tomato infected with
Pseudomonas syringae, ethylene is induced increasing its susceptibility
to the pathogen (Cohn and Martin 2005). However, ethylene signaling
can also act synergistically with SA in order to contribute to immunity
against both necrotrophic and biotrophic pathogens (Tsuda et al. 2009).
Ethylene signaling in combination with JA-Ile leads to activation of
ERFs, while only JA-Ile signaling results in activation of MYC family
transcription factors. Defense triggered by ERF and MYC are mutually
antagonistic acting against fungi and herbivores, respectively (Lorenzo
et al. 2004; Verhage 2011; Fernández-Calvo et al. 2011). Moreover,
phytoalexins stimulates production of SA since mutation of PAD4
(phytoalexin deficient 4) have a defect in SA accumulation after
pathogen infection, suggesting that PAD4 is involved in a positive
regulatory loop to activate defense responses dependent on SA (Jirage
et al. 1999). Moreover, full ethylene production after pathogen
infection or other stresses relies on PAD4 activity (Heck et al. 2003;
Mühlenbock et al. 2008). Furthermore, PAD4 in combination with
enhanced disease susceptibility 1 (EDS1) regulates signaling during
defense responses (Pathogen-associated molecular patterns (PAMP)-
and effector-triggered immunities; PTI and ETI) (Rietz et al. 2011).
Thus, PAD4 regulates processes determinant for antimicrobial
biosynthesis during pathogen infection as previously reported with
fungal infections (Glazebrook et al. 1997).
Plant interaction with beneficial organisms
Beneficial microorganisms association with plants requires
mutual recognition being initially perceived as potential invaders and

53
Introduction
thereby triggering immune responses (Zamioudis and Pieterse 2012). A
common symbiosis signaling pathway (Sym pathway) is activated in
plants cells after perception of mycorrhizal and rhizobial factors, called
Myc and Nod factors, respectively (Oldroyd et al. 2009; Maillet et al.
2011). Furthermore, some non-symbiotic microbes as plant growth
promoting bacteria (PGPB) could also activate signaling components of
the Sym pathway (Sanchez et al. 2005) suggesting a partly converged
signaling pathway triggered by beneficial microbes.
PGPB are able to induce immune responses (Van Wees et al.
2008), and elicitors coming from induced systemic resistance (ISR)-
inducing PGPB strains are the best characterized, triggering a ROS
burst, a quick increase of cytoplasmatic calcium, and expression of
defense-related genes (Bakker et al. 2007; Van Loon et al. 2008).
Nevertheless, PGPB are also able to suppress triggered immune
response via effector secretion with involvement of ethylene since
PGPB-secreted molecules could target ethylene-dependent processes
(Millet et al. 2010). Indeed, several PGPB are able to reduce ethylene
production by plants (Glick et al. 2007b). Additionally, several soil
microbes are able to produce phytohormone-like compounds
(Lugtenberg and Kamilova 2009), which can help to suppress SA
signaling pathway affecting the outcome of the immune response
(Pieterse et al. 2009; Verhage et al. 2010). Thus, PGPB could produce
phytohormones in order to mitigate the SA signaling though hormonal
cross-talk mechanisms.
In addition, bacteria can reversibly switch morphology of
colonies, and thereby PGPB can use phenotypic variation or phase
variation in order to avoid plant immune system (Davidson and Surette

54
Introduction
2008). Bacterial subpopulations differ in expressed or altered molecules
on the surface such as flagella or lipopolisaccharides (LPS) (Van Der
Woude and Bäumler 2004). In fact, phenotypic variation processes has
been reported in interaction between plants and microorganisms living
in the rhizosphere (Achouak et al. 2004; Van Den Broek et al. 2005).
Furthermore, PGPB are able to secrete effectors by type III
secrtion systems (TTSS) which can determinate the host-specificity
suppressing innate immune system responses (Mavrodi et al. 2011). It
has been reported that immune responses to PGPB are dependent on
combination between host plants and bacterial strains (Van Wees et al.
1997; Van Loon et al. 1998; Ton et al. 2002), pointing to a gene-for-
gene plant-bacteria interaction. However, further research is required in
order to identify putative host “R proteins” which recognize effectors
and modulate the interaction between plant and bacteria (Zamioudis
and Pieterse 2012).
Tomato as model plant
Arabidopsis (Arabidopsis thaliana) was selected as model
organism in plant science to integrate knowledge of classical
disciplines with genetics and molecular biology (Koornneef and
Meinke 2010). Nevertheless, domesticated tomato (Solanum
lycopersicum) is the most important horticultural crop around the
world, and the second vegetable consumed after potato (Schwarz et al.
2010). Tomato is broadly used as model crop for physiological,
biochemical, molecular, and genetic studies as well as for fruit
development (Schwarz et al. 2014). Several large seed banks provide

55
Introduction
useful germoplasm as the Tomato Genetic Resuorce Center (TRGC) at
the University of California (Davis, USA; http://tgrc.ucdavis.edu),
which has been used in the present thesis. Moreover, the genomes of
the tomato wild-relative (Solanum pimpinellifollium) and the inbred
cultivar “Heinz 1706” were sequenced (Sato et al. 2012). Physical and
genetic maps (http://solgenomics.net) as well as databank of gene
expression (Koenig et al. 2013) and DNA polymorphisms (Causse et al.
2013) are also available providing useful information in order to
analyze and compare obtained results. Moreover, simple and general
methods using Agrobacterium tumefaciens have been developed for
genetic transformation in order to obtain tomato transgenic lines with
adequate efficiency in 4-6 months (Cortina and Culiáñez-Macià 2004;
Qiu et al. 2007; Sun et al. 2015).
Moreover, tomato can be easily growth within growth chambers
or greenhouses using nutrient solution to meet nutritional demands as
well as specific nutrient surplus or deficit (Hewitt 1966), achieving
seed to seed cultivation periods about 100 days at 20ºC (Schwarz et al.
2014). In consequence, tomato is a suitable model because all
abovementioned traits as well as the availability of a plenty of mutants.
For instance, the ethylene-insensitive mutant used in the present thesis,
called never ripe (Lanahan et al. 1994; Wilkinson et al. 1995).
Beneficial soil microorganisms
In soil, a plethora of microorganisms are able to associate with
plants. The microorganisms, which colonize plant roots, include fungi,
algae, bacteria, protozoa and actinomycetes (Barea et al. 2005; Gray

56
Introduction
and Smith 2005; Bhattacharyya and Jha 2012). These interactions can
be harmful, neutral or beneficial influencing plant growth and
development (Adesemoye and Kloepper 2009; Lau and Lennon 2011;
Nadeem et al. 2014).
The rhizosphere can be defined as any soil volume specially
influenced by plant root system or associated with the material
produced by roots and plants, including the region of soil bound by
plant roots and a few millimeters from the root surface (Bringhurst et
al. 2001). The term “rhizosphere” was firstly described as a zone of
maximum microbial activity since rhizosphere contains much more
bacteria diversity than the surrounding bulk soil (Montesinos 2003)
because plant exudates, that contains amino acids and sugars, provide a
rich source of nutrients and energy (Burdman et al. 2000; Farrar et al.
2003). In addition, soil microorganisms can be present in the
rhizosphere, rhizoplane (root surface), root tissue and/or within
specialized root structures (Martínez-Viveros et al. 2010) (Fig. I6).
Figure I6. Schematic representation of rhizosphere. The schematic shows magnified
pictures of the rhizosphere, containing saprophytic and symbiotic bacteria and fungi,
including arbuscular mycorrhizal fungi (AMF). Figure taken from Philippot et al.
(2013).

57
Introduction
Although bacterial population is the most abundant in the
rhizosphere (Schoenborn et al. 2004), fungi also inhabit the rhizosphere
influencing plant growth and development. The term “mycorrhizae”
designates the symbiotic association between plant roots, and fungi and
have been classified in endomyccorrhizae, ectomycorrhizae, and
ectendomycorrhizae regarding to hyphae penetration in root cortical
cells. Mycorrhizae increases area surface of roots enhancing water and
nutrient uptake, and also protects plants from abiotic stresses (Harrier
2001; Evelin et al. 2009; Martin et al. 2016).
Plant growth promoting bacteria
Among beneficial soil microorganisms, the bacteria has been
studied in detail (Lugtenberg and Kamilova 2009; Pii et al. 2015;
Santoyo et al. 2016), although cultivable bacterial cells in soil
represents only about 1% of total number of cells present (Schoenborn
et al. 2004). The term “rhizobacteria” was established to designate the
bacterial community of soil that competitively colonized plant root
system and promoted plant growth and/or diminish plant disease
incidence (Kloepper and Schroth 1978). Later, these were named plant-
growth promoting rizhobacteria or more generally plant growth
promoting bacteria (PGPR and PGPB, respectively). Nowadays, PGPB
concept has been limited to bacterial strains with at least two traits of
the abovementioned three criteria (Weller et al. 2002; Vessey 2003).
The root colonization process is influenced by bacterial traits,
root exudates and biotic and abiotic factors (Benizri et al. 2001;
Haichar et al. 2014). Furthermore, a successful PGPB root colonization

58
Introduction
is required to produce their beneficial effects (Elliott and Lynch 1984).
PGPB can be classified in accordance with their association degree
with the plant root cells into extracelluar (ePGPB) and intracellular
(iPGPB). In addition, iPGPB can be generally found inside specialized
nodular structures and ePGPB in the rhizosphere, rhizoplane or root
surface and the space between cells of root cortex (Martínez-Viveros et
al. 2010). Additionally, PGPB can also be classified such as
biofertilizers, phytostimulators and biopesticides (Lugtenberg and
Kamilova 2009), offering an attractive way to diminish or even replace
the use of chemicals in agriculture (Bhattacharyya and Jha 2012).
Biofertilizer: Product which contains live microorganisms that,
when is applied on the seed, plant surface or soil, is able to colonize
the rhizosphere and stimulate plant growth via increasing supply of
primary nutrients.
Phytostimulator: Product that contains live microorganisms,
which are able to modulate phytohormone levels that finely control
plant growth and development.
Biopesticide: Product that contains live microorganisms, which
are able to promote plant growth by controlling phytopathogenic
agents.
Plant-beneficial microbe associations are thought to be ancient
and shaped during co-evolution so that bacteria could have significant
effects on plant physiology (Lambers et al. 2009). In fact, the action
mechanism of some PGPB suggests a simple interaction and responses
between the two partners.

59
Introduction
PGPB action mechanisms
The bacteria able to stimulate plant growth include those that are
free-living bacteria, bacterial endophytes able to colonize interior
tissues of plants, that specifically form symbiosis with plants (such as
Rhizobia spp. and Frankia spp.), and cyanobacteria (previously named
blue-green algae). PGPB are able to induce plant growth either directly
or indirectly (Ortíz-Castro et al. 2009), although several mechanisms
may simultaneously act enhancing plant growth as a cumulative result
(Martínez-Viveros et al. 2010). They all facilitate resource uptake,
modulate phytohormone levels or decrease growth inhibitory effects
caused by stress agents (Glick 2012) (Fig. I7).
Direct
PGPB mechanisms
Resource uptakefacilitation
• Phosphate solubilization• Iron sequestration• Nitrogen fixation
Phytohormonemodulation
• Ethylene• Cytokinis• Gibberellins• Auxins
Biocontrol
• Competition for niches• Siderophore production• Production of antibiotics• Production of lytic enzymes• Reduction of Ethylene
response • Induced systemic resistance• Promotion of establishment
of beneficial plant-microbesymbiosis
Indirect
Figure I7. PGPB action mechanisms

60
Introduction
Direct action mechanisms
Direct stimulation of plant growth by PGPB includes
enhancement of plant nutrition as well as modulation of phytohormone
levels (Fig. I7). Thus different action mechanisms were classified as
follows.
Resource uptake facilitation
Bacterial stimulation of plant growth includes meeting plant
nutritional demands with low available resources in soils such as of
nitrogen, iron and phosphorous (López-Bucio et al. 2002; Colombo
et al. 2014; Kiba and Krapp 2016). The plant-bacterial interactions
and their environment are essentials for better uptake of water and
nutrients by plants (Ryan et al. 2009). Although nutrient availability
is limited in most soils, a constant level of essential mineral nutrients
needs to be maintained and microbial communities of the
rhizosphere are associated with nutrient biogeochemical cycles
(Barea et al. 2005). To cope with nutrient limitation, several
physiological and developmental responses can be triggered (López-
Bucio et al. 2002) and plant association with soil microorganisms
represent a suitable strategy in order to cope with low nutrient
availability.
Phosphate solubilization
Phosphorus is an essential element in plant growth and
development (Cheng et al. 2011). However, their bioavailability in
soils is very limited since phosphate is poorly soluble (López-
Bucio et al. 2002). In fact, low phosphorus availability was
reported in approximately half of the agricultural lands, limiting

61
Introduction
plant growth and resulting in crop yield losses (Lynch 2011). In
consequence, phosphorus solubilization produced by phosphate
solubilizing bacteria is an important feature in PGPB (Canbolat et
al. 2006; Lai et al. 2008). Solubilization of phosphate is generally
caused by low molecular weight acids produced by PGPB such as
gluconic and citric acids, while its mineralization occurs as
consequence of phosphatases excretion (Rodriguez et al. 1999).
Indeed, phosphate mineralization and solubilization processes can
be performed by the same bacterial strain (Tao et al. 2008).
Iron sequestration
Although iron is an abundant element on earth, it cannot be
assimilated by either plants or bacteria due to its oxidation state.
Ferric ion (Fe3+
) is poorly soluble causing a very low iron amount
available for organism assimilation (Ma 2005). Plants and bacteria
need a high level of iron even producing competition in the
rhizosphere for iron (Loper and Buyer 1991; Pii et al. 2015). To
cope with limited iron and facilitates its uptake, bacteria produce
siderophores, which show high affinity for Fe3+
and membrane
receptors able to bind complexes of Fe-siderophore for their
acquisition (Hider and Kong 2010). Bacterial siderophores directly
benefit plant growth since plants are also able to uptake Fe-
siderophore complexes improving their fitness (Siebner-Freibach
et al. 2003; Sharma et al. 2003; Jin et al. 2006; Vansuyt et al.
2007). In addition, iron nutrition enhancement by PGPB is
essential under stress conditions such as heavy metal pollution
(Burd et al. 2000; Belimov et al. 2005).

62
Introduction
Nitrogen fixation
Although atmosphere contains about 78% of nitrogen gas
(N2), plants are unable to use this form and its availability in soils
is very limited. Biological nitrogen fixation is performed by
bacteria. In order to fixate nitrogen, an enzyme complex called
nitrogenase is required as well as a large amount of energy in form
of ATP. Atmospheric nitrogen is reduced to ammonia, which is a
form of nitrogen that can be used by diazotrophic bacteria and
plants (de Bruijn 2015). Apart from Rhizobium spp., several free-
living bacteria such as Azospirilumm spp. can perform nitrogen
fixation which can be taken up by plants (Bashan and Levanony
1990; Pankievicz et al. 2015). Thus, the utilization of PGPB able to
fixate atmospheric nitrogen was proposed as a highest potential
biotechnological tool in order to improve crop yields (Souza et al.
2014).
Phytohormone modulation
As commented above, during plant growth and development
as well as in interaction and response with their environment,
phytohormones play essential functions (Davies 2010). In addition,
plants suffer several non-lethal stresses, which limit their growth
until stress disappear or plants are able to adapt their metabolism
overcoming stress effects. Under stress conditions, phytohormone
levels are finely adjusted in order to diminish the negative effects on
plant growth. PGPB are able to produce phytohormones or change
phytohormonal levels affecting the hormonal balance of plants and
thereby their stress response (De Garcia Salamone et al. 2006; Glick
et al. 2007a).

63
Introduction
Ethylene modulation
Ethylene production is typically induced in response to
environmental stresses (Wang et al. 2013). The enzyme 1-
aminocyclopropane-1-carboxylate deaminase (ACCd) was
discovered in soil bacteria (Honma and Shimomura 1978) and
reported its presence as a common trait in several PGPB (Blaha et
al. 2006; Glick et al. 2007b). ACC is the immediate precursor of
ethylene, and a portion is exuded by roots (Penrose and Glick
2001). PGPB are able to uptake that ACC and produce ammonia
and -ketobutyrate by ACCd activity for bacteria nutrition,
reducing as a consequence ethylene produced by plant and its
inhibitory growth effects (Glick et al. 1998). PGPB inoculation
containing the activity ACCd, results in root elongation at short-
term and shoot growth promotion at long-term (Dey et al. 2004;
Contesto et al. 2008; Onofre-Lemus et al. 2009; Glick 2014).
Cytokinis and gibberellins modulation
Cytokinin and/or gibberellin production by soil bacteria was
previously widely reported (Williams; and Sicardi De Mallorca
1982; Timmusk and Wagner 1999; García de Salamone et al.
2001). Additionally, plant growth stimulation by PGPB producing
cytokinins or gibberellins was also reported (Joo et al. 2005;
Arkhipova et al. 2007). Nevertheless, the role of microbially-
produced cytokinins and gibberellins in plant physiology was
proposed in function of studies with exogenous addition of
hormones in plants, but little is known about their action
mechanisms and regulation by plants (Glick 2012).

64
Introduction
Auxins modulation
As abovementioned, IAA affects several processes in plant
physiology such as plant cell division, extension and differentiation
and increase resistance to stress among other functions (Zhao
2010; Spaepen and Vanderleyden 2011). Additionally, different
IAA concentrations have differential effects regarding plant tissue
and developmental stage. In consequence, the endogenous IAA
concentration may be altered by soil bacteria, resulting in plant
growth promotion or inhibition (Spaepen and Vanderleyden 2011).
IAA production by PGPB was previously reported causing marked
effects on plant growth (Patten and Glick 2002; Mohite 2013).
Indirect action mechanisms
Indirect mechanisms are basically related to biocontrol of
pathogenic microorganisms (Fig. I7), but there are some differences in
the molecular mechanisms and thereby they were classified as follows.
Competition for niches
The non-pathogenic microorganisms of soil quickly colonize
plant surfaces in order to use available nutrients. In consequence,
competition for niches on plants and nutrients between pathogenic
microorganisms and PGPB has been reported limiting disease
incidence and severity in some cases (Kamilova et al. 2005;
Innerebner et al. 2011).
Siderophore production
In some cases, PGPB strains producing siderophores can act as
biocontrol agents directly preventing that phytopathogenic

65
Introduction
microorganisms can uptake enough iron to meet their metabolic
demands and thereby limiting their growth (Kloepper et al. 1980;
Dowling et al. 1996). This biocontrol mechanism is effective
because PGPB siderophores show a much greater affinity for iron
than pathogenic fungal ones (Miethke and Marahiel 2007). Thus,
this method is proper against fungal pathogens. In addition, plant
growth is generally not affected because plants are able to use the
PGPB Fe-siderophore complexes (Wang et al. 1993).
Production of antibiotics and lytic enzymes
Certain PGPB strains are able to synthetize different
antibiotics preventing the proliferation of plant pathogenic
microorganisms (Whipps 2001; Compant et al. 2005; Mazurier et al.
2009; Beneduzi et al. 2012). Additionally, some PGPB are also able
to produce lytic enzymes such as cellulases, chitinases, glucanases,
proteases and lipases, which can damage structural components of
pathogenic microorganisms. Generally, PGPB producing these
enzymes or antibiotics are efficient against pathogenic fungi such as
Phytophtora spp. or Fusarium spp. among others (Singh et al. 1999;
Kim et al. 2008b).
Ethylene response reduction
Plants usually respond to phytopathogens by synthesizing
ethylene which enhance stress effects on plants (van Loon et al.
2006). In consequence, reduction of ethylene levels can reduce the
damage to plants caused by phytopathogens (Glick and Bashan
1997). Thus, PGPB containing ACCd activity can be very useful in
biocontrol strategies (Glick 2014). For instance, inoculation with

66
Introduction
bacteria containing ACCd activity can reduce crown gall caused by
Agrobacterium tumefaciens infection in tomato (Toklikishvili et al.
2010).
Induced systemic resistance
Some PGPB are also able to trigger induced systemic
resistance (Verhagen et al. 2004; Bakker et al. 2007). ISR involves
plant ethylene and jasmonate signaling to stimulate defense response
against pathogenic microorganisms. ISR is activated when plants
interact with the PGPB strain, but it does not require direct
interaction between pathogenic microorganism and ISR-inducing
bacteria. ISR-positive plants react quicker and more strongly to
attack of pathogenic microorganisms by inducing mechanisms of
defense phenotypically similar to systemic acquired resistance
(Pieterse et al. 2014).
Promotion of establishment of beneficial plant-microbe
symbiosis
Establishment of beneficial plant-microbe symbiosis can be
also modulated by PGPB. Ethylene negatively affects nodulation, in
beneficial interaction between legumes and rhizobia (Guinel 2015),
and mycorrhization (Azcon-Aguilar et al. 1981; Geil et al. 2001). In
consequence, utilization of PGPB able to reduce ethylene levels in
plants can increase mycorrhizal colonization (Gamalero et al. 2008),
as well as rhizobial nodulation in several plants (Ma et al. 2004;
Nascimento et al. 2012).

67
Introduction
Ethylene and PGPB
Ethylene is involved in direct and indirect action mechanisms of
PGPB, but reported studies are mainly focused in PGPB strains
containing ACCd activity and thus they are able to decrease ethylene
levels directly stimulating plant growth and/or indirectly favoring
beneficial interactions or reducing pathogenic infections. In
consequence, these PGPB containing ACCd activity (Belimov et al.
2007; Glick 2014) were defined as stress controllers (Lugtenberg and
Kamilova 2009), since ethylene production is typically induced under
stress conditions (Wang et al. 2013a).
In addition, it was noticed that ethylene biosynthesis or action
inhibitors caused similar physiologic effects to inoculation with PGPB
containing ACCd activity, suggesting that growth enhancement is
consequence of ethylene level reduction (Belimov et al. 2007).
Inoculation with PGPB containing ACCd activity caused lower ACC
levels in seeds and roots (Mayak et al. 2004a). Moreover, effects of
bacteria containing ACCd activity are not restricted to root system.
Reduced ACC levels in root tissue diminishes the growth-inhibitory
effects of ethylene on aerial tissues (Klee et al. 1991; Glick et al. 1998),
and inoculation with PGPB containing ACCd activity caused lower
ACC levels in xylem sap (Belimov et al. 2009). Variovorax paradoxus
5C-2 with ACCd activity increased plant vegetative growth in pea
(Belimov et al. 2009) and arabidopsis (Chen et al. 2013). In addition,
recovery of plant from drought was improved modulating stress-
induced ethylene in tomato and pepper seedlings inoculated with PGPB
containing ACCd activity (Mayak et al. 2004b).

68
Introduction
The importance of bacterial ACCd activity for plant growth
promotion was also evidenced because its disruption resulted in
reduced or unnoticed plant growth stimulation (Li et al. 2000a;
Madhaiyan et al. 2006; Viterbo et al. 2010). For instance, tomato
inoculation with Pseudomonas brassicacearum Am3 deficient in ACCd
showed a dose-dependent negative impact in primary root growth
regarding to its wild type strain (Belimov et al. 2007).
Nevertheless, other reports suggest ethylene-independent
growth promotion or that ACCd exclusively affects local regulatory
mechanisms in plant roots. Inoculation of Bacillus megaterium in two
ethylene-insensitive mutants (ein2-1 and etr1-3) and wild type A.
thaliana produced similar promotion of shoot biomass and lateral root
number (López-Bucio et al. 2007). Arabidopsis thaliana wild type and
the ein2-1 mutant under inoculation with PGPB containing ACCd
activity and ACCd-deficient mutants of four different bacterial strains
showed similar effects on primary and total lateral root length, but the
promotion of root hair length was significantly reduced by ACCd
activity suggesting that ACCd affects local regulatory mechanisms in
plant roots, but lateral root development is regulated by systemic
mechanisms (Contesto et al. 2008).
Methodologies to widely study plant-PGPB interaction
Although there are plenty studies addressing interaction between
plant and bacteria, most approaches were only focused on a single
biochemical pathway and often miss lots of bacterial effects. The term
“-omics” represents completeness. There are several kinds of -omics

69
Introduction
technologies including genomics, transcriptomics, proteomics,
metabolomics, lipidomics, secretomics or signalomics among others.
All these techniques aim to depict precise pictures of the complete
cellular processes (Jha et al. 2015).
Furthermore, the increasing number of sequenced plant genomes
has permitted to study a wide range of biological processes regarding
plant growth and development as well as response to biotic and abiotic
stresses (Bolger et al. 2014; Jha et al. 2015). In consequence, various -
omics approaches have been performed in order to shed light on plant-
bacteria interaction (Cheng et al. 2010; Stearns et al. 2012; van de
Mortel et al. 2012; Couillerot et al. 2013; Su et al. 2016), but many
fundamental questions remain to be solved.
In addition, -omics studies regarding plant-bacteria interaction are
mainly focused in the nitrogen-fixing rhizobia symbiosis (Mathesius
2009; Lang and Long 2015; Lardi et al. 2016) and plant-pathogen
interaction (Ameline-Torregrosa et al. 2006; Mehta et al. 2008; Aliferis
and Jabaji 2012; Afroz et al. 2013). However, little is known about
PGPB effects on plant -omics profiles, despite of their environmental
and agricultural importance. Moreover, further research is needed since
PGPB action mechanisms are often strain-specific and dependent on
plant growth conditions (Ryu et al. 2005; Long et al. 2008), and they
are less well characterized (Pühler et al. 2004). Although PGPB
inoculation produces systemic effects on aerial plant tissues, the roots
are a significant bacterial niche for PGPB, where occur direct plant-
bacteria interaction (Benizri et al. 2001). In consequence, PGPB effects
on roots should be addressed using -omics approaches.

70
Introduction
Transcriptomics
Transcriptomics aims to evaluate the complete set of
differentially expressed genes (Jha et al. 2015). Currently, two
complementary techniques are commonly used in transcriptomic
studies: sequencing directly mRNA samples as RNA-seq or hybridizing
them with a great number of surface-immobilized probes as in case of
microarrays and BeadArrays. The two most commonly used
transcriptomic methods are microarray technology and next-generation
sequencing methodologies (Brady 2006).
The modern sequencing technologies such as RNA-seq allow the
generation of a huge quantity of data very useful for crop improvement
(Bolger et al. 2014). Both transcriptomic techniques allow the gene
expression analysis in parallel of several biological samples under the
same conditions (Stears et al. 2003). Sequencing methodologies require
a reference genome in order to determine identity of genes and low
expressed ones tend to be underrepresented. Meanwhile, microarray
technology is only able to detect those genes whose probes are
immobilized on the array, but low expressed genes can be easily
detected if probes corresponding to them are present (Brady 2006). In
addition, microarrays are commercially available for some plant species
such as GeneChip® Tomato Genome Array (Affymetrix) used in the
present thesis.
Several transcriptomic studies addressing plant bacteria
interaction were carried out to clarify bacterial effects on plant
physiology (Cartieaux et al. 2003; Verhagen et al. 2004; van de Mortel
et al. 2012). Arabidopsis inoculation with Pseudomonas thrivervalensis

71
Introduction
MLG45 compared to non-inoculated plants were evaluated by
microarray technology showing increased transcription of defense-
related genes. In fact, bacterial inoculation increased plant resistance to
subsequent infections by pathogenic bacteria. Thus, these results
evidenced that transcriptomic analysis could be very useful in order to
predict physiological changes (Cartieaux et al. 2003). Moreover, other
studies addressed the ISR by PGPB strains showing transcriptomic
changes in phytohormone-related genes which are crucial to orchestrate
plant responses (van de Mortel et al. 2012).
In Arabidopsis thaliana, root inoculation with the PGPB
Paenibacillus polymyxa significantly affected the expression of few
genes concluding that plants are responding to such PGPB presence as
a mild biotic stress agent (Timmusk and Wagner 1999). In other study,
the addition of an ACC deaminase-producing PGPB and its ACC
deaminase negative mutant was analyzed in order to identify genes in
canola roots whose expression was differentially affected. The bacteria
strain with ACCd activity increase the expression of genes involved in
plant growth and decrease the expression of genes involved in plant
stress responses induced by ethylene suggesting that when PGPB
express ACCd, they are no longer perceived as a mild biotic stress by
the plant (Hontzeas et al. 2004).
In consequence, transcriptomic analysis using microarray
technology is a valuable tool in order to understand plant-bacteria
interaction as well as predict physiological changes that could be
related with ethylene biosynthesis, signalling and/or response, but also
unrelated with ethylene since the most of the genome is represented in
the microarray allowing interrogate over 9200 tomato transcripts.

72
Introduction
Proteomics
Proteomics studies the analysis of whole protein population in a
subcellular compartment, cell or tissue (Jha et al. 2015). In addition,
proteomic information can be interpreted as a photo on plant
physiology since proteins are often final agents in plant physiology
(Feussner and Polle 2015). However, post-translational processes also
regulate protein activity and sub-cellular localization as well as protein
turnover (Guerra et al. 2015; Nelson and Harvey Millar 2015). Some
problems can be easily solved by direct analysis of certain tissues, cell
or organelles. Other limitations have been addressed developing
technical variations in order to analyze protein post-translational
modifications such as phosphorylation using phosphoproteomics
(Picotti 2015), and ubiquitination using an immunoprecipitation
approach to specifically enrich ubiquitinated portion of proteins (Xu
and Jaffrey 2013) among others.
Despite of limitations, proteomics can be very useful to
understand bacterial effects on plant physiology and some proteomic
analyses addressing plant interaction with PGPB strains have been
recently performed leading to valuable information in arabidopsis
(Kwon et al. 2016) and crop plants such as rice (Miché et al. 2006;
Alberton et al. 2013) and maize (Cangahuala-Inocente et al. 2013;
Faleiro et al. 2015).
Proteomic analysis of arabidopsis inoculation with Paenibacillus
polymyxa E681, which is able to produce ISR, showed differential
expression of proteins involved in redox and phytohormonal statuses,
metabolism of amino acids and carbohydrates and photosynthesis as
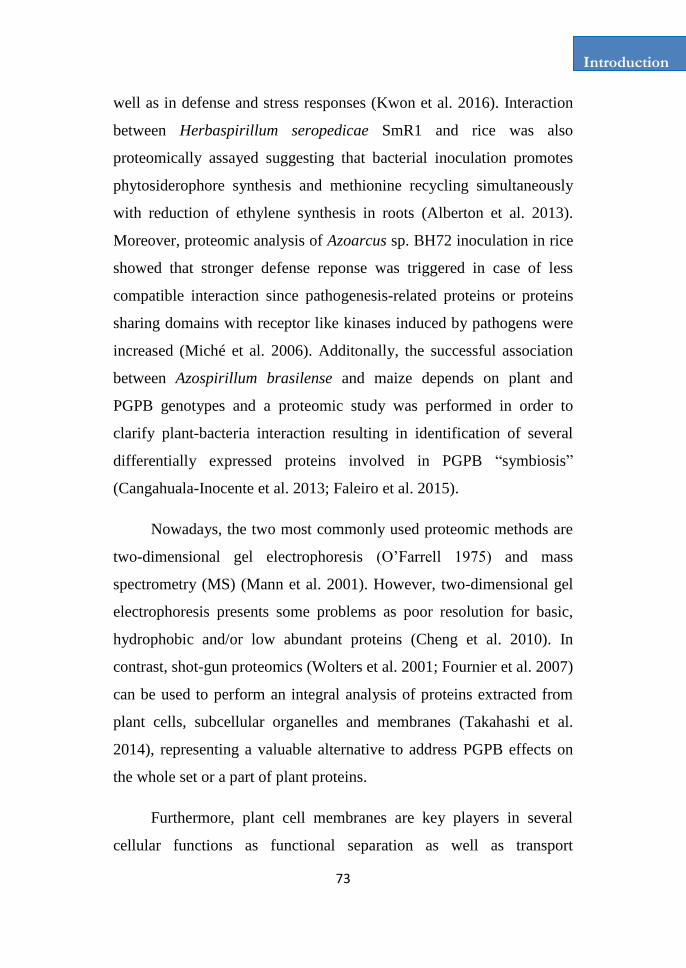
73
Introduction
well as in defense and stress responses (Kwon et al. 2016). Interaction
between Herbaspirillum seropedicae SmR1 and rice was also
proteomically assayed suggesting that bacterial inoculation promotes
phytosiderophore synthesis and methionine recycling simultaneously
with reduction of ethylene synthesis in roots (Alberton et al. 2013).
Moreover, proteomic analysis of Azoarcus sp. BH72 inoculation in rice
showed that stronger defense reponse was triggered in case of less
compatible interaction since pathogenesis-related proteins or proteins
sharing domains with receptor like kinases induced by pathogens were
increased (Miché et al. 2006). Additonally, the successful association
between Azospirillum brasilense and maize depends on plant and
PGPB genotypes and a proteomic study was performed in order to
clarify plant-bacteria interaction resulting in identification of several
differentially expressed proteins involved in PGPB “symbiosis”
(Cangahuala-Inocente et al. 2013; Faleiro et al. 2015).
Nowadays, the two most commonly used proteomic methods are
two-dimensional gel electrophoresis (O’Farrell 1975) and mass
spectrometry (MS) (Mann et al. 2001). However, two-dimensional gel
electrophoresis presents some problems as poor resolution for basic,
hydrophobic and/or low abundant proteins (Cheng et al. 2010). In
contrast, shot-gun proteomics (Wolters et al. 2001; Fournier et al. 2007)
can be used to perform an integral analysis of proteins extracted from
plant cells, subcellular organelles and membranes (Takahashi et al.
2014), representing a valuable alternative to address PGPB effects on
the whole set or a part of plant proteins.
Furthermore, plant cell membranes are key players in several
cellular functions as functional separation as well as transport

74
Introduction
(Chrispeels 1999), signalling platforms in response to abiotic (Osakabe
et al. 2013) and biotic (Inada and Ueda 2014) stimuli and molecular
trafficking mediated by vesicles (Chen et al. 2011; Murphy et al. 2011).
Additionally, membrane protein composition mainly define the
membrane functionality (Komatsu et al. 2007). The plasma membrane
(PM) acts as a selectively permeable barrier which ensures the
interchange of essential metabolites and ions to meet the cell
requirements since several nutrients are taken up by transporters
located in the plasma membrane (Chrispeels 1999). Moreover, the
plasma membrane and tonoplast (vacuolar membrane) maintain the
intracellular homeostasis in the cytoplasm (Sondergaard et al. 2004). In
addition, plants interact with a wide variety of microorganisms and
recognition and defence mechanisms have been developed to cope with
them (Dodds and Rathjen 2010). Receptors, which recognize elicitors
or microbe-associated molecular patterns (MAMPs), are located in
cellular membranes and are able to trigger responses (Boller and Felix
2009).
Furthermore, proteins are processed along the endomembrane
system. Firstly, proteins are synthesized in the endoplasmic reticulum
(ER) and then transported throughout the secretory pathway to be
located in the plasma membrane by exocytosis (Murphy et al. 2011).
Proteins remain in the plasma membrane or are taken up by
endocytosis, and stored in endocytic vesicles and recycled back to the
plasma membrane when needed or targeted for degradation in lytic
vacuoles (Chen et al. 2011). Plant cells can respond to microbe
interaction by adapting vesicle trafficking (Ivanov et al. 2010;
Dörmann et al. 2014; Inada and Ueda 2014). However, these processes
have been observed with intracellular microorganisms such as

75
Introduction
symbiotic bacteria and mycorrhizae (Nathalie Leborgne-Castel and
Bouhidel 2014) and little is known about PGPB effects on secretory
pathways. The microsomal fraction is enriched in membranes such as
ER, Golgi, PM, tonoplast and several endosomal vesicles and
compartments (Abas and Luschnig 2010). Thus, proteomic analysis of
microsomal fraction is very useful for looking into plant-bacteria
interaction regarding plant recognition and signalling as well as
transport processes.
Metabolomics
Metabolomics pursues to define the status of a subcellular
compartment, cell or tissue at a particular physiological status or
developmental stage analysing the whole set of metabolites (Jha et al.
2015). Metabolites play a key role in regulatory mechanisms because
they are in many cases the end-products, and thereby metabolic
information is very useful to understand the plant interaction with its
environment (Feussner and Polle 2015), and could be interpreted as a
snapshot of bacterial effects on plant physiology. Nowadays, the
metabolomics could be considered as an “emerging field” compared to
transcriptomics and proteomics. The complicated nature of small
molecules in combination with very little in common chemical
structure makes more difficult to establish a standard methodology for
metabolome analysis. Metabolomics requires methodologies for
metabolite separation and detection. Separation is usually performed by
chromatographic methods such as capillary chromatography (Soga et
al. 2003), high performance liquid chromatography (Gika et al. 2007),
or gas chromatography (Ogbaga et al. 2016). The most common used

76
Introduction
techniques for metabolomics detection are mass spectrometry (MS) and
nuclear magnetic resonance (NMR) spectroscopy (Barco 2013).
Furthermore, metabolomic assessment of samples rich in
metabolic diversity, such as plant-microbe interaction samples, can
produce a complex output in order to successfully identify all separated
metabolites. However, some metabolomic studies have been performed
(Weston et al. 2012; Kwon et al. 2016). In arabidopsis, metabolomic
analysis showed modified levels of several metabolites such as amino
acids, sugars and their derivatives as well as vitamins, phytohormones,
and organic acids such as tricarboxylic acid intermediates due to
bacterial inoculation that could explain the stress tolerance or
promotion of plant growth conferred by the PGPB presence (Su et al.
2016).
Although performed in shoots, other studies also showed sugar
modification caused by bacterial inoculation such as glucose and
fructose alteration in arabidopsis (Weston et al. 2012), as well as
modification of glucose, fructose, maltose, sucrose, raffinose and
mannose contents in grapevine (Fernandez et al. 2012). Additionally,
amino acid content modification by bacterial inoculation was also
reported in arabidopsis affecting levels of tryptophan and phenylalanine
(Weston et al. 2012), and proline in grapevine (Ait Barka et al. 2006).
Paenibacillus polymyxa E681 inoculation in arabidopsis also increased
levels of tryptophan, indole-3-acetic acid (IAA), and camalexin
increasing resistance to Botrytis cinerea infection (Kwon et al. 2016).
In consequence, analysis of metabolites such as phytohormones, amino
acids, sugars and organic acids could shed valuable information in
order to clarify interaction between plants and PGPB.

77
Introduction
Interest of study
The present thesis mainly pursued to shed light on the role of
ethylene sensitivity in interaction between plants and PGPB, focusing
specifically in bacterial action mechanisms. In consequence, two
tomato lines differing in ethylene sensitivity were selected in order to
be inoculated with two PGPB strains isolated from arid soils in
southern Spain. Indeed, non-inoculated plants were used as control
treatments along all performed experiments.
The ethylene-insensitive tomato mutant never ripe (nr) and its
isogenic wild-type (wt) parental Pearson cv. lines were selected
because previous studies showed that despite of residual responsiveness
(Lanahan et al. 1994), never ripe plants are largely unable to perceive
ethylene due to a mutation in the sensor domain of the ethylene
receptor SlETR3 (Wilkinson et al. 1995).
Two PGPB strains Bacillus megaterium (Bm) (Marulanda-
Aguirre et al. 2008) and Enterobacter sp. (hereinafter Enterobacter C7
(C7)) were selected. Bm has shown PGPB features in previous reports
(Marulanda et al. 2009, 2010; Porcel et al. 2014; Armada et al. 2014;
Ortiz et al. 2015). However, Enterobacter C7 was evaluated here for
the first time. Since most studies about the role of ethylene in the PGPB
activity have been focused on bacteria able to reduce ACC contents
(Glick et al. 2007; Glick 2014), we intended to use bacteria without
either ACCd activity or ethylene production capacity in order to avoid
any perturbation of plant ethylene metabolism caused by the bacteria.

78

79
Aims of the Study

80
Aims of the Study
Aims of the Study
The present study is focused in the interaction between two
plant growth-promoting bacteria and tomato plants regarding ethylene
sensitivity by using different approaches in order to clarify bacterial
action mechanisms and get valuable information, which could be
further implemented in crop systems.
The following specific aims were defined and addressed
throughout the chapters exposed in the present thesis in order to
achieve this overall objective.
Determine if ethylene sensitivity is critical for plant-
bacteria interaction and growth induction by both Bacillus
megaterium and Enterobacter C7 PGPB strains in juvenile
and mature tomato plants.
Evaluate Bacillus megaterium and Enterobacter C7
inoculation effects in expression of ethylene-related genes
from biosynthesis to response, under both well watered and
drought conditions.
Transcriptomically assess plant interaction with Bacillus
megaterium and Enterobacter C7 and PGPB mechanisms
regarding to ethylene perception.
Proteomically assess plant interaction with Bacillus
megaterium and Enterobacter C7 and PGPB mechanisms
regarding to ethylene perception.

81
Aims of the Study
Evaluate the effects of Bacillus megaterium and
Enterobacter C7 inoculation on plant nutritional and
phytohormonal statuses at juvenile and mature stages.
Determine Bacillus megaterium and Enterobacter C7
inoculation effects in root metabolite content at juvenile
and mature stages.

82

83
Materials and Methods

84
Materials and Methods
Materials and Methods
Biological material
Seeds of never ripe tomato (Solanum lycopersicum) (LA0162)
(Wilkinson et al. 1995) and its isogenic parental cv. Pearson (LA0012)
were obtained from the Tomato Genetics Resource Center at the
University of California, Davis, CA, USA. PGPB strains were isolated
from soils in southern Spain. Bacillus megaterium (Bm) was identified
and partially characterized in a previous study (Marulanda-Aguirre et
al., 2008). Enterobacter C7 (C7) was isolated and identified as
described in Armada et al. (2014b).
Seed sterilization and germination
Seeds were sterilized performing the following washing steps:
70% ethanol for 5 min; 5% sodium hypochlorite for 10 min; 3 washing
steps with sterile water to remove any trace of chemicals. Sterilized
seeds were kept in water at 4ºC overnight and placed on sterile
vermiculite at 25ºC until germination. Finally seedlings were grown in
a greenhouse under controlled conditions (18-24°C, 50-60% relative
humidity, 16 h:8 h light (600 μmol m-2
s-1
):dark) until inoculation
treatment.
Seedling inoculation with PGPB strains
Ten-days-old seedlings were inoculated during transplantation to
the final substrate. Bacteria were grown in Luria broth (LB) medium
with shaking (200 rpm) at 28ºC overnight. Culture optical density at
600 nm (OD600) was measured, bacterial cultures were centrifuged

85
Materials and Methods
(2655 g, 10 min), and the pellet was resuspended with sterile distilled
water until OD600 = 1.5, which corresponds to cell density over 107
colony-forming unities per milliliter (CFU ml-1
). One milliliter of
distilled water (control plants), or a bacterial suspension: either Bm or
C7 (inoculated plants) was sprinkled onto each root seedling at
transplantation.
Colonization of tomato root system
Seeds were sterilized as abovementioned and germinated on filter
paper soaked with sterile distilled water on Petri plates in darkness for
3 days. 10-day-old seedlings were transferred to sterilized glass bottles
containing sterile peat moss:perlite (1:1, v:v, autoclaved twice at 120°C
for 20 min). Seedlings were inoculated as mentioned above at
transplantation. The glass bottles were closed and kept for one week in
a climate-controlled growth chamber (18-24°C, 50-60% relative
humidity, 16 h daylight). A one centimeter-long intermediate root
segment was carefully cut and suspended in 1 ml of sterile water. Tubes
were incubated for 1 hour on an orbital shaker (35 rpm) with vibration.
Suspensions were serially diluted (10-2
-10-9
). Dilutions were plated on
LB agar medium and cultivated overnight at 28ºC. Finally, colonies
were counted and CFU
cm-1
root values were calculated. Eight
replicates of each treatment were performed (n=8). All procedures were
performed under sterile conditions in a laminar flow cabinet.
Plant growth conditions
Plants were generally grown in pots of 1 l containing sterile peat
moss:perlite (1:1, v:v, autoclaved twice at 120°C for 20 min) within a
greenhouse under controlled climatic conditions (18-24°C, 50-60%

86
Materials and Methods
relative humidity, 16 h:8 h light (600 μmol m-2
s-1
):dark). In order to
maintain constant soil water content close to water-holding capacity
during the whole experiment, water was supplied every two days.
Watering for well watered and drought treatments (Chapter 1)
Field capacity estimation: Eight pots of 1 l containing sterile peat
moss:perlite were watered until saturation and let them drain for 24
hours. Pot weights assuming to correspond to water-holding capacity of
100 % were measured resulting in weight mean of 640.10 g. These pots
were dried in a forced draught oven (70ºC, 7 days) and pot dry weights
corresponding to water-holding capacity of 0 % were determined again
resulting in weight mean of 163.91 g. Thus, watering regime treatments
were performed estimating the grams of water that one gram of
substrate is able to contain by extrapolating water-holding capacity
(WHC) to substrate weight (SW) in our experimental system and
following the equation:
SW = 4.7568*WHC + 163.91
All plants were grown for four weeks under well watered
conditions supplying water every two days in order to maintain
constant soil water content close to 100 % water-holding capacity.
Watering regime treatments was applied from then on watering plants
up to WHC of 100 % (640.10 g) and 60 % (448.10 g) for well watered
and drought conditions, respectively.
Differential phosphorus conditions bioassay (chapter 3)
Ten-day-old seedlings were transferred to 1 l plastic pots
containing sterile sand:perlite (1:3, v:v, autoclaved twice at 120°C for

87
Materials and Methods
20 min). This inert substratum was chosen in order to control plant
nutrition by using Hewitt’s nutrient solution (Hewitt 1966) every two
days, maintaining constant soil water content close to water-holding
capacity of 100% during the whole experiment. The experiment was
carried out with two phosphorus treatments: control conditions (Control
P; NaH2PO4 1 mM) and low phosphorus conditions (Low P: NaH2PO4
0.2 mM).
Biomass production determination
Plant growth was determined in order to evaluate PGPB activity.
Shoots were separated from root systems and their fresh weights (FW)
were measured. Samples were dried in a forced draught oven (70ºC, 3
days), and their dry weights (DW) were determined.
Relative growth rate (Chapter 2)
Relative growth rate (RGR) was determined in order to know
how bacterial inoculation affects plant growth between juvenile and
mature stage. RGR was calculated using the classical approach (Hunt
1982) following the equation where W1 and W2 are dry weights at
times t1 an t2, respectively:
RGR = (ln W2 – ln W1)/(t2-t1)
Bacterial ACC deaminase activity bioassay
PGPB strains were tested for the ability to use ACC as a sole
nitrogen source in comparison with a positive control in order to
evaluate their possible effect on plant ACC levels. ACC deaminase
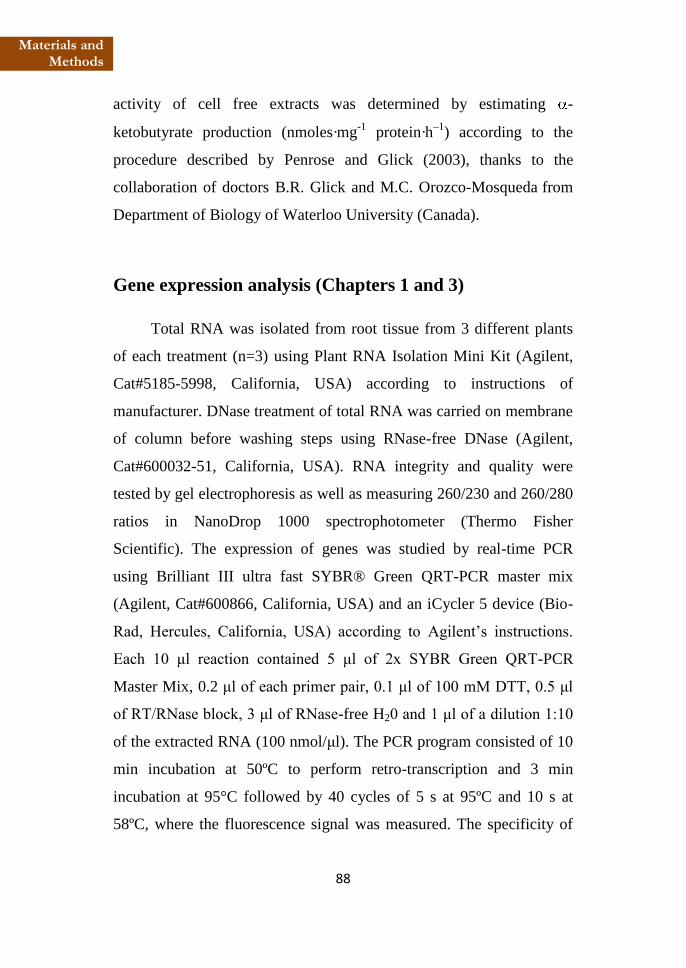
88
Materials and Methods
activity of cell free extracts was determined by estimating -
ketobutyrate production (nmoles·mg-1
protein·h–1
) according to the
procedure described by Penrose and Glick (2003), thanks to the
collaboration of doctors B.R. Glick and M.C. Orozco-Mosqueda from
Department of Biology of Waterloo University (Canada).
Gene expression analysis (Chapters 1 and 3)
Total RNA was isolated from root tissue from 3 different plants
of each treatment (n=3) using Plant RNA Isolation Mini Kit (Agilent,
Cat#5185-5998, California, USA) according to instructions of
manufacturer. DNase treatment of total RNA was carried on membrane
of column before washing steps using RNase-free DNase (Agilent,
Cat#600032-51, California, USA). RNA integrity and quality were
tested by gel electrophoresis as well as measuring 260/230 and 260/280
ratios in NanoDrop 1000 spectrophotometer (Thermo Fisher
Scientific). The expression of genes was studied by real-time PCR
using Brilliant III ultra fast SYBR® Green QRT-PCR master mix
(Agilent, Cat#600866, California, USA) and an iCycler 5 device (Bio-
Rad, Hercules, California, USA) according to Agilent’s instructions.
Each 10 μl reaction contained 5 μl of 2x SYBR Green QRT-PCR
Master Mix, 0.2 μl of each primer pair, 0.1 μl of 100 mM DTT, 0.5 μl
of RT/RNase block, 3 μl of RNase-free H20 and 1 μl of a dilution 1:10
of the extracted RNA (100 nmol/μl). The PCR program consisted of 10
min incubation at 50ºC to perform retro-transcription and 3 min
incubation at 95°C followed by 40 cycles of 5 s at 95ºC and 10 s at
58ºC, where the fluorescence signal was measured. The specificity of

89
Materials and Methods
PCR amplification procedure was checked using a heat dissociation
protocol ranging 60-100ºC after the last PCR cycle.
Each QRT-PCR was carried out in duplicate with three
independent biological replicates (n=3). The obtained values were
normalized using the threshold cycle (Ct) value for the tomato
constitutive elongation factor (EF) gene. Different putative constitutive
genes (actin, tubulin, ubiquitin and elongation factor) were tested. The
elongation factor was selected as constitutive using the “Normfinder”
algorithm (Andersen et al. 2004) because it was the most stable gene
between all considered treatments. The relative abundance of
transcription were calculated by using the 2-∆∆Ct
method (Livak and
Schmittgen 2001). Negative controls without RNA were used in all
PCR reactions. The primers used to amplify each analyzed gene are
shown in the following tables:
Table M1 Primers of analyzed genes by QRT-PCR to validate microarray data
(Chapter 1).
Gen ID Forward Reverse
Les.1334.1.A1_at 5’-GACTTTGGGCTTGCGAAAC-3’ 5’-GTCCAACATTCCCATTAGCAG-3’
Les.1842.1.S1_at 5’-ACCCATAGGCTTGAAGAGCA-3’ 5’-AGCTCCTCTGTCTCCCTTTGA-3’
Les.2063.1.A1_at 5’-GGCGTTATAAGGAACCACCA-3’ 5’-GTAGGCTTGTTGAAAAGGAAAAG-3’
Les.5253.1.S1_at 5’-TACTTGAAAGGACCCGCAAC-3’ 5’-CCGACATCACTGGTTGACAC-3’
Les.5416.1.S1_at 5’-GGTGGAGCCGTATACTTGGA-3’ 5’-CATTACACGCACCACCTCAC-3’
LesAffx.21605.1.S1_at 5’-GGCTTATTCACCAACCCAGA-3’ 5’-TTCCACGTCTCGAAACCTCT-3’
LesAffx.57363.1.S1_at 5’-AGCACAAGGGATATGGTTGC-3’ 5’-ATCGATGTCTGTTCCATTGCT-3’
LesAffx.65198.1.S1_at 5’-TGTTGGAGATTCAGCTGTGG-3’ 5’-TTGTCCAGCAGTGTCCCATA-3’

90
Materials and Methods
Table M2 Primers of ethylene-related genes analyzed by QRT-PCR (Chapter 1).
Gen ID Forward Reverse
Sl EF 5’-GATTGGTGGTATTGGAACTGCT-3’ 5’-AGCTTCGTGGTGCATCTC-3’
Sl ACS 1 5’-CGGGCTAGTTTCAACTCAGA-3’ 5’-CAACAACAACAAATCTAAGCCA-3’
Sl ACS 2 5’-GAGGTTAGGTAAAAGGCACA-3’ 5’-CATACGCTAACAACTATTTCT-3’
Sl ACS 3 5’-CGGTCTCCCCGGTTTTCGCA-3’ 5’-GTGGCCGCGGACACAACCAT-3’
Sl ACS 4 5’-GCTAGCTTTCATGTTGTCTGA-3’ 5’-GCACGAGCCTGGGCGAATCTA-3’
Sl ACS 5 5’-CACAGTATTCGATTGGCCAAAAT-3’ 5’-AAATCATGCCAACTCTGAAACCTG-3’
Sl ACS 6 5’-GGGTTTCCTGGATTTAGGGT-3’ 5’-GGTACTCAGTGAAATAGTCGA-3’
Sl ACS 7 5’-TGCCTTGAGAGCAATGCTGGGT-3’ 5’-ACATGCACGAAACCAACCCGGT-3’
Sl ACS 8 5’-AGAGAACGATAGTCTGTGTGAACAA-3’ 5’-GGACCGAGTGCATTCTCTACA-3’
Sl ACO 1 5’-TCCGCGCTCATACAGACGCA-3’ 5’--AGTGGCGCATGGGAGGAACA3’
Sl ACO 2 5’-GCATCCTTCTACAATCCAGGA-3’ 5’-CATGTAGTAGGGACGCACA-3’
Sl ACO 3 5’-GAGCGTGATGCACAGAGTGA-3’ 5’-CAATCACACACACATACACCA-3’
Sl ACO 4 5’-TTCGCGCTCACACGGATGCT-3’ 5’-CACCTCTAGCTGATCGCCGAGG-3’
Sl ACO 5 5’-GGCCCTAGATTTGAGTCTGCC-3’ 5’-ATCCTTCTTCCTCAATGCCCA-3’
Sl ACO 6 5’-GGGAATGGGAAGAAAAGATTGTT-3’ 5’-CCTCTTAACATATCACACTACCAGA-3’
Sl ETR 3 5’-GATCAGGTTGCTGTCGCTCT-3’ 5’-TCATCACAGCAAGGAAGTCG-3’
Sl ETR 6 5’-TACGTGGTGTGGAGGTTCTG-3’ 5’-TGTAACGAGGACACAACGGG-3’
Sl TCTR 1 5’-TGAAGCTTGCTGGGCTAATG-3’ 5’-TGTGTGACCTGGTGGAGGTA-3’
Sl ERF1 5’-ATTGGGGTTCTTGGGTCTCC-3’ 5’-GGACCACACATTAGCCTTGC-3’
Sl ER 5 5’-TGCCAGTGAAGGTACCTCAC-3’ 5’-ATGGAAGCTTGATCTCGCCG-3’
Sl ER 21 5’-TGGTGCAGGCCCTAAGATTG-3’ 5’-TAGACTGGGTGAAATATCGAAGG-3’
Sl ER 24 5’-TGAAGGCCCAAGACCTGAAG-3’ 5’-CGCCGCCTCATCTAGCTTTC-3’
Table M3 Phosphate transporter genes primers analyzed by QRT-PCR (Chapter 3).
Gen ID Forward Reverse
Sl PT1 5’-GGGAAGAGGAAACTGTAGCTG-3’ 5’-TTCTAATCCCAAATACCACAA-3’
Sl PT2 5’-AGTGGGAGCGTATGGGTTCTTA-3’ 5’-TTCCAAGTGCATTGATACAGCC-3’

91
Materials and Methods
Transcriptomic analysis (Chapter 1)
Sample preparation for microarray
Total RNA was isolated from root tissue from 3 different plants
of each treatment (n=3) using RNeasy Plant Mini Kit (Qiagen,
Cat#74904, California, USA). RNA quality was assessed by gel
electrophoresis as well as measuring 260/230 and 260/280 ratios in
NanoDrop 1000 spectrophotometer (Thermo Fisher Scientific) and
Bioanalyzer RNA kit (Bionalyzer® 2100 Agilent Technologies).
Total RNA was processed to use on GeneChip® Tomato Genome
Array (Affymetrix) according to the manufacturer’s protocol by
Genomic Analytical service of Cabimer (CSIC), Seville, Spain. Total
RNA (10 g) was used in a reverse transcription reaction to generate
first-strand cDNA, using the SuperScript choice system (Invitrogen)
with oligo(dT) 24 fused to T7 RNA polymerase promoter. After
second-strand synthesis, target complementary RNA (cRNA) labelled
with biotin was prepared using the BioArray high-yield RNA transcript
labeling kit (Enzo Biochem, New York) in the presence of biotinylated
UTP, and CTP. After purification and fragmentation, cRNA (15 μg)
was used in a hybridization mixture where hybridization controls were
added. Hybridization mixture (200 µl) was hybridized on arrays for 16
h at 45°C. Standard post-hybridization wash and double-stain protocols
were used on an Affymetrix GeneChip fluidics station 450. Finally,
arrays were scanned on an Affymetrix GeneChip scanner 3000 7G.

92
Materials and Methods
Microarray validation
Microarray data were validated using QRT-PCR according to
Morey et al. (2006). A set of genes was selected for validation based on
their p-value (P < 0.05) and assayed by QRT-PCR as before described
in gene expression analysis section using the primers showed in Table
M1. Relationships between microarrays and QRT-PCR date were
examined by Pearson’s correlation. The data input into the correlation
analysis was the Log2 value of the weighted average for each gene
from all replicate plants. Correlations above 0.8 between microarray
and QRT-PCR results are indicative of strong agreement and consider
the study validated (Morey et al. 2006). Correlations for selected
differentially expressed genes (DEG) are showed in the following table:
Table M4 Correlation values between microarray and QRT-PCR data for microarray
validation.
Gen ID ANOVA p-value Correlation
Les.1334.1.A1_at 5.84E-06 0.869
Les.1842.1.S1_at 8.89E-11 0.985
Les.2063.1.A1_at 4.10E-06 0.915
Les.5253.1.S1_at 3.30E-08 0.957
Les.5416.1.S1_at 2.35E-07 0.943
LesAffx.21605.1.S1_at 2.49E-08 0.952
LesAffx.57363.1.S1_at 0.00089252 0.961
LesAffx.65198.1.S1_at 2.89E-09 0.974
93
Materials and Methods
Microarray data analysis
In order to evaluate bacterial inoculation effects on wt and nr
plants, the transcriptomic profiles of Bm-inoculated and C7-inoculated
plants were compared with those of non-inoculated ones as well as with
each others. The Plant MetGenMap Software (Joung et al. 2009) was
used to identify changed pathways from genomic profile data and to
visualize the profile data in a biochemical pathway context using a
threshold of fold change over 2. The Venn diagram webtool software
(Open Source; http://bioinformatics.psb.ugent.be/webtools/Venn/)
developed by Ghent University was used to quantitatively compare
transcriptomic profiles with those obtained under different
experimental conditions.
Physiological Parameters (Chapter 2)
Samples were taken from the last expanded leaf for stomatal
conductance, photosynthetic efficiency and chlorophyll content (n=9).
Stomatal conductance
Stomatal conductance was measured three hours after sunrise
with a porometer system (Porometer AP4, Delta-T Devices Ltd.,
Cambridge, UK).
Photosynthetic efficiency
A FluorPen FP100 (Photon Systems Instruments, Brno, Czech
Republic) was used to measure Photosystem II efficiency according to
Oxborough & Baker (1997).

94
Materials and Methods
Leaf chlorophyll concentration
Photosynthetic pigments were extracted from leaf samples (0.5
cm2) in 100% methanol at 4ºC for 24 h. Pigment concentration was
spectrophotometrically determined according to Lichtenthaler (1987).
Nutrient measurement (Chapters 2 and 3)
Mineral analysis was determined in shoots and roots (n=4).
Carbon and nitrogen concentration (% DW) were determined by mass
spectrometry (Elemental Leco TruSpec CN) and were performed by the
Analytical Service of the Instituto de Nutrición Animal (CSIC),
Granada, Spain. Calcium, potassium, magnesium, sodium, phosphorus,
sulfur, and silicon concentration (% DW) as well as copper, iron,
manganese, and zinc concentration (ppm) analyses were determined by
inductively coupled plasma-optical emission spectrometry (ICP-OES
Varina ICP 720-ES) and were performed by Instrumentation Service of
the Estación Experimental del Zaidín (CSIC), Granada, Spain.
Phytohormone analysis
Ethylene determination
Ethylene production was analyzed using gas chromatography
(GC). Samples were introduced in 20 ml vials (Supelco Analytical,
Pennsylvania, USA). Vials were closed and incubated at room
temperature. Samples of 1 ml were withdrawn from each vial with a
syringe and ethylene was quantified using a Hewlett Packard model

95
Materials and Methods
5890 gas chromatograph equipped with a Poropak-R column and a
hydrogen flame ionization detector.
Ethylene production by tomato tissues (Chapter 1 and 2)
Completely expanded leaflets from the last developed leaf, and
entire roots were chosen for shoot and root ethylene determination,
respectively. Samples were introduced in vials with 200 μl of miliQ
water to avoid tissue drying. After 15 min to let the ethylene produced
from injury escape, vials were closed and incubated for 1 h (leaflets)
and 4 h (roots). Ethylene production rate (nmol ethylene h–1
DW g–1
)
was evaluated using six replicates per treatment in chapter 1, while six
and four replicates per treatment were used in 4 and 8 wpi harvests,
respectively, in chapter 2.
Ethylene production by bacterial strains (Chapter 1)
Bacterial ethylene production was measured in order to determine
possible effects of microbially-derived ethylene in plant-bacteria
interaction and/or growth promotion. Bacteria were grown in Luria
broth (LB) medium with shaking (200 rpm) at 28ºC overnight. Culture
OD600 was measured and new subcultures (LB, 6 ml, OD600 = 0.01)
were started in sterile 20 ml vials (Supelco Analytical, Pennsylvania,
USA). Vials were closed and incubated at 28ºC with shaking (200
rpm). Samples of 1 ml were withdrawn from each vial and ethylene
production was quantified as abovementioned at 3, 6, 9 and 24 hours
after starting the culture. Six replicates per bacteria and LB without
inoculum were analyzed (n=6).

96
Materials and Methods
Ethylene production by bacterial-inoculated seedlings
(Chapter 1)
Ethylene production by tomato wt and nr plantlets induced by
inoculation of bacterial strains was also analyzed. Seeds were sterilized
as described above and directly planted within 20 ml vials (Supelco
Analytical, Pennsylvania, USA) containing sterile peat moss:perlite
(1:1, v:v, autoclaved twice at 120°C for 20 min). Plantlets were grown
for ten days without vial lid under well watered conditions in growth
chamber under controlled conditions (18-24°C, 50-60% relative
humidity, 16 h:8 h light (600 μmol m-2
s-1
):dark). Bacterial strains were
cultured and ten-days-old seedlings were inoculated as before
mentioned. Vials were immediately closed and incubated inside the
growth chamber. Moreover, vials without seedlings but containing
substrate were also inoculated in order to assay ethylene production by
PGPB strains and/or substrate. Ethylene production rate was evaluated
on inoculation day (7 hours post-inoculation) and the day after
inoculation (26 hours post-inoculation). Ethylene was determined as
above mentioned using four replicates per treatment.
Other phytohormones determination
Indole-acetic acid (IAA), abscisic acid (ABA), salicylic acid
(SA), jasmonic acid (JA) and jasmonoyl isoleucine (JA-Ile) were
analyzed using high performance liquid chromatography-electrospray
ionization-high-resolution accurate mass spectrometry (HPLC-ESI-
HRMS) thanks to collaboration of doctors José María García-Mina and
Ángel María Zamarreño from Department of Environmental Biology of
Navarra University (Pamplona, Spain).

97
Materials and Methods
The extraction and purification were performed using the
following method: 250 mg of frozen tissue (previously ground to a
powder in a mortar with liquid N2) was homogenized with 2.5 ml of
precooled methanol:water:HCOOH (90:9:1, v/v/v with 2.5 mM Na-
diethyldithiocarbamate) and 25 µl of a stock solution of 1000 ng ml-1
of deuterium-labelled internal standards D-IAA, D-ABA, D-SA and D-
JA, and 200 ng ml-1
of D-JA-Ile in methanol. The mixture was shaken
for 60 min at room temperature before being centrifuged (20000 g, 10
min), shaken again for 20 min and centrifuged. 2 ml of pooled
supernatants were taken and dried at 40ºC. The residue was dissolved
in 500 µl of methanol:0.133% acetic acid (40:60, v/v) and centrifuged
(20000 g, 10 min) before being injected in an HPLC-ESI-HRMS
system. Reagents and internal standards are shown in the following
table:
Table M5: Reagents and Standards used for phytohormone analysis by HPLC-ESI-
HRMS.
Compound Source
Rea
gen
ts
Indole-3-Acetic acid (IAA)
OlChemin Ltd
(Olomouc, Czech Republic)
Cis,trans-Abscisic acid (ABA
(-)-Jasmonic acid (JA)
N-(-)-Jasmonoyl Isoleucine (JA-Ile)
Salicylic acid (SA) Sigma-Aldrich (St Louis USA)
Inte
rnal
Stan
dar
s
2H5-Indole-3-Acetic acid (D-IAA)
OlChemin Ltd
(Olomouc, Czech Republic)
2H6-(+)-cis,trans-Abscisic acid (D-ABA)
2H2-N-(-)-Jasmonoyl Isoleucine (D-JA-Ile)
2H4-Salicylic acid (D-SA)
2H5-Jasmonic acid (D-JA) CDN Isotopes
(Pointe-Claire, Quebec, Canada)

98
Materials and Methods
Hormones were quantified using a Dionex Ultimate 3000
UHPLC device coupled to a Q Exactive Focus Mass Spectrometer
(Thermo Fisher Scientific, Waltham, Massachusetts, USA), equipped
with an HESI(II) source, a quadrupole mass filter, a C-Trap, a HCD
collision cell and an Orbitrap mass analyzer (Orbitrap-Focus, Thermo
Sci). A reverse-phase column (Synergi 4 mm Hydro-RP 80A, 150 x 2
mm; Phenomenex, Torrance, CA) was used. A linear gradient of
methanol (A), water (B) and 2% acetic acid in water (C) was used: 38%
A for 3 min, 38% to 96% A in 12 min, 96% A for 2 min and 96% to
38% A in 1 min and kept 4 min. C remains constant at 4%. The flow
rate was 0.30 ml min-1
, the injection volume was 40 µl and column and
sample temperatures were 35 and 15ºC, respectively. The detection and
quantification were performed using a Full MS experiment with
MS/MS Confirmation in the negative-ion mode. Instrument control and
data processing were performed by TraceFinder 3.3 EFS software.
Instrumental parameters and compound accurate masses are reported in
the following tables:
Table M6 Instrumental parameters used for HESI (II) ionization.
Instrumental parameters Value
Sheath gas flow rate 44 au
Auxiliary gas flow rate 11 au
Sweep gas flow rate 1 au
Spray voltage 3.5 kV
Capillary temperature 340 ºC
S-lens RF level 50
Auxiliary gas heater temperature 300 ºC

99
Materials and Methods
Table M7 Accurate masses of the phytohormones and internal standards, and its
principal fragments
Analyte[M-H]
Phytohormone[M-H] Fragment
IAA 174.05605 130.06615
ABA 263.12888 219.13900
SA 137.02442 93.03401
JA 209.11832 59.01297
Ja-Ile 322.20238 130.08735
D-IAA 179.08744 135.09760
D-ABA 269.16654 225.17668
D-SA 141.04952 97.05915
D-JA 214.14970 61.02555
D-JA-Ile 324.21494 131.09370
Metabolite analysis (Chapter 2)
Metabolite analysis was performed by gas chromatography-mass
spectrometry (GC-MS) according to Roessner et al. (2000). Samples
were assayed by Scientific Instrumentation Service of the Estación
Experimental del Zaidín (CSIC), Granada, Spain. 100 mg of frozen
tissue (previously ground to a powder in a mortar with liquid N2) was
extracted with 1 ml of methanol containing internal standard (ribitol 9
µg ml-1
in methanol). The mixture was extracted 20 min at 4°C and 400
µl of water were added and mixed before centrifugation (18626 g, 5
min). Two aliquots of supernatant were taken for analysis of major
components (10 µl) and minor components (200 µl) after dried
overnight under vacuum. The residue was derivatized in two steps,
metoxymation and silylation (60 µl of methoxyamine hydrochloride in
pyridine, 37°C 90 min and BSTFA+TMCS, 37ºC 30 min.)
A Varian (now Bruker) 450GC 240MS system was used for
GC-MS analysis. All samples were analyzed twice. 1 µl was injected at

100
Materials and Methods
230°C in split 1/50 mode with Pressure Pulse (30psi 0.2min). He flux at
1 ml min-1
and temperature ramp started at 70°C 5 min, increased at
5°C until 245°C, increased at 20°C until 310°C and kept for 1 min.
Column DB-5ms (30 m x 0.25 mm, 0.25 µm). Ionization by electronic
impact and mass analysis in TIC Full Scan mode acquiring masses in
the range 50-600 m/z. Identification by comparison with NIST08
spectra library and retention time of pure compounds. For comparative
purposes, within each chromatogram the compound peak areas were
normalized by the sample fresh weight and by the internal standard
peak area, resulting in relative response ratios. Six and four replicates
per treatment were used for 4 and 8 wpi harvests, respectively.
Proteomic analysis (Chapter 3)
Proteomic analyses were performed during the short-stay in
Department of Plant Physiology of Faculty of Agriculture of Iwate
University (Japan) under supervision of Dr. Matsuo Uemura.
Microsomal fraction preparation
Microsomes were isolated as described in Hachez et al. (2006)
with some modifications. Frozen root tissue (500 mg) was
homogenized with 5 ml of grinding buffer (sorbitol 250 mM, Tris-HCl
50 mM (pH 8), EDTA 2 mM; and proteinase inhibitor cocktail mix:
phenylmethylsulfonyl fluoride 1 mM, leupeptin 1 g l–1
, aprotinin 1 g l–
1, antipain 1 g l
–1, chymostatin 1 g l
–1 and pepstatin 1 g l
–1. The mixture
was filtered by a nylon mesh and then centrifuged (4400 g, 10 min).
The supernatant was collected carefully and centrifuged (100000 g, 2
h). Finally, the supernatant was removed and the resulting pellet was

101
Materials and Methods
resuspended in 30 l of suspension buffer (KH2PO4 5 mM, sucrose 330
mM and KCl 3 mM with a final pH of 7.8). An aliquot of the samples
was used for protein quantification by Bradford assay (Bradford 1976)
and the remainder was kept at -20ºC.
Sample preparation for nano-LC-MS/MS analysis
Microsomal protein samples (equivalent to 5 g protein) were
subjected to in-gel tryptic digestion for peptide analysis according to
Takahashi et al. (2011).
Nano-LC−MS/MS analysis and data acquisition
The peptide solutions were subjected to nano-LC-MS/MS
analysis. The peptide solutions were concentrated with a trap column
(L-column Micro 0.3 × 5 mm; CERI, Japan) on an ADVANCE
UHPLC system (MICHROM Bioresources, Auburn, CA), and eluted
with formic acid 0.1 % in acetonitrile (v/v). Eluted peptides were
separated by a Magic C18 AQ nano column (0.1 × 150 mm;
MICHROM Bioresources) using a linear gradient of acetonitrile (from
5 to 45 % (v/v)) at a flow rate of 500 nl min-1
.
Then, peptides were ionized by an ADVANCE spray source
(MICHROM Bioresources) with spray voltage of 1.8 kV. Mass analysis
was carried out by using an LTQ Orbitrap XL mass spectrometer
(Thermo Fisher Scientific, Waltham, MA) equipped with Xcalibur
software (version 2.0.7, Thermo Fisher Scientific). Full-scan mass
spectra were obtained in the range of 400 to 1800 m/z with a resolution
of 30000. Collision-induced fragmentation was applied to the five most
intense ions at a threshold above 500. These experiments were

102
Materials and Methods
performed with three three-plant pool-samples per treatment collected
from 9 biologically independent plants (n=3).
Peak detection and data processing were carried out with
Progenesis Ql for proteomics Software (Nonlinear Dynamics).
Parameters used for file conversion were: precursor mass range (m/z
350-5000), highest and lowest charge state (0), the minimum total
intensity of a spectrum (0), and the minimum number of peaks in a
spectrum (1). Progenesis Ql software automatically selects a reference
file (control “gel”) in order to align the rest of files. A manual review
process was carried out in order to get an overlapping above the
threshold (70 %). Finally, Progenesis Ql for proteomics software
automatically aligns all files resulting in a list of detected and
quantified peptides by LTQ-Orbitrap XL.
Protein identification was performed using the Mascot search
engine v. 2.5.0 (Matrix Science; London, UK) and the solanaceous
protein database of international tomato annotation group (ITAG) v.
2.3. Search parameters were: monoisotopic mass accuracy, trypsin
digestion, peptide mass tolerance (5 ppm), MS/MS tolerance (0.6 Da),
allowance of missed cleavage, fixed modification
(carbamidomethylation (Cys)), variable modification (oxidation (Met))
and peptide charges (+1, +2, +3). Positive identification was attributed
with Mascot p-values under the threshold (P< 0.05) and false discovery
rate 5 %. Progenesis Ql for proteomics software was used to associate
peptide and proteins information and perform the statistical analysis of
obtained data. Significant differences were assigned to proteins under
the threshold (P< 0.05) in comparisons between treatments.

103
Materials and Methods
In order to evaluate bacterial inoculation effects on wt and nr
plants, the proteomic profiles of Bm-inoculated and C7-inoculated
plants were compared with those of non-inoculated ones as well as with
each other. The Plant MetGenMap Software (Joung et al. 2009) was
used to identify changed pathways from protein profile data and to
visualize the profile data in a biochemical pathway context using a
threshold of fold change over 4. The BioVenn software (Hulsen et al.
2008) was used to compare quantitatively protein profiles with those
obtained under different experimental conditions.
Phosphate solubilization bioassay (Chapter 3)
Bacterial strains were tested by plate bioassay in order to evaluate
phosphate solubilizing ability of PGPB strains according to Nautiyal
(1999), with some variations. National Botanical Research’s Institute
phosphate growth medium (glucose 10 g l-1
, Ca3(PO4)2 5 g l-1
, MgCl2.6
H20 5 g l-1
, MgSO4.7 H20 0.25 g l-1
, KCl 0.2 g l-1
and (NH4)2S04 0.1 g g
l-1
) supplemented with 1.5 % Bacto-agar was used in petri dishes. The
medium pH was adjusted to 7.0 before autoclaving. Bacterial
suspension droplets (5 l, D.O.600 nm=1.0) were plated and five
replicates per bacterial strain were tested (n=5). A Pseudomonas sp.
strain (C+ p12) was kindly provided by Ana. V. Lasa from the
laboratory of Manuel Fernández-López from Estación Experimental del
Zaidín (CSIC, Granada, Spain) and used as positive control. The colony
and the halo (zone of clearance surrounding the bacterial colony)
diameters were measured after 10 days of the plate incubation at 28ºC.
Phosphate solubilizing index (PSI) was calculated as the ratio of halo
diameter (mm) and colony diameter (mm) (Kumar and Narula 1999).

104
Materials and Methods
Antioxidant enzymatic activities (Chapter 3)
The extraction of enzymes were performed as described Aroca et
al. (2003) with some variations. Frozen root sample (200 mg,
previously ground to a powder in a mortar with liquid N2) were
homogenized with 1.6 ml phosphate buffer 100 mM (pH 7.0)
containing KH2PO4 60 mM, K2HPO4 40 mM, DTPA 0.1 mM, and
PVPP 1 % (w/v) by shaking in vortex. The homogenate was
centrifuged (18000 g, 10 min, 4ºC) and the supernatant was used for
enzyme activity determination. Total soluble protein was determined
according to Bradford (1976), using bovine serum albumin as standard.
Glutathione reductase (EC 1.20.4.2) activity was
spectrophotometrically determined by measuring the absorbance
reduction at 340 nm due to the NADPH oxidation (Carlberg and
Mannervik 1985). The reaction mixture (200 l) contained buffer
solution (Tris buffer 50 mM, MgCl2 3 mM, oxidized glutathione
(GSSG) 1 mM, pH 7.5), and 10 μl of enzyme extract, and NADPH 0.3
mM was added and mixed thoroughly to begin the reaction. The results
were expressed in nmol of oxidized NADPH per g of total protein per
minute, and the enzymatic activity was calculated using the initial
reaction speed and the calibration curve of NADPH ranging from 0 to
0.3 mM.
Ascobate peroxidase (EC 1.11.1.11) activity was measured in a
200 l reaction volume containing potassium phosphate buffer 80 mM
(pH 7.0), hydrogen peroxide (H202) 0.25 mM, and sodium ascorbate 0.5
mM and 10 μl of enzyme extract. Enzymatic activity was
spectrophotometrically determined by measuring the absorbance
105
Materials and Methods
reduction at 290 nm during 1 min to determine the ascorbate oxidation
rate when H202 was added to start the reaction and the calibration curve
of sodium ascorbate ranging from 0 to 0.5 mM (Amako et al. 1994).
Superoxide dismutase (EC 1.15.1.1) activity was evaluated
according to Burd et al. (2000). SOD is able to inhibit the reduction of
nitroblue tetrazolium (NBT) by superoxide radicals generated
photochemically. One unit of SOD was defined as the enzyme amount
required to inhibit the reduction rate of NBT by 50% at 25ºC.
Catalase (EC 1.11.1.6) activity was spectrophotometrically
measured according to Aebi (1984). Enzymatic activity was determined
by measuring consumption of H202 at 240 nm for 1 min and the
calibration curve of H202 ranging from 0 to 8 mM. The reaction mixture
consisted of potassium phosphate buffer 50 mM (pH 7.0) containing
H202 10 mM and 5 μl of enzyme extract in a 200 l volume.
Antioxidant compounds determination (Chapter 3)
Root samples were used in order to measure ascorbic acid and
reduced and oxidized glutathione forms (GSH and GSSG, respectively)
contents. Antioxidant molecule analysis was carried out by liquid LC-
MS according to Airaki et al. (2011) with some variations. Frozen
tissue (150 mg, previously ground to a powder in a mortar with liquid
N2) was extracted with 1 ml of HCl 0.1 N. The mixture was extracted
by shaking in vortex 1 min and kept at 4ºC. Homogenates were
centrifuged (17000 g, 40 min, 4ºC) and the supernatants collected,
filtered with a syringe through Nylon membrane filters (0.20 m). A 10
µl aliquot of filtered fraction was immediately taken for analysis. All

106
Materials and Methods
procedures were done at 4ºC and protected from light to avoid potential
analyte degradation.
Samples were assayed by Scientific Instrumentation Service of
the Estación Experimental del Zaidín (CSIC), Granada, Spain. An
alliance 2695 separation module connected to Quattro Micro triple
quadrupole mass spectrometer detector (Waters) was used for LC-MS
analysis. The compounds were detected by electrospray mode, using an
orthogonal Z-spray electrospray interface (Quattro Micro, Waters).
Instrument control, data collection, analysis and management were
controlled by the MassLynx 4.1 software package. Separation was
carried out using an Atlantis T3 Column (3 x 150 mm, 3 µm, Waters).
Analyte concentrations were calculated from a standard curve
constructed using commercial analytes.
Statistical analyses
Data were processed using R software (v3.2.2 Open Source;
http://www.r-project.org/) by two- or three-way ANOVA depending on
number of sources of variation in order to know if there is interaction
between independent variables on the dependent variable. Significance
of source of variation interaction was evaluated by P-value (P < 0.05).
In case of significant interaction between factors, all treatments
were compared between each other’s by least significant
difference (LSD) test (P < 0.05).
In case of no interaction between factors, inoculum effects were
evaluated analyzing separately wt and nr plants using ANOVA

107
Materials and Methods
followed by LSD’s test (P < 0.05). Additionally, plant genotype
effect was evaluated analyzing wt and nr plants under the same
conditions by t-Student test (P < 0.05).
Relationships between variables were examined using the
Pearson correlation coefficient (P < 0.05). Principal component
analysis (PCA) was used to compare profiles with those obtained under
different experimental conditions using Excel add-in Multibase
package (v_2015 Open source; http://www.numericaldynamics.com/).
Statistical analyses in chapter 1
Plant dry weight, gene expression and shoot ethylene production
data were processed by three-way ANOVA with plant genotype (G),
watering regime (W) and inoculum (I) as sources of variation. Ethylene
produced by seedlings data were also processed by three-way ANOVA
with plant genotype (G), time after inoculation (D) and inoculum (I) as
sources of variation. Bacterial colonization and bacterial ethylene
production were processed by two-way ANOVA with plant genotype
(G) and inoculum (I) as sources of variation. ACC deaminase activity
was evaluated using ANOVA followed by LSD’s test (P < 0.05).
Microarray data were analyzed with statistical tool LIMMA
(Linear Models for Microarrays Analysis) by using affylmGUI
(Wettenhall et al. 2006) in R software, and significant differences were
assigned to genes under the threshold (P < 0.05) in comparisons
between treatments.

108
Materials and Methods
Statistical analyses in chapter 2
Plant dry weight, RGR, stomatal conductance, photosynthetic
efficiency, chlorophyll, nutrient, phytohormone and metabolite contents
data were processed by two-way ANOVA with plant genotype (G) and
inoculum (I) as sources of variation.
Relationships between total, shoot and root dry weights and
nutrients, and metabolites were examined using the Pearson correlation
coefficient. Principal component analysis (PCA) was also used to
compare nutrient and metabolite profiles with those obtained under
different experimental conditions.
Statistical analyses in chapter 3
Fresh weight, root phosphorus content, expression of phosphate
transporter genes, antioxidant enzymatic activities, and antioxidant
compounds contents obtained in main experiment of chapter 3 were
analyzed by two-way ANOVA with plant genotype (G) and inoculum
(I) as sources of variation. Phosphate solubilizing index was evaluated
using ANOVA followed by LSD’s test (P < 0.05).
Progenesis Ql for proteomics software was used to perform the
statistical analysis of obtained proteomic data by ANOVA followed by
LSD’s test (P < 0.05). PCA was also used to compare root proteomic
profiles with those obtained under different experimental conditions.
In case of differential phosphorus conditions bioassay, dry
weight, root and shoot phosphorus content and expression of phosphate
transporter genes were processed by three-way ANOVA with genotype
(G), phosphorous regime (P), and inoculum (I) as sources of variation.

109
Chapter 1: Ethylene sensitivity by ETR3 is
essential in tomato interaction with Bacillus
megaterium but not with Enterobacter C7

110
Chapter 1
Chapter 1: Ethylene sensitivity by ETR3 is essential in
tomato interaction with Bacillus megaterium but not with
Enterobacter C7
Objective
The present chapter aims to shed light on plant-microbe
interactions as well as plant growth promotion mediated by bacterial
strains regarding to ethylene sensitivity under well watered and drought
conditions, with focus in ethylene transduction pathway. PGPB are able
to induce plant growth either directly or indirectly (Ortíz-Castro et al.
2009). Ethylene is typically induced in response to environmental
stresses as drought (Pierik et al. 2007). Some PGPB were defined as
stress controllers (Lugtenberg and Kamilova 2009), since they contain
ACCd activity and they are able to reduce ethylene levels (Belimov et
al. 2007; Glick 2014). Furthermore, transcriptomic approaches have
contributed with valuable information to clarify plant-bacteria
interaction (Cartieaux et al. 2003; Verhagen et al. 2004; van de Mortel
et al. 2012). However, bacteria without either ACCd activity or
ethylene production capacity have been selected in the present study to
avoid any direct perturbation of plant ethylene metabolism caused by
the bacteria.
We pursued to determine if ethylene sensitivity is decisive for
plant growth promotion in mature plants by these two PGPB and clarify
plant-bacteria interaction and PGPB mechanisms regarding to ethylene
perception under both well watered and drought conditions. Plant
growth was determined at 8 weeks post-inoculation and expression of

111
Chapter 1
ethylene-related genes as well as ethylene production was assayed.
Furthermore, the expression levels of tomato genes were
simultaneously analyzed by microarray technology to highlight other
plant significantly changed pathways involved in PGPB activity or
interaction with plants.
Experimental design
The experiment consisted of a randomized complete block design
with two tomato plant lines (wt and nr), two watering regimes (well
watered (WW) and drought (D) conditions), and three inoculation
treatments: (1) non-inoculated control plants, (2) Bacillus megaterium-
inoculated plants and (3) Enterobacter C7-inoculated plants. Each
treatment consisted in eleven replicates (n=11). Plants were harvested
at 8 weeks post inoculation (Fig. 1.1).
Wellwatered4 weeks
10 dayplantlets
PGPB Inoculation
Start of watering regimes
4 wpi
Drought4 weeks
Harvest8 wpi
Juvenilestage
Maturestage
SampleCollection
Determination:
• Plant growth• Expression of
ethylene-related genes
• Root transcriptomicanalysis
Wellwatered4 weeks
SeedSterlization and
GerminationDay 0
Figure 1.1 Schematic representation of experimental design of chapter 1.
Weeks post-inoculation (wpi).

112
Chapter 1
Results
Colonization of tomato root system by PGPB strains
A bioassay for bacterial colonization was performed to test the
ability of the PGPB strains that were used to colonize wt and nr root
systems. As expected, no bacterial growth was observed in non-
inoculated plants. Bm and C7 were able to colonize roots independently
of plant genotype. Moreover, no significant differences were noticed in
colonization rates, reaching values of around 2x10⁶ CFU cm
-1 root
(Table 1.1). Furthermore, the PGPB strains did not show either
ethylene production or the ability to cleave ACC the direct precursor of
ethylene (data not shown).
Table 1.1 Bacterial root colonization. Colony-forming units (CFU) per root
centimeter of Bacillus megaterium (Bm) and Enterobacter C7 (C7) in wild type (wt)
cv. Pearson and never ripe (nr) tomato plants. Data are means ± SE (n = 8). No
significant differences were noticed according to LSD’s test (P < 0.05).
TreatmentCFU
root cm-1 SE
Bmwt 2.55x10⁶ 0.68x10⁶
nr 2.02x10⁶ 0.41x10⁶
C7wt 1.85x10⁶ 0.39x10⁶
nr 2.69x10⁶ 0.76x10⁶
SE: standard error
Biomass production of wt and nr plants inoculated with
Bacillus megaterium and Enterobacter C7
Dry weight of wt and nr plants inoculated with both PGPB (Bm
or C7) showed similar growth patterns under WW and D conditions,

113
Chapter 1
but interaction between main factors (GxWxI) was unnoticed (Fig. 1.2).
PGPB inoculation promoted total plant growth in wt plants under WW
(20.2% and 20.0% for Bm and C7, respectively) and D conditions
(24.7% and 27.4% for Bm and C7, respectively). However, total DW
only showed an increase in nr plants due to C7 inoculation (25.6% and
21.3% under WW and D conditions, respectively). Moreover, drought
treatment significantly reduced total DW in both plant genotypes under
all inoculation treatments (Fig. 1.2 A).
Bm inoculation only increased shoot DW in wt plants under
drought conditions (26.5%). However, shoot DW was increased by C7
inoculation in both plant genotypes under both watering regimes
(22.7% and 24.4% in wt plants under WW and D conditions,
respectively, and 24.8% and 21.7% in nr plants under WW and D
conditions, respectively). Furthermore, significant differences due to
drought treatments were noticed in all cases excepting in wt plants
under Bm inoculation (Fig. 1.2 B). Additionally, significant differences
between wt and nr plants were only noticed in non-inoculated plants
under WW conditions in total and shoot DWs, showing nr plants higher
values than wt ones (Fig. 1.2 A, B).
In addition, root DW was increased by both PGPB inoculation in
wt plants under WW (15.7% and 15.9% for Bm and C7, respectively)
and D conditions (17.3% and 17.2% for Bm and C7, respectively).
However, only significant differences due to C7 inoculation in nr plants
were found under WW conditions (29.2%). Furthermore, drought
treatment significantly reduced root DW in all cases, but no differences
between plant genotypes were noticed (Fig. 1.2 C).

114
Chapter 1
0.0
0.2
0.4
0.6
0.8
1.0
1.2
1.4
1.6
1.8
WW D WW D
wt nr
B
Sho
ot
Dry
We
igh
t(r
_u)
c
b bb
aab
w
xy
wx
GxWxI ns
y yz*
GxWxI ns
0.0
0.2
0.4
0.6
0.8
1.0
1.2
1.4
1.6
WW D WW D
wt nr
C
Ro
ot
Dry
We
igh
t(r
_u)
ba a
c
b bxy
yzz
w
wxy
wx
0.0
0.2
0.4
0.6
0.8
1.0
1.2
1.4
1.6
WW D WW D
wt nr
A
Tota
l Dry
We
igh
t(r
_u)
ba a
c
b b
w
xy
wx
GxWxI nsz
y y*
Figure 1.2 Effects of bacterial inoculation on plant dry weights under well watered
and drought conditions. (A) Total, (B) shoot and (C) root dry weights of wild type cv.
Pearson (wt) and never ripe (nr) tomato (Solanum lycopersicum) plants under well
watered (WW) and drought (D) conditions. Treatments are designed as non-
inoculated controls (No, black bars), Bacillus megaterium inoculated plants (Bm,
white bars), and Enterobacter C7 inoculated plants (C7, grey bars). Data are means ±
SE (n = 7). Data were analyzed by three-way ANOVA with plant genotype (G),
watering regime (W) and inoculum (I) as sources of variation. Significance of sources
of variation interaction (GxWxI) was evaluated by P-value; ns, not significant; * P ≤
0.05; ** P ≤ 0.01; *** P ≤ 0.001. As no significant interaction between factors was
noticed, inoculum effects under well watered and drought conditions were
evaluated analyzing separately wt and nr plants using ANOVA. Means followed by
different letters are significantly different (P < 0.05) according to LSD’s test, using as
highest value from letter a onwards for wt plants, and from letter z backwards for nr
plants. Plant genotype effect was evaluated analyzing wt and nr plants under the
same inoculation treatment (No, Bm or C7) by t-Student test and significant
difference (P < 0.05) is showed as (*) above nr means.

115
Chapter 1
Modification of ethylene biosynthesis genes expression by
PGPB inoculation regarding to ethylene sensitivity
PGPB inoculation, drought and ethylene insensitivity effects on
expression of eight ACS and six ACO genes were evaluated (Fig. 1.3
and 1.4, respectively).
Expression of ACS2 to 5 and ACS8 genes in both plant tissues
and ACS7 gene in roots were unaffected by PGPB inoculation neither
by plant genotype and drought treatment (data not shown). In roots,
ACS1 expression showed significant factor interaction (GxWxI).
Exclusively, both bacterial strains decreased ACS1 expression
compared to non-inoculated wt plants under D conditions showing C7-
inoculated plants lowest expression than Bm-inoculated ones.
Moreover, drought treatment increased ACS1 expression in roots in
non- and Bm-inoculated wt plants (Fig 1.3 A).
ACS6 expression only showed significant difference between
non-inoculated wt and nr plants under D conditions showing nr plants
lower values than wt ones (Fig 1.3 B). Furthermore, no effects in ACS7
expression were noticed in wt plants. Meanwhile, C7 inoculation
increased ACS7 expression in nr plants under WW conditions
producing significant differences between C7-inoculated plants under
different watering regimes (Fig 1.3 C).

116
Chapter 1
0
5
10
15
20
25
30
WW D WW D
wt nr
D
Sho
ot
SlA
CS
1 (
r_u
)
* * *
GxWxI ns
0.0
1.0
2.0
3.0
4.0
5.0
6.0
7.0
WW D WW D
wt nr
A
Ro
ot
SlA
CS
1 (
r_u
) B
A
C
CD CD CD
GxWxI *
CD CD CD
D D D
0.0
0.2
0.4
0.6
0.8
1.0
1.2
1.4
1.6
1.8
WW D WW D
wt nr
B
*
Ro
ot
SlA
CS
6 (
r_u
)
GxWxI ns
0.0
0.5
1.0
1.5
2.0
2.5
3.0
WW D WW D
wt nr
No
Bm
C7
CGxWxI ns
y y y y
yz
z
Ro
ot
SlA
CS
7 (
r_u
)
0.0
0.2
0.4
0.6
0.8
1.0
1.2
1.4
WW D WW D
wt nr
E
Sho
ot
SlA
CS
6 (
r_u
)
GxWxI ns
bc
ab
c
bc
a
c
xy
z
x x x
y *
*
Figure 1.3 Effects of bacterial inoculation on ACC synthase (ACS) gene expression
under well watered and drought conditions. Relative expression of (A) root ACS 1,
(B) root ACS 6, (C) root ACS 7, (D) shoot ACS 1 and (E) shoot ACS 6 in wild type cv.
Pearson (wt) and never ripe (nr) tomato (Solanum lycopersicum) plants under well
watered (WW) and drought (D) conditions. Treatments are designed as non-

117
Chapter 1
inoculated controls (No, black bars), Bacillus megaterium inoculated plants (Bm,
white bars), and Enterobacter C7 inoculated plants (C7, grey bars). Data are means ±
SE (n = 3). Data were analyzed by three-way ANOVA with plant genotype (G),
watering regime (W) and inoculum (I) as sources of variation. Significance of sources
of variation interaction (GxWxI) was evaluated by P-value; ns, not significant; * P ≤
0.05; ** P ≤ 0.01; *** P ≤ 0.001. In case of significant interaction between factors, all
treatments were compared between each others. Means followed by different
capital letters are significantly different (P < 0.05) according to LSD’s test. In case of
not-significant interaction between factors, inoculum effects under well watered and
drought conditions were evaluated analyzing separately wt and nr plants using
ANOVA. Means followed by different letters are significantly different (P < 0.05)
according to LSD’s test, using as highest value from letter a onwards for wt plants,
and from letter z backwards for nr plants. Plant genotype effect was evaluated
analyzing wt and nr plants under the same inoculation treatment (No, Bm or C7) by
t-Student test and significant difference (P < 0.05) is showed as (*) above nr means.
In shoots, ACS1 expression was exclusively affected by plant
genotype in non-inoculated plants under both watering regimes and in
Bm-inoculated plants only under WW conditions always showing wt
plants higher values than nr ones (Fig. 1.3 D). However, ACS6
expression was affected by PGPB inoculation in both plant genotypes
under both watering regimes. Bm inoculation decreased ACS6
expression in wt plants exclusively under D conditions, while its levels
were increased by Bm in nr plants independently of watering regime.
C7 inoculation decreased ACS6 expression in wt plants under both
watering regimes, but no significant effect was noticed compared to
Bm-inoculated wt plants. Furthermore, C7 inoculation did not affect
ACS6 expression in nr plants independently of watering regime.
Significant effect of drought treatment was only observed in nr plants
under Bm inoculation, causing a descent. In addition, significant
differences between wt and nr plants were exclusively noticed in non-
inoculated plants independently of watering regime (Fig. 1.3 E).

118
Chapter 1
PGPB inoculation, drought treatment and plant genotype did not
cause any effect in ACO2 and 5 in shoots neither in ACO3 to 5 in roots
(data not shown). Furthermore, no significant differences due to PGPB
inoculation neither by drought treatment was noticed in root expression
of ACO1, 2 and 6. In these genes, only plant genotype differences were
noticed, but in all cases wt plants showed higher expression values than
nr ones (Fig. 1.4). ACO1 and ACO2 exclusively showed differences
between plant genotypes in non-inoculated plants under WW and D
conditions, respectively (Fig. 1.4 A, B). Moreover, ACO6 showed
differences between plant genotypes in non- and C7-inoculated plants
only under WW conditions (Fig. 1.4 C).
In shoots, ACO1 expression was unaffected by PGPB
inoculation under D conditions in both plant genotypes. However, both
bacterial strains decreased ACO1 expression in wt plants, while Bm
inoculation exclusively increased its expression in nr plants under WW
conditions. Drought treatment decreased ACO1 expression in non-
inoculated wt plants and in Bm-inoculated plants independently of
plant genotype. Moreover, significant differences between wt and nr
plants were only noticed in non-inoculated plants under both watering
regimes (Fig. 1.4 D). In ACO3 expression, exclusively differences
between plant genotypes were noticed in non- and C7-inoculated plants
under WW conditions (Fig. 1.4 E). Only C7 inoculation decreased
ACO4 expression in wt plants independently of watering regime. In
addition, significant differences between wt and nr plants were
exclusively noticed in non-inoculated plants under WW conditions
(Fig. 1.4 F).

119
Chapter 1
0.0
0.2
0.4
0.6
0.8
1.0
1.2
1.4
WW D WW D
wt nr
Shoo
tSl
ACO
4 (r
_u) ab
bc
a a
bc
*
c
FGxWxI ns
0.0
0.2
0.4
0.6
0.8
1.0
1.2
1.4
1.6
1.8
WW D WW D
wt nr
E
Shoo
tSl
ACO
3 (r
_u)
* *
GxWxI ns
0.0
0.2
0.4
0.6
0.8
1.0
1.2
1.4
WW D WW D
wt nr
D
Shoo
tSlA
CO 1
(r_u
)
ba
bc
c c c
GxWxI ns
z
y y y y y* *
0.0
0.2
0.4
0.6
0.8
1.0
1.2
1.4
WW D WW D
wt nr
b b b ba a
Shoo
tSl
ACO
6 (r
_u)
GGxWxI ns
x
y
xy xy xy
z
* *
*
0.0
0.2
0.4
0.6
0.8
1.0
1.2
1.4
1.6
WW D WW D
wt nr
A
*
GxWxI ns
Root
SlAC
O 1
(r_u
)
0.0
0.2
0.4
0.6
0.8
1.0
1.2
1.4
1.6
WW D WW D
wt nr
B
*
GxWxI ns
Root
SlAC
O 2
(r_u
)
0.0
0.2
0.4
0.6
0.8
1.0
1.2
1.4
1.6
1.8
WW D WW D
wt nr
No
Bm
C7
C
Root
SlAC
O 6
(r_u
)
* *
GxWxI ns
Figure 1.4 Effects of bacterial inoculation on ACC oxidase (ACO) gene expression
under well watered and drought conditions. Relative expression of (A) root ACO 1,
(B) root ACO 2 and (C) root ACO 6 , (D) shoot ACO 1, (E) shoot ACO 3, (F) shoot ACO
4 and (G) shoot ACO 6 in wild type cv. Pearson (wt) and never ripe (nr) tomato

120
Chapter 1
(Solanum lycopersicum) plants under well watered (WW) and drought (D) conditions.
Treatments are designed as non-inoculated controls (No, black bars), Bacillus
megaterium inoculated plants (Bm, white bars), and Enterobacter C7 inoculated
plants (C7, grey bars). Data are means ± SE (n = 3). Data were analyzed by three-way
ANOVA with plant genotype (G), watering regime (W) and inoculum (I) as sources of
variation. Significance of sources of variation interaction (GxWxI)) was evaluated by
P-value; ns, not significant; * P ≤ 0.05; ** P ≤ 0.01; *** P ≤ 0.001. As no significant
interaction between factors was noticed, inoculum effects under well watered and
drought conditions were evaluated analyzing separately wt and nr plants using
ANOVA. Means followed by different letters are significantly different (P < 0.05)
according to LSD’s test, using as highest value from letter a onwards for wt plants,
and from letter z backwards for nr plants. Plant genotype effect was evaluated
analyzing wt and nr plants under the same inoculation treatment (No, Bm or C7) by
t-Student test and significant difference (P < 0.05) is showed as (*) above nr means.
Regarding ACO6 expression, Bm inoculation exclusively
increased its expression in nr plants independently of watering regime.
However, C7 inoculation decreased ACO6 expression only in wt plants
under WW conditions. Significant effect of drought treatment was
observed in non- and Bm- inoculated wt plants and exclusively in Bm-
inoculated nr plants. Moreover, differences between plant genotypes
were significantly noticed in non-inoculated plants independently of
watering regime and in C7-inoculated plants only under WW
conditions (Fig. 1.4 G).
Modification of expression of Never Ripe (ETR3) receptor and
TCTR1 genes by PGPB inoculation regarding to ethylene sensitivity
The effects of PGPB inoculation, drought treatment and plant
genotype on expression of ETR3 and TCTR1 (Tomato CTR1) genes
were evaluated (Fig. 1.5).

121
Chapter 1
In roots, Bm inoculation exclusively increased ETR3 expression
in nr plants under D conditions, while C7 inoculation did not show
effects under both watering regimes. Moreover, differences between
plant genotypes were exclusively noticed under C7 inoculation and
WW conditions showing wt plants higher values than nr ones (Fig. 1.5
A).
In shoots, no PGPB effects were noticed in both genotypes under
WW conditions. However, C7 inoculation decreased ETR3 expression
exclusively in wt plants, while Bm increased its expression in nr plants
under D conditions. Moreover, drought treatment only increased shoot
ETR3 expression in non-inoculated wt plants and in Bm-inoculated nr
plants. Significant differences between plant genotypes were noticed in
non-inoculated plants independently of watering regime and under C7
inoculation in WW conditions always showing nr plants lower values
than wt ones (Fig. 1.5 C).
Exclusively significant differences in root TCTR1 expression
were found between plant genotypes under Bm inoculation and D
conditions, showing nr plants lower values than wt ones (Fig. 1.5 B).
However, shoot TCTR1 expression showed significant differences due
to PGPB inoculation and between wt and nr plants. Bm inoculation
increased TCTR1 only under D conditions in nr plants. Moreover, non-
inoculated nr plants showed lower TCTR1 expression than wt ones
under D conditions (Fig. 1.5 D). However, no significant differences
were observed in wt plants (Fig. 1.5 B, D).

122
Chapter 1
0.0
0.5
1.0
1.5
2.0
2.5
3.0
WW D WW D
wt nr
C
Sho
ot
SlET
R 3
(r_
u)
GxWxI ns
bc bc bc
c
a ab
y y y y y
z * * *
0.0
0.5
1.0
1.5
2.0
2.5
3.0
WW D WW D
wt nr
A
Ro
ot
SlET
R 3
(r_
u)
GxWxI ns
xy xy xy
yzz
x
*
0.0
0.5
1.0
1.5
2.0
2.5
3.0
WW D WW D
wt nr
No Bm C7
B
*
GxWxI ns
Ro
ot
SlTC
TR 1
(r_
u)
0.0
0.2
0.4
0.6
0.8
1.0
1.2
1.4
WW D WW D
wt nr
D
Sho
ot
SlTC
TR 1
(r_
u)
GxWxI ns
yz
xy xy *
z
x x
Figure 1.5 Effects of bacterial inoculation on expression of ethylene receptor
(ETR3) and signaling (TCTR1) genes under well watered and drought conditions.
Relative expression of (A) root ETR3, (B) root TCTR1, (C) shoot ETR3 and (D) shoot
TCTR1 in wild type cv. Pearson (wt) and never ripe (nr) tomato (Solanum
lycopersicum) plants under well watered (WW) and drought (D) conditions.
Treatments are designed as non-inoculated controls (No, black bars), Bacillus
megaterium inoculated plants (Bm, white bars), and Enterobacter C7 inoculated
plants (C7, grey bars). Data are means ± SE (n = 3). Data were analyzed by three-way
ANOVA with plant genotype (G), watering regime (W) and inoculum (I) as sources of
variation. Significance of sources of variation interaction (GxWxI) was evaluated by
P-value; ns, not significant; * P ≤ 0.05; ** P ≤ 0.01; *** P ≤ 0.001 As no significant
interaction between factors was noticed, inoculum effects under well watered and
drought conditions were evaluated analyzing separately wt and nr plants using
ANOVA. Means followed by different letters are significantly different (P < 0.05)
according to LSD’s test, using as highest value from letter a onwards for wt plants,
and from letter z backwards for nr plants. Plant genotype effect was evaluated
analyzing wt and nr plants under the same inoculation treatment (No, Bm or C7) by
t-Student test and significant difference (P < 0.05) is showed as (*) above nr means.

123
Chapter 1
Modification of ethylene-responsive genes expression by
PGPB inoculation regarding to ethylene sensitivity
In addition, expression of genes involved in ethylene response
was also analyzed (Fig. 1.6). No significant changes were noticed in
case of ERF1 in root and shoot tissues, neither in ER24 and ER5 in
roots (data not shown). In root, ER21 expression interaction between
main factors (GxWxI) was noticed, and exclusively Bm inoculation
increased ER21 expression in nr plants under WW conditions (Fig. 1.6
A).
In shoots, ER21 expression was affected by bacterial inoculation
in both plant genotypes. In wt plants, C7 inoculation reduced ER21
expression values only under D conditions. Nevertheless, C7 induced
ER21 expression in nr plants exclusively under WW conditions.
Moreover, ER21 expression was increased due to Bm inoculation in nr
plants only under D conditions. Drought treatment increased ER21
expression in non-inoculated wt plants and in Bm-inoculated nr plants,
while ER21 expression was decreased by drought in nr plants under C7
inoculation. Differences between plant genotypes were only noticed in
non-inoculated plants independently of watering regime showing nr
plants lower values than wt ones (Fig. 1.6 B).
In addition, shoot ER24 was exclusively affected by Bm
inoculation in nr plants under WW conditions showing an expression
induction by bacterial inoculation (Fig. 1.6 C). Regarding ER5
expression, only non-inoculated wt plants significantly showed higher
values than nr plants under D conditions (Fig. 1.6 D).

124
Chapter 1
0.0
0.5
1.0
1.5
2.0
2.5
3.0
WW D WW D
wt nr
No Bm C7
c
B
Sho
ot
SlER
21
(r_
u)
* *
GxWxI ns
bc bc bc
aab
x x x
yz
xy
z
0
5
10
15
20
25
30
WW D WW D
wt nr
A
B B B B B B B B B B B
GxWxI **
Ro
ot
SlER
21
(r_
u)
A
0.0
0.2
0.4
0.6
0.8
1.0
1.2
1.4
1.6
1.8
WW D WW D
wt nr
Sho
ot
SlER
24
(r_
u)
yz
xyzz
xy xy x
CGxWxI ns
0.0
0.2
0.4
0.6
0.8
1.0
1.2
1.4
1.6
WW D WW D
wt nr
D
*
GxWxI ns
Sho
ot
SlER
5 (
r_u
)
Figure 1.6 Effects of bacterial inoculation on ethylene-responsive gene expression
under well watered and drought conditions. Relative expression of (A) root ER21,
(B) shoot ER21, (C) shoot ER24, and (D) shoot ER5 in wild type cv. Pearson (wt) and
never ripe (nr) tomato (Solanum lycopersicum) plants under well watered (WW) and
drought (D) conditions. Treatments are designed as non-inoculated controls (No,
black bars), Bacillus megaterium inoculated plants (Bm, white bars), and
Enterobacter C7 inoculated plants (C7, grey bars). Data are means ± SE (n = 7). Data
were analyzed by three-way ANOVA with plant genotype (G), watering regime (W)
and inoculum (I) as sources of variation. Significance of sources of variation
interaction (GxWxI) was evaluated by P-value; ns, not significant; * P ≤ 0.05; ** P ≤
0.01; *** P ≤ 0.001. In case of significant interaction between factors, all treatments
were compared between each others. Means followed by different capital letters are
significantly different (P < 0.05) according to LSD’s test. In case of not-significant
interaction between factors, inoculum effects under well watered and drought
conditions were evaluated analyzing separately wt and nr plants using ANOVA.
Means followed by different letters are significantly different (P < 0.05) according to
LSD’s test, using as highest value from letter a onwards for wt plants, and from letter
z backwards for nr plants. Plant genotype effect was evaluated analyzing wt and nr
plants under the same inoculation treatment (No, Bm or C7) by t-Student test and
significant difference (P < 0.05) is showed as (*) above nr means.

125
Chapter 1
Modification of ethylene production by PGPB inoculation
regarding to ethylene sensitivity
Ethylene emission by leaflets was determined, but no significant
differences due to PGPB inoculation neither by drought treatment were
observed in both plant genotypes. However, significant differences
between wt and nr plants were noticed in C7-inoculated plants
independently of watering regime, and in Bm-inoculated plants only
under WW conditions and in non-inoculated plants exclusively under D
conditions showing always nr plants higher values than wt ones (Fig.
1.7 A).
In addition, a bioassay for ethylene production was performed
to test if ethylene levels emitted by seedlings are affected in response to
bacterial inoculation (Fig. 1.7 B). As expected, no ethylene was
detected in vials without seedlings independently of no, Bm or C7
inoculation of substrate (data not shown).
In case of wt plants, C7 inoculation exclusively induced
ethylene production rate after 7 h of inoculation. In nr plants, only Bm
increased ethylene production rate after 7 h of inoculation showing no
significant effect 26 h after inoculation. In addition, differences
between wt and nr plants in ethylene production rate were exclusively
noticed under Bm inoculation 26 h post-inoculation showing nr plants
higher ethylene production than wt plants (Fig. 1.7 B).

126
Chapter 1
0.0
0.5
1.0
1.5
2.0
2.5
3.0
WW D WW D
wt nr
A
Eth
yle
ne
pro
du
ctio
nra
te(r
_u)
GxWxI ns
* *
* *
0.0
1.0
2.0
3.0
4.0
5.0
6.0
id 1 dpi id 1 dpi
wt nr
No Bm C7B
Eth
yle
ne
pro
du
ctio
nra
te(n
mo
lh-1
DW
g-1
)
b b b b b
a
x
xy xy xy
GxDxI ns
z
*
yz
7 h 26 h 7 h 26 h
Figure 1.7 Ethylene emissions by tomato plants inoculated with PGPB under well
watered and drought conditions. (A) Relative ethylene production rate in wild type
cv. Pearson (wt) and never ripe (nr) tomato (Solanum lycopersicum) plants under
well watered (WW) and drought (D) conditions. Data are means ± SE (n = 6). Data
were analyzed by three-way ANOVA with plant genotype (G), watering regime (W)
and inoculum (I) as sources of variation. Significance of sources of variation
interaction (GxWxI) was evaluated by P-value; ns, not significant; * P ≤ 0.05; ** P ≤
0.01; *** P ≤ 0.001. As no significant interaction between factors neither PGPB
inoculation effects were noticed, plant genotype effect was evaluated analyzing wt
and nr plants under the same inoculation treatment (No, Bm or C7) by t-Student test
and significant difference (P < 0.05) is showed as (*) above nr means. (B) Ethylene
emission (nmol) per hour and gramme of dry weight (DW) in wild type cv. Pearson
(wt) and never ripe (nr) tomato (Solanum lycopersicum) plantlets at 7 and 26 hours
post-inoculation. Data are means ± SE (n = 4). Data were also processed by three-
way ANOVA with plant genotype (G), time after inoculation (D) and inoculum (I) as
sources of variation. Significance of sources of variation interaction (GxDxI) was
evaluated by P-value. As no significant interaction between factors was noticed,
inoculum effects under well watered and drought conditions were evaluated
analyzing separately wt and nr plants using ANOVA. Means followed by different
letters are significantly different (P < 0.05) according to LSD’s test, using as highest
value from letter a onwards for wt plants, and from letter z backwards for nr plants.
Plant genotype effect was evaluated analyzing wt and nr plants under the same
inoculation treatment (No, Bm or C7) by t-Student test, and significant difference (P
< 0.05) is showed as (*) above nr means. Treatments are designed as non-inoculated
controls (No, black bars), Bacillus megaterium inoculated plantlets (Bm, white bars),
and Enterobacter C7 inoculated plantlets (C7, grey bars).

127
Chapter 1
Transcriptomic analysis of wt and nr plants inoculated with
PGPB strains
Microarray data were validated by QRT-PCR evaluating
correlations between data obtained with both methodologies (Table
M4). The transcriptomic analysis of root samples was performed
comparing different treatments in pairs to evaluate PGPB inoculation
effects on wt and nr plants and direct comparison between both
inocula. Transcriptomic data were quantitatively evaluated using Venn
diagrams to get a general overview of bacterial inoculation effects
(Fig.1.8).
A Bacillus megaterium effects B Enterobacter C7 effects
Comparison between PGPB effectsC
wt plants under WW conditions
wt plants under D conditions
nr plants under WW conditions
nr plants under D conditions
Figure 1.8 Venn diagrams of differentially expressed genes by bacterial inoculation
in wild type (wt) and never ripe (nr) tomato (Solanum lycorpesicum) plants under
under well watered (WW) and drought (D) conditions. (A) Bacillus megaterium
effects, (B) Enterobacter C7 effects and (C) comparison between Bacillus
megaterium and Enterobacter C7 effects. Each shape represents a comparison
between two treatments. Numbers indicate genes differentially expressed (p-value <
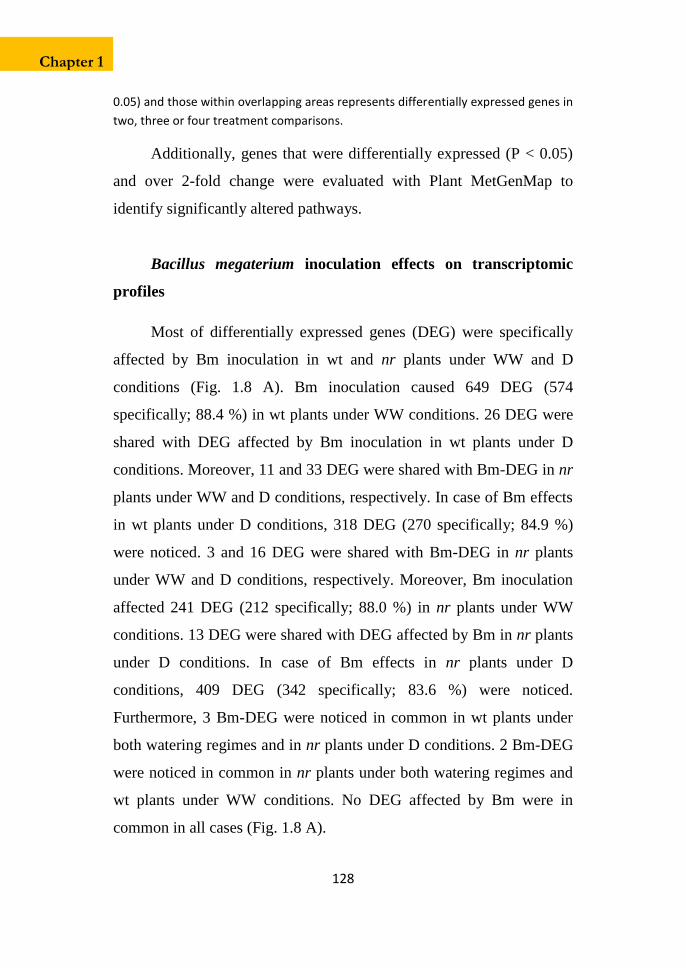
128
Chapter 1
0.05) and those within overlapping areas represents differentially expressed genes in
two, three or four treatment comparisons.
Additionally, genes that were differentially expressed (P < 0.05)
and over 2-fold change were evaluated with Plant MetGenMap to
identify significantly altered pathways.
Bacillus megaterium inoculation effects on transcriptomic
profiles
Most of differentially expressed genes (DEG) were specifically
affected by Bm inoculation in wt and nr plants under WW and D
conditions (Fig. 1.8 A). Bm inoculation caused 649 DEG (574
specifically; 88.4 %) in wt plants under WW conditions. 26 DEG were
shared with DEG affected by Bm inoculation in wt plants under D
conditions. Moreover, 11 and 33 DEG were shared with Bm-DEG in nr
plants under WW and D conditions, respectively. In case of Bm effects
in wt plants under D conditions, 318 DEG (270 specifically; 84.9 %)
were noticed. 3 and 16 DEG were shared with Bm-DEG in nr plants
under WW and D conditions, respectively. Moreover, Bm inoculation
affected 241 DEG (212 specifically; 88.0 %) in nr plants under WW
conditions. 13 DEG were shared with DEG affected by Bm in nr plants
under D conditions. In case of Bm effects in nr plants under D
conditions, 409 DEG (342 specifically; 83.6 %) were noticed.
Furthermore, 3 Bm-DEG were noticed in common in wt plants under
both watering regimes and in nr plants under D conditions. 2 Bm-DEG
were noticed in common in nr plants under both watering regimes and
wt plants under WW conditions. No DEG affected by Bm were in
common in all cases (Fig. 1.8 A).

129
Chapter 1
In addition, Bm inoculation significantly affects several DEG
with a fold change over two independently of plant genotype and
watering regime (Tables 1.2-5), and Plant MetGenMap identified
several changed pathways. In wt plants under WW conditions, 17 DEG
were noticed due to Bm inoculation which induced 3 DEG while
decreased 14 DEG (Table 1.2). Anthocyanin biosynthesis pathway was
induced due to increased transcription of leucoanthocyanidin
dioxygenase (LDOX), while lipoxygenase and jasmonic acid
biosynthesis pathways were reduced due to decreased transcription of
lipoxigenase A (LOX1.1).
Table 1.2 Differentially expressed genes over 2-fold due to Bacillus megaterium
inoculation in tomato Pearson cv. wild type under well watered conditions
Gene ID Fold change
Genes induced by Bm inoculation
Proline-rich protein LesAffx.67559.1.S1_at 2.43
Leucoanthocyanidin dioxygenase; LDOX LesAffx.17064.1.A1_at 2.04
Peptidase C14, caspase catalytic subunit p20 LesAffx.49028.1.S1_at 2.03
Genes repressed by Bm inoculation
Succinate dehydrogenase subunit 3 ┴ LesAffx.15544.1.S1_at 2.71
Nitrate reductase LesAffx.45315.4.S1_at 2.53
Lipoxygenase A; LOX1.1 * Les.3668.1.S1_at 2.35
Extensin-like protein Les.3560.1.S1_at 2.35
Photosystem II 44 kDa protein ┴ LesAffx.66410.1.S1_at 2.33
No description available Les.1542.1.A1_at 2.32
Endo-1,4-beta-glucanase; cel5 Les.3491.1.S1_at 2.21
No description available Les.766.1.A1_at 2.17
Photosystem II 47 kDa protein ┴ Les.4293.1.A1_at 2.12
Cytochrome c oxidase subunit 3 ┴ LesAffx.51975.3.S1_at 2.09
No description available Les.4279.1.A1_at 2.04
No description available Les.1633.1.A1_at 2.03
No description available Les.2172.1.A1_at 2.01
Cytochrome c oxidase subunit 3 LesAffx.51975.4.S1_at 2.00
* Common genes that are differentially expressed due to Bacillus megaterium (Bm) inoculation in wild type and never ripe
plants under well watered conditions
┴ Common genes that are differentially expressed due to both bacterial inoculations in wild type plants under well
watered conditions

130
Chapter 1
In wt plants under D conditions, Bm inoculation caused 7 DEG
showing induction in 2 DEG and repression in 5 DEG (Table 1.3), but
no significant altered pathways were noticed.
Table 1.3 Differentially expressed genes over 2-fold due to Bacillus megaterium
inoculation in tomato Pearson cv. wild type under drought conditions
Gene ID Fold change
Genes induced by Bm inoculation
AtRABA6a; GTP binding LesAffx.65198.1.S1_at 2.41
Responsive to dessication 2; RD2 Les.2914.2.S1_at 2.07
Genes repressed by Bm inoculation
NTGP4 Les.1842.1.S1_at 4.20
Elongation factor 1 gamma-like protein Les.5230.1.S1_at 3.61
SANT/MYB domain protein; fsm1 ┴ Les.3716.1.S1_at 3.11
Cytochrome b559 beta chain; psbF LesAffx.65143.1.A1_at 2.64
Ethylene receptor-like protein; ETR6 Les.3465.1.S1_at 2.30
┴ Common genes that are differentially expressed due to both bacterial inoculations in wild type plants under drought
conditions
In nr plants under WW conditions, 34 DEG were observed due to
Bm inoculation which induced 5 DEG while decreased 29 DEG (Table
1.4). Furthermore, lipoxygenase and jasmonic acid biosynthesis
pathways were reduced due to decreased transcription of LOX1.1 and
two allene oxide synthase genes (AOS; cytochrome P450 CYP74C3
and CYP74C4). Flavonoid biosynthesis pathway was also reduced by
Bm inoculation due to a decreased transcription of chalcone synthase B
and hyosciamine 6-dioxygenase. Moreover, Bm inoculation also
reduced canavanine degradation pathway due to a decreased
transcription of arginase 2.

131
Chapter 1
Table 1.4 Differentially expressed genes over 2-fold due to Bacillus megaterium
inoculation in tomato Pearson cv. never ripe under well watered conditions
Gene ID Fold-change
Genes induced by Bm inoculation
Ca2+/H+ exchanger LesAffx.23546.1.S1_at 3.10
Ribosomal protein L2 Les.4399.2.S1_at 2.32
Chalcone reductase LesAffx.61328.1.S1_at 2.25
Ribosomal protein S7 LesAffx.33796.2.S1_at 2.22
Patatin-like protein 1 LesAffx.47467.1.S1_at 2.08
Genes repressed by Bm inoculation
Cysteine protease inhibitor, multicystatin; TMC Les.4820.1.S1_x_at 9.37
flavin reductase-related Les.2173.1.A1_at 7.00
MADS-box protein 15, Wound-induced proteinase inhibitor I
prepropeptide; PIIFLes.2971.2.A1_at 6.58
Peroxidase 27; PRXR7 Les.4692.1.S1_at 6.17
MADS-box protein 15, Wound-induced proteinase inhibitor I
prepropeptide; PIIFLes.2971.1.S1_at 5.37
Polyphenol oxidase F; PPO Les.4299.1.S1_at 4.44
Chalcone synthase B Les.4911.1.S1_at 4.41
Cytochrome P450 CYP74C3 Les.3986.1.S1_at 3.72
Hyoscyamine 6-dioxygenase , putative Les.4685.1.S1_at 3.63
Arginase 2; ARG2 Les.3299.2.A1_s_at 3.37
Germin-like protein LesAffx.7583.1.S1_at 2.98
Peroxidase 1 ┴ Les.5935.2.S1_at 2.93
Laccase Les.5030.1.S1_at 2.88
Cationic peroxidase isozyme 40K precursor LesAffx.53132.1.S1_at 2.77
Hydrolase, alpha/beta fold family protein LesAffx.24204.1.S1_at 2.73
Lipoxygenase A; LOX1.1 * Les.3668.1.S1_at 2.69
peroxidase 1 Les.5935.1.A1_at 2.66
Putative C-4 sterol methyl oxidase LesAffx.63154.1.S1_at 2.43
Nod26-like protein Les.5112.1.S1_at 2.35
3b-hydroxylase; 3OH-1 Les.10.1.S1_at 2.34
TPI Les.2902.1.S1_at 2.20
No description available Les.2922.1.S1_at 2.19
NAD-dependent epimerase/dehydratase LesAffx.44937.1.S1_at 2.17
Basic peroxidase swpb5 LesAffx.39.1.S1_at 2.13
Cytochrome P450 CYP74C4 Les.3466.1.S1_at 2.12
No description available Les.3210.2.A1_at 2.08
Peroxidase; TPX2 Les.203.1.S1_at 2.08
TPI Les.2902.2.A1_at 2.02
Expansin; EXP1 Les.191.1.S1_at 2.01
* Common genes that are differentially expressed due to Bacillus megaterium (Bm) inoculation in wild type and never
ripe plants under well watered conditions
┴ Common genes that are diferentially expressed due to both bacterial inoculations in never ripe plants under well
watered conditions
In nr plants under D conditions, Bm inoculation caused 10 DEG
showing induction in 7 DEG and repression in 3 DEG (Table 1.5). As

132
Chapter 1
observed in wt plants under D conditions, no significant changed
pathways were noticed.
Table 1.5 Differentially expressed genes over 2-fold due to Bacillus megaterium
inoculation in tomato Pearson cv. never ripe under drought conditions
Gene ID Fold-change
Genes induced by Bm inoculation
Unnamed protein product LesAffx.37715.1.S1_at 3.17
TPA: AT-hook motif nuclear localized protein 2 LesAffx.65906.1.S1_at 2.74
Phosphoglycerate/bisphosphoglycerate mutase family protein Les.5567.1.S1_at 2.55
Intracellular ribonuclease LX; rnalx Les.50.1.S1_at 2.38
(1-4)-beta-mannan endohydrolase, putative LesAffx.3610.1.A1_at 2.29
Nodulin MtN3 family protein Les.3157.1.S1_at 2.25
Thioredoxin Les.3221.1.S1_a_at 2.21
Genes repressed by Bm inoculation
No description available Les.2668.1.S1_at 2.26
Cytochrome c oxidase subunit 3 LesAffx.51975.3.S1_at 2.18
Hydroxyproline-rich glycoprotein homolog Les.3320.2.S1_at 2.10
Furthermore, LOX1.1 was the unique DEG affected in common
over 2-fold change threshold by Bm inoculation independently of plant
genotype under WW conditions, showing transcription repression
(Tables 1.2, 1.4).
Enterobacter C7 inoculation effects on transcriptomic profiles
As observed in Bm, most of DEG were specifically affected by
C7 inoculation in both plant genotypes and both watering regimes (Fig.
1.8 B). In case of C7 effects in wt plants under WW conditions, 582
DEG (457 specifically; 78.5 %) were noticed. 68 DEG were shared
with DEG affected by C7 inoculation in wt plants under D conditions.
Furthermore, 19 and 27 DEG were shared with C7-DEG in nr plants
under WW and D conditions, respectively. C7 inoculation affected 353
DEG (254 specifically; 72.0 %) in wt plants under D conditions. 17 and
7 DEG were shared with DEG affected by C7 in nr plants under WW

133
Chapter 1
and D conditions, respectively. In case of C7 inoculation effects on nr
plants under WW conditions, 504 DEG (443 specifically; 88.0 %) were
noticed. 16 DEG were shared with C7-DEG in nr plants under D
conditions. C7 inoculation affected 242 DEG (185 specifically; 76.5 %)
in nr plants under D conditions. Moreover, 4 and 2 C7-DEG were
noticed in common in wt plants under both watering regimes and in nr
plants under WW and D conditions, respectively. 4 C7-DEG were
shared in nr plants under both watering regimes and wt plants under
WW. Finally, only one DEG affected by C7 was shared in both plant
genotypes and both watering regimes (Fig. 1.8 B).
Furthermore, several DEG were noticed due to C7 inoculation
with a fold change over two in wt and nr plants under WW and D
conditions (Tables 1.6-9) and Plant MetGenMap also identified several
changed pathways. 36 DEG were observed in wt plants under WW
conditions due to C7 inoculation showing induction of 3 DEG and
repression of 33 DEG (Table 1.6). C7 inoculation induced cyanate
degradation pathway due to increased transcription of carbonic
anhydrase (Ca3).
Table 1.6 Differentially expressed genes over 2-fold due to Enterobacter C7
inoculation in tomato Pearson cv. wild type under well watered conditions
Gene ID Fold change
Genes induced by C7 inoculation
Pathogenesis-related protein 4; P4 Les.4693.1.S1_at 6.84
Carbonic anhydrase; Ca3 Les.796.1.A1_at 4.71
Glucan endo-1,3-beta-D-glucosidase; Q`a Les.3653.1.S1_at 4.04
Genes repressed by C7 inoculation
Photosystem II 44 kDa protein ┴ LesAffx.66410.1.S1_at 6.14
Cytochrome c oxidase subunit 3 ┴ LesAffx.51975.3.S1_at 3.49
NAD(P)H-quinone oxidoreductase subunit 1; NDH subunit 1 LesAffx.44224.1.S1_at 3.15
GUN4 (Genomes uncoupled 4) LesAffx.41330.2.S1_at 3.10
Photosystem I assembly protein Ycf4 LesAffx.482.1.S1_at 3.03
Succinate dehydrogenase subunit 3 ┴ LesAffx.15544.1.S1_at 2.92
Cytochrome c oxidase subunit 3 LesAffx.51975.2.S1_at 2.85
Photosystem II 47 kDa protein ┴ Les.4293.1.A1_at 2.74
Ribosomal protein S7 LesAffx.33796.2.S1_at 2.71
ATP synthase CF1 alpha chain Les.5834.1.S1_at 2.68
Cytochrome f LesAffx.51226.1.A1_at 2.64
ACR toxin-sensitivity inducing protein LesAffx.3698.2.A1_at 2.52
Centromeric protein-related Les.573.1.A1_at 2.48
Ribosomal protein L2 Les.4399.2.S1_at 2.47
Ribosomal protein S3 LesAffx.18735.1.S1_at 2.40
Unknow protein LesAffx.71664.1.S1_at 2.39
Putative ankyrin LesAffx.21763.2.S1_at 2.38
Ammonium transporter 1 member 3; LeAMT1;3 Les.3509.1.S1_at 2.37
Phagocytosis and cell motility protein ELMO1-related Les.3322.1.S1_at 2.35
Photosystem II protein N LesAffx.18338.1.S1_at 2.28
UDP-glucose:glucosyltransferase Les.842.1.S1_at 2.26
Probable U6 snRNA-associated Sm-like protein LSm4, Glycine-rich
protein 10; GRP 10Les.2940.2.S1_at 2.26
ATP synthase CF0 A subunit LesAffx.70834.1.S1_at 2.21
GUN4 (Genomes uncoupled 4) LesAffx.41330.1.A1_at 2.20
Tyrosine-rich hydroxyproline-rich glycoprotein; extensin (class I) Les.3606.1.S1_at 2.18
Probable U6 snRNA-associated Sm-like protein LSm4, Glycine-rich
protein 10; GRP 10Les.2940.2.S1_s_at 2.12
UDP-glucose:glucosyltransferase Les.842.2.S1_a_at 2.12
NAD(P)H-quinone oxidoreductase subunit 1; NDH subunit 1 LesAffx.44224.1.A1_at 2.08
photosystem I assembly protein Ycf3 Les.4298.1.S1_s_at 2.08
ribosomal protein S12 LesAffx.3499.2.A1_at 2.05
Ribosomal protein S12 LesAffx.3499.1.S1_at 2.03
MOS4 Les.4255.2.S1_at 2.03
Sulfate transporter 2; ST2 Les.3479.1.S1_at 2.00
┴ Common genes that are differentially expressed due to both bacterial inoculations in wild type plants under well
watered conditions

134
Chapter 1
Gene ID Fold change
Genes induced by C7 inoculation
Pathogenesis-related protein 4; P4 Les.4693.1.S1_at 6.84
Carbonic anhydrase; Ca3 Les.796.1.A1_at 4.71
Glucan endo-1,3-beta-D-glucosidase; Q`a Les.3653.1.S1_at 4.04
Genes repressed by C7 inoculation
Photosystem II 44 kDa protein ┴ LesAffx.66410.1.S1_at 6.14
Cytochrome c oxidase subunit 3 ┴ LesAffx.51975.3.S1_at 3.49
NAD(P)H-quinone oxidoreductase subunit 1; NDH subunit 1 LesAffx.44224.1.S1_at 3.15
GUN4 (Genomes uncoupled 4) LesAffx.41330.2.S1_at 3.10
Photosystem I assembly protein Ycf4 LesAffx.482.1.S1_at 3.03
Succinate dehydrogenase subunit 3 ┴ LesAffx.15544.1.S1_at 2.92
Cytochrome c oxidase subunit 3 LesAffx.51975.2.S1_at 2.85
Photosystem II 47 kDa protein ┴ Les.4293.1.A1_at 2.74
Ribosomal protein S7 LesAffx.33796.2.S1_at 2.71
ATP synthase CF1 alpha chain Les.5834.1.S1_at 2.68
Cytochrome f LesAffx.51226.1.A1_at 2.64
ACR toxin-sensitivity inducing protein LesAffx.3698.2.A1_at 2.52
Centromeric protein-related Les.573.1.A1_at 2.48
Ribosomal protein L2 Les.4399.2.S1_at 2.47
Ribosomal protein S3 LesAffx.18735.1.S1_at 2.40
Unknow protein LesAffx.71664.1.S1_at 2.39
Putative ankyrin LesAffx.21763.2.S1_at 2.38
Ammonium transporter 1 member 3; LeAMT1;3 Les.3509.1.S1_at 2.37
Phagocytosis and cell motility protein ELMO1-related Les.3322.1.S1_at 2.35
Photosystem II protein N LesAffx.18338.1.S1_at 2.28
UDP-glucose:glucosyltransferase Les.842.1.S1_at 2.26
Probable U6 snRNA-associated Sm-like protein LSm4, Glycine-rich
protein 10; GRP 10Les.2940.2.S1_at 2.26
ATP synthase CF0 A subunit LesAffx.70834.1.S1_at 2.21
GUN4 (Genomes uncoupled 4) LesAffx.41330.1.A1_at 2.20
Tyrosine-rich hydroxyproline-rich glycoprotein; extensin (class I) Les.3606.1.S1_at 2.18
Probable U6 snRNA-associated Sm-like protein LSm4, Glycine-rich
protein 10; GRP 10Les.2940.2.S1_s_at 2.12
UDP-glucose:glucosyltransferase Les.842.2.S1_a_at 2.12
NAD(P)H-quinone oxidoreductase subunit 1; NDH subunit 1 LesAffx.44224.1.A1_at 2.08
photosystem I assembly protein Ycf3 Les.4298.1.S1_s_at 2.08
ribosomal protein S12 LesAffx.3499.2.A1_at 2.05
Ribosomal protein S12 LesAffx.3499.1.S1_at 2.03
MOS4 Les.4255.2.S1_at 2.03
Sulfate transporter 2; ST2 Les.3479.1.S1_at 2.00
┴ Common genes that are differentially expressed due to both bacterial inoculations in wild type plants under well
watered conditions
In wt plants under D conditions, C7 inoculation caused 7 DEG
showing induction in 3 DEG and repression in 4 DEG (Table 1.7), but
no significant altered pathways were observed.
Table 1.7 Differentially expressed genes over 2-fold due to Enterobacter C7
inoculation in tomato Pearson cv. wild type under drought conditions
Gene ID Fold change
Genes induced by C7 inoculation
Heat shock cognate 70 kDa protein 1 Les.1936.1.S1_at 3.74
Protease inhibitor/seed storage/lipid transfer protein (LTP) family
proteinLesAffx.22413.1.S1_at 2.80
Intracellular ribonuclease LX; rnlax Les.50.1.S1_at 2.01
Genes repressed by C7 inoculation
Non-specific lipid-transfer protein 2; LTP 2 Les.1389.1.S1_at 2.73
SANT/MYB domain protein; fms1 ┴ Les.3716.1.S1_at 2.66
Unknown Les.358.1.S1_at 2.08
Allantoinase/ hydrolase; ATALN Les.3319.3.S1_at 2.05
┴ Common genes that are differentially expressed due to both bacterial inoculations in wild type plants under drought
conditions

135
Chapter 1
In nr plants under WW conditions, 23 DEG were observed due to
C7 inoculation which induced 12 DEG while decreased 11 DEG (Table
1.8). Ethylene biosynthesis from methionine and methionine salvage II
pathways were altered due to induction of one ACS gene.
Table 1.8 Differentially expressed genes over 2-fold due to Enterobacter C7
inoculation in tomato Pearson cv. never ripe under well watered conditions
Gene ID Fold change
Genes induced by C7 inoculation
IAA2 Les.3707.1.S1_at 2.60
No description available Les.876.1.A1_at 2.53
No description available Les.2261.1.A1_at 2.38
Putative acid phosphatase; TPSI1 Les.3614.1.S1_at 2.36
IAA2 Les.3707.1.A1_at 2.33
F-box-containing protein 1 LesAffx.41381.1.S1_at 2.33
Polygalacturonase-like protein Les.857.1.S1_at 2.27
Peroxidase LesAffx.53517.1.S1_at 2.17
No description available Les.1776.1.A1_at 2.11
euFUL FRUITFULL-like MADS-box Les.4339.1.S1_at 2.08
Protease inhibitor/seed storage/lipid transfer protein (LTP) family
proteinLesAffx.22413.1.S1_at 2.03
1-aminocyclopropane-1-carboxylate synthase Les.3475.1.S1_at 2.01
Genes repressed by C7 inoculation
No description available Les.1175.2.S1_at 3.55
Peroxidase 1 ┴ Les.5935.2.S1_at 2.84
ELI3 Les.3741.1.S1_at 2.67
UDP-glucose:glucosyltransferase LesAffx.62420.1.S1_at 2.33
Hypothetical protein Les.2001.1.S1_at 2.29
Shikimate kinase family protein Les.1859.3.S1_at 2.26
protease inhibitor/seed storage/lipid transfer protein (LTP) family
proteinLesAffx.67592.1.S1_at 2.21
Alternative oxidase 1c Les.4337.1.S1_at 2.15
Transporter, putative, expressed LesAffx.55549.1.S1_at 2.10
Pathogen-related protein LesAffx.71065.1.S1_at 2.10
bHLH transcriptional regulator; fer • Les.3814.1.S1_at 2.07
• Common genes that are differentially expressed due to Enterobacter C7 (C7) inoculation in never ripe plants under well
watered and drought conditions
┴ Common genes that are differentially expressed due to both bacterial inoculations in never ripe plants under well
watered conditions
In nr plants under D conditions, C7 inoculation only showed
repression of 24 DEG (Table 1.9). Moreover, tyrosine and
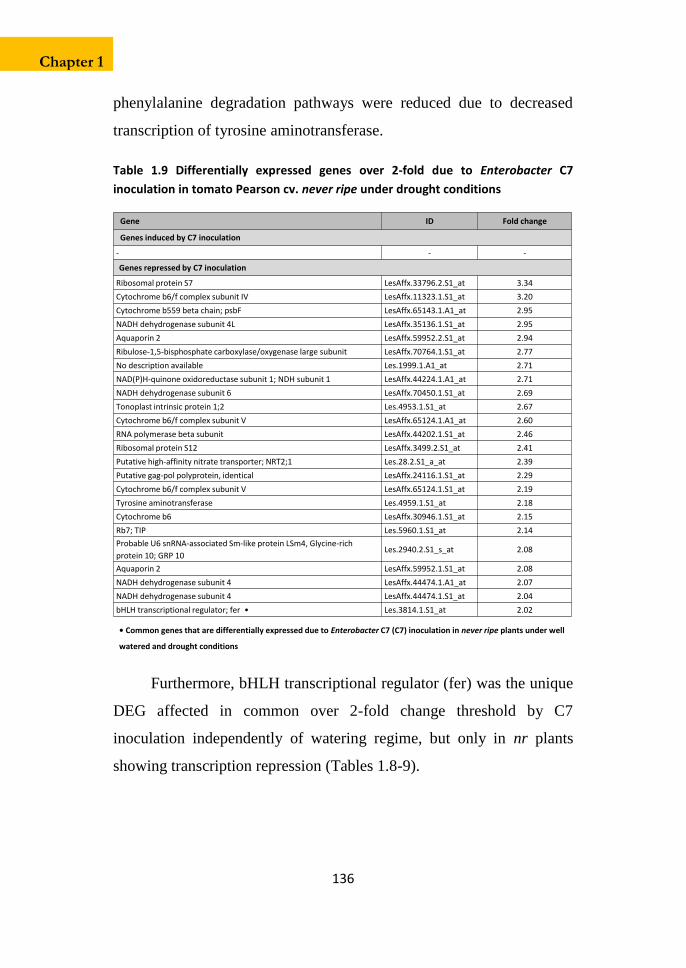
136
Chapter 1
phenylalanine degradation pathways were reduced due to decreased
transcription of tyrosine aminotransferase.
Table 1.9 Differentially expressed genes over 2-fold due to Enterobacter C7
inoculation in tomato Pearson cv. never ripe under drought conditions
Gene ID Fold change
Genes induced by C7 inoculation
- - -
Genes repressed by C7 inoculation
Ribosomal protein S7 LesAffx.33796.2.S1_at 3.34
Cytochrome b6/f complex subunit IV LesAffx.11323.1.S1_at 3.20
Cytochrome b559 beta chain; psbF LesAffx.65143.1.A1_at 2.95
NADH dehydrogenase subunit 4L LesAffx.35136.1.S1_at 2.95
Aquaporin 2 LesAffx.59952.2.S1_at 2.94
Ribulose-1,5-bisphosphate carboxylase/oxygenase large subunit LesAffx.70764.1.S1_at 2.77
No description available Les.1999.1.A1_at 2.71
NAD(P)H-quinone oxidoreductase subunit 1; NDH subunit 1 LesAffx.44224.1.A1_at 2.71
NADH dehydrogenase subunit 6 LesAffx.70450.1.S1_at 2.69
Tonoplast intrinsic protein 1;2 Les.4953.1.S1_at 2.67
Cytochrome b6/f complex subunit V LesAffx.65124.1.A1_at 2.60
RNA polymerase beta subunit LesAffx.44202.1.S1_at 2.46
Ribosomal protein S12 LesAffx.3499.2.S1_at 2.41
Putative high-affinity nitrate transporter; NRT2;1 Les.28.2.S1_a_at 2.39
Putative gag-pol polyprotein, identical LesAffx.24116.1.S1_at 2.29
Cytochrome b6/f complex subunit V LesAffx.65124.1.S1_at 2.19
Tyrosine aminotransferase Les.4959.1.S1_at 2.18
Cytochrome b6 LesAffx.30946.1.S1_at 2.15
Rb7; TIP Les.5960.1.S1_at 2.14
Probable U6 snRNA-associated Sm-like protein LSm4, Glycine-rich
protein 10; GRP 10Les.2940.2.S1_s_at 2.08
Aquaporin 2 LesAffx.59952.1.S1_at 2.08
NADH dehydrogenase subunit 4 LesAffx.44474.1.A1_at 2.07
NADH dehydrogenase subunit 4 LesAffx.44474.1.S1_at 2.04
bHLH transcriptional regulator; fer • Les.3814.1.S1_at 2.02
• Common genes that are differentially expressed due to Enterobacter C7 (C7) inoculation in never ripe plants under well
watered and drought conditions
Furthermore, bHLH transcriptional regulator (fer) was the unique
DEG affected in common over 2-fold change threshold by C7
inoculation independently of watering regime, but only in nr plants
showing transcription repression (Tables 1.8-9).

137
Chapter 1
Differences between Bacillus megaterium and Enterobacter C7
inoculation effects on transcriptomic profiles
Number of DEG was increased when PGPB were compared
between each other regarding comparisons with non-inoculated plants,
but most of DEG were also specifically affected in both plant
genotypes and both watering regimes (Fig. 1.8 C). PGPB comparison
showed 1579 DEG (1337 specifically; 84.7 %) in wt plants under WW
conditions. 110 DEG were shared with those affected between inocula
in wt plants under D conditions. Moreover, 72 and 40 DEG were
shared with those in nr plants under WW and D conditions,
respectively. Comparison between PGPB affected 904 DEG (624
specifically; 69.0 %) in wt plants under D conditions. 87 and 64 DEG
were shared with those in nr plants under WW and D conditions,
respectively. In comparison between PGPB effects on nr plants under
WW conditions, 947 DEG (746 specifically; 78.8 %) were noticed. 25
DEG were shared with those in nr plants under D conditions. In PGPB
comparison in nr plants under D conditions 425 DEG (284 specifically;
66.8 %) were noticed. Moreover, 10 and 5 DEG were shared in wt
plants under both watering regimes and in nr plants under WW and D
conditions, respectively. 3 and 2 DEG were noticed in common in nr
plants under both watering regimes and wt plants under WW and D
conditions, respectively. Finally, only 2 DEG were shared in both plant
genotypes and both watering regimes (Fig. 1.8 C).
Additionally, direct comparison between both PGPB strains also
showed several DEG with a fold change over two in both plant
genotypes and under both watering regimes (Tables 1.10-13) and Plant
MetGenMap identified several changed pathways. In wt plants under

138
Chapter 1
WW conditions, 53 DEG were noticed between Bm and C7
inoculations, showing 11 DEG induction by C7 inoculation regarding
Bm-inoculated plants and 42 DEG opposite pattern (Table 1.10). Five
pathways were significantly reduced in C7- regarding Bm-inoculated
plants. The xanthofile cycle pathway was decreased due to
transcriptional reduction of violaxanthin de-epoxidase. The dTDP-L-
rhamnose biosynthesis II pathway was also reduced by a transcriptional
decrease of NAD-dependent epimerase/dehydratase family protein-like
gene. Transcriptional reduction of glycine hydroxymethyltransferase
(Cytochrome P450 76A2) decreased glycine betaine degradation,
formaldehyde assimilation I and superpathway of serine and glycine
biosynthesis II pathways. Moreover, four DEG were affected in
common over 2-fold change in comparison between both Bm and C7
inoculations in wt plants under WW conditions. Succinate
dehydrogenase subunit 3, photosystem II 44 kDa protein, photosystem
II 47 kDa protein and cytochrome c oxidase subunit were repressed due
to both bacterial inoculations (Tables 1.2, 1.6).
Table 1.10 Differentially expressed genes over 2-fold between Bacillus
megaterium- and Enterobacter C7-inoculated tomato Pearson cv. wild type under
well watered conditions
Gene ID Fold change
Genes induced by C7 inoculation regarding Bm-inoculated plants
Pathogenesis-related protein 4; P4 Les.4693.1.S1_at 6.82
MADS-box protein 15, Wound-induced proteinase inhibitor I
prepropeptide; PIIFLes.2971.2.A1_at 5.73
MADS-box protein 15, Wound-induced proteinase inhibitor I
prepropeptide; PIIFLes.2971.1.S1_at 4.28
26S proteasome regulatory particle non-ATPase subunit 8 • LesAffx.31317.17.A1_at 2.69
No description available Les.766.1.A1_at 2.35
Nodulin MtN3 family protein Les.3157.1.S1_at 2.32
Lactuca sativa short-chain dehydrogenase/reductase 2 LesAffx.68802.1.S1_at 2.24
Thiamine biosynthesis family protein / thiC family protein Les.4594.1.S1_at 2.17
H1 histone-like protein Les.3317.1.S1_at 2.04
No description available Les.1988.1.A1_at 2.03
Unnamed protein product Les.4065.1.A1_at 2.03
Genes induced by Bm inoculation regarding C7-inoculated plants
Glutathione S-transferase LesAffx.57342.1.S1_at 5.85
GUN4 (Genomes uncoupled 4) LesAffx.41330.2.S1_at 4.48
Flavonoid 3-glucosyl transferase LesAffx.63776.1.S1_at 4.00
Putative anthocyanin permease Les.4452.1.S1_at 3.93
Putative cell surface adhesion protein LesAffx.46503.1.S1_at 3.65
Contains 2 PF|00400 WD40, G-beta repeats. Les.424.2.S1_at 3.33
Ammonium transporter 1 member 3; LeAMT1;3 Les.3509.1.S1_at 3.04
GUN4 (Genomes uncoupled 4) LesAffx.41330.1.A1_at 2.98
Cysteine protease 14 LesAffx.69261.1.S1_at 2.72
Ribosomal protein S7 LesAffx.33796.2.S1_at 2.70
Cytochrome P450 76A2 Les.3127.3.S1_at 2.70
Photosystem II 44 kDa protein LesAffx.66410.1.S1_at 2.64
Ripening-related protein-like; hydrolase-like LesAffx.49809.1.S1_at 2.56
Contains 2 PF|00400 WD40, G-beta repeats. Les.3981.1.S1_at 2.55
SOUL heme-binding family protein LesAffx.59056.1.S1_at 2.51
Unknown LesAffx.26570.1.S1_at 2.49
UDP-glucose:glucosyltransferase Les.842.1.S1_at 2.45
Glutathione transferase LesAffx.64054.1.S1_at 2.35
CONSTANS interacting protein 1; CIP1 Les.3376.2.S1_at 2.34
O-diphenol-O-methyl transferase, putative Les.5506.1.S1_at 2.33
NAD-dependent epimerase/dehydratase family protein-like protein, GDP-
mannose 3',5'-epimerase; GME1Les.3214.2.S1_at 2.31
Unnamed protein product LesAffx.71003.1.S1_at 2.27
No description available Les.3318.2.S1_at 2.27
Membrane lipoprotein lipid attachment site-containing protein -like LesAffx.59507.1.S1_at 2.23
Galacturonosyltransferase-like 2; GATL2 LesAffx.32379.1.S1_at 2.22
Putative aspartic proteinase nepenthesin I LesAffx.56820.1.S1_at 2.20
Violaxanthin de-epoxidase Les.3958.1.S1_at 2.20
No description available Les.3006.2.S1_at 2.19
Heat shock protein binding / unfolded protein binding LesAffx.50432.1.S1_at 2.17
No description available Les.1816.1.S1_at 2.17
Intracellular ribonuclease LX; rnalx Les.50.1.S1_at 2.15
UDP-glucose:glucosyltransferase Les.842.2.S1_a_at 2.15
26S proteasome non-ATPase regulatory subunit 3 Les.3119.2.S1_at 2.12
Cytochrome P450-dependent fatty acid hydroxylase LesAffx.295.2.S1_at 2.12
Phosphatidate cytidylyltransferase family protein Les.3175.1.S1_at 2.11
Putative enoyl-CoA hydratase/isomerase LesAffx.31406.1.S1_at 2.08
No description available Les.656.1.A1_at 2.08
Os05g0404400 LesAffx.26495.1.S1_at 2.07
No description available Les.3038.1.S1_at 2.07
Non-intrinsic ABC protein 9; ATNAP9 LesAffx.21557.1.S1_at 2.04
No description available Les.656.2.S1_at 2.03
Elongation factor TuB; EF-TuB Les.2942.3.S1_at 2.00
• Common genes that are differentially expressed between Bacillus megaterium and Enterobacter C7-inoculated plants
in wild type plants under well watered and drought conditions

139
Chapter 1
Gene ID Fold change
Genes induced by C7 inoculation regarding Bm-inoculated plants
Pathogenesis-related protein 4; P4 Les.4693.1.S1_at 6.82
MADS-box protein 15, Wound-induced proteinase inhibitor I
prepropeptide; PIIFLes.2971.2.A1_at 5.73
MADS-box protein 15, Wound-induced proteinase inhibitor I
prepropeptide; PIIFLes.2971.1.S1_at 4.28
26S proteasome regulatory particle non-ATPase subunit 8 • LesAffx.31317.17.A1_at 2.69
No description available Les.766.1.A1_at 2.35
Nodulin MtN3 family protein Les.3157.1.S1_at 2.32
Lactuca sativa short-chain dehydrogenase/reductase 2 LesAffx.68802.1.S1_at 2.24
Thiamine biosynthesis family protein / thiC family protein Les.4594.1.S1_at 2.17
H1 histone-like protein Les.3317.1.S1_at 2.04
No description available Les.1988.1.A1_at 2.03
Unnamed protein product Les.4065.1.A1_at 2.03
Genes induced by Bm inoculation regarding C7-inoculated plants
Glutathione S-transferase LesAffx.57342.1.S1_at 5.85
GUN4 (Genomes uncoupled 4) LesAffx.41330.2.S1_at 4.48
Flavonoid 3-glucosyl transferase LesAffx.63776.1.S1_at 4.00
Putative anthocyanin permease Les.4452.1.S1_at 3.93
Putative cell surface adhesion protein LesAffx.46503.1.S1_at 3.65
Contains 2 PF|00400 WD40, G-beta repeats. Les.424.2.S1_at 3.33
Ammonium transporter 1 member 3; LeAMT1;3 Les.3509.1.S1_at 3.04
GUN4 (Genomes uncoupled 4) LesAffx.41330.1.A1_at 2.98
Cysteine protease 14 LesAffx.69261.1.S1_at 2.72
Ribosomal protein S7 LesAffx.33796.2.S1_at 2.70
Cytochrome P450 76A2 Les.3127.3.S1_at 2.70
Photosystem II 44 kDa protein LesAffx.66410.1.S1_at 2.64
Ripening-related protein-like; hydrolase-like LesAffx.49809.1.S1_at 2.56
Contains 2 PF|00400 WD40, G-beta repeats. Les.3981.1.S1_at 2.55
SOUL heme-binding family protein LesAffx.59056.1.S1_at 2.51
Unknown LesAffx.26570.1.S1_at 2.49
UDP-glucose:glucosyltransferase Les.842.1.S1_at 2.45
Glutathione transferase LesAffx.64054.1.S1_at 2.35
CONSTANS interacting protein 1; CIP1 Les.3376.2.S1_at 2.34
O-diphenol-O-methyl transferase, putative Les.5506.1.S1_at 2.33
NAD-dependent epimerase/dehydratase family protein-like protein, GDP-
mannose 3',5'-epimerase; GME1Les.3214.2.S1_at 2.31
Unnamed protein product LesAffx.71003.1.S1_at 2.27
No description available Les.3318.2.S1_at 2.27
Membrane lipoprotein lipid attachment site-containing protein -like LesAffx.59507.1.S1_at 2.23
Galacturonosyltransferase-like 2; GATL2 LesAffx.32379.1.S1_at 2.22
Putative aspartic proteinase nepenthesin I LesAffx.56820.1.S1_at 2.20
Violaxanthin de-epoxidase Les.3958.1.S1_at 2.20
No description available Les.3006.2.S1_at 2.19
Heat shock protein binding / unfolded protein binding LesAffx.50432.1.S1_at 2.17
No description available Les.1816.1.S1_at 2.17
Intracellular ribonuclease LX; rnalx Les.50.1.S1_at 2.15
UDP-glucose:glucosyltransferase Les.842.2.S1_a_at 2.15
26S proteasome non-ATPase regulatory subunit 3 Les.3119.2.S1_at 2.12
Cytochrome P450-dependent fatty acid hydroxylase LesAffx.295.2.S1_at 2.12
Phosphatidate cytidylyltransferase family protein Les.3175.1.S1_at 2.11
Putative enoyl-CoA hydratase/isomerase LesAffx.31406.1.S1_at 2.08
No description available Les.656.1.A1_at 2.08
Os05g0404400 LesAffx.26495.1.S1_at 2.07
No description available Les.3038.1.S1_at 2.07
Non-intrinsic ABC protein 9; ATNAP9 LesAffx.21557.1.S1_at 2.04
No description available Les.656.2.S1_at 2.03
Elongation factor TuB; EF-TuB Les.2942.3.S1_at 2.00
• Common genes that are differentially expressed between Bacillus megaterium and Enterobacter C7-inoculated plants
in wild type plants under well watered and drought conditions
In wt plants under D conditions, 30 DEG were noticed between
Bm and C7 inoculations, showing 21 DEG induction by C7 inoculation
regarding Bm-inoculated plants and 9 DEG opposite pattern (Table
1.11). Moreover, several pathways were significantly induced in C7-

140
Chapter 1
regarding Bm-inoculated plants. Lipoxygenase and jasmonic acid
biosynthesis pathways were induced due to transcriptional induction of
LOX1.1 and AOS (cytochrome P450 CYP74C3). Furthermore, C7
inoculation compared to Bm inoculation increased transcription of
arginase 2 which significantly affected to canavanine degradation,
arginine degradation, citrulline metabolism and urea cycle pathways.
Moreover, only SANT/MYB domain protein (fsm1) was repressed in
common over 2-fold change in comparison between both Bm and C7
inoculations in wt plants under D conditions (Tables 1.3, 1.7).
Table 1.11 Differentially expressed genes over 2-fold between Bacillus
megaterium- and Enterobacter C7-inoculated tomato Pearson cv. wild type under
well watered conditions
Gene ID Fold change
Genes induced by C7 inoculation regarding Bm-inoculated plants
NTGP4 Les.1842.1.S1_at 4.24
Cytochrome P450 CYP74C3 Les.3986.1.S1_at 3.86
Cytochrome b559 beta chain; psbF * LesAffx.65143.1.A1_at 3.71
Elongation factor 1 gamma-like protein Les.5230.1.S1_at 3.58
Cytochrome b6/f complex subunit IV * LesAffx.11323.1.A1_at 3.57
Cytochrome b559 beta chain; psbF * LesAffx.65143.1.S1_at 3.51
Cytochrome b6/f complex subunit V * LesAffx.65124.1.A1_at 2.70
Protease inhibitor/seed storage/lipid transfer protein (LTP) family protein LesAffx.22413.1.S1_at 2.65
26S proteasome regulatory particle non-ATPase subunit 8 • LesAffx.31317.17.A1_at 2.49
Lipoxygenase A; LOX1.1 Les.3668.1.S1_at 2.44
No description available Les.4510.3.A1_at 2.42
NADH dehydrogenase subunit 4 LesAffx.44474.1.S1_at 2.41
Putative gag-pol polyprotein LesAffx.24116.1.A1_at 2.40
Cytochrome b6/f complex subunit V * LesAffx.65124.1.S1_at 2.40
Arginase 2; ARG2 Les.3299.1.S1_at 2.36
Ribosomal protein L1 family protein Les.986.1.S1_at 2.33
Hypothetical protein Poptr_cp075 Les.4272.3.S1_at 2.26
No description available Les.2358.1.A1_at 2.18
Zinc finger (AN1-like) family protein LesAffx.3163.2.S1_at 2.09
Systemin Les.266.1.S1_a_at 2.06
CYP81C6v2 LesAffx.40179.1.S1_at 2.02
Genes induced by Bm inoculation regarding C7-inoculated plants
No description available Les.3288.1.A1_at 2.80
TPA: AT-hook motif nuclear localized protein 2 LesAffx.65906.1.S1_at 2.44
F-box-containing protein 1 LesAffx.41381.1.S1_at 2.22
Contains 2 PF|00400 WD40, G-beta repeats. Les.4334.2.S1_at 2.18
No description available Les.3761.1.S1_at 2.10
Putative 3'(2'),5'-bisphosphate nucleotidase LesAffx.69601.1.S1_at 2.07
Responsive to dessication 2; RD2 * Les.2914.2.S1_at 2.04
Putative 3'(2'),5'-bisphosphate nucleotidase LesAffx.69601.2.S1_at 2.00
Contains 2 PF|00400 WD40, G-beta repeats. Les.4334.3.A1_at 2.00
* Common genes that are differentially expressed between Bacillus megaterium and Enterobacter C7-inoculated in wild
type and never ripe plants under drought conditions
• Common genes that are differentially expressed between Bacillus megaterium and Enterobacter C7-inoculated wild
type plants under well watered and drought conditions

141
Chapter 1
Gene ID Fold change
Genes induced by C7 inoculation regarding Bm-inoculated plants
NTGP4 Les.1842.1.S1_at 4.24
Cytochrome P450 CYP74C3 Les.3986.1.S1_at 3.86
Cytochrome b559 beta chain; psbF * LesAffx.65143.1.A1_at 3.71
Elongation factor 1 gamma-like protein Les.5230.1.S1_at 3.58
Cytochrome b6/f complex subunit IV * LesAffx.11323.1.A1_at 3.57
Cytochrome b559 beta chain; psbF * LesAffx.65143.1.S1_at 3.51
Cytochrome b6/f complex subunit V * LesAffx.65124.1.A1_at 2.70
Protease inhibitor/seed storage/lipid transfer protein (LTP) family protein LesAffx.22413.1.S1_at 2.65
26S proteasome regulatory particle non-ATPase subunit 8 • LesAffx.31317.17.A1_at 2.49
Lipoxygenase A; LOX1.1 Les.3668.1.S1_at 2.44
No description available Les.4510.3.A1_at 2.42
NADH dehydrogenase subunit 4 LesAffx.44474.1.S1_at 2.41
Putative gag-pol polyprotein LesAffx.24116.1.A1_at 2.40
Cytochrome b6/f complex subunit V * LesAffx.65124.1.S1_at 2.40
Arginase 2; ARG2 Les.3299.1.S1_at 2.36
Ribosomal protein L1 family protein Les.986.1.S1_at 2.33
Hypothetical protein Poptr_cp075 Les.4272.3.S1_at 2.26
No description available Les.2358.1.A1_at 2.18
Zinc finger (AN1-like) family protein LesAffx.3163.2.S1_at 2.09
Systemin Les.266.1.S1_a_at 2.06
CYP81C6v2 LesAffx.40179.1.S1_at 2.02
Genes induced by Bm inoculation regarding C7-inoculated plants
No description available Les.3288.1.A1_at 2.80
TPA: AT-hook motif nuclear localized protein 2 LesAffx.65906.1.S1_at 2.44
F-box-containing protein 1 LesAffx.41381.1.S1_at 2.22
Contains 2 PF|00400 WD40, G-beta repeats. Les.4334.2.S1_at 2.18
No description available Les.3761.1.S1_at 2.10
Putative 3'(2'),5'-bisphosphate nucleotidase LesAffx.69601.1.S1_at 2.07
Responsive to dessication 2; RD2 * Les.2914.2.S1_at 2.04
Putative 3'(2'),5'-bisphosphate nucleotidase LesAffx.69601.2.S1_at 2.00
Contains 2 PF|00400 WD40, G-beta repeats. Les.4334.3.A1_at 2.00
* Common genes that are differentially expressed between Bacillus megaterium and Enterobacter C7-inoculated in wild
type and never ripe plants under drought conditions
• Common genes that are differentially expressed between Bacillus megaterium and Enterobacter C7-inoculated wild
type plants under well watered and drought conditions
In nr plants under WW conditions, 90 DEG were observed
between Bm and C7 inoculations, showing 52 DEG induction by C7
inoculation regarding Bm-inoculated plants and 38 DEG opposite
pattern (Table 1.12). Several pathways were significantly induced in
C7- regarding Bm-inoculated plants. C7 regarding Bm inoculation
induced transcription of two arginase 2 genes which significantly
affected to canavanine degradation, arginine degradation, citrulline
metabolism and urea cycle pathways. Additionally, ethylene
biosynthesis from methionine and methionine salvage II pathways were
also induced in C7- compared to Bm-inoculated plants due to
transcriptional induction of two ACS genes. Moreover, only peroxidase
1 was repressed in common over 2-fold change in comparison between
both Bm and C7 inoculations in nr plants under WW conditions
(Tables 1.4, 1.8).
Table 1.12 Differentially expressed genes over 2-fold between Bacillus
megaterium- and Enterobacter C7-inoculated tomato Pearson cv. never ripe under
well watered conditions
Gene ID Fold change
Genes induced by C7 inoculation regarding Bm-inoculated plants
Defective in induced resistance; DIR1 LesAffx.124.1.S1_at 12.66
Defective in induced resistance; DIR1 LesAffx.66472.1.S1_at 8.18
Contains similarity to proline-rich protein LesAffx.44139.1.S1_at 5.26
Endo-1,4-beta-glucanase precursor; cel1 Les.3667.1.S1_at 4.94
Tumor-related protein LesAffx.823.1.S1_at 4.42
Catechol oxidase, Polyphenol oxidase F; PPO Les.4299.1.S1_at 4.34
Germin-like protein LesAffx.64062.1.S1_at 4.29
DNA-binding protein LesAffx.12514.1.S1_at 4.24
Auxin-induced SAUR-like protein LesAffx.1251.1.S1_at 4.24
Arginase 2; ARG2 Les.3299.2.A1_s_at 4.10
No description available Les.1379.1.A1_at 4.02
Gamma-thionin Les.3559.1.A1_at 3.89
Arginase 2; ARG2 LesAffx.1.1.S1_at 3.78
Protease inhibitor/seed storage/lipid transfer protein (LTP) family protein LesAffx.22413.1.S1_at 3.73
Cationic peroxidase isozyme 40K precursor LesAffx.53132.1.S1_at 3.71
No description available Les.2261.1.A1_at 3.67
Protease inhibitor/seed storage/lipid transfer protein (LTP) family protein Les.2696.1.S1_at 3.64
36.4 kDa proline-rich protein; TPRP-F1 Les.3273.1.S1_at 3.52
Protein GAST1 Les.827.1.S1_at 3.17
No description available Les.647.1.A1_at 3.09
No description available Les.2207.1.A1_at 2.93
Putative C-4 sterol methyl oxidase LesAffx.63154.1.S1_at 2.93
Polygalacturonase-like protein Les.857.1.S1_at 2.84
Pectin methylesterase Les.218.3.S1_at 2.80
Proteinase inhibitor I4, serpin LesAffx.48076.1.S1_at 2.72
1-aminocyclopropane-1-carboxylate synthase 7; ACS7B Les.3474.1.S1_at 2.71
AMP-binding protein, putative Les.5150.1.S1_at 2.67
Pectin methylesterase Les.218.1.S1_at 2.65
No description available Les.1776.1.A1_at 2.62
Phosphoethanolamine N-methyltransferase Les.4710.1.S1_at 2.55
Drought-induced protein SDi-6, metallothionein II-like protein; MTA Les.4077.1.S1_at 2.44
No description available Les.1721.2.S1_at 2.42
Hydrolase, alpha/beta fold family protein LesAffx.24204.1.S1_at 2.39
1-aminocyclopropane-1-carboxylate synthase; ACS8 Les.3475.1.S1_at 2.38
Leucine aminopeptidase; lap2 Les.84.1.S1_at 2.33
PGIP LesAffx.56547.2.S1_at 2.27
Contains similarity to proline-rich protein LesAffx.44139.1.A1_at 2.27
Homeobox protein knotted-1-like LET6 Les.70.1.S1_at 2.25
Phosphoesterase family protein LesAffx.39212.1.S1_at 2.24
Sulfate transporter 2; ST2 Les.3479.1.S1_at 2.21
No description available Les.2358.1.A1_at 2.21
No description available Les.181.1.A1_at 2.16
Serine carboxypeptidase II-2 precursor (CP-MII.2) Les.4810.1.S1_at 2.09
No description available Les.477.1.S1_at 2.09
No description available Les.2026.2.A1_at 2.06
euFUL FRUITFULL-like MADS-box Les.4339.1.S1_at 2.05
STS14 protein precursor Les.1394.1.A1_at 2.04
Putative ripening-related protein LesAffx.71016.1.S1_at 2.04
Protein RSI-1 Les.3625.1.S1_at 2.03
Transferase, transferring glycosyl groups LesAffx.30198.1.S1_at 2.02
NAD-dependent epimerase/dehydratase LesAffx.44937.1.S1_at 2.02
Calmodulin binding protein, putative Les.933.1.A1_at 2.01
Genes induced by Bm inoculation regarding C7-inoculated plants
No description available Les.195.1.S1_at 8.57
Class II small heat shock protein Le-HSP17.6 Les.3581.1.S1_at 7.32
Ca2+/H+ exchanger LesAffx.23546.1.S1_at 5.11
Small heat shock protein; vis1 Les.3677.1.S1_at 5.03
ELI3 Les.3741.1.S1_at 4.45
TAS14 peptide Les.3593.1.S1_at 3.79
Chalcone-flavanone isomerase LesAffx.68320.1.S1_at 3.68
Shikimate kinase family protein Les.1859.3.S1_at 3.45
Lipid transfer protein, putative LesAffx.70407.1.S1_at 3.43
Flavonoid glucoyltransferase UGT73E2 Les.2403.2.S1_at 3.25
17.7 kD class I small heat shock protein Les.4004.1.S1_a_at 3.12
ATEGY3 Les.1132.1.A1_at 3.01
4-hydroxyphenylpyruvate dioxygenase; HPPDase Les.3415.2.S1_at 2.96
Jasmonic acid 2; JA2 Les.23.1.S1_at 2.71
Flavonoid glucoyltransferase UGT73E2 Les.2403.1.S1_at 2.63
1-aminocyclopropane-1-carboxylate oxidase 1; ACO1 Les.2560.1.S1_at 2.60
No description available Les.3288.1.A1_at 2.54
ATP phosphoribosyltransferase Les.4149.2.S1_a_at 2.45
Shikimate kinase family protein Les.1859.2.S1_at 2.42
Universal stress protein (USP) family protein / early nodulin ENOD18 family protein LesAffx.47187.1.S1_at 2.37
Flavonoid glucoyltransferase UGT73E2 Les.5832.1.S1_at 2.32
Cytochrome P450 76A2 LesAffx.8720.1.S1_at 2.31
Gibberellin 3-beta hydroxylase LesAffx.71330.1.S1_at 2.30
Zinc finger (C3HC4-type RING finger) family protein Les.4360.1.S1_at 2.27
No description available Les.1596.1.A1_at 2.25
Protease inhibitor/seed storage/lipid transfer protein (LTP) family protein LesAffx.67592.1.S1_at 2.20
Cold-induced glucosyl transferase LesAffx.6688.1.S1_at 2.14
Oxidoreductase, 2OG-Fe(II) oxygenase family protein LesAffx.9824.1.S1_at 2.11
Patatin-like protein 1 LesAffx.47467.1.S1_at 2.10
NAC domain protein NAC2 Les.2084.1.S1_at 2.09
MADS-box protein 15 LesAffx.4763.1.S1_at 2.09
Putative stress-responsive protein Les.5957.1.S1_at 2.07
No description available Les.3164.2.S1_at 2.06
AER Les.220.1.S1_at 2.06
Pathogen-related protein LesAffx.71065.1.S1_at 2.06
Uroporphyrinogen III synthase LesAffx.70617.1.S1_at 2.06
Serine acetyltransferase 3;2, acetyltransferase/serine O-acetyltransferase LesAffx.59463.1.S1_at 2.02
Cytochrome P450 76A2 LesAffx.8720.2.S1_at 2.00

142
Chapter 1
Gene ID Fold change
Genes induced by C7 inoculation regarding Bm-inoculated plants
Defective in induced resistance; DIR1 LesAffx.124.1.S1_at 12.66
Defective in induced resistance; DIR1 LesAffx.66472.1.S1_at 8.18
Contains similarity to proline-rich protein LesAffx.44139.1.S1_at 5.26
Endo-1,4-beta-glucanase precursor; cel1 Les.3667.1.S1_at 4.94
Tumor-related protein LesAffx.823.1.S1_at 4.42
Catechol oxidase, Polyphenol oxidase F; PPO Les.4299.1.S1_at 4.34
Germin-like protein LesAffx.64062.1.S1_at 4.29
DNA-binding protein LesAffx.12514.1.S1_at 4.24
Auxin-induced SAUR-like protein LesAffx.1251.1.S1_at 4.24
Arginase 2; ARG2 Les.3299.2.A1_s_at 4.10
No description available Les.1379.1.A1_at 4.02
Gamma-thionin Les.3559.1.A1_at 3.89
Arginase 2; ARG2 LesAffx.1.1.S1_at 3.78
Protease inhibitor/seed storage/lipid transfer protein (LTP) family protein LesAffx.22413.1.S1_at 3.73
Cationic peroxidase isozyme 40K precursor LesAffx.53132.1.S1_at 3.71
No description available Les.2261.1.A1_at 3.67
Protease inhibitor/seed storage/lipid transfer protein (LTP) family protein Les.2696.1.S1_at 3.64
36.4 kDa proline-rich protein; TPRP-F1 Les.3273.1.S1_at 3.52
Protein GAST1 Les.827.1.S1_at 3.17
No description available Les.647.1.A1_at 3.09
No description available Les.2207.1.A1_at 2.93
Putative C-4 sterol methyl oxidase LesAffx.63154.1.S1_at 2.93
Polygalacturonase-like protein Les.857.1.S1_at 2.84
Pectin methylesterase Les.218.3.S1_at 2.80
Proteinase inhibitor I4, serpin LesAffx.48076.1.S1_at 2.72
1-aminocyclopropane-1-carboxylate synthase 7; ACS7B Les.3474.1.S1_at 2.71
AMP-binding protein, putative Les.5150.1.S1_at 2.67
Pectin methylesterase Les.218.1.S1_at 2.65
No description available Les.1776.1.A1_at 2.62
Phosphoethanolamine N-methyltransferase Les.4710.1.S1_at 2.55
Drought-induced protein SDi-6, metallothionein II-like protein; MTA Les.4077.1.S1_at 2.44
No description available Les.1721.2.S1_at 2.42
Hydrolase, alpha/beta fold family protein LesAffx.24204.1.S1_at 2.39
1-aminocyclopropane-1-carboxylate synthase; ACS8 Les.3475.1.S1_at 2.38
Leucine aminopeptidase; lap2 Les.84.1.S1_at 2.33
PGIP LesAffx.56547.2.S1_at 2.27
Contains similarity to proline-rich protein LesAffx.44139.1.A1_at 2.27
Homeobox protein knotted-1-like LET6 Les.70.1.S1_at 2.25
Phosphoesterase family protein LesAffx.39212.1.S1_at 2.24
Sulfate transporter 2; ST2 Les.3479.1.S1_at 2.21
No description available Les.2358.1.A1_at 2.21
No description available Les.181.1.A1_at 2.16
Serine carboxypeptidase II-2 precursor (CP-MII.2) Les.4810.1.S1_at 2.09
No description available Les.477.1.S1_at 2.09
No description available Les.2026.2.A1_at 2.06
euFUL FRUITFULL-like MADS-box Les.4339.1.S1_at 2.05
STS14 protein precursor Les.1394.1.A1_at 2.04
Putative ripening-related protein LesAffx.71016.1.S1_at 2.04
Protein RSI-1 Les.3625.1.S1_at 2.03
Transferase, transferring glycosyl groups LesAffx.30198.1.S1_at 2.02
NAD-dependent epimerase/dehydratase LesAffx.44937.1.S1_at 2.02
Calmodulin binding protein, putative Les.933.1.A1_at 2.01
Genes induced by Bm inoculation regarding C7-inoculated plants
No description available Les.195.1.S1_at 8.57
Class II small heat shock protein Le-HSP17.6 Les.3581.1.S1_at 7.32
Ca2+/H+ exchanger LesAffx.23546.1.S1_at 5.11
Small heat shock protein; vis1 Les.3677.1.S1_at 5.03
ELI3 Les.3741.1.S1_at 4.45
TAS14 peptide Les.3593.1.S1_at 3.79
Chalcone-flavanone isomerase LesAffx.68320.1.S1_at 3.68
Shikimate kinase family protein Les.1859.3.S1_at 3.45
Lipid transfer protein, putative LesAffx.70407.1.S1_at 3.43
Flavonoid glucoyltransferase UGT73E2 Les.2403.2.S1_at 3.25
17.7 kD class I small heat shock protein Les.4004.1.S1_a_at 3.12
ATEGY3 Les.1132.1.A1_at 3.01
4-hydroxyphenylpyruvate dioxygenase; HPPDase Les.3415.2.S1_at 2.96
Jasmonic acid 2; JA2 Les.23.1.S1_at 2.71
Flavonoid glucoyltransferase UGT73E2 Les.2403.1.S1_at 2.63
1-aminocyclopropane-1-carboxylate oxidase 1; ACO1 Les.2560.1.S1_at 2.60
No description available Les.3288.1.A1_at 2.54
ATP phosphoribosyltransferase Les.4149.2.S1_a_at 2.45
Shikimate kinase family protein Les.1859.2.S1_at 2.42
Universal stress protein (USP) family protein / early nodulin ENOD18 family protein LesAffx.47187.1.S1_at 2.37
Flavonoid glucoyltransferase UGT73E2 Les.5832.1.S1_at 2.32
Cytochrome P450 76A2 LesAffx.8720.1.S1_at 2.31
Gibberellin 3-beta hydroxylase LesAffx.71330.1.S1_at 2.30
Zinc finger (C3HC4-type RING finger) family protein Les.4360.1.S1_at 2.27
No description available Les.1596.1.A1_at 2.25
Protease inhibitor/seed storage/lipid transfer protein (LTP) family protein LesAffx.67592.1.S1_at 2.20
Cold-induced glucosyl transferase LesAffx.6688.1.S1_at 2.14
Oxidoreductase, 2OG-Fe(II) oxygenase family protein LesAffx.9824.1.S1_at 2.11
Patatin-like protein 1 LesAffx.47467.1.S1_at 2.10
NAC domain protein NAC2 Les.2084.1.S1_at 2.09
MADS-box protein 15 LesAffx.4763.1.S1_at 2.09
Putative stress-responsive protein Les.5957.1.S1_at 2.07
No description available Les.3164.2.S1_at 2.06
AER Les.220.1.S1_at 2.06
Pathogen-related protein LesAffx.71065.1.S1_at 2.06
Uroporphyrinogen III synthase LesAffx.70617.1.S1_at 2.06
Serine acetyltransferase 3;2, acetyltransferase/serine O-acetyltransferase LesAffx.59463.1.S1_at 2.02
Cytochrome P450 76A2 LesAffx.8720.2.S1_at 2.00
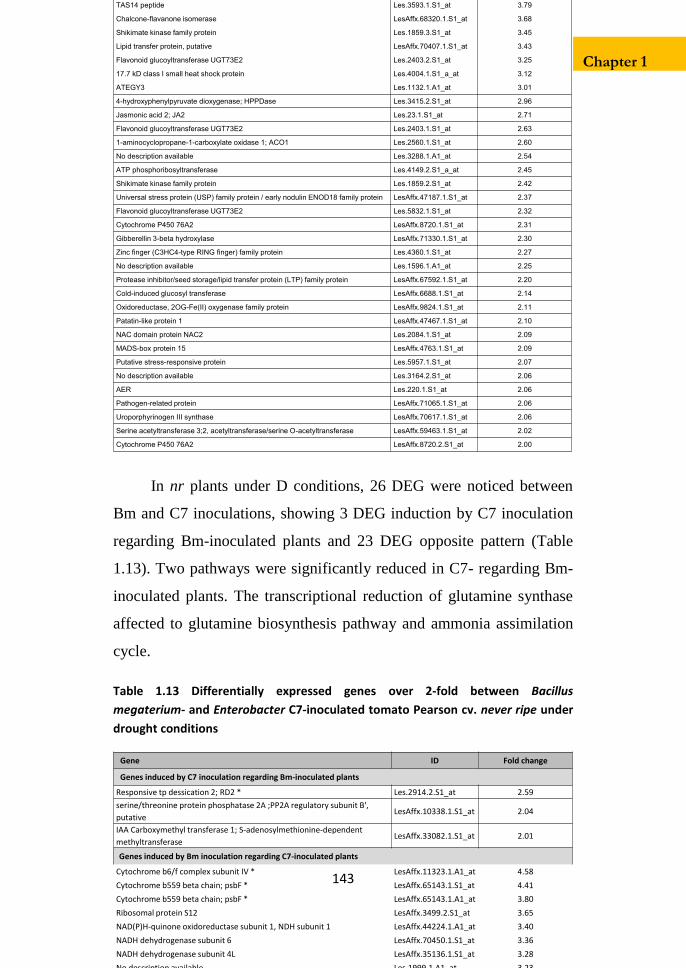
143
Chapter 1
Gene ID Fold change
Genes induced by C7 inoculation regarding Bm-inoculated plants
Defective in induced resistance; DIR1 LesAffx.124.1.S1_at 12.66
Defective in induced resistance; DIR1 LesAffx.66472.1.S1_at 8.18
Contains similarity to proline-rich protein LesAffx.44139.1.S1_at 5.26
Endo-1,4-beta-glucanase precursor; cel1 Les.3667.1.S1_at 4.94
Tumor-related protein LesAffx.823.1.S1_at 4.42
Catechol oxidase, Polyphenol oxidase F; PPO Les.4299.1.S1_at 4.34
Germin-like protein LesAffx.64062.1.S1_at 4.29
DNA-binding protein LesAffx.12514.1.S1_at 4.24
Auxin-induced SAUR-like protein LesAffx.1251.1.S1_at 4.24
Arginase 2; ARG2 Les.3299.2.A1_s_at 4.10
No description available Les.1379.1.A1_at 4.02
Gamma-thionin Les.3559.1.A1_at 3.89
Arginase 2; ARG2 LesAffx.1.1.S1_at 3.78
Protease inhibitor/seed storage/lipid transfer protein (LTP) family protein LesAffx.22413.1.S1_at 3.73
Cationic peroxidase isozyme 40K precursor LesAffx.53132.1.S1_at 3.71
No description available Les.2261.1.A1_at 3.67
Protease inhibitor/seed storage/lipid transfer protein (LTP) family protein Les.2696.1.S1_at 3.64
36.4 kDa proline-rich protein; TPRP-F1 Les.3273.1.S1_at 3.52
Protein GAST1 Les.827.1.S1_at 3.17
No description available Les.647.1.A1_at 3.09
No description available Les.2207.1.A1_at 2.93
Putative C-4 sterol methyl oxidase LesAffx.63154.1.S1_at 2.93
Polygalacturonase-like protein Les.857.1.S1_at 2.84
Pectin methylesterase Les.218.3.S1_at 2.80
Proteinase inhibitor I4, serpin LesAffx.48076.1.S1_at 2.72
1-aminocyclopropane-1-carboxylate synthase 7; ACS7B Les.3474.1.S1_at 2.71
AMP-binding protein, putative Les.5150.1.S1_at 2.67
Pectin methylesterase Les.218.1.S1_at 2.65
No description available Les.1776.1.A1_at 2.62
Phosphoethanolamine N-methyltransferase Les.4710.1.S1_at 2.55
Drought-induced protein SDi-6, metallothionein II-like protein; MTA Les.4077.1.S1_at 2.44
No description available Les.1721.2.S1_at 2.42
Hydrolase, alpha/beta fold family protein LesAffx.24204.1.S1_at 2.39
1-aminocyclopropane-1-carboxylate synthase; ACS8 Les.3475.1.S1_at 2.38
Leucine aminopeptidase; lap2 Les.84.1.S1_at 2.33
PGIP LesAffx.56547.2.S1_at 2.27
Contains similarity to proline-rich protein LesAffx.44139.1.A1_at 2.27
Homeobox protein knotted-1-like LET6 Les.70.1.S1_at 2.25
Phosphoesterase family protein LesAffx.39212.1.S1_at 2.24
Sulfate transporter 2; ST2 Les.3479.1.S1_at 2.21
No description available Les.2358.1.A1_at 2.21
No description available Les.181.1.A1_at 2.16
Serine carboxypeptidase II-2 precursor (CP-MII.2) Les.4810.1.S1_at 2.09
No description available Les.477.1.S1_at 2.09
No description available Les.2026.2.A1_at 2.06
euFUL FRUITFULL-like MADS-box Les.4339.1.S1_at 2.05
STS14 protein precursor Les.1394.1.A1_at 2.04
Putative ripening-related protein LesAffx.71016.1.S1_at 2.04
Protein RSI-1 Les.3625.1.S1_at 2.03
Transferase, transferring glycosyl groups LesAffx.30198.1.S1_at 2.02
NAD-dependent epimerase/dehydratase LesAffx.44937.1.S1_at 2.02
Calmodulin binding protein, putative Les.933.1.A1_at 2.01
Genes induced by Bm inoculation regarding C7-inoculated plants
No description available Les.195.1.S1_at 8.57
Class II small heat shock protein Le-HSP17.6 Les.3581.1.S1_at 7.32
Ca2+/H+ exchanger LesAffx.23546.1.S1_at 5.11
Small heat shock protein; vis1 Les.3677.1.S1_at 5.03
ELI3 Les.3741.1.S1_at 4.45
TAS14 peptide Les.3593.1.S1_at 3.79
Chalcone-flavanone isomerase LesAffx.68320.1.S1_at 3.68
Shikimate kinase family protein Les.1859.3.S1_at 3.45
Lipid transfer protein, putative LesAffx.70407.1.S1_at 3.43
Flavonoid glucoyltransferase UGT73E2 Les.2403.2.S1_at 3.25
17.7 kD class I small heat shock protein Les.4004.1.S1_a_at 3.12
ATEGY3 Les.1132.1.A1_at 3.01
4-hydroxyphenylpyruvate dioxygenase; HPPDase Les.3415.2.S1_at 2.96
Jasmonic acid 2; JA2 Les.23.1.S1_at 2.71
Flavonoid glucoyltransferase UGT73E2 Les.2403.1.S1_at 2.63
1-aminocyclopropane-1-carboxylate oxidase 1; ACO1 Les.2560.1.S1_at 2.60
No description available Les.3288.1.A1_at 2.54
ATP phosphoribosyltransferase Les.4149.2.S1_a_at 2.45
Shikimate kinase family protein Les.1859.2.S1_at 2.42
Universal stress protein (USP) family protein / early nodulin ENOD18 family protein LesAffx.47187.1.S1_at 2.37
Flavonoid glucoyltransferase UGT73E2 Les.5832.1.S1_at 2.32
Cytochrome P450 76A2 LesAffx.8720.1.S1_at 2.31
Gibberellin 3-beta hydroxylase LesAffx.71330.1.S1_at 2.30
Zinc finger (C3HC4-type RING finger) family protein Les.4360.1.S1_at 2.27
No description available Les.1596.1.A1_at 2.25
Protease inhibitor/seed storage/lipid transfer protein (LTP) family protein LesAffx.67592.1.S1_at 2.20
Cold-induced glucosyl transferase LesAffx.6688.1.S1_at 2.14
Oxidoreductase, 2OG-Fe(II) oxygenase family protein LesAffx.9824.1.S1_at 2.11
Patatin-like protein 1 LesAffx.47467.1.S1_at 2.10
NAC domain protein NAC2 Les.2084.1.S1_at 2.09
MADS-box protein 15 LesAffx.4763.1.S1_at 2.09
Putative stress-responsive protein Les.5957.1.S1_at 2.07
No description available Les.3164.2.S1_at 2.06
AER Les.220.1.S1_at 2.06
Pathogen-related protein LesAffx.71065.1.S1_at 2.06
Uroporphyrinogen III synthase LesAffx.70617.1.S1_at 2.06
Serine acetyltransferase 3;2, acetyltransferase/serine O-acetyltransferase LesAffx.59463.1.S1_at 2.02
Cytochrome P450 76A2 LesAffx.8720.2.S1_at 2.00
In nr plants under D conditions, 26 DEG were noticed between
Bm and C7 inoculations, showing 3 DEG induction by C7 inoculation
regarding Bm-inoculated plants and 23 DEG opposite pattern (Table
1.13). Two pathways were significantly reduced in C7- regarding Bm-
inoculated plants. The transcriptional reduction of glutamine synthase
affected to glutamine biosynthesis pathway and ammonia assimilation
cycle.
Table 1.13 Differentially expressed genes over 2-fold between Bacillus
megaterium- and Enterobacter C7-inoculated tomato Pearson cv. never ripe under
drought conditions
Gene ID Fold change
Genes induced by C7 inoculation regarding Bm-inoculated plants
Responsive tp dessication 2; RD2 * Les.2914.2.S1_at 2.59
serine/threonine protein phosphatase 2A ;PP2A regulatory subunit B',
putativeLesAffx.10338.1.S1_at 2.04
IAA Carboxymethyl transferase 1; S-adenosylmethionine-dependent
methyltransferaseLesAffx.33082.1.S1_at 2.01
Genes induced by Bm inoculation regarding C7-inoculated plants
Cytochrome b6/f complex subunit IV * LesAffx.11323.1.A1_at 4.58
Cytochrome b559 beta chain; psbF * LesAffx.65143.1.S1_at 4.41
Cytochrome b559 beta chain; psbF * LesAffx.65143.1.A1_at 3.80
Ribosomal protein S12 LesAffx.3499.2.S1_at 3.65
NAD(P)H-quinone oxidoreductase subunit 1, NDH subunit 1 LesAffx.44224.1.A1_at 3.40
NADH dehydrogenase subunit 6 LesAffx.70450.1.S1_at 3.36
NADH dehydrogenase subunit 4L LesAffx.35136.1.S1_at 3.28
No description available Les.1999.1.A1_at 3.23
Cytochrome b6/f complex subunit V * LesAffx.65124.1.A1_at 2.95
Putative glutamine synthase; gts1 Les.224.1.S1_at 2.89
Ribosomal protein S7 LesAffx.33796.2.S1_at 2.80
Xyloglucan endotransglycosylase, putative LesAffx.69296.1.S1_at 2.80
Ribulose-1,5-bisphosphate carboxylase/oxygenase large subunit LesAffx.70764.1.S1_at 2.78
Thioredoxin Les.3221.1.S1_a_at 2.45
Ribosomal protein S3 LesAffx.18735.1.A1_at 2.45
Cytochrome b6/f complex subunit IV LesAffx.11323.1.S1_at 2.43
Unnamed protein product LesAffx.37715.1.S1_at 2.31
Cytochrome b6/f complex subunit V * LesAffx.65124.1.S1_at 2.28
Peroxidase 1 Les.5935.1.A1_at 2.24
1-aminocyclopropane-1-carboxylic acid oxidase; ACO LesAffx.69245.1.S1_at 2.20
Retroelement pol polyprotein-like LesAffx.71660.4.S1_at 2.15
Probable U6 snRNA-associated Sm-like protein LSm4, Glycine-rich protein
10; GRP 10Les.2940.2.S1_s_at 2.14
No description available Les.2033.3.S1_at 2.11
* Common genes that are differentially expressed between Bacillus megaterium and Enterobacter C7-inoculated in wild
type and never ripe plants under drought conditions

144
Chapter 1
Gene ID Fold change
Genes induced by C7 inoculation regarding Bm-inoculated plants
Responsive tp dessication 2; RD2 * Les.2914.2.S1_at 2.59
serine/threonine protein phosphatase 2A ;PP2A regulatory subunit B',
putativeLesAffx.10338.1.S1_at 2.04
IAA Carboxymethyl transferase 1; S-adenosylmethionine-dependent
methyltransferaseLesAffx.33082.1.S1_at 2.01
Genes induced by Bm inoculation regarding C7-inoculated plants
Cytochrome b6/f complex subunit IV * LesAffx.11323.1.A1_at 4.58
Cytochrome b559 beta chain; psbF * LesAffx.65143.1.S1_at 4.41
Cytochrome b559 beta chain; psbF * LesAffx.65143.1.A1_at 3.80
Ribosomal protein S12 LesAffx.3499.2.S1_at 3.65
NAD(P)H-quinone oxidoreductase subunit 1, NDH subunit 1 LesAffx.44224.1.A1_at 3.40
NADH dehydrogenase subunit 6 LesAffx.70450.1.S1_at 3.36
NADH dehydrogenase subunit 4L LesAffx.35136.1.S1_at 3.28
No description available Les.1999.1.A1_at 3.23
Cytochrome b6/f complex subunit V * LesAffx.65124.1.A1_at 2.95
Putative glutamine synthase; gts1 Les.224.1.S1_at 2.89
Ribosomal protein S7 LesAffx.33796.2.S1_at 2.80
Xyloglucan endotransglycosylase, putative LesAffx.69296.1.S1_at 2.80
Ribulose-1,5-bisphosphate carboxylase/oxygenase large subunit LesAffx.70764.1.S1_at 2.78
Thioredoxin Les.3221.1.S1_a_at 2.45
Ribosomal protein S3 LesAffx.18735.1.A1_at 2.45
Cytochrome b6/f complex subunit IV LesAffx.11323.1.S1_at 2.43
Unnamed protein product LesAffx.37715.1.S1_at 2.31
Cytochrome b6/f complex subunit V * LesAffx.65124.1.S1_at 2.28
Peroxidase 1 Les.5935.1.A1_at 2.24
1-aminocyclopropane-1-carboxylic acid oxidase; ACO LesAffx.69245.1.S1_at 2.20
Retroelement pol polyprotein-like LesAffx.71660.4.S1_at 2.15
Probable U6 snRNA-associated Sm-like protein LSm4, Glycine-rich protein
10; GRP 10Les.2940.2.S1_s_at 2.14
No description available Les.2033.3.S1_at 2.11
* Common genes that are differentially expressed between Bacillus megaterium and Enterobacter C7-inoculated in wild
type and never ripe plants under drought conditions
In addition, several DEG were affected in common over 2-fold
change in comparison between both Bm and C7 inoculations
independently of plant genotype, but only under D conditions (Tables
1.11, 1.13). Responsive to dessication 2 (RD2) was the unique DEG
affected showing transcription induction by Bm inoculation in wt plants
and repression by C7 inoculation in nr plants. Nevertheless,
Cytochrome b6/f complex subunit IV, Cytochrome b6/f complex
subunit and Cytochrome b559 beta chain (psbF) were affected showing
transcription induction by C7 inoculation in wt plants and repression by
Bm inoculation in nr plants. Furthermore, 26S proteasome regulatory
particle non-ATPase subunit 8 was the unique DEG affected in
common over 2-fold change in comparison between both Bm and C7

145
Chapter 1
inoculations independently of watering regime, but only in wt plants
showing transcription induction by C7 inoculation (Tables 1.10, 1.11).
Discussion
In order for a bacterium to be considered as a PGPB, colonization
of the plant root system is a critical trait for plant-bacteria interaction
(Benizri et al. 2001). In the present study, the colonization bioassay
confirmed that Bm as well as C7 were able to colonize the roots of
ethylene sensitive and insensitive plants. Moreover, the colonization
rates were not significantly different (Table 1.1), suggesting that plant
growth variations are not due to differences in root colonization.
Ethylene sensitivity is essential for growth promotion by Bm
but not for C7
Both Bm and C7 can be considered as PGPB due to growth
promotion noticed in wt plants (Weller et al. 2002; Vessey 2003). Plant
growth promotion by Bm was previously reported in several plant
species (Marulanda-Aguirre et al. 2008; Marulanda et al. 2009; Porcel
et al. 2014; Armada et al. 2014), but Enterobacter C7 was evaluated in
the present study for first time. Nevertheless, noticed results in nr
plants pointed to a PGPB mechanism dependent on ethylene sensitivity
for Bm but not for C7 (Fig. 1.2). PGPB mode of action dependent on
ethylene-sensitivity was previously reported in arabidopsis plants
inoculated with Variovorax paradoxus also without differences in root
colonization rate but which presenting ACC deaminase activity (Chen
et al. 2013). In contrast, C7 inoculation resulted in growth promotion of

146
Chapter 1
both plant genotypes (Fig. 1.2), suggesting that ethylene perception by
ETR3 was not involved in its action mechanism. Other studies
previously reported an ethylene-independent PGPB effect in different
plant-bacteria combinations (López-Bucio et al. 2007; Meldau et al.
2012). As with many plant-bacterial interactions, discrepancies
between these studies could be explained by strain-specific PGPB
mechanisms, plant growth conditions (Ryu et al. 2005; Long et al.
2008), and/or differences in ethylene-transduction pathways between
tomato and arabidopsis such as receptor functionality and signaling
regulation (Hua and Meyerowitz 1998; Tieman et al. 2000; Kevany et
al. 2007).
In addition, drought significantly reduced plant growth in all
cases (Fig. 1.2 A). Yield losses caused by drought are very important in
tomato (Pervez et al. 2009) and are increasing due to intensive
agriculture and climate change (Misra 2014). Bacteria-inoculated wt
plants under D conditions reached values of non-inoculated wt plants
under WW conditions reducing potential yield losses and suggesting
that PGPB can be used to diminish water inputs in agriculture or
increase resource use efficiency (Dodd and Ruiz-Lozano 2012).
Moreover, enhanced promotion effects were noticed in wt plants under
D conditions suggesting that PGPB increased plant stress tolerance as
previously reported under suboptimal environmental conditions (Glick
2004; Aroca and Ruiz-Lozano 2009; Dimkpa et al. 2009).
Nevertheless, although C7 was able to promote growth in nr
plants independently of watering regime, the promotion was lower
under D conditions. These results suggest that ethylene insensitivity
affects C7 effects, despite of proposed ethylene-independent activity.
147
Chapter 1
Additionally, ethylene production is typically up-regulated by drought
(Wang et al. 2013), and this could result in later response and a
reduction in growth promotion by C7 since nr plants are unable to
sense it. In addition, differences between plant genotypes were only
significant in non-inoculated plants pointing to less pronounced
ethylene growth inhibitory effects (Pierik et al. 2006) on nr plants in
WW conditions due to its mutation (Wilkinson et al. 1995), but not
observed under D conditions probably due to ethylene induction by
stress (Pierik et al. 2007).
PGPB inoculation locally affects ethylene biosynthesis and
response resulting in stress alleviation by C7, and Bm miss-
recognition by nr plants
In tomato, several isoforms of ACS and ACO genes have been
identified (Blume and Grierson 1997; Jiang and Fu 2000; Alexander
and Grierson 2002). The rate-limiting enzyme in ethylene biosynthesis
is generally ACS (Wang et al. 2002), although ACO could be limiting
under certain conditions (Dorling and McManus 2012). During plant
growth and development, ethylene production is strongly regulated
(Wang et al. 2002; Argueso et al. 2007). ACS expression shows tissue-
and cell-specific patterns which are differentially regulated depending
on developmental stage and in response to different stimuli, controlling
finely ethylene production (Tsuchisaka et al. 2009; Dorling and
McManus 2012).
Expression alteration of ethylene biosynthesis genes in tomato
due to PGPB inoculation was previously reported by Porcel et al.
(2014). In the present study, both PGPB modified expression of ACS

148
Chapter 1
and ACO genes (Fig. 1.3 and 1.4). Either Bm as C7 decreased their
expression in wt plants, although C7 inoculation affected with higher
intensity in accordance with higher growth promotion. Thereby, both
PGPB could diminish ethylene growth inhibitory effects independently
on watering regimes (Pierik et al. 2006; Wang et al. 2013a).
Nevertheless, PGPB inoculation in nr plants induced ethylene
biosynthesis genes showing higher effects by Bm inoculation. ACC
levels highly increase in response to stresses as wounding and/or
pathogen infection (Kende and Boller 1981; van Loon et al. 2006)
suggesting that nr plants could recognize Bm as a pathogen-like
microorganism, which induces ethylene signaling and response.
Additionally, drought effects in ethylene biosynthesis genes
pointed to higher stress alleviation by C7 inoculation, according with
previously enhanced tolerance against stresses due to PGPB inoculation
(Aroca and Ruiz-Lozano 2009). Ethylene emission by aerial tissues
was determined to evaluate any alteration of ethylene metabolism, but
neither PGPB nor drought modified ethylene production rate (Fig. 1.7
A). However, previous studies correlated spatiotemporal ACS
expression with ethylene production (Zarembinski and Theologis 1994;
Wang et al. 2002; Sobeih et al. 2004). ACS genes present a strong post-
transcriptional regulation with high influence on ethylene production
(McClellan and Chang 2008; Lyzenga et al. 2012; Xu and Zhang
2014), but ACS activity was not assayed and further research is needed
to clarify these results.
Additionally, drought treatment generally increased ethylene
emission (Pierik et al. 2007; Wang et al. 2013a), but the harvest was
carried out one month after drought treatment started and plants could

149
Chapter 1
be adapted (Pan et al. 2012). Moreover, plant homeostasis can also
counteract bacterial effects since PGPB were grown in roots during two
months. Another feasible explanation is that ethylene could be
specifically produced by limited number of tissues or cells, leading to a
strong local production, while total ethylene were maintained at low
levels in the whole plant and/or organ.
Furthermore, differences between plant genotypes in ethylene
biosynthesis genes were generally observed in non-inoculated plants
disappearing under bacterial inoculation probably due to stress
alleviation effects (Glick 2004; Aroca and Ruiz-Lozano 2009; Dimkpa
et al. 2009). Moreover, ethylene production showed significant
differences between plant genotypes supporting independence of
ethylene for C7 activity and pointing to ethylene sensitivity as
determinant in Bm-tomato interaction with interference of drought
stress (Pierik et al. 2007).
In addition, a bioassay for ethylene production was performed to
test if ethylene levels emitted by seedlings are affected in response to
bacterial inoculation (Fig. 1.7 B). After 7 h of inoculation, Bm and C7
inoculation increased ethylene production rate in nr and wt plants,
respectively. Although 26 h post-inoculation ethylene production rate
was decreased in both cases regarding to inoculation day and no
differences were noticed due to PGPB inoculation compared to non-
inoculated plants, Bm-inoculated nr plants showed higher ethylene
production rate than wt ones 26 h post-inoculation. Ethylene emission
by plants after interaction with bacteria was previously reported (van
Loon et al. 2006) acting as modulator of interaction between plants
with several enemies (Groen et al. 2013), although also with beneficial

150
Chapter 1
microorganisms (Zamioudis and Pieterse 2012). Thereby, these results
also points to miss-interaction between Bm and nr plants.
Moreover, induction of ethylene receptors by PGPB strains was
previously reported pointing to ethylene response pathway involvement
in the early stages of establishment of plant-bacteria association (Ciardi
et al. 2000; Vargas et al. 2012) required for proper interaction
(Vacheron et al. 2013). Thus, ETR3 expression was evaluated to
determine if PGPB inoculation can modulate ethylene sensitivity by
ETR3 and if ETR3 is involved in interaction between PGPB and
tomato plants (Fig. 1.5 A, C). Bm inoculation induced ETR3 expression
in root and shoot tissues exclusively in nr plants pointing to lower
ethylene sensitivity and non-completely functional association between
Bm and nr plants. However, C7 inoculation decreased shoot ETR3
expression only in wt shoots suggesting that aerial tissues of C7-
inoculated plants could be less sensitive to ethylene. Residual
responsiveness in nr plants (Lanahan et al. 1994), could contribute to
these late response to bacterial strains.
In addition, although four CTR1-like genes were described in
tomato, TCTR1 expression analysis was selected because it is ethylene-
inducible and associated with tissues at development stages with high
ethylene levels (Zegzouti et al. 1999; Leclercq et al. 2002; Adams-
Phillips et al. 2004). Induction of TCTR1 expression in roots by Bm
inoculation was noticed in nr plants under D conditions (although it
was also partially significant induced under WW conditions)
suggesting local ethylene production and in accordance with growth
results (Fig. 1.5 B, D). Furthermore, ETR3 expression on a par with
TCTR1 was reported to regulate ethylene responsiveness (Tieman et al.

151
Chapter 1
2000), and Bm was able to induce both genes in nr plants, suggesting
negatively feedback regulation in Bm-inoculated nr plants. Indeed,
ethylene receptors and CTRs are differentially regulated in response to
stimuli and during plant development possibly regulating different
ethylene responses (Zhong et al. 2008).
Ethylene-responsive genes were also analyzed to evaluate if
ethylene transduction pathway was activated in PGPB-inoculated plants
despite of similar ethylene production. ERF1 was selected because it
acts as integrator between osmotic stress and ethylene pathways in
tomato (Huang et al. 2004), and is induced by drought in several
species (Cheng et al. 2013; Müller and Munné-Bosch 2015).
Surprisingly, despite of drought treatment, no expression change was
noticed pointing to plant adaptation to drought (Pan et al. 2012).
Furthermore, ERF1 is also involved in defense against pathogens
(Cheng et al. 2013; Müller and Munné-Bosch 2015) suggesting that
both PGPB did not induce defense mechanisms, although nr plants
could miss-recognize Bm.
ER5, ER21 and ER24 expression was analyzed due to their strong
ethylene-dependent alteration (Fig. 1.6). ER5 and ER21 are involved in
stress response, while ER24 participates in regulation of gene
expression (Zegzouti et al. 1999). ER21 encodes a tomato heat-shock
protein cognate 70 (hsp70) (Sun et al. 1996). Stress can cause plant cell
damage resulting in osmotic and oxidative stress and induction of heat-
shock proteins (Scarpeci et al. 2008; Al-Whaibi 2011) as hsp70, which
function as chaperone (Sung et al. 2001; Su and Li 2008). Bm was able
to strongly induce ER21 expression in nr roots suggesting that Bm

152
Chapter 1
presence caused a high stress according with miss-recognition
hypothesis.
ER21 expression results in shoot tissue points to Bm and C7
produced systemic stress under D and WW conditions, respectively.
However, C7 inoculation could alleviate stress under D conditions in
wt and nr plants in accordance with growth results. Furthermore,
drought induction of ER21 in Bm-inoculated nr shoots and in non-
inoculated wt ones pointed to higher stress levels in these two
treatments. Additionally, differences between plant genotypes in shoot
ER21 were only noticed in non-inoculated plants suggesting that nr
plans were suffering less stress probably because ethylene insensitivity
prevents further signaling failing to produce some adaptive responses
as previously reported (Feng and Barker 1992; Zhang et al. 2003). In
accordance, ER5 is a lea-like gene (Zegzouti et al. 1999) involved in
response to desiccation (Van Den Dries et al. 2011), and showed lower
levels in non-inoculated nr than wt plants under D conditions.
Furthermore, ER24 is a transcriptional co-activator (Zegzouti et al.
1999), suggesting higher response by nr plants under stress triggered by
Bm.
PGPB inoculation affected transcriptomic profiles showing
strain-specific effects mainly dependent on ethylene insensitivity
and watering conditions.
Transcriptomic analysis was carried out to evaluate PGPB
inoculation effects on wt and nr plants and to point to other plant
changed pathways. Both PGPB inoculations as well as direct
comparison between inocula generally produced specific effects

153
Chapter 1
dependent on bacterial strain, plant genotype and watering regime (Fig.
1.8) in accordance with PGPB effects dependent on inoculated bacteria
and growth conditions (Ryu et al. 2005; Long et al. 2008). Moreover,
both bacterial inoculations modified expression of a high number of
genes under WW conditions suggesting than drought stress could
diminish bacterial inoculation effects. Indeed, drought stress has a great
impact in tomato transcriptomic profiles (Gong et al. 2010; Iovieno et
al. 2016). However, Bm altered lower number of DEG in nr plants
under WW conditions in accordance with cross-talk between drought
stress and Bm interaction with nr plants.
Bacillus megaterium modulates flavonoids enhancing
antioxidant status in wt plants but ethylene insensitivity impairs
interaction with tomato.
Bm inoculation showed significant effects on pathways only
under WW conditions. Bm induced anthocyanin biosynthesis pathway
in wt plants. LDOX produces cyanidin and is essential for biosynthesis
of proanthocyanidin (Saito et al. 1999; Abrahams et al. 2003). These
molecules belong to the flavonoid family, which plays a determinant
role in plant interaction with beneficial microorganisms and maintain
the redox status within cells by their antioxidative properties (Shirley
1996; Mierziak et al. 2014). Although flavonoids has been described in
symbiotic bacteria and mychorriza (Abdel-Lateif et al. 2012), it could
play also a role in interaction with bacteria living in the rhizosphere.
Additionally, plant proanthocyanidins can neutralize bacterial
lipopolysaccharides (Delehanty et al. 2007), which trigger plant

154
Chapter 1
immune system (Newman et al. 2013), suggesting that wt plants could
avoid immune response against Bm.
Nevertheless, flavonoid biosynthesis pathway was repressed by
Bm inoculation in nr plants. Chalcone synthase is the first enzyme in
the tomato flavonoid biosynthesis pathway (Schijlen et al. 2007), while
hyosciamine 6-dioxygenase catalyzes hydroxylation of hyoscyamine
transformation to scopolamine (Matsuda et al. 1991). Chalcone
synthase expression results in accumulation of flavonoids involved in
defense pathway (Dao et al. 2011), suggesting that nr plants did not
defensively react against Bm. Induction of hyoscyamine and
scopolamine accumulation was previously reported using PGPB as
biotic elicitors (Ghorbanpour et al. 2010), but repression of these
enzyme genes was in accordance with no completely recognition of Bm
as pathogen by nr plants. However, among root exudates canavanine is
a non-protein amino acid which is toxic to many soil bacteria (Cai et al.
2009). Canavanine degradation pathway was also reduced by Bm
inoculation in nr plants suggesting its accumulation. Indeed,
canavanine-mediated inhibition of Alfalfa spermosphere colonization
by Bacillus cereus was previously reported (Emmert et al. 1998)
pointing to non-completely functional colonization of nr roots by Bm.
Furthermore, lipoxygenase and jasmonic acid (JA) biosynthesis
pathways were repressed by Bm independently of plant genotype,
although AOS was exclusively reduced in nr plants probably because
ethylene is able to induce AOS expression in tomato (Sivasankar et al.
2000). JA function as regulator of plant immune responses against
pathogens (Browse 2009). Thus, these results suggest that Bm is not

155
Chapter 1
completely recognized as a pathogenic microorganism despite of miss-
interaction between Bm and nr plants.
Ethylene sensitivity determines tomato interaction with
Enterobacter C7, which minimizes defense response in wt but
improves plant fitness in nr plants.
C7 inoculation in wt plants under WW conditions induced
cyanate degradation pathway. Carbonic anhydrase participates in
transport of inorganic carbon modulating CO2 levels in photosynthesis
and respiration (Badger 1994; Price et al. 1994; Henry 1996). Carbonic
anhydrase is positively correlated with photosynthesis and dry matter
accumulation in shoots (Khan 2002; Khan et al. 2004) suggesting
increased respiration and inorganic carbon transport in roots.
Surprisingly, C7 inoculation in nr plants under WW conditions affected
to ethylene biosynthesis and methionine salvage II pathways due to
induction of an ACS gene. In accordance, ACS7 expression was
induced by C7 inoculation under these conditions. ACS7 role in
flooding and wound response was previously reported (Shiu et al.
1998). However, ethylene levels were unaffected by C7 inoculation and
our results pointed to its involvement in plant-bacteria interaction.
Indeed, several ACS genes participate in response to bacterial elicitors
in arabidopsis (Denoux et al. 2008).
Under D conditions, C7 inoculation in nr plants decreased
tyrosine and phenylalanine degradation pathways. Tyrosine and
phenylalanine were used in the biosynthesis of secondary metabolites
(Tzin and Galili 2010; Hyun et al. 2011) involved in cell wall structure
(Bonawitz and Chapple 2010), and plant defense or response to stress

156
Chapter 1
(Fraser and Chapple 2011; Lee and Facchini 2011), suggesting that
higher amino acid availability in C7-inoculated nr plants could
counteract stress.
Furthermore, a bHLH transcriptional regulator (fer) was reduced
by C7 in nr plants independently of watering regime. Fer protein
regulates iron uptake in tomato (Brumbarova and Bauer 2005),
suggesting its repression that C7 inoculation could enhance Fe nutrition
in nr plants due to noticed growth promotion. Additionally, ethylene is
a signal which triggers response to Fe deficiency (Lucena et al. 2006;
Lingam et al. 2011) suggesting that C7 inoculation could restore this
response when plants are unable to perceive ethylene.
In addition, cyanide is a defensive metabolite in plants whose
oxidation results in cyanate formation (Møller and Seigler 1999). Plants
produce cyanide during ethylene biosynthesis (Peiser et al. 1984;
Kende 1993) and cyanide forms part of catalytic proteins active Fe-
cyanide complexes (Reissmann et al. 2003). Thus, wt plants could be
able to recognize C7 decreasing defensive metabolites, while nr plants
respond to C7 presence by enhancing ethylene biosynthesis pathway.
Although growth promotion by C7 inoculation was proposed as
independent of ethylene perception, these results also suggest that
mutation of ETR3 affects tomato-C7 interaction.

157
Chapter 1
Bm diminishes oxidative stress only in wt plants, while C7
increase it but modulates amino acidic metabolism independently
of ethylene sensitivity
Although PGPB inoculations did not significantly altered
pathways compared to non-inoculated plants under D conditions, direct
comparison between Bm and C7 showed multiple differences.
In wt plants under WW conditions, C7 compared to Bm
inoculation repressed several pathways. The dTDP-L-rhamnose
biosynthesis II pathway produces l-rhamnose, which is key component
of cell wall and secondary metabolites including flavonoids and
anthocyanins (Watt et al. 2004) in accordance with previous results
observed when compared Bm and C7 regarding to non-inoculated
plants. The xanthophyll cycle is involved in plant protection against
oxidative stress (Latowski et al. 2011) pointing to higher oxidative
stress in C7- than in Bm-inoculated wt plants. Although metabolites of
xanthophyll cycle could present antioxidant properties in roots,
oxidative protection was generally described in photosynthetic tissues
(Barickman et al. 2014). However, this pathway also produced
substrates for ABA production (Schwartz et al. 1997), suggesting that
ABA levels could participate in PGPB activity of Bm and/or C7. In
fact, normal endogenous ABA levels were proposed as essential for
Bm–mediated growth promotion (keeping low ethylene production) in
tomato plants (Porcel et al. 2014). Additionally, ABA was typically
characterized as growth inhibitor, but it plays an important role in
growth of young tissues (Finkelstein 2013). Moreover, glycine
hydroxymethyltransferase plays a role in the photorespiratory pathway
and contributes to minimize ROS production and avoid cellular damage

158
Chapter 1
(Moreno et al. 2004) also pointing to lower oxidative stress in wt plants
inoculated with Bm than with C7.
In contrast, C7 compared to Bm inoculation in wt plants under D
conditions induced lipoxygenase and jasmonic acid biosynthesis
pathways. This difference can be due to Bm differences with non-
inoculated wt plants in those pathways not noticed with C7.
Furthermore, arginase 2 induction significantly increased canavanine
degradation, arginine degradation, citrulline metabolism and urea cycle
pathways. C7 compared to Bm inoculation in nr plants under WW
conditions also induced arginase 2 genes inducing those pathways
suggesting a common mechanism independent on ethylene sensitivity.
In tomato, jasmonic acid and wounding are able to induce arginase 2
expression (Chen et al. 2004). Arginase catalyzes the transformation of
arginine pool (up to 90% of free nitrogen in vegetative tissues) into
urea and ornithine, which is used in biosynthesis of glutamate, proline
and to polyamines. Moreover, nitrogen mobilization has been
correlated with arginase expression to meet the metabolic demands
(Zonia et al. 1995; Hwang et al. 2001) suggesting that C7 could be able
to induce the amino acidic metabolism and/or enhance the nitrogen use
efficiency as previously reported by several PGPB (Mantelin and
Touraine 2004; Tikhonovich and Provorov 2011; Carvalho et al. 2014).
Furthermore, canavanine degradation is induced suggesting lower
accumulation of this toxic metabolite under C7 inoculation (Cai et al.
2009).
In nr plants under WW conditions, ethylene biosynthesis and
methionine salvage II pathways were also induced by C7 compared to
Bm inoculation. As abovementioned, these processes could be affected

159
Chapter 1
by ACS7 expression induction mediated by C7 compared to non-
inoculated plants. Furthermore, Peroxidase 1 was the unique repressed
DEG in common by both PGPB (Tables 1.4, 1.8). Peroxidase 1 is a key
enzyme in biosynthesis of lignin and suberin, which are involved in
water transport and cell wall strengthen, suggesting that both PGPB
strains are able to modulate root transport processes and cell wall
resistance (Quiroga et al. 2000).
In nr plants under D conditions, C7 compared to Bm reduced
glutamine synthase. This enzyme is responsible of primary ammonium
assimilation and participates in ammonium detoxification released in
metabolic processes as proteolysis or photorespiration (Lea and Miflin
2010), pointing to higher proteolysis under Bm inoculation in
accordance with higher stress response.
In addition, several DEG showed opposite results due to Bm or
C7 inoculation. Responsive to desiccation 2 (RD2) which belongs to
universal stress protein A family, is involved in oxidative stress
regulating negatively ROS generation in tomato plants (Gutiérrez-
Beltrán et al. 2017). Thus, our results points to lower oxidative stress in
Bm-inoculated wt plants and higher in C7-inoculated nr plants.
Moreover, photosystem II (PSII), which contains psbF, and cytochrome
b6/f (cyt b6/f) complex are key players in photosynthetic electron
transport chain (Yamori et al. 2016). Alteration of these genes was
previously reported in photosynthetic tissues, but it was suggested that
PSII could function as ROS sensor in roots (Huo et al. 2015). These
results suggest that C7 could increase electron transport in wt plants,
while Bm reduced it in nr plants according with increased respiration
and oxidative stress by C7 inoculation.

160
Chapter 1
Conclusions
In conclusion, both bacterial strains acts as PGPB under well
watered and drought conditions in ethylene-sensitive tomato plants. C7
inoculation promoted plant growth in wt and nr plants, and generally
reduced expression of ethylene biosynthesis genes in wt plants resulting
in stress alleviation. However, Bm inoculation induced expression of
ethylene-biosynthesis, -signaling and -response genes in nr plants
suggesting local ethylene emission in Bm-inoculated nr plants. Thus,
ETR3 mutation could impair interaction between Bm and tomato plants
resulting in miss-recognition and missing its PGPB activity. In
consequence, Bacillus megaterium and Enterobacter C7 PGPB activity
in tomato plants could be proposed as dependent and independent on
ethylene perception by ETR3, respectively.
Furthermore, PGPB inoculation modified the root transcriptomic
profiles in a mode dependent on strain, genotype and watering regime.
Flavonoid biosynthesis was affected by Bm inoculation enhancing
antioxidant status in wt plants, while nr plants respond avoiding
immune response but inhibiting complete interaction. Moreover, ETR3
mutation also affects to tomato-C7 interaction causing C7 inoculation
in wt plants higher respiration and carbon transport, and in nr plants
probably improved Fe nutrition leading to better growth even under
stress conditions. Furthermore, C7 could also modulate amino acid
metabolism and/or nitrogen use by plants. However, further research is
needed to clarify if PGPB are able to modulate these processes studying
PGPB effects in metabolites as well as in nutritional and antioxidant
statuses.

161
Chapter 2: PGPB inoculation modifies
photosynthetic traits and root metabolites as well
as nutritional and hormonal statuses with strong
influence of ethylene sensitivity

162
Chapter 2
Chapter 2: PGPB inoculation modifies photosynthetic
traits and root metabolites as well as nutritional and
hormonal statuses with strong influence of ethylene
sensitivity
Objective
The present chapter pursued to gain more insights into in plant-
microbe interactions regarding to ethylene sensitivity, with focus in
plant nutritional and phytohormonal statuses as well as photosynthetic
traits and root metabolites at two differential developmental stages.
Rhizospheric microorganisms are associated with nutrient
biogeochemical cycles (Barea et al. 2005), and plant-bacterial
interaction was reported as essential for better nutrition (Ryan et al.
2009). Moreover, nutritional and hormonal homeostasis are closely
coordinated to finely regulate plant growth and development (Krouk et
al. 2011), and metabolic information contribute with valuable
information to understand plant-bacteria interaction (Feussner and Polle
2015). Additionally, PGPB colonization of plant root system causes
physiological modifications as well as changes in metabolites (Su et al.
2016).
In consequence, the present study aimed to determine if ethylene
sensitivity is crucial for plant-bacteria interaction and growth induction
by these two PGPB strains in juvenile plants, and to evaluate the effects
of bacterial inoculation on plant physiology at both juvenile and mature
stages. In order to achieve exposed aims, plant growth, stomatal
conductance, photosynthetic efficiency, chlorophyll contents, nutrients,

163
Chapter 2
phytohormones and root metabolites were determined at 4 and 8 weeks
post-inoculation (wpi).
Experimental design
The experiment consisted of a randomized complete block design
with two plant lines: tomato cv. Pearson wild type and its ethylene-
insensitive mutant (never ripe), and three inoculation treatments: (1)
non-inoculated control plants, (2) Bacillus megaterium-inoculated
plants and (3) Enterobacter C7-inoculated plants. Experiment consisted
of 18 replicates per treatment and two different harvests were
established: 4 and 8 weeks post inoculation, using nine plants at each
harvest (n=9).
Wellwatered4 weeks
10 dayplantlets
PGPB Inoculation
Wellwatered4 weeksJuvenile
stageMaturestage
SampleCollection
Determination:
• Plant growth• Stomatal
conductance• Photosynthetic
efficiency• Chlorophyll contents• Nutrients• Phytohormones• Root metabolites
Seed Sterlizationand Germination
Day 0
Harvest4 wpi
Harvest8 wpi
Figure 2.1 Schematic representation of experimental design of chapter 2.
Weeks post-inoculation (wpi).

164
Chapter 2
Results
Biomass production of wt and nr plants inoculated with two
PGPB strains
Dry weight of wild type and never ripe plants inoculated with
PGPB strains (B. megaterium and Enterobacter C7) showed different
growth patterns at 4 and 8 weeks post-inoculation (wpi), but no
interaction between factors was noticed (Fig. 2.2). At 4 wpi, total and
shoot DWs showed no differences due to bacteria inoculation in wt and
nr plants neither due to plant genotype under different inoculations
(Fig. 2.2 A, C). However, root DW was increased by Bm inoculation in
nr plants, while no growth promotion in wt roots was observed.
Moreover, significant difference between wt and nr plants was only
observed in Bm-inoculated roots (Fig. 2.2 E).
At 8 wpi, total DW showed an increase due to PGPB inoculation
in wt plants (18.4% and 24.6% for Bm and C7, respectively).
Nevertheless, in nr plants total DW was only increased by C7
inoculation (25.5%), showing no significant differences due to Bm
inoculation (Fig. 2.2 B). Shoot DW was increased by C7 inoculation in
both plant genotypes (26.3% and 25.7% in wt and nr plants,
respectively). However, Bm inoculation did not produce significant
effect on shoot growth (Fig. 2.2 D). Moreover, significant difference
between plant genotypes was only noticed in non-inoculated plants in
total and shoot DWs (Fig. 2.2 B, D). In addition, root DW was
increased by PGPB inoculation in wt plants (15.8% and 18.1% for Bm
and C7, respectively), showing no significant differences in nr plants
(Fig. 2.2 F).

165
Chapter 2
0.0
2.0
4.0
6.0
8.0
10.0
12.0
wt nr
Sho
ot
Dry
We
igh
t(g
)
0.00
0.05
0.10
0.15
0.20
0.25
0.30
0.35
wt nr
Sho
ot
Dry
We
igh
t(g
)
0.00
0.01
0.02
0.03
0.04
0.05
0.06
0.07
0.08
wt nr
Ro
ot
Dry
We
igh
t(g
)
E
0.0
0.5
1.0
1.5
2.0
2.5
wt nr
Ro
ot
Dry
We
igh
t(g
)
FGxI ns GxI ns
A
0.00
0.05
0.10
0.15
0.20
0.25
0.30
0.35
0.40
0.45
wt nr
Tota
l Dry
We
igh
t(g
)
4 wpi
0.0
2.0
4.0
6.0
8.0
10.0
12.0
14.0
wt nrTo
tal D
ryW
eig
ht
(g)
B
8 wpi
GxI ns GxI ns
a
y
a
by
*z
ba a
y
z*y
ya
b
ab
*y
z
C DGxI ns GxI ns
Figure 2.2 Effects of bacterial inoculation on plant dry weights at 4 and 8 weeks
post-inoculation. (A) Total, (C) shoot and (E) root dry weights of wild type cv.
Pearson (wt) and never ripe (nr) tomato (Solanum lycopersicum) plants at 4 weeks
166
Chapter 2
post-inoculation (wpi). (B) Total, (D) shoot and (F) root dry weights of wild type cv.
Pearson (wt) and never ripe (nr) tomato plants at 8 wpi. Treatments are designed as
non-inoculated controls (No, black bars), Bacillus megaterium inoculated plants (Bm,
white bars), and Enterobacter C7 inoculated plants (C7, grey bars). Data are means ±
SE (n = 9). Data were analyzed by two-way ANOVA with plant genotype (G) and
inoculum (I) as sources of variation. Significance of sources of variation interaction
(GxI) was evaluated by P-value; ns, not significant; * P ≤ 0.05; ** P ≤ 0.01; *** P ≤
0.001. As no significant interaction between factors was noticed, inoculum effects
were evaluated analyzing separately wt and nr plants using ANOVA. Means followed
by different letters are significantly different (P < 0.05) according to LSD’s test, using
as highest value from letter a onwards for wt plants, and from letter z backwards for
nr plants. Plant genotype effect was evaluated analyzing wt and nr plants under the
same inoculation treatment (No, Bm or C7) by t-Student test and significant
difference (P < 0.05) is showed as (*) above nr means.
In order to analyze plant growth responses between the two
harvests, RGR was calculated showing interaction between factors in
total and root DWs (Fig. 2.3). In wt plants, RGRs were unaffected.
However, in nr plants RGR changed according to inoculated bacteria
and plant tissue (Fig. 2.3).
Total RGR showed the highest value in C7-inoculated nr plants
and the lowest value in Bm-inoculated ones, showing both of them
significant differences with control plants. Furthermore, no differences
due to plant genotype were noticed (Fig. 2.3 A). In shoots, C7-
inoculated nr plants increased RGR, but Bm inoculation did not affect
shoot RGR compared to control plants (Fig. 2.3 B). Furthermore, root
RGR was only decreased by Bm inoculation in nr plants and significant
difference between plant genotypes was exclusively noticed under Bm
inoculation (Fig. 2.3 C).

167
Chapter 2
0.110
0.115
0.120
0.125
0.130
0.135
wt nr
Tota
l RG
R (
g g-1
d-1
)
No Bm C7
B
C
A
BC BC AB
GxI *A
0.110
0.115
0.120
0.125
0.130
0.135
wt nr
Sho
ot
RG
R (
g g-1
d-1
)
z z
yB GxI ns
0.105
0.110
0.115
0.120
0.125
0.130
0.135
0.140
wt nr
Ro
ot
RG
R (
g g1
d-1
)
A
B
A
C
A A AGxI *
Figure 2.3 Effects of bacterial inoculation on relative growth rates. (A) Total, (B)
shoot and (C) root relative growth rates (RGR) of wild type cv. Pearson (wt) and
never ripe (nr) tomato (Solanum lycopersicum) plants at 8 weeks post-inoculation
(wpi). Treatments are designed as non-inoculated controls (No, black bars), Bacillus
megaterium inoculated plants (Bm, white bars), and Enterobacter C7 inoculated
plants (C7, grey bars). Data are means ± SE (n = 9). Data were analyzed by two-way
ANOVA with plant genotype (G) and inoculum (I) as sources of variation. Significance
of sources of variation interaction (GxI) was evaluated by P-value; ns, not significant;
* P ≤ 0.05; ** P ≤ 0.01; *** P ≤ 0.001. In case of significant interaction between
factors, all treatments were compared between each others. Means followed by
different capital letters are significantly different (P < 0.05) according to LSD’s test. In
case of not-significant interaction between factors, inoculum effects were evaluated

168
Chapter 2
analyzing separately wt and nr plants using ANOVA. Means followed by different
letters are significantly different (P < 0.05) according to LSD’s test, using as highest
value from letter a onwards for wt plants, and from letter z backwards for nr plants.
Plant genotype effect was evaluated analyzing wt and nr plants under the same
inoculation treatment (No, Bm or C7) by t-Student test and significant difference (P <
0.05) is showed as (*) above nr means, but genotype effect was unnoticed in shoot
RGR.
PGPB effects on stomatal conductance, photosynthetic
efficiency and chlorophyll content
Factor interaction was not significant in stomatal conductance,
photosynthetic efficiency and chlorophyll content (Table 2.1). Stomatal
conductance was affected by bacterial inoculation in both plant
genotypes only at 4 wpi, showing C7 inoculation increased stomatal
conductance independently of plant genotype (27.1% and 36.6% in wt
and nr plants, respectively). Moreover, Bm decreased stomatal
conductance by 17.3% in wt plants, showing no effect in nr plants. In
addition, significant differences between wt and nr plants in stomatal
conductance were only noticed under Bm inoculation at 4 wpi (higher
in nr plants) and under all inoculation treatments at 8 wpi (higher
values in wt plants) (Table 2.1). C7 did not affect photosynthetic
efficiency maintaining similar values to control plants. However, Bm
inoculation decreased this parameter independently of plant genotype
(25.8% and 10.9% in wt and nr plants, respectively). Significant
differences between wt and nr plants were only noticed in Bm-
inoculated plants with higher values in nr plants. Although
photosynthetic efficiency was not modified by bacterial inoculation at 8
wpi, significant plant genotype differences were noticed in non- and
C7-inoculated plants with higher values in wt plants (Table 2.1).
Chlorophyll content was unaltered by PGPB inoculation in both plant

169
Chapter 2
genotypes at both harvests. Moreover, significant plant genotype
difference was only noticed under Bm inoculation at 4 wpi (Table 2.1).
Table 2.1 Effects of bacterial inoculation on stomatal conductance photosynthetic
efficiency and chlorophyll content. Data were analyzed by two-way ANOVA with
plant genotype (G) and inoculum (I) as sources of variation. Data are means ± SE (n =
9). Significance of sources of variation interaction (GxI) was evaluated by P-value. As
no significant interaction between factors was noticed, inoculum effects were
evaluated analyzing separately wt and nr plants using ANOVA. Means followed by
different letters are significantly different (P < 0.05) according to LSD’s test, using as
highest value from letter a onwards for wt plants, and from letter z backwards for nr
plants. Plant genotype effect was evaluated analyzing wt and nr plants under the
same inoculation treatment (No, Bm or C7) by t-Student test and significant
difference (P < 0.05) is showed as (*) next to nr means.
Stomatal Conductance(mmol m-2s-1)
Photosyntheticefficiency (r_u)
Total
Clorophyll (mg cm-2)
4 wpi 8 wpi 4 wpi 8 wpi 4 wpi 8 wpi
wt No484.125 b+/- 30.503
131.636+/- 13.199
0.641 a+/- 0.017
0.727+/- 0.004
5.486
+/- 0.506
2.830
+/- 0.464
wt Bm400.222 c+/- 27.720
136.455+/- 13.644
0.476 b+/- 0.026
0.720+/- 0.005
5.446
+/- 0.420
2.682
+/- 0.379
wt C7615.313 a+/- 25.015
134.636+/- 13.304
0.590 a+/- 0.029
0.732+/- 0.005
5.146
+/- 0.481
2.937
+/- 0.389
P-value *** ns *** ns ns ns
nr No470.833 y+/- 22.065
97.910 *+/- 4.157
0.664 z+/- 0.018
0.699 *+/- 0.006
5.263
+/- 0.371
2.498
+/- 0.389
nr Bm499.833 y *+/- 31.429
100.273 *+/- 8.552
0.592 y *+/- 0.025
0.713+/- 0.008
5.011 *
+/- 0.233
2.598
+/- 0.580
nr C7643.333 z+/- 32.067
105.500 *+/- 5.973
0.660 z+/- 0.017
0.701 *+/- 0.005
5.228
+/- 0.367
2.831
+/- 0.582
P-value *** ns * ns ns ns
Significance of source of variation
G x I ns ns ns ns ns ns
Treatments: non-inoculated, Bacillus megaterium-inoculated and Enterobacter C7-
inoculated wild-type plants (wt No, wt Bm and wt C7, respectively) and non-
inoculated, Bacillus megaterium-inoculated and Enterobacter C7-inoculated never
ripe plants (nr No, nr Bm and nr C7 respectively).
P-value; ns, not significant; * P ≤ 0.05; ** P ≤ 0.01; *** P ≤ 0.001.

170
Chapter 2
PGPB effects on plant nutritional status
In order to throw some light on PGPB inoculation effects on plant
nutrition regarding ethylene insensitivity, macro- and micronutrients
were quantified in roots and shoots (Tables 2.2 and 2.3, respectively).
In case of root nutrients, factor interaction was only significant in
Ca concentration at 8 wpi (Table 2.2). Root nutrients showed no
significant differences due to PGPB inoculation in wt plants at 4 wpi.
However, Na level was decreased by C7 inoculation in nr plants at 4
wpi. Moreover, Zn concentration was higher in C7- regarding Bm-
inoculated nr plants showing no differences compared to control ones.
Furthermore, Mn concentration showed significant differences between
wt and nr plants showing nr plants higher values than wt ones under all
inoculation treatments (Table 2.2).
In contrast, several changes were noticed due to PGPB
inoculation and ethylene insensitivity at 8 wpi. In wt plants, C
concentration was increased by both bacterial inoculations (1.8% and
3.2% by Bm and C7, respectively), and Ca concentration was increased
only by Bm inoculation. Most changes were found in nr plants,
showing a general reduction by bacterial inoculation. C7 inoculation
decreased Cu, Mg, S and Si concentrations in nr plants. In the case of
Bm-inoculated nr plants, only Cu, Mg and Si concentrations were
decreased compared to non-inoculated plants. Moreover, some
differences between inocula were observed in Cu and Si
concentrations, decreasing to a greater extent after C7 inoculation than
after Bm inoculation. Furthermore, significant differences between
plant genotypes were noticed for several nutrients. Ca concentration
showed higher values in wt plants under all inoculations. C

171
Chapter 2
concentration was higher in nr than wt plants only in non-inoculated
plants. Exclusively under Bm inoculation, Na concentration was higher
in wt plants. Under C7 inoculation, Mn showed higher level in nr
plants, while Si showed higher levels in wt ones. Finally, Cu, Mg and S
concentrations were significantly lower in nr than in wt plants under
both bacterial inoculations (Table 2.2).
Regarding shoot nutrients, several changes were noticed in wt
and nr plants at 4 and 8 wpi. Moreover, factor interaction was
significant for Cu, Fe and P concentrations at 8 wpi (Table 2.3).
At 4 wpi, C7 inoculation did not affect shoot nutrients, while Bm
inoculation modified nutrients in both plant genotypes. The C
concentration was increased by Bm inoculation of wt plants. Moreover,
Bm inoculation decreased N and Mn concentrations in wt plants, and
Zn and Fe concentrations in nr plants. In addition, significant
differences between wt and nr plants were noticed for Cu, Mn and Zn
under all inoculation treatments showing nr plants lower values than wt
plants. Moreover, significant differences between plants genotypes
were noticed in non-inoculated plants only for Mg level, and under
both bacterial inoculations for Ca concentration, showing higher
concentration in wt plants in all cases (Table 2.3).

172
Chapter 2
Tre
atm
en
ts:
no
n-i
no
cula
ted
,B
aci
llu
sm
eg
ate
riu
m-i
no
cula
ted
an
dE
nte
rob
act
er
C7
-in
ocu
late
dw
ild
-ty
pe
pla
nts
(wt
No
,w
tB
ma
nd
wt
C7
)a
nd
no
n-i
no
cula
ted
,B
aci
llu
s
me
ga
teri
um
-in
ocu
late
da
nd
En
tero
ba
cte
rC
7-i
no
cula
ted
ne
ve
rri
pe
pla
nts
(nr
No
,n
rB
ma
nd
nr
C7
resp
ect
ive
ly).
na
:n
ot-
ap
pli
cab
le;
P-v
alu
e;
ns,
no
tsi
gn
ific
an
t;*
P≤
0.0
5;
**
P≤
0.0
1;
**
*P
≤0
.00
1.
Gx
I:G
en
oty
pe
*In
ocu
lum
Ta
ble
2.2
Eff
ect
so
fb
act
eri
al
ino
cula
tio
no
nro
ot
nu
trie
nt
con
cen
tra
tio
ns.
Ro
ot
nu
trie
nt
con
cen
tra
tio
ns
incv
Pe
ars
on
tom
ato
pla
nts
at
two
ha
rve
stti
me
s:4
an
d8
we
eks
po
st-i
no
cula
tio
n(w
pi)
.D
ata
we
rea
na
lyze
db
ytw
o-w
ay
AN
OV
Aw
ith
pla
nt
ge
no
typ
e(G
)a
nd
ino
culu
m(I
)a
sso
urc
es
of
va
ria
tio
n.
Da
taa
rem
ea
ns
±S
E(n
=4
).Sig
nif
ica
nce
of
sou
rce
so
fv
ari
ati
on
inte
ract
ion
(GxI
)w
as
ev
alu
ate
db
yP
-va
lue
.In
case
of
sig
nif
ica
nt
inte
ract
ion
be
twe
en
fact
ors
,a
lltr
ea
tme
nts
we
reco
mp
are
db
etw
ee
ne
ach
oth
ers
.
Me
an
sfo
llo
we
db
yd
iffe
ren
tca
pit
al
lett
ers
are
sig
nif
ica
ntl
yd
iffe
ren
t(P
<0
.05
)a
cco
rdin
gto
LSD
’ste
st.
Inca
seo
fn
ot-
sig
nif
ica
nt
inte
ract
ion
be
twe
en
fact
ors
,in
ocu
lum
eff
ect
sw
ere
eva
lua
ted
an
aly
zin
gse
pa
rate
lyw
ta
nd
nr
pla
nts
usi
ng
AN
OV
A.
Me
an
sfo
llo
we
db
yd
iffe
ren
tle
tte
rsa
resi
gn
ific
an
tly
dif
fere
nt
(P<
0.0
5)
acc
ord
ing
toLS
D’s
test
,
usi
ng
as
hig
he
stv
alu
efr
om
lett
er
ao
nw
ard
sfo
rw
tp
lan
ts,
an
dfr
om
lett
er
zb
ack
wa
rds
for
nr
pla
nts
.P
lan
tg
en
oty
pe
eff
ect
wa
se
va
lua
ted
an
aly
zin
gw
ta
nd
nr
pla
nts
un
de
r
the
sam
ein
ocu
lati
on
tre
atm
en
t(N
o,
Bm
or
C7
)b
yt-
Stu
de
nt
test
an
dsi
gn
ific
an
td
iffe
ren
ce(P
<0
.05
)is
sho
we
da
s(*
)a
bo
ve
nr
me
an
s.
Ca
rbo
n(%
DW
)N
itro
ge
n(%
DW
)C
alc
ium
(% D
W)
Co
op
er
(pp
m)
Iro
n(p
pm
)P
ota
ssiu
m(%
DW
)M
ag
ne
siu
m(%
DW
)M
an
ga
ne
se(p
pm
)S
od
ium
(% D
W)
Ph
osp
ho
rus
(% D
W)
Su
lph
ur
(% D
W)
Sil
ico
n(%
DW
)Z
inc
(pp
m)
wp
i4
84
84
84
84
84
84
84
84
84
84
84
84
8
wt
No
41
.8+
/-0
.5
44
.3
+/- 0.3
b
2.5
0+
/-0
.10
1.3
8
+/-
0.0
5
0.8
8
+/-
0.0
4
0.8
1
+/-
0.0
2A
5.8
0
+/-
0.9
5
15
.72
+/-
2.8
7
30
6.1
2 +
/-8
0.8
5
10
0.1
1 +
/-2
0.7
7
0.7
7+
/-0
.32
0.5
6+
/-0
.08
0.2
8
+/-
0.0
3
0.5
9
+/-
0.0
8
11
3.0
2 +
/-1
5.7
4
32
.13
+
/-3
.00
0.2
6
+/-
0.0
5
0.6
3
+/-
0.0
6
0.2
7
+/-
0.0
6
0.1
8
+/-
0.0
2
0.1
8
+/-
0.0
6
0.2
02
+/-
0.0
16
0.1
0+
/-0
.06
0.0
52
+/-
0.0
06
24
.14
+/-
4.8
4
29
.86
+
/-3
.55
wt
Bm
41
.6
+/-
0.2
45
.1
+/-
0.3
a
2.5
7
+/-
0.1
4
1.3
6
+/-
0.0
3
0.7
5
+/-
0.0
3
0.8
9
+/-
0.0
1A
B
8.3
3
+/-
0.4
0
12
.37
+
/-0
.62
37
4.9
7 +
/-7
0.0
2
10
8.8
4 +
/-1
7.2
1
1.1
6
+/-
0.1
6
0.3
9
+/-
0.0
7
0.4
1
+/-
0.0
5
0.4
9
+/-
0.0
5
10
9.1
8 +
/-2
.20
38
.08
+
/-4
.93
0.4
2
+/-
0.0
6
0.7
1
+/-
0.0
4
0.3
9
+/-
0.0
4
0.2
0
+/-
0.0
1
0.2
9
+/-
0.0
4
0.2
07
+/-
0.0
06
0.1
1
+/-
0.0
1
0.0
61
+/-
0.0
08
28
.50
+
/-2
.57
34
.36
+
/-1
.87
wt
C7
41
.7
+/-
0.3
45
.7
+/- 0.1 a
2.4
4
+/-
0.0
6
1.3
3+
/-0
.04
0.8
1
+/-
0.0
7
0.8
5
+/-
0.0
4B
6.6
8
+/-
0.4
4
12
.28
+
/-0
.51
46
0.8
1 +
/-4
1.2
5
94
.27
+
/-2
5.8
4
1.1
7+
/-0
.19
0.4
2
+/-
0.0
5
0.3
7
+/-
0.0
1
0.5
1
+/-
0.0
4
14
2.6
9+
/-9
.01
30
.95
+
/-2
.00
0.3
0
+/-
0.0
4
0.6
0
+/-
0.0
6
0.3
4
+/-
0.0
6
0.1
8
+/-
0.0
2
0.2
4
+/-
0.0
3
0.1
93
+/-
0.0
08
0.1
6
+/-
0.0
2
0.0
53
+/-
0.0
03
30
.98
+
/-4
.49
34
.80
+
/-4
.32
P-v
alu
en
a*
na
na
na
na
na
ns
na
na
na
na
na
na
ns
na
ns
na
na
na
na
ns
na
na
na
na
nr
No
42
.1+
/-0
.6
45
.3
+/-
0.2
2.7
6
+/-
0.0
3
1.3
7
+/-
0.0
4
0.7
4
+/-
0.0
1
0.6
0
+/-
0.0
2C
6.4
6
+/-
0.5
0
10
.39
+
/-0
.26
z
17
3.6
9+
/-7
.89
69
.79
+
/-2
.21
1.2
0
+/-
0.1
1
0.3
4
+/-
0.0
4
0.2
8
+/-
0.0
1
0.3
4
+/-
0.0
1
21
7.8
7 +
/-1
4.3
2*
56
.92
+
/-3
.86
0.3
7
+/-
0.0
3z
0.5
1
+/-
0.0
3
0.3
7+
/-0
.03
0.1
8
+/-
0.0
1
0.2
8
+/-
0.0
1
0.1
91
+/-
0.0
09
z
0.0
6
+/-
0.0
1
0.0
47
+
/-0
.00
2
32
.55
+
/-1
.59
38
.24
+
/-5
.47
nr
Bm
42
.4
+/-
0.4
45
.2
+/- 0.2
2.5
6
+/-
0.0
7
1.4
3
+/-
0.0
9
0.7
3
+/-
0.0
4
0.5
3
+/-
0.0
3C
6.3
2
+/-
0.3
4
8.8
1
+/-
0.5
5y
*
21
8.8
8 +
/-3
9.2
0
57
.13
+
/-2
.63
1.1
5
+/-
0.0
7
0.3
0
+/-
0.0
2
0.2
9
+/-
0.0
1
0.2
7
+/-
0.0
1*
20
1.1
0 +
/-8
.36
*
49
.34
+
/-5
.88
*
0.3
6+
/-0
.02
z
0.4
4
+/-
0.0
3*
0.3
7
+/-
0.0
1
0.1
8
+/-
0.0
1
0.3
2
+/-
0.0
1
0.1
81
+
/-0
.00
7
z *
0.0
7
+/-
0.0
1
0.0
40
+
/-0
.00
2
29
.62
+/-
0.3
8
32
.11
+
/-2
.32
nr
C7
42
.8
+/-
0.2
45
.9
+/-
0.4
2.5
6
+/-
0.1
0
1.4
5
+/-
0.0
3
0.7
2
+/-
0.0
1
0.5
3
+/-
0.0
1C
8.1
8
+/-
1.4
2
7.1
8+
/-0
.62
x *
30
3.7
9 +
/-9
7.4
3
63
.58
+/-
14
.19
1.3
1
+/-
0.0
2
0.2
5
+/-
0.0
4
0.2
9
+/-
0.0
2
0.2
5
+/-
0.0
1*
24
6.0
9+
/-1
0.5
5*
42
.64
+
/-3
.75
*
0.2
6
+/-
0.0
1y
0.4
2
+/-
0.0
2
0.4
0
+/-
0.0
1
0.1
6
+/-
0.0
1
0.2
9
+/-
0.0
2
0.1
50
+
/-0
.00
2y
*
0.1
0
+/-
0.0
3
0.0
31
+
/-0
.00
2*
36
.30
+
/-1
.44
25
.86
+
/-0
.52
P-v
alu
en
an
sn
an
an
an
an
a*
*n
an
an
an
an
an
an
sn
a*
na
na
na
na
*n
an
an
an
a
Sig
nif
ica
nce
of
sou
rce
of
va
ria
tio
n
G x
In
sn
sn
sn
sn
s*
ns
ns
ns
ns
ns
ns
ns
ns
ns
ns
ns
ns
ns
ns
ns
ns
ns
ns
ns
ns

173
Chapter 2
Ca
rbo
n(%
DW
)N
itro
ge
n(%
DW
)C
alc
ium
(% D
W)
Co
op
er
(pp
m)
Iro
n(p
pm
)P
ota
ssiu
m(%
DW
)M
ag
ne
siu
m(%
DW
)M
an
ga
ne
se(p
pm
)S
od
ium
(% D
W)
Ph
osp
ho
rus
(% D
W)
Su
lph
ur
(% D
W)
Sil
ico
n(%
DW
)Z
inc
(pp
m)
wp
i4
84
84
84
84
84
84
84
84
84
84
84
84
8
wt
No
39
.0
+/-
0.2
b
39
.1
+/-
0.2
5.0
6
+/-
0.1
8a
0.8
4
+/-
0.0
2
2.2
9
+/-
0.1
0
1.8
5
+/-
0.0
7
5.6
3
+/-
0.2
2
2.6
5
+/-
0.0
5B
88
.42
+
/-3
.85
23
.83
+
/-0
.90
B
2.0
6
+/-
0.0
6
1.4
8
+/-
0.0
8
0.2
6
+/-
0.0
1
0.3
1
+/-
0.0
1
12
3.0
0 +
/-2
.00
a
10
9.8
7 +
/-3
.63
0.1
6
+/-
0.0
3
0.0
53
+
/-0
.00
4
0.5
7
+/-
0.0
2
0.2
7
+/-
0.0
1A
0.5
9
+/-
0.0
3
0.3
2
+/-
0.0
2
0.0
57
+
/-0
.05
nd
67
.70
+
/-1
.66
29
.31
+
/-1
.41
wt
Bm
40
.0
+/-
0.1
a
39
.6
+/-
0.2
4.4
2
+/-
0.1
7b
0.8
4
+/-
0.0
3
2.3
4
+/-
0.0
8
1.7
3
+/-
0.0
7
5.3
7
+/-
0.2
6
2.4
2
+/-
0.0
3B
C
85
.10
+
/-7
.52
21
.71
+
/-1
.69
B
1.7
9
+/-
0.0
9
1.3
2
+/-
0.0
5
0.2
6
+/-
0.0
2
0.3
0
+/-
0.0
1
11
4.7
7 +
/-2
.10
b
10
5.0
0 +
/-4
.32
0.1
2
+/-
0.0
1
0.0
48
+
/-0
.00
4
0.4
9
+/-
0.0
3
0.2
7
+/-
0.0
1A
B
0.6
0
+/-
0.0
4
0.3
0
+/-
0.0
2
0.0
55
+
/-0
.00
3n
d6
0.6
6
+/-
3.0
4
28
.40
+
/-1
.39
wt
C7
38
.4
+/-
0.6
b
39
.1
+/-
0.1
5.4
1
+/-
0.2
4a
0.8
9
+/-
0.0
4
2.2
3
+/-
0.0
6
1.7
7
+/-
0.0
6
5.5
7
+/-
0.2
6
3.0
0
+/-
0.1
5A
84
.10
+
/-3
.01
31
.75
+
/-4
.25
A
1.9
3
+/-
0.1
7
1.3
3
+/-
0.0
6
0.2
5
+/-
0.0
2
0.3
3
+/-
0.0
2
12
5.9
5 +
/-2
.35
a
10
6.9
2 +
/-4
.70
0.1
7
+/-
0.0
2
0.0
53
+
/-0
.00
6
0.5
7
+/-
0.0
4
0.2
8
+/-
0.0
1A
0.6
1
+/-
0.0
4
0.3
3
+/-
0.0
2
0.0
56
+
/-0
.00
5n
d6
9.8
7
+/-
2.8
0
30
.94
+
/-1
.14
P-v
alu
e*
na
*n
an
an
an
an
an
an
an
an
an
an
a*
*n
sn
an
an
sn
an
an
an
an
an
sn
a
nr
No
40
.1
+/-
0.5
39
.3
+/-
0.6
4.9
9
+/-
0.1
9
0.8
4
+/-
0.0
5
2.1
0
+/-
0.0
7
1.2
6
+/-
0.0
7*
4.1
4
+/-
0.1
9*
2.5
3
+/-
0.1
4B
86
.57
+/-
3.5
6
21
.97
+
/-2
.14
B
1.6
8
+/-
0.1
5
1.2
3
+/-
0.0
6*
0.2
2
+/-
0.0
1*
0.2
2
+/-
0.0
1*
11
2.2
2 +
/-3
.32
*
89
.08
+
/-5
.45
*
0.1
2
+/-
0.0
1
0.0
84
+/-
0.0
05
*
0.4
9
+/-
0.0
3
0.2
7
+/-
0.0
1A
0.5
4
+/-
0.0
5
0.2
7
+/-
0.0
3
0.0
51
+
/-0
.00
4n
d
57
.39
+/-
1.6
7z
*
27
.84
+
/-1
.68
nr
Bm
40
.2
+/-
0.3
39
.9
+/-
0.1
4.8
4
+/-
0.0
8
0.9
6+
/-0
.05
2.1
1
+/-
0.0
6*
1.3
2
+/-
0.0
5*
4.5
0
+/-
0.1
8*
2.5
2
+/-
0.1
5B
76
.02
+
/-1
.31
27
.68
+
/-2
.22
AB
1.7
6
+/-
0.0
9
1.3
1
+/-
0.0
7
0.2
2
+/-
0.0
1
0.2
3
+/-
0.0
1*
10
5.3
7 +
/-1
.74
*
92
.59
+
/-6
.21
0.1
2
+/-
0.0
1
0.0
81
+/-
0.0
07
*
0.4
6
+/-
0.0
2
0.2
9
+/-
0.0
2A
0.5
7
+/-
0.0
2
0.2
8
+/-
0.0
2
0.0
48
+
/-0
.00
3n
d
50
.33
+/-
1.7
1y
*
26
.46
+
/-1
.69
nr
C7
38
.4
+/-
1.1
40
.1
+/-
0.1 *
5.3
4
+/-
0.1
6
0.8
8
+/-
0.0
3
1.9
6
+/-
0.0
6*
1.1
7
+/-
0.0
6*
4.3
5
+/-
0.1
9*
2.1
5
+/-
0.0
5C
84
.22
+
/-2
.69
22
.25
+
/-1
.19
B
1.8
8
+/-
0.0
7
1.1
1
+/-
0.0
5*
0.2
2+
/-0
.00
4
0.2
0
+/-
0.0
1*
11
3.6
8 +
/-2
.83
*
87
.00
+/-
4.3
7*
0.1
3
+/-
0.0
2
0.0
62
+
/-0
.00
2
0.5
2
+/-
0.0
1
0.2
3
+/-
0.0
1B
0.5
5
+/-
0.0
3
0.2
3
+/-
0.0
1*
0.0
49
+/-
0.0
03
nd
56
.01
+
/-1
.08
z *
23
.14
+
/-1
.11
*
P-v
alu
en
sn
an
sn
an
an
an
an
an
an
an
an
an
an
an
sn
sn
an
an
sn
an
an
an
an
a*
na
Sig
nif
ica
nce
of
sou
rce
of
va
ria
tio
n
G x
In
sn
sn
sn
sn
sn
sn
s*
**
ns
*n
sn
sn
sn
sn
sn
sn
sn
sn
s*
ns
ns
ns
-n
sn
s
Ta
ble
2.3
Eff
ect
so
fb
act
eri
al
ino
cula
tio
no
nsh
oo
tn
utr
ien
tco
nce
ntr
ati
on
s.S
ho
ot
nu
trie
nt
con
cen
tra
tio
ns
incv
Pe
ars
on
tom
ato
pla
nts
at
two
ha
rve
stti
me
s:4
an
d8
we
eks
po
st-i
no
cula
tio
n(w
pi)
.D
ata
we
rea
na
lyze
db
ytw
o-w
ay
AN
OV
Aw
ith
pla
nt
ge
no
typ
e(G
)a
nd
ino
culu
m(I
)a
sso
urc
es
of
va
ria
tio
n.
Da
taa
rem
ea
ns
±SE
(n=
4).
Sig
nif
ica
nce
of
sou
rce
so
fva
ria
tio
nin
tera
ctio
n(G
xI)
wa
se
va
lua
ted
by
P-v
alu
e.
Inca
seo
fsi
gn
ific
an
tin
tera
ctio
nb
etw
ee
nfa
cto
rs,
all
tre
atm
en
tsw
ere
com
pa
red
be
twe
en
ea
cho
the
rs.
Me
an
sfo
llow
ed
by
dif
fere
nt
cap
ita
lle
tte
rsa
resi
gn
ific
an
tly
dif
fere
nt
(P<
0.0
5)
acc
ord
ing
toLS
D’s
test
.In
case
of
no
t-si
gn
ific
an
tin
tera
ctio
nb
etw
ee
nfa
cto
rs,
ino
culu
me
ffe
cts
we
ree
va
lua
ted
an
aly
zin
gse
pa
rate
lyw
ta
nd
nr
pla
nts
usi
ng
AN
OV
A.
Me
an
sfo
llo
we
db
yd
iffe
ren
tle
tte
rsa
resi
gn
ific
an
tly
dif
fere
nt
(P<
0.0
5)
acc
ord
ing
to
LSD
’ste
st,
usi
ng
as
hig
he
stv
alu
efr
om
lett
er
ao
nw
ard
sfo
rw
tp
lan
ts,
an
dfr
om
lett
er
zb
ack
wa
rds
for
nr
pla
nts
.P
lan
tg
en
oty
pe
eff
ect
wa
se
va
lua
ted
an
aly
zin
gw
ta
nd
nr
pla
nts
un
de
rth
esa
me
ino
cula
tio
ntr
ea
tme
nt
(No
,B
mo
rC
7)
by
t-S
tud
en
tte
sta
nd
sig
nif
ica
nt
dif
fere
nce
(P<
0.0
5)
issh
ow
ed
as
(*)
ab
ov
en
rm
ea
ns.
Tre
atm
en
ts:
no
n-i
no
cula
ted
,B
aci
llu
sm
eg
ate
riu
m-i
no
cula
ted
an
dE
nte
rob
act
er
C7
-in
ocu
late
dw
ild
-ty
pe
pla
nts
(wt
No
,w
tB
ma
nd
wt
C7
,re
spe
ctiv
ely
)a
nd
no
n-i
no
cula
ted
,
Ba
cill
us
me
ga
teri
um
-in
ocu
late
da
nd
En
tero
ba
cte
rC
7-i
no
cula
ted
ne
ve
rri
pe
pla
nts
(nr
No
,n
rB
ma
nd
nr
C7
resp
ect
ive
ly).
nd
:n
on
-de
tect
ed
;n
a:
no
t-a
pp
lica
ble
;P
-va
lue
;n
s,n
ot
sig
nif
ica
nt;
*P
≤0
.05
;*
*P
≤0
.01
;*
**
P≤
0.0
01
.

174
Chapter 2
At 8 wpi, Bm only increased C level in wt plants showing no
effect on shoot nutrition of nr plants. However, C7 inoculation
increased Cu and Fe concentrations in wt plants and decreased Cu, Na
and P concentrations in nr plants. Furthermore, significant differences
between plant genotypes were noticed for several nutrients. Ca and Mg
concentrations showed higher values in wt than in nr plants under all
inoculation treatments. In case of Na, genotype differences were
observed in non- and Bm-inoculated plants with higher values in nr
plants. Moreover, significant differences between wt and nr plants were
noticed for K and Mn in non- and C7-inoculated plants showing both
higher values in wt plants. Finally, significant differences were
exclusively noticed under C7 inoculation for C, Cu, Fe, P and Zn
concentrations, showing higher values for C in nr plants and for Cu, Fe,
P and Zn in wt plants (Table 2.3).
Nutrient concentrations and plant DWs were assessed by Pearson
correlation analysis (Table 2.4). A positive correlation was observed
between root S concentration and total, shoot and root DWs at 4 wpi.
Meanwhile, shoot Fe concentration showed a strong negative
correlation with all DWs at this time. At 8 wpi, DWs were correlated
with several nutrients. Indeed, a positive correlation was found between
the root C concentration and all DWs. Moreover, negative correlations
were obtained between total DW and root Cu, K and S concentrations.
Shoot K concentration was also negatively correlated with total DW. In
addition, shoot DW showed the same correlations as total DW (Table
2.4).

175
Chapter 2
Table 2.4 Pearson correlations between plant dry weights and nutrient contents.
Tissue Root Shoot
NutrientCarbon(% DW)
Copper(ppm)
Iron(ppm)
Potassium(% DW)
Sulphur(% DW)
Carbon(% DW)
Copper(ppm)
Iron(ppm)
Potassium(% DW)
Sulphur(% DW)
4 w
eeks
po
st in
ocu
lati
on Total
DW
r 0.376 0.177 -0.155 0.523 0.809 0.396 -0.371 -0.973 -0.540 -0.078
P-value 0.449 0.732 0.764 0.266 0.033 0.421 0.455 0.000 0.247 0.881
ShootDW
r 0.359 0.179 -0.148 0.510 0.805 0.407 -0.355 -0.971 -0.535 -0.063
P-value 0.472 0.729 0.774 0.281 0.035 0.407 0.476 0.000 0.252 0.903
RootDW
r 0.418 0.172 0.172 -0.172 0.818 0.368 -0.411 -0.974 -0.549 -0.116
P-value 0.393 0.745 0.740 0.739 0.030 0.459 0.402 0.000 0.237 0.823
8 w
eeks
po
st in
ocu
lati
on Total
DW
r 0.916 -0.848 -0.502 -0.836 -0.849 0.715 -0.479 -0.016 -0.901 -0.687
P-value 0.004 0.018 0.290 0.023 0.018 0.086 0.316 0.975 0.006 0.107
ShootDW
r 0.921 -0.868 -0.541 -0.854 -0.865 0.714 -0.489 -0.043 -0.920 -0.714
P-value 0.003 0.013 0.246 0.017 0.014 0.087 0.305 0.935 0.003 0.087
RootDW
r 0.810 -0.661 -0.225 -0.661 -0.686 0.669 -0.385 0.149 -0.714 -0.465
P-value 0.033 0.129 0.661 0.128 0.108 0.122 0.436 0.773 0.087 0.334
DW: Dry Weight
Root nutrient concentrations and total, shoot and root DWs values
were used to build a data matrix in order to perform a principal
component analysis (PCA) to compare inoculation treatments in both
plant genotypes (Fig. 2.4). Axes PC1 and PC2, represented in the
factorial plan, explained 55.2% of data variability at 4 wpi. PCA
separated treatments by plant genotype. In wt plants, Bm inoculation
produced separation from control plants, meanwhile C7-inoculated
plants shared a tiny area with control ones. However, both bacterial
effects were mostly overlapped. Also, both bacterial inoculations
shared a little area with non-inoculated nr plants without overlapping
each other (Fig. 2.4 A). The nutrients with a greater contribution to the
observed variability were K, P, S and Zn for PC1, and Fe, Mg and Si
for PC2 (Fig. 2.4 B).
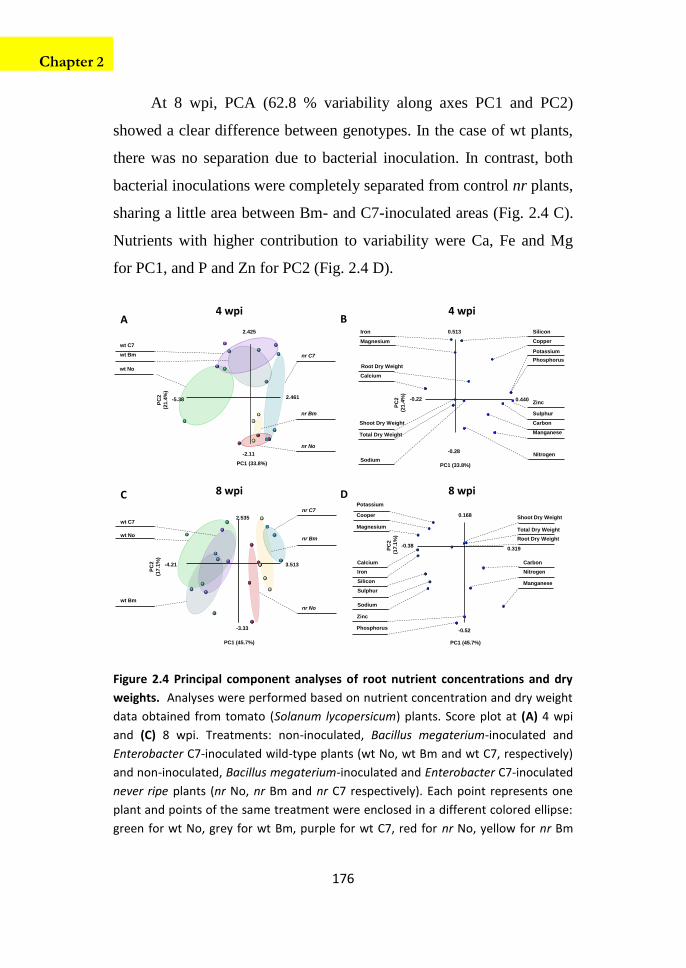
176
Chapter 2
At 8 wpi, PCA (62.8 % variability along axes PC1 and PC2)
showed a clear difference between genotypes. In the case of wt plants,
there was no separation due to bacterial inoculation. In contrast, both
bacterial inoculations were completely separated from control nr plants,
sharing a little area between Bm- and C7-inoculated areas (Fig. 2.4 C).
Nutrients with higher contribution to variability were Ca, Fe and Mg
for PC1, and P and Zn for PC2 (Fig. 2.4 D).
0.440-0.22
0.513
-0.28
PC1 (33.8%)
PC
2
(21.4
%)
Iron Silicon
Copper
Zinc
Potassium
Phosphorus
Manganese
Magnesium
Sulphur
Carbon
Calcium
Total Dry Weight
Shoot Dry Weight
Root Dry Weight
SodiumNitrogen
B4 wpi
3.513-4.21
2.535
-3.33
PC1 (45.7%)
PC
2
(17.1
%)
nr C7
wt Bm
wt Nonr Bm
wt C7
nr No
C 8 wpi
2.461-5.38
2.425
-2.11
PC1 (33.8%)
PC
2
(21.4
%)
wt No
nr No
nr C7
wt C7
nr Bm
wt Bm
A4 wpi
0.319-0.38
0.168
-0.52
PC1 (45.7%)
PC
2
(17.1
%)
Phosphorus
Manganese
Zinc
Sodium
Magnesium
Iron
Calcium
Sulphur
Cooper
Potassium
Silicon
Nitrogen
Carbon
Total Dry Weight
Shoot Dry Weight
Root Dry Weight
D 8 wpi
Figure 2.4 Principal component analyses of root nutrient concentrations and dry
weights. Analyses were performed based on nutrient concentration and dry weight
data obtained from tomato (Solanum lycopersicum) plants. Score plot at (A) 4 wpi
and (C) 8 wpi. Treatments: non-inoculated, Bacillus megaterium-inoculated and
Enterobacter C7-inoculated wild-type plants (wt No, wt Bm and wt C7, respectively)
and non-inoculated, Bacillus megaterium-inoculated and Enterobacter C7-inoculated
never ripe plants (nr No, nr Bm and nr C7 respectively). Each point represents one
plant and points of the same treatment were enclosed in a different colored ellipse:
green for wt No, grey for wt Bm, purple for wt C7, red for nr No, yellow for nr Bm

177
Chapter 2
and blue for nr C7. Loading plot at (B) 4 wpi and (D) 8 wpi. Each point represents one
nutrient or dry weight.
PGPB effects on plant phytohormonal status
PGPB inoculation effects on phytohormones were studied
regarding ethylene sensitivity in roots and shoots, evaluating ethylene,
IAA, ABA, SA, JA and JA-Ile concentrations at 4 and 8 wpi (Tables
2.5 and 2.6, respectively). Factor interaction was only noticed in root
ABA concentration at 4 wpi.
At 4 wpi, JA and JA-Ile levels were unaffected by PGPB
inoculation neither by plant genotype (data not shown). Exclusively, C7
inoculation increased root ABA concentration in nr plants, while no
changes were noticed in wt plants. Moreover, significant difference
between wt and nr plants was only observed in C7-inoculated roots
(higher levels in nr plants) and unnoticed in shoots (Table 2.5). In case
of ethylene, genotype differences were observed in non- and Bm-
inoculated roots and in non- and C7-inoculated shoots showing nr
plants higher ethylene levels than wt ones in all cases (Table 2.5).
Moreover, differences between wt and nr plants were noticed for
IAA concentration in non- and C7-inoculated roots and exclusively
under C7 inoculation in shoots showing nr plants higher levels than wt
ones (Table 2.5). Finally, genotype difference in SA concentration was
only noticed in Bm-inoculated shoots with higher values in nr plants
(Table 2.5).

178
Chapter 2
Table 2.5 Effects of bacterial inoculation on phytohormone concentrations at 4
weeks post-inoculation. Data were analyzed by two-way ANOVA with plant
genotype (G) and inoculum (I) as sources of variation. Data are means ± SE (n = 6).
Significance of sources of variation interaction (GxI) was evaluated by P-value. In
case of significant interaction between factors, all treatments were compared
between each others. Means followed by different capital letters are significantly
different (P < 0.05) according to LSD’s test. In case of not-significant interaction
between factors, inoculum effects were evaluated analyzing separately wt and nr
plants using ANOVA, but inoculums effects were unnoticed. Plant genotype effect
was evaluated analyzing wt and nr plants under the same inoculation treatment (No,
Bm or C7) by t-Student test and significant difference (P < 0.05) is showed as (*)
below nr means.
Tissue Root Shoot
HormoneEthylene
(nmol g-1h-1)IAA
(pmol g-1)ABA
(pmol g-1)SA
(pmol g-1)Ethylene
(nmol g-1h-1)IAA
(pmol g-1)ABA
(pmol g-1)SA
(pmol g-1)
wt No3.05+/-
0.24
88.52+/-
4.38
37.65+/-
4.91BC
80.33+/-
6.30
0.88+/-
0.05
42.07+/-
3.19
669.22+/-
36.47
224.89+/-
43.23
wt Bm3.89+/-
0.28
79.13+/-
2.16
30.18+/-
1.96C
67.65+/-
3.53
1.03+/-
0.12
38.53+/-
2.34
676.00+/-
12.40
216.23+/-
6.69
wt C73.55+/-
0.24
82.34+/-
3.62
32.32+/-
2.89C
68.03+/-
8.60
1.21+/-
0.15
37.64+/-
1.67
655.35+/-
17.35
240.28+/-
25.36
P-value na ns na na na na na na
nr No
6.70+/-
0.49*
108.66+/-
7.21*
42.00+/-
1.04B
68.20+/-
4.60
2.02+/-
0.32*
41.95+/-
1.15
710.53+/-
28.63
226.43+/-
15.23
nr Bm
5.91+/-
0.53*
96.64+/-
6.83
37.05+/-
1.51BC
72.13+/-
8.08
1.38+/-
0.20
44.20+/-
2.53
862.62+/-
86.44
265.35+/-
15.01*
nr C75.40+/-
1.07
119.92+/-
3.69*
51.42+/-
3.23A
87.75+/-
11.59
2.23+/-
0.31*
46.17+/-
1.60*
693.38+/-
13.18
226.86+/-
16.30
P-value na ns na na na na na na
Treatments: non-inoculated, Bacillus megaterium-inoculated and Enterobacter C7-
inoculated wild-type plants (wt No, wt Bm and wt C7, respectively) and non-
inoculated, Bacillus megaterium-inoculated and Enterobacter C7-inoculated never
ripe plants (nr No, nr Bm and nr C7 respectively).
nd: non-detected; na: not-applicable; P-value; ns, not significant; * P ≤ 0.05; ** P ≤
0.01; *** P ≤ 0.001.

179
Chapter 2
Table 2.6 Effects of bacterial inoculation on phytohormone concentrations at 8
weeks post-inoculation. Data were analyzed by two-way ANOVA with plant
genotype (G) and inoculum (I) as sources of variation. Data are means ± SE (n = 4).
Significance of sources of variation interaction (GxI) was evaluated by P-value. In
case of not-significant interaction between factors, inoculum effects were evaluated
analyzing separately wt and nr plants using ANOVA, but inoculum effects were
unnoticed. Plant genotype effect was evaluated analyzing wt and nr plants under the
same inoculation treatment (No, Bm or C7) by t-Student test and significant
difference (P < 0.05) is showed as (*) below nr means.
Tissue Root Shoot
HormoneEthylene
(nmol g-1h-1)IAA
(pmol g-1)SA
(pmol g-1)JA
(pmol g-1)JA-Ile
(pmol g-1)Ethylene
(nmol g-1h-1)IAA
(pmol g-1)SA
(pmol g-1)JA
(pmol g-1)JA-Ile
(pmol g-1)
wt No2.91 +/-
0.27
22.73+/-
2.09
375.79+/-
40.53
125.56+/-
21.27
5.88+/-
0.38
0.85+/-
0.12
120.0+/-
2.98
2554.80+/-
950.65
65.88+/-
10.42
1.34+/-
0.24
wt Bm
2.61+/-
0.55
16.20+/-
3.74
290.10+/-
35.70
91.32+/-
13.19
5.11+/-
0.99
1.30+/-
0.29
133.43+/-
14.14
1562.67+/-
375.99
50.01+/-
12.65
0.99+/-
0.02
wt C7
3.09+/-
0.34
19.22+/-
4.25
350.86+/-
65.99
98.85+/-
15.08
4.68+/-
0.56
1.14+/-
0.13
144.52+/-
22.89
1423.38+/-
393.23
75.64+/-
6.03
1.21+/-
0.26
P-value na na na na na na na na na na
nr No
4.79+/-
0.50*
30.91+/-
1.82*
524.44+/-
35.97*
169.39+/-
14.05
6.29+/-
0.25
2.09+/-
0.37*
168.86+/-
10.06*
2581.40+/-
256.21
58.70+/-
9.32
1.54+/-
0.27
nr Bm
4.69+/-
0.75*
25.66+/-
2.78
527.62+/-
78.98*
154.46+/-
37.03
6.53+/-
0.78
2.45+/-
0.41*
146.00+/-
18.12
2869.05+/-
277.71*
95.73+/-
8.34*
2.49+/-
0.10*
nr C7
4.68+/-
0.53*
26.71+/-
4.69
549.53+/-
27.92
165.45+/-
36.25
7.46+/-
0.82
2.40+/-
0.51*
184.87+/-
21.29
2585.30+/-
492.29
118.31+/-
47.58
2.68+/-
0.80
P-value na na na na na na na na na na
Treatments: non-inoculated, Bacillus megaterium-inoculated and Enterobacter C7-
inoculated wild-type plants (wt No, wt Bm and wt C7, respectively) and non-
inoculated, Bacillus megaterium-inoculated and Enterobacter C7-inoculated never
ripe plants (nr No, nr Bm and nr C7 respectively).
nd: non-detected; P-value; ns, not significant; * P ≤ 0.05; ** P ≤ 0.01; *** P ≤ 0.001.
At 8 wpi, PGPB inoculation did not affect any phytohormone
levels in roots neither in shoots. However, significant differences
between wt and nr plants were noticed in both tissues (Table 2.6). ABA
levels were also unaffected by plant genotype (data not shown).
Ethylene concentration showed higher values in nr than in wt plants

180
Chapter 2
under all inoculation treatments in roots and shoots (Table 2.6). In case
of IAA, genotype differences were only noticed in non-inoculated
plants in root and shoot tissues, showing nr plants higher levels than wt
ones (Table 2.6). Moreover, SA concentration showed significant
differences between plant genotypes in non- and Bm-inoculated roots
and exclusively in Bm-inoculated shoots, showing always higher values
in nr plants (Table 2.6). Furthermore, although genotype differences
were unnoticed for JA and JA-Ile concentration in roots, differences
between wt and nr plants were exclusively observed under Bm
inoculation in shoots showing nr plants higher values than wt ones
(Table 2.6).
PGPB effects on root metabolite content
Root metabolites were analyzed to determine how PGPB
inoculation affects their accumulation regarding to ethylene
insensitivity in juvenile and mature plants (Tables 2.7 and 2.8,
respectively). Several root metabolites were identified including
carbohydrates (fructose, glucose, galactose, sacarose, mannose and
myoinositol), amino acids (glycine, methionine, phenylalanine,
threonine, valine, leucine/isoleucine, glutamine, serine, gamma-
aminobutitic acid (GABA), glutamic acid and aspartic acid), and
organic acids (oxalacetic, fumaric, succinic and malic and
dehydroascorbic (DHA)). Factor interaction in root metabolite levels
was noticed for galactose, aspartic acid, glutamic acid, fumaric acid,
glutamine, isoleucine/leucine, phenylalanine, serine, threonine and
valine at 4 wpi, while no factor interaction was noticed at 8 wpi.

181
Chapter 2
At 4 wpi, a dozen metabolites showed different levels due to
bacterial inoculation in wt and/or nr plants (Table 2.7 A).
Carbohydrates were unaffected in wt plants. However, C7 inoculation
reduced fructose, galactose and glucose in nr plants compared to
controls. In contrast, fructose and galactose levels were increased by
Bm inoculation in nr plants. In the case of amino acids, aspartic acid,
glutamic acid, glutamine, leucine/isoleucine, phenylalanine and serine
levels were reduced in wt plants, meanwhile aspartic acid, glutamic
acid and glutamine were increased in nr plants by C7 inoculation. Bm
inoculation did not modify amino acid levels in wt plants, but aspartic
acid, serine and threonine levels were decreased in nr plants. In
addition, different levels between inocula were noticed in threonine and
serine, showing no changes compared to control plants. Fumaric acid
was reduced by Bm inoculation in nr plants while C7 inoculation
increased it in wt plants. Succinic acid was increased by both bacteria
in wt plants. No changes due to PGPB inoculation were noticed for
myoinositol, malic acid, GABA and DHA levels (Table 2.7 A).
Furthermore, differences between wt and nr plants were noticed
in several root metabolites. GABA levels showed higher values in nr
than in wt plants under all inoculation treatments. In case of galactose,
significant difference between plant genotypes was noticed in Bm-
inoculated plants (higher level in nr plants) and in C7-inoculated ones
(higher level in wt plants). Moreover, a difference between wt and nr
plants was only noticed in non-inoculated plants for mioinositol,
fumaric acid and succinic acid showing nr plants higher values. In case
of malic acid, genotype differences were exclusively noticed under C7
inoculation with higher values in wt plants. In addition, significant
difference between plant genotypes was exclusively noticed under C7

182
Chapter 2
inoculation for aspartic acid, glutamic acid, glutamine,
isoleucine/leucine, phenylalanine and serine showing higher values in
nr plants. In case of threonine and valine, significant differences
between plant genotypes were noticed in non- and C7-inoculated plants
showing nr plants higher levels than wt ones (Table 2.7 A).
Correlations between plant DWs and root metabolite levels were
evaluated at 4 wpi (Table 2.7 B). The galactose content was positively
correlated with total, shoot and root DWs, while DHA was negatively
correlated with all DWs.
PCA was also performed to compare inoculation treatment effects
on root metabolite profiles at 4 wpi (Fig. 2.5). In this analysis, 57.7% of
the variability was explained by the data in axes PC1 and PC2. In wt
plants, all treatments overlapped with C7-inoculated plants showing
higher variability than Bm-inoculated and control plants. Nevertheless,
Bm inoculation in nr plants produced a different profile than C7
inoculation, showing a tiny overlap between them. Moreover, both
bacterial inoculations showed a specific overlap with non-inoculated
plants. Furthermore, non-inoculated wt and nr profiles showed partial
overlapping. The Bm-inoculated nr plant profile enclosed non- and
Bm-inoculated wt plant profiles. However, C7 inoculation resulted in a
total separation, showing less variation in nr plants (Fig. 2.5 A). The
loading plot showed two clear sources of variation; amino acids
(glutamine, serine, phenylalanine, valine and threonine) and
carbohydrates (fructose, glucose, galactose and sacarose), which
contributed to the high variability for PC1 and PC2, respectively (Fig.
2.5 B).

183
Chapter 2
Table 2.7 Root metabolite contents and correlations between plant dry weights at
4 weeks post-inoculation (wpi). (A) Data were analyzed by two-way ANOVA with
plant genotype (G) and inoculum (I) as sources of variation. Data are means ± SE (n =
4). Significance of sources of variation interaction (GxI) was evaluated by P-value. In
case of significant interaction between factors, all treatments were compared
between each others. Means followed by different capital letters are significantly
different (P < 0.05) according to LSD’s test. In case of not-significant interaction
between factors, inoculum effects were evaluated analyzing separately wt and nr
plants using ANOVA. Means followed by different letters are significantly different (P
< 0.05) according to LSD’s test, using as highest value from letter a onwards for wt
plants, and from letter z backwards for nr plants. Plant genotype effect was
evaluated analyzing wt and nr plants under the same inoculation treatment (No, Bm
or C7) by t-Student test and significant difference (P < 0.05) is showed as (*) next to
nr means. (B) Significant Pearson correlations between plant dry weights and root
metabolites at 4 wpi.
A
Fru
cto
se
Gal
acto
se
Glu
cose
Asp
arti
cac
id
Glu
tam
icac
id
Fum
aric
acid
Glu
tam
ine
Iso
leu
cin
e/
leu
cin
e
Ph
en
ylal
anin
e
Seri
ne
Thre
on
ine
valin
e
Glic
ine
GA
BA
DH
A
wt No7.40 +/-
1.410.025 +/-0.004 BC
4.47 +/-0.90
1.08 +/-0.07 BC
3.70 +/-0.30 BC
0.29 +/-0.02 B
1.08 +/-0.08 B
0.13 +/-0.01 B
0.086 +/-0.009 B
0.79 +/-0.06 BC
0.059 +/-0.004 BC
0.053 +/-0.010 CD
0.201 +/-0.185
1.956 +/-0.375
0.037 +/-0.008
wt Bm8.44 +/-
0.740.033 +/-0.003 B
6.78 +/-0.58
0.93 +/-0.10 CD
3.35 +/-0.41 C
0.33 +/-0.02 AB
0.98 +/-0.12 BC
0.14 +/-0.01 AB
0.076 +/-0.013 B
0.72 +/-0.07 BC
0.062 +/-0.005 B
0.066 +/-0.018 BC
0.204 +/-0.084
2.044 +/-0.287
0.031 +/-0.005
wt C710.71 +/-
1.840.032 +/-0.005 B
5.68 +/-1.04
0.65 +/-0.14 D
1.87 +/-0.42 D
0.37 +/-0.02 A
0.67 +/-0.16 C
0.08 +/-0.01 C
0.041 +/-0.005 C
0.33 +/-0.08 D
0.040 +/-0.007 C
0.044 +/-0.019 D
0.258 +/-0.042
2.154 +/-0.389
0.031 +/-0.004
P-value ns na ns na * na na na na na na na na na na
nr No9.22 +/-1.01 y
0.032 +/-0.003 B
6.37 +/-0.63 z
1.31 +/-0.10 B
4.61 +/-0.27 B
0.37 +/-0.01 A
1.27 +/-0.07 B
0.16 +/-0.01 AB
0.103 +/-0.007 AB
0.95 +/-0.06 AB
0.087 +/-0.007 A
0.080 +/-0.016 AB
0.338 +/-0.117
3.305 +/-0.740 *
0.030 +/-0.002
nr Bm12.11 +/-
1.17 z0.047 +/-0.003 A
7.88 +/-0.75 z
0.85 +/-0.12 CD
3.65 +/-0.55 BC
0.29 +/-0.03 B
1.03 +/-0.14 B
0.16 +/-0.02 AB
0.093 +/-0.015 AB
0.70 +/-0.11 C
0.062 +/-0.007 B
0.070 +/-0.02 ABC
0.220 +/-0.075
2.691 +/-0.534 *
0.026 +/-0.004
nr C75.73 +/-0.48 x
0.022 +/-0.002 C
4.20 +/-0.41 y
1.82 +/-0.09 A
5.78 +/-0.26 A
0.36 +/-0.01 A
1.59 +/-0.07 A
0.17 +/-0.01 A
0.122 +/-0.009 A
1.09 +/-0.04 A
0.102 +/-0.007 A
0.090 +/-0.013 A
0.490 +/-0.282
3.554 +/-0.686 *
0.026 +/-0.003
P-value *** na ** na ** na na na na na na na na na na
B Dry Weight and Metabolite Content Correlation
TotalDW
r 0.662 0.812 0.734 -0.239 -0.071 -0.269 -0.112 0.241 0.038 -0.159 -0.050 0.216 -0.063 0.177 -0.798
P-value 0.127 0.032 0.074 0.640 0.891 0.597 0.829 0.637 0.942 0.759 0.923 0.674 0.903 0.731 0.038
ShootDW
r 0.675 0.818 0.742 -0.252 -0.082 -0.283 -0.124 0.236 0.029 -0.167 -0.063 0.205 -0.083 0.157 -0.786
P-value 0.117 0.029 0.069 0.621 0.874 0.577 0.811 0.645 0.956 0.747 0.903 0.690 0.872 0.762 0.044
RootDW
r 0.628 0.793 0.710 -0.203 -0.043 -0.231 -0.082 0.254 0.062 -0.139 -0.016 0.244 -0.011 0.228 -0.827
P-value 0.158 0.040 0.090 0.692 0.935 0.652 0.875 0.619 0.905 0.789 0.976 0.633 0.983 0.655 0.026
Treatments: non-inoculated, Bacillus megaterium-inoculated and Enterobacter C7-
inoculated wild-type plants (wt No, wt Bm and wt C7, respectively) and non-
inoculated, Bacillus megaterium-inoculated and Enterobacter C7-inoculated never
ripe plants (nr No, nr Bm and nr C7 respectively). DW: Dry Weight; GABA: gamma-
Aminobutyric acid; DHA: dehydroascorbic acid.

184
Chapter 2
DW: Dry Weight; nd: non-detected; P-value; ns, not significant; * P ≤ 0.05; ** P ≤
0.01; *** P ≤ 0.001.
6.010-5.88
4.925
-4.10
PC1 (35.8%)
PC
2 (
21.9
%)
nr C7
wt C7
wt No
wt Bm
nr No
nr Bm
0.336-7.59E-02
0.408
-0.13
PC1 (35.8%)
PC
2 (
21.9
%)
Fructose
Galactose
Glucose
Sacarose
Aspartic acid
Glutamic acid
Serine
Glutamine
Threonine
Phenylalanine
Malic acid
Valine
Iso/leucine
GABA
Fumaric acid
Myoinositol
Succinic acid
Glycine
DHA
Oxalacetic acid
Total Dry Weight
Root Dry Weight
Shoot Dry Weight
A
B
Figure 2.5 Principal component analysis of root metabolite levels and dry weights
at 4 wpi. Analysis was performed based on metabolite contents and dry weight data
obtained from tomato (Solanum lycopersicum) roots. (A) Score plot. Treatments:
non-inoculated, Bacillus megaoterium-inoculated and Enterobacter C7-inoculated
wild-type plants (wt No, wt Bm and wt C7, respectively) and non-inoculated, Bacillus
megaterium-inoculated and Enterobacter C7-inoculated never ripe plants (nr No, nr
Bm and nr C7 respectively). Each point represents one plant and points of the same
treatment were enclosed in a different colored ellipse: green for wt No, grey for wt
Bm, purple for wt C7, red for nr No, yellow for nr Bm and blue for nr C7. (B) Loading
plot. Each point represents one metabolite or dry weight.

185
Chapter 2
PGPB inoculation effects on root metabolite content regarding
ethylene sensitivity were also assessed at 8 wpi. Nevertheless, factor
interaction was unnoticed and PGPB inoculation did not affect root
metabolite levels in mature plants (Table 2.8 A). Fructose levels were
unaffected by plant genotype. However, differences between wt and nr
plants were noticed for several metabolites. Mannose and serine levels
showed higher values in nr than in wt plants under all inoculation
treatments. Moreover, genotype difference was only noticed in non-
inoculated plant for galactose with higher levels in nr plants. Glucose
showed higher levels in nr plants in non- and Bm-inoculated plants.
However, threonine and methionine showed also higher values in nr
plants, but under Bm and C7 inoculations. Furthermore, myoinositol
and aspartic acid showed higher levels in nr plants exclusively under
Bm inoculation. On the other hand, differences between wt and nr
plants were only significant under C7 inoculation for fumaric acid,
glutamic acid, glutamine, isoleucine/leucine, phenylalanine, valine and
GABA levels (Table 2.8 A). Moreover, some positive correlations were
observed between plant DWs and root metabolite levels at 8 wpi (Table
2.8 B). Fructose content was positively correlated with all DWs, and
galactose and glucose were correlated positively with total and shoot
DWs.
Treatment effects on root metabolites were also evaluated by
PCA at 8 wpi (65.3% variability along axes PC1 and PC2) (Fig. 2.6).
Profiles were not completely separated by plant genotype in Bm-
inoculated and non-inoculated plants, but there were differences with
C7-inoculated plants. In wt plants, both bacterial inoculations showed a
totally different root metabolite profile compared to control plants,
showing almost complete overlap between Bm- and C7-inoculated

186
Chapter 2
plants. In nr plants, Bm inoculation resulted in a profile that overlapped
with control plants while C7 inoculation produced a nearly complete
separation from controls (Fig. 2.6 A).
Table 2.8 Root metabolite contents and correlations between plant dry weights at
8 weeks post-inoculation (wpi). (A) Data were analyzed by two-way ANOVA with
plant genotype (G) and inoculum (I) as sources of variation. Data are means ± SE (n =
4). Significance of sources of variation interaction (GxI) was evaluated by P-value. In
case of not-significant interaction between factors, inoculum effects were evaluated
analyzing separately wt and nr plants using ANOVA, but inoculum effects were
unnoticed. Plant genotype effect was evaluated analyzing wt and nr plants under the
same inoculation treatment (No, Bm or C7) by t-Student test and significant
difference (P < 0.05) is showed as (*) next to nr means. (B) Significant Pearson
correlations between plant dry weights and root metabolites at 8 wpi.
A
Fru
cto
se
Gal
acto
se
Glu
cose
Man
no
se
Mio
ino
sito
l
Asp
arti
cac
id
Glu
tam
icac
id
Glu
tam
ine
Iso
leu
cin
e/
leu
cin
e
Ph
en
ylal
anin
e
Seri
ne
Thre
on
ine
valin
e
GA
BA
Me
tio
nin
e
wt No68.91 +/-
1.630.479 +/-
0.03541.13 +/-
3.330.30 +/-
0.026.67 +/-
1.940.23 +/-
0.130.52 +/-
0.190.16 +/-
0.060.17 +/-
0.050.07 +/-
0.020.28 +/-
0.050.023 +/-
0.0050.044 +/-
0.0082.63 +/-
0.850.12 +/-
0.02
wt Bm75.02 +/-
4.460.611 +/-
0.06846.37 +/-
3.210.32 +/-
0.075.56 +/-
1.480.18 +/-
0.070.35 +/-
0.120.11 +/-
0.040.15 +/-
0.070.06 +/-
0.020.25 +/-
0.070.023 +/-
0.0080.047 +/-
0.0241.90 +/-
0.500.11 +/-
0.03
wt C779.39 +/-
3.510.710 +/-
0.06850.03 +/-
3.250.33 +/-
0.055.96 +/-
1.410.20 +/-
0.030.40 +/-
0.120.13 +/-
0.030.14 +/-
0.030.07 +/-
0.020.26 +/-
0.050.022 +/-
0.0050.041 +/-
0.0041.78 +/-
0.180.11 +/-
0.03
P-value ns ns na na na na na na na na na na na na na
nr No74.08 +/-
4.400.783 +/-0.076 *
56.67 +/-4.40 *
0.55 +/-0.10 *
9.11 +/-2.70
0.33 +/-0.09
0.53 +/-0.09
0.17 +/-0.02
0.20 +/-0.06
0.08 +/-0.01
0.49 +/-0.11 *
0.034 +/-0.007
0.060 +/-0.014
2.73 +/-0.67
0.13 +/-0.02
nr Bm74.47 +/-
3.030.781 +/-
0.03357.48 +/-
3.01 *0.70 +/-0.20 *
8.85 +/-1.74 *
0.36 +/-0.09 *
0.57 +/-0.24
0.18 +/-0.07
0.24 +/-0.09
0.10 +/-0.03
0.49 +/-0.09 *
0.046 +/-0.013 *
0.083 +/-0.040
3.62 +/-1.44
0.18 +/-0.05 *
nr C794.26 +/-
10.541.013 +/-
0.09067.72 +/-
5.260.74 +/-0.09 *
8.66 +/-1.38
0.36 +/-0.12
0.59 +/-0.06 *
0.18 +/-0.02 *
0.24 +/-0.02 *
0.11 +/-0.01 *
0.53 +/-0.07 *
0.044 +/-0.008 *
0.071 +/-0.005 *
3.91 +/-0.26 *
0.20 +/-0.02 *
P-value ns ns na na na na na na na na na na na na na
B Dry Weight and Metabolite Content Correlation
TotalDW
r 0.963 0.916 0.863 0.661 0.321 0.446 0.241 0.292 0.484 0.723 0.531 0.597 0.465 0.466 0.680
P-value
0.000 0.004 0.014 0.128 0.523 0.358 0.638 0.563 0.312 0.082 0.257 0.187 0.334 0.333 0.113
ShootDW
r 0.959 0.937 0.888 0.691 0.369 0.485 0.278 0.332 0.512 0.746 0.572 0.624 0.491 0.491 0.698
P-value
0.000 0.002 0.008 0.105 0.457 0.310 0.583 0.508 0.278 0.066 0.213 0.162 0.303 0.303 0.099
RootDW
r 0.908 0.718 0.642 0.428 -0.005 0.165 -0.012 0.023 0.271 0.522 0.234 0.383 0.273 0.272 0.520
P-value
0.005 0.085 0.145 0.381 0.993 0.750 0.981 0.965 0.594 0.267 0.647 0.438 0.591 0.592 0.270
Treatments: non-inoculated, Bacillus megaterium-inoculated and Enterobacter C7-
inoculated wild-type plants (wt No, wt Bm and wt C7, respectively) and non-
inoculated, Bacillus megaterium-inoculated and Enterobacter C7-inoculated never
ripe plants (nr No, nr Bm and nr C7 respectively).
DW: Dry Weight; nd: non-detected; P-value; ns, not significant; * P ≤ 0.05; ** P ≤
0.01; *** P ≤ 0.001.

187
Chapter 2
8.151-6.13
3.978
-4.11
PC1 (47.8%)
PC
2 (
17.5
%)
nr Bm
nr C7
wt Bm
wt No
wt C7
nr No
A
B
0.303-0.13
0.436
-0.35
PC1 (47.8%)
PC
2 (
17.5
%)
Total Dry Weight
Root Dry Weight
Shoot Dry Weight
Malic acid
Succinic acid
Fumaric acid
Valine
Glutamine
Glutamic acid
Iso/leucine
GABA
Oxalacetic acid
Threonine
Phenylalanine
Methionine
Mannose
Aspartic acid
Serine
Myoinositol
Glycine
DHA
Sacarose
Glucose
Galactose
Fructose
Figure 2.6 Principal component analysis of root metabolite levels and dry weights
at 8 wpi. Analysis was performed based on metabolite contents and dry weight data
obtained from tomato (Solanum lycopersicum) roots. (A) Score plot. Treatments:
non-inoculated, Bacillus megaoterium-inoculated and Enterobacter C7-inoculated
wild-type plants (wt No, wt Bm and wt C7, respectively) and non-inoculated, Bacillus
megaterium-inoculated and Enterobacter C7-inoculated never ripe plants (nr No, nr
Bm and nr C7 respectively). Each point represents one plant and points of the same
treatment were enclosed in a different colored ellipse: green for wt No, grey for wt
Bm, purple for wt C7, red for nr No, yellow for nr Bm and blue for nr C7. (B) Loading
plot. Each point represents one metabolite or dry weight.

188
Chapter 2
PCA also showed that PC1 variability was due to amino acids
(glutamine, glutamic acid, leucine/isoleucine, valine and GABA).
Unexpectedly, plant DWs were a source of variation for PC2.
Moreover, malic acid also contributed to the variability of PC2 (Fig.
2.6 B).
Discussion
In the present chapter, the outcome of the inoculation of tomato
plants with two different PGPB was reported regarding to ethylene
sensitivity at two different plant developmental stages.
PGPB inoculation exclusively affected relative growth rate in
ethylene-insensitive plants
In juvenile plants, an increase in root DW was only produced by
Bm inoculation in nr plants resulting also in significant difference
between wt and nr plants only under Bm inoculation (Fig. 2.2 E),
suggesting that root growth promotion is related to ethylene
insensitivity in case of Bm. At 8 wpi, C7 inoculation stimulated plant
growth independently of sensitivity to ethylene, while Bm inoculation
promoted plant growth only in wt plants (Fig. 2.2 B). Furthermore,
phenotypic analysis only showed visible differences in plant height and
number of flowers resulting in the same pattern as total DW (data not
shown). These results indicate that ethylene perception is required for
growth promotion in mature plants by Bm but not for C7 as discussed
in the previous chapter.

189
Chapter 2
Furthermore, difference between plant genotypes was only
significant in non-inoculated plants pointing to less pronounced
ethylene growth inhibitory effects (Pierik et al. 2006) on nr plants due
to its mutation (Wilkinson et al. 1995). Under Bm inoculation, this
genotype difference was unnoticed because growth promotion was only
produced in wt plants reaching similar DW than nr plants, and
suggesting that Bm could modulate ethylene receptor expression as
previously reported by other PGPB strain (Vargas et al. 2012) and
needed for the properly establishment of beneficial plant-bacteria
association (Vacheron et al. 2013). Although C7 inoculation promoted
growth of wt and nr plants, no significant difference between plant
genotypes was observed probably due to different intensity of growth
promotion. Moreover, IAA is able to induce plant growth (Zhao 2010)
and higher auxin levels were exclusively noticed in non-inoculated nr
mature plants compared to wt ones.
In addition, total RGR was not affected by ethylene insensitivity,
as previously reported (Tholen et al. 2004). However, our data show
that bacterial inoculation produced RGR modifications in ethylene-
insensitive plants unnoticed in wt plants. Although few PGPB studies
include RGR evaluation, RGRs can be enhanced by PGPB inoculation,
but these responses are strain-specific (Shishido and Chanway 2000),
as observed in our results (Fig. 2.3). These results points to Bm
inoculation deleterious effects on mature nr plants, as previously
reported in ABA-deficient tomato plants by Porcel et al. (2014).
Moreover, it was also noticed that short-term growth promotion was
not always linked with long-term promotion, as observed previously
(Gray and Smith 2005; Kuan et al. 2016). Thus, further research
addressing bacterial inoculation effects on mature plants is necessary,

190
Chapter 2
since several studies that propose the use of bacterial strains as PGPB
have only evaluated the effects of these bacteria on juvenile plants or
seedlings and/or grown in vitro.
Furthermore, several correlations have been found between DWs
and nutrients (Table 2.4) or metabolites (Tables 2.7 and 2.8). In
juvenile plants, root sulfur concentration was positively correlated with
total, shoot and root DWs. S levels were decreased by C7 inoculation in
nr plants and a previous study reported modulation of S assimilation by
PGPB inoculation (Aziz et al. 2016). Moreover, ethylene and S
nutrition present links at metabolic and regulatory levels (Wawrzynska
et al. 2015). In mature plants, C positively correlated with all DWs.
Although C gain is a consequence of photosynthesis, little is known
about the impact of carbon availability on plant growth (Smith and Stitt
2007). Moreover, this correlation could be linked to positive
correlations noticed between root sugar content and DWs. Shoot Fe
concentration was negatively correlated with all DWs at 4 wpi.
Ethylene is involved in a plant response to Fe deficiency (Lucena et al.
2006) resulting in the initiation of root hairs affected by inhibition of
ethylene perception (Schmidt 2001). Thus, lower shoot Fe levels
observed in Bm-inoculated nr plants could be due to less Fe uptake and
translocation. Competition for Fe uptake between plants and
microorganisms has been reported at the rhizosphere, showing that
microorganisms could be more competitive than plants (Pii et al. 2015).
Consequently, our results suggest an interaction failure between Bm
and nr plants that leads to competition for Fe at the rhizosphere.
In juvenile plants, galactose and DHA correlated with all DWs
positively and negatively, respectively. DHA is the oxidized form of

191
Chapter 2
ascorbic acid, involved in oxidative damage prevention (Wang et al.
2013). Thus, this negative correlation could be due to reduced oxidative
damage in Bm-inoculated nr roots which showed increased root DW.
Moreover, the main ascorbic acid biosynthesis pathway in plants is the
L-galactose pathway (Laing et al. 2007), and galactose was increased
by Bm inoculation in nr plants. In addition, sugars are immediate
substrates for metabolism and signaling molecules and their availability
is linked to plant growth (Rolland et al. 2006; Hanson and Smeekens
2009). In consequence, the observed correlations could be due to sugar
availability.
Stomatal conductance and photosynthetic efficiency was
affected by PGPB inoculation at juvenile stage
PGPB inoculation effects on stomatal conductance and
photosynthetic efficiency were only noticed in juvenile plants, while
differences between plant genotypes showed different patterns at 4 and
8 wpi (Table 2.1). Stomatal conductance results also suggested a role
for ethylene sensitivity in the Bm-tomato interaction. Reduction of
stomatal conductance by Bm inoculation was previously reported in
clover (Armada et al. 2014), lavender and salvia (Armada et al. 2014),
although no effect was reported in tomato (Porcel et al. 2014).
Moreover, photosynthesis is directly related with chlorophyll content
(Richardson et al. 2002), but the chlorophyll content was unaffected by
Bm inoculation, suggesting that the photosynthetic efficiency decrease
was not linked to chlorophyll content. Ethylene is able to modify
photosynthesis by affecting stomatal aperture with a dose-dependent
mechanism (Tanaka et al. 2005), and significant differences between

192
Chapter 2
plant genotypes were only observed under Bm inoculation for the three
parameters at 4 wpi. These results are in accordance with a Bm-tomato
interaction mediated by ethylene (and thus dependent on its perception)
that could decrease stomatal conductance and then photosynthetic
efficiency in wt plants. However, Bm could be misrecognized by nr
plants (unable to respond to the released ethylene from interaction)
resulting in no change in stomatal conductance and deleterious effects
as reduced photosynthetic efficiency and lower chlorophyll levels in
Bm-inoculated nr plants compared to wt ones. Nevertheless, stomatal
conductance was increased in wt and nr plants, while photosynthetic
efficiency and chlorophyll content were unaffected by C7 inoculation,
in accordance with a PGPB mechanism independent of ethylene
sensitivity.
Furthermore, stomatal conductance was significantly lower in nr
than in wt plants under all inoculation treatments and photosynthetic
efficiency in non- and C7-inoculated plants at 8 wpi, when higher
ethylene values were observed in nr plants. Although physiological
ethylene role depends on specific traits of plant species (related in
principle with their habitat) and the integrative result of internal and
external stimuli (Pierik et al. 2006), these results suggest that nr plants
were more stressed than wt ones, probably because ethylene is a key
hormone involved in response to environmental stresses (Wang et al.
2013a; Van de Poel et al. 2015), and some ethylene-insensitive
genotypes would fail to produce some adaptive responses (Feng and
Barker 1992; Zhang et al. 2003).

193
Chapter 2
Phytohormonal status was mainly affected by ethylene
insensitivity and altered under bacterial inoculation
PGPB effects on phytohormone levels were mainly dependent on
ethylene sensitivity and only C7 inoculation directly affected root ABA
(Tables 2.5 and 2.6). Root ABA concentration was exclusively
increased by C7 inoculation in nr juvenile plants as previously reported
with others PGPB (Bresson et al. 2013; Cohen et al. 2015). ABA role
has been historically described as growth inhibitor. However, high
ABA levels were reported in young tissues and ABA-deficient mutants
are severely affected in growth (Finkelstein 2013). Endogenous ABA is
crucial in limiting ethylene production maintaining rather than reducing
plant growth (Sharp 2002). Furthermore, ABA is able to suppress plant
resistance mechanisms mediated by JA/ethylene- and SA-dependent
immune responses (Anderson et al. 2004; Sánchez-Vallet et al. 2012).
Our results also showed higher root ABA levels in C7-inoulated nr
plants compared to wt ones but no genotype differences in ethylene, JA
and SA concentrations. Thus, although C7 did not promote plant
growth at 4 wpi, these hormonal changes predispose plants to further
growth. In fact, ethylene, JA, JA-Ile and SA levels were also unaffected
by C7 inoculation neither by plant genotype in case of JA, JA-Ile and
SA levels under C7 inoculation in mature plants.
However, Bm did not affect directly phytohormone levels. A
previous report using Bm-inoculated wt and ABA-deficient tomato
lines suggested that normal endogenous ABA levels could be essential
for growth promotion by maintaining production of ethylene at low
levels (Porcel et al. 2014). Bm only promoted growth in wt plants, and
ethylene and ABA levels were unaffected as reported in wt plants by

194
Chapter 2
Porcel et al. (2014). Thus, our results are in accordance with the
hypothesis pointing to plant ethylene sensitivity as a new player in Bm-
tomato interaction. Indeed, although similar differences between plant
genotypes were noticed in root ethylene in non- and Bm-inoculated
plants, genotype difference was exclusively unnoticed in shoot ethylene
under Bm inoculation. Furthermore, shoot SA levels exclusively
showed higher values in nr plants under Bm inoculation, suggesting nr
plants respond to Bm activating plant defenses since SA is a key factor
for basal defenses establishment, effector-triggered inmmunity and
both local and systemic acquired response (Vlot et al. 2009). In fact,
SA, JA and JA-Ile showed also higher values in nr than in wt shoots
only under Bm inoculation in mature plants. The best-known JA role is
to regulate plant immune responses against pathogens (Browse 2009).
Thus, these results also support miss-interaction resulting in Bm
recognition by nr plants as a pathogen-like microorganism and
physiologic deleterious effects. Indeed, ethylene modulates plant
resistance and susceptibility to pathogens (van Loon et al. 2006) and
even beneficial microorganisms can be recognized as potential invaders
triggering immune response (Zamioudis and Pieterse 2012).
Furthermore, ethylene and IAA affect each other’s synthesis
since high IAA levels result in increased ethylene biosynthesis (Muday
et al. 2012) and vice versa (Stepanova et al. 2005). The ethylene-
insensitive tomato mutant nr is not able to perceive ethylene, but
presents some residual responsiveness (Lanahan et al. 1994) and only
SlETR3 is not functional (Wilkinson et al. 1995). Cross-talk between
ethylene and auxins is mainly produced at biosynthesis level and thus
higher levels of IAA and ethylene were generally noticed in non-
inoculated nr plants compared to wt ones. Furthermore, microbially-

195
Chapter 2
derived IAA is a signaling molecule in microorganisms and interfere
with several developmental processes in planta (Spaepen and
Vanderleyden 2011). Although IAA production by these PGPB was not
assayed, PGPB inoculation did not directly modify IAA levels and only
plant genotype differences were affected under bacterial inoculations,
suggesting that both Bm and C7 are unable to produce auxins. Lower
IAA levels were noticed in Bm-inoculated nr plants compared to wt
plants and IAA signaling down-regulation was reported as part of plant
defense against bacteria (Spaepen and Vanderleyden 2011) in
accordance with our results. Moreover, root and shoot IAA levels were
increased in C7-inocualted nr plants compared to wt ones, predisposing
plant to further growth since IAA plays crucial functions in several
developmental processes being identified as a plant growth promotion
hormone (Zhao 2010).
Root metabolites were directly altered by PGPB inoculation
at juvenile stage showing high dependence of ethylene sensitivity in
mature plants
Our results showed changes in root sugars, amino acids and
organic acids due to bacterial inoculation. Although performed in
shoots, previous studies pointed to modification of those compounds by
bacterial inoculation (Weston et al. 2012; Su et al. 2016). Root
metabolite contents were affected by bacterial inoculation in juvenile
plants, but did not show changes in mature plants when genotype
differences were clearly marked (Tables 2.7 and 2.8; Figs. 2.5 and 2.6).
Sugars and amino acids were pointed as the main source of
variation at 4 wpi, while only amino acids contributed to variability in

196
Chapter 2
mature plants, suggesting that modification of root sugar levels rather
than amino acid content by bacterial inoculation could be relevant in
growth promotion. Furthermore, ethylene perception is related to plant
sensitivity to sugars (Paul and Pellny 2003). Moreover, separation
between Bm- and C7-inoculated juvenile plants was observed in nr
plants, suggesting strain-specific interactions between bacteria and
host-plants as previously reported (Walker et al. 2011; Weston et al.
2012). These results imply that ethylene sensitivity could affect plant-
bacteria interaction because similar profiles were observed in wt plants.
Root metabolic profiles were in agreement with biomass results at 8
wpi, showing high similarity in profiles of Bm- and non-inoculated nr
plants (Fig. 2.2 and 2.6).
Root biomass can be increased by bacterial succinic acid
(Yoshikawa et al. 1993), and higher succinic acid levels coupled with
higher root biomass were only observed in bacteria-inoculated wt
plants. Furthermore, fumaric acid plays a crucial role in biofilm
formation necessary for root colonization by Bacillus strains (Zhang et
al. 2014; Yuan et al. 2015). Thus, lower fumaric acid levels only
noticed in Bm-inoculated nr plants could affect functional interaction.
Moreover, differences in monosaccharide levels between both inocula
were restricted to nr plants. Higher glucose levels were noticed in Bm-
inoculated nr plants compared to wt ones at 8 wpi. Ethylene is involved
in plant sensitivity to sugars and it has been reported that ethylene-
insensitive plants show higher response to endogenous glucose
resulting in increased photosynthesis suppression by carbohydrates
(Zhou et al. 1998; León and Sheen 2003; Paul and Pellny 2003). Thus,
Bm inoculation could enhance this phenomenon only in nr plants
modifying mainly sugar metabolism.

197
Chapter 2
In addition, previous studies have reported changes in plant
amino acid levels by bacteria (Curzi et al. 2008). Also, previous reports
suggested that amino acid homeostasis could have regulatory functions
in maintaining plant growth and development (Walch-Liu et al. 2006;
Yu et al. 2013; Ros et al. 2014). Several amino acids were decreased by
Bm and increased by C7 in nr plants. These results suggest a strain-
specific effect on root amino acid levels that could lead to different
growth responses. Aspartic acid is the common precursor of other
amino acids in higher plants (Azevedo et al. 2006). Serine and derived
molecules deficiencies have consequences such as altered mineral
homeostasis and root development (Muñoz-Bertomeu et al. 2009; Ros
et al. 2014). Thus, these specific reductions of amino acid contents in
nr plants could affect plant growth under Bm inoculation. Moreover,
aspartic acid, glutamic acid and glutamine are involved in plant
nitrogen assimilation (Xu and Zhou 2004), suggesting that C7
inoculation could improve N assimilation in nr juvenile plants.
Furthermore, amino acid levels were reduced in wt plants by C7
inoculation. Isoleucine deficiency produces defects in cell proliferation
and expansion during development of roots (Yu et al. 2013).
Phenylalanine is also used in the phenylpropanoid pathway leading to
the biosynthesis of secondary products (Hyun et al. 2011) involved in
cell wall structure (Bonawitz and Chapple 2010), and plant defense or
response to stress (Winkel-Shirley 2001; Fraser and Chapple 2011).
Thus, these results suggest that C7 inoculation could affect plant
development though modification of amino acid content. As proposed
by Rivero et al. (2015), reduction of amino acids could be due to their
use for secondary metabolism. In addition, genotype differences

198
Chapter 2
noticed exclusively under C7 inoculation were in amino acid levels also
pointing to a remodeling of amino acidic metabolism.
PGPB inoculation affected plant nutrition notably at mature
stage with clear influence of ethylene sensitivity
PGPB effects on nutritional status were more prominent in
mature plants, showing a high dependence of ethylene sensitivity
(Tables 2.2 and 2.3; Figs. 2.4). Indeed, ethylene signaling and plant
nutrition interaction was reviewed by Iqbal et al. (2013), indicating that
nutrient deficiencies are largely related with ethylene perception and
biosynthesis. As observed in metabolites, separation of root nutrient
profiles was clearly marked by plant genotype in mature plants, but the
strain-specific effect was maintained in nr plants (Fig. 2.4).
Bm inoculation did not alter nutrients in juvenile roots, but the
leaf contents of several nutrients were affected. The C concentration
was increased, while N and Mn were decreased in wt plants. Mn plays
an important role in protection of photosynthetic tissues (Mehlhorn &
Wenzel, 1996) and our results showed a reduction in photosynthetic
efficiency of Bm-inoculated wt plants. Moreover, reduced Zn and Fe
levels in nr shoots due to Bm inoculation could suggest that Bm affects
nutrient translocation in nr plants (Sperotto 2013). In mature plants,
Bm inoculation increased C in roots and shoots of wt plants, but a
decrease of several nutrients were noticed in nr roots. Thus, the C:N
ratio was increased by Bm inoculation in wt plants, suggesting that Bm
stimulates plant growth by increasing C assimilation per N unit leading
to a biomass increase (Lawlor 2002). Moreover, Ca is a key player
conferring structure and rigidity to cell wall and interacts with ethylene

199
Chapter 2
signaling and plant responses to biotic attacks (Iqbal et al. 2013). Thus,
root Ca increase mediated by Bm inoculation could enhance wt plants
resistance.
Although both PGPB decreased Cu levels in nr roots at 8 wpi, C7
reduced it in a higher degree than Bm. Also, C7 inoculation decreased
Cu in nr shoots at 8 wpi. Moreover, root Cu concentration was
negatively correlated with total and shoot DWs. Cu is a structural
component of ethylene receptors (Rodríguez 1999). Thus, lower levels
of Cu could result in less functional ethylene receptors, and
consequentially lower growth inhibition by ethylene (Pierik et al.
2006). These results are in accordance with plant growth promotion
observed in nr plants. However, C7 increased shoot Cu levels in wt
plants, but ethylene transduction pathway and regulatory mechanisms
are functional showing no growth inhibitory effects. In addition, both
PGPB also affected Si levels in mature nr roots. Moreover, Si role in
plants has been described as biotic and abiotic protector (Ma and
Yamaji 2008). Thus, lower Si levels noticed in bacterial-inoculated
plants could indicate that low Si could favor interaction with PGPB
showing lower levels C7- than Bm-inoculated nr plants.
Nevertheless, C7 inoculation only reduced root Na concentration
in nr roots not affecting shoot nutrients in juvenile plants. Although no
saline stress was applied in this study, reduction of Na by PGPB was
previously reported (Zhang et al. 2008), and could be related with
growth promotion because Na is toxic to plant cells and its
accumulation within cells is undesirable (Pardo and Quintero 2002). In
contrast, C7 inoculation showed a great impact in plant nutrition at 8
wpi. Root C concentration was increased in wt plants, while root S

200
Chapter 2
levels were decreased in nr plants, respectively. S reduction by C7
inoculation only in nr plants could be due to modulation of sulfur
assimilation machinery of plant (Aziz et al. 2016) whose regulation is
dependent on ethylene perception (Wawrzynska et al. 2015). In
addition, C7 inoculation affected shoot nutrients increasing Fe in wt
plants and decreasing P levels in nr plants. Fe is a key factor in
photosynthesis and respiration and its deficiency produced stunted
plant growth (Iqbal et al. 2013), suggesting that C7 inoculation of wt
plants improves nutrient translocation (Sperotto 2013) and maintain
plant on growth. However, P deficiency limits shoot and root DWs
(Borch et al. 1999). Ethylene is induced in P-deficient plants and
ethylene sensitivity is involved in regulating carbon allocation to
adventitious roots (Kim et al. 2008a) and root hair development (Zhang
et al. 2003) in order to facilitate a quick recovery of stressed plants. A
previous study reported that B. amyloliquefaciens reduced P uptake
(Talboys et al. 2014). These results are in agreement with our study but
further research is necessary to know how the C7 inoculation affects P
nutrition.
Conclusions
In this chapter, it has been reported that physiological parameters
and root metabolites were modified by bacterial inoculation in juvenile
plants rather than in mature ones, when plant homeostasis can
counteract inoculation effects. However, PGPB effects on nutritional
status were more prominent in mature plants with a high dependence of
ethylene sensitivity (Fig. 2.7).
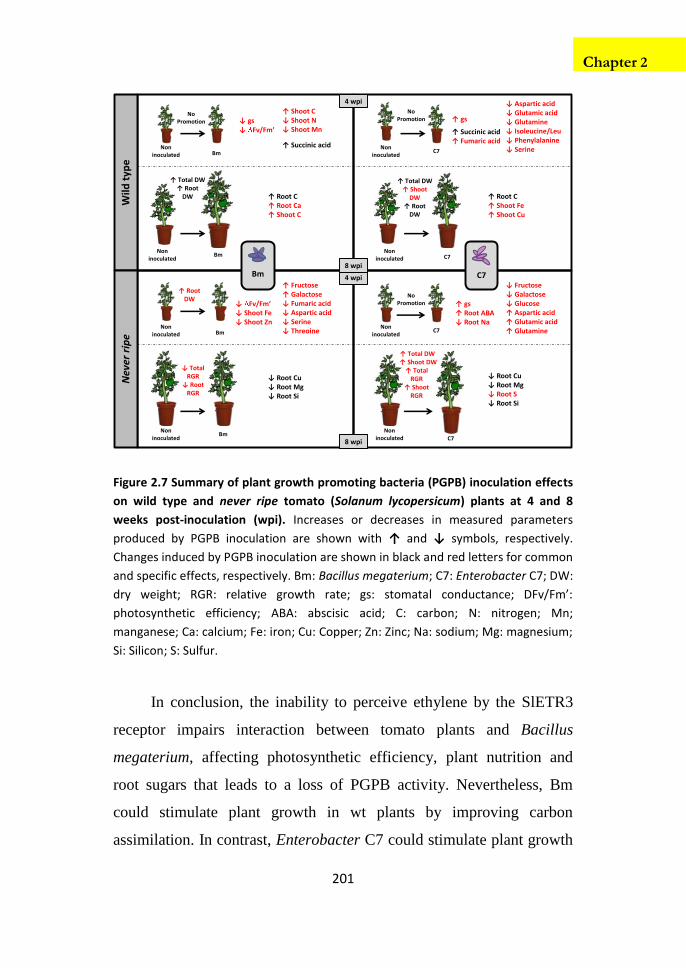
201
Chapter 2
Wild
typ
eN
ever
rip
e
4 wpi
4 wpi
↑ RootDW
↓ gs↓ Fv/Fm’
↓ Fv/Fm’↓ Shoot Fe↓ Shoot Zn
↑ gs
↑ gs↑ Root ABA↓ Root Na
↓ Root Cu↓ Root Mg↓ Root S↓ Root Si
↓ Root Cu↓ Root Mg↓ Root Si
↑ Root C↑ Root Ca↑ Shoot C
↑ Shoot C↓ Shoot N↓ Shoot Mn
↑ Root C↑ Shoot Fe↑ Shoot Cu
↑ Succinic acid
↓ Aspartic acid↓ Glutamic acid↓ Glutamine↓ Isoleucine/Leu↓ Phenylalanine↓ Serine
↑ Fructose↑ Galactose↓ Fumaric acid↓ Aspartic acid↓ Serine↓ Threoine
↓ Fructose↓ Galactose↓ Glucose↑ Aspartic acid↑ Glutamic acid↑ Glutamine
↑ Succinic acid↑ Fumaric acid
Bm
↓ Total RGR
↓ RootRGR
C78 wpi
No Promotion
No Promotion
No Promotion
Noninoculated
Noninoculated
Bm
Bm
Noninoculated Bm
Noninoculated
Bm
↑ Total DW↑ Shoot DW
↑ Total RGR
↑ ShootRGR
Noninoculated C7
Noninoculated
C7
Noninoculated C7
8 wpi
Noninoculated
C7
↑ Total DW↑ Root
DW
↑ Total DW↑ Shoot
DW↑ Root
DW
Figure 2.7 Summary of plant growth promoting bacteria (PGPB) inoculation effects
on wild type and never ripe tomato (Solanum lycopersicum) plants at 4 and 8
weeks post-inoculation (wpi). Increases or decreases in measured parameters
produced by PGPB inoculation are shown with ↑ and ↓ symbols, respectively.
Changes induced by PGPB inoculation are shown in black and red letters for common
and specific effects, respectively. Bm: Bacillus megaterium; C7: Enterobacter C7; DW:
dry weight; RGR: relative growth rate; gs: stomatal conductance; DFv/Fm’:
photosynthetic efficiency; ABA: abscisic acid; C: carbon; N: nitrogen; Mn;
manganese; Ca: calcium; Fe: iron; Cu: Copper; Zn: Zinc; Na: sodium; Mg: magnesium;
Si: Silicon; S: Sulfur.
In conclusion, the inability to perceive ethylene by the SlETR3
receptor impairs interaction between tomato plants and Bacillus
megaterium, affecting photosynthetic efficiency, plant nutrition and
root sugars that leads to a loss of PGPB activity. Nevertheless, Bm
could stimulate plant growth in wt plants by improving carbon
assimilation. In contrast, Enterobacter C7 could stimulate plant growth

202
Chapter 2
by affecting stomatal conductance, plant nutrition and root amino acids.
Moreover, C7 inoculation in ethylene-insensitive plants could improve
nitrogen assimilation (Fig. 2.7). Despite of no growth promotion
mediated by PGPB inoculation in juvenile plants, ethylene sensitivity
could be proposed as essential for PGPB activity of Bacillus
megaterium in tomato plants, whereas Enterobacter C7 PGPB
mechanism seems to be SlETR3-independent.

203
Chapter 3: Ethylene perception determines the
outcome of plant-bacteria interaction resulting in
reshaping of phosphorus nutrition and antioxidant
status

204
Chapter 3
Chapter 3: Ethylene perception determines the outcome
of plant-bacteria interaction resulting in reshaping of
phosphorus nutrition and antioxidant status
Objective
The present chapter aimed to shed light on plant-bacteria
interaction and PGPB mechanisms regarding to ethylene perception
using a proteomic approach. Recently, -omics have clarified plant-
bacteria interaction (van de Mortel et al. 2012; Su et al. 2016), but
fundamental questions remain to be settled. Proteomics throws valuable
information of bacterial effects on plant physiology (Feussner and Polle
2015). Nevertheless, further research is required since PGPB action
mechanisms are often strain-specific (Ryu et al. 2005; Long et al.
2008).
The shot-gun proteomics (Wolters et al. 2001; Fournier et al.
2007) allows an integral analysis of proteins extracted including
subcellular organelles and membranes (Takahashi et al. 2014). Plant
cell membranes are determinant in transport processes (Chrispeels
1999) and molecular trafficking (Chen et al. 2011; Murphy et al. 2011)
as well as in response to abiotic (Osakabe et al. 2013) and biotic stimuli
(Inada and Ueda 2014). Plant cells can respond to microbe interaction
by adapting vesicle trafficking (Ivanov et al. 2010; Dörmann et al.
2014; Inada and Ueda 2014), and the microsomal fraction is enriched in
several membranes (Abas and Luschnig 2010). Furthermore, the roots
are the bacterial niche where a direct plant-bacteria interaction occurs
(Benizri et al. 2001). Thus, proteomic analysis of root microsomal

205
Chapter 3
fraction can be very useful for looking into plant-bacteria interaction
regarding signalling and transport processes.
The present chapter aimed to evaluate the bacterial effects on the
root microsomal proteomic profiles in mature plants. Plant growth was
determined at 8 weeks post-inoculation (wpi) and microsomal proteins
analyzed by shot-gun proteomics. Additionally, antioxidant and
phosphorus nutrition statuses were evaluated and a bioassay under low
phosphorus conditions was performed based on proteomic results.
Experimental design
Main experiment The main experiment of third chapter
consisted of a randomized complete block design with two tomato plant
lines (wt and nr) and three inoculation treatments: (1) non-inoculated
control plants, (2) Bacillus megaterium-inoculated plants and (3)
Enterobacter C7-inoculated plants. Each treatment consisted in eleven
replicates (n=11). Plants were harvested at 8 weeks post inoculation
(wpi).
Differential phosphorus conditions bioassay The experiment
with low phosphorus were also carried out as a randomized complete
block design with the two plant lines and three inoculation treatments
abovementioned, and two phosphorus treatments: control conditions
(Control P; NaH2PO4 1 mM) and low phosphorus conditions (Low P;
NaH2PO4 0.2 mM). Each treatment consisted of seven replicates (n=7)
and plants were harvested at 4 wpi.

206
Chapter 3
Wellwatered8 weeks
10 dayplantlets
PGPB Inoculation
Harvest8 wpi
Maturestage
Sample
Collection
Determination• Plant growth
• Proteomic analysis• Phosphorus concentration• Phosphate transporters
expression• Antioxidant enzymatic
activities• Antioxidant metabolites
Root tissue
Seed Sterlizationand Germination
Day 0
Figure 3.1 Schematic representation of experimental design of main experiment in
chapter 3. Weeks post-inoculation (wpi).
Control PNutrient solution
NaH2PO4
1 mM
10 dayplantlets
PGPB Inoculation
Harvest4 wpi
SampleCollection
Determination• Plant growth• Root phosphorus• Shoot phosphorus• Phosphate transporters
expression
Low PNutrient solution
NaH2PO4
0.2 mM
Seed Sterlizationand Germination
Day 0
Figure 3.2 Schematic representation of experimental design of differential
phosphorus conditions bioassay in chapter 3. Weeks post-inoculation (wpi).

207
Chapter 3
Results
Biomass production of PGPB-inoculated wt and nr plants
In order to evaluate plant-growth promoting activity of both
tested bacterial strains regarding to ethylene insensitivity, the biomass
production was evaluated by fresh weight (FW) determination in the
first experiment showing no significant interaction between main
factors (GxI) (Fig. 3.3). Total FW showed an increase due to PGPB
inoculation in wt plants (13.1 % and 22.6 % for Bm and C7,
respectively). Nevertheless, in nr plants only C7 inoculation promoted
plant growth (19.7 % compared to non-inoculated plants), showing Bm
inoculation no significant growth promotion (Fig. 3.3 A).
Moreover, shoot FW was increased by both bacterial inoculations
in both plant genotypes. Bm inoculation increased shoot FW by 17.7 %
and 14.1 % in wt and nr plants, respectively. Meanwhile, shoot FW
increases of 26.3 % and 25.9 % were noticed due to C7 inoculation in
wt and nr plants, respectively (Fig. 3.3 B). In contrast, no significant
differences were observed in root FW due to any bacterial inoculation
(Fig. 3.3 C).
In addition, significant differences between plant genotypes were
noticed in shoot FW independently of inoculation treatment showing
higher values nr than wt plants. However, differences between plant
genotypes were observed in non- and Bm-inoculated plants but
showing nr plants lower root FW values than wt ones (Fig. 3.3 B, C).

208
Chapter 3
0
10
20
30
40
50
60
70
80
wt nr
A
Tota
l Fre
shW
eigh
t(g) b
y yza a
zGxI ns
0
10
20
30
40
50
60
wt nr
B
Shoo
tFre
shW
eigh
t(g)
b
y a a* z z
* *GxI ns
0
5
10
15
20
25
30
wt nr
CRo
otFr
esh
Wei
ght(
g)GxI ns
* *
Figure 3.3 Effects of bacterial inoculation on plant fresh weights. (A) Total, (B)
shoot, and (C) root fresh weights of wild type cv. Pearson (wt) and never ripe (nr)
tomato plants at 8 weeks post-inoculation (wpi). Treatments are designed as non-
inoculated controls (No, black bars), Bacillus megaterium-inoculated plants (Bm,
white bars), and Enterobacter C7-inoculated plants (C7, grey bars). Data are means ±
SE (n = 11). Data were analyzed by two-way ANOVA with plant genotype (G) and
inoculum (I) as sources of variation. Significance of sources of variation interaction
(GxI) was evaluated by P-value; ns, not significant; * P ≤ 0.05; ** P ≤ 0.01; *** P ≤
0.001. As no significant interaction between factors was noticed, inoculum effects
were evaluated analyzing separately wt and nr plants using ANOVA. Means followed
by different letters are significantly different (P < 0.05) according to LSD’s test, using
as highest value from letter a onwards for wt plants, and from letter z backwards for
nr plants. Plant genotype effect was evaluated analyzing wt and nr plants under the
same inoculation treatment (No, Bm or C7) by t-Student test and significant
difference (P < 0.05) is showed as (*) above nr means.

209
Chapter 3
Proteomic analysis of wt and nr plants inoculated with PGPB
strains
The proteomic analysis of microsomal root samples resulted in
1214 identified proteins. Among them, 1164 proteins were also
quantified at least in all samples coming from one treatment. Different
treatments were compared in pairs in order to analyze the bacterial
inoculation effects on wt and nr plants.
Protein data obtained for each treatment were used to build a data
matrix to perform a principal component analysis (PCA) in order to
compare inoculation treatments in wt and nr plants, as well as
differences between both plant genotypes (Fig. 3.4). Non-supervised
PCA almost separated treatments by plant genotype. Axes PC1 and
PC2 represented in the factorial plan, explained 41.9 % of data
variability. In wt plants, non-inoculated plant profiles mostly
overlapped with bacterial inoculated ones. Any bacterial inoculated
profile approximately shared the half of their area with controls and
mostly overlapped with each other. In contrast, although both bacterial
inoculations partly overlapped with non-inoculated nr plants, the C7
inoculation produced a higher separation from non-inoculated plants
than the Bm inoculation. Bm-inoculated profiles almost completely
overlapped with non-inoculated ones (Fig. 3.4 A).
In addition, a supervised PCA ( =0.1) was also carried out in
order to improve accuracy of analysis (Barshan et al. 2011). A clear
difference between genotypes was noticed in this analysis (47.0 %
variability along axes PC1 and PC2). In wt plants, both bacterial
inoculations partially overlapped with non-inoculated plants without
overlapping each other. Bm inoculation produced an almost completely

210
Chapter 3
overlapped protein profile with non-inoculated plants, meanwhile C7-
inoculated plant profile only shared a little area with non-inoculated
plants. Unexpectedly in case of nr plants, Bm-inoculated protein profile
was completely separated from non- and C7-inoculated profiles,
meanwhile C7 inoculated profile only overlapped a little area with non-
inoculated one (Fig. 3.4 B).
7.982-10.0
7.015
-11.1
PC1 (33.5%)
PC
2
(13.5
%)
nr Bm
wt C7
wt Bm
nr No
nr C7wt No
159 Proteins (13.66%)B
wt Bm
25.8
5
-23.3
23.1
4
-20.3
PC1 (29.6%)
PC
2
(12.3
%)
nr C7
wt C7
wt No
nr BMnr No
1164 ProteinsA
Figure 3.4 Effects of bacterial inoculation on microsomal proteomic profiles.
Principal component analyses (PCA) were performed based on protein quantification
data obtained from tomato roots. Treatments: non-inoculated, Bacillus megaterium-
inoculated and Enterobacter C7-inoculated wild-type plants (wt No, wt Bm and wt
C7, respectively) and non-inoculated, Bacillus megaterium-inoculated and
Enterobacter C7-inoculated never ripe plants (nr No, nr Bm and nr C7 respectively).
Each point represents a three-plant pool sample and points of the same treatment
were enclosed in a different colored ellipse: green for wt No, grey for wt Bm, purple
for wt C7, red for nr No, yellow for nr Bm and blue for nr C7. (A) Non-supervised
PCA; (B) Supervised PCA ( = 0.1%).

211
Chapter 3
Furthermore, the PGPB inoculation effects on wt and nr plants
compared with non-inoculated plants as well as between each others
directly were also evaluated using a Venn diagram (Fig. 3.5).
A
3620 ↑ 16 ↓
3020 ↑ 10 ↓3
B
4418 ↑ 26 ↓
2810 ↑ 18 ↓
1
C
1712↑ 5 ↓
7239↑ 33↓
3
Bacillus megaterium effects Enterobacter C7 effects
Comparison between PGPB effects
Figure 3.5 Venn diagrams for proteomic profiles comparisons. (A) Bacillus
megaterium inoculation effects on tomato plants; (B) Enterobacter C7 inoculation
effects on tomato plants; (C) Differences between Bacillus megaterium- and
Enterobacter C7-inoculated tomato plants. Each ellipse represents a comparison
between two treatments. Overlapping area proportionally represents number of
proteins that changes in two comparisons. Numbers indicate the number of
identified proteins with significant level modification. Induced and repressed
proteins by bacteria inoculation are represented by ↑ and ↓ symbols, respectively.
Treatments: non-inoculated, Bacillus megaterium-inoculated and Enterobacter C7-
inoculated wild-type plants (wt No, wt Bm and wt C7, respectively) and non-
inoculated, Bacillus megaterium-inoculated and Enterobacter C7-inoculated never
ripe plants (nr No, nr Bm and nr C7 respectively).

212
Chapter 3
Bacillus megaterium inoculation effects on proteomic profiles
Bacillus megaterium inoculation significantly affects several
protein levels independently of plant genotype. In wt plants, Bm
inoculation produced level modification of 33 proteins (Table 3.1).
Among them, 22 proteins were induced and 11 proteins were repressed.
Moreover, 5 proteins showed fold change over 2 between treatments.
Plant MetGenMap identified several changed pathways (P < 0.05) due
to Bm inoculation of wt plants. Dihydroxiacetone cycle (formaldehyde
assimilation), Calvin-Benson-Bassham cycle, oxygenic photosynthesis,
glycolysis and superpathway of glycolysis, pyruvate deshydrogenase,
Krebs cycle and glyoxylate bypass were significantly affected due to
modification of triosephosphate isomerase levels. Indeed,
triosephosphate isomerase was undetected under Bm inoculation.
Table 3.1 Differentially expressed proteins due to Bacillus megaterium inoculation
in tomato Pearson cv. wild type.
Protein Solyc ID Fold-change
Proteins induced by Bacillus megaterium inoculation
60S ribosomal protein L4-B ┴ Solyc10g084350 2.86
Inorganic phosphate transporter * ┴ Solyc09g066410 2.82
50S ribosomal protein L11 Solyc02g082500 2.17
Solute carrier family 2, facilitated glucose transporter member 12 ┴ Solyc04g082700 1.90
Receptor like kinase, RLK Solyc02g071810 1.88
Harpin binding protein 1 ┴ Solyc09g090330 1.82
40S ribosomal protein S8 Solyc06g007570 1.76
Chaperone DnaK Solyc01g103450 1.69
Ribosomal protein L3-like * Solyc01g103510 1.68
40S ribosomal protein S29 Solyc06g073430 1.68
60S ribosomal protein L38 Solyc03g058990 1.67
Cathepsin B-like cysteine proteinase Solyc04g078540 1.62
Ras-related protein Rab-2-A Solyc02g093530 1.57
Ribosomal protein L26 Solyc02g092430 1.54
Magnesium transporter MRS2-1 Solyc11g066660 1.53
40S ribosomal protein S24 Solyc06g084230 1.49
AD-dependent malic enzyme 2 Solyc08g013860 1.48
60 ribosomal protein L14 Solyc06g008260 1.43
60 ribosomal protein L14 Solyc06g083820 1.42
60S ribosomal protein L14 Solyc09g066430 1.34
Ribosomal protein Solyc08g061850 1.32
60S ribosomal protein L23a Solyc09g005720 1.25
Proteins repressed by Bacillus megaterium inoculation
Triosephosphate isomerase * Solyc04g011510 Non-detected with Bm
Argininosuccinate synthase Solyc05g012270 2.51
Reticulon family protein Solyc08g081730 1.96
Vesicle-associated membrane protein-associated protein A Solyc01g090910 1.83
NADH-quinone oxidoreductase subunit N Solyc00g013130 1.79
Dynamin 2 Solyc05g050600 1.70
S-adenosyl-L-methionine salicylic acid carboxyl methyltransferase Solyc01g005230 1.60
tRNA pseudouridine synthase B Solyc02g081810 1.57
LysM domain containing protein ┴ Solyc11g012870 1.55
Aquaporin ┴ Solyc06g075650 1.41
Vacuolar ATPase subunit H protein Solyc07g005940 1.24
* Common proteins that are diferentially expressed due to Bacillus megaterium (Bm) inoculation in wild type and never
ripe plants
┴ Common proteins that are diferentially expressed due to both bacterial inoculations in wild type plants

213
Chapter 3
Protein Solyc ID Fold-change
Proteins induced by Bacillus megaterium inoculation
60S ribosomal protein L4-B ┴ Solyc10g084350 2.86
Inorganic phosphate transporter * ┴ Solyc09g066410 2.82
50S ribosomal protein L11 Solyc02g082500 2.17
Solute carrier family 2, facilitated glucose transporter member 12 ┴ Solyc04g082700 1.90
Receptor like kinase, RLK Solyc02g071810 1.88
Harpin binding protein 1 ┴ Solyc09g090330 1.82
40S ribosomal protein S8 Solyc06g007570 1.76
Chaperone DnaK Solyc01g103450 1.69
Ribosomal protein L3-like * Solyc01g103510 1.68
40S ribosomal protein S29 Solyc06g073430 1.68
60S ribosomal protein L38 Solyc03g058990 1.67
Cathepsin B-like cysteine proteinase Solyc04g078540 1.62
Ras-related protein Rab-2-A Solyc02g093530 1.57
Ribosomal protein L26 Solyc02g092430 1.54
Magnesium transporter MRS2-1 Solyc11g066660 1.53
40S ribosomal protein S24 Solyc06g084230 1.49
AD-dependent malic enzyme 2 Solyc08g013860 1.48
60 ribosomal protein L14 Solyc06g008260 1.43
60 ribosomal protein L14 Solyc06g083820 1.42
60S ribosomal protein L14 Solyc09g066430 1.34
Ribosomal protein Solyc08g061850 1.32
60S ribosomal protein L23a Solyc09g005720 1.25
Proteins repressed by Bacillus megaterium inoculation
Triosephosphate isomerase * Solyc04g011510 Non-detected with Bm
Argininosuccinate synthase Solyc05g012270 2.51
Reticulon family protein Solyc08g081730 1.96
Vesicle-associated membrane protein-associated protein A Solyc01g090910 1.83
NADH-quinone oxidoreductase subunit N Solyc00g013130 1.79
Dynamin 2 Solyc05g050600 1.70
S-adenosyl-L-methionine salicylic acid carboxyl methyltransferase Solyc01g005230 1.60
tRNA pseudouridine synthase B Solyc02g081810 1.57
LysM domain containing protein ┴ Solyc11g012870 1.55
Aquaporin ┴ Solyc06g075650 1.41
Vacuolar ATPase subunit H protein Solyc07g005940 1.24
* Common proteins that are diferentially expressed due to Bacillus megaterium (Bm) inoculation in wild type and never
ripe plants
┴ Common proteins that are diferentially expressed due to both bacterial inoculations in wild type plants
In nr plants, 39 proteins were affected due to Bm inoculation
(Table 3.2). 21 proteins were induced and 18 were reduced in Bm-
inoculated plants compared to non-inoculated plants. 19 proteins
showed fold change over 2 between treatments. As observed in Bm-
inoculated wt plants, triosephosphate isomerase was undetected under
Bm inoculation. Although Bm inoculation modified protein levels in
higher degree in nr than in wt plants, pathway analysis resulted in only
one significant altered pathway (P < 0.05) due to Bm inoculation of nr
plants. The glutathione-mediated detoxification was affected due to
increased levels of glutathione S-transferase observed in Bm-inoculated
nr plants. Unexpectedly, although triosephosphate isomerase showed
the same differential expression as in wt plants, all abovementioned
altered pathways were unaffected in nr plants.

214
Chapter 3
Table 3.2 Differentially expressed proteins due to Bacillus megaterium inoculation
in tomato Pearson cv. never ripe.
Protein Solyc ID Fold-change
Proteins induced by Bacillus megaterium inoculation
Lysosomal Pro-X carboxypeptidase Solyc11g066590 Non-detected in controls
Glutathione S-transferase ┴ Solyc01g081270 24.16
Band 7 stomatin family protein ┴ Solyc06g073030 12.63
Glutathione S-transferase Solyc08g080900 8.82
50S ribosomal protein L4 ┴ Solyc12g088730 3.60
Ribosomal protein L3-like * Solyc01g103510 2.66
Heat shock protein 70-3 Solyc10g086410 2.51
Non-specific lipid-transfer protein Solyc01g105010 2.49
Neutral ceramidase Solyc03g006140 2.43
Subtilisin-like protease Solyc06g062950 2.04
V-type proton ATPase subunit E ┴ Solyc08g081910 1.85
Guanine nucleotide-binding protein beta subunit-like protein Solyc06g069010 1.80
Protein disulfide isomerase L-2 Solyc04g049450 1.79
60S ribosomal protein L34 Solyc06g069860 1.57
60S ribosomal protein L34 Solyc02g087930 1.56
Syntaxin-71 ┴ Solyc10g084210 1.53
Phosphoglycerate kinase Solyc07g066600 1.50
Os06g0220000 protein (Fragment) ┴ Solyc01g105410 1.42
14-3-3 protein beta/alpha-1 Solyc02g063070 1.40
Flavoprotein wrbA Solyc02g079750 1.39
Ribosomal protein L18 Solyc01g099900 1.31
Proteins repressed by Bacillus megaterium inoculation
Triosephosphate isomerase * ┴ Solyc04g011510 Non-detected with Bm
Reductase ┴ Solyc08g081530 65.32
F-box family protein Solyc04g057950 4.77
Metacaspase 7 Solyc09g098150 3.31
Erlin-2 Solyc05g012340 2.58
Mitochondrial porin (Voltage-dependent anion channel) outer membrane protein
Solyc02g092440 2.38
Receptor like kinase, RLK Solyc12g014350 2.15
Ras-related protein Rab-8A Solyc11g073050 2.08
Cytochrome c1 Solyc06g067920 2.07
Vesicle-associated membrane protein 7C Solyc06g065950 1.93
Inorganic phosphate transporter * ┴ Solyc09g066410 1.83
NADH dehydrogenase Solyc03g007660 1.72
Acid phosphatase Solyc04g008260 1.62
Dolichyl-diphosphooligosaccharide--protein glycosyltransferase subunit 1
Solyc04g082670 1.62
2-oxoglutarate/malate translocator Solyc01g105540 1.52
Homology to unknown gene (Fragment) Solyc11g065490 1.49
HVA22-like protein e Solyc11g010930 1.49
REF-like stress related protein 1 Solyc05g015390 1.34
* Common proteins that are diferentially expressed due to Bacillus megaterium (Bm) inoculation in wild type and never
ripe plants
┴ Common proteins that are diferentially expressed due to both bacterial inoculations in never ripe plants

215
Chapter 3
Protein Solyc ID Fold-change
Proteins induced by Bacillus megaterium inoculation
Lysosomal Pro-X carboxypeptidase Solyc11g066590 Non-detected in controls
Glutathione S-transferase ┴ Solyc01g081270 24.16
Band 7 stomatin family protein ┴ Solyc06g073030 12.63
Glutathione S-transferase Solyc08g080900 8.82
50S ribosomal protein L4 ┴ Solyc12g088730 3.60
Ribosomal protein L3-like * Solyc01g103510 2.66
Heat shock protein 70-3 Solyc10g086410 2.51
Non-specific lipid-transfer protein Solyc01g105010 2.49
Neutral ceramidase Solyc03g006140 2.43
Subtilisin-like protease Solyc06g062950 2.04
V-type proton ATPase subunit E ┴ Solyc08g081910 1.85
Guanine nucleotide-binding protein beta subunit-like protein Solyc06g069010 1.80
Protein disulfide isomerase L-2 Solyc04g049450 1.79
60S ribosomal protein L34 Solyc06g069860 1.57
60S ribosomal protein L34 Solyc02g087930 1.56
Syntaxin-71 ┴ Solyc10g084210 1.53
Phosphoglycerate kinase Solyc07g066600 1.50
Os06g0220000 protein (Fragment) ┴ Solyc01g105410 1.42
14-3-3 protein beta/alpha-1 Solyc02g063070 1.40
Flavoprotein wrbA Solyc02g079750 1.39
Ribosomal protein L18 Solyc01g099900 1.31
Proteins repressed by Bacillus megaterium inoculation
Triosephosphate isomerase * ┴ Solyc04g011510 Non-detected with Bm
Reductase ┴ Solyc08g081530 65.32
F-box family protein Solyc04g057950 4.77
Metacaspase 7 Solyc09g098150 3.31
Erlin-2 Solyc05g012340 2.58
Mitochondrial porin (Voltage-dependent anion channel) outer membrane protein
Solyc02g092440 2.38
Receptor like kinase, RLK Solyc12g014350 2.15
Ras-related protein Rab-8A Solyc11g073050 2.08
Cytochrome c1 Solyc06g067920 2.07
Vesicle-associated membrane protein 7C Solyc06g065950 1.93
Inorganic phosphate transporter * ┴ Solyc09g066410 1.83
NADH dehydrogenase Solyc03g007660 1.72
Acid phosphatase Solyc04g008260 1.62
Dolichyl-diphosphooligosaccharide--protein glycosyltransferase subunit 1
Solyc04g082670 1.62
2-oxoglutarate/malate translocator Solyc01g105540 1.52
Homology to unknown gene (Fragment) Solyc11g065490 1.49
HVA22-like protein e Solyc11g010930 1.49
REF-like stress related protein 1 Solyc05g015390 1.34
* Common proteins that are diferentially expressed due to Bacillus megaterium (Bm) inoculation in wild type and never
ripe plants
┴ Common proteins that are diferentially expressed due to both bacterial inoculations in never ripe plants
Furthermore, the effects on wt and nr plants produced by Bm
inoculation was also evaluated using a Venn diagram. Most of the
proteins were specifically altered in wt or nr roots by Bm inoculation
regarding controls. Only three proteins were significantly affected in
both plant genotypes by Bm inoculation, meanwhile 30 and 36 proteins
showed specific level modifications in wt and nr plants, respectively
(Fig. 3.5 A). Among these three proteins affected in both plant
genotypes, an inorganic phosphate transporter was induced in wt plants
due to Bm inoculation, meanwhile a reduction in its levels was noticed
in Bm-inoculated nr plants. A triosephosphate isomerase was detected
and quantified in non-inoculated wt and nr plants, but was undetected
when plants were inoculated with Bm. Moreover, a ribosomal protein
L3-like was induced in both plant genotypes due to Bm inoculation.
Enterobacter C7 inoculation effects on proteomic profiles
Enterobacter C7 inoculation significantly affects several protein
levels independently of plant genotype and greater effect was observed
on nr plants (Tables 3.3 and 3.4). In wt plants, levels of 29 proteins
were significantly affected by C7 inoculation (11 induced and 18
repressed proteins). Among them, a fold change over 2 was noticed for
9 proteins (Table 3.3). However, pathway analysis showed no
significant altered pathways.

216
Chapter 3
Table 3.3 Differentially expressed proteins due to Enterobacter C7 inoculation in
tomato Pearson cv. wild type.
Protein Solyc ID Fold-change
Proteins induced by Enterobacter C7 inoculation
Aquaporin-like protein Solyc08g066840 3.74
Non-specific lipid-transfer protein Solyc01g005990 3.00
Inorganic phosphate transporter * ┴ Solyc09g066410 2.53
60S ribosomal protein L4-B ┴ Solyc10g084350 2.24
Ascorbate peroxidase Solyc02g083630 2.09
Peroxidase 4 Solyc04g071890 1.77
Solute carrier family 2, facilitated glucose transporter member 12 ┴ Solyc04g082700 1.74
Unknown Protein Solyc01g020590 1.67
Dihydroxy-acid dehydratase Solyc05g053540 1.61
Harpin binding protein 1 ┴ Solyc09g090330 1.32
Peroxidase Solyc03g006700 1.29
Proteins repressed by Enterobacter C7 inoculation
Blue copper protein (Fragment) Solyc07g008110 8.28
Glucan synthase like 7 Solyc01g006350 3.57
Related to ATP dependent RNA helicase Solyc06g082100 2.42
V-type proton ATPase 16 kDa proteolipid subunit c2 Solyc02g084360 2.20
6 7-dimethyl-8-ribityllumazine synthase Solyc08g015660 1.94
Aquaporin ┴ Solyc06g075650 1.75
Cathepsin B-like cysteine proteinase Solyc12g088670 1.73
LysM domain containing protein ┴ Solyc11g012870 1.66
14-3-3 protein beta/alpha-B Solyc04g076060 1.66
Major latex-like protein Solyc00g323130 1.61
Protein kinase-like protein Solyc05g009540 1.60
Remorin 2 Solyc01g094370 1.60
Aminotransferase-like protein Solyc12g006450 1.47
Ras-related protein Rab-1A Solyc01g103370 1.39
30S ribosomal protein S9 Solyc04g026100 1.30
26S proteasome non-ATPase regulatory subunit 4 Solyc02g083710 1.29
Flavoprotein wrbA Solyc02g079750 1.29
Xylanase inhibitor (Fragment) Solyc01g080010 1.09
* Common proteins that are diferentially expressed due to Enterobacter C7 (C7) inoculation in wild type and never ripe
plants
┴ Common proteins that are diferentially expressed due to both bacterial inoculations in wild type plants
In nr plants, C7 inoculation produced modification in levels of 45
proteins. Eighteen proteins were increased and 27 were reduced due to
C7 inoculation with 20 proteins over a 2-fold change (Table 3.4). In
fact, the dolichyl-diphosphooligosacharide-protein glycosyltransferase
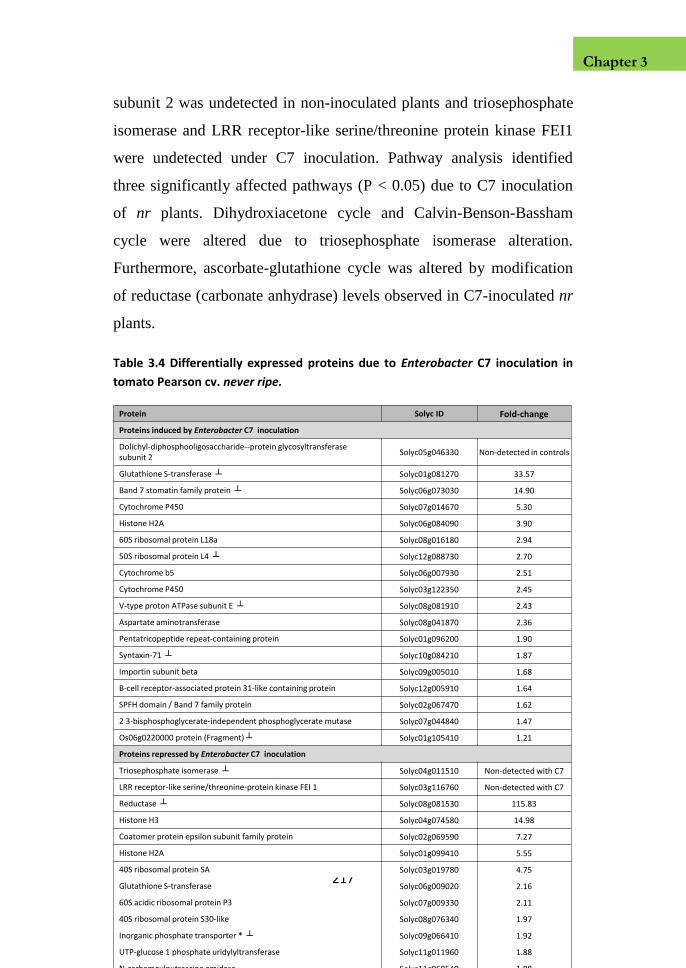
217
Chapter 3
subunit 2 was undetected in non-inoculated plants and triosephosphate
isomerase and LRR receptor-like serine/threonine protein kinase FEI1
were undetected under C7 inoculation. Pathway analysis identified
three significantly affected pathways (P < 0.05) due to C7 inoculation
of nr plants. Dihydroxiacetone cycle and Calvin-Benson-Bassham
cycle were altered due to triosephosphate isomerase alteration.
Furthermore, ascorbate-glutathione cycle was altered by modification
of reductase (carbonate anhydrase) levels observed in C7-inoculated nr
plants.
Table 3.4 Differentially expressed proteins due to Enterobacter C7 inoculation in
tomato Pearson cv. never ripe.
Protein Solyc ID Fold-change
Proteins induced by Enterobacter C7 inoculation
Dolichyl-diphosphooligosaccharide--protein glycosyltransferase subunit 2
Solyc05g046330 Non-detected in controls
Glutathione S-transferase ┴ Solyc01g081270 33.57
Band 7 stomatin family protein ┴ Solyc06g073030 14.90
Cytochrome P450 Solyc07g014670 5.30
Histone H2A Solyc06g084090 3.90
60S ribosomal protein L18a Solyc08g016180 2.94
50S ribosomal protein L4 ┴ Solyc12g088730 2.70
Cytochrome b5 Solyc06g007930 2.51
Cytochrome P450 Solyc03g122350 2.45
V-type proton ATPase subunit E ┴ Solyc08g081910 2.43
Aspartate aminotransferase Solyc08g041870 2.36
Pentatricopeptide repeat-containing protein Solyc01g096200 1.90
Syntaxin-71 ┴ Solyc10g084210 1.87
Importin subunit beta Solyc09g005010 1.68
B-cell receptor-associated protein 31-like containing protein Solyc12g005910 1.64
SPFH domain / Band 7 family protein Solyc02g067470 1.62
2 3-bisphosphoglycerate-independent phosphoglycerate mutase Solyc07g044840 1.47
Os06g0220000 protein (Fragment) ┴ Solyc01g105410 1.21
Proteins repressed by Enterobacter C7 inoculation
Triosephosphate isomerase ┴ Solyc04g011510 Non-detected with C7
LRR receptor-like serine/threonine-protein kinase FEI 1 Solyc03g116760 Non-detected with C7
Reductase ┴ Solyc08g081530 115.83
Histone H3 Solyc04g074580 14.98
Coatomer protein epsilon subunit family protein Solyc02g069590 7.27
Histone H2A Solyc01g099410 5.55
40S ribosomal protein SA Solyc03g019780 4.75
Glutathione S-transferase Solyc06g009020 2.16
60S acidic ribosomal protein P3 Solyc07g009330 2.11
40S ribosomal protein S30-like Solyc08g076340 1.97
Inorganic phosphate transporter * ┴ Solyc09g066410 1.92
UTP-glucose 1 phosphate uridylyltransferase Solyc11g011960 1.88
N-carbamoylputrescine amidase Solyc11g068540 1.88
Fasciclin-like arabinogalactan protein 13 Solyc01g091530 1.87
40S ribosomal protein S6 Solyc12g096300 1.73
40S ribosomal protein S7-like protein Solyc06g069090 1.68
Heat shock protein 4 Solyc12g043110 1.61
26S proteasome regulatory subunit Solyc05g053650 1.61
60S ribosomal protein L24 Solyc09g008800 1.59
Threonine synthase Solyc03g121910 1.51
30S ribosomal protein S19 Solyc06g053820 1.49
40S ribosomal protein S24 Solyc06g084230 1.46
Proteasome subunit alpha type Solyc10g008010 1.40
2-oxoglutarate dehydrogenase E1 component Solyc04g011350 1.37
Phosphatidylinositol transfer protein SFH5 Solyc11g027880 1.33
Dihydrolipoyllysine-residue acetyltransferase component of pyruvate dehydrogenase complex
Solyc07g006790 1.30
14-3-3 protein beta/alpha-B Solyc04g074510 1.19
* Common proteins that are diferentially expressed due to Enterobacter C7 (C7) inoculation in wild type and never ripe
plants
┴ Common proteins that are diferentially expressed due to both bacterial inoculations in never ripe plants

218
Chapter 3
Protein Solyc ID Fold-change
Proteins induced by Enterobacter C7 inoculation
Dolichyl-diphosphooligosaccharide--protein glycosyltransferase subunit 2
Solyc05g046330 Non-detected in controls
Glutathione S-transferase ┴ Solyc01g081270 33.57
Band 7 stomatin family protein ┴ Solyc06g073030 14.90
Cytochrome P450 Solyc07g014670 5.30
Histone H2A Solyc06g084090 3.90
60S ribosomal protein L18a Solyc08g016180 2.94
50S ribosomal protein L4 ┴ Solyc12g088730 2.70
Cytochrome b5 Solyc06g007930 2.51
Cytochrome P450 Solyc03g122350 2.45
V-type proton ATPase subunit E ┴ Solyc08g081910 2.43
Aspartate aminotransferase Solyc08g041870 2.36
Pentatricopeptide repeat-containing protein Solyc01g096200 1.90
Syntaxin-71 ┴ Solyc10g084210 1.87
Importin subunit beta Solyc09g005010 1.68
B-cell receptor-associated protein 31-like containing protein Solyc12g005910 1.64
SPFH domain / Band 7 family protein Solyc02g067470 1.62
2 3-bisphosphoglycerate-independent phosphoglycerate mutase Solyc07g044840 1.47
Os06g0220000 protein (Fragment) ┴ Solyc01g105410 1.21
Proteins repressed by Enterobacter C7 inoculation
Triosephosphate isomerase ┴ Solyc04g011510 Non-detected with C7
LRR receptor-like serine/threonine-protein kinase FEI 1 Solyc03g116760 Non-detected with C7
Reductase ┴ Solyc08g081530 115.83
Histone H3 Solyc04g074580 14.98
Coatomer protein epsilon subunit family protein Solyc02g069590 7.27
Histone H2A Solyc01g099410 5.55
40S ribosomal protein SA Solyc03g019780 4.75
Glutathione S-transferase Solyc06g009020 2.16
60S acidic ribosomal protein P3 Solyc07g009330 2.11
40S ribosomal protein S30-like Solyc08g076340 1.97
Inorganic phosphate transporter * ┴ Solyc09g066410 1.92
UTP-glucose 1 phosphate uridylyltransferase Solyc11g011960 1.88
N-carbamoylputrescine amidase Solyc11g068540 1.88
Fasciclin-like arabinogalactan protein 13 Solyc01g091530 1.87
40S ribosomal protein S6 Solyc12g096300 1.73
40S ribosomal protein S7-like protein Solyc06g069090 1.68
Heat shock protein 4 Solyc12g043110 1.61
26S proteasome regulatory subunit Solyc05g053650 1.61
60S ribosomal protein L24 Solyc09g008800 1.59
Threonine synthase Solyc03g121910 1.51
30S ribosomal protein S19 Solyc06g053820 1.49
40S ribosomal protein S24 Solyc06g084230 1.46
Proteasome subunit alpha type Solyc10g008010 1.40
2-oxoglutarate dehydrogenase E1 component Solyc04g011350 1.37
Phosphatidylinositol transfer protein SFH5 Solyc11g027880 1.33
Dihydrolipoyllysine-residue acetyltransferase component of pyruvate dehydrogenase complex
Solyc07g006790 1.30
14-3-3 protein beta/alpha-B Solyc04g074510 1.19
* Common proteins that are diferentially expressed due to Enterobacter C7 (C7) inoculation in wild type and never ripe
plants
┴ Common proteins that are diferentially expressed due to both bacterial inoculations in never ripe plants
In addition, Venn diagram showed that C7 inoculation effects on
wt and nr plants were mostly genotype specific (Fig 3.5 B). While 28
and 44 proteins showed specific level modifications in wt and nr plants,
respectively, only one protein was significantly affected in both plant
genotypes due to C7 inoculation. This protein was identified as an
inorganic phosphate transporter. As observed in Bm-inoculated plants,
it was increased and reduced in wt and nr plants due to C7 inoculation,
respectively.
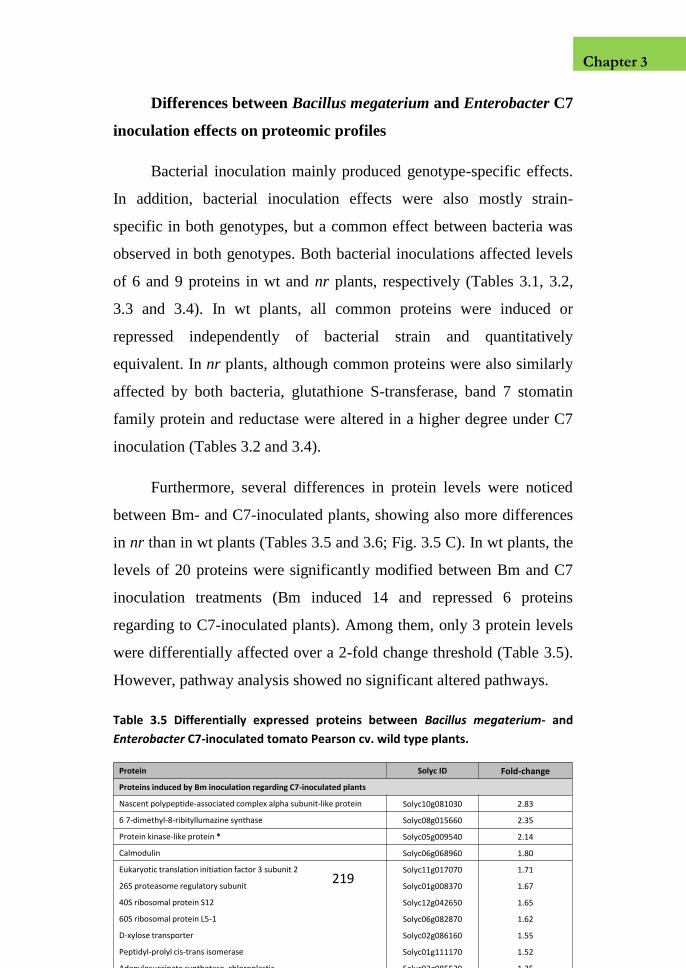
219
Chapter 3
Differences between Bacillus megaterium and Enterobacter C7
inoculation effects on proteomic profiles
Bacterial inoculation mainly produced genotype-specific effects.
In addition, bacterial inoculation effects were also mostly strain-
specific in both genotypes, but a common effect between bacteria was
observed in both genotypes. Both bacterial inoculations affected levels
of 6 and 9 proteins in wt and nr plants, respectively (Tables 3.1, 3.2,
3.3 and 3.4). In wt plants, all common proteins were induced or
repressed independently of bacterial strain and quantitatively
equivalent. In nr plants, although common proteins were also similarly
affected by both bacteria, glutathione S-transferase, band 7 stomatin
family protein and reductase were altered in a higher degree under C7
inoculation (Tables 3.2 and 3.4).
Furthermore, several differences in protein levels were noticed
between Bm- and C7-inoculated plants, showing also more differences
in nr than in wt plants (Tables 3.5 and 3.6; Fig. 3.5 C). In wt plants, the
levels of 20 proteins were significantly modified between Bm and C7
inoculation treatments (Bm induced 14 and repressed 6 proteins
regarding to C7-inoculated plants). Among them, only 3 protein levels
were differentially affected over a 2-fold change threshold (Table 3.5).
However, pathway analysis showed no significant altered pathways.
Table 3.5 Differentially expressed proteins between Bacillus megaterium- and
Enterobacter C7-inoculated tomato Pearson cv. wild type plants.
Protein Solyc ID Fold-change
Proteins induced by Bm inoculation regarding C7-inoculated plants
Nascent polypeptide-associated complex alpha subunit-like protein Solyc10g081030 2.83
6 7-dimethyl-8-ribityllumazine synthase Solyc08g015660 2.35
Protein kinase-like protein * Solyc05g009540 2.14
Calmodulin Solyc06g068960 1.80
Eukaryotic translation initiation factor 3 subunit 2 Solyc11g017070 1.71
26S proteasome regulatory subunit Solyc01g008370 1.67
40S ribosomal protein S12 Solyc12g042650 1.65
60S ribosomal protein L5-1 Solyc06g082870 1.62
D-xylose transporter Solyc02g086160 1.55
Peptidyl-prolyl cis-trans isomerase Solyc01g111170 1.52
Adenylosuccinate synthetase, chloroplastic Solyc02g085520 1.35
30S ribosomal protein S9 Solyc04g026100 1.35
Ectonucleoside triphosphate diphosphohydrolase 6 * Solyc12g098540 1.31
26S proteasome non-ATPase regulatory subunit 4 Solyc02g083710 1.15
Proteins induced by C7 inoculation regarding Bm-inoculated plants
tRNA pseudouridine synthase B Solyc02g081810 1.74
Chitinase Solyc10g055800 1.72
Major allergen Mal d 1 * Solyc09g090980 1.43
Atozi1 (Fragment) Solyc10g080190 1.39
NADH-quinone oxidoreductase subunit C Solyc00g019950 1.29
Mitochondrial processing peptidase alpha subunit Solyc12g008630 1.25
* Common proteins that are diferentially expressed between Bacillus megaterium- and Enterobacter C7-inoculated wild
type and never ripe plants

220
Chapter 3
Protein Solyc ID Fold-change
Proteins induced by Bm inoculation regarding C7-inoculated plants
Nascent polypeptide-associated complex alpha subunit-like protein Solyc10g081030 2.83
6 7-dimethyl-8-ribityllumazine synthase Solyc08g015660 2.35
Protein kinase-like protein * Solyc05g009540 2.14
Calmodulin Solyc06g068960 1.80
Eukaryotic translation initiation factor 3 subunit 2 Solyc11g017070 1.71
26S proteasome regulatory subunit Solyc01g008370 1.67
40S ribosomal protein S12 Solyc12g042650 1.65
60S ribosomal protein L5-1 Solyc06g082870 1.62
D-xylose transporter Solyc02g086160 1.55
Peptidyl-prolyl cis-trans isomerase Solyc01g111170 1.52
Adenylosuccinate synthetase, chloroplastic Solyc02g085520 1.35
30S ribosomal protein S9 Solyc04g026100 1.35
Ectonucleoside triphosphate diphosphohydrolase 6 * Solyc12g098540 1.31
26S proteasome non-ATPase regulatory subunit 4 Solyc02g083710 1.15
Proteins induced by C7 inoculation regarding Bm-inoculated plants
tRNA pseudouridine synthase B Solyc02g081810 1.74
Chitinase Solyc10g055800 1.72
Major allergen Mal d 1 * Solyc09g090980 1.43
Atozi1 (Fragment) Solyc10g080190 1.39
NADH-quinone oxidoreductase subunit C Solyc00g019950 1.29
Mitochondrial processing peptidase alpha subunit Solyc12g008630 1.25
* Common proteins that are diferentially expressed between Bacillus megaterium- and Enterobacter C7-inoculated wild
type and never ripe plants
In nr plants, the levels of 75 proteins were significantly modified
between inoculation of Bm and C7. 42 proteins were increased and 33
were reduced due to Bm inoculation compared to C7 inoculation with
13 proteins over a 2-fold change (Table 3.6). Despite of great
differences noticed between Bm- and C7-inoculated nr plants, no
significantly affected pathways were identified.
Table 3.6 Differentially expressed proteins between Bacillus megaterium- and
Enterobacter C7-inoculated tomato Pearson cv. never ripe plants.
Protein Solyc ID Fold-change
Proteins induced by Bm inoculation regarding C7-inoculated plants
Aspartyl aminopeptidase Solyc11g007090 23.83
40S ribosomal protein S8 Solyc06g083180 2.44
Glutathione S-transferase Solyc06g009020 2.34
30S ribosomal protein S19 Solyc06g053820 2.29
Proteasome subunit alpha type Solyc07g055080 1.78
Major allergen Mal d 1 * Solyc09g090980 1.76
Unknown Protein Solyc07g017410 1.75
Ribosomal protein L30 Solyc11g071490 1.71
4-alpha-glucanotransferase Solyc02g020980 1.68
Ribosomal protein L7a Solyc06g064460 1.68
Ribosomal protein L30 Solyc01g009100 1.67
Ectonucleoside triphosphate diphosphohydrolase 6 * Solyc12g098540 1.66
N-carbamoylputrescine amidase Solyc11g068540 1.66
60S acidic ribosomal protein P3 Solyc07g009330 1.65
Nitrilase/cyanide hydratase and apolipoprotein N-acyltransferase Solyc10g047630 1.63
Proteasome subunit beta type Solyc11g069150 1.59
Translationally-controlled tumor protein homolog Solyc01g099770 1.56
Histidyl-tRNA synthetase 1 Solyc03g119280 1.55
60S ribosomal protein L24 Solyc09g008800 1.51
60S ribosomal protein L34 Solyc06g069860 1.51
Phospholipase D Solyc06g068090 1.51
Unknown Protein Solyc01g020590 1.47
Regulator of ribonuclease activity A Solyc04g008280 1.46
Ribosomal protein L18 Solyc01g099900 1.45
Fasciclin-like arabinogalactan protein 13 Solyc01g091530 1.45
50S ribosomal protein L25 Solyc02g090420 1.45
60S ribosomal protein L37a Solyc08g007140 1.44
Proteasome subunit alpha type Solyc04g080590 1.43
UTP-glucose 1 phosphate uridylyltransferase Solyc11g011960 1.43
Proteasome subunit beta type Solyc07g016200 1.40
Heat shock protein 4 Solyc12g043110 1.39
Protein kinase-like protein * Solyc05g009540 1.38
Ribosomal protein L12 Solyc11g065670 1.36
60S ribosomal protein L23a Solyc09g005720 1.35
Proteasome subunit beta type Solyc09g082320 1.33
Ribosomal protein L3 Solyc01g104590 1.30
Proteasome subunit alpha type Solyc12g009140 1.30
60S ribosomal protein L6 Solyc04g014720 1.26
2-oxoglutarate dehydrogenase E1 component Solyc04g011350 1.26
Proteasome subunit alpha type Solyc02g081700 1.25
Dihydrolipoyllysine-residue succinyltransferase component of 2-oxoglutarate dehydrogenase complex
Solyc07g064800 1.23
26S proteasome non-ATPase regulatory subunit 13 Solyc05g053140 1.19
Proteins induced by C7 inoculation regarding Bm-inoculated plants
F-box family protein Solyc04g057950 5.00
Non-green plastid inner envelope membrane protein Solyc09g015650 4.40
LETM1 and EF-hand domain-containing protein 1, mitochondrial Solyc11g008770 2.87
Cytochrome P450 Solyc07g014670 2.84
Cytochrome c1 Solyc06g067920 2.48
Ras-related protein Rab-8A Solyc11g073050 2.16
Dolichyl-diphosphooligosaccharide--protein glycosyltransferase subunit 1 Solyc04g082670 2.08
Cc-nbs-lrr, resistance protein Solyc04g007030 2.08
Receptor like kinase, RLK Solyc12g014350 2.06
Histone H1 Solyc06g084020 1.94
Pore protein of (OEP24) Solyc04g080190 1.92
Receptor protein kinase Solyc00g289230 1.91
Mitochondrial Rho GTPase 1 Solyc01g098920 1.74
Sorting and assembly machinery component 50 homolog Solyc04g079270 1.68
Mitochondrial 2-oxoglutarate/malate carrier protein Solyc01g005620 1.66
Cytochrome P450 Solyc03g122350 1.64
Pentatricopeptide repeat-containing protein Solyc01g096200 1.58
Ras-related protein Rab-7a Solyc04g072060 1.58
B-cell receptor-associated protein 31-like containing protein Solyc12g005910 1.54
Cytochrome b5 Solyc06g007930 1.54
NADH-quinone oxidoreductase F subunit family protein Solyc02g087240 1.49
Aquaporin Solyc06g060760 1.48
Pre-mRNA splicing factor Solyc04g017710 1.47
Cc-nbs-lrr, resistance protein Solyc02g084450 1.47
NADH-quinone oxidoreductase subunit D Solyc00g014830 1.43
Mitochondrial phosphate carrier protein Solyc02g094470 1.38
Mitochondrial processing peptidase beta subunit Solyc02g088700 1.36
Calcium-binding protein Calnexin Solyc03g118040 1.35
Mitochondrial processing peptidase beta subunit Solyc05g012480 1.33
V-type proton ATPase subunit C Solyc03g097790 1.31
1-phosphatidylinositol-4 5-bisphosphate phosphodiesterase Solyc05g052760 1.30
ATP synthase gamma chain Solyc03g115110 1.25
Protein kinase Solyc03g114210 1.18
* Common proteins that are diferentially expressed between Bacillus megaterium- and Enterobacter C7-inoculated wild
type and never ripe plants

221
Chapter 3
Protein Solyc ID Fold-change
Proteins induced by Bm inoculation regarding C7-inoculated plants
Aspartyl aminopeptidase Solyc11g007090 23.83
40S ribosomal protein S8 Solyc06g083180 2.44
Glutathione S-transferase Solyc06g009020 2.34
30S ribosomal protein S19 Solyc06g053820 2.29
Proteasome subunit alpha type Solyc07g055080 1.78
Major allergen Mal d 1 * Solyc09g090980 1.76
Unknown Protein Solyc07g017410 1.75
Ribosomal protein L30 Solyc11g071490 1.71
4-alpha-glucanotransferase Solyc02g020980 1.68
Ribosomal protein L7a Solyc06g064460 1.68
Ribosomal protein L30 Solyc01g009100 1.67
Ectonucleoside triphosphate diphosphohydrolase 6 * Solyc12g098540 1.66
N-carbamoylputrescine amidase Solyc11g068540 1.66
60S acidic ribosomal protein P3 Solyc07g009330 1.65
Nitrilase/cyanide hydratase and apolipoprotein N-acyltransferase Solyc10g047630 1.63
Proteasome subunit beta type Solyc11g069150 1.59
Translationally-controlled tumor protein homolog Solyc01g099770 1.56
Histidyl-tRNA synthetase 1 Solyc03g119280 1.55
60S ribosomal protein L24 Solyc09g008800 1.51
60S ribosomal protein L34 Solyc06g069860 1.51
Phospholipase D Solyc06g068090 1.51
Unknown Protein Solyc01g020590 1.47
Regulator of ribonuclease activity A Solyc04g008280 1.46
Ribosomal protein L18 Solyc01g099900 1.45
Fasciclin-like arabinogalactan protein 13 Solyc01g091530 1.45
50S ribosomal protein L25 Solyc02g090420 1.45
60S ribosomal protein L37a Solyc08g007140 1.44
Proteasome subunit alpha type Solyc04g080590 1.43
UTP-glucose 1 phosphate uridylyltransferase Solyc11g011960 1.43
Proteasome subunit beta type Solyc07g016200 1.40
Heat shock protein 4 Solyc12g043110 1.39
Protein kinase-like protein * Solyc05g009540 1.38
Ribosomal protein L12 Solyc11g065670 1.36
60S ribosomal protein L23a Solyc09g005720 1.35
Proteasome subunit beta type Solyc09g082320 1.33
Ribosomal protein L3 Solyc01g104590 1.30
Proteasome subunit alpha type Solyc12g009140 1.30
60S ribosomal protein L6 Solyc04g014720 1.26
2-oxoglutarate dehydrogenase E1 component Solyc04g011350 1.26
Proteasome subunit alpha type Solyc02g081700 1.25
Dihydrolipoyllysine-residue succinyltransferase component of 2-oxoglutarate dehydrogenase complex
Solyc07g064800 1.23
26S proteasome non-ATPase regulatory subunit 13 Solyc05g053140 1.19
Proteins induced by C7 inoculation regarding Bm-inoculated plants
F-box family protein Solyc04g057950 5.00
Non-green plastid inner envelope membrane protein Solyc09g015650 4.40
LETM1 and EF-hand domain-containing protein 1, mitochondrial Solyc11g008770 2.87
Cytochrome P450 Solyc07g014670 2.84
Cytochrome c1 Solyc06g067920 2.48
Ras-related protein Rab-8A Solyc11g073050 2.16
Dolichyl-diphosphooligosaccharide--protein glycosyltransferase subunit 1 Solyc04g082670 2.08
Cc-nbs-lrr, resistance protein Solyc04g007030 2.08
Receptor like kinase, RLK Solyc12g014350 2.06
Histone H1 Solyc06g084020 1.94
Pore protein of (OEP24) Solyc04g080190 1.92
Receptor protein kinase Solyc00g289230 1.91
Mitochondrial Rho GTPase 1 Solyc01g098920 1.74
Sorting and assembly machinery component 50 homolog Solyc04g079270 1.68
Mitochondrial 2-oxoglutarate/malate carrier protein Solyc01g005620 1.66
Cytochrome P450 Solyc03g122350 1.64
Pentatricopeptide repeat-containing protein Solyc01g096200 1.58
Ras-related protein Rab-7a Solyc04g072060 1.58
B-cell receptor-associated protein 31-like containing protein Solyc12g005910 1.54
Cytochrome b5 Solyc06g007930 1.54
NADH-quinone oxidoreductase F subunit family protein Solyc02g087240 1.49
Aquaporin Solyc06g060760 1.48
Pre-mRNA splicing factor Solyc04g017710 1.47
Cc-nbs-lrr, resistance protein Solyc02g084450 1.47
NADH-quinone oxidoreductase subunit D Solyc00g014830 1.43
Mitochondrial phosphate carrier protein Solyc02g094470 1.38
Mitochondrial processing peptidase beta subunit Solyc02g088700 1.36
Calcium-binding protein Calnexin Solyc03g118040 1.35
Mitochondrial processing peptidase beta subunit Solyc05g012480 1.33
V-type proton ATPase subunit C Solyc03g097790 1.31
1-phosphatidylinositol-4 5-bisphosphate phosphodiesterase Solyc05g052760 1.30
ATP synthase gamma chain Solyc03g115110 1.25
Protein kinase Solyc03g114210 1.18
* Common proteins that are diferentially expressed between Bacillus megaterium- and Enterobacter C7-inoculated wild
type and never ripe plants

222
Chapter 3
Protein Solyc ID Fold-change
Proteins induced by Bm inoculation regarding C7-inoculated plants
Aspartyl aminopeptidase Solyc11g007090 23.83
40S ribosomal protein S8 Solyc06g083180 2.44
Glutathione S-transferase Solyc06g009020 2.34
30S ribosomal protein S19 Solyc06g053820 2.29
Proteasome subunit alpha type Solyc07g055080 1.78
Major allergen Mal d 1 * Solyc09g090980 1.76
Unknown Protein Solyc07g017410 1.75
Ribosomal protein L30 Solyc11g071490 1.71
4-alpha-glucanotransferase Solyc02g020980 1.68
Ribosomal protein L7a Solyc06g064460 1.68
Ribosomal protein L30 Solyc01g009100 1.67
Ectonucleoside triphosphate diphosphohydrolase 6 * Solyc12g098540 1.66
N-carbamoylputrescine amidase Solyc11g068540 1.66
60S acidic ribosomal protein P3 Solyc07g009330 1.65
Nitrilase/cyanide hydratase and apolipoprotein N-acyltransferase Solyc10g047630 1.63
Proteasome subunit beta type Solyc11g069150 1.59
Translationally-controlled tumor protein homolog Solyc01g099770 1.56
Histidyl-tRNA synthetase 1 Solyc03g119280 1.55
60S ribosomal protein L24 Solyc09g008800 1.51
60S ribosomal protein L34 Solyc06g069860 1.51
Phospholipase D Solyc06g068090 1.51
Unknown Protein Solyc01g020590 1.47
Regulator of ribonuclease activity A Solyc04g008280 1.46
Ribosomal protein L18 Solyc01g099900 1.45
Fasciclin-like arabinogalactan protein 13 Solyc01g091530 1.45
50S ribosomal protein L25 Solyc02g090420 1.45
60S ribosomal protein L37a Solyc08g007140 1.44
Proteasome subunit alpha type Solyc04g080590 1.43
UTP-glucose 1 phosphate uridylyltransferase Solyc11g011960 1.43
Proteasome subunit beta type Solyc07g016200 1.40
Heat shock protein 4 Solyc12g043110 1.39
Protein kinase-like protein * Solyc05g009540 1.38
Ribosomal protein L12 Solyc11g065670 1.36
60S ribosomal protein L23a Solyc09g005720 1.35
Proteasome subunit beta type Solyc09g082320 1.33
Ribosomal protein L3 Solyc01g104590 1.30
Proteasome subunit alpha type Solyc12g009140 1.30
60S ribosomal protein L6 Solyc04g014720 1.26
2-oxoglutarate dehydrogenase E1 component Solyc04g011350 1.26
Proteasome subunit alpha type Solyc02g081700 1.25
Dihydrolipoyllysine-residue succinyltransferase component of 2-oxoglutarate dehydrogenase complex
Solyc07g064800 1.23
26S proteasome non-ATPase regulatory subunit 13 Solyc05g053140 1.19
Proteins induced by C7 inoculation regarding Bm-inoculated plants
F-box family protein Solyc04g057950 5.00
Non-green plastid inner envelope membrane protein Solyc09g015650 4.40
LETM1 and EF-hand domain-containing protein 1, mitochondrial Solyc11g008770 2.87
Cytochrome P450 Solyc07g014670 2.84
Cytochrome c1 Solyc06g067920 2.48
Ras-related protein Rab-8A Solyc11g073050 2.16
Dolichyl-diphosphooligosaccharide--protein glycosyltransferase subunit 1 Solyc04g082670 2.08
Cc-nbs-lrr, resistance protein Solyc04g007030 2.08
Receptor like kinase, RLK Solyc12g014350 2.06
Histone H1 Solyc06g084020 1.94
Pore protein of (OEP24) Solyc04g080190 1.92
Receptor protein kinase Solyc00g289230 1.91
Mitochondrial Rho GTPase 1 Solyc01g098920 1.74
Sorting and assembly machinery component 50 homolog Solyc04g079270 1.68
Mitochondrial 2-oxoglutarate/malate carrier protein Solyc01g005620 1.66
Cytochrome P450 Solyc03g122350 1.64
Pentatricopeptide repeat-containing protein Solyc01g096200 1.58
Ras-related protein Rab-7a Solyc04g072060 1.58
B-cell receptor-associated protein 31-like containing protein Solyc12g005910 1.54
Cytochrome b5 Solyc06g007930 1.54
NADH-quinone oxidoreductase F subunit family protein Solyc02g087240 1.49
Aquaporin Solyc06g060760 1.48
Pre-mRNA splicing factor Solyc04g017710 1.47
Cc-nbs-lrr, resistance protein Solyc02g084450 1.47
NADH-quinone oxidoreductase subunit D Solyc00g014830 1.43
Mitochondrial phosphate carrier protein Solyc02g094470 1.38
Mitochondrial processing peptidase beta subunit Solyc02g088700 1.36
Calcium-binding protein Calnexin Solyc03g118040 1.35
Mitochondrial processing peptidase beta subunit Solyc05g012480 1.33
V-type proton ATPase subunit C Solyc03g097790 1.31
1-phosphatidylinositol-4 5-bisphosphate phosphodiesterase Solyc05g052760 1.30
ATP synthase gamma chain Solyc03g115110 1.25
Protein kinase Solyc03g114210 1.18
* Common proteins that are diferentially expressed between Bacillus megaterium- and Enterobacter C7-inoculated wild
type and never ripe plants
Additionally, Venn diagram showed bacterial inoculation
differences in wt and nr plants were mostly genotype-specific (Fig. 3.5
C). 17 and 72 proteins showed specific level modifications in wt and nr
plants, respectively, and three proteins were significantly affected in
both bacterial inoculations in both plant genotypes. A protein kinase-
like protein and ectonucleoside triphosphate diphosphohydrolase 6
were induced under Bm inoculation regarding C7 inoculation treatment
in both plant genotypes. However, major allergen Mal d 1 showed
higher protein values in C7-inoculated wt plants, meanwhile its levels
were higher in Bm-inoculated nr plants (Tables 3.5 and 3.6).

223
Chapter 3
Phosphate solubilizing bioassay
In order to check phosphorus bioavailability under different
inoculation treatments, phosphate solubilization capacity of PGPB was
tested and phosphate solubilization index (PSI) was calculated for each
bacterial strain (Fig. 3.6). A Pseudomonas sp. strain named C+ p12 was
used as positive control reaching a PSI-value of almost 2 and showing a
clear transparent halo around bacterial colony. In contrast, Bm and C7
strains showed significant reduced values of PSI (around 1.12) and very
tiny halos were noticed around colonies. Thus, no differences were
noticed between Bm and C7 in ability to solubilize phosphates and both
PGPB could be classified as negative phosphate solubilizers.
0.0
0.5
1.0
1.5
2.0
2.5
C+ p12 BM C7
PSI
(r_
u)
a
b b
C+ p12 Bm C7
A
B
Figure 3.6 Phosphate solubilization bioassay. (A) Phosphate solubilization index
values observed with NBRIP medium in plate assay. Positive control strain
Pseudomonas p12 (C+ p12, black bars), Bacillus megaterium (Bm, white bars), and
Enterobacter C7 (C7, grey bars). Data are means ± SE (n=5). Means followed by
different letters are significantly different (P < 0.05) according to LSD’s test. (B)
Pictures of bacterial colonies and phosphate solubilization halos observed with
NBRIP medium in plate assay.

224
Chapter 3
Phosphorus nutrition
In the main experiment, root phosphorus concentration and
expression of phosphate transporter genes (SlPT1 and SlPT2) were
determined in root tissue (Fig. 3.7). Root P concentration showed
interaction between factors (GxI) resulting in significant differences in
wt and nr plants due to bacterial inoculation. In wt plants, C7
inoculation increased P concentration by 26.5 % regarding non-
inoculated plants, meanwhile no effects were noticed due to Bm
inoculation. In contrast, only Bm inoculation produced an increase of P
concentration in nr roots (24.5 % regarding non-inoculated plants). In
addition, significant differences between wt and nr plants were
exclusively noticed under C7 inoculation showing nr plants lower
values than wt ones (Fig. 3.7 A).
Furthermore, expression of phosphate transporters did not show
factor interaction and was unaffected in wt plants, meanwhile different
effects were observed in nr plants due to bacterial inoculation. Bm
inoculation increased SlPT1 expression in nr plants, but no expression
change was noticed in SlPT2 levels. In contrast, C7 inoculation did not
affect SlPT1 expression and induced SlPT2 expression in nr plants.
Moreover significant differences between wt and nr plants were
exclusively noticed for SlPT1 expression in non-inoculated plants (Fig.
3.7 B, C).

225
Chapter 3
0.00
0.02
0.04
0.06
0.08
0.10
0.12
0.14
wt nr
A
Ro
ot
Ph
osp
ho
rus
(% D
W) BC
AB
C
A
BC BC
GxI **
0.0
0.2
0.4
0.6
0.8
1.0
1.2
1.4
wt nr
B
SlP
T1(r
el.
exp
ress
ion
)
y y
z
GxI ns
*
0.0
0.2
0.4
0.6
0.8
1.0
1.2
1.4
wt nr
CSl
PT2
(re
l. e
xpre
ssio
n)
y y
z
GxI ns
Figure 3.7 Effects of bacterial inoculation on root phosphorus concentration and
expression of phosphate transporters. (A) Root phosphorus concentration (% Dry
Weight (DW)) (n=7), (B) Solanum lycopersicum phosphate transporter 1 (SlPT1)
expression (n=3), and (C) Solanum lycopersicum phosphate transporter 2 (SlPT2)
expression (n=3) of wild type cv. Pearson (wt) and never ripe (nr) tomato plants.
Treatments are designed as non-inoculated controls (No, black bars), Bacillus
megaterium inoculated plants (Bm, white bars), and Enterobacter C7 inoculated
plants (C7, grey bars). Data were analyzed by two-way ANOVA with plant genotype
(G) and inoculum (I) as sources of variation. Significance of sources of variation
interaction (GxI) was evaluated by P-value; ns, not significant; * P ≤ 0.05; ** P ≤ 0.01;
*** P ≤ 0.001. In case of significant interaction between factors, all treatments were
compared between each other’s. Means followed by different capital letters are
significantly different (P < 0.05) according to LSD’s test. In case of not-significant

226
Chapter 3
interaction between factors, inoculum effects were evaluated analyzing separately
wt and nr plants using ANOVA. Means followed by different letters are significantly
different (P < 0.05) according to LSD’s test, using as highest value from letter a
onwards for wt plants, and from letter z backwards for nr plants. Plant genotype
effect was evaluated analyzing wt and nr plants under the same inoculation
treatment (No, Bm or C7) by t-Student test and significant difference (P < 0.05) is
showed as (*) above nr means.
Differential phosphorus conditions bioassay
In order to evaluate P nutrition involvement in PGPB
mechanisms, a bioassay with two P nutrition regimes was performed.
Biomass production was evaluated to determine importance of
phosphorus in plant growth promotion by bacterial strains.
Additionally, P concentration in root and shoot tissues as well as root
phosphate transporters expression were evaluated to determine bacterial
inoculation effects on phosphorus accumulation and acquisition,
respectively. Factor interaction between main factors (GxPxI) was
noticed in case of root P concentration and SlPT2 expression (Fig. 3.8).
Several differences were noticed in biomass production due to
bacterial inoculation (Fig. 3.8 A, B, C). A reduction in all DWs was
observed due to low P treatment regarding control P conditions. Plant
growth promotion was only noticed by C7 inoculation in nr plants
independently of P nutrition regime. Under control P conditions, C7
inoculation in nr plants increased total (25.1 %) and shoot (26.2 %)
DWs, but no significant difference was noticed in root DW. Under low
phosphorus conditions, C7 inoculation in nr plants increased total (80.3
%), shoot (71.1 %) and root (116.7 %) DWs. However, no significant
effects were noticed in wt plants due to C7 inoculation. In contrast, Bm
inoculation only produced significant changes in wt plants under

227
Chapter 3
control P conditions showing a reduction of total (21.8 %), shoot (19.2
%) and root (34.4 %) DWs, showing no significant effects on wt plants
under low P conditions. Bm inoculation in nr plants had no growth
effects under any P regime. Furthermore, significant differences
between wt and nr plants were noticed in total, shoot and root DWs in
all cases excepting under C7 inoculation and low P conditions. It was
generally noticed that wt plants were more efficient than nr plants in
biomass production under both P nutrition regimes (Fig. 3.8 A, B, C).
In addition, several effects were noticed in root P concentration
(Fig. 3.8 D). No effects were noticed due to any bacterial inoculation in
nr plants compared to non-inoculated plants. However in wt plants, Bm
inoculation decreased and increased root P concentration under control
and low P conditions, respectively, while C7 inoculation only increased
root P concentration under control P conditions. Moreover, a reduction
in root P concentration was observed due to low P treatment regarding
control P conditions in non- and C7-inoculated wt plants, but not
noticed under Bm inoculation treatment. In nr plants, this reduction due
to low P conditions was observed in all cases. Furthermore, differences
between inocula were noticed in wt plants under control P conditions
and in nr plants under low P conditions. C7 inoculation increased root
P concentration regarding Bm-inoculated plants in both cases. In
addition, nr plants significantly showed higher root P concentration
than wt ones in all cases excepting under C7 inoculation and control P
conditions, and under Bm inoculation and low P conditions (Fig. 3.8
D). Moreover, no significant effects were observed in shoot P
concentration due to PGPB inoculation neither by plant genotype,
showing exclusively the low P treatment a significant decrease of P
concentration (Fig. 3.8 E).

228
Chapter 3
0.00
0.02
0.04
0.06
0.08
0.10
0.12
0.14
0.16
0.18
Control P Low P Control P Low P
wt nr
D
Ro
ot
Pho
sph
oru
s(%
DW
)
DECD
EF
D
BC
EF
F
G
A GxPxI **
FG
AB AB
0.00
0.05
0.10
0.15
0.20
0.25
0.30
0.35
Control P Low P Control P Low P
wt nr
E
Sho
ot
Pho
sph
oru
s(%
DW
) a a a z z z
b b by y y
GxPxI ns
GxPxI ns
0.0
0.2
0.4
0.6
0.8
1.0
1.2
1.4
1.6
Control P Low P Control P Low P
wt nr
A
Tota
l Dry
Wei
ght
(g)
w w
x
y y
z
a
b
ab
c c c
GxPxI ns
* *
* *
*
0.0
0.2
0.4
0.6
0.8
1.0
1.2
1.4
Control P Low P Control P Low P
wt nr
B
Sho
ot
Dry
Wei
ght
(g)
w w
xy y
z
c c c
a
b
ab
GxPxI ns
* *
* *
*
0.00
0.05
0.10
0.15
0.20
0.25
0.30
Control P Low P Control P Low P
wt nr
No Bm C7C
Ro
ot
Dry
Wei
ght
(g)
w w
xc c c
a
b
ab
yzz
y
**
*
* *
0.0
0.2
0.4
0.6
0.8
1.0
1.2
1.4
1.6
1.8
2.0
Control P Low P Control P Low P
wt nr
F
SlPT
1(r
el. e
xpre
ssio
n)
cd
d
bc
a
bab
GxPxI ns
0
2
4
6
8
10
12
14
16
18
Control P Low P Control P Low P
wt nr
G
SlPT
2(r
el. e
xpre
ssio
n)
B
BCDE
A
F
GxPxI *
EF EFEF
DEF
CDEF
BCD BCD
BC
Figure 3.8 Effects of bacterial inoculation on plant growth and phosphorus
nutrition under two differential phosphorus-nutrition conditions. (A) Total, (B)
shoot and (C) root dry weights (n=7), (D) root and (E) shoot phosphorous content
(n=4), (F) Solanum lycopersicum phosphate transporter 1 (SlPT1) expression (n=3)
and (G) Solanum lycopersicum phosphate transporter 2 (SlPT2) expression (n=3) of
wild type cv. Pearson (wt) and never ripe (nr) tomato plants irrigated with two
differential phosphorus regimes: 1 and 0.2 mM. Treatments are designed as non-
inoculated controls (No, black bars), Bacillus megaterium inoculated plants (Bm,
white bars), and Enterobacter C7 inoculated plants (C7, grey bars). Data are means ±
SE. Data were analyzed by three-way ANOVA with plant genotype (G), phosphorous
regime (P) and inoculum (I) as sources of variation. Significance of sources of
variation interaction (GxPxI) was evaluated by P-value; ns, not significant; * P ≤ 0.05;

229
Chapter 3
** P ≤ 0.01; *** P ≤ 0.001. In case of significant interaction between factors, all
treatments were compared between each other’s. Means followed by different
capital letters are significantly different (P < 0.05) according to LSD’s test. In case of
not-significant interaction between factors, inoculum effects were evaluated
analyzing separately wt and nr plants using ANOVA. Means followed by different
letters are significantly different (P < 0.05) according to LSD’s test, using as highest
value from letter a onwards for wt plants and from letter z backwards for nr plants.
Plant genotype effect was evaluated analyzing wt and nr plants under the same
inoculation treatment (No, Bm or C7) by t-Student test and significant difference (P <
0.05) is showed as (*) above nr means.
Finally, expression of phosphate transporter genes (SlPT1 and
SlPT2) was evaluated. On one hand, SlPT1 expression was only
affected in wt plants, not showing inoculation or low P effects on nr
plants. Under control P conditions, C7 inoculation significantly reduced
SlPT1 expression regarding non-inoculated wt plants; meanwhile no
effect was noticed due to Bm inoculation. Under low P conditions,
SlPT1 expression differences between Bm- and C7-inoculated wt plants
were noticed showing Bm-inoculated wt plants higher expression than
C7-inoculated ones. Furthermore, low P treatment induced SlPT1
expression only under Bm and C7 inoculation treatments. In addition,
no differences between wt and nr plants were noticed for SlPT1
expression (Fig. 3.8 F). On the other hand, SlPT2 expression showed
changes in both wt and nr plants. In wt plants, low P treatment
significantly induced SlPT2 expression regarding control P conditions,
but no PGPB inoculation effects were observed. However, SlPT2
expression was significantly reduced by both Bm and C7 inoculations
under low P conditions without differences between each inocula in nr
plants. PGPB inoculation did not show effect in nr plants under control
P conditions. Additionally, induction of SlPT2 expression by low P
treatment was observed under no and Bm inoculation conditions, but

230
Chapter 3
not noticed under C7 inoculation. In addition, significant differences
between plant genotypes were exclusively noticed in non-inoculated
plants under low P conditions (Fig. 3.8 G).
Table 3.7 Effects of bacterial inoculation on antioxidant enzymatic activities.
ANOVA of superoxide dismutase (SOD), glutathione reductase (GR), ascorbate
peroxidase (APX) and catalase (CAT) activities in cv. Pearson tomato plants. SOD
activity: expressed in unities of SOD g-1
protein; GR activity: expressed in nmol
oxidized NADPH min-1
g-1
protein; APX activity expressed in nmol oxidized
ascorbate min-1
g-1
protein; CAT activity: expressed in nmol H202 min-1
g-1
protein.
Data are means ± SE (n = 7). Significance of sources of variation interaction (GxI) was
evaluated by P-value. As no significant interaction between factors was noticed,
inoculum effects were evaluated analyzing separately wt and nr plants using ANOVA.
Means followed by different letters are significantly different (P < 0.05) according to
LSD’s test, using as highest value from letter a onwards for wt plants, and from letter
z backwards for nr plants. Plant genotype effect was evaluated analyzing wt and nr
plants under the same inoculation treatment (No, Bm or C7) by t-Student test and
significant difference (P < 0.05) is showed as (*) next to nr means.
SOD Activity GR activity APX activity CAT activity
wt No170.50
+/- 35.535.08
+/- 0.591.98
+/- 0.09 a914.31
+/- 142.51
wt Bm178.51
+/- 30.874.47
+/- 0.531.54
+/- 0.13 b631.60
+/- 54.37
wt C7160.72
+/- 19.524.08
+/- 0.171.54
+/- 0.06 b802.95
+/- 75.26
P-value ns ns ** ns
nr No204.78
+/- 44.976.62
+/- 0.902.58
+/- 0.641389.96
+/- 318.99
nr Bm168.87
+/- 28.374.39
+/- 0.561.56
+/- 0.151081.88 *+/- 149.61
nr C7185.48
+/- 28.265.80
+/- 0.821.80
+/- 0.261213.65
+/- 185.21
P-value ns ns ns ns
Treatments: non-inoculated, Bacillus megaterium-inoculated and Enterobacter C7-
inoculated wild-type plants (wt No, wt Bm and wt C7, respectively) and non-
inoculated, Bacillus megaterium-inoculated and Enterobacter C7-inoculated never
ripe plants (nr No, nr Bm and nr C7 respectively).
P-value; ns, not significant; * P ≤ 0.05; ** P ≤ 0.01; *** P ≤ 0.001.

231
Chapter 3
Antioxidants enzymatic activities
Superoxide dismutase, glutathione reductase, ascorbate
peroxidase and catalase activities were determined in root tissue
samples of main experiment. No changes were noticed in SOD, GR,
and CAT activities due to PGPB inoculation in both plant genotypes.
However, APX activity showed a significant reduction due to both
bacterial inoculations only in wt plants. Furthermore, differences
between plant genotypes were exclusively observed for CAT activity
under Bm inoculation, showing nr plants higher values than wt ones
(Table 3.7).
Antioxidant compounds measurement
Ascorbic acid as well as reduced and oxidized glutathione forms
were determined in root tissue samples of main experiment (Fig. 3.9).
Ascorbic acid concentration showed a reduction due to C7 inoculation
only in wt plants showing no PGPB inoculation effects in nr plants.
Moreover, differences between plant genotypes were exclusively
observed in non-inoculated plants showing nr plants lower values than
wt ones (Fig 3.9 C). Nevertheless, glutathione forms were altered in
both plant genotypes by bacterial inoculation, showing different
modifications depending on sensitivity to ethylene. Bm inoculation
increased reduced glutathione (GSH) in wt roots, meanwhile a decrease
of GSH levels was noticed in nr plants. Furthermore, Bm inoculation
did not alter oxidized form of glutathione (GSSG) concentration in wt
roots, but increased levels were noticed in nr plants. On the other hand,
C7 inoculation reduced GSH concentration independently of plant
genotype and GSSG was increased by C7 inoculation also in both plant
genotypes. Furthermore, differences between inocula were noticed in

232
Chapter 3
GSH and GSSG levels in both genotypes, showing C7-inoculated
plants lower GSH levels and higher GSSG levels than Bm-inoculated
ones. Significant differences between wt and nr plants were also
noticed in GSH and GSSG levels. Non-inoculated nr plants showed
higher GSH levels and lower GSSG levels than wt ones. However,
lower GSH in nr than in wt plants and no change in GSSG levels were
noticed under Bm inoculation. In contrast, no GSH change and lower
GSSG levels in nr than in wt plants were observed under C7
inoculation (Fig. 3.9 A, B).
In addition, total glutathione was determined to examine the
glutathione pool. In wt plants, Bm inoculation increased total
glutathione concentration, meanwhile it was reduced due to C7
inoculation. In nr plants, both Bm and C7 inoculation decreased total
glutathione concentration, but lower values were noticed due to C7
inoculation. Significant differences between plant genotypes were
noticed showing bacteria-inoculated nr plants reduced glutathione pool
than wt ones and no change in non-inoculated plants (Fig. 3.9 D). Ratio
between GSH and GSSG is used as a marker for oxidative stress, with
higher values reflecting lower stress conditions (Mhamdi et al. 2010).
Bm inoculation increased GSH:GSSG in wt roots, meanwhile
GSH:GSSG was reduced in nr roots. Nevertheless, a decrease in
GSH:GSSG was noticed due to C7 inoculation in both plant genotypes.
Additionally, differences between inocula were also noticed in
GSH:GSSG in both plant genotypes, showing C7-inoculated plants
lower ratio values than Bm-inoculated ones. Significant differences
between wt and nr plants were exclusively noticed in non-inoculated
plants showing nr plants higher ratio than wt plants (Fig. 3.9 E).

233
Chapter 3
0
5
10
15
20
25
30
35
wt nr
A
GSH
(p
pm
)
B
A
C C
B
A
GxI ***
0
2
4
6
8
10
wt nr
B
GSS
G (
pp
m)
BC BC
A
B
CD
GxI *
0
5
10
15
20
25
wt nr
A
AB
BC BC BC
C
C
Asc
orb
icA
cid
(pp
m)
GxI *
0
5
10
15
20
25
30
35
40
wt nr
D
GSH
+ G
SSG
(pp
m)
BCA
D
AB
E
CD
GxI **
0
2
4
6
8
10
wt nr
No
Bm
C7
ER
atio
GSH
:GSS
G
C
B
D
A
BC
D
GxI ***
Figure 3.9 Effects of bacterial inoculation on ascorbic acid and glutathione. (A)
Reduced glutathione concentration, (B) oxidized glutathione concentration, (C)
ascorbic acid, (D) total glutathione concentration, and (E) ratio between reduced and
oxidized glutathione forms of wild type cv. Pearson (wt) and never ripe (nr) tomato
plants. Treatments are designed as non-inoculated controls (No, black bars), Bacillus
megaterium inoculated plants (Bm, white bars), and Enterobacter C7 inoculated
plants (C7, grey bars). Data are means ± SE (n = 7). Data were analyzed by two-way
ANOVA with plant genotype (G) and inoculum (I) as sources of variation. Significance
of sources of variation interaction (GxI) was evaluated by P-value; ns, not significant;
* P ≤ 0.05; ** P ≤ 0.01; *** P ≤ 0.001. As interaction between factors was noticed in
all cases, all treatments were compared between each other’s. Means followed by
different capital letters are significantly different (P < 0.05) according to LSD’s test.

234
Chapter 3
Discussion
In the present chapter, Bm inoculation only promoted plant
growth in wt plants. In contrast, C7 inoculation resulted in growth
promotion of both plant genotypes (Fig. 3.3). These results are in
accordance with previous results and PGPB mechanisms proposed as
dependent on ethylene perception by SlETR3 for Bm, but independent
of ethylene perception for C7 as discussed in previous chapters. The
bacterial effects on roots could be responsible of noticed differences
because bacterial niche is the plant root system (Benizri et al. 2001),
and thereby PGPB colonization can cause physiological modifications
as previously reported (Su et al. 2016).
PGPB inoculation affected proteomic profiles by different
mechanisms, showing strain-specific effects dependent on ethylene
insensitivity.
Root proteomic analysis of microsomal fraction was performed to
examine plant-bacteria interaction. Ethylene insensitivity produced
higher differences than bacterial inoculation, which additionally
increased differences between plant genotypes (Fig. 3.4 A). Moreover,
non-supervised PCA results suggest similar bacterial effects in wt
plants, but not in nr plants. These results are in concordance with
observed plant growth promotion suggesting that Bm inoculation could
be unable to induce protein changes that conduct to a plant-growth
stimulation. Specific differences between treatments were observed by
supervised PCA (Fig. 3.4 B). Genotype differences were clearly
noticed and a strain-specific effect was observed in wt plants

235
Chapter 3
suggesting two different PGPB mechanisms. Bacterial inoculation
effect was only as stronger as ethylene insensitivity effect due to Bm
inoculation in nr plants suggesting that specific protein changes could
block plant growth promotion as well. Thus, our results point to both
bacterial inoculations can modify both plant proteomic profiles by
different mechanisms, but the outcome is strain-specific, and dependent
on ethylene sensitivity.
Bacillus megaterium could be misrecognized by nr plants
causing oxidative stress
Bacillus megaterium inoculation produced less and slighter
protein level changes in wt than in nr plants and effects were mainly
genotype-specific (Tables 3.1 and 3.2). Triosephosphate isomerase
(TPI) was undetected in Bm-inoculated wt plants inducing significant
changes in several pathways of sugar metabolism. Nevertheless, TPI
was also undetected in Bm-inoculated nr plants, but these pathways
were unaltered suggesting the involvement of ethylene perception. TPI
is a sugar-metabolic enzyme and its inactivation would slow down
glycolysis and tricarboxylic acid cycle, and therefore arrest
mitochondrial metabolism under oxidative stress conditions resulting in
prevention of deleterious reactive oxygen species (ROS) production
(Cabiscol et al. 2000). Furthermore, the glutathione-mediated
detoxification was affected in Bm-inoculated nr plants, and TPI could
be target of glutathionylation for its function regulation (Ito et al.
2003). Additionally, opposed effects were noticed in inorganic
phosphate transporter due to Bm inoculation pointing to a involvement
of P nutrition as new player in Bm-plant interaction probably with

236
Chapter 3
involvement of ethylene sensitivity. In fact, ethylene and its perception
is highly related with P nutrition (Borch et al. 1999; Kim et al. 2008a;
Lei et al. 2011).
On one hand, specific changes were observed in wt plants by Bm
inoculation (Table 3.1). RPL4-B is involved in trafficking of vacuolar
targeted proteins affecting plant growth and its role was suggested as
essential for plant viability (Rosado et al. 2010). Moreover, 50SL11
plays a function in plastid ribosome activity and its mutation reduced
the growth-rate affecting photosynthesis (Pesaresi et al. 2001). In
contrast, argininosuccinate synthase (ASS), which is involved in
arginine synthesis (Slocum 2005), was repressed. In some pathogenic
fungi and bacteria, arginine is involved in growth and virulence in
planta and its auxotrophy leads to a pathogenicity lost (Namiki et al.
2001; Ardales et al. 2009). Thus, Bm inoculation produced specific
effects in wt plants that could increase protein synthesis and trafficking
in vacuole and chloroplast resulting in better plant growth and reduce
the possible overgrowth of Bm by decreasing arginine biosynthesis.
On the other hand, several specific changes were noticed in nr
plants by Bm inoculation (Table 3.2). Glutathione S-transferase (GST)
is a ubiquitous enzyme with antioxidant properties involved in
detoxification of xenobiotics and peroxide removal (Edwards et al.
2000; Edwards and Dixon 2005). The band 7 stomatin family protein is
involved in root meristem proliferation and could shape respiratory
chain functioning and organization (Gehl and Sweetlove 2014). Heat
shock protein 70 (Hsp70) plays role as chaperones (Sung et al. 2001;
Su and Li 2008). Stress can cause damage to plant cell and lead to
osmotic and oxidative stress inducing Hsps production (Scarpeci et al.

237
Chapter 3
2008; Al-Whaibi 2011). In addition, the non-specific lipid-transfer
proteins (nsLTPs) are fundamental in plant growth and development as
well as in resistance to a/biotic stresses (Liu et al. 2015) showing
differential expression in response to bacteria (Molina et al. 1993; Jung
et al. 2006), and have been classified as pathogenesis-related proteins
(Sels et al. 2008). NsLTPs present strong antimicrobial activity
(Gizatullina et al. 2013) and their over-expression significantly
increased resistance to bacterial pathogens (Molina and García-Olmedo
1997). Neutral ceramidases improve resistance to oxidative stress
responses (Li et al. 2015), and subtilisin-like proteases are involved in
proteolytic degradation during a/biotic programmed cell death (PCD)
such as during oxidative and osmotic stresses (Vartapetian et al. 2011).
Some of them are specifically induced by pathogen infection and could
function as receptor activating immune signalling processes located in
the plasmalemma (Figueiredo et al. 2014). Thus, induction of these
proteins suggested that nr plants inoculated with Bm were under stress
and plants responded counteracting the bacterial negative effects.
In contrast, Bm repressed some proteins in nr plants. Reductase
or carbonic anhydrase (CA) is involved in inorganic carbon transport
modulating efficient CO2 fixation in the photosynthetic process and in
respiration (Badger 1994; Price et al. 1994; Henry 1996). Furthermore,
a mitochondrial porin outer membrane protein is involved as a major
component of tRNA import of plant mitochondria (Salinas et al. 2006),
and its mutation reduced ATP synthesis rate (Pan et al. 2014).
Cytochrome c (Cc) is a redox carrier in the electron transport chain of
mitochondria (Eubel et al. 2004), and is able to interact with several
protein targets under homeostatic conditions affecting (among others)
ascorbate biosynthesis (Leferink et al. 2008; Hervás et al. 2013).

238
Chapter 3
Nevertheless, Cc in the cytoplasm and even in the nucleus is capable of
interacting with other proteins under PCD (Díaz-Moreno et al. 2011;
Martínez-Fábregas et al. 2013). Metacaspase 7 is also involved in
induction of PCD in plant cells (Bozhkov et al. 2005). In addition, Bm
inoculation reduced Ras-related protein Rab-8A protein levels
(ethylene-responsive small GTP-binding protein) (Moshkov et al.
2003), suggesting involvement of ethylene. Rab GTPases play a role in
intracellular membrane trafficking and would provide specificity for
events of membrane fusion (Zerial and McBride 2001). Moreover, F-
box proteins (involved in protein ubiquitination and degradation
(Hellmann et al. 2002)) control several important processes including
pathogen resistance (Lechner et al. 2006). Erlin1/2 form a complex that
mediates the endoplasmic reticulum-associated degradation of inositol
1,4,5-triphosphate receptors (Pearce et al. 2009; Wang et al. 2009).
These receptors are involved in Ca2+
signalling to control several
cellular and physiological processes (Bosanac et al. 2002; Taylor and
Tovey 2010) including responses to environmental stimuli in plants
(Krinke et al. 2007). Finally, a Receptor like kinase (RLK) appear to
play a central role in pathogen recognition, activation of plant defence
and developmental control (Afzal et al. 2008; De Smet et al. 2009).
Noticed reduction in these proteins pointed that Bm inoculation in nr
plants induced a metabolism alteration but which is counteracted by
plants to avoid cellular damage.
Thus, protein biosynthesis and degradation as well as trafficking
were modified by Bm inoculation in nr plants, affecting to
mitochondrial metabolism, and thus to several growth and
developmental processes and responses to environmental stimuli. Bm
could be perceived as a pathogenic-like bacteria by nr plants, since

239
Chapter 3
pathogenesis-related proteins were induced. In accordance with our
results, induction of a pathogenic-related protein by Bm was reported in
a tomato line deficient in ABA (Porcel et al. 2014). Furthermore,
several proteins involved in plant response to oxidative stress showed
augmented levels pointing to an increase in oxidative stress. However,
reduction in F-box, RLK, Cc and metacaspase7 suggested that plants
could modulate pathogenesis related response to avoid PCD. Indeed,
Bm did not reduce plant growth (Fig. 3.3) suggesting not completely
recognition as pathogen. In consequence, Bm inoculation in nr plants
may alter cell metabolism due to a fail in plant-bacteria interaction
mediated by ethylene perception that ends in an increase of oxidative
stress as previously observed with other beneficial microorganisms
(Van Loon et al. 2008). However, plant homeostasis counteracts
bacterial effects resulting in a non-pathogenic interaction and the same
growth as non-inoculated nr plants (Fig. 3.3). Indeed, beneficial
microorganisms can be recognized as potential invaders firstly
triggering immune response and later detaining it to let successful
beneficial association (Zamioudis and Pieterse 2012).
C7 inoculation increased oxidative stress and stimulates plant
growth in wt and nr plants modifying different proteins
Enterobacter C7 inoculation also caused minor and less intense
changes in protein levels in wt than in nr plants (Tables 3.3 and 3.4).
Moreover, most of effects are specific of plant genotype. Only an
inorganic phosphate transporter showed opposed effects suggesting that
phosphorus nutrition is also involved in C7 PGPB mechanism.

240
Chapter 3
Specific changes were observed in wt plants by C7 inoculation
(Table 3.3). An aquaporin-like protein was induced suggesting that C7
could improve transport of water, small neutral solutes or gases in
cellular membranes (Maurel et al. 2008). 60S ribosomal protein L4-B
induction pointed to alteration in trafficking of vacuolar targeted
proteins (Rosado et al., 2010). Additionally, APX is expressed in
response to a/biotic stresses and during plant development to detoxify
H2O2 avoiding cellular damage (Caverzan et al. 2012).
In contrast, C7 inoculation repressed some proteins in wt plants.
Blue copper proteins (BCPs) transport electrons in bacteria and plants
(De Rienzo et al. 2000), and are involved in lignin accumulation (Ji et
al. 2015). Indeed, BCP protein seems to be responsible of cell wall-
based resistance noticed in response to non-adapted bacteria (Mishina
and Zeier 2007). Moreover, glucan synthase-like 7 (GSL7) protein is a
callose synthase involved in phloem transport (Barratt et al. 2011).
Callose plays a key role in several processes in plant growth and
development as well as in response to a/biotic stresses (Chen and Kim
2009). RNA helicases are essential in RNA metabolism, regulate plant
growth and development (Owttrim 2006), and stabilize the plant
growth under stress-conditions (Tuteja et al. 2014). Furthermore,
vacuolar-type proton ATPases (VHA) acidifies intracellular
compartments to energize ion and metabolite transport.
In consequence, it could be proposed that C7 inoculation in wt
plants increased oxidative stress, probably because plant-bacteria
interaction induces pathogenesis related proteins such as nsLTP.
However, BCP and GSL7 reductions could facilitate interaction
between C7 and wt plants avoiding cell wall-based resistance.

241
Chapter 3
Nevertheless, C7 inoculation also showed specific effects in nr
plants (Table 3.4) inducing several proteins. The dolichyl-
diphosphooligosaccharide-protein glycosyltransferase subunit 2
(undetected in non-inoculated plants) is fundamental in N-glycosilation
of matrix polysaccharides affecting root cell growth and survival (Qin
et al. 2013). The Band 7 stomatin family protein induction suggested
modulation of respiratory chain and proliferation of root meristem
(Gehl & Sweetlove, 2014). A GST was highly induced by C7
inoculation indicating that plants were under oxidative stress.
Cytochrome P450 families are involved in chemical defence
mechanisms (Mizutani 2012) catalyzing a wide variety of reactions in
biosynthesis or catabolic pathways of phytohormones, antioxidants and
defense compounds (Bak et al. 2011). Cytochrome b5 is involved in
electron transference supplying reductant for polyunsaturated fatty acid
synthesis (Shanklin and Cahoon 1998; Kumar et al. 2012), which is
essential in cellular membranes (McConn and Browse 1998). The V-
type proton ATPase (V-ATPase) is the dominant H+-pump localized at
membranes of the secretory pathways and is essential for plant growth.
Under stress conditions, cell survival depends on maintain or
modulating V-ATPase activity (Dietz et al. 2001). Furthermore, it has
been suggested a interaction between V-ATPase subunits and
glycolytic enzymes that could allow quick ATPase access to protons
and ATP generated in glycolysis (Holliday and Holliday 2014).
Aspartate aminotransferase (AAT) is an enzyme with a key role in the
amino acid synthesis and involved in regulation of carbon and nitrogen
metabolism (Zhou et al. 2009). AAT catalyzes formation of aspartate,
which is the biosynthetic precursor of several amino acids as well as

242
Chapter 3
derived metabolites involved in plant growth, development,
reproduction and defence (De La Torre et al. 2014).
In addition, histones are involved in cell division (Zhao et al.
2000; Nelson et al. 2002) and chromatin reorganization (Talbert et al.
2002; Mizuguchi et al. 2004). Their modifications and variants play a
key role in gene expression regulation and DNA repair (Verbsky and
Richards 2001; Fransz and De Jong 2002). C7 inoculation induced a
histone H2A, but other H2A and H3 proteins were repressed. H3
phosphorylation was described in plants for cell cycle regulation
(Houben et al. 2007). Thus, C7 inoculation could alter chromatin
organization and gene expression by modulation of histone levels.
In contrast, C7 inoculation repressed some proteins in nr plants.
TPI was undetected in C7-inoculated nr plants affecting significantly to
dihydroxiacetone and Calvin cycles. As abovementioned, TPI
inactivation would slow down glycolysis and tricarboxylic acid cycle
under oxidative stress (Cabiscol et al. 2000). A LRR receptor-like
serine/threonine-protein kinase FEI 1 was also undetected in C7-
inoculated nr plants. FEI proteins are receptors that regulate cellulose
biosynthesis and thereby cell wall function (Harpaz-saad et al. 2012).
Its mutation disrupts anisotropic expansion suppressed by inhibition of
ACC synthase, but not by blocking ethylene response (Xu et al. 2008).
In consequence, although an ethylene-perception independent
mechanism has been proposed for C7, the ethylene precursor ACC
could be involved in C7 PGPB mechanism or C7 is able to stimulate
plant growth in wt and nr plants by different action mechanisms.
Moreover, COPI vesicles are critical in plant growth and survival
taking part in retrograde protein transport in secretory pathway (Ahn et

243
Chapter 3
al. 2015), and reduction of its subunits disrupted the Golgi structure and
produced autolysosome-like structures accumulation. Finally, 60S
acidic ribosomal protein P3 (RPP3) is an acidic phosphoprotein
involved in translation. Stress is able to cause dynamic changes in the
P-protein complex by protein phosphorylation (Bailey-Serres et al.
1997).
In consequence, it could be proposed that C7 inoculation in nr
plants affected chromatin organization and gene expression regulation
as well as translation. Furthermore, C7 inoculation modified
mitochondrial metabolism and protein trafficking and increased
oxidative stress with higher levels of GST and P450 proteins. However,
noticed induction of cytochrome b5, V-ATPase subunit E proteins and
processes (N-glycosilation, and amino acid biosynthesis) could
counteract stress effects resulting in cell survival and growth
promotion.
Interaction with nr plants is modulated by C7 through
recognition-related proteins while Bm triggered an immune
response
Furthermore, comparison between both PGPB could help to
clarify action mechanisms. Our results showed mainly strain-specific
bacteria in both plant genotypes and common proteins were similarly
modified by both bacteria (Tables 3.1, 3.2, 3.3 and 3.4). However,
quantitative changes were noticed in some proteins dependently of
bacterial inoculation in nr plants (Tables 3.2 and 3.4) and could be
related with different outputs observed. GST higher induction in C7-
inoculated plants suggests higher oxidative stress than in Bm-

244
Chapter 3
inoculated ones (Edwards et al. 2000). In accordance, reductase
modification caused the ascorbate-glutathione cycle variation in C7-
inoculated nr plants unnoticed in Bm-inoculated ones. Reductase was
highly reduced by both bacterial inoculation, but in a higher degree by
C7 suggesting a greater effect of C7 inoculation in respiration and/or
inorganic carbon transport (Badger 1994; Henry 1996; Li et al. 2000b).
Although, reductase is positively correlated with photosynthesis and
dry matter accumulation (Khan 2002; Khan et al. 2004), it was
observed in shoot tissue pointing to respiration and inorganic carbon
transport as affected processes in roots. Additionally, C7 could affect
mitochondrial respiratory chain more than Bm inoculation due to
higher increase in band 7 stomatin family protein (Gehl and Sweetlove
2014).
Direct comparison between both PGPB also pointed to greater
differences in nr than in wt plants (Tables 3.5 and 3.6; Fig. 3.5 C),
although pathways were unaffected in both plant genotypes suggesting
that bacterial effects regarding non-inoculated plants could be greater
than between both bacteria despite of all noticed protein changes.
Moreover, the unique common protein that showed opposed
modification was the major allergen Mal d 1 induced in wt and nr
plants by C7 and Bm, respectively. It belongs to the pathogenesis
related group 10 (PR-10) which plays a role in plant defence against
pathogens (Fernandes et al. 2013). Thus, Bm inoculation could trigger a
higher response against bacterial colonization than C7 inoculation in nr
plants in accordance with fail in Bm-plant interaction.
In wt plants, Bm compared to C7 inoculation could promote
appropriate targeting of ribosome-nascent polypeptide complexes due

245
Chapter 3
to observed changes in nascent polypeptide-associated complex alpha
subunit-like protein (Beatrix et al. 2000). Furthermore, higher values of
6 7-dimethyl-8-ribityllumazine synthase or riboflavin synthase (Jordan
et al. 1999) was noticed pointing to higher riboflavin levels in wt plants
under Bm inoculation which could induce disease resistance due to its
role as elicitor (Wang and Tzeng 1998; Dong and Beer 2000).
In nr plants, an aspartyl aminopeptidase (AAP) was highly
induced in Bm- compared to C7-inoculated plants. AAP is a protease
(Wilk et al. 1998), and function as plant susceptibility factor against
bacterial pathogens (Bae et al. 2013). However, higher F-box family
protein levels were observed in C7- compared to Bm-inoculated plants.
As abovementioned, F-box proteins are involved in protein degradation
regulating several significant processes including pathogen resistance
(Hellmann et al. 2002; Lechner et al. 2006). Increased levels of LETM1
and EF-hand domain-containing protein 1 was also noticed due to C7
inoculation suggesting a higher accumulation of ATP synthase proteins
(Zhang et al. 2012). Furthermore, higher cytochrome P450 levels
observed in C7-inoculated suggested higher response against stress by
chemical defense (Mizutani 2012). Cc-nbs-lrr is a resistance protein
involved in detection of several pathogens monitoring effects of
pathogen effectors in their targeted plant proteins (McHale et al. 2006;
Marone et al. 2013). Higher Cc-nbs-lrr levels were observed under C7
inoculation suggesting that nr plants could monitor better C7 effects
and thus maybe finely control their deleterious effects. In accordance,
RLK levels were also higher in C7 than in Bm-inoculated nr plants.
This receptor contribute to bacterial recognition in order to distinguish
between pathogen or beneficial bacteria (Afzal et al. 2008), although
the proper response critically depends on RLKs localization and

246
Chapter 3
abundance at cell surface (Antolín-Llovera et al. 2014). Summarizing,
Bm inoculation could be perceived as a pathogenic-like bacteria by nr
plants, meanwhile C7 inoculation could modulate its interaction with nr
plants affecting to recognition-related proteins as Cc-nbs-lrr and RLK.
Bm inoculation miss-regulates low phosphorus response,
while C7 is able to avoid it in wt and nr plants.
Our results showed that phosphorus nutrition was affected by
bacterial inoculation (Tables 3.1, 3.2, 3.3 and 3.4; Fig 3.7). Phosphorus
is a key element in plant growth and development (Cheng et al. 2011).
Additionally, their bioavailability in soils is very limited (due to poorly
phosphate solubility), but fundamental for plant productivity (López-
Bucio et al. 2002). Indeed, low P availability is noticed in
approximately half of the agricultural lands, compromising crop yields
(Lynch 2011). Several PGPB can solubilize soil phosphates increasing
P availability for plant acquisition (Canbolat et al. 2006; Lai et al.
2008). PSI was evaluated resulting in poor ability to solubilize
phosphates and showing no differences between Bm and C7 strains
(Fig. 3.6). Thus, these results suggested similar P availability for plants,
although bacterial traits could be altered under effects of plant and root
exudates (Doornbos et al. 2012).
Furthermore, plants show several physiological adaptations to
cope with low P conditions (Ticconi and Abel 2004; Wasaki et al.
2009). Phosphorus acquisition is performed by high-affinity phosphate
transporters strongly induced under limited-P conditions in root tissue
and regulated at transcriptional level mediating P acquisition across
cellular membranes. In fact, P cellular concentration was proposed as

247
Chapter 3
triggering signal for low P response resulting in a fine coordination
between gene expression and P acquisition (Liu et al. 1998; Guo et al.
2008). Ethylene production is induced by P deficiency mediating plant
response to low P availability (Borch et al. 1999; Li et al. 2009), and
the ethylene signaling role in response to P starvation has been studied
in several plant species (Drew et al. 1989; He et al. 1992; Kim et al.
2008a; Lei et al. 2011).
Soil microorganisms are determinant for plant nutrition and
several symbiotic relationships have been developed to cope with
persistent phosphorus deficiency (Raghothama and Karthikeyan 2005),
such in case of mycorrhizal fungi (Harrison et al. 2002; Paszkowski et
al. 2002). However, little is known about PGPB involvement in P
acquisition. Only one study formerly pointed to direct modulation of P
uptake by PGPB under low P conditions. Bacillus amyloliquefaciens
promoted root growth in wheat, but reduced P uptake down-regulating
phosphate transporter genes and up-regulating phosphate remobilizing
ones (Talboys et al. 2014).
Thus, our results (Fig. 3.7) suggest a miss-regulation of low P
response in nr plants due to Bm inoculation, since although higher P
levels were noticed in roots, a phosphate transporter (SlPT1) induction
was observed as in P starvation (Borch et al. 1999; Li et al. 2009). In
contrast, C7 inoculation improved P concentration in wt plants and
could be able to modulate P acquisition in nr plants via SlPT2
suggesting an improvement of P nutrition as part of C7 PGPB
mechanism.
In order to shed light on phosphorus nutrition implication in
PGPB mechanisms, bacterial strains were tested under control and low

248
Chapter 3
P conditions (Fig. 3.8). Low P conditions produced a DW reduction in
all cases regarding corresponding control conditions pointing to an
effective P shortage (Hermans et al. 2006). In addition, biomass
production was generally noticed higher in wt than in nr plants under
both P nutrition regimes. Nevertheless, higher root P concentration was
generally observed in nr regarding wt plants. These results are in
accordance with previous studies which proposed that ethylene-
insensitive genotypes under low P stress would show reduced growth
and would fail to produce some adaptive responses (Feng and Barker
1992; Zhang et al. 2003).
Surprisingly, no growth promotion effects due to Bm and C7
were noticed in wt plants (Fig. 3.8 A, B, C). These results could be
explained because performed nutrition schedule could diminish PGPB
effects since optimal nutrients concentrations were added every two
days and wt plants are ethylene sensitive and thereby able to respond to
low P. Furthermore, Bm inoculation did not caused effects in nr plants
but diminished biomass production exclusively in wt plants under
control P conditions suggesting that high P availability could be
deleterious for Bm-interaction. In fact, Bm inoculation reduced and
increased root P concentration under control and low P conditions,
respectively, but no differences were noticed in root P levels between
both P nutrition regimes in wt plants under Bm inoculation (Fig. 3.8 D,
E). Moreover, SlPT1 and SlPT2 expression was induced by low P
conditions under Bm inoculation suggesting a miss-regulation in P
acquisition also in Bm-inoculated wt plants (Fig. 3.8 F, G).
Nevertheless, C7 inoculation stimulated plant growth in nr plants
independently of P nutrition regime, but more efficiently under low P

249
Chapter 3
conditions (Fig. 3.8 A, B, C). In fact, root DW was unaffected under
control P conditions, but highly enhanced in low P conditions reaching
root DW of non-inoculated nr plants under control P conditions. Thus,
C7 inoculation could avoid low P effects on growth in nr plants
suggesting the improvement of P nutrition as part of its action
mechanism. In addition, C7 inoculation in nr plants under low P
conditions could restore plant phenotype since plant genotype
differences were noticed in all cases excepting under these conditions.
However, no bacterial inoculation effects were noticed in DWs in wt
plants under both P nutrition regimes, suggesting that C7 PGPB
mechanism could imply P nutrition improvement even at lower levels
than 0.2 mM when plants are ethylene-sensitive. Additionally, although
C7 action mechanism was proposed independent on ethylene
perception by SlETR3, two different C7 PGPB mechanisms in wt and
nr plants could also explain different observed growth promotion
effects.
In fact, C7 inoculation produced higher root P concentration
values than wt ones under control P conditions reaching C7-inoculated
nr plants values (Fig. 3.8 D). C7 inoculation reduced SlPT1 expression
in wt plants only under control P conditions corresponding with
increased root P concentration by C7 inoculation. Moreover, SlPT2
expression was induced by low P conditions in wt in all cases and in nr
plants under non- and Bm-inoculation, but not under C7 inoculation
suggesting that C7 inoculation could avoid low P response in wt and nr
plants mediated by SlPT1 and SlPT2, respectively (Fig. 3.8 F, G).
In tomato, SlPT2 expression was restricted to roots, meanwhile
SlPT1 was mainly expressed in roots but faintly expressed in aerial
250
Chapter 3
tissues (Liu et al. 1998). Our results showed that SlPT1 was generally
slightly induced by low P conditions in wt plants, but not in nr plants.
In contrast SlPT2 showed a strong induction due to low P conditions
independently of plant genotypes according to previous reports that
show a stronger response of SlPT2 due to P starvation than SlPT1
(Muneer and Jeong 2015). These results suggest that SlPT1 response
could be dependent of ethylene perception by SlETR3, while SlPT2
regulation may be independent of this ethylene receptor.
Thus, low P response of tomato plants is dependent of ethylene
and mediated by phosphate transporters. SlPT1 expression regulation
could be dependent of ethylene perception by SlETR3, but not SlPT2.
Root P concentrations and expression of phosphate transporters
observed in both experiments pointed to plants of main experiment
were growing in conditions similar to control P, but nr plant response
was similar to wt plants under low P conditions due to its inability to
perceive ethylene (Fig 3.7 and 3.8). Additionally, Bm PGPB activity
was proposed as dependent on ethylene perception by SlETR3 and Bm
inoculation could miss-regulate low P response altering SlPT1
expression. However C7 activity was suggested as independent of
ethylene perception and could avoid low P response (keeping plant
growth) mainly affecting SlPT1 and SlPT2 expression in wt and nr
plants, respectively.
Bm PGPB activity could be mediated by increased GSH
levels, while C7 increased oxidative stress in wt and nr plants
Antioxidant enzymatic activities were mainly unaffected by
bacterial inoculation, excepting APX activity. However, no difference

251
Chapter 3
between both PGPB strains was noticed suggesting that antioxidant
metabolites could be responsible of antioxidant status alteration.
Glutathione is a key metabolite essential in plant cells (Cairns et
al. 2006; Pasternak et al. 2008), and involved in several functions such
as primary metabolism, redox signaling and defense/detoxification
(Noctor et al. 2012). Moreover, reductive H202 metabolism is linked to
ascorbate in plants by the glutathione-ascorbate cycle (Noctor and
Foyer 1998). GSH can undergo several redox reactions including
conjugation with proteins and other electrophilic molecules (Edwards
and Dixon 2010). Furthermore, GSH can be oxidized by reactive
oxygen species preventing excessive oxidation of sensitive cellular
components (Kataya and Reumann 2010).
Ascorbic acid was exclusively reduced by C7 inoculation in wt
plants, but several changes were noticed in glutathione (Fig. 3.9). Our
results showed that Bm inoculation increased GSH, total glutathione
pool and GSH:GSSG ratio, but did not affect GSSG levels in wt roots.
However, Bm inoculation decreased GSH and GSH:GSSG ratio, and
increased GSSG concentration without altering total glutathione pool in
nr plants. These data suggest that oxidative stress was reduced in wt
plants, but it was increased in nr plants due to Bm inoculation agreeing
with proteomic results and suggesting a PGPB mechanism dependent
on ethylene sensitivity by ETR3 that affects cellular redox status. In
contrast, C7 inoculation affected glutathione levels independently of
ethylene sensitivity, reducing GSH, total glutathione pool and
GSH:GSSG ratio, but increasing GSSG concentration. These results
suggest that oxidative stress was induced by C7 inoculation, but growth

252
Chapter 3
promotion was noticed in both plant genotypes pointing to an action
mechanism independent of ethylene perception and oxidative stress.
Moreover, differences between wt and nr plants also are in
accordance with these hypotheses and other studies have previously
related ethylene signaling with glutathione metabolism. After ozone-
induced stress in arabidopsis, ethylene insensitivity produced a
decrease in GSH levels, but its external addition mitigated damage,
suggesting that ethylene could induce de novo GSH biosynthesis
protecting from injury (Yoshida et al. 2009). However, induction of an
ethylene-precursor biosynthesis enzyme was induced in transgenic
tobacco plants over-expressing a GSH biosynthesis enzyme, suggesting
the involvement of GSH in ethylene biosynthesis (Ghanta et al. 2014).
Recently, GSH-ethylene interaction was studied demonstrating that
GSH stimulate ethylene production through transcriptional and post-
transcriptional regulation of ACC biosynthesis enzymes. Additionally,
ACC oxidase was identified as a target for S-glutathionylation.
Moreover, exogenous GSH application enhanced stress tolerance in wt
arabidopsis plants, but not in ethylene-insensitive ones pointing to
ethylene-dependent pathway to improve stress tolerance mediated by
GSH (Datta et al. 2015). GSH is involved in the synergistic multiple
steps crosstalk between ethylene and salicylic acid to respond to
environmental stresses (Ghanta et al. 2014). In consequence, Bm PGPB
activity proposed as dependent on ethylene-perception could imply
enhancement of GSH levels necessary to improve stress tolerance.
Similarly, Sphingomonas sp. LK11 increased tomato plant growth at
the same time that modulated the oxidative stress increasing GSH
levels and it was suggested that could counteract toxicity mediated by

253
Chapter 3
ROS via antioxidants level regulation but not by antioxidant enzymes
(Halo et al. 2015).
Conclusions
In conclusion, our results showed that PGPB inoculation
modified the root proteomic profiles in a mode dependent on strain and
genotype. Several PGPB effects were noticed in secretory pathway
proteins, but they could be spill over impacts in plant metabolism due
to bacterial presence instead of direct bacterial effects. Thus, further
research is needed to clarify if PGPB are able to modulate the secretory
pathway.
Furthermore, SlETR3 mutation in nr plants impairs interaction
between tomato plants and Bm, resulting in recognition as a pathogen-
like microorganism and leading to increased oxidative stress and to loss
of PGPB activity. Bm inoculation promoted plant growth in wt plants
on a par with improvement in the redox status. Thus, the PGPB activity
of Bacillus megaterium in tomato plants could be proposed as mediated
by increased GSH and dependent on ethylene perception by SlETR3.
Furthermore, low P response by SlPT1 may be dependent on ethylene
sensitivity by SlETR3, and thereby Bm inoculation in nr plants resulted
in low P response miss-regulation.
In contrast, C7 inoculation induced plant growth and oxidative
stress independently of ethylene sensitivity, but affecting different
proteins depending on plant genotype. Indeed, C7 inoculation improved
P nutrition mediated by SlPT1 and SlPT2 in wt and nr plants,

254
Chapter 3
respectively. In consequence, although SlETR3 mutation determines
plant interaction with C7 strain, Enterobacter C7 PGPB mechanism
implies phosphorus nutrition enhancement and could be proposed as
independent of ethylene perception.

255
General Discussion

256
General Discussion
General Discussion
The sustainable intensification of agriculture aims to provide food
security to an expanding global population and simultaneously
diminish harmful environmental effects of crops (Tilman et al. 2011).
Thus, new strategies should be developed in order to increase
efficiency in crop resource utilization maintaining present yields (Dodd
and Ruiz-Lozano 2012). Management of rhizospheric microorganisms
is a valuable strategy to induce plant growth (Berg 2009; Singh et al.
2011), and could diminish and even replace chemicals inputs in
agriculture (Bhattacharyya and Jha 2012). Nevertheless, in-depth
research is needed to completely understand interaction between plant
and microorganisms as well as bacterial action mechanisms for the
proper and effective large-scale use of these bacteria in integrated
agricultural systems (Berg 2009). In consequence, the present study
evaluate the effects of two different PGPB strains on plant growth and
physiology regarding to ethylene perception in tomato in order to
elucidate PGPB mechanisms and achieve determinant information for
further implementation in crop systems.
Association between plants and beneficial microbes are thought
to be ancient and moulded during co-evolution causing bacterial
inoculation significant effects in plant physiology (Lambers et al.
2009). The present study showed that PGPB inoculation modified
transcriptomic profiles in a strain-specific manner and dependently on
ethylene sensitivity and watering conditions. Root metabolites,
phytohormones and nutrients were also affected in function of
inoculated bacteria and ethylene sensitivity. Proteomic profiles also
showed strain-specific effects dependent on ethylene sensitivity. All

257
General Discussion
these results are in accordance with strain-specific interactions between
host-plants and bacterial strains (Walker et al. 2011; Weston et al.
2012) as well as strain-specific PGPB mechanisms and bacterial effects
depending on plant growth conditions (Ryu et al. 2005; Long et al.
2008).
Furthemore, ethylene insensitivity caused higher differences than
PGPB inoculation, which additionally increased differences between
plant genotypes in root transcriptomic, proteomic and nutritional
profiles of mature plants. This can be explained since ethylene is
involved in several key processes in plant growth and development as
well as regulation of the phenotypic plasticity (Dugardeyn and Van Der
Straeten 2008) to overcome environmental changes including
nutritional stresses (Iqbal et al. 2013), and water stress (Hattori et al.
2009; Pan et al. 2012). Thus, ethylene-response leads to differentially
expression of hundreds of genes (An et al. 2010), and ethylene-
insensitive genotypes under stress would fail to adapt to stress
conditions as observed in differential phosphorus bioassay (Feng and
Barker 1992; Zhang et al. 2003). Moreover, plant genotype differences
were significant in non-inoculated plants with higher growth in nr
plants under well watered conditions pointing to less pronounced
ethylene growth inhibitory effects (Pierik et al. 2006) due to their
ethylene insensitivity (Wilkinson et al. 1995). However, this effect was
unnoticed under drought conditions probably due to less adaptability to
drought and higher ethylene induction by stress (Pierik et al. 2007).
Moreover, PGPB inoculation modifies plant nutrition notably in
mature plants. Rhizospheric microbial communities are associated with
nutrient biogeochemical cycles (Barea et al. 2005), and interaction

258
General Discussion
between plants and bacteria is fundamental for better acquisition of
nutrients by plants (Ryan et al. 2009). Indeed, several PGPB action
mechanisms are related with plant nutrition enhancement. PGPB
inoculation directly modifies root metabolites in juvenile plants
including amino acids, sugars and organic acids as observed in other
studies (Weston et al. 2012; Fernandez et al. 2012; Su et al. 2016), that
could explain plant growth promotion as well as interaction processes
between plants and bacterial strains.
Although an ethylene-dependent mechanism was previously
reported in arabidopsis (Chen et al. 2013), the present study report for
first time an ethylene-dependent mechanism in bacteria without ACC
deaminase activity. PGPB action mechanism related to ethylene were
mainly reported for bacterial strains able to reduce ACC levels and
thereby ethylene levels since they contain ACC deaminase activity
(Glick et al. 2007a; Glick 2014). Nevertheless, PGPB selected in the
present study did not show ACCd activity, neither ethylene production
which can disturb plant ethylene metabolism. In fact, ethylene emission
by plant root and shoots was unaffected directly by PGPB inoculation.
Furthermore, both Bm as well as C7 were able to colonize the roots
independently of plant ethylene-sensitivity, which is a determinant
feature of PGPB for interaction with plants (Benizri et al. 2001).
However, ethylene emission by seedlings 26 h post-inoculation was
exclusively increased under Bm inoculation in nr plants compared to
wt plants suggesting that SlETR3 plays a role in tomato plant
interaction with Bm. In fact, other PGPB strains modulate ethylene
receptor expression for the properly establishment of beneficial plant-
bacteria association (Vargas et al. 2012; Vacheron et al. 2013).
Moreover, basal ethylene levels are negatively feedback regulated

259
General Discussion
during vegetative growth (Barry et al. 2000; Alexander and Grierson
2002; Alba et al. 2005), and a similar process could be happened in Bm
interaction with wt plants avoiding the induction of ethylene.
Indeed, ethylene perception by SlETR3 is proposed as essential
for growth promotion mediated by Bm but no for C7, and congruent
results were noticed in total growth in all chapters. However, some
differences in ethylene insensitivity and PGPB effects on shoot and
root growth in chapter 3 showed discordant results with chapters 1 and
2. This could be explained since fresh weights were used in chapter 3
for biomass production evaluation while dry weight were used in
previous chapters suggesting that relative water content was affected by
bacterial inoculation as previously reported with other PGPB (Mayak et
al. 2004a; Li and Jiang 2017). However, relative water content was
undetermined in these experiments, which in addition were performed
in greenhouse where growth conditions can be variable depending on
outside weather, affecting obtained outputs.
Moreover, the same growth promotion effects were observed
under drought stress conditions and even PGPB improved their
efficiency in wt plants suggesting stress alleviation due to bacterial
inoculation as previously reported (Glick 2004; Aroca and Ruiz-
Lozano 2009; Dimkpa et al. 2009), and enhancement of water and
nutrient use efficiency (Dodd and Ruiz-Lozano 2012). Drought causes
important yield losses enhanced by climate change and intensive
agriculture with deep impact in tomato production (Pervez et al. 2009;
Misra 2014). Thus, PGPB management can represent a suitable
methodology for reduce water inputs and/or utilization of semiarid
lands maintaining present yields or reducing potential yield losses.

260
General Discussion
However, drought stress has a great impact in plant physiology
(Hasanuzzaman et al. 2014) as well as in transcriptomic profiles (Gong
et al. 2010; Iovieno et al. 2016), which can mask PGPB inoculation
effects. Actually, no significant altered pathways were reported when
PGPB-inoculated plants were compared with non-inoculated ones
under drought stress. Furthermore, either Bm or C7 plant growth
promotion were independent of watering regime and thereby
experiments in chapter 2 and 3 were carried out exclusively under well
watered conditions in order to avoid that drought effects distort PGPB
effects and to easily clarify plant interaction with bacterial strains as
well as their action mechanisms.
In addition, PGPB inoculation affected relative growth rate
exclusively in nr plants. RGR was decreased under Bm inoculation and
increased under C7 inoculation in accordance with ethylene perception
by SlETR3 essential for Bm and circumvented by C7, but suggesting
that ethylene insensitivity affects plant interaction with both PGPB
strains. Nevertheless, plant growth promotion effects were unnoticed in
juvenile plants indicating that further research addressing bacterial
effects on mature plants is necessary to completely understand bacterial
effects on plant growth and achieve proper yield increases in crops,
especially in tomato plants where only fruits are the profitable yield.
However, PGPB inoculation at juvenile stage produced physiological
effects as modification of stomatal conductance, photosynthetic
efficiency and root metabolites as previously reported after PGPB
colonization of plant root system (Su et al. 2016). Stomatal
conductance and photosynthetic efficiency modifications were in
agreement with PGPB activity dependent on ethylene perception by
SlETR3 for Bm and ethylene-independent for C7.

261
General Discussion
Additionally, phytohormone levels were generally affected due to
ethylene insensitivity and PGPB inoculation was able to indirectly
modify plant phytohormonal status. During development and response
to internal and external stimuli, several phytohormonal cross-talk
processes have been reported (Munné-Bosch and Müller 2013).
Transcriptomic analysis pointed to involvement of ethylene, JA and
ABA in plant interaction with PGPB. ABA modulate plant growth
response to ethylene and viceversa (Wilkinson and Davies 2010;
Wilkinson et al. 2012), while JA acts regulating plant immune response
against pathogens (Browse 2009), and SA is a key factor for basal
defenses establishment (Vlot et al. 2009). Phytohormone analysis
showed that C7 inoculation modulates root ABA in juvenile nr plants
predisposing them for further growth or suppressing plant response
mediated by SA and/or JA/ethylene (Anderson et al. 2004; Sánchez-
Vallet et al. 2012). In contrast, endogenous ABA levels could be
essential for growth promotion mediated by Bm maintaining
production of ethylene at low levels (Porcel et al. 2014). Moreover,
increased levels of SA, JA and JA-Ile under Bm inoculation in nr plants
regarding wt ones suggested that Bm activate defenses in nr plants
(Browse 2009; Vlot et al. 2009). All these bacterial effects in juvenile
plants predispose plants for further growth since there is balance
between plant growth and defense which implies antagonistic crosstalk
among phytohormones (Karasov et al. 2017).
Furthermore, PGPB inoculation did not cause changes in ethylene
evolution in root and shoot tissues, but locally affects ethylene
biosynthesis, signaling and response gene expression pointing to a local
production. In wt plants, Bm and C7 reduce expression of ethylene
biosynthesis genes in accordance with stress alleviation (Glick 2004;

262
General Discussion
Aroca and Ruiz-Lozano 2009; Dimkpa et al. 2009). However, nr
plantlets showed higher ethylene production rate than wt ones under
Bm inoculation at 26 h post-inoculation and Bm inoculation in nr
plants increased expression of ethylene biosynthesis, signaling and
response genes pointing to a local ethylene production as reported in
plant interaction with bacterial pathogens (van Loon et al. 2006), and
suggesting that nr plants could recognize Bm as a pathogen-like
microorganism and thereby non-completely functional beneficial
association was established. However, ethylene negatively feedback
regulation was observed in Bm-inoculated nr plants as previously
reported by simultaneously expression of SlETR3 and TCTR1 genes
(Tieman et al. 2000). Thus, Bm inoculation induced a stress response in
nr plants probably due to a miss-recognition (Zamioudis and Pieterse
2012), but not completely trigger defense mechanisms causing plant
growth reduction as noticed in biomass production (Karasov et al.
2017).
Bacillus megaterium PGPB activity
Ethylene perception by SlETR3 is proposed as essential for Bm
PGPB activity. In addition, the different approaches utilized to address
Bm interaction with tomato plants and clarify its action mechanism also
support this hypothesis.
Transcriptomic analysis showed that Bm was able to reshape
biosynthesis and degradation pathways of flavonoids that could result
in improved antioxidant capacity and favored interaction in wt plants,
while ethylene insensitivity impairs interaction with Bm resulting in

263
General Discussion
non-completely functional establishment of association, but without
fully triggering immune response. Additionally, direct transcriptomic
comparison between Bm and C7 also points to lower oxidative stress in
Bm- than in C7-inoculated wt plants. Root metabolites analysis
suggests that Bm inoculation mainly modify sugar metabolism and
could enhance photosynthesis suppression by endogenous glucose
levels in nr plants since ethylene perception is related to plant
sensitivity to sugars (Paul and Pellny 2003). Furthermore, reduced
levels in nr roots under Bm inoculation of fumaric acid, which is
necessary for biofilm formation needed for complete colonization by
Bacillus strains (Zhang et al. 2014; Yuan et al. 2015), suggested a
failure in completely functional interaction between Bm and nr roots.
Additionally, nutrient results also suggest an interaction failure between
Bm and nr plants that leads to competition for iron at the rhizosphere
(Pii et al. 2015).
Proteomic analysis also support that wt plants favor interaction
with Bm decreasing arginine biosynthesis, and plants growth better due
to Bm-mediated increase in protein synthesis and trafficking in plastids
and vacuole. However, Bm could be perceived as pathogenic-like
bacteria by nr plants increasing the oxidative stress, and affecting
mitochondrial metabolism and thus to several growth and
developmental processes and responses to environmental stimuli.
Although nr plants miss-recognize Bm as a beneficial microorganism
and caused stress, nr plants can modulate immune response in order to
avoid plant cell death and further damage growing just as non-
inoculated nr plants. Moreover, direct proteomic comparison between
Bm and C7 also support that Bm could induce disease resistance in wt
plants, but Bm is recognized as a pathogenic-like microorganism
264
General Discussion
inducing pathogenesis-related proteins and increasing plant
susceptibility against bacterial pathogens. PGPB perception as mild
biotic stress was previously reported in arabidopsis (Timmusk and
Wagner 1999) and ethylene was involved in this process since PGPB
with ACCd activity was not longer recognized as a stressor agent by
plants (Hontzeas et al. 2004). In accordance, the present study points to
ethylene sensitivity as regulator of plant interaction with PGPB.
Although phosphorus nutrition has been proposed as new player
in tomato-Bm interaction with involvement of ethylene sensitivity, Bm
inoculation caused miss-regulation of low phosphorus response in nr
plants. Ethylene sensitivity by SlETR3 was proposed as essential for
low phosphorus response mediated by SlPT1, and thus Bm PGPB
activity does not imply phosphorus nutrition improvement. On the
other hand, antioxidant metabolite results confirm transcriptomic and
proteomic results showing that Bm increased GSH levels enhancing
antioxidant capacity in wt plants. This action mechanism was
previously reported by Sphingomonas sp. LK11 inoculation in tomato
(Halo et al. 2015). In addition, exogenous application of GSH improves
stress tolerance dependently of ethylene sensitivity (Datta et al. 2015).
In consequence, Bm PGPB activity proposed as dependent on ethylene
perception by SlETR3 is mediated by increased GSH levels affecting
cellular redox status, and thereby antioxidant capacity necessary to
improve stress tolerance. However, Bm interaction with nr plants was
not completely successful and causes oxidative stress since ethylene
sensitivity is essential in GSH biosynthesis (Fig. D1).

265
General Discussion
Ethylene
Response
TCTR1
NR
A B
ETR3
TCTR1
No Response
wt No wt Bm nr No nr Bm
GSH
Biosynthesis
GSH
Biosynthesis
Improved Redox
Status
Oxidative
Stress
PGPB activity dependent on SlETR3
Plant
Growth
Promotion
Comparable
Growth
Promotion
Figure D1 Summary of Bacillus megaterium (Bm) plant growth promotion
mechanism in wild type (wt) and never ripe (nr) tomato (Solanum lycopersicum)
plants. Molecular events triggered by Bm inoculation in (A) wt and (B) nr plants.
Increases or decreases in reduced glutathione (GSH) and oxidative stress caused by
Bm inoculation are shown with ↑ and ↓ symbols, respectively. Activation of the
following step is represented by dotted arrows, while Inhibition is represented by ┴
symbol. ETR3: Ethylene receptor 3; NR: Never Ripe receptor; TCTR1: Tomato
Constitutive Triple Response 1.
266
General Discussion
Enterobacter C7 PGPB activity
Although C7 promoted plant growth independently on ethylene
sensitivity, the different approaches indicate that SlETR3 mutation
partially determines plant interaction with C7. Thus, PGPB mechanism
is able to circumvent ethylene insensitivity in case of C7 strain.
Transcriptomic analysis showed that ethylene sensitivity
determines plant interaction with C7 affecting different processes. C7
inoculation up-regulated transcripts of respiration in wt roots, but wt
plants are able to recognize C7 minimizing defense response. However,
C7 inoculation in nr plants could improve plant fitness enhancing plant
nutrition. Additionally, C7 could modulate amino acidic metabolism
and/or enhance the nitrogen use efficiency independently of ethylene
sensitivity. Root metabolites results were in agreement with the above
statement, since C7 inoculation could improve nitrogen assimilation in
nr juvenile plants and points to remodeling of amino acidic metabolism
by C7 independently of ethylene sensitivity affecting plant growth and
development as previously reported by several PGPB (Mantelin and
Touraine 2004; Tikhonovich and Provorov 2011; Carvalho et al. 2014).
Furthermore, proteomic analysis pointed to increased oxidative
stress under C7 inoculation and plant growth stimulation determined by
ethylene insensitivity. C7 presence in wt root caused slight stress, but
plant facilitate interaction with C7 by reduction of proteins involved in
cell wall resistance. In nr plants, C7 inoculation altered chromatin
organization and gene expression together with mitochondrial
metabolism and protein trafficking resulting also in oxidative stress.
However, nr plants can counteract stress effects induced by C7.

267
General Discussion
Furthermore, direct comparison between Bm and C7 also support that
C7 cause oxidative stress and affect respiratory chain, but nr plants
tempers C7 interaction modulating recognition-related proteins. In
accordance with proteomic results, antioxidant metabolite analyses
showed that C7 inoculation increases oxidative stress in both wt and nr
plant genotypes together with plant growth promotion pointing that C7
action mechanism is independent of ethylene perception and oxidative
stress.
Additionally, proteomic analysis suggested that phosphorus
nutrition is involved in C7 PGPB mechanism and also that ethylene
perception by SlETR3 determines C7 interaction with tomato plants.
Ethylene production is induced by phosphorus deficiency mediating
plant response to low phosphorus availability inducing phosphate
transporters expression (Borch et al. 1999; Li et al. 2009). C7
inoculation could improve phosphorus nutrition in wt and nr plants
mediated by SlPT1 and SlPT2, respectively, avoiding low phosphorus
stress response and keeping plants on growth (Hermans et al. 2006).
Several PGPB can solubilise phosphates (Canbolat et al. 2006; Lai et
al. 2008), but C7 did not show this trait and only one study formerly
pointed to direct modulation of phosphorus uptake by PGPB under low
phosphorus conditions also reducing expression of phosphate
transporter genes (Talboys et al. 2014). Thus, C7 is able to promote
plant growth independently on ethylene sensitivity improving
phosphorus nutrition and circumventing ethylene insensivity by
SlETR3 modulating two different phosphate transporters.

268
General Discussion
Ethylene
Response
TCTR1
NR
A B
ETR3
TCTR1
No Response
wt No wt C7 nr No nr C7
Sl PT1
expression
Phosphorus Nutrition
Low Phosphorus
Stress Response
Phosphorus Nutrition
Low Phosphorus
Stress Response
Sl PT2
expression
Sl PT1
expression
Unknown
Signaling
PGPB activity independent on SlETR3
Plant
Growth
Promotion
Plant
Growth
Promotion
Figure D2 Summary of Enterobacter C7 (C7) plant growth promotion mechanism in
wild type (wt) and never ripe (nr) tomato (Solanum lycopersicum) plants. Molecular
events triggered by C7 inoculation in (A) wt and (B) nr plants. Increases in phosphate
transporters expression caused by C7 inoculation are shown with ↑ symbol.
Activation of the following step is represented by dotted arrows, while Inhibition is
represented by ┴ symbol. ETR3: Ethylene receptor 3; NR: Never Ripe receptor;
TCTR1: Tomato Constitutive Triple Response 1; Sl PT1: Solanum lycopersicum
Phosphate transporter 1; Sl PT2: Solanum lycopersicum Phosphate transporter 2

269
General Discussion
Future work
Although PGPB inoculation effects on plant physiology represent
valuable information for application in crop systems, further research is
needed to completely elucidate Bm and C7 action mechanisms as well
as to know if several action mechanisms are simultaneously improving
plant growth (Martínez-Viveros et al. 2010).
Drought stress induced the production of ROS causing oxidative
stress that damage cellular components (Mittler 2002). Bm action
mechanism was proposed as mediated by enhanced levels of GSH,
which prevents excessive oxidation (Kataya and Reumann 2010).
However, redox status was not studied under drought stress conditions
neither in juvenile plants. Moreover, low phosphorus response was
mediated by ethylene (Borch et al. 1999; Li et al. 2009), and ethylene is
induced by drought stress (Pierik et al. 2007). C7 inoculation implies
enhancement of phosphorus nutrition avoiding low phosphorus
response and keeping plants on growth, but phosphorus nutrition and
phosphate transporter expression was not assayed under drought
conditions. In consequence, action mechanisms reported in the present
study should be corroborated under drought conditions.
In addition, beneficial association between plants and PGPB
requires mutual recognition (Zamioudis and Pieterse 2012), and thereby
direct research addressing bacterial features and physiology can help to
clarify plant-bacteria interaction as well as PGPB mechanisms. For
instance, it should be addressed the PGPB phenotypic variation or
phase variation to avoid plant immune system (Davidson and Surette
2008), bacterial effectors which could activate signaling components of

270
General Discussion
the Sym pathway (Sanchez et al. 2005) or determinate the host-
specificity suppressing defensive responses (Mavrodi et al. 2011) as
well as PGPB production of siderophores (Hider and Kong 2010). In
consequence, PGPB growth and bacterial proteomic analyses under
root exudates coming from wt and nr plants are being performed.
Establishment of beneficial plant-PGPB interaction as well as immune
responses against PGPB are dependent on combination between host
plants and bacterial strain (Van Wees et al. 1997; Van Loon et al. 1998;
Ton et al. 2002), pointing to a gene-for-gene plant-bacteria interaction.
In the present study, ethylene sensitivity by SlETR3 was proposed as
essential for proper Bm recognition and growth promotion suggesting
that SlETR3 could function as “R-like protein”. However, no clues
about which protein could act as “R protein” for C7 was obtained.
In case of Bm inoculation in nr plants, ethylene negatively
feedback regulation was observed due to induction of SlETR3 and
TCTR1 (Tieman et al. 2000), that could be responsible of non-
deleterious effects on plant growth. Moreover, TCRT1 is ethylene-
inducible protein which inhibits further ethylene signaling in tomato
(Zegzouti et al. 1999; Leclercq et al. 2002; Adams-Phillips et al. 2004),
and could participate in initial response after Bm inoculation in wt
plants. In consequence, transgenic lines silencing and overexpressing
TCTR1 gene are being obtained in order to assay plant growth and
interaction with Bacillus megaterium.
PGPB utilization is poorly represented in worldwide agriculture.
However, several bacterial strains, including Bacillus spp.,
Pseudomonas spp. and Rhizobium spp. among others, are currently
used in crop systems and commercialized despite of the limited

271
General Discussion
understanding of interaction between plants and PGPB (Lucy et al.
2004; Banerjee et al. 2006; Timmusk 2017). Total understanding of
PGPB interaction with plants as well as action mechanisms would play
fundamental roles in agriculture and horticulture improving
productivity of crops as well as in forestry and environmental
restoration. Furthermore, PGPB can be used in combination with other
soil beneficial microorganisms such as other PGPB strains or
mycorrhizal fungi displaying different action mechanisms showing
synergistic effects on plant fitness and growth. Thus, beneficial
microorganisms consortia in combination with the appropiate plant
under certain environmental conditions will be able to produce real and
positive effects resulting in a feasible option for sustainable
intensification of agriculture.

272

273
Conclusions

274

275
Conclusions
Conclusions
Ethylene perception by SlETR3 is essential for PGPB activity of
Bacillus megaterium in tomato plants, whereas Enterobacter C7
PGPB mechanism seems to be SlETR3-independent.
PGPB inoculation effects on plant physiology are strain-specific and
dependent on plant ethylene sensitivity as well as on plant growth
conditions.
PGPB inoculation affects photosynthesis, phythormones and root
metabolites in juvenile plants predisposing plants for further growth.
Both bacterial strains acts as PGPB under well watered and drought
conditions in ethylene-sensitive tomato plants resulting in improved
plant fitness and stress alleviation.
SlETR3 mutation impairs interaction between Bacillus megaterium
and tomato never ripe plants, resulting in a non-completely
functional recognition and leading to increased oxidative stress and
loss of PGPB activity.
PGPB activity of Bacillus megaterium in tomato plants could be
proposed as mediated by increased GSH and thereby improved plant
redox status.
SlETR3 mutation determines plant interaction with Enterobacter
C7, whose PGPB mechanism implies phosphorus nutrition
enhancement mediated by phosphate transporers SlPT1 and SlPT2
in wt and nr plants, respectively, and avoidance of low phosphorus
stress response.

276

277
References

278
References
References
Abas L, Luschnig C. 2010. Maximum yields of microsomal-type membranes from
small amounts of plant material without requiring ultracentrifugation. Analytical
Biochemistry 401: 217–227.
Abdel-Lateif K, Bogusz D, Hocher V. 2012. The role of flavonoids in the
establishment of plant roots endosymbioses with arbuscular mycorrhiza fungi,
rhizobia and Frankia bacteria. Plant Signaling & Behavior 7: 636–641.
Abeles FB, Morgan PW, Saltveit ME. 1992. Ethylene in Plant Biology. Academic
Press.
Abrahams S, Lee E, Walker AR, Tanner GJ, Larkin PJ, Ashton AR. 2003. The
Arabidopsis TDS4 gene encodes leucoanthocyanidin dioxygenase (LDOX) and is
essential for proanthocyanidin synthesis and vacuole development. Plant Journal 35:
624–636.
Achard P, Genschik P. 2009. Releasing the brakes of plant growth: How GAs
shutdown della proteins. Journal of Experimental Botany 60: 1085–1092.
Achouak W, Conrod S, Cohen V, Heulin T. 2004. Phenotypic variation of
Pseudomonas brassicacearum as a plant root-colonization strategy. Molecular Plant-
Microbe Interactions 17: 872–879.
Adams-Phillips L, Barry C, Kannan P, Leclercq J, Bouzayen M, Giovannoni J.
2004. Evidence that CTR1-mediated ethylene signal transduction in tomato is
encoded by a multigene family whose members display distinct regulatory features.
Plant Molecular Biology 54: 387–404.
Adesemoye AO, Kloepper JW. 2009. Plant-microbes interactions in enhanced
fertilizer-use efficiency. Applied Microbiology and Biotechnology 85: 1–12.
Aebi H. 1984. Catalase in vitro. Methods in Enzymology 105: 121–126.
Afroz A, Zahur M, Zeeshan N, Komatsu S. 2013. Plant-bacterium interactions
analyzed by proteomics. Frontiers in plant science 4: 1–18.
Afzal AJ, Wood AJ, Lightfoot DA. 2008. Plant receptor-like serine threonine
kinases: roles in signaling and plant defense. Molecular Plant-Microbe Interactions
21: 507–517.
Ahn H-K, Kang YW, Lim HM, Hwang I, Pai H-S. 2015. Physiological functions of
the COPI complex in higher plants. Molecules and Cells 38: 866–75.
Aibara I, Miwa K. 2014. Strategies for optimization of mineral nutrient transport in
plants: multilevel regulation of nutrient-dependent dynamics of root architecture and
transporter activity. Plant and Cell Physiology 55: 2027–2036.
Airaki M, Sánchez-Moreno L, Leterrier M, Barroso JB, Palma JM, Corpas FJ.
2011. Detection and quantification of S-nitrosoglutathione (GSNO) in pepper
(Capsicum annuum L.) plant organs by LC-ES/MS. Plant and Cell Physiology 52:
2006–2015.
Ait Barka E, Nowak J, Clément C. 2006. Enhancement of chilling resistance of
inoculated grapevine plantlets with a plant growth-promoting rhizobacterium,
Burkholderia phytofirmans strain PsJN. Applied and Environmental Microbiology 72:
7246–7252.
Aktar MW, Sengupta D, Chowdhury A. 2009. Impact of pesticides use in
agriculture: their benefits and hazards. Interdisciplinary toxicology 2: 1–12.
Al-Khalifah NS, Alderson PG. 1999. The effect of auxins and ethylene on leaf
abscission of Ficus benjamina. Biology and Biotechnology of the Plant Hormone
Ethylene II. Dordrecht: Springer Netherlands, 255–260.
279
References
Al-Whaibi MH. 2011. Plant heat-shock proteins: A mini review. Journal of King
Saud University - Science 23: 139–150.
Alba R, Payton P, Fei Z, McQuinn R, Debbie P, Martin GB, Tanksley SD,
Giovannoni JJ. 2005. Transcriptome and selected metabolite analyses reveal
multiple points of ethylene control during tomato fruit development. The Plant Cell
17: 2954–65.
Alberton D, Müller-Santos M, Brusamarello-Santos LCC, Valdameri G,
Cordeiro FA, Yates MG, De Oliveira Pedrosa F, De Souza EM. 2013.
Comparative proteomics analysis of the rice roots colonized by Herbaspirillum
seropedicae strain SmR1 reveals induction of the methionine recycling in the plant
host. Journal of Proteome Research 12: 4757–4768.
Alexander L, Grierson D. 2002. Ethylene biosynthesis and action in tomato: a model
for climacteric fruit ripening. Journal of Experimental Botany 53: 2039–2055.
Aliferis KA, Jabaji S. 2012. Deciphering plant – pathogen interactions applying
metabolomics : principles and applications. Canadian Journal of Plant Pathology
34: 29–33.
Alonso JM, Hirayama T, Roman G, Nourizadeh S, Ecker JR. 1999. EIN2, a
bifunctional transducer of ethylene and stress responses in Arabidopsis. Science 284:
2148–2152.
Amako K, Chen G-X, Asada K. 1994. Separate assays specific for ascorbate
peroxidase and guaiacol peroxidase and for the chloroplastic and cytosolic isozymes
of ascorbate peroxidase in plants. Plant and Cell Physiology 35: 497–504.
Ameline-Torregrosa C, Dumas B, Krajinski F, Esquerre-Tugaye MT, Jacquet C.
2006. Transcriptomic approaches to unravel plant-pathogen interactions in legumes.
Euphytica 147: 25–36.
An F, Zhao Q, Ji Y, Li W, Jiang Z, Yu X, Zhang C, Han Y, He W, Liu Y, et al. 2010. Ethylene-induced stabilization of ETHYLENE INSENSITIVE3 and EIN3-
LIKE1 is mediated by proteasomal degradation of EIN3 binding F-box 1 and 2 that
requires EIN2 in Arabidopsis. The Plant Cell 22: 2384–2401.
Andersen CL, Jensen JL, Ørntoft TF. 2004. Normalization of real-time quantitative
reverse transcription-PCR data: a model-based variance estimation approach to
identify genes suited for normalization, applied to bladder and colon cancer data sets.
Cancer Research 64: 5245–5250.
Anderson JP, Badruzsaufari E, Schenk PM, Manners JM, Desmond OJ, Ehlert
C, Maclean DJ, Ebert PR, Kazan K. 2004. Antagonistic interaction between
abscisic acid and jasmonate-ethylene signaling pathways modulates defense gene
expression and disease resistance in Arabidopsis. The Plant Cell 16: 3460–3479.
Anjum S, Xie X, Wang L. 2011. Morphological, physiological and biochemical
responses of plants to drought stress. African Journal of Agricultural Research 6:
2026–2032.
Antolín-Llovera M, Petutsching EK, Ried MK, Lipka V, Nürnberger T,
Robatzek S, Parniske M. 2014. Knowing your friends and foes - plant receptor-like
kinases as initiators of symbiosis or defence. New Phytologist 204: 791–802.
Ardales E, Moon S, Park SR, Shin D, Byun M, Noh TH. 2009. Inactivation of
argG, encoding argininosuccinate synthetase from Xanthomonas oryzae pv. oryzae, is
involved in bacterial growth and virulence in planta. Canadian Journal of Plant
Pathology 31: 368–374.
Argueso CT, Hansen M, Kieber JJ. 2007. Regulation of ethylene biosynthesis.
Journal of Plant Growth Regulation 26: 92–105.

280
References
Arkhipova TN, Prinsen E, Veselov SU, Martinenko E V., Melentiev AI,
Kudoyarova GR. 2007. Cytokinin producing bacteria enhance plant growth in drying
soil. Plant and Soil 292: 305–315.
Armada E, Portela G, Roldán A, Azcón R. 2014a. Combined use of beneficial soil
microorganism and agrowaste residue to cope with plant water limitation under
semiarid conditions. Geoderma 232–234: 640–648.
Armada E, Roldán A, Azcon R. 2014b. Differential activity of autochthonous
bacteria in controlling drought stress in native Lavandula and Salvia plants species
under drought conditions in natural arid soil. Microbial Ecology 67: 410–420.
Aroca R, Irigoyen JJ, Sánchez-Díaz M. 2003. Drought enhances maize chilling
tolerance. II. Photosynthetic traits and protective mechanisms against oxidative stress.
Physiologia plantarum 117: 540–549.
Aroca R, Ruiz-Lozano JM. 2009. Induction of plant tolerance to semi-arid
enviroments by beneficial soil microorganisms. A review. Climate Change,
Intercropping, Pest Control and Beneficial Microorganisms, Sustainable Agriculture
Reviews: 121–35.
Arteca RN, Arteca JM. 2007. Heavy-metal-induced ethylene production in
Arabidopsis thaliana. Journal of Plant Physiology 164: 1480–8.
Asgher M, Khan NA, Khan MIR, Fatma M, Masood A. 2014. Ethylene production
is associated with alleviation of cadmium-induced oxidative stress by sulfur in
mustard types differing in ethylene sensitivity. Ecotoxicology and Environmental
Safety 106: 54–61.
Assmann SM. 1999. The cellular basis of guard cell sensing of rising CO2. Plant,
Cell and Environment 22: 629–637.
Azcon-Aguilar C, Rodriguez-Navarro DN, Barea JM. 1981. Effects of ethrel on
the formation and responses to VA mycorrhiza in Medicago and Triticum. Plant and
Soil 60: 461–468.
Azevedo RA, Lancien M, Lea PJ. 2006. The aspartic acid metabolic pathway, an
exciting and essential pathway in plants. Amino Acids 30: 143–162.
Aziz M, Nadipalli RK, Xie X, Sun Y, Surowiec K, Zhang J, Paré PW. 2016.
Augmenting sulfur metabolism and herbivore defense in arabidopsis by bacterial
volatile signaling. Frontiers in Plant Science 7: 1–14.
Badger MR. 1994. The role of carbonic anhydrase in photosynthesis. Annual Review
of Plant Physiology and Plant Molecular Biology 45: 369–392.
Bae C, Kim S min, Lee DJ, Choi D. 2013. Multiple classes of immune-related
proteases associated with the cell death response in pepper plants. PLoS ONE 8:
e63533.
Bailey-Serres J, Vangala S, Szick K, Lee CH. 1997. Acidic phosphoprotein
complex of the 60S ribosomal subunit of maize seedling roots. Components and
changes in response to flooding. Plant Physiology 114: 1293–305.
Bak S, Beisson F, Bishop G, Hamberger B, Höfer R, Paquette S, Werck-
Reichhart D. 2011. Cytochromes P450. The Arabidopsis Book 9: e0144.
Bakker PAHM, Pieterse CMJ, van Loon LC. 2007. Induced systemic resistance by
fluorescent Pseudomonas spp. Phytopathology 97: 239–243.
Banerjee MR, Yesmin L, Vessey JK. 2006. Plant-growth-promoting rhizobacteria as
biofertilizers and biopesticides. Handbook of Microbial Biofertilizers.137–183.
Banno H, Ikeda Y, Niu QW, Chua NH. 2001. Overexpression of Arabidopsis ESR1
induces initiation of shoot regeneration. The Plant Cell 13: 2609–18.
Barco B. 2015. Methodologies for metabolomics: experimental strategies and
techniques . The Yale Journal of Biology and Medicine 88: 101.

281
References
Barea JM, Pozo MJ, Azcón R, Azcón-Aguilar C. 2005. Microbial co-operation in
the rhizosphere. Journal of Experimental Botany 56: 1761–1778.
Barickman TC, Kopsell DA, Sams CE. 2014. Abscisic acid increases carotenoid
and chlorophyll concentrations in leaves and fruit of two tomato genotypes. Journal
of the American Society for Horticultural Science 139: 261–266.
Barratt DHP, Kölling K, Graf A, Pike M, Calder G, Findlay K, Zeeman SC,
Smith AM. 2011. Callose synthase GSL7 is necessary for normal phloem transport
and inflorescence growth in Arabidopsis. Plant Physiology 155: 328–341.
Barry CS, Blume B, Bouzayen M, Cooper W, Hamilton AJ, Grierson D. 1996.
Differential expression of the 1-aminocyclopropane-1-carboxylate oxidase gene
family of tomato. Plant Journal 9: 525–535.
Barry CS, Giovannoni JJ. 2006. Ripening in the tomato Green-ripe mutant is
inhibited by ectopic expression of a protein that disrupts ethylene signaling.
Proceedings of the National Academy of Sciences of the United States of America
103: 7923–7928.
Barry CS, Llop-Tous MI, Grierson D. 2000. The regulation of 1-
aminocyclopropane-1-carboxylic acid synthase gene expression during the transition
from system-1 to system-2 ethylene synthesis in tomato. Plant Physiology 123: 979–
986.
Barshan E, Ghodsi A, Azimifar Z, Zolghadri Jahromi M. 2011. Supervised
principal component analysis: visualization, classification and regression on
subspaces and submanifolds. Pattern Recognition 44: 1357–1371.
Bashan Y, Levanony H. 1990. Current status of Azospirillum inoculation
technology: Azospirillum as a challenge for agriculture. Canadian Journal of
Microbiology 36: 591–608.
Bashline L, Lei L, Li S, Gu Y. 2014. Cell wall, cytoskeleton, and cell expansion in
higher plants. Molecular Plant 7: 586–600.
Baur AH, Yang SF. 1972. Methionine metabolism in apple tissue in relation to
ethylene biosynthesis. Phytochemistry 11: 3207–3214.
Beatrix B, Sakai H, Wiedmann M. 2000. The alpha and beta subunit of the nascent
polypeptide-associated complex have distinct functions. Journal of Biological
Chemistry 275: 37838–37845.
Belimov AA, Dodd IC, Hontzeas N, Theobald JC, Safronova VI, Davies WJ.
2009. Rhizosphere bacteria containing 1-aminocyclopropane-1-carboxylate
deaminase increase yield of plants grown in drying soil via both local and systemic
hormone signalling. New Physiologist 181: 413–23.
Belimov AA, Dodd IC, Safronova VI, Hontzeas N, Davies WJ. 2007.
Pseudomonas brassicacearum strain Am3 containing 1-aminocyclopropane-1-
carboxylate deaminase can show both pathogenic and growth-promoting properties in
its interaction with tomato. Journal of Experimental Botany 58: 1485–95.
Belimov AA, Hontzeas N, Safronova VII, Demchinskaya SV V., Piluzza G,
Bullitta S, Glick BRR. 2005. Cadmium-tolerant plant growth-promoting bacteria
associated with the roots of Indian mustard (Brassica juncea L. Czern.). Soil Biology
and Biochemistry 37: 241–50.
Beneduzi A, Ambrosini A, Passaglia LMP. 2012. Plant growth-promoting
rhizobacteria (PGPR): Their potential as antagonists and biocontrol agents. Genetics
and Molecular Biology 35: 1044–1051.
Benizri E, Baudoin E, Guckert A. 2001. Root colonization by inoculated plant
growth-promoting rhizobacteria. Biocontrol Science and Technology 11: 557–574.

282
References
Benlloch-González M, Fournier JM, Benlloch M. 2010. K+ deprivation induces
xylem water and K+ transport in sunflower: Evidence for a co-ordinated control.
Journal of Experimental Botany 61: 157–164.
Bennett E. 2014. Toward a more resilient agriculture. Solutions (Burlington, Vt.) 5:
65.
Berg G. 2009. Plant–microbe interactions promoting plant growth and health:
perspectives for controlled use of microorganisms in agriculture. Applied
Microbiology and Biotechnology 84: 11–18.
Bhattacharyya PN, Jha DK. 2012. Plant growth-promoting rhizobacteria (PGPR):
emergence in agriculture. World Journal of Microbiology & Biotechnology 28: 1327–
50.
Blaha D, Prigent-Combaret C, Mirza MS, Moënne-Loccoz Y. 2006. Phylogeny of
the 1-aminocyclopropane-1-carboxylic acid deaminase-encoding gene acdS in
phytobeneficial and pathogenic Proteobacteria and relation with strain biogeography.
FEMS Microbiology Ecology 56: 455–470.
Bleecker AB, Estelle MA, Somerville C, Kende H. 1988. Insensitivity to ethylene
conferred by a dominant mutation in Arabidopsis thaliana. Science 241: 1086–1089.
Blume B, Grierson D. 1997. Expression of ACC oxidase promoter-GUS fusions in
tomato and Nicotiana plumbaginifolia regulated by developmental and environmental
stimuli. The Plant Journal 12: 731–746.
Bolger ME, Weisshaar B, Scholz U, Stein N, Usadel B, Mayer KFX. 2014. Plant
genome sequencing - applications for crop improvement. Current Opinion in
Biotechnology 26: 31–37.
Boller T, Felix G. 2009. A renaissance of elicitors: perception of microbe-associated
molecular patterns and danger signals by pattern-recognition receptors. Annual
Review of Plant Biology 60: 379–406.
Boller T, Herner R, Kende H. 1979. Assay for and enzymatic formation of an
ethylene precursor, 1- aminocyclopropane-1-carboxylic acid. Planta 145: 293–303.
Bonawitz ND, Chapple C. 2010. The genetics of lignin biosynthesis: connecting
genotype to phenotype. Annual Review of Genetics 44: 337–63.
Borch K, Bouma TJ, Lynch JP, Brown KM. 1999. Ethylene: a regulator of root
architectural responses to soil phosphorus availability. Plant, Cell and Environment
22: 425–431.
Bosanac I, Alattia J-R, Mal TK, Chan J, Talarico S, Tong FK, Tong KI,
Yoshikawa F, Furuichi T, Iwai M, et al. 2002. Structure of the inositol 1,4,5-
trisphosphate receptor binding core in complex with its ligand. Nature 420: 696–700.
Bowler C, Montagu M V, Inze D. 1992. Superoxide dismutase and stress tolerance.
Annual Review of Plant Physiology and Plant Molecular Biology 43: 83–116.
Bozhkov P V, Suarez MF, Filonova LH, Daniel G, Zamyatnin AA, Rodriguez-
Nieto S, Zhivotovsky B, Smertenko A. 2005. Cysteine protease mcII-Pa executes
programmed cell death during plant embryogenesis. Proceedings of the National
Academy of Sciences of the United States of America 102: 14463–14468.
Bradford MM. 1976. A rapid and sensitive method for the quantitation of microgram
quantities of protein utilizing the principle of protein-dye binding. Analytical
Biochemistry 72: 248–254.
Brady SM. 2006. Unraveling the Dynamic Transcriptome. The Plant Cell 18: 2101–
2111.
283
References
Bresson J, Varoquaux F, Bontpart T, Touraine B, Vile D. 2013. The PGPR strain
Phyllobacterium brassicacearum STM196 induces a reproductive delay and
physiological changes that result in improved drought tolerance in Arabidopsis. New
Phytologist 200: 558–569.
Bringhurst RM, Cardon ZG, Gage DJ. 2001. Galactosides in the rhizosphere:
Utilization by Sinorhizobium meliloti and development of a biosensor. Proceedings of
the National Academy of Sciences of the United States of America 98: 4540–4545.
Van Den Broek D, Bloemberg G V., Lugtenberg B. 2005. The role of phenotypic
variation in rhizosphere Pseudomonas bacteria. Environmental Microbiology 7:
1686–1697.
Broun P, Poindexter P, Osborne E, Jiang C-Z, Riechmann JL. 2004. WIN1, a
transcriptional activator of epidermal wax accumulation in Arabidopsis. Proceedings
of the National Academy of Sciences of the United States of America 101: 4706–4711.
Browse J. 2009. Jasmonate passes muster: a receptor and targets for the defense
hormone. Annual Review of Plant Biology 60: 183–205.
De Bruijn FJ. 2015. Introduction. Biological Nitrogen Fixation. Hoboken, NJ, USA:
John Wiley & Sons, Inc, 1–4.
Brumbarova T, Bauer P. 2005. Iron-mediated control of the basic helix-loop-helix
protein FER, a regulator of iron uptake in tomato. Plant Physiology 137: 1018–1026.
Burd GI, Dixon DG, Glick BR. 2000. Plant growth-promoting bacteria that decrease
heavy metal toxicity in plants. Canadian Journal of Microbiology 46: 237–245.
Burdman S, Jurkevitch E, Okon Y. 2000. Recent advances in the use of plant
growth promoting rhizobacteria (PGPR) in agriculture. Microbial interactions in
agriculture and forestry. Science Publishers, Inc., 229.
Caballero F, Botella MA, Rubio L, Fernández JA, Martínez V, Rubio F. 2012. A
Ca2+
-sensitive system mediates low-affinity K+ uptake in the absence of AKT1 in
arabidopsis plants. Plant and Cell Physiology 53: 2047–2059.
Cabiscol E, Piulats E, Echave P, Herrero E, Ros J. 2000. Oxidative stress promotes
specific protein damage in Saccharomyces cerevisiae. Journal of Biological
Chemistry 275: 27393–27398.
Cai T, Cai W, Zhang J, Zheng H, Tsou AM, Xiao L, Zhong Z, Zhu J. 2009. Host
legume-exuded antimetabolites optimize the symbiotic rhizosphere. Molecular
Microbiology 73: 507–517.
Cairns NG, Pasternak M, Wachter A, Cobbett CS, Meyer AJ. 2006. Maturation
of arabidopsis seeds is dependent on glutathione biosynthesis within the embryo.
Plant Physiology 141: 446–55.
Canbolat MY, Bilen S, Cakmakci R, Sahin F, Aydin A. 2006. Effect of plant
growth-promoting bacteria and soil compaction on barley seedling growth, nutrient
uptake, soil properties and rhizosphere microflora. Biology and Fertility of Soils 42:
350–357.
Cangahuala-Inocente GC, Plucani do Amaral F, Faleiro AC, Huergo LF,
Maisonnave Arisi AC. 2013. Identification of six differentially accumulated proteins
of Zea mays seedlings (DKB240 variety) inoculated with Azospirillum brasilense
strain FP2. European Journal of Soil Biology 58: 45–50.
Carlberg I, Mannervik B. 1985. Glutathione reductase. Methods in Enzymology
113: 484–490.
Cartieaux F, Thibaud MC, Zimmerli L, Lessard P, Sarrobert C, David P,
Gerbaud A, Robaglia C, Somerville S, Nussaume L. 2003. Transcriptome analysis
of Arabidopsis colonized by a plant-growth promoting rhizobacterium reveals a
general effect on disease resistance. Plant Journal 36: 177–188.

284
References
Carvalho TLG, Balsemao-Pires E, Saraiva RM, Ferreira PCG, Hemerly AS.
2014. Nitrogen signalling in plant interactions with associative and endophytic
diazotrophic bacteria. Journal of Experimental Botany 65: 5631–5642.
Causse M, Desplat N, Pascual L, Le Paslier M-C, Sauvage C, Bauchet G, Bérard
A, Bounon R, Tchoumakov M, Brunel D, et al. 2013. Whole genome resequencing
in tomato reveals variation associated with introgression and breeding events. BMC
Genomics 14: 791–805.
Caverzan A, Passaia G, Rosa SB, Ribeiro CW, Lazzarotto F, Margis-Pinheiro M.
2012. Plant responses to stresses: role of ascorbate peroxidase in the antioxidant
protection. Genetics and Molecular Biology 35: 1011–1019.
Chakravarthy S, Tuori RP, D’Ascenzo MD, Fobert PR, Despres C, Martin GB.
2003. The tomato transcription factor Pti4 regulates defense-related gene expression
via GCC box and non-GCC box cis elements. The Plant Cell 15: 3033–3050.
Chang J, Clay JM, Chang C. 2014. Association of cytochrome b5 with ETR1
ethylene receptor signaling through RTE1 in Arabidopsis. Plant Journal 77: 558–567.
Chao Q, Rothenberg M, Solano R, Roman G, Terzaghi W, Ecker JR. 1997.
Activation of the ethylene gas response pathway in Arabidopsis by the nuclear protein
ETHYLENE-INSENSITIVE3 and related proteins. Cell 89: 1133–1144.
Charfeddine M, Saïdi MN, Charfeddine S, Hammami A, Gargouri Bouzid R.
2014. Genome-wide analysis and expression profiling of the ERF transcription factor
family in potato (Solanum tuberosum L.). Molecular Biotechnology 57: 348–358.
Chaves MM, Maroco JP, Pereira JS. 2003. Understanding plant responses to
drought - From genes to the whole plant. Functional Plant Biology 30: 239–264.
Chen M. 2014. Chlorophyll modifications and their spectral extension in oxygenic
photosynthesis. Annual Review of Biochemistry 83: 317–40.
Chen L, Dodd IC, Theobald JC, Belimov AA, Davies WJ. 2013. The
rhizobacterium Variovorax paradoxus 5C-2, containing ACC deaminase, promotes
growth and development of Arabidopsis thaliana via an ethylene-dependent pathway.
Journal of Experimental Botany 64: 1565–73.
Chen X, Irani NG, Friml J. 2011. Clathrin-mediated endocytosis: the gateway into
plant cells. Current Opinion in Plant Biology 14: 674–682.
Chen X, Kim J. 2009. Callose synthesis in higher plants. Plant Signaling & Behavior
4: 489–492.
Chen H, McCaig BC, Melotto M, He SY, Howe GA. 2004. Regulation of plant
arginase by wounding, jasmonate, and the phytotoxin coronatine. Journal of
Biological Chemistry 279: 45998–46007.
Chen H, Xue L, Chintamanani S, Germain H, Lin H, Cui H, Cai R, Zuo J, Tang
X, Li X, et al. 2009. ETHYLENE INSENSITIVE3 and ETHYLENE
INSENSITIVE3-LIKE1 repress SALICYLIC ACID INDUCTION DEFICIENT2
expression to negatively regulate plant innate immunity in Arabidopsis. The Plant
Cell 21: 2527–2540.
Cheng L, Bucciarelli B, Liu J, Zinn K, Miller S, Patton-Vogt J, Allan D, Shen J,
Vance CP. 2011. White lupin cluster root acclimation to phosphorus deficiency and
root hair development involve unique glycerophosphodiester phosphodiesterases.
Plant Physiology 156: 1131–1148.
Cheng M-C, Liao P-M, Kuo W-W, Lin T-P. 2013. The Arabidopsis ETHYLENE
RESPONSE FACTOR1 regulates abiotic stress-responsive gene expression by
binding to different cis-acting elements in response to different stress signals. Plant
Physiology 162: 1566–82.

285
References
Cheng Z, McConkey BJ, Glick BR. 2010. Proteomic studies of plant–bacterial
interactions. Soil Biology and Biochemistry 42: 1673–1684.
Chrispeels MJ. 1999. Proteins for transport of water and mineral nutrients across the
membranes of plant cells. The Plant Cell 11: 661–676.
Ciardi JA, Tieman DM, Lund ST, Jones JB, Stall RE, Klee HJ. 2000. Response to
Xanthomonas campestris pv. vesicatoria in tomato involves regulation of ethylene
receptor gene expression. Plant Physiology 123: 81–92.
Clark KL, Larsen PB, Wang X, Chang C. 1998. Association of the Arabidopsis
CTR1 Raf-like kinase with the ETR1 and ERS ethylene receptors (hormone signal
transduction two-component regulators protein–protein interactions yeast). Plant
Biology 95: 5401–5406.
Cleland WW, Andrews TJ, Gutteridge S, Hartman FC, Lorimer GH. 1998.
Mechanism of Rubisco: the carbamate as general base. Chemical Reviews 98: 549–
562.
Cohen AC, Bottini R, Pontin M, Berli FJ, Moreno D, Boccanlandro H, Travaglia
CN, Piccoli PN. 2015. Azospirillum brasilense ameliorates the response of
Arabidopsis thaliana to drought mainly via enhancement of ABA levels. Physiologia
Plantarum 153: 79–90.
Cohn RJ, Martin GB. 2005. Pseudomonas syringae pv. tomato type III effecors
AvrPto and AvrPtoB promote ethylene -dependent cell death in tomato. Plant Journal
44: 139–154.
Colombo C, Palumbo G, He JZ, Pinton R, Cesco S. 2014. Review on iron
availability in soil: Interaction of Fe minerals, plants, and microbes. Journal of Soils
and Sediments 14: 538–548.
Compant S, Duffy B, Nowak J, Clément C, Barka EA. 2005. Use of plant growth-
promoting bacteria for biocontrol of plant diseases: Principles, mechanisms of action,
and future prospects. Applied and Environmental Microbiology 71: 4951–4959.
Contesto C, Desbrosses G, Lefoulon C, Béna G, Borel F, Galland M, Gamet L,
Varoquaux F, Touraine B. 2008. Effects of rhizobacterial ACC deaminase activity
on Arabidopsis indicate that ethylene mediates local root responses to plant growth-
promoting rhizobacteria. Plant Science 175: 178–189.
Cortina C, Culiáñez-Macià FA. 2004. Tomato transformation and transgenic plant
production. Plant Cell, Tissue and Organ Culture 76: 269–275.
Couillerot O, Ramírez-Trujillo A, Walker V, Von Felten A, Jansa J, Maurhofer
M, Défago G, Prigent-Combaret C, Comte G, Caballero-Mellado J, et al. 2013.
Comparison of prominent Azospirillum strains in Azospirillum-Pseudomonas- Glomus
consortia for promotion of maize growth. Applied Microbiology and Biotechnology
97: 4639–4649.
Cruz de Carvalho MH. 2008. Drought stress and reactive oxygen species:
Production, scavenging and signaling. Plant Signaling & Behavior 3: 156–65.
Curzi MJ, Ribaudo CM, Trinchero GD, Curá JA, Pagano EA. 2008. Changes in
the content of organic and amino acids and ethylene production of rice plants in
response to the inoculation with Herbaspirillum seropedicae. Journal of Plant
Interactions 3: 163–173.
Dao TTH, Linthorst HJM, Verpoorte R. 2011. Chalcone synthase and its functions
in plant resistance. Phytochemistry reviews: proceedings of the Phytochemical Society
of Europe 10: 397–412.

286
References
Datta R, Kumar D, Sultana A, Hazra S, Bhattacharyya D, Chattopadhyay S.
2015. Glutathione regulates 1-aminocyclopropane-1-carboxylate synthase
transcription via WRKY33 and 1-aminocyclopropane-1-carboxylate oxidase by
modulating messenger RNA stability to induce ethylene synthesis during stress. Plant
Physiology 169: 2963–81.
Davidson CJ, Surette MG. 2008. Individuality in bacteria. Annual Review of
Genetics 42: 253–268.
Davies PJ. 2010. Plant hormones: Biosynthesis, signal transduction, action! (PJ
Davies, Ed.). Dordrecht: Springer Netherlands.
Deblonde PMK, Ledent JF. 2001. Effects of moderate drought conditions on green
leaf number, stem height, leaf length and tuber yield of potato cultivars. European
Journal of Agronomy 14: 31–41.
Delehanty J, Johnson BJ, Hickey TE, Ligler FS. 2007. Binding and Neutralization
of Lipopolysaccharides by Plant Proanthocyanidins. Journal of Natural Products 70:
1718-1724.
Denoux C, Galletti R, Mammarella N, Gopalan S, Werck D, De Lorenzo G,
Ferrari S, Ausubel FM, Dewdney J. 2008. Activation of defense response pathways
by OGs and Flg22 elicitors in Arabidopsis seedlings. Molecular Plant 1: 423–445.
Dey R, Pal KK, Bhatt DM, Chauhan SM. 2004. Growth promotion and yield
enhancement of peanut (Arachis hypogaea L.) by application of plant growth-
promoting rhizobacteria. Microbiological Research 159: 371–394.
Díaz-Moreno I, García-Heredia JM, Díaz-Quintana A, De la Rosa MA. 2011.
Cytochrome c signalosome in mitochondria. European Biophysics Journal 40: 1301–
1315.
Dietz KJ, Tavakoli N, Kluge C, Mimura T, Sharma SS, Harris GC,
Chardonnens a N, Golldack D. 2001. Significance of the V-type ATPase for the
adaptation to stressful growth conditions and its regulation on the molecular and
biochemical level. Journal of Experimental Botany 52: 1969–1980.
Dimkpa C, Weinand T, Asch F. 2009. Plant rhizobacteria interactions alleviate
abiotic stress conditions. Plant, Cell and Environment 32: 1682–94.
Djemal R, Khoudi H. 2015. Isolation and molecular characterization of a novel
WIN1/SHN1 ethylene-responsive transcription factor TdSHN1 from durum wheat
(Triticum turgidum. L. subsp. durum). Protoplasma 252: 1461–1473.
Dodd IC, Ruiz-Lozano JM. 2012. Microbial enhancement of crop resource use
efficiency. Current Opinion in Biotechnology 23: 236–42.
Dodds PN, Rathjen JP. 2010. Plant immunity: towards an integrated view of plant–
pathogen interactions. Nature Reviews Genetics 11: 539–548.
Dong H, Beer S V. 2000. Riboflavin induces disease resistance in plants by
activating a novel signal transduction pathway. Phytopathology 90: 801–11.
Doornbos RF, Van Loon LC, Bakker PAHM. 2012. Impact of root exudates and
plant defense signaling on bacterial communities in the rhizosphere. A review.
Agronomy for Sustainable Development 32: 227–243.
Dorling SJ, McManus MT. 2012. The fate of ACC in higher plants. The Plant
Hormone Ethylene. Oxford, UK: Wiley-Blackwell, 83–115.
Dörmann P, Kim H, Ott T, Schulze-Lefert P, Trujillo M, Wewer V, Hückelhoven
R. 2014. Cell-autonomous defense, re-organization and trafficking of membranes in
plant-microbe interactions. New Phytologist: 815–822.

287
References
Dowling D, Sexton R, Fenton A. 1996. Iron regulation in plant-associated
Pseudomonas fluorescens M114: implications for biological control. In T. Nakazawa,
K. Ferukawa, D. Haas and S. Silver (Eds.), Molecular Biology of Pseudomonas: 502–
511. American Society for Microbiology. Washington, D.C.
Drew MC, He CJ, Morgan PW. 1989. Decreased ethylene biosynthesis, and
induction of aerenchyma, by nitrogen- or phosphate-starvation in adventitious roots of
Zea mays L. Plant Physiology 91: 266–271.
Van Den Dries N, Facchinelli F, Giarola V, Phillips JR, Bartels D. 2011.
Comparative analysis of LEA-like 11-24 gene expression and regulation in related
plant species within the Linderniaceae that differ in desiccation tolerance. New
Phytologist 190: 75–88.
Dubois M, Skirycz A, Claeys H, Maleux K, Dhondt S, De Bodt S, Vanden
Bossche R, De Milde L, Yoshizumi T, Matsui M, et al. 2013. The ETHYLENE
RESPONSE FACTOR 6 acts as central regulator of leaf growth under water limiting
conditions in Arabidopsis thaliana. Plant Physiology 162: 319–332.
Dugardeyn J, Van Der Straeten D. 2008. Ethylene: Fine-tuning plant growth and
development by stimulation and inhibition of elongation. Plant Science 175: 59–70.
Edwards R, Dixon DP. 2005. Plant glutathione transferases. Methods in Enzymology
401: 169–186.
Edwards R, Dixon DP. 2010. Glutathione transferases. The Arabidopsis Book 8:
e0131.
Edwards R, Dixon DP, Walbot V. 2000. Plant glutathione S -transferases: enzymes
with multiple functions in sickness and in health. Trends in Biotechnology 5: 193–
198.
Elliott LF, Lynch JM. 1984. Pseudomonads as a factor in the growth of winter
wheat (Triticum aestivum L.). Soil Biology and Biochemistry 16: 69–71.
Else M, Jackson MB. 1998. Transport of 1-aminocyclopropane-1-carboxylic acid
(ACC) in the transpiration stream of tomato (Lycopersicon esculentum) in relation to
foliar ethylene production and petiole epinasty. Australian Journal of Plant
Physiology 25: 453–458.
Emmert EAB, Milner JL, Lee JC, Pulvermacher KL, Olivares HA, Clardy J,
Handelsman J. 1998. Effect of canavanine from alfalfa seeds on the population
biology of Bacillus cereus. Applied and Environmental Microbiology 64: 4683–4688.
Eubel H, Heinemeyer J, Sunderhaus S, Braun HP. 2004. Respiratory chain
supercomplexes in plant mitochondria. Plant Physiology and Biochemistry 42: 937–
942.
Evelin H, Kapoor R, Giri B. 2009. Arbuscular mycorrhizal fungi in alleviation of
salt stress: A review. Annals of Botany 104: 1263–1280.
Faleiro AC, Neto PAV, De Souza TV, Santos M, Maisonnave Arisi AC. 2015.
Microscopic and proteomic analysis of Zea mays roots (P30F53 variety) inoculated
with Azospirillum brasilense strain FP2. Journal of Crop Science and Biotechnology
18: 63–71.
FAO. 2013. Climate-Smart Agriculture Sourcebook.
Fariduddin Q, Yusuf M, Ahmad I, Ahmad A. 2014. Brassinosteroids and their role
in response of plants to abiotic stresses. Biologia Plantarum 58: 9–17.
Farrar J, Hawes M, Jones D, Lindow S. 2003. How roots control the flux of carbon
to the rhizosphere. Ecology 84: 827–837.
Feng J, Barker A V. 1992. Ethylene evolution and ammonium accumulation by
nutrient stressed tomato plants. Journal of Plant Nutrition 15: 137–153.

288
References
Fernandes H, Michalska K, Sikorski M, Jaskolski M. 2013. Structural and
functional aspects of PR-10 proteins. FEBS Journal 280: 1169–1199.
Fernández-Calvo P, Chini A, Fernández-Barbero G, Chico J-M, Gimenez-
Ibanez S, Geerinck J, Eeckhout D, Schweizer F, Godoy M, Franco-Zorrilla JM,
et al. 2011. The Arabidopsis bHLH transcription factors MYC3 and MYC4 are
targets of JAZ repressors and act additively with MYC2 in the activation of jasmonate
responses. The Plant Cell 23: 701–715.
Fernandez O, Theocharis A, Bordiec S, Feil R, Jacquens L, Clément C, Fontaine
F, Ait Barka E. 2012. Burkholderia phytofirmans PsJN acclimates grapevine to cold
by modulating carbohydrate metabolism. Molecular Plant-Microbe Interactions 25:
496–504.
Feussner I, Polle A. 2015. What the transcriptome does not tell - proteomics and
metabolomics are closer to the plants’ patho-phenotype. Current Opinion in Plant
Biology 26: 26–31.
Fiebig A, Dodd IC. 2016. Inhibition of tomato shoot growth by over-irrigation is
linked to nitrogen deficiency and ethylene. Physiologia Plantarum 156: 70–83.
Figueiredo A, Monteiro F, Sebastiana M. 2014. Subtilisin-like proteases in plant-
pathogen recognition and immune priming: a perspective. Frontiers in Plant Science
5: 739.
Finkelstein R. 2013. Abscisic acid synthesis and response. The Arabidopsis book /
American Society of Plant Biologists 11: e0166.
Fiorani F, Bögemann GM, Visser EJW, Lambers H, Voesenek LACJ. 2002.
Ethylene emission and responsiveness to applied ethylene vary among Poa species
that inherently differ in leaf elongation rates. Plant Physiology 129: 1382–1390.
Foley J a, Defries R, Asner GP, Barford C, Bonan G, Carpenter SR, Chapin FS,
Coe MT, Daily GC, Gibbs HK, et al. 2005. Global consequences of land use.
Science 309: 570–4.
Folke C, Hahn T, Olsson P, Norberg J. 2005. Adaptative governance of social-
ecological systems. Annual Review of Environment and Resources 30: 441–73.
Fournier ML, Gilmore JM, Martin-Brown SA, Washburn MP. 2007.
Multidimensional separations-based shotgun proteomics. Chemical Reviews 107:
3654–3686.
Fowler JL, Morgan PW. 1972. The relationship of the peroxidative indoleacetic acid
oxidase system to in vivo ethylene synthesis in cotton. Plant Physiology 49: 555–9.
Franchin C, Fossati T, Pasquini E, Lingua G, Castiglione S, Torrigiani P, Biondi
S. 2007. High concentrations of zinc and copper induce differential polyamine
responses in micropropagated white poplar (Populus alba). Physiologia Plantarum
130: 77–90.
Fransz PF, De Jong JH. 2002. Chromatin dynamics in plants. Current Opinion in
Plant Biology 5: 560–567.
Fraser CM, Chapple C. 2011. The phenylpropanoid pathway in Arabidopsis. The
Arabidopsis book / American Society of Plant Biologists 9: e0152.
Galmés J, Ochogavía JM, Gago J, Roldán EJ, Cifre J, Conesa MÀ. 2013. Leaf
responses to drought stress in Mediterranean accessions of Solanum lycopersicum:
Anatomical adaptations in relation to gas exchange parameters. Plant, Cell and
Environment 36: 920–935.
Gamalero E, Berta G, Massa N, Glick BR, Lingua G. 2008. Synergistic
interactions between the ACC deaminase-producing bacterium Pseudomonas putida
UW4 and the AM fungus Gigaspora rosea positively affect cucumber plant growth.
FEMS Microbiology Ecology 64: 459–467.
289
References
García de Salamone IE, Hynes RK, Nelson LM. 2001. Cytokinin production by
plant growth promoting rhizobacteria and selected mutants. Canadian Journal of
Microbiology 47: 404–411.
García MJ, Lucena C, Romera FJ, Alcántara E, Pérez-Vicente R. 2010. Ethylene
and nitric oxide involvement in the up-regulation of key genes related to iron
acquisition and homeostasis in Arabidopsis. Journal of Experimental Botany 61:
3885–3899.
García MJ, Romera FJ, Lucena C, Alcántara E, Pérez-Vicente R. 2015. Ethylene
and the regulation of physiological and morphological responses to nutrient
deficiencies. Plant Physiology 169: 51–60.
De Garcia Salamone IE, Hynes RK, Nelson LM. 2006. Role of cytokinins in plant
growth promotion by rhizosphere bacteria. PGPR: Biocontrol and Biofertilization.
Dordrecht: Springer Netherlands, 173–195.
Garnett T, Appleby MC, Balmford A, Bateman IJ, Benton TG, Bloomer P,
Burlingame B, Dawkins M, Dolan L, Fraser D, et al. 2013. Sustainable
intensification in agriculture: premises and policies. Science Magazine 341: 33–34.
Gehl B, Sweetlove LJ. 2014. Mitochondrial Band-7 family proteins: scaffolds for
respiratory chain assembly? Frontiers in Plant Science 5: 141.
Geil RD, Peterson RL, Guinel FC. 2001. Morphological alterations of pea (Pisum
sativum cv. Sparkle) arbuscular mycorrhizas as a result of exogenous ethylene
treatment. Mycorrhiza 11: 137–143.
Ghanem ME, Hichri I, Smigocki AC, Albacete A, Fauconnier M-L, Diatloff E,
Martinez-Andujar C, Lutts S, Dodd IC, Pérez-Alfocea F. 2011. Root-targeted
biotechnology to mediate hormonal signalling and improve crop stress tolerance.
Plant Cell Reports 30: 807–23.
Ghanta S, Datta R, Bhattacharyya D, Sinha R, Kumar D, Hazra S, Mazumdar
AB, Chattopadhyay S. 2014. Multistep involvement of glutathione with salicylic
acid and ethylene to combat environmental stress. Journal of Plant Physiology 171:
940–950.
Ghorbanpour M, Majnoon Hosseini N, Rezazadeh S, Omidi M, Khavazi K,
Etminan A. 2010. Hyoscyamine and scopolamine production of black henbane
(Hyoscyamus niger) infected with Pseudomonas putida and P. fluorescens strains
under water deficit stress. Planta Medica 76: P167.
Gika HG, Theodoridis GA, Wingate JE, Wilson ID. 2007. Within-day
reproducibility of an HPLC-MS-based method for metabonomic analysis: Application
to human urine. Journal of Proteome Research 6: 3291–3303.
Giller KE, Beare MH, Lavelle P, Izac A-MN, Swift MJ. 1997. Agricultural
intensification, soil biodiversity and agroecosystem function. Applied Soil Ecology 6:
3–16.
Gizatullina AK, Finkina EI, Mineev KS, Melnikova DN, Bogdanov I V.,
Telezhinskaya IN, Balandin S V., Shenkarev ZO, Arseniev AS, Ovchinnikova T
V. 2013. Recombinant production and solution structure of lipid transfer protein from
lentil Lens culinaris. Biochemical and Biophysical Research Communications 439:
427–432.
Glazebrook J. 2005. Contrasting mechanisms of defense against biotrophic and
necrotrophic pathogens. Annual Review of Phytopathology 43: 205–227.
Glazebrook J, Zook M, Mert F, Kagan I, Rogers EE, Crute IR, Holub EB,
Hammerschmidt R, Ausubel FM. 1997. Phytoalexin-deficient mutants of
Arabidopsis reveal that PAD4 encodes a regulatory factor and that four PAD genes
contribute to downy mildew resistance. Genetics 146: 381–392.

290
References
Glick BR. 2004. Bacterial ACC deaminase and the alleviation of plant stress.
Advances in Applied Microbiology 56: 291–312.
Glick BR. 2012. Plant growth-promoting bacteria: mechanisms and applications.
Scientifica 2012: 1–15.
Glick BR. 2014. Bacteria with ACC deaminase can promote plant growth and help to
feed the world. Microbiological Research 169: 30–39.
Glick BR, Bashan Y. 1997. Genetic manipulation of plant growth-promoting bacteria
to enhance biocontrol of phytopathogens. Biotechnology Advances 15: 353–378.
Glick B, Cheng Z, Czarny J, Duan J. 2007a. Promotion of plant growth by ACC
deaminase-producing soil bacteria. European Journal of Plant Pathology 119: 329–
39.
Glick B, Penrose D, Li J. 1998. A model for the lowering of plant ethylene
concentrations by plant growth-promoting bacteria. Journal of Theoretical Biology
190: 63–8.
Glick B, Todorovic B, Czarny J, Cheng Z, Duan J, McConkey B. 2007b.
Promotion of plant growth by bacterial ACC deaminase. Critical Reviews in Plant
Sciences 26: 227–242.
Gomez-Roldan V, Fermas S, Brewer PB, Puech-Pagès V, Dun EA, Pillot J-P,
Letisse F, Matusova R, Danoun S, Portais J-C, et al. 2008. Strigolactone inhibition
of shoot branching. Nature 455: 189–194.
Gong P, Zhang J, Li H, Yang C, Zhang C, Zhang X, Khurram Z, Zhang Y,
Wang T, Fei Z, et al. 2010. Transcriptional profiles of drought-responsive genes in
modulating transcription signal transduction, and biochemical pathways in tomato.
Journal of Experimental Botany 61: 3563–3575.
Goormachtig S, Capoen W, James EK, Holsters M. 2004. Switch from
intracellular to intercellular invasion during water stress-tolerant legume nodulation.
Proceedings of the National Academy of Sciences of the United States of America
101: 6303–6308.
Gray WM. 2004. Hormonal regulation of plant growth and development. PLoS
Biology 2: E311.
Gray EJ, Smith DL. 2005. Intracellular and extracellular PGPR: commonalities and
distinctions in the plant-bacterium signaling processes. Soil Biology and Biochemistry
37: 395–412.
Grefen C, Städele K, Růzicka K, Obrdlik P, Harter K, Horák J. 2008. Subcellular
localization and in vivo interactions of the Arabidopsis thaliana ethylene receptor
family members. Molecular Plant 1: 308–20.
Groen SC, Whiteman NK, Bahrami AK, Wilczek AM, Cui J, Russell JA,
Cibrian-Jaramillo A, Butler IA, Rana JD, Huang G-H, et al. 2013. Pathogen-
triggered ethylene signaling mediates systemic-induced susceptibility to herbivory in
Arabidopsis. The Plant Cell 25: 1–13.
Gu YQ, Yang C, Thara VK, Zhou J, Martin GB. 2000. Pti4 is induced by ethylene
and salicylic acid, and its product is phosphorylated by the Pto kinase. The Plant Cell
12: 771–86.
Guerra D, Crosatti C, Khoshro HH, Mastrangelo AM, Mica E, Mazzucotelli E.
2015. Post-transcriptional and post-translational regulations of drought and heat
response in plants: a spider’s web of mechanisms. Frontiers in Plant Science 6: 57.
Guinel FC. 2015. Ethylene, a hormone at the center-stage of nodulation. Frontiers in
Plant Science 6: 1121–1121.

291
References
Guo ZJ, Chen XJ, Wu XL, Ling JQ, Xu P. 2004. Overexpression of the
AP2/EREBP transcription factor OPBP1 enhances disease resistance and salt
tolerance in tobacco. Plant Molecular Biology 55: 607–618.
Guo H, Ecker JR. 2003. Plant responses to ethylene gas are mediated by
SCFEBF1/EBF2- dependent proteolysis of EIN3 transcription factor. Cell 115: 667–
677.
Guo H, Ecker JR. 2004. The ethylene signaling pathway: New insights. Current
Opinion in Plant Biology 7: 40–49.
Guo B, Jin Y, Wussler C, Blancaflor EB, Motes CM, Versaw WK. 2008.
Functional analysis of the Arabidopsis PHT4 family of intracellular phosphate
transporters. New Phytologist 177: 889–898.
Guo W, Nazim H, Liang Z, Yang D. 2016. Magnesium deficiency in plants: An
urgent problem. The Crop Journal 4: 83–91.
Gutiérrez-Beltrán E, Personat JM, de la Torre F, del Pozo O. 2017. A universal
stress protein involved in oxidative stress is a phosphorylation target for protein
kinase CIPK6. Plant Physiology 173: 836–852.
Guzman P, Ecker JR. 1990. Exploiting the triple response of Arabidopsis to identify
ethylene-related mutants. The Plant Cell 2: 513–523.
Hachez C, Moshelion M, Zelazny E, Cavez D, Chaumont F. 2006. Localization
and quantification of plasma membrane aquaporin expression in maize primary root:
A clue to understanding their role as cellular plumbers. Plant Molecular Biology 62:
305–323.
Haichar F el Z, Santaella C, Heulin T, Achouak W. 2014. Root exudates mediated
interactions belowground. Soil Biology and Biochemistry 77: 69–80.
Hallberg G. 1987. The impacts of agricultural chemicals on ground water quality.
GeoJournal 15: 283–295.
Halo BA, Khan AL, Waqas M, Al-Harrasi A, Hussain J, Ali L, Adnan M, Lee I-
J. 2015. Endophytic bacteria (Sphingomonas sp. LK11) and gibberellin can improve
Solanum lycopersicum growth and oxidative stress under salinity. Journal of Plant
Interactions 10: 117–125.
Hanson J, Smeekens S. 2009. Sugar perception and signaling - an update. Current
Opinion in Plant Biology 12: 562–567.
Harpaz-saad S, Western TL, Kieber JJ. 2012. The FEI2-SOS5 pathway and
cellulose synthase 5 are required for cellulose biosynthesis in the Arabidopsis seed
coat and affect pectin mucilage structure. Plant Signaling & Behavior 7: 285–288.
Harrier LA. 2001. The arbuscular mycorrhizal symbiosis: a molecular review of the
fungal dimension. Journal of Experimental Botany 52: 469–478.
Harrison MJ, Dewbre GR, Liu JY. 2002. A phosphate transporter from Medicago
truncatula involved in the acquisiton of phosphate released by arbuscular mycorrhizal
fungi. Plant Cell 14: 2413–2429.
Hasanuzzaman M, Nahar K, Gill SS, Fujita M. 2014. Drought stress responses in
plants, oxidative stress, and antioxidant defense. Climate Change and Plant Abiotic
Stress Tolerance, First Edition. In N. Tuteja and S.S. Gill (Eds.), 209–250. Wiley-
VCH Verlag GmbH & Co. KGaA. Weinheim, Germany.
Hattori Y, Nagai K, Furukawa S, Song X-J, Kawano R, Sakakibara H, Wu J,
Matsumoto T, Yoshimura A, Kitano H, et al. 2009. The ethylene response factors
SNORKEL1 and SNORKEL2 allow rice to adapt to deep water. Nature 460: 1026–
1030.

292
References
He CJ, Morgan PW, Drew MC. 1992. Enhanced sensitivity to ethylene in nitrogen-
or phosphate-starved roots of Zea mays L. during aerenchyma Formation. Plant
Physiology 98: 137–142.
Heck S, Grau T, Buchala A, Métraux JP, Nawrath C. 2003. Genetic evidence that
expression of NahG modifies defence pathways independent of salicylic acid
biosynthesis in the Arabidopsis-Pseudomonas syringae pv. tomato interaction. Plant
Journal 36: 342–352.
Hellmann H, Estelle M. 2002. Plant Development: regulation by Protein
Degradation. Science 297: 793–798.
Hemphill DD. 1993. Agricultural plastics as solid waste: What are the options for
disposal? HortTechnology 3: 70–73.
Henry RP. 1996. Multiple roles of carbonic anhydrase in cellular transport and
metabolism. Annual Review of Physiology 58: 523–538.
Hepler PK. 2005. Calcium: a central regulator of plant growth and development. The
Plant Cell 17: 2142–55.
Hermans C, Hammond JP, White PJ, Verbruggen N. 2006. How do plants
respond to nutrient shortage by biomass allocation? Trends in Plant Science 11: 610–
617.
Hermans C, Vuylsteke M, Coppens F, Cristescu SM, Harren FJM, Inzé D,
Verbruggen N, Inze D. 2010. Systems analysis of the responses to long-term
magnesium deficiency and restoration in Arabidopsis thaliana. New Phytologist 187:
132–44.
Herrmann SM, Hutchinson CF. 2005. The changing contexts of the desertification
debate. Journal of Arid Environments. 3:538–555.
Hervás M, Bashir Q, Leferink NGH, Ferreira P, Moreno-Beltrán B, Westphal
AH, Dίaz-Moreno I, Medina M, de la Rosa MA, Ubbink M, et al. 2013.
Communication between L-galactono-1,4-lactone dehydrogenase and cytochrome c.
FEBS Journal 280: 1830–1840.
Hetherington AM, Woodward FI. 2003. The role of stomata in sensing and driving
environmental change. Nature 424: 901–908.
Hewitt EJ. 1966. Sand and water culture methods used in the study of plant nutrition.
Commonwealth Agricultural Bureau.
Hider RC, Kong X. 2010. Chemistry and biology of siderophores. Natural Product
Reports 27: 637–657.
Hirayama T, Kieber JJ, Hirayama N, Kogan M, Guzman P, Nourizadeh S,
Alonso JM, Dailey WP, Dancis A, Ecker JR. 1999. RESPONSIVE-TO-
ANTAGONIST1, a Menkes/Wilson disease–related copper transporter, is required for
ethylene signaling in Arabidopsis. Cell 97: 383–393.
Holliday LS, Holliday LS. 2014. Vacuolar H + -ATPase: an essential multitasking
enzyme in physiology and pathophysiology. New Journal of Science 2014: 1–21.
Honma M, Shimomura T. 1978. Metabolism of 1-aminocyclopropane-1-carboxylic
acid. Agricultural and Biological Chemistry 42: 1825–1831.
Hontzeas N, Saleh SS, Glick BR. 2004. Changes in gene expression in canola roots
induced by ACC-deaminase-containing plant-growth-promoting bacteria. Molecular
Plant-Microbe Interactions 17: 865–871.
Houben A, Demidov D, Caperta AD, Karimi R, Agueci F, Vlasenko L. 2007.
Phosphorylation of histone H3 in plants-A dynamic affair. Biochimica et Biophysica
Acta 1769: 308–315.
Hua J, Chang C, Sun Q, Meyerowitz EM. 1995. Ethylene insensitivity conferred by
Arabidopsis ERS gene. Science 269: 1712–1714.

293
References
Hua J, Meyerowitz EM. 1998. Ethylene responses are negatively regulated by a
receptor gene family in Arabidopsis thaliana. Cell 94: 261–71.
Hua J, Sakai H, Nourizadeh S, Chen Q, Bleecker A, Ecker J, Meyerowitz E.
1998. EIN4 and ERS2 are members of the putative ethylene receptor gene family in
Arabidopsis. The Plant Cell 10: 1321–1332.
Huang Y, Li H, Hutchison CE, Laskey J, Kieber JJ. 2003. Biochemical and
functional analysis of CTR1, a protein kinase that negatively regulates ethylene
signaling in Arabidopsis. Plant Journal 33: 221–233.
Huang D, Wu W, Abrams SR, Cutler AJ. 2008. The relationship of drought-related
gene expression in Arabidopsis thaliana to hormonal and environmental factors.
Journal of Experimental Botany 59: 2991–3007.
Huang Z, Zhang Z, Zhang X, Zhang H, Huang D, Huang R. 2004. Tomato
TERF1 modulates ethylene response and enhances osmotic stress tolerance by
activating expression of downstream genes. FEBS Letters 573: 110–116.
Hu N, Tang N, Yan F, Bouzayen M, Li Z. 2014. Effect of LeERF1 and LeERF2
overexpression in the response to salinity of young tomato (Solanum lycopersicum cv.
Micro-Tom) seedlings. Acta Physiologiae Plantarum 36: 1703–1712.
Hulsen T, de Vlieg J, Alkema W, Venn J, Chow S, Ruskey F, Pirooznia M,
Nagarajan V, Deng Y, Kestler H, et al. 2008. BioVenn – a web application for the
comparison and visualization of biological lists using area-proportional Venn
diagrams. BMC Genomics 9: 488.
Hunt R. 1982. Plant growth analysis. The Journal of Applied Ecology 17: 516.
Huo Y, Wang M, Wei Y, Xia Z. 2015. Overexpression of the maize psbA gene
enhances drought tolerance through regulating antioxidant system, photosynthetic
capability, and stress defense gene expression in tobacco. Frontiers in Plant Science
6: 1223.
Hwang HJ, Kim EH, Cho YD. 2001. Isolation and properties of arginase from a
shade plant, ginseng (Panax ginseng C.A. Meyer) roots. Phytochemistry 58: 1015–
1024.
Hyun MW, Yun YH, Kim JY, Kim SH. 2011. Fungal and plant phenylalanine
ammonia-lyase. Mycobiology 39: 257–265.
Inada N, Ueda T. 2014. Membrane trafficking pathways and their roles in plant-
microbe interactions. Plant and Cell Physiology 55: 672–686.
Innerebner G, Knief C, Vorholt JA. 2011. Protection of Arabidopsis thaliana
against leaf-pathogenic Pseudomonas syringae by Sphingomonas strains in a
controlled model system. Applied and Environmental Microbiology 77: 3202–3210.
Iovieno P, Punzo P, Guida G, Mistretta C, Van Oosten MJ, Nurcato R, Bostan
H, Colantuono C, Costa A, Bagnaresi P, et al. 2016. Transcriptomic changes drive
physiological responses to progressive drought stress and rehydration in tomato.
Frontiers in Plant Science 7: 371.
Iqbal N, Nazar R, Syeed S, Masood A, Khan NA. 2011. Exogenously-sourced
ethylene increases stomatal conductance, photosynthesis, and growth under optimal
and deficient nitrogen fertilization in mustard. Journal of Experimental Botany 62:
4955–4963.
Iqbal N, Trivellini A, Masood A, Ferrante A, Khan NA. 2013. Current
understanding on ethylene signaling in plants: the influence of nutrient availability.
Plant Physiology and Biochemistry 73: 128–38.
Ito H, Iwabuchi M, Ogawa K. 2003. The sugar-metabolic enzymes aldolase and
triose-phosphate isomerase are targets of glutathionylation in Arabidopsis thaliana:
Detection using biotinylated glutathione. Plant and Cell Physiology 44: 655–660.

294
References
Ivanov S, Fedorova E, Bisseling T. 2010. Intracellular plant microbe associations:
Secretory pathways and the formation of perimicrobial compartments. Current
Opinion in Plant Biology 13: 372–377.
Jakubowicz M, Gałgańska H, Nowak W, Sadowski J. 2010. Exogenously induced
expression of ethylene biosynthesis, ethylene perception, phospholipase D, and Rboh-
oxidase genes in broccoli seedlings. Journal of Experimental Botany 61: 3475–3491.
Jha UC, Bhat JS, Patil BS, Hossain F. 2015. PlantOmics: The Omics of Plant
Science. In D. Barh, M.S. Khan, E. Davies (Eds.), Springer India. New Delhi
Jiang Y, Fu J. 2000. Ethylene regulation of fruit ripening: Molecular aspects. Plant
Growth Regulation 30: 193–200.
Ji H, Wang Y, Cloix C, Li K, Jenkins GI, Wang S, Shang Z, Shi Y, Yang S, Li X.
2015. The Arabidopsis RCC1 family protein TCF1 regulates freezing tolerance and
cold acclimation through modulating lignin biosynthesis. PLoS Genetics 11: 1–25.
Jin CW, He YF, Tang CX, Wu P, Zheng SJ. 2006. Mechanisms of microbially
enhanced Fe acquisition in red clover (Trifolium pratense L.). Plant, Cell and
Environment 29: 888–897.
Jirage D, Tootle TL, Reuber TL, Frost LN, Feys BJ, Parker JE, Ausubel FM,
Glazebrook J. 1999. Arabidopsis thaliana PAD4 encodes a lipase-like gene that is
important for salicylic acid signaling. Proceedings of the National Academy of
Sciences 96: 13583–13588.
Joo G-J, Kim Y-M, Kim J-T, Rhee I-K, Kim J-H, Lee I-J. 2005. Gibberellins-
producing rhizobacteria increase endogenous gibberellins content and promote
growth of red peppers. Journal of Microbiology 43: 510–515.
Jordan DB, Bacot KO, Carlson TJ, Kessel M, Viitanen P V. 1999. Plant riboflavin
biosynthesis. Cloning, chloroplast localization, expression, purification, and partial
characterization of spinach lumazine synthase. Journal of Biological Chemistry 274:
22114–21.
Joung J-G, Corbett AM, Fellman SM, Tieman DM, Klee HJ, Giovannoni JJ, Fei
Z. 2009. Plant MetGenMAP: an integrative analysis system for plant systems biology.
Plant Physiology 151: 1758–68.
Ju C, Chang C. 2012. Advances in ethylene signalling: protein complexes at the
endoplasmic reticulum membrane. AoB plants 2012: pls031.
Jung HW, Lim CW, Hwang BK. 2006. Isolation and functional analysis of a pepper
lipid transfer protein III (CALTPIII) gene promoter during signaling to pathogen,
abiotic and environmental stresses. Plant Science 170: 258–266.
Jung J-Y, Shin R, Schachtman DP. 2009. Ethylene mediates response and tolerance
to potassium deprivation in Arabidopsis. The Plant Cell 21: 607–621.
Kamilova F, Validov S, Azarova T, Mulders I, Lugtenberg B. 2005. Enrichment
for enhanced competitive plant root tip colonizers selects for a new class of biocontrol
bacteria. Environmental Microbiology 7: 1809–1817.
Karasov T, Chae E, Herman J, Bergelson J. 2017. Mechanisms to mitigate the
tradeoff between growth and defense. The Plant Cell: tpc.00931.2016.
Kataya A, Reumann S. 2010. Arabidopsis glutathione reductase 1 is dually targeted
to peroxisomes and the cytosol. Plant Signaling & Behavior 5: 171–175.
Kende H. 1993. Ethylene Biosynthesis. Annual Review of Plant Physiology and Plant
Molecular Biology 44: 283–307.
Kende H, Boller T. 1981. Wound ethylene and 1-aminocyclopropane-1-carboxylate
synthase in ripening tomato fruit. Planta 151: 476–481.
Kende H, Knaap E van der, Cho H-TH. 1998. Deepwater rice: a model plant to
study stem elongation. Plant Physiology 118: 1105–1110.
295
References
Kevany BM, Tieman DM, Taylor MG, Cin VD, Klee HJ. 2007. Ethylene receptor
degradation controls the timing of ripening in tomato fruit. Plant Journal 51: 458–
467.
Khan NA. 2002. Activities of carbonic anhydrase and ribulose-1,5-bisphosphate
carboxylase, and dry mass accumulation in Brassica juncea following defoliation.
Photosynthetica 40: 633–634.
Khan NA, Javid S, Samiullah. 2004. Physiological role of carbonic anhydrase in
CO2 fixation and carbon partitioning. Physiology and Molecular Biology of Plants 10:
153–166.
Kiba T, Krapp A. 2016. Plant nitrogen acquisition under low availability: regulation
of uptake and root architecture. Plant and Cell Physiology 57: 707–714.
Kibblewhite MG, Ritz K, Swift MJ. 2008. Soil health in agricultural systems.
Philosophical transactions of the Royal Society of London. Series B, Biological
sciences 363: 685–701.
Kieber JJ, Rothenberg M, Roman G, Feldmann KA, Ecker JR. 1993. CTR1, a
negative regulator of the ethylene response pathway in arabidopsis, encodes a
member of the Raf family of protein kinases. Cell 72: 427–441.
Kim YC, Jung H, Kim KY, Park SK. 2008a. An effective biocontrol
bioformulation against Phytophthora blight of pepper using growth mixtures of
combined chitinolytic bacteria under different field conditions. European Journal of
Plant Pathology 120: 373–382.
Kim H-J, Lynch JP, Brown KM. 2008b. Ethylene insensitivity impedes a subset of
responses to phosphorus deficiency in tomato and petunia. Plant, Cell and
Environment 31: 1744–55.
Klee HJ, Hayford MB, Kretzmer K a, Barry GF, Kishore GM. 1991. Control of
ethylene synthesis by expression of a bacterial enzyme in transgenic tomato plants.
The Plant cell 3: 1187–1193.
Kloepper JW, Leong J, Teintze M, Schroth MN. 1980. Enhanced plant growth by
siderophores produced by plant growth-promoting rhizobacteria. Nature 286: 885–
886.
Kloepper J, Schroth M. 1978. Plant growth-promoting rhizobacteria on radishes.
Proceedings of the 4th International Conference on Plant Pathogenic Bacteria: 879–
882.
Knoester M, Linthorst HJ., Bol JF, van Loon L. 1997. Modulation of stress-
inducible ethylene biosynthesis by sense and antisense gene expression in tobacco.
Plant Science 126: 173–183.
Koenig D, Jiménez-Gómez JM, Kimura S, Fulop D, Chitwood DH, Headland
LR, Kumar R, Covington MF, Devisetty UK, Tat A V, et al. 2013. Comparative
transcriptomics reveals patterns of selection in domesticated and wild tomato.
Proceedings of the National Academy of Sciences of the United States of America
110: E2655-62.
Komatsu S, Konishi H, Hashimoto M. 2007. The proteomics of plant cell
membranes. Journal of Experimental Botany 58: 103–112.
Koornneef M, Meinke D. 2010. The development of Arabidopsis as a model plant.
Plant Journal 61: 909–921.
Krinke O, Novotná Z, Valentová O, Martinec J. 2007. Inositol trisphosphate
receptor in higher plants: is it real? Journal of Experimental Botany 58: 361–376.
Krouk G, Ruffel S, Gutiérrez RA, Gojon A, Crawford NM, Coruzzi GM,
Lacombe B. 2011. A framework integrating plant growth with hormones and
nutrients. Trends in Plant Science 16: 178–182.

296
References
Kuan KB, Othman R, Abdul Rahim K, Shamsuddin ZH. 2016. Plant growth-
promoting rhizobacteria inoculation to enhance vegetative growth, nitrogen fixation
and nitrogen remobilisation of maize under greenhouse conditions. PLoS ONE 11:
e0152478.
Kumar V, Narula N. 1999. Solubilization of inorganic phosphates and growth
emergence of wheat as affected by Azotobacter chroococcum mutants. Biology and
Fertility of Soils 28: 301–305.
Kumar R, Tran LSP, Neelakandan AK, Nguyen HT. 2012. Higher plant
cytochrome b5 polypeptides modulate fatty acid desaturation. PLoS ONE 7: e31370.
Kwak SH, Lee SH. 1997. The requirements for Ca2+
, protein phosphorylation, and
dephosphorylation for ethylene signal transduction in Pisum sativum L. Plant and
Cell Physiology 38: 1142–9.
Kwon YS, Lee DY, Rakwal R, Baek SB, Lee JH, Kwak YS, Seo JS, Chung WS,
Bae DW, Kim SG. 2016. Proteomic analyses of the interaction between the plant-
growth promoting rhizobacterium Paenibacillus polymyxa E681 and Arabidopsis
thaliana. Proteomics 16: 122–135.
De La Torre F, Cañas RA, Pascual MB, Avila C, Cánovas FM. 2014. Plastidic
aspartate aminotransferases and the biosynthesis of essential amino acids in plants.
Journal of Experimental Botany 65: 5527–5534.
Lai WA, Rekha PD, Arun AB, Young CC. 2008. Effect of mineral fertilizer, pig
manure, and Azospirillum rugosum on growth and nutrient contents of Lactuca sativa
L. Biology and Fertility of Soils 45: 155–164.
Laing WA, Wright MA, Cooney J, Bulley SM. 2007. The missing step of the L-
galactose pathway of ascorbate biosynthesis in plants, an L-galactose
guanyltransferase, increases leaf ascorbate content. Proceedings of the National
Academy of Sciences 104: 9534–9539.
Lamb D, Erskine PD, Parrotta JA. 2005. Restoration of degraded tropical forest
landscapes. Science 310: 1628–1632.
Lambers H, Mougel C, Jaillard B, Hinsinger P. 2009. Plant-microbe-soil
interactions in the rhizosphere: an evolutionary perspective. Plant and Soil 321: 83–
115.
Lanahan MB, Yen HC, Giovannoni JJ, Klee HJ. 1994. The never ripe mutation
blocks ethylene perception in tomato. The Plant cell 6: 521–30.
Lang C, Long SR. 2015. Transcriptomic analysis of Sinorhizobium meliloti and
Medicago truncatula symbiosis using nitrogen fixation deficient nodules. Molecular
Plant-Microbe Interactions 28: 1–43.
Lardi M, Murset V, Fischer HM, Mesa S, Ahrens CH, Zamboni N, Pessi G. 2016.
Metabolomic profiling of Bradyrhizobium diazoefficiens-induced root nodules reveals
both host plant-specific and developmental signatures. International Journal of
Molecular Sciences 17: 815.
Lashbrook CC, Tieman DM, Klee HJ. 1998. Differential regulation of the tomato
ETR gene family throughout plant development. Plant Journal 15: 243–252.
Latowski D, Kuczyńska P, Strzałka K. 2011. Xanthophyll cycle – a mechanism
protecting plants against oxidative stress. Redox Report 16: 78–90.
Lau JA, Lennon JT. 2011. Evolutionary ecology of plant-microbe interactions: soil
microbial structure alters selection on plant traits. New Phytologist 192: 215–224.
Lau O-LL, Yang SF. 1976. Stimulation of ethylene production in the mung bean
hypocotyls by cupric ion, calcium ion, and kinetin. Plant Physiology 57: 88–92.

297
References
Lawlor DW. 2002. Carbon and nitrogen assimilation in relation to yield: mechanisms
are the key to understanding production systems. Journal of Experimental Botany 53:
773–787.
Lea PJ, Miflin BJ. 2010. Nitrogen assimilation and its relevance to crop
improvement. Annual Plant Reviews. 42:1–40.
Leborgne-Castel N., Bouhidel K. 2014. Plasma membrane protein trafficking in
plant-microbe interactions: a plant cell point of view. Frontiers in Plant Science 5:
735.
Lechner E, Achard P, Vansiri A, Potuschak T, Genschik P. 2006. F-box proteins
everywhere. Current Opinion in Plant Biology 9: 631–638.
Leclercq J, Adams-Phillips LC, Zegzouti H, Jones B, Latché A, Giovannoni JJ,
Pech J-C, Bouzayen M. 2002. LeCTR1, a tomato CTR1-like gene, demonstrates
ethylene signaling ability in Arabidopsis and novel expression patterns in tomato.
Plant Physiology 130: 1132–1142.
Lee E-J, Facchini PJ. 2011. Tyrosine aminotransferase contributes to
benzylisoquinoline alkaloid biosynthesis in opium poppy. Plant Physiology 157:
1067–1078.
Lee SH, Reid DM. 1997. The role of endogenous ethylene in the expansion of
Helianthus annuus leaves. Canadian Journal of Botany 75: 501–508.
Leferink NGH, Van Den Berg WAM, Van Berkel WJH. 2008. L-Galactono-
gamma-lactone dehydrogenase from Arabidopsis thaliana, a flavoprotein involved in
vitamin C biosynthesis. FEBS Journal 275: 713–726.
Lei M, Zhu C, Liu Y, Karthikeyan AS, Bressan RA, Raghothama KG, Liu D.
2011. Ethylene signalling is involved in regulation of phosphate starvation-induced
gene expression and production of acid phosphatases and anthocyanin in Arabidopsis.
New Phytologist 189: 1084–1095.
León P, Sheen J. 2003. Sugar and hormone connections. Trends in Plant Science 8:
110–116.
Lezhneva L, Kiba T, Feria-Bourrellier AB, Lafouge F, Boutet-Mercey S, Zoufan
P, Sakakibara H, Daniel-Vedele F, Krapp A. 2014. The Arabidopsis nitrate
transporter NRT2.5 plays a role in nitrate acquisition and remobilization in nitrogen-
starved plants. Plant Journal 80: 230–241.
Li J, Bi F-C, Yin J, Wu J-LJ-X, Rong C, Wu J-LJ-X, Yao N. 2015. An
Arabidopsis neutral ceramidase mutant ncer1 accumulates hydroxyceramides and is
sensitive to oxidative stress. Frontiers in Plant Science 6: 460.
Li HQ, Jiang XW. 2017. Inoculation with plant growth-promoting bacteria (PGPB)
improves salt tolerance of maize seedling. Russian Journal of Plant Physiology 64:
235–241.
Li Y-S, Mao X-T, Tian Q-Y, Li L-H, Zhang W-H. 2009. Phosphorus deficiency-
induced reduction in root hydraulic conductivity in Medicago falcata is associated
with ethylene production. Environmental and Experimental Botany 67: 172–177.
Li J, Ovakim DH, Charles TC, Glick BR. 2000a. An ACC deaminase minus mutant
of Enterobacter cloacae UW4 no longer promotes root elongation. Current
Microbiology 41: 101–5.
Li J, Yi XL, Rong XZ. 2000b. Study on the variation of photosynthetic electron
transport activity and photosynthetic enzyme activity during maturation and
senescence of tobacco (Nicotiana tabacum L.) leaves. Journal of Huazhong
Agricultural University 19: 533–536.
Lichtenthaler HK. 1987. Chlorophylls and carotenoids: pigments of photosynthetic
biomembranes. Methods in Enzymology 148: 350–382.
298
References
Lingam S, Mohrbacher J, Brumbarova T, Potuschak T, Fink-Straube C,
Blondet E, Genschik P, Bauer P. 2011. Interaction between the bHLH transcription
factor FIT and ETHYLENE INSENSITIVE3/ETHYLENE INSENSITIVE3-LIKE1
reveals molecular linkage between the regulation of iron acquisition and ethylene
signaling in Arabidopsis. The Plant Cell 23: 1815–1829.
Liu C, Muchhal US, Uthappa M, Kononowicz AK, Raghothama KG. 1998.
Tomato phosphate transporter genes are differentially regulated in plant tissues by
phosphorus. Plant Physiology 116: 91–99.
Liu F, Zhang X, Lu C, Zeng X, Li Y, Fu D, Wu G. 2015. Non-specific lipid
transfer proteins in plants: presenting new advances and an integrated functional
analysis. Journal of Experimental Botany 66: 5663–5681.
Livak KJ, Schmittgen TD. 2001. Analysis of relative gene expression data using
real-time quantitative PCR and the 2(-Delta Delta C(T)) Method. Methods 25: 402–
408.
Lodish H, Berk A, Zipursky S, Matsudaira P, Baltimore D, and Darnell J. 2000.
Osmosis, water channels, and the regulation of cell volume. Molecular Cell Biology.
W. H. Freeman Publishers, New York.
Long HH, Schmidt DD, Baldwin IT. 2008. Native bacterial endophytes promote
host growth in a species-specific manner; phytohormone manipulations do not result
in common growth responses. PLoS ONE 3: e2702.
Van Loon LC, Bakker PAHM, Van Der Heijdt WHW, Wendehenne D, Pugin A.
2008. Early responses of tobacco suspension cells to rhizobacterial elicitors of
induced systemic resistance. Molecular Plant-Microbe Interactions 21: 1609–1621.
Van Loon LC, Bakker PAHM, Pieterse CMJ. 1998. Systemic resistances induced
by rhizosphere bacteria induction of resistance in plants. Annual Review
Phytopathology 36: 453–83.
Van Loon LC, Geraats BPJ, Linthorst HJM. 2006. Ethylene as a modulator of
disease resistance in plants. Trends in Plant Science 11: 184–191.
Loper JE, Buyer JS. 1991. Siderophore in microbial interaction on plant surface.
Molecular Plant-Microbe Interaction 4: 5–13.
López-Bucio J, Campos-Cuevas JC, Hernández-Calderón E, Velásquez-Becerra
C, Farías-Rodríguez R, Macías-Rodríguez LI, Valencia-Cantero E. 2007. Bacillus
megaterium rhizobacteria promote growth and alter root-system architecture through
an auxin- and ethylene-independent signaling mechanism in Arabidopsis thaliana.
Molecular Plant-Microbe Interactions 20: 207–17.
López-Bucio J, Hernández-Abreu E, Sánchez-Calderón L, Nieto-Jacobo MF,
Simpson J, Herrera-Estrella L. 2002. Phosphate availability alters architecture and
causes changes in hormone sensitivity in the Arabidopsis root system. Plant
Physiology 129: 244–256.
Lorenzo O, Chico JM, Sánchez-Serrano JJ, Solano R. 2004. JASMONATE-
INSENSITIVE1 encodes a MYC transcription factor essential to discriminate
between different jasmonate-regulated defense responses in Arabidopsis. The Plant
Cell 16: 1938–50.
Lucena C, Waters BM, Romera FJ, García MJ, Morales M, Alcántara E, Pérez-
Vicente R. 2006. Ethylene could influence ferric reductase, iron transporter, and H +-
ATPase gene expression by affecting FER (or FER-like) gene activity. Journal of
Experimental Botany 57: 4145–4154.
Lucy M, Reed E, Glick BR. 2004. Applications of free living plant growth-
promoting rhizobacteria. Antonie van Leeuwenhoek 86: 1–25.
299
References
Lugtenberg B, Kamilova F. 2009. Plant-growth-promoting rhizobacteria. Annual
Review of Microbiology 63: 541–56.
Lynch JP. 2011. Root phenes for enhanced soil exploration and phosphorus
acquisition: tools for future crops. Plant Physiology 156: 1041–1049.
Lynch JP, Brown KM. 1997. Ethylene and plant responses to nutritional stress.
Physiologia Plantarum 100: 613–619.
Lyzenga WJ, Booth JK, Stone SL. 2012. The Arabidopsis RING-type E3 ligase
XBAT32 mediates the proteasomal degradation of the ethylene biosynthetic enzyme,
1-aminocyclopropane-1-carboxylate synthase 7. Plant Journal 71: 23–34.
Ma JF. 2005. Plant root responses to three abundant soil minerals: silicon, aluminum
and iron. Critical Reviews in Plant Sciences 24: 267–281.
Ma W, Charles TC, Glick BR. 2004. Expression of an exogenous 1-
aminocyclopropane-1-carboxylate deaminase gene in Sinorhizobium meliloti
increases its ability to nodulate alfalfa. Applied and Environmental Microbiology 70:
5891–5897.
Ma Q, Du W, Brandizzi F, Giovannoni JJ, Barry CS. 2012. Differential control of
ethylene responses by GREEN-RIPE and GREEN-RIPE LIKE1 provides evidence for
distinct ethylene signaling modules in tomato. Plant Physiology 160: 1968-1984.
Ma JF, Yamaji N. 2008. Functions and transport of silicon in plants. Cellular and
Molecular Life Sciences 65: 3049–3057.
Ma B, Yin CC, He SJ, Lu X, Zhang WK, Lu TG, Chen SY, Zhang JS. 2014.
Ethylene-induced inhibition of root growth requires abscisic acid function in rice
(Oryza sativa L.) seedlings. PLoS Genetics 10: e1004701.
Madhaiyan M, Poonguzhali S, Ryu J, Sa T. 2006. Regulation of ethylene levels in
canola (Brassica campestris) by 1-aminocyclopropane-1-carboxylate deaminase-
containing Methylobacterium fujisawaense. Planta 224: 268–278.
Maillet F, Poinsot V, André O, Puech-Pagès V, Haouy A, Gueunier M, Cromer
L, Giraudet D, Formey D, Niebel A, et al. 2011. Fungal lipochitooligosaccharide
symbiotic signals in arbuscular mycorrhiza. Nature 469: 58–63.
Maksymiec W. 2007. Signaling responses in plants to heavy metal stress. Acta
Physiologiae Plantarum 29: 177–187.
Malakoff D. 1998. Death by suffocation in the Gulf of Mexico. Science 281: 190.
Mann M, Hendrickson RC, Pandey A. 2001. Analysis of proteins and proteomes by
mass spectrometry. Annual Review of Biochemistry 70: 437–473.
Mantelin S, Touraine B. 2004. Plant growth-promoting bacteria and nitrate
availability: impacts on root development and nitrate uptake. Journal of Experimental
Botany 55: 27–34.
Mao D, Chen J, Tian L, Liu Z, Yang L, Tang R, Li J, Lu C, Yang Y, Shi J, et al. 2014. Arabidopsis transporter MGT6 mediates magnesium uptake and is required for
growth under magnesium limitation. Plant Cell 26: 2234–2248.
Marone D, Russo MA, Laidò G, De Leonardis AM, Mastrangelo AM. 2013. Plant
nucleotide binding site-leucine-rich repeat (NBS-LRR) genes: active guardians in host
defense responses. International Journal of Molecular Sciences 14: 7302–26.
Martin F, Kohler A, Murat C, Veneault-Fourrey C, Hibbett DS. 2016. Unearthing
the roots of ectomycorrhizal symbioses. Nature Reviews Microbiology 14: 760–773.
Martínez-Fábregas J, Díaz-Moreno I, González-Arzola K, Janocha S, Navarro
JA, Hervás M, Bernhardt R, Díaz-Quintana A, De la Rosa MÁ. 2013. New
Arabidopsis thaliana cytochrome c partners: a look into the elusive role of
cytochrome c in programmed cell death in plants. Molecular & Cellular Proteomics
12: 3666–76.

300
References
Martínez-Viveros O, Jorquera M., Crowley D., Gajardo G, Mora M. 2010.
Mechanisms and practical considerations involved in plant growth promotion by
rhizobacteria. Journal of Soil Science and Plant Nutrition 10: 293–319.
Marulanda-Aguirre A, Azcón R, Ruiz-Lozano JM, Aroca R. 2008. Differential
effects of a Bacillus megaterium strain on Lactuca sativa plant growth depending on
the origin of the arbuscular mycorrhizal fungus coinoculated: physiologic and
biochemical traits. Journal of Plant Growth Regulation 27: 10–8.
Marulanda A, Azcón R, Chaumont F, Ruiz-Lozano JM, Aroca R. 2010.
Regulation of plasma membrane aquaporins by inoculation with a Bacillus
megaterium strain in maize (Zea mays L.) plants under unstressed and salt-stressed
conditions. Planta 232: 533–43.
Marulanda A, Barea JM, Azcón R. 2009. Stimulation of plant growth and drought
tolerance by native microorganisms (AM fungi and bacteria) from dry environments:
mechanisms related to bacterial effectiveness. Journal of Plant Growth Regulation
28: 115–24.
Mathesius U. 2009. Comparative proteomic studies of root-microbe interactions.
Journal of Proteomics 72: 353–366.
Matsuda J, Okabe S, Hashimoto T, Yamada Y. 1991. Molecular cloning of
hyoscyamine 6 beta-hydroxylase, a 2-oxoglutarate-dependent dioxygenase, from
cultured roots of Hyoscyamus niger. Journal of Biological Chemistry 266: 9460–
9464.
Maurel C, Verdoucq L, Luu D-T, Santoni V. 2008. Plant aquaporins: membrane
channels with multiple integrated functions. Annual Review of Plant Biology 59: 595–
624.
Mavrodi D V, Joe A, Mavrodi O V, Hassan KA, Weller DM, Paulsen IT, Loper
JE, Alfano JR, Thomashow LS. 2011. Structural and functional analysis of the type
III secretion system from Pseudomonas fluorescens Q8r1-96. Journal of Bacteriology
193: 177–189.
Mayak S, Tirosh T, Glick BR. 2004a. Plant growth-promoting bacteria that confer
resistance to water stress in tomatoes and peppers. Plant Science 166: 525–530.
Mayak S, Tirosh T, Glick BR. 2004b. Plant growth-promoting bacteria confer
resistance in tomato plants to salt stress. Plant Physiology and Biochemistry 42: 565–
72.
Mazurier S, Corberand T, Lemanceau P, Raaijmakers JM. 2009. Phenazine
antibiotics produced by fluorescent pseudomonads contribute to natural soil
suppressiveness to Fusarium wilt. ISME Journal 3: 977–991.
McClellan CA, Chang C. 2008. The role of protein turnover in ethylene biosynthesis
and response. Plant Science 175: 24–31.
McConn M, Browse J. 1998. Polyunsaturated membranes are required for
photosynthetic competence in a mutant of Arabidopsis. Plant Journal 15: 521–530.
McHale L, Tan X, Koehl P, Michelmore RW, Jones D, Jones J, Ellis J, Dodds P,
Pryor T, Meyers B, et al. 2006. Plant NBS-LRR proteins: adaptable guards. Genome
Biology 7: 212.
Mehlhorn H, Wenzel AA. 1996. Manganese deficiency enhances ozone toxicity in
bush beans (Phaseolus vulgaris L. cv. Saxa). Journal of Plant Physiology 148: 155–
159.
Mehta A, Brasileiro ACM, Souza DSL, Romano E, Campos MA, Grossi-De-Sá
MF, Silva MS, Franco OL, Fragoso RR, Bevitori R, et al. 2008. Plant-pathogen
interactions: what is proteomics telling us? FEBS Journal 275: 3731–3746.

301
References
Meldau DG, Long HH, Baldwin IT. 2012. A native plant growth promoting
bacterium, Bacillus sp. B55, rescues growth performance of an ethylene-insensitive
plant genotype in nature. Frontiers in Plant Science 3: 1–13.
Merchante C, Alonso JM, Stepanova AN. 2013. Ethylene signaling: simple ligand,
complex regulation. Current Opinion in Plant Biology 16: 554–60.
Mhamdi A, Hager J, Chaouch S, Queval G, Han Y, Taconnat L, Saindrenan P,
Gouia H, Issakidis-Bourguet E, Renou J-P, et al. 2010. Arabidopsis glutathione
reductase1 plays a crucial role in leaf responses to intracellular hydrogen peroxide
and in ensuring appropriate gene expression through both salicylic acid and jasmonic
acid signaling pathways. Plant Physiology 153: 1144–1160.
Miché L, Battistoni F, Gemmer S, Belghazi M, Reinhold-Hurek B. 2006.
Upregulation of jasmonate-inducible defense proteins and differential colonization of
roots of Oryza sativa cultivars with the endophyte Azoarcus sp. Molecular Plant-
Microbe Interactions 19: 502–511.
Mierziak J, Kostyn K, Kulma A. 2014. Flavonoids as important molecules of plant
interactions with the environment. Molecules 19: 16240–16265.
Miethke M, Marahiel MA. 2007. Siderophore-based iron acquisition and pathogen
control. Microbiology and Molecular Biology Reviews 71: 413–451.
Millet YA, Danna CH, Clay NK, Songnuan W, Simon MD, Werck-Reichhart D,
Ausubel FM. 2010. Innate immune responses activated in Arabidopsis roots by
microbe-associated molecular patterns. The Plant Cell 22: 973–990.
Mishina TE, Zeier J. 2007. Bacterial non-host resistance: interactions of Arabidopsis
with non-adapted Pseudomonas syringae strains. Physiologia Plantarum 131: 448–
461.
Misra AK. 2014. Climate change and challenges of water and food security.
International Journal of Sustainable Built Environment 3: 153–165.
Mittler R. 2002. Oxidative stress, antioxidants and stress tolerance. Trends in Plant
Science 7: 405–410.
Miyazaki JH, Yang SF. 1987. The methionine salvage pathway in relation to
ethylene and polyamine biosynthesis. Physiologia Plantarum 69: 366–370.
Mizuguchi G, Shen X, Landry J, Wu W-H, Sen S, Wu C. 2004. ATP-driven
exchange of histone H2AZ variant catalyzed by SWR1 chromatin remodeling
complex. Science 303: 343–348.
Mizutani M. 2012. Impacts of diversification of cytochrome P450 on plant
metabolism. Biological and Pharmaceutical Bulletin 35: 824–832.
Mohite B. 2013. Isolation and characterization of indole acetic acid (IAA) producing
bacteria from rhizospheric soil and its effect on plant growth. Journal of Soil Science
and Plant Nutrition 13: 638–649.
Molina A, García-Olmedo F. 1997. Enhanced tolerance to bacterial pathogens
caused by the transgenic expression of barley lipid transfer protein LTP2. Plant
Journal 12: 669–675.
Molina A, Segura A, García-Olmedo F. 1993. Lipid transfer proteins (nsLTPs)
from barley and maize leaves are potent inhibitors of bacterial and fungal plant
pathogens. FEBS Letters 316: 119–122.
Møller BL, Seigler DS. 1999. Biosynthesis of cyanogenic glycosides, cyanolipids,
and related compounds. Plant Amino Acids. Biochemistry and Biotechnology. 563–
609.
Montesinos E. 2003. Plant-associated microorganisms: a view from the scope of
microbiology. International Microbiology 6: 221–223.

302
References
Morell S, Follmann H, De Tullio M, Häberlein I. 1997. Dehydroascorbate and
dehydroascorbate reductase are phantom indicators of oxidative stress in plants. FEBS
Letters 414: 567–570.
Moreno JI, Martín R, Castresana C. 2004. Arabidopsis SHMT1, a serine
hydroxymethyltransferase that functions in the photorespiratory pathway influences
resistance to biotic and abiotic stress. Plant Journal 41: 451–463.
Morey JS, Ryan JC, Van Dolah FM. 2006. Microarray validation: factors
influencing correlation between oligonucleotide microarrays and real-time PCR.
Biological Procedures Online 8: 175–93.
Van de Mortel JE, De Vos RCH, Dekkers E, Pineda A, Guillod L, Bouwmeester
K, van Loon JJ a., Dicke M, Raaijmakers JM. 2012. Metabolic and transcriptomic
changes induced in Arabidopsis by the rhizobacterium Pseudomonas fluorescens
SS101. Plant Physiology 160: 2173–2188.
Moshkov IE, Mur LAJ, Novikova G V., Smith AR, Hall MA. 2003. Ethylene
regulates monomeric GTP-binding protein gene expression and activity in
Arabidopsis. Plant Physiology 131: 1705–1717.
Mott KA. 1988. Do stomata respond to CO(2) concentrations other than intercellular?
Plant Physiology 86: 200–203.
Muday GK, Rahman A, Binder BM. 2012. Auxin and ethylene: collaborators or
competitors? Trends in Plant Science 17: 181–195.
Mühlenbock P, Szechynska-Hebda M, Plaszczyca M, Baudo M, Mateo A,
Mullineaux PM, Parker JE, Karpinska B, Karpinski S. 2008. Chloroplast
signaling and LESION SIMULATING DISEASE1 regulate crosstalk between light
acclimation and immunity in Arabidopsis. The Plant Cell 20: 2339–56.
Müller M, Munné-Bosch S. 2015. Ethylene response factors: a key regulatory hub in
hormone and stress signaling. Plant Physiology 169: 32–41.
Muneer S, Jeong BR. 2015. Proteomic analysis provides new insights in phosphorus
homeostasis subjected to pi (inorganic phosphate) starvation in tomato plants
(Solanum lycopersicum L.). PLoS ONE 10: e0134103.
Munemasa S, Hauser F, Park J, Waadt R, Brandt B, Schroeder JI. 2015.
Mechanisms of abscisic acid-mediated control of stomatal aperture. Current Opinion
in Plant Biology 28: 154–162.
Munemasa S, Mori IC, Murata Y. 2011. Methyl jasmonate signaling and signal
crosstalk between methyl jasmonate and abscisic acid in guard cells. Plant Signaling
and Behavior 6: 939–941.
Munné-Bosch S, Müller M. 2013. Hormonal cross-talk in plant development and
stress responses. Frontiers in Plant Science 4: 529.
Muñoz-Bertomeu J, Cascales-Miñana B, Mulet JM, Baroja-Fernández E,
Pozueta-Romero J, Kuhn JM, Segura J, Ros R. 2009. Plastidial glyceraldehyde-3-
phosphate dehydrogenase deficiency leads to altered root development and affects the
sugar and amino acid balance in Arabidopsis. Plant Physiology 151: 541–558.
Murphy AS, Peer W, Schulz B. 2011. The Plant Plasma Membrane. In A.S.
Murphy,W. Peer, B. Schulz (Eds.), Springer-Verlag Berlin Heildelberg
Nadeem SM, Ahmad M, Zahir ZA, Javaid A, Ashraf M. 2014. The role of
mycorrhizae and plant growth promoting rhizobacteria (PGPR) in improving crop
productivity under stressful environments. Biotechnology Advances 32: 429–448.
Nakano T, Suzuki K, Fujimura T, Shinshi H. 2006. Genome-wide analysis of the
ERF gene family in arabidopsis and rice. Plant Physiology 140: 411–432.
303
References
Nakatsuka A, Murachi S, Okunishi H, Shiomi S, Nakano R, Kubo Y, Inaba A.
1998. Differential expression and internal feedback regulation of 1-
aminocyclopropane-1-carboxylate synthase, 1-aminocyclopropane-1-carboxylate
oxidase, and ethylene receptor genes in tomato fruit during development and ripening.
Plant Physiology 118: 1295–1305.
Namiki F, Matsunaga M, Okuda M, Inoue I, Nishi K, Fujita Y, Tsuge T. 2001.
Mutation of an arginine biosynthesis gene causes reduced pathogenicity in Fusarium
oxysporum f. sp. melonis. Molecular Plant-Microbe Interactions 14: 580–584.
Nascimento FX, Brígido C, Glick BR, Oliveira S, Alho L. 2012. Mesorhizobium
ciceri LMS-1 expressing an exogenous 1-aminocyclopropane-1-carboxylate (ACC)
deaminase increases its nodulation abilities and chickpea plant resistance to soil
constraints. Letters in Applied Microbiology 55: 15–21.
Nautiyal CS. 1999. An efficient microbiological growth medium for screening
phosphate solubilizing microorganisms. FEMS Microbiology Letters 170: 265–270.
Naylor RL. 1996. Energy and resource constraints on intensive agricultural
production. Annual Review of Energy and the Environment 21: 99–123.
Negi S, Sukumar P, Liu X, Cohen JD, Muday GK. 2010. Genetic dissection of the
role of ethylene in regulating auxin-dependent lateral and adventitious root formation
in tomato. Plant Journal 61: 3–15.
Nelson N, Ben-Shem A. 2004. The complex architecture of oxygenic photosynthesis.
Molecullar and Cell Biology 5: 971–982.
llar A. 2015. Protein turnover in plant biology. Nature Plants 1: 15017.
Nelson DM, Ye X, Hall C, Santos H, Ma T, Kao GD, Yen TJ, Harper JW, Adams
PD. 2002. Coupling of DNA synthesis and histone synthesis in S phase independent
of cyclin/cdk2 activity. Molecular and Cellular Biology 22: 7459–72.
Newman M-A, Sundelin T, Nielsen JT, Erbs G. 2013. MAMP (microbe-associated
molecular pattern) triggered immunity in plants. Frontiers in Plant Science 4: 139.
Noctor G, Foyer CH. 1998. Ascorbate and glutathione: keeping active oxygen under
control. Annual Review of Plant Physiology and Plant Molecular Biology 49: 249–79.
Noctor G, Mhamdi A, Chaouch S, Han Y, Neukermans J, Marquez-Garcia B,
Queval G, Foyer CH. 2012. Glutathione in plants: an integrated overview. Plant,
Cell and Environment 35: 454–484.
O’Farrell PH. 1975. High resolution two-dimensional electrophoresis of proteins.
Journal of Biological Chemistry 250: 4007–4021.
Ogbaga CC, Stepien P, Dyson BC, Rattray NJW, Ellis DI, Goodacre R, Johnson
GN. 2016. Biochemical analyses of sorghum varieties reveal differential responses to
drought. PLoS ONE 11: e0154423.
Oldroyd GED, Harrison MJ, Paszkowski U, Besserer A, Becard G, Jauneau A,
Roux C, Sejalon-Delmas N, Radutoiu S, Kosuta S, et al. 2009. Reprogramming
plant cells for endosymbiosis. Science 324: 753–4.
Olmedo G, Guo H, Gregory BD, Nourizadeh SD, Aguilar-Henonin L, Li H, An
F, Guzman P, Ecker JR. 2006. ETHYLENE-INSENSITIVE5 encodes a 5’-->3’
exoribonuclease required for regulation of the EIN3-targeting F-box proteins EBF1/2.
Proceedings of the National Academy of Sciences of the United States of America
103: 13286–13293.
Onofre-Lemus J, Hernández-Lucas I, Girard L, Caballero-Mellado J. 2009. ACC
(1-aminocyclopropane-1-carboxylate) deaminase activity, a widespread trait in
Burkholderia species, and its growth-promoting effect on tomato plants. Applied and
Environmental Microbiology 75: 6581–6590.

304
References
Ortíz-Castro R, Contreras-Cornejo HA, Macías-Rodríguez L, López-Bucio J.
2009. The role of microbial signals in plant growth and development. Plant Signaling
and Behavior 4: 701–712.
Ortiz N, Armada E, Duque E, Roldán A, Azcón R. 2015. Contribution of
arbuscular mycorrhizal fungi and/or bacteria to enhancing plant drought tolerance
under natural soil conditions: effectiveness of autochthonous or allochthonous strains.
Journal of Plant Physiology 174: 87–96.
Osakabe Y, Yamaguchi-Shinozaki K, Shinozaki K, Tran LSP. 2013. Sensing the
environment: key roles of membrane-localized kinases in plant perception and
response to abiotic stress. Journal of Experimental Botany 64: 445–458.
Osugi A, Sakakibara H. 2015. Q&A: How do plants respond to cytokinins and what
is their importance? BMC Biology 13: 102.
Owttrim GW. 2006. RNA helicases and abiotic stress. Nucleic Acids Research 34:
3220–3230.
Oxborough K, Baker NR. 1997. Resolving chlorophyll a fluorescence images of
photosynthetic efficiency into photochemical and non-photochemical components -
Calculation of qP and Fv’/Fm’ without measuring Fo’. Photosynthesis Research 54:
135–142.
Pan X, Chen Z, Yang X, Liu G. 2014. Arabidopsis voltage-dependent anion channel
1 (AtVDAC1) is required for female development and maintenance of mitochondrial
functions related to energy-transaction. PLoS ONE 9: e106941.
Pan Y, Seymour GB, Lu C, Hu Z, Chen X, Chen G. 2012. An ethylene response
factor (ERF5) promoting adaptation to drought and salt tolerance in tomato. Plant
Cell Reports 31: 349–360.
Pankievicz VCS, Do Amaral FP, Santos KFDN, Agtuca B, Xu Y, Schueller MJ,
Arisi ACM, Steffens MBR, De Souza EM, Pedrosa FO, et al. 2015. Robust
biological nitrogen fixation in a model grass-bacterial association. Plant Journal 81:
907–919.
Pardey PG, Beddow JM, Hurley TM, Beatty TKM, Eidman VR. 2014. A bounds
analysis of world food futures: global agriculture through to 2050. Australian Journal
of Agricultural and Resource Economics 58: 571–589.
Pardo JM, Quintero FJ. 2002. Plants and sodium ions: keeping company with the
enemy. Genome Biology 3: REVIEWS1017.
Pasternak M, Lim B, Wirtz M, Hell R, Cobbett CS, Meyer AJ. 2008. Restricting
glutathione biosynthesis to the cytosol is sufficient for normal plant development.
Plant Journal 53: 999–1012.
Paszkowski U, Kroken S, Roux C, Briggs SP. 2002. Rice phosphate transporters
include an evolutionarily divergent gene specifically activated in arbuscular
mycorrhizal symbiosis. Proceedings of the National Academy of Sciences of the
United States of America 99: 13324–13329.
Patten CL, Glick BR. 2002. Role of Pseudomonas putida indoleacetic acid in
development of the host plant root system. Applied and Environmental Microbiology
68: 3795–3801.
Paul MJ, Pellny TK. 2003. Carbon metabolite feedback regulation of leaf
photosynthesis and development. Journal of Experimental Botany 54: 539–547.
Pearce MMP, Wormer DB, Wilkens S, Wojcikiewicz RJH. 2009. An endoplasmic
reticulum (ER) membrane complex composed of SPFH1 and SPFH2 mediates the
ER-associated degradation of inositol 1,4,5-trisphosphate receptors. Journal of
Biological Chemistry 284: 10433–10445.

305
References
Peiser GD, Wang TT, Hoffman NE, Yang SF, Liu HW, Walsh CT. 1984.
Formation of cyanide from carbon 1 of 1-aminocyclopropane-1-carboxylic acid
during its conversion to ethylene. Proceedings of the National Academy of Sciences of
the United States of America 81: 3059–63.
Penrose DM, Glick BR. 2001. Levels of ACC and related compounds in exudate and
extracts of canola seeds treated with ACC deaminase-containing plant growth-
promoting bacteria. Canadian Journal of Microbiology 47: 368–372.
Penrose DM, Glick BR. 2003. Methods for isolating and characterizing ACC
deaminase-containing plant growth-promoting rhizobacteria. Physiologia Plantarum
118: 10–15.
Pervez MA, Ayub CM, Khan HA, Shahid MA, Ashraf I. 2009. Effect of drought
stress on growth, yield and seed quality of tomato (Lycopersicon esculentum L .).
Pakistan Journal of Agricultural Science 46: 174–178.
Pesaresi P, Varotto C, Meurer J, Jahns P, Salamini F, Leister D. 2001. Knock-out
of the plastid ribosomal protein L11 in Arabidopsis: effects on mRNA translation and
photosynthesis. Plant Journal 27: 179–189.
Philippot L, Raaijmakers JM, Lemanceau P, van der Putten WH. 2013. Going
back to the roots: the microbial ecology of the rhizosphere. Nature Reviews
Microbiology 11: 789–799.
Phukan UJ, Jeena GS, Tripathi V, Shukla RK. 2017. Regulation of
Apetala2/Ethylene Response Factors in Plants. Frontiers in Plant Science 8: 150.
Picotti P. 2015. Phosphoproteomics takes it easy. Nature Biotechnology 33: 929–30.
Pierik R, Sasidharan R, Voesenek LACJ. 2007. Growth control by ethylene:
adjusting phenotypes to the environment. Journal of Plant Growth Regulation 26:
188–200.
Pierik R, Tholen D, Poorter H, Visser EJW, Voesenek L a CJ. 2006. The janus
face of ethylene: growth inhibition and stimulation. Trends in Plant Science 11: 176–
83.
Pierik R, Verkerke W, Voesenek R, Blom K, Visser EJW. 1999. Thick root
syndrome in cucumber (Cucumis sativus L.): a description of the phenomenon and an
investigation of the role of ethylene. Annals of Botany 84: 755–762.
Pierik R, Visser EJW, De Kroon H, Voesenek LACJ. 2003. Ethylene is required in
tobacco to successfully compete with proximate neighbours. Plant, Cell and
Environment 26: 1229–1234.
Pierik R, Whitelam GC, Voesenek LACJ, de Kroon H, Visser EJW. 2004.
Canopy studies on ethylene-insensitive tobacco identify ethylene as a novel element
in blue light and plant-plant signalling. Plant Journal 38: 310–319.
Pieterse CMJ, Van der Does D, Zamioudis C, Leon-Reyes A, Van Wees SCM.
2012. Hormonal modulation of plant immunity. Annual Review of Cell and
Developmental Biology 28: 489–521.
Pieterse CMJ, Leon-Reyes A, Van der Ent S, Van Wees SCM. 2009. Networking
by small-molecule hormones in plant immunity. Nature Chemical Biology 5: 308–
316.
Pieterse CMJ, Zamioudis C, Berendsen RL, Weller DM, Van Wees SCM,
Bakker PAHM. 2014. Induced systemic resistance by beneficial microbes. Annual
Review of Phytopathology 52: 347–375.
Pii Y, Mimmo T, Tomasi N, Terzano R, Cesco S, Crecchio C. 2015. Microbial
interactions in the rhizosphere: beneficial influences of plant growth-promoting
rhizobacteria on nutrient acquisition process. A review. Biology and Fertility of Soils
51: 403–415.
306
References
Pirrello J, Jaimes-Miranda F, Sanchez-Ballesta MT, Tournier B, Khalil-Ahmad
Q, Regad F, Latché A, Pech JC, Bouzayen M. 2006. Sl-ERF2, a tomato ethylene
response factor involved in ethylene response and seed germination. Plant and Cell
Physiology 47: 1195–1205.
Pirrello J, Prasad N, Zhang W, Chen K, Mila I, Zouine M, Latche A, Pech J-C,
Ohme-Takagi M, Regad F, et al. 2012. Functional analysis and binding affinity of
tomato ethylene response factors provide insight on the molecular bases of plant
differential responses to ethylene. BMC Plant Biology 12: 190.
Van de Poel B, Smet D, Van Der Straeten D. 2015. Ethylene and hormonal cross
talk in vegetative growth and development. Plant Physiology 169: 61–72.
Van de Poel B, Van Der Straeten D. 2014. 1-aminocyclopropane-1-carboxylic acid
(ACC) in plants: more than just the precursor of ethylene! Frontiers in Plant Science
5: 640.
Poorter H. 2002. Plant Growth and Carbon Economy. Encyclopidia of Life Sciences:
1–6.
Porcel R, Zamarreño ÁM, García-Mina JM, Aroca R. 2014. Involvement of plant
endogenous ABA in Bacillus megaterium PGPR activity in tomato plants. BMC Plant
Biology 14: 36.
Potuschak T, Lechner E, Parmentier Y, Yanagisawa S, Grava S, Koncz C,
Genschik P. 2003. EIN3-dependent regulation of plant ethylene hormone signaling
by two Arabidopsis F box proteins: EBF1 and EBF2. Cell 115: 679–689.
Potuschak T, Vansiri A, Binder BM, Lechner E, Vierstra RD, Genschik P. 2006.
The exoribonuclease XRN4 is a component of the ethylene response pathway in
Arabidopsis. The Plant Cell 18: 3047–57.
Price GD, von Caemmerer S, Evans JR, Yu JW, Lloyd J, Oja V, Kell P,
Harrison K, Gallagher A, Badger MR. 1994. Specific reduction of chloroplast
carbonic anhydrase activity by antisense RNA in transgenic tobacco plants has a
minor effect on photosynthetic CO2 assimilation. Planta 193: 331–340.
Prins A, Orr DJ, Andralojc PJ, Reynolds MP, Carmo-Silva E, Parry MAJ. 2016.
Rubisco catalytic properties of wild and domesticated relatives provide scope for
improving wheat photosynthesis. Journal of Experimental Botany 67: 1827–1838.
Pühler A, Arlat M, Becker A, Göttfert M, Morrissey JP, O’Gara F. 2004. What
can bacterial genome research teach us about bacteria–plant interactions? Current
Opinion in Plant Biology 7: 137–147.
Qiao H, Chang KN, Yazaki J, Ecker JR. 2009. Interplay between ethylene,
ETP1/ETP2 F-box proteins, and degradation of EIN2 triggers ethylene responses in
Arabidopsis. Genes and Development 23: 512–521.
Qin C, Li Y, Gan J, Wang W, Zhang H, Liu Y, Wu P. 2013. OsDGL1, a homolog
of an oligosaccharyltransferase complex subunit, is involved in N-glycosylation and
root development in rice. Plant and Cell Physiology 54: 129–137.
Qiu D, Diretto G, Tavarza R, Giuliano G. 2007. Improved protocol for
Agrobacterium mediated transformation of tomato and production of transgenic plants
containing carotenoid biosynthetic gene CsZCD. Scientia Horticulturae 112: 172–
175.
Qiu L, Xie F, Yu J, Wen C-K. 2012. Arabidopsis RTE1 is essential to ethylene
receptor ETR1 amino-terminal signaling independent of CTR1. Plant Physiology 159:
1263–76.
Quiroga M, Guerrero C, Botella MA, Barceló A, Amaya I, Medina MI, Alonso
FJ, de Forchetti SM, Tigier H, Valpuesta V. 2000. A tomato peroxidase involved in
the synthesis of lignin and suberin. Plant Physiology 122: 1119–27.
307
References
Rabalais NN, Turner RE, Wiseman WJ. 2002. Gulf of Mexico Hypoxia, a.k.a.
‘The Dead Zone’. Annual Review of Ecology and Systematics 33: 235–263.
Raghothama KG, Karthikeyan AS. 2005. Phosphate acquisition. Plant and Soil
274: 37–49.
Reissmann S, Hochleitner E, Wang H, Paschos A, Lottspeich F, Glass RS, Böck
A. 2003. Taming of a poison: biosynthesis of the NiFe-hydrogenase cyanide ligands.
Science 299: 1067–1070.
Resnick JS, Rivarola M, Chang C. 2008. Involvement of RTE1 in conformational
changes promoting ETR1 ethylene receptor signaling in Arabidopsis. Plant Journal
56: 423–431.
Resnick JSJ, Wen CC-K, Shockey JA, Chang C. 2006. REVERSION-TO-
ETHYLENE SENSITIVITY1, a conserved gene that regulates ethylene receptor
function in Arabidopsis. Proceedings of the National Academy of Sciences of the
United States of America 103: 7917–7922.
Richardson AD, Duigan SP, Berlyn GP. 2002. An evaluation of noninvasive
methods to estimate foliar chlorophyll content. New Phytologist 153: 185–194.
Riechmann JL, Heard J, Martin G, Reuber L, Jiang C-Z, Keddie J, Adam L,
Pineda O, Ratcliffe OJ, Samaha RR, et al. 2000. Arabidopsis transcription factors:
genome-wide comparative analysis among eukaryotes. Science 290: 2105–2110.
De Rienzo F, Gabdoulline RR, Menziani MC, Wade RC, Rienzo FDE,
Gabdoulline RR, Menziani MC, Wade RC. 2000. Blue copper proteins: a
comparative analysis of their molecular interaction properties. Protein Science 9:
1439–1454.
Rietz S, Stamm A, Malonek S, Wagner S, Becker D, Medina-Escobar N, Corina
Vlot A, Feys BJ, Niefind K, Parker JE. 2011. Different roles of Enhanced Disease
Susceptibility1 (EDS1) bound to and dissociated from Phytoalexin Deficient4 (PAD4)
in Arabidopsis immunity. New Phytologist 191: 107–119.
Rivas-San Vicente M, Plasencia J. 2011. Salicylic acid beyond defence: its role in
plant growth and development. Journal of Experimental Botany 62: 3321–3338.
Rivero J, Gamir J, Aroca R, Pozo MJ, Flors V. 2015. Metabolic transition in
mycorrhizal tomato roots. Frontiers in Microbiology 6: 598.
Robert-Seilaniantz A, Grant M, Jones JDG. 2011. Hormone crosstalk in plant
disease and defense: more than just JASMONATE-SALICYLATE antagonism.
Annual Review of Phytopathology 49: 317–343.
Rodríguez FI. 1999. A copper cofactor for the ethylene receptor ETR1 from
Arabidopsis. Science 283: 996–998.
, Fraga R. 1999. Phosphate solubilizing
bacteria and their role in plant growth promotion. Biotechnology Advances 17: 319–
339.
Roelfsema MRG, Konrad KR, Marten H, Psaras GK, Hartung W, Hedrich R.
2006. Guard cells in albino leaf patches do not respond to photosynthetically active
radiation, but are sensitive to blue light, CO2 and abscisic acid. Plant, Cell and
Environment 29: 1595–1605.
Roessner U, Wagner C, Kopka J, Trethewey RN, Willmitzer L. 2000. Technical
advance: simultaneous analysis of metabolites in potato tuber by gas chromatography-
mass spectrometry. Plant Journal 23: 131–42.
Rolland F, Baena-Gonzalez E, Sheen J. 2006. Sugar sensing and signaling in plants:
conserved and novel mechanisms. Annual Review of Plant Biology 57: 675–709.

308
References
Roman G, Lubarsky B, Kieber JJ, Rothenberg M, Ecker R, Ecker JR. 1995.
Genetic analysis of ethylene signal transduction in Arabidopsis thaliana: Five novel
mutant loci integrated into a stress response pathway. Genetics 139: 1393–1409.
Romera FJ, Alcántara E. 1994. Iron-deficiency stress responses in cucumber
(Cucumis sativus L) roots: a possible role for ethylene? Plant Physiology 105: 1133–
1138.
Rong W, Qi L, Wang A, Ye X, Du L, Liang H, Xin Z, Zhang Z. 2014. The ERF
transcription factor TaERF3 promotes tolerance to salt and drought stresses in wheat.
Plant Biotechnology Journal 12: 468–479.
Rosado A, Sohn EJ, Drakakaki G, Pan S, Swidergal A, Xiong Y, Kang B-H,
Bressan RA, Raikhel N V. 2010. Auxin-mediated ribosomal biogenesis regulates
vacuolar trafficking in Arabidopsis. The Plant Cell 22: 143–158.
Ros R, Muñoz-Bertomeu J, Krueger S. 2014. Serine in plants: biosynthesis,
metabolism, and functions. Trends in Plant Science 19: 564–569.
Rout GR, Sahoo S. 2015. Role of iron in plant growth and metabolism. Reviews in
Agricultural Science 3: 1–24.
Ryan PR, Dessaux Y, Thomashow LS, Weller DM. 2009. Rhizosphere engineering
and management for sustainable agriculture. Plant and Soil 321: 363–383.
Ryu C-M, Hu C-H, Locy RD, Kloepper JW. 2005. Study of mechanisms for plant
growth promotion elicited by rhizobacteria in Arabidopsis thaliana. Plant and Soil
268: 285–292.
Saito K, Kobayashi M, Gong Z, Tanaka Y, Yamazaki M. 1999. Direct evidence
for anthocyanidin synthase as a 2-oxoglutarate-dependent oxygenase: molecular
cloning and functional expression of cDNA from a red forma of Perilla frutescens.
Plant Journal 17: 181–189.
Sakai H, Hua J, Chen Q, Chang C, Medrano L, Bleecker A, Meyerowitz E. 1998.
ETR2 is an ETR1-like gene involved in ethylene signaling in Arabidopsis.
Proceedings of the National Academy of Sciences of the United States of America 95:
5812–5817.
Sakuma Y, Liu Q, Dubouzet JG, Abe H, Shinozaki K, Yamaguchi-Shinozaki K.
2002. DNA-binding specificity of the ERF/AP2 domain of Arabidopsis DREBs,
transcription factors involved in dehydration- and cold-inducible gene expression.
Biochemical and Biophysical Research Communications 290: 998–1009.
Salinas T, Duchêne A-M, Delage L, Nilsson S, Glaser E, Zaepfel M, Maréchal-
Drouard L. 2006. The voltage-dependent anion channel, a major component of the
tRNA import machinery in plant mitochondria. Proceedings of the National Academy
of Sciences of the United States of America 103: 18362–7.
Sánchez-Romera B, Ruiz-Lozano JM, Li G, Luu DT, Martínez-Ballesta MDC,
Carvajal M, Zamarreño AM, García-Mina JM, Maurel C, Aroca R. 2014.
Enhancement of root hydraulic conductivity by methyl jasmonate and the role of
calcium and abscisic acid in this process. Plant, Cell and Environment 37: 995–1008.
Sánchez-Vallet A, López G, Ramos B, Delgado-Cerezo M, Riviere M-P, Llorente
F, Fernández PV, Miedes E, Estevez JM, Grant M, et al. 2012. Disruption of
abscisic acid signaling constitutively activates Arabidopsis resistance to the
necrotrophic fungus Plectosphaerella cucumerina. Plant Physiology 160: 2109–24.
Sanchez L, Weidmann S, Arnould C, Bernard AR, Gianinazzi S, Gianinazzi-
Pearson V. 2005. Pseudomonas fluorescens and Glomus mosseae trigger DMI3-
dependent activation of genes related to a signal transduction pathway in roots of
Medicago truncatula. Plant Physiology 139: 1065–77.

309
References
Santoyo G, Moreno-Hagelsieb G, del Carmen Orozco-Mosqueda M, Glick BR.
2016. Plant growth-promoting bacterial endophytes. Microbiological Research 183:
92–99.
Sasaki K, Mitsuhara I, Seo S, Ito H, Matsui H, Ohashi Y. 2007. Two novel
AP2/ERF domain proteins interact with cis-element VWRE for wound-induced
expression of the Tobacco tpoxN1 gene. Plant Journal 50: 1079–1092.
Sasaki A, Yamaji N, Yokosho K, Ma JF. 2012. Nramp5 is a major transporter
responsible for manganese and cadmium uptake in rice. The Plant Cell 24: 2155–
2167.
Sato S, Tabata S, Hirakawa H, Asamizu E, Shirasawa K, Isobe S, Kaneko T,
Nakamura Y, Shibata D, Aoki K, et al. 2012. The tomato genome sequence
provides insights into fleshy fruit evolution. Nature 485: 635–641.
Scarpeci TE, Zanor MI, Carrillo N, Mueller-Roeber B, Valle EM. 2008.
Generation of superoxide anion in chloroplasts of Arabidopsis thaliana during active
photosynthesis: a focus on rapidly induced genes. Plant Molecular Biology 66: 361–
378.
Schachtman DP, Goodger JQD. 2008. Chemical root to shoot signaling under
drought. Trends in Plant Science 13: 281–287.
Scherr SJ, McNeely JA, Acharya KP, Angelsen A, Kaimowitz D, Balmford A,
Moore JL, Brooks T, Burgess N, Hansen LA, et al. 2008. Biodiversity conservation
and agricultural sustainability: towards a new paradigm of ‘ecoagriculture’
landscapes. Philosophical Transactions of the Royal Society of London. Series B,
Biological sciences 363: 477–94.
Schijlen EGWM, de Vos CHR, Martens S, Jonker HH, Rosin FM, Molthoff JW,
Tikunov YM, Angenent GC, van Tunen AJ, Bovy AG. 2007. RNA interference
silencing of chalcone synthase, the first step in the flavonoid biosynthesis pathway,
leads to parthenocarpic tomato fruits. Plant Physiology 144: 1520–1530.
Schlagnhaufer CD, Arteca RN, Pell EJ. 1997. Sequential expression of two 1-
aminocyclopropane-1-carboxylate synthase genes in response to biotic and abiotic
stresses in potato (Solanum tuberosum L.) leaves. Plant Molecular Biology 35: 683–
688.
Schmidt W. 2001. Different pathways are involved in phosphate and iron stress-
induced alterations of root epidermal cell development. Plant Physiology 125: 2078–
2084.
Schoenborn L, Yates PS, Grinton BE, Hugenholtz P, Janssen PH. 2004. Liquid
serial dilution is inferior to solid media for isolation of cultures representative of the
phylum-level diversity of soil bacteria. Applied and Environmental Microbiology 70:
4363–4366.
Schwartz SH, Tan BC, Gage DA, Zeevaart JA, McCarty DR. 1997. Specific
oxidative cleavage of carotenoids by VP14 of maize. Science 276: 1872–4.
Schwarz D, Rouphael Y, Colla G, Venema JH. 2010. Grafting as a tool to improve
tolerance of vegetables to abiotic stresses: thermal stress, water stress and organic
pollutants. Scientia Horticulturae 127: 162–171.
Schwarz D, Thompson AJ, Kläring H-P. 2014. Guidelines to use tomato in
experiments with a controlled environment. Frontiers in Plant Science 5: 625.
Sell S, Hehl R. 2005. A fifth member of the tomato 1-aminocyclopropane-1-
carboxylic acid (ACC) oxidase gene family harbours a leucine zipper and is
anaerobically induced. DNA Sequence 16: 80–82.

310
References
Sels J, Mathys J, De Coninck BMA, Cammue BPA, De Bolle MFC. 2008. Plant
pathogenesis-related (PR) proteins: a focus on PR peptides. Plant Physiology and
Biochemistry 46: 941–950.
Severo J, Tiecher A, Pirrello J, Regad F, Latché A, Pech JC, Bouzayen M,
Rombaldi CV. 2015. UV-C radiation modifies the ripening and accumulation of
ethylene response factor (ERF) transcripts in tomato fruit. Postharvest Biology and
Technology 102: 9–16.
Shanklin J, Cahoon EB. 1998. Desaturation and related modifications of fatty acids.
Annual Review of Plant Physiology and Plant Molecular Biology 49: 611–641.
Sharma A., Johri BN, Sharma AK, Glick BR. 2003. Plant growth-promoting
bacterium Pseudomonas sp. strain GRP3 influences iron acquisition in mung bean
(Vigna radiata L. Wilzeck). Soil Biology and Biochemistry 35: 887–894.
Sharp R. 2002. Interaction with ethylene: changing views on the role of abscisic acid
in root and shoot growth responses to water stress. Plant, Cell and Environment: 211–
222.
Sharp RE, LeNoble ME, Else MA, Thorne ET, Gherardi F. 2000. Endogenous
ABA maintains shoot growth in tomato independently of effects on plant water
balance: evidence for an interaction with ethylene. Journal of Experimental Botany
51: 1575–1584.
Shinozaki K, Yamaguchi-Shinozaki K. 2007. Gene networks involved in drought
stress response and tolerance. Journal of Experimental Botany 58: 221–227.
Shirley BW. 1996. Flavonoid biosynthesis: ‘New’ functions for an ‘old’ pathway.
Trends in Plant Science 1: 377–382.
Shishido M, Chanway CP. 2000. Colonization and growth promotion of outplanted
spruce seedlings pre-inoculated with plant growth-promoting rhizobacteria in the
greenhouse. Canadian Journal of Forest Research 30: 845–854.
Shiu OY, Oetiker JH, Shang A, Yang F. 1998. The promoter of LE-ACS7, an early
flooding-induced 1-aminocyclopropane-1-carboxylate synthase gene of the tomato, is
tagged by a Sol3 transposon. Plant Biology 95: 10334–10339.
Siebner-Freibach H, Hadar Y, Chen Y. 2003. Siderophores sorbed on Ca-
montmorillonite as an iron source for plants. Plant and Soil 251: 115–124.
Singh JS, Pandey VC, Singh DP. 2011. Efficient soil microorganisms: a new
dimension for sustainable agriculture and environmental development. Agriculture,
Ecosystems and Environment 140: 339–353.
Singh PP, Shin YC, Park CS, Chung YR. 1999. Biological control of fusarium wilt
of cucumber by chitinolytic bacteria. Phytopathology 89: 92–99.
Sivasankar S, Sheldrick B, Rothstein SJ. 2000. Expression of allene oxide synthase
determines defense gene activation in tomato. Plant Physiology 122: 1335–1342.
Slocum RD. 2005. Genes, enzymes and regulation of arginine biosynthesis in plants.
Plant Physiology and Biochemistry 43: 729–745.
Smalle J, Straeten D. 1997. Ethylene and vegetative development. Physiologia
Plantarum 100: 593–605.
De Smet I, Voss U, Jürgens G, Beeckman T. 2009. Receptor-like kinases shape the
plant. Nature Cell Biology 11: 1166–73.
Smith AM, Stitt M. 2007. Coordination of carbon supply and plant growth. Plant,
Cell and Environment 30: 1126–1149.
Sobeih WY, Dodd IC, Bacon MA, Grierson D, Davies WJ. 2004. Long-distance
signals regulating stomatal conductance and leaf growth in tomato (Lycopersicon
esculentum) plants subjected to partial root-zone drying. Journal of Experimental
Botany 55: 2353–2363.

311
References
Soga T, Ohashi Y, Ueno Y, Naraoka H, Tomita M, Nishioka T. 2003. Quantitative
metabolome analysis using capillary electrophoresis mass spectrometry. Journal of
Proteome Research 2: 488–494.
Solano R, Stepanova A, Chao Q, Ecker JR. 1998. Nuclear events in ethylene
signaling: A transcriptional cascade mediated by ETHYLENE-INSENSITIVE3 and
ETHYLENE-RESPONSE-FACTOR1. Genes and Development 12: 3703–3714.
Sondergaard TE, Schulz A, Palmgren MG. 2004. Update on energization of
nutrient transport energization of transport processes in plants. Roles of the plasma
membrane H + -ATPase. Plant Physiology 136: 2475–2482.
Souza E, Chubatsu L, Huergo LF, Monteiro R, Camilios-Neto D, Wassem R, de
Oliveira Pedrosa F. 2014. Use of nitrogen-fixing bacteria to improve agricultural
productivity. BMC Proceedings 8: O23.
Spaepen S, Vanderleyden J. 2011. Auxin and Plant-Microbe Interactions. Cold
Spring Harbour Perspectives in Biology 3:a001438.
Sperotto RA. 2013. Zn/Fe remobilization from vegetative tissues to rice seeds:
should I stay or should I go? Ask Zn/Fe supply! Frontiers in Plant Science 4: 464.
Stearns JC, Woody OZ, McConkey BJ, Glick BR. 2012. Effects of bacterial ACC
deaminase on Brassica napus gene expression. Molecular Plant-Microbe Interactions
25: 668–676.
Stears RL, Martinsky T, Schena M. 2003. Trends in microarray analysis. Nature
Medicine 9: 140–145.
Stepanova AN, Hoyt JM, Hamilton AA, Alonso JM. 2005. A Link between
ethylene and auxin uncovered by the characterization of two root-specific ethylene-
insensitive mutants in Arabidopsis. The Plant Cell 17: 2230–42.
Steudle E. 2000. Water uptake by roots: effects of water deficit. Journal of
experimental botany 51: 1531–1542.
Su F, Gilard F, Guerard F, Citerne S, Clément C, Vaillant-Gaveau N, Dhondt-
Cordelier S. 2016. Spatio-temporal responses of Arabidopsis leaves in photosynthetic
performance and metabolite contents to Burkholderia phytofirmans PsJN. Frontiers in
Plant Science 7: 403.
Su P-H, Li H-M. 2008. Arabidopsis stromal 70-kD heat shock proteins are essential
for plant development and important for thermotolerance of germinating seeds. Plant
Physiology 146: 1231–41.
Suge H, Nishizawa T. 1997. Phenotypic plasticity of internode elongation stimulated
by deep‐seeding and ethylene in wheat seedlings. Plant, Cell and Environment 20:
961–964.
Sun SW, Chung MC, Lin TY. 1996. The structure and expression of an hsc70 gene
from Lycopersicon esculentum. Gene 170: 237–241.
Sun S, Kang XP, Xing XJ, Xu XY, Cheng J, Zheng SW, Xing GM. 2015.
Agrobacterium-mediated transformation of tomato (Lycopersicon esculentum L. cv.
Hezuo 908) with improved efficiency. Biotechnology and Biotechnological
Equipment 29: 861–868.
Sung D, Kaplan F, Guy CL. 2001. Plant Hsp70 molecular chaperones: protein
structure , gene family , expression and function. Physiologia Plantarum 113: 443–
451.
Swarup R, Perry P, Hagenbeek D, Van Der Straeten D, Beemster GTS,
Sandberg G, Bhalerao R, Ljung K, Bennett MJ. 2007. Ethylene upregulates auxin
biosynthesis in Arabidopsis seedlings to enhance inhibition of root cell elongation.
The Plant Cell 19: 2186–2196.

312
References
Takahashi D, Li B, Nakayama T, Kawamura Y, Uemura M. 2014. Shotgun
proteomics of plant plasma membrane and microdomain proteins using nano-LC-
MS/MSPlant Proteomics. Plant Proteomics: Methods and Protocols, Methods in
Molecular Biology. 481–498.
Talbert PB, Masuelli R, Tyagi AP, Comai L, Henikoff S. 2002. Centromeric
localization and adaptive evolution of an Arabidopsis histone H3 variant. The Plant
Cell 14: 1053–1066.
Talboys PJ, Owen DW, Healey JR, Withers PJ a, Jones DL. 2014. Auxin secretion
by Bacillus amyloliquefaciens FZB42 both stimulates root exudation and limits
phosphorus uptake in Triticum aestivium. BMC Plant Biology 14: 51.
Tanaka Y, Sano T, Tamaoki M, Nakajima N, Kondo N. 2005. Ethylene inhibits
abscisic acid-induced stomatal closure in Arabidopsis. Plant Physiology 138: 2337–
2343.
Tao J-J, Chen H-W, Ma B, Zhang W-K, Chen S-Y, Zhang J-S. 2015. The role of
ethylene in plants under salinity stress. Frontiers in Plant Science 6: 1059.
Tao GC, Tian SJ, Cai MY, Xie GH. 2008. Phosphate-solubilizing and -mineralizing
abilities of bacteria isolated from soils. Pedosphere 18: 515–523.
Taylor CW, Tovey SC. 2010. IP3 receptors: toward understanding their activation.
Cold Spring Harbor Perspectives in Biology 2: a004010–a004010.
Tholen D, Voesenek LACJ, Poorter H. 2004. Ethylene insensitivity does not
increase leaf area or relative growth rate in Arabidopsis, Nicotiana tabacum, and
Petunia x hybrida. Plant Physiology 134: 1803–12.
Ticconi CA, Abel S. 2004. Short on phosphate: plant surveillance and
countermeasures. Trends in Plant Science 9: 548–555.
Tieman DM, Klee HJ. 1999. Differential expression of two novel members of the
tomato ethylene-receptor family. Plant Physiology 120: 165–172.
Tieman DM, Taylor MG, Ciardi JA, Klee HJ. 2000. The tomato ethylene receptors
NR and LeETR4 are negative regulators of ethylene response and exhibit functional
compensation within a multigene family. Proceedings of the National Academy of
Sciences of the United States of America 97: 5663–8.
Tikhonovich IA, Provorov NA. 2011. Microbiology is the basis of sustainable
agriculture: an opinion. Annals of Applied Biology 159: 155–168.
Tilman D, Balzer C, Hill J, Befort BL. 2011. Global food demand and the
sustainable intensification of agriculture. Proceedings of the National Academy of
Sciences of the United States of America 108: 20260–4.
Timmusk S. 2017. Perspectives and challenges of microbial application for crop
improvement. Frontiers in Plant Science 8: 49.
Timmusk S, Wagner EG. 1999. The plant-growth-promoting rhizobacterium
Paenibacillus polymyxa induces changes in Arabidopsis thaliana gene expression: a
possible connection between biotic and abiotic stress responses. Molecular Plant-
Microbe Interactions 12: 951–959.
Toklikishvili N, Dandurishvili N, Vainstein A, Tediashvili M, Giorgobiani N,
Lurie S, Szegedi E, Glick BR, Chernin L. 2010. Inhibitory effect of ACC
deaminase-producing bacteria on crown gall formation in tomato plants infected by
Agrobacterium tumefaciens or A. vitis. Plant Pathology 59: 1023–1030.
Tomás M, Flexas J, Copolovici L, Galmés J, Hallik L, Medrano H, Ribas-Carbó
M, Tosens T, Vislap V, Niinemets Ü. 2013. Importance of leaf anatomy in
determining mesophyll diffusion conductance to CO2 across species: quantitative
limitations and scaling up by models. Journal of Experimental Botany 64: 2269–2281.

313
References
Ton J, Van Pelt JA, Van Loon LC, Pieterse CMJ. 2002. The Arabidopsis ISR1
locus is required for rhizobacteria-mediated induced systemic resistance against
different pathogens. Plant Biology 4: 224–227.
Tsuchisaka A, Yu G, Jin H, Alonso JM, Ecker JR, Zhang X, Gao S, Theologis A.
2009. A combinatorial interplay among the 1-aminocyclopropane-1-carboxylate
isoforms regulates ethylene biosynthesis in Arabidopsis thaliana. Genetics 183: 979–
1003.
Tsuda K, Sato M, Stoddard T, Glazebrook J, Katagiri F. 2009. Network
properties of robust immunity in plants. PLoS Genetics 5: e1000772.
Tuteja N, Tarique M, Banu MSA, Ahmad M, Tuteja R. 2014. Pisum sativum p68
DEAD-box protein is ATP-dependent RNA helicase and unique bipolar DNA
helicase. Plant Molecular Biology 85: 639–651.
Tzin V, Galili G. 2010. New Insights into the shikimate and aromatic amino acids
biosynthesis pathways in plants. Molecular Plant 3: 956–972.
UN. 2012. Resilient people resilient planet: a future worth choosing. DOI:
10.1590/S1676-06032012000100001
Vacheron J, Desbrosses G, Bouffaud M-L, Touraine B, Moënne-Loccoz Y,
Muller D, Legendre L, Wisniewski-Dyé F, Prigent-Combaret C. 2013. Plant
growth-promoting rhizobacteria and root system functioning. Frontiers in Plant
Science 4: 356.
Vandenbussche F, Vaseva I, Vissenberg K, Van Der Straeten D. 2012. Ethylene in
vegetative development: a tale with a riddle. New Phytologist 194: 895–909.
Vansuyt G, Robin A, Briat JF, Curie C, Lemanceau P. 2007. Iron acquisition from
Fe-pyoverdine by Arabidopsis thaliana. Molecular Plant-Microbe Interactions 20:
441–447.
Vargas L, de Carvalho TLG, Ferreira PCG, Baldani VLD, Baldani JI, Hemerly
AS. 2012. Early responses of rice (Oryza sativa L.) seedlings to inoculation with
beneficial diazotrophic bacteria are dependent on plant and bacterial genotypes. Plant
and Soil 356: 127–137.
Vartapetian AB, Tuzhikov AI, Chichkova N V, Taliansky M, Wolpert TJ. 2011.
A plant alternative to animal caspases: subtilisin-like proteases. Cell Death and
Differentiation 18: 1289–1297.
Verbsky ML, Richards EJ. 2001. Chromatin remodeling in plants. Current Opinion
in Plant Biology 4: 494–500.
Verhage A. 2011. Rewiring of the jasmonate signaling pathway in Arabidopsis
during insect herbivory. Frontiers in Plant Science 2: 1–12.
Verhage A, van Wees SCM, Pieterse CMJ. 2010. Plant immunity: it’s the
hormones talking, but what do they say? Plant Physiology 154: 536–540.
Verhagen BWM, Glazebrook J, Zhu T, Chang H-S, van Loon LC, Pieterse CMJ.
2004. The transcriptome of rhizobacteria-induced systemic resistance in Arabidopsis.
Molecular Plant-Microbe Interactions 17: 895–908.
Vermeulen SJ, Campbell BM, Ingram JSI. 2012. Climate change and food
systems. Annual Review of Environment and Resources 37: 195–222.
Vessey JKJ. 2003. Plant growth promoting rhizobacteria as biofertilizers. Plant and
Soil 255: 571–586.
Visser EJW, Nabben RHM, Blom CWPM, Voesenek L a CJ. 1997. Elongation by
primary lateral roots and adventitious roots during conditions of hypoxia and high
ethylene concentrations. Plant Cell and Environment 20: 647–653.

314
References
Viterbo A, Landau U, Kim S, Chernin L, Chet I. 2010. Characterization of ACC
deaminase from the biocontrol and plant growth-promoting agent Trichoderma
asperellum T203. FEMS Microbiology Letters 305: 42–8.
Vlot AC, Dempsey DA, Klessig DF. 2009. Salicylic acid, a multifaceted hormone to
combat disease. Annual Review of Phytopathology 47: 177–206.
Voesenek LACJ, Sasidharan R. 2013. Ethylene - and oxygen signalling - drive plant
survival during flooding. Plant Biology 15: 426–435.
Voesenek L, Vriezen WH, Smekens M, Huitink F, Bogemann GM, Blom C. 1997.
Ethylene sensitivity and response sensor expression in petioles of Rumex species at
low O2 and high CO2 concentrations. Plant Physiology 114: 1501–1509.
Vogel MO, Moore M, König K, Pecher P, Alsharafa K, Lee J, Dietz K-J. 2014.
Fast retrograde signaling in response to high light involves metabolite export,
MITOGEN-ACTIVATED PROTEIN KINASE6, and AP2/ERF transcription factors
in Arabidopsis. The Plant Cell 26: 1151–65.
Vosenek LACJ, Van der Veen R. 1994. The role of phytohormones in plant stress:
too much or too little water. Acta Botanica Neerlandica 43: 91–127.
Walch-Liu P, Liu LH, Remans T, Tester M, Forde BG. 2006. Evidence that L-
glutamate can act as an exogenous signal to modulate root growth and branching in
Arabidopsis thaliana. Plant and Cell Physiology 47: 1045–1057.
Walker V, Bertrand C, Bellvert F, Moënne-Loccoz Y, Bally R, Comte G. 2011.
Host plant secondary metabolite profiling shows a complex, strain-dependent
response of maize to plant growth-promoting rhizobacteria of the genus Azospirillum.
New Phytologist 189: 494–506.
Wang Y, Brown HN, Crowley DE, Szaniszlo PJ. 1993. Evidence for direct
utilization of a siderophore, ferrioxamine B, in axenically grown cucumber. Plant,
Cell and Environment 16: 579–585.
Wang F, Cui X, Sun Y, Dong C-H. 2013a. Ethylene signaling and regulation in
plant growth and stress responses. Plant Cell Reports 32: 1099–109.
Wang KL-C, Li H, Ecker JR. 2002. Ethylene biosynthesis and signaling networks.
The Plant Cell 14 Suppl: S131-51.
Wang Y, Pearce MMP, Sliter DA, Olzmann JA, Christianson JC, Kopito RR,
Boeckmann S, Gagen C, Leichner GS, Roitelman J, et al. 2009. SPFH1 and
SPFH2 mediate the ubiquitination and degradation of inositol 1,4,5-trisphosphate
receptors in muscarinic receptor-expressing HeLa cells. Biochimica et Biophysica
Acta 1793: 1710–1718.
Wang SY, Tzeng DDS. 1998. Methionine-riboflavin mixtures with surfactants and
metal ions reduce powdery mildew infection in strawberry plants. Journal of the
American Society for Horticultural Science 123: 987–991.
Wang J, Zhang Z, Huang R. 2013b. Regulation of ascorbic acid synthesis in plants.
Plant Signaling and Behavior 8: e24536.
Wasaki J, Maruyama H, Tanaka M, Yamamura T, Dateki H, Shinano T, Ito S,
Osaki M. 2009. Overexpression of the LASAP2 gene for secretory acid phosphatase
in white lupin improves the phosphorus uptake and growth of tobacco plants. Soil
Science and Plant Nutrition 55: 107–113.
Watt G, Leoff C, Harper AD, Bar-Peled M. 2004. A bifunctional 3,5-epimerase/4-
keto reductase for nucleotide-rhamnose synthesis in Arabidopsis. Plant Physiology
134: 1337–46.
Wawrzynska A, Moniuszko G, Sirko A. 2015. Links between ethylene and sulfur
nutrition—A regulatory interplay or just metabolite association? Frontiers in Plant
Science 6: 1053.

315
References
Van Wees SCM, Van der Ent S, Pieterse CMJ. 2008. Plant immune responses
triggered by beneficial microbes. Current Opinion in Plant Biology 11: 443–8.
Van Wees SCM, Pieterse CMJ, Trijssenaar A, Van ’T Westende YAM, Hartog
F, Van Loon LC. 1997. Differential induction of systemic resistance in Arabidopsis
by biocontrol bacteria. Molecular Plant-Microbe Interactions 10: 716–724.
Weller DM, Raaijmakers JM, Gardener BBM, Thomashow LS. 2002. Microbial
populations responsible for specific soil suppressiveness to plant pathogens. Annual
Review of Phytopathology 40: 309–48.
Wen C-K, Li W, Guo H, Wen C-K, Li W, Guo H. 2015. Regulatory components of
ethylene signal transduction. Ethylene in Plants. In Wen, C-K (Eds.), Dordrecht:
Springer Netherlands. 73–92.
Weston DJ, Pelletier D a., Morrell-Falvey JL, Tschaplinski TJ, Jawdy SS, Lu T-
Y, Allen SM, Melton SJ, Martin MZ, Schadt CW, et al. 2012. Pseudomonas
fluorescen induces strain-dependent and strain-independent host plant responses in
defense networks, primary metabolism, photosynthesis, and fitness. Molecular Plant-
Microbe Interactions 25: 765–778.
Whipps JM. 2001. Microbial interactions and biocontrol in the rhizosphere. Journal
of Experimental Botany 52: 487–511.
Wilk S, Wilk E, Magnusson RP. 1998. Purification, characterization, and cloning of
a cytosolic aspartyl aminopeptidase. Journal of Biological Chemistry 273: 15961–
15970.
Wilkinson S, Davies WJ. 2010. Drought, ozone, ABA and ethylene: new insights
from cell to plant to community. Plant Cell and Environment 33: 510–525.
Wilkinson S, Kudoyarova GR, Veselov DS, Arkhipova TN, Davies WJ. 2012.
Plant hormone interactions: Innovative targets for crop breeding and management.
Journal of Experimental Botany 63: 3499–3509.
Wilkinson JQ, Lanahan MB, Yen HC, Giovannoni JJ, Klee HJ. 1995. An
ethylene-inducible component of signal transduction encoded by never-ripe. Science
270: 1807–1809.
Willekens H, Chamnongpol S, Davey M, Schraudner M, Langebartels C, Van
Montagu M, Inzé D, Van Camp W. 1997. Catalase is a sink for H2O2 and is
indispensable for stress defence in C3 plants. EMBO Journal 16: 4806–4816.
Williams; PM, Sicardi De Mallorca M. 1982. Abscisic acid and gibberellin-like
substances in roots and root nodules of Glycine max. Plant and Soil 26: 19–26.
Wilson R, Lacey R, Binder B. 2015. Ethylene receptors—biochemical events.
Ethylene in Plants. In Wen, C-K (Eds.), Dordrecht: Springer Netherlands. 45–59.
Winkel-Shirley B. 2001. Flavonoid biosynthesis. A colorful model for genetics,
biochemistry, cell biology, and biotechnology. Plant Physiology 126: 485–493.
Woeste KE, Kieber JJ. 2000. A strong loss-of-function mutation in RAN1 results in
constitutive activation of the ethylene response pathway as well as a rosette-lethal
phenotype. The Plant Cell 12: 443–455.
Wolters DA, Washburn MP, Yates JR. 2001. An automated multidimensional
protein identification technology for shotgun proteomics. Analytical Chemistry 73:
5683–5690.
Van Der Woude MW, Bäumler AJ. 2004. Phase and antigenic variation in bacteria.
Clinical Microbiology Reviews 17: 581–611.
Wu L, Chen X, Ren H, Zhang Z, Zhang H, Wang J, Wang XC, Huang R. 2007.
ERF protein JERF1 that transcriptionally modulates the expression of abscisic acid
biosynthesis-related gene enhances the tolerance under salinity and cold in tobacco.
Planta 226: 815–825.

316
References
Xu G, Jaffrey SR. 2013. Proteomic identification of protein ubiquitination events.
Biotechnology and Genetic Engineering Reviews 29: 73–109.
Xu S-L, Rahman A, Baskin TI, Kieber JJ. 2008. Two leucine-rich repeat receptor
kinases mediate signaling, linking cell wall biosynthesis and ACC synthase in
Arabidopsis. The Plant Cell 20: 3065–3079.
Xu J, Zhang S. 2014. Regulation of ethylene biosynthesis and signaling by protein
kinases and phosphatases. Molecular Plant 7: 939–942.
Xu Z, Zhou G. 2004. Research advance in nitrogen metabolism of plant and its
environmental regulation. Journal of Applied Ecology 15: 511–516.
Yamaguchi-Shinozaki K, Shinozaki K. 2006. Transcriptional regulatory networks
in cellular responses and tolerance to dehydration and cold stresses. Annual Review of
Plant Biology 57: 781–803.
Yamori W, Kondo E, Sugiura D, Terashima I, Suzuki Y, Makino A. 2016.
Enhanced leaf photosynthesis as a target to increase grain yield: insights from
transgenic rice lines with variable Rieske FeS protein content in the cytochrome b 6 /
f complex. Plant, Cell and Environment 39: 80–87.
Yang SF, Hoffman NE. 1984. Ethylene biosynthesis and its regulation in higher
plants. Annual Review of Plant Physiology 35: 155–189.
Yang N, Zhu C, Gan L, Ng D, Xia K. 2011. Ammonium-stimulated root hair
branching is enhanced by methyl jasmonate and suppressed by ethylene in
Arabidopsis thaliana. Journal of Plant Biology 54: 92–100.
Yoshida S, Tamaoki M, Ioki M, Ogawa D, Sato Y, Aono M, Kubo A, Saji S, Saji
H, Satoh S, et al. 2009. Ethylene and salicylic acid control glutathione biosynthesis in
ozone-exposed Arabidopsis thaliana. Physiologia Plantarum 136: 284–298.
Yoshikawa M, Hirai N, Wakabayashi K, Sugizaki H, Iwamura H. 1993. Succinic
and lactic acids as plant growth promoting compounds produced by rhizospheric
Pseudomonas putida. Canadian Journal of Microbiology 39: 1150–1154.
Youm JW, Jeon JH, Choi D, Yi SY, Joung H, Kim HS. 2008. Ectopic expression
of pepper CaPF1 in potato enhances multiple stresses tolerance and delays initiation
of in vitro tuberization. Planta 228: 701–708.
Yruela I. 2005. Copper in plants. Brazilian Journal of Plant Physiology 17: 145–156.
Yuan J, Zhang N, Huang Q, Raza W, Li R, Vivanco JM, Shen Q. 2015. Organic
acids from root exudates of banana help root colonization of PGPR strain Bacillus
amyloliquefaciens NJN-6. Scientific Reports 5: 13438.
Yu H, Zhang F, Wang G, Liu Y, Liu D. 2013. Partial deficiency of isoleucine
impairs root development and alters transcript levels of the genes involved in
branched-chain amino acid and glucosinolate metabolism in Arabidopsis. Journal of
Experimental Botany 64: 599–612.
Zamioudis C, Pieterse CMJ. 2012. Modulation of host immunity by beneficial
microbes. Molecular Plant-Microbe Interactions 25: 139–150.
Zarembinski TI, Theologis A. 1994. Ethylene biosynthesis and action: a case of
conservation. Plant Molecular Biology 26: 1579–1597.
Zegzouti H, Jones B, Frasse P, Marty C, Maitre B, Latché A, Pech JC, Bouzayen
M. 1999. Ethylene-regulated gene expression in tomato fruit: characterization of
novel ethylene-responsive and ripening-related genes isolated by differential display.
Plant Journal 18: 589–600.
Zerial M, McBride H. 2001. Rab proteins as membrane organizers. Nature Reviews.
Molecular Cell Biology 2: 107–117.
Zhang JY, Broeckling CD, Blancaflor EB, Sledge MK, Sumner LW, Wang ZY.
2005. Overexpression of WXP1, a putative Medicago truncatula AP2 domain-

317
References
containing transcription factor gene, increases cuticular wax accumulation and
enhances drought tolerance in transgenic alfalfa (Medicago sativa). Plant Journal 42:
689–707.
Zhang B, Carrie C, Ivanova A, Narsai R, Murcha MW, Duncan O, Wang Y,
Law SR, Albrecht V, Pogson B, et al. 2012. LETM proteins play a role in the
accumulation of mitochondrially encoded proteins in Arabidopsis thaliana and
AtLETM2 displays parent of origin effects. Journal of Biological Chemistry 287:
41757–41773.
Zhang H, Kim M-S, Sun Y, Dowd SE, Shi H, Paré PW. 2008. Soil bacteria confer
plant salt tolerance by tissue-specific regulation of the sodium transporter HKT1.
Molecular Plant-Microbe Interactions 21: 737–744.
Zhang H, Li W, Chen J, Yang Y, Zhang Z, Zhang H, Wang XC, Huang R. 2007.
Transcriptional activator TSRF1 reversely regulates pathogen resistance and osmotic
stress tolerance in tobacco. Plant Molecular Biology 63: 63–71.
Zhang YJ, Lynch JP, Brown KM. 2003. Ethylene and phosphorus availability have
interacting yet distinct effects on root hair development. Journal of Experimental
Botany 54: 2351–2361.
Zhang N, Wang D, Liu Y, Li S, Shen Q, Zhang R. 2014. Effects of different plant
root exudates and their organic acid components on chemotaxis, biofilm formation
and colonization by beneficial rhizosphere-associated bacterial strains. Plant and Soil
374: 689–700.
Zhao Y. 2010. Auxin biosynthesis and its role in plant development. Annual Review
of Plant Biology 61: 49–64.
Zhao J, Kennedy BK, Lawrence BD, Barbie DA, Matera AG, Fletcher JA,
Harlow E. 2000. NPAT links cyclin E – Cdk2 to the regulation of replication-
dependent histone gene transcription. Genes and Development 14: 2283–2297.
Zhong S, Lin Z, Grierson D. 2008. Tomato ethylene receptor-CTR interactions:
visualization of NEVER-RIPE interactions with multiple CTRs at the endoplasmic
reticulum. Journal of Experimental Botany 59: 965–972.
Zhou Y, Cai H, Xiao J, Li X, Zhang Q, Lian X. 2009. Over-expression of aspartate
aminotransferase genes in rice resulted in altered nitrogen metabolism and increased
amino acid content in seeds. Theoretical and Applied Genetics 118: 1381–1390.
Zhou L, Jang J-C, Jones TL, Sheen J. 1998. Glucose and ethylene signal
transduction crosstalk revealed by an Arabidopsis glucose-insensitive mutant.
Proceedings of the National Academy of Sciences of the United States of America 95:
10294–10299.
Zhu X-G, de Sturler E, Long SP. 2007. Optimizing the distribution of resources
between enzymes of carbon metabolism can dramatically increase photosynthetic
rate: a numerical simulation using an evolutionary algorithm. Plant Physiology 145:
513–526.
Zonia LE, Stebbins NE, Polacco JC. 1995. Essential role of urease in germination
of nitrogen-limited Arabidopsis thaliana seeds. Plant Physiology 107: 1097–103.
Zornoza P, Sánchez-Pardo B, Carpena RO. 2010. Interaction and accumulation of
manganese and cadmium in the manganese accumulator Lupinus albus. Journal of
Plant Physiology 167: 1027–32.

318

319

Ethylene perception by ETR3 determines
plant interaction with plant growth
promoting bacteria in tomato
(Solanum lycopersicum)
Pablo Ibort Pereda
Tesis Doctoral
2017
DO
CT
OR
AL
TH
ES
IS 2
017
PA
BL
O I
BO
RT
PE
RE
DA
Programa Oficial de
Doctorado en
Biología
Fundamental
y de
Sistemas
Some are leavessome are branches
I and I are the roots ...
Robert Nesta Marley