Embed Size (px)
Citation preview

1
PACIFIC GAS AND ELECTRIC COMPANY
2015 ANNUAL ELECTRIC RELIABILITY REPORT (Per Decision16-01-008)
August 12th, 2016

2
Table of Contents Executive Summary .............................................................................................................................. 5
How PG&E Measures Reliability ....................................................................................................... 7
What’s Behind Record Reliability? .................................................................................................... 8
Introduction ......................................................................................................................................... 10
1. System Indices For The last Ten Years ....................................................................................... 12
a. System Indices (2006-2015) .................................................................................................. 12
i. Distribution System Indices .................................................................................................... 13
ii. Transmission System Indices ................................................................................................ 13
b. Separate System Charts of SAIDI, SAIFI, MAIFI, and CAIDI for the past 10 years with linear trend line (MED Excluded)............................................................................................................... 14
i. SAIDI Performance Results (MED Excluded) ........................................................................ 14
ii. SAIFI Performance Results (MED Excluded) ........................................................................ 15
iii. MAIFI Performance Results (MED Excluded) ..................................................................... 17
iv. CAIDI Performance Results (MED Excluded) ..................................................................... 17
2. Division Reliability Indices for the past 10 years including and excluding MED ........................... 19
a. Division Reliability Indices for the past 10 years excluding ISO and planned outages and including Major Event Days ............................................................................................................. 19
b. Division Reliability Indices for the past 10 years excluding planned outages, ISO outages and Major Event Days ............................................................................................................................ 24
c. Charts for Division Reliability Indices for the past 10 years ....................................................... 29
i. Charts for Division Reliability Indices for the past 10 years with linear trend line excluding ISO and planned outages and including MED .................................................................................... 29
1. AIDI Performance Results (MED Included) ........................................................................ 29
2. AIFI Performance Results (MED Included) ......................................................................... 39
3. MAIFI Performance Results (MED Included) ...................................................................... 49
4. CAIDI Performance Results (MED Included) ...................................................................... 59
ii. Charts for Division Reliability Indices for the past 10 years with linear trend line excluding ISO, planned outages and MED .................................................................................................. 69
1. AIDI Performance Results (MED Excluded) ....................................................................... 69
2. AIFI Performance Results (MED Excluded) ........................................................................ 79
3. MAIFI Performance Results (MED Excluded) ..................................................................... 89
4. CAIDI Performance Results (MED Excluded) ..................................................................... 99
d. Division and System Reliability Indices Performance Variances (Five-Year Average) ........ 109
i. System and Division Performance Assessment ...................................................................... 115
1. System Performance Assessment .................................................................................... 115
2. Central Coast Division Performance Assessment ............................................................ 117
3. Diablo Division Performance Assessment ........................................................................ 118

3
4. Kern Division Performance Assessment........................................................................... 120
5. Mission Division Performance Assessment ...................................................................... 121
6. North Bay Division Performance Assessment .................................................................. 123
7. Peninsula Division Performance Assessment .................................................................. 124
8. San Francisco Division Performance Assessment ........................................................... 126
9. San Jose Division Performance Assessment ................................................................... 127
10. Sierra Division Performance Assessment......................................................................... 128
11. Stockton Division Performance Assessment .................................................................... 129
ii. 2015 Excludable Major Event Day (MED) CAIDI Performance ............................................... 130
1. February 6-8, 2015 Major Event Days .............................................................................. 132
1.1 System CAIDI Assessment ............................................................................................... 132
1.2 Humboldt Division CAIDI Assessment .............................................................................. 133
1.3 North Valley Division CAIDI Assessment.......................................................................... 134
1.4 Sierra Division CAIDI Assessment ................................................................................... 135
2. April 6, 2015 Major Event Day .......................................................................................... 136
2.1 Peninsula Division CAIDI Assessment ............................................................................. 137
3. June 8, 2015 Major Event Day ......................................................................................... 138
3.1 De Anza Division CAIDI Assessment ............................................................................... 139
3.2 Kern Division CAIDI Assessment ..................................................................................... 140
3.3 Mission Division CAIDI Assessment ................................................................................. 141
3.4 Sacramento Division CAIDI Assessment .......................................................................... 142
4. July 18, and July 19, 2015 Major Event Days ................................................................... 143
4.1 Fresno Division CAIDI Assessment .................................................................................. 144
4.2 Los Padres Division CAIDI Assessment ........................................................................... 145
4.3 Mission Division CAIDI Assessment ................................................................................. 146
4.4 Sacramento Division CAIDI Assessment .......................................................................... 147
5. December 13, 2015 Major Event Day ............................................................................... 148
5.1 Los Padres Division CAIDI Assessment ........................................................................... 149
5.2 Mission Division CAIDI Assessment ................................................................................. 150
6. December 24, 2015 Major Event Day ............................................................................... 151
6.1 System CAIDI Assessment ............................................................................................... 152
6.2 Humboldt Division CAIDI Assessment .............................................................................. 153
6.3 Los Padres Division CAIDI Assessment ........................................................................... 154
6.4 Mission Division CAIDI Assessment ................................................................................. 155
6.5 Peninsula Division CAIDI Assessment ............................................................................. 156
3. System and Division Indices Based on IEEE 1366 for the past 10 years including Planned Outages and including and excluding MED ..................................................................................................... 157

4
a. System and Division Indices Based on IEEE 1366 for the past ten years including Planned Outages and including MED, and excluding ISO Outages ........................................................... 158
b. System and Division Indices Based on IEEE 1366 for the past 10 years including Planned Outages and excluding ISO, and MED .......................................................................................... 163
c. Charts for System and Division Indices Based on IEEE 1366 for the past 10 years including Planned Outages and including and excluding MED ..................................................................... 168
i. Charts for System and Division Reliability Indices based on IEEE 1366 for the past 10 years with linear trend line, and including planned outages and excluding ISO, and MED ................. 168
1. SAIDI Performance Results (MED Excluded) ................................................................... 168
2. SAIFI Performance Results (MED Excluded) ................................................................... 178
3. MAIFI Performance Results (MED Excluded) ................................................................... 188
4. CAIDI Performance Results (MED Excluded) ................................................................... 198
ii. Charts for System and Division Reliability Indices based on IEEE 1366 for the past 10 years including planned outages and including MED .......................................................................... 208
1. SAIDI Performance Results (MED Included) .................................................................... 208
2. SAIFI Performance Results (MED Included) .................................................................... 218
3. MAIFI Performance Results (MED Included) .................................................................... 228
4. CAIDI Performance Results (MED Included) .................................................................... 238
d. The number of planned outages, date, and location of planned outages in each division on an annual basis. ................................................................................................................................. 248
4. Service Territory Map................................................................................................................. 249
5. Top 1% of Worst Performing Circuits (WPC) excluding Major Event Day (MED) ...................... 250
6. Top 10 major unplanned power outage events of 2015 ............................................................. 265
7. Summary List of Major Event Day (MED) per IEEE 1366 .......................................................... 266
7.1 Major Event Day (MED) Discussions: ............................................................................... 267
February 6-8, 2015 Major Event Day ......................................................................................... 267
April 6th, 2015 Major Event Day ................................................................................................. 268
June 8th, 2015 Major Event Day ................................................................................................. 269
July 18 -19, 2015 Major Event Day ............................................................................................ 270
December 13th, 2015 Major Event Day ...................................................................................... 271
December 24th, 2015 Major Event Day ...................................................................................... 272
8. Historical Ten Largest Unplanned Outage Events for 2005-2014 .............................................. 273
9. The Number of Customer Inquiries on Reliability Data and the Number of Days per Response283
10. Appendix A – Definitions, Acronyms & Abbreviations ................................................................ 284

5
Executive Summary Over the last ten (10) years, electric customers of Pacific Gas and Electric Company (PG&E) have seen improving reliability. 2015 marked another milestone as the average PG&E customer experienced less than one outage during the year for the second year in a row. PG&E’s investment in its electric infrastructure and its commitment to integrating innovative technology continue to pay dividends for our customers. As noted in the California Public Utilities Commission’s (CPUC) recently released 10-year reliability study, “Particularly in PG&E’s service territory, marked improvement in reliability metrics are seen in the historic data, with particular improvement observed in the Central Valley and Bay Area.”1 Utilities measure reliability in many ways: duration of outages, frequency of outages, average restoration time, counting only unplanned outages, counting planned outages, excluding unusual events such as major storms (so called Major Event days), including or excluding certain types of outages, among other distinctions. This report explains the various different measures and includes all the various metrics required by CPUC Decision 16-01-008. For purposes of this Executive Summary, PG&E is focusing on metrics that include planned outages, but exclude major event days. These metrics are found in Section 3, starting at page 159. PG&E believes these metrics best reflect the typical customer’s experience. Since 2006, PG&E has reduced the amount of time the average PG&E customer experiences a sustained outage or outages in a given year by half, from 195.7 minutes to 95.8 minutes, a 51 percent improvement. In the same period, PG&E has also reduced the number of times the average PG&E customer experiences a sustained outage in a given year from 1.450 to 0.870, a 40 percent improvement. Table 1 below displays our improvement in electric reliability from 2006 through 2015.
1 CPUC Policy and Planning Division, California Electric Reliability Investor-Owned Utilities Performance Review 2006-2015, Executive Summary, p. iii, which can be found at http://www.cpuc.ca.gov/uploadedfiles/cpuc_public_website/content/about_us/organization/divisions/policy_and_planning/ppd_work/ppd_work_products_(2014_forward)/ppd%20reliability%20review.pdf.

6
Table 1 – Combined Transmission and Distribution System Indices (2006-2015)
(Excludes MED and ISO outages, and includes planned outages)
. Chart A on the following page shows the reduction in the duration of the amount of time the average PG&E customer experiences a sustained outage or outages in a given year in graph form:
Major Event Day (MED) ExcludedSAIDI SAIFI MAIFI CAIDI
2006 195.7 1.450 1.588 135.02007 167.0 1.306 1.526 127.92008 181.5 1.299 1.597 139.72009 157.5 1.206 1.398 130.62010 157.2 1.207 1.257 130.22011 141.8 1.087 1.180 130.52012 131.5 1.125 1.805 116.92013 116.8 1.065 1.533 109.72014 110.2 0.965 1.400 114.22015 95.8 0.870 1.549 110.1
Year
7
2006-2015 Transmission & Distribution System SAIDI Performance Results
Chart A
(Includes Planned Outages, Excludes Major Event Days and ISO Outages)2 And, not surprisingly, system-wide improvement is mirrored at the division level. As shown by the 10-year charts included later in this report, reliability improved in 18 of PG&E’s 19 divisions in 2015 compared to 2006. Division level reliability also improved in 13 of PG&E’s 19 divisions in 2015 compared to 2014. How PG&E Measures Reliability
PG&E uses four metrics commonly used in the electric utility industry to measure reliability: the System Average Interruption Duration Index (SAIDI), the System Average Interruption Frequency Index (SAIFI), the Momentary Average Interruption Frequency Index (MAIFI), and the Customer Average Interruption Duration Index (CAIDI).
• SAIDI measures the amount of time the average PG&E customer experiences a sustained outage or outages (being without power for more than five minutes) in a given year. In 2015, PG&E's SAIDI was about 95.8 minutes per customer. This is a better than 51 percent improvement over the last 10 years.
• SAIFI is the number of times the average PG&E customer experiences a sustained outage in a given year. In 2015, PG&E's SAIFI was 0.870 or less than one sustained outage per customer for the year, including planned outages. This is the second year in a row that the average customer
2 See Table 47 on Page 157.

8
has experienced less than one sustained outage for the year. The 2015 SAIFI, 0.870, represents a 40 percent improvement over the last 10 years.
• MAIFI is the number of times the average customer is interrupted by momentary outages each year. Momentary outages are outages lasting 5 minutes or less. In 2015, PG&E's MAIFI was 1.549, or more than one per customer. This figure is similar to the 2007 MAIFI results.
• CAIDI is the average duration of a sustained outage. It is determined by taking the total outage minutes for all customer outages3 (System Average Interruption Duration Index (SAIDI)) and dividing it by the total number of outages (System Average Interruption Frequency Index (SAIFI)). In 2015, PG&E's CAIDI was 110.1 minutes. This represents an 18 percent improvement over the past 10 years.
What’s Behind Record Reliability?
PG&E continues to integrate a wide range of advanced communications and control technologies throughout its electric grid to enhance the resiliency of the system and to identify and restore power outages more quickly. In the last five years, PG&E has invested more than $11 billion dollars to enhance and harden its electric transmission and distribution system assets. Some highlights of the technology that has boosted reliability include: New Distribution Control Centers: Since 2014, PG&E has opened state-of-the-art electric distribution control centers that manage more than 140,000 miles of electric distribution power lines throughout Northern and Central California. These facilities are the nerve centers of the grid that delivers energy to the homes and businesses of more than 16 million Californians. Located in Fresno and Concord, in addition to a new distribution control center opened this year in Rocklin in Placer
3 Excluding momentary outages, which are measured through MAIFI.

9
County, the centers already are enhancing electric reliability for PG&E customers while incorporating clean, renewable energy into the grid. Smart Grid: PG&E is also installing advanced automated technology on power lines throughout its service area. This technology can automatically “self-heal” the grid by re-routing the flow of electricity around a damaged power line and effectively restore power to the majority of impacted customers within minutes. These systems have been installed on more than 20 percent of PG&E’s electrical distribution circuits, helping the company avoid more than 100 million customer outage minutes and saving more than one million customers from a sustained outage since the program began in 2012. Other advances, including line sensors that help pinpoint the specific location of an outage, continue to be integrated into the system. What follows is the 2015 Electric Reliability Report for Pacific Gas and Electric Company as required by Decision 16-01-008. This report includes system reliability data based on Institute of Electrical and Electronic Engineers (IEEE) Standard 1366 methodology, as required by D.16-01-008. The report includes very specific details, including reliability numbers for each of PG&E’s 19 divisions. It also includes a list of our worst performing circuits in Chapter 5.

10
Introduction
This is the 2015 Electric Reliability Report for Pacific Gas and Electric Company as required by Decision 16-01-008. This report includes system reliability data based on Institute of Electrical and Electronic Engineers (IEEE) Standard 1366 Methodology. This report consists of the following:
Section Description 1. System Indices For The Last 10 Years (2006-2015) 2. Division Reliability Indices (2006-2015) Including and Excluding Major
Event Day (MED) 3. System and Division Indices Based on IEEE 1366 (2006-2015) Including
Planned Outages and Including and Excluding MED 4. Service Territory Map including Divisions 5. Top 1% of Worst Performing Circuits (WPC) excluding MED 6. Top 10 Major Unplanned Power Outage Events in 2015 7. Summary List of MEDs per IEEE 1366 8. Historical Ten Largest Unplanned Outage Events (2006-2015) 9. The Number of Customer Inquiries on Reliability Data and the Number of
Days per Response 10. Appendix A – Definitions, Acronyms and Abbreviations
In 2015, PG&E implemented a new outage reporting system that included the data conversion of its legacy (DART/OUTAGE) database. This new system consists of two main components that are typically referred to as PG&E’s Integrated Logging and Information System (ILIS) and its Operations Database (ODB), also called ILIS-ODB for short. ILIS models the actual electric switching operations reported during the circuit restoration process (which is useful for determining accurate customer outage minutes for calculating SAIDI and CAIDI). PG&E maintains account specific information for customers affected by outages that are recorded and stored in PG&E’s ODB. This system tracks outages at various levels (generation, transmission, substation, primary distribution, and individual transformers) and the most current outage data was used to compile the information contained in this report. Distribution operators log outage information in PG&E’s ILIS tool, which uses minutes as the smallest time increment to record the outage start, switching operations, and outage end times. SmartMeters measure outage duration in seconds and are used to automatically report momentary outages beyond non-SCADA auto-reclosing devices. Momentary outages for SCADA related and other events are logged by distribution operators using the ILIS tool, which does not have the benefit of measuring the outage duration in seconds. Consequently and although infrequent, it is possible that an outage duration is recorded as 5 minutes when the actual outage duration was up to 5 minutes and 59 seconds. In 2015, PG&E updated its reporting tools and process to help minimize this occurrence and allows the operator in these situations to log this event as a 6 minute sustained outage.

11
We have added a list of Definitions, Acronyms and Abbreviations at the end as Appendix A to help the reader who is not familiar with the jargon used in reliability reporting.

12
1. System Indices For The last Ten Years
a. System Indices (2006-2015)
Table 2 lists the required SAIDI, SAIFI, MAIFI4, and CAIDI with MED Included and Excluded as directed in Appendix B of D.16-01-0085:
Table 2 – Combine Transmission and Distribution System Indices6 (2006-2015)
(Excludes planned and ISO outages)
Note: Includes Generation, Transmission, Substation, and Distribution related outages
4 On November 18, 2011 the EON recording system was removed from service. Momentary outage data is now being collected from SCADA devices and through the use of Smart Meters. Data collection from the Smart Meters is more effective than the previous EON system since Smart Meters don’t rely on customer volunteers having EON devices securely connected inside their buildings. The increased frequency of momentary outages recorded does not indicate an actual increase in momentary outages in 2012 and after as compared to prior years, but is a result of this improved method for recording momentary outages. 5 In the course of preparing this report, PG&E realized that it made minor errors in last year’s report. For example, for 2014 System Indices including both transmission and distribution, and excluding major event days, SAIFI should have been 0.879 (instead of 0.880), MAIFI should have been 1.393 (instead of 1.391), and CAIDI should have been 105.6 (instead of 105.4). This year’s report includes corrected historical figures for all included system indices and divisional indices. 6 Several tables containing 2015 system results have been updated based on PG&E’s master outage data base as of July 8, 2016. These updates show slightly lower overall system results (in other words, better reliability) compared to the May 31, 2016 draft report provided to Energy Division. The results with respect to sustained outages dropped by 0.1% to 1.2%, while the results for momentary outages fell by 2.8% to 5.3%.
The reduction in momentary outages is primarily related to a data processing error discovered and resolved in June 2016. PG&E has used Smart Meter technology to automatically record momentary outages for several years. That technology relies on a de-duplication process to accurately identify the location and customers impacted. However, a data processing gap occurred when PG&E implemented other software initiatives that prevented this de-duplication process from working correctly for all scenarios. This error, which has now been corrected, was difficult to identify since the de-duplication process worked in most but not all cases. Although the system tables in this report have been updated, the division metrics and the variances discussions have not been updated, due to the relatively small nature of the differences.
SAIDI SAIFI MAIFI CAIDI SAIDI SAIFI MAIFI CAIDI2006 286.7 1.728 1.781 165.9 171.1 1.347 1.585 127.02007 162.4 1.254 1.570 129.5 144.8 1.204 1.521 120.32008 424.0 1.575 1.831 269.2 156.9 1.208 1.594 129.92009 211.8 1.316 1.544 160.9 134.3 1.119 1.395 120.02010 249.5 1.394 1.488 179.0 130.2 1.106 1.253 117.72011 278.8 1.267 1.483 219.9 109.7 0.966 1.172 113.62012 141.4 1.125 1.923 125.7 111.2 1.031 1.802 107.82013 117.8 1.065 1.638 110.6 96.4 0.964 1.529 100.02014 133.8 1.044 1.565 128.2 92.8 0.879 1.393 105.62015 130.0 0.965 1.764 134.7 80.5 0.786 1.541 102.5
Major Event Day (MED) ExcludedMajor Event Day (MED) IncludedYear

13
i. Distribution System Indices
Table 3 – Distribution System Indices (2006-2015) (Excludes planned outages, transmission, substation, and generation related outages)
Note: PG&E defines its distribution system as line voltage less than 50 kilovolts (KV)
The MAIFI information is not included in Table 3 since non-SCADA automatic recording devices (EON or Smart Meters) do not distinguish between transmission system outages or distribution system outages.
ii. Transmission System Indices
Table 4 – Transmission System Indices (2006-2015) (Excludes planned outages, distribution, and generation related outages)
(Includes substation outages)
Note: PG&E defines its transmission system as line voltage 60 kilovolts (KV) and above The MAIFI information is not included in Table 4 since non-SCADA automatic recording devices do not distinguish between transmission system outages or distribution system outages.
Major Event Day (MED) Included Major Event Day (MED) ExcludedSAIDI SAIFI CAIDI SAIDI SAIFI CAIDI
2006 247.1 1.478 167.1 147.0 1.142 128.72007 131.1 1.047 125.2 121.5 1.019 119.22008 374.9 1.363 275.0 132.8 1.041 127.52009 191.2 1.151 166.1 119.4 0.974 122.52010 210.8 1.164 181.1 108.2 0.921 117.52011 239.2 1.041 229.7 92.8 0.796 116.52012 120.1 0.959 125.2 96.3 0.882 109.22013 100.1 0.869 115.2 84.8 0.804 105.52014 119.7 0.926 129.2 85.2 0.780 109.22015 99.3 0.803 123.6 72.4 0.688 105.3
Year
SAIDI SAIFI CAIDI SAIDI SAIFI CAIDI2006 39.5 0.249 158.5 24.0 0.204 117.62007 31.3 0.208 150.9 23.3 0.185 126.42008 48.8 0.211 231.0 23.8 0.166 143.62009 20.6 0.165 124.8 14.9 0.144 103.42010 38.7 0.230 168.2 22.0 0.186 118.42011 39.5 0.224 176.2 16.9 0.168 100.62012 21.3 0.165 128.7 14.8 0.149 99.62013 13.1 0.168 77.7 11.7 0.160 72.62014 14.1 0.116 121.0 7.5 0.097 77.82015 30.5 0.159 191.4 7.8 0.095 82.7
Major Event Day (MED) ExcludedMajor Event Day (MED) IncludedYear

14
b. Separate System Charts of SAIDI, SAIFI, MAIFI, and CAIDI for the past 10 years with linear trend line (MED Excluded)
i. SAIDI Performance Results (MED Excluded)
Chart 1: Transmission & Distribution System SAIDI Indices
(Excludes Planned and ISO Outages)
Chart 2: Distribution System SAIDI Indices
(Excludes planned outages, transmission, substation, and generation related outages)

15
Chart 3: Transmission System SAIDI Indices
(Excludes planned outages, distribution, and generation related outages)
(Includes substation outages)
ii. SAIFI Performance Results (MED Excluded)
Chart 4: Transmission & Distribution System SAIFI Indices
(Excludes planned and ISO Outages)

16
Chart 5: Distribution System SAIFI Indices
(Excludes planned outages, transmission, substation, and generation related outages)
Chart 6: Transmission System SAIFI Indices
(Excludes planned outages, distribution, and generation related outages)
(Includes substation outages)

17
iii. MAIFI7 Performance Results (MED Excluded)
Chart 7: Transmission & Distribution System MAIFI Indices
(Excludes planned and ISO Outages)
iv. CAIDI Performance Results (MED Excluded)
Chart 8: Transmission & Distribution System CAIDI Indices
(Excludes planned and ISO Outages)
7 As explained in footnote 4 on page 12 above, on November 18, 2011 the EON recording system was removed from service. Momentary outage data is now being collected from SCADA devices and through the use of Smart Meters. Data collection from the Smart Meters is more effective than the previous EON system since Smart Meters don’t rely on customer volunteers having EON devices securely connected inside their buildings. The increased frequency of momentary outages recorded in 2012 and following years does not indicate an actual increase in momentary outages in 2012 and after as compared to prior years, but is a result of this improved method for recording momentary outages.

18
Chart 9: Distribution System CAIDI Indices
(Excludes planned outages, transmission, substation, and generation related outages)
Chart 10: Transmission System CAIDI Indices
(Excludes planned outages, distribution, and generation related outages)
(Includes substation outages)

19
2. Division Reliability Indices for the past 10 years including and excluding MED
a. Division Reliability Indices for the past 10 years excluding ISO and planned outages and including Major Event Days
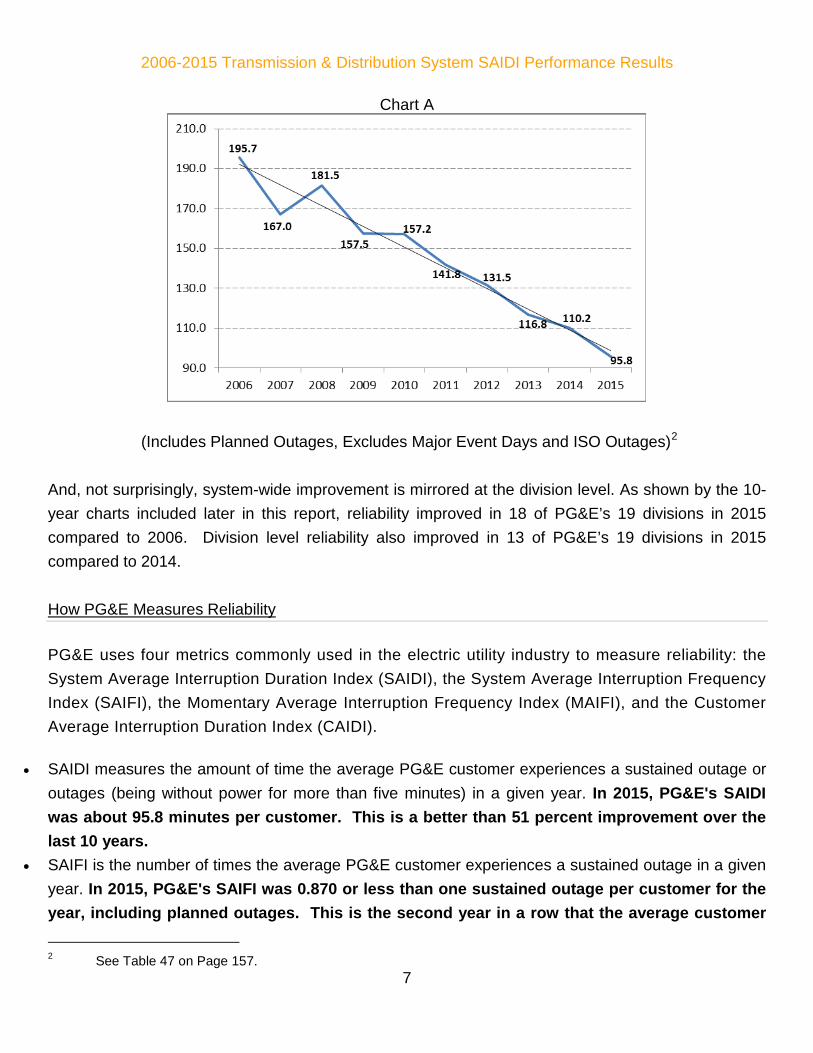
Table 5: Division Reliability Indices
Year Division AIDI AIFI MAIFI CAIDI2006 CENTRAL COAST 419.8 2.222 3.032 188.92007 CENTRAL COAST 214.2 1.859 2.732 115.22008 CENTRAL COAST 768.2 2.256 2.825 340.52009 CENTRAL COAST 445.4 2.321 3.172 191.92010 CENTRAL COAST 390.7 1.984 3.941 196.92011 CENTRAL COAST 497.2 1.995 2.060 249.22012 CENTRAL COAST 152.0 1.317 2.362 115.52013 CENTRAL COAST 125.3 1.315 2.041 95.32014 CENTRAL COAST 199.3 1.351 2.133 147.52015 CENTRAL COAST 253.0 1.289 2.279 196.3Year Division AIDI AIFI MAIFI CAIDI2006 DE ANZA 334.8 1.480 1.639 226.22007 DE ANZA 96.3 0.873 1.136 110.32008 DE ANZA 266.4 1.228 1.723 216.92009 DE ANZA 163.8 0.984 1.633 166.52010 DE ANZA 172.8 1.171 1.420 147.72011 DE ANZA 82.2 0.712 1.495 115.52012 DE ANZA 82.8 0.718 1.223 115.32013 DE ANZA 78.8 0.831 1.173 94.82014 DE ANZA 112.9 1.017 1.318 111.12015 DE ANZA 63.4 0.594 1.303 106.7Year Division AIDI AIFI MAIFI CAIDI2006 DIABLO 312.5 1.867 1.652 167.42007 DIABLO 122.4 1.103 1.579 111.02008 DIABLO 202.9 1.457 2.101 139.32009 DIABLO 161.1 1.376 1.203 117.12010 DIABLO 119.9 1.376 1.309 87.12011 DIABLO 78.7 0.936 1.394 84.02012 DIABLO 105.3 1.230 1.400 85.62013 DIABLO 83.1 1.023 1.297 81.32014 DIABLO 82.2 0.979 1.374 84.02015 DIABLO 84.0 0.981 1.961 85.6Year Division AIDI AIFI MAIFI CAIDI2006 EAST BAY 168.1 1.215 1.002 138.32007 EAST BAY 166.9 1.318 1.012 126.62008 EAST BAY 157.8 1.001 0.872 157.72009 EAST BAY 139.6 1.146 0.944 121.82010 EAST BAY 126.3 1.092 0.754 115.72011 EAST BAY 104.5 0.981 1.060 106.62012 EAST BAY 110.7 1.372 1.347 80.72013 EAST BAY 117.3 1.010 1.266 116.22014 EAST BAY 81.1 0.847 1.515 95.82015 EAST BAY 59.6 0.723 1.218 82.5
20
Year Division AIDI AIFI MAIFI CAIDI2006 FRESNO 304.3 2.214 2.341 137.42007 FRESNO 232.0 1.779 2.243 130.42008 FRESNO 201.0 1.600 1.793 125.62009 FRESNO 153.2 1.293 1.916 118.52010 FRESNO 175.4 1.275 1.953 137.62011 FRESNO 164.9 1.122 2.012 147.02012 FRESNO 100.1 1.066 2.359 94.02013 FRESNO 95.0 1.100 2.104 86.42014 FRESNO 81.6 1.002 1.781 81.52015 FRESNO 100.3 1.151 2.132 87.2Year Division AIDI AIFI MAIFI CAIDI2006 HUMBOLDT 1,076.0 2.838 3.855 379.12007 HUMBOLDT 556.8 1.837 3.325 303.02008 HUMBOLDT 1,062.7 2.708 3.367 392.52009 HUMBOLDT 243.4 1.710 2.482 142.32010 HUMBOLDT 575.3 2.537 1.686 226.72011 HUMBOLDT 543.1 1.954 2.282 277.92012 HUMBOLDT 338.1 1.747 4.654 193.52013 HUMBOLDT 304.3 1.416 2.627 214.92014 HUMBOLDT 288.4 1.368 1.940 210.92015 HUMBOLDT 695.2 2.234 2.839 311.2Year Division AIDI AIFI MAIFI CAIDI2006 KERN 216.3 1.640 1.970 131.92007 KERN 124.0 1.132 1.580 109.62008 KERN 176.7 1.349 1.260 130.92009 KERN 111.5 1.156 1.534 96.42010 KERN 137.4 1.198 1.566 114.82011 KERN 169.8 1.273 1.617 133.42012 KERN 89.2 0.999 1.218 89.22013 KERN 91.3 1.073 1.226 85.12014 KERN 108.8 1.109 1.848 98.22015 KERN 91.9 0.946 1.972 97.2Year Division AIDI AIFI MAIFI CAIDI2006 LOS PADRES 377.2 2.239 3.211 168.52007 LOS PADRES 141.4 1.172 2.683 120.72008 LOS PADRES 237.5 1.785 3.114 133.12009 LOS PADRES 178.4 1.264 1.723 141.12010 LOS PADRES 277.0 1.745 2.045 158.72011 LOS PADRES 135.4 1.230 2.195 110.12012 LOS PADRES 95.4 1.010 1.658 94.42013 LOS PADRES 212.5 1.495 1.105 142.12014 LOS PADRES 186.6 1.238 1.354 150.72015 LOS PADRES 132.2 0.844 1.869 156.6

21
Year Division AIDI AIFI MAIFI CAIDI2006 MISSION 123.9 1.059 1.259 116.92007 MISSION 83.5 0.833 1.022 100.22008 MISSION 108.0 1.016 1.499 106.42009 MISSION 93.7 0.796 0.874 117.62010 MISSION 111.1 0.987 0.794 112.52011 MISSION 74.3 0.869 0.656 85.42012 MISSION 93.9 0.931 0.862 100.92013 MISSION 73.5 0.805 0.837 91.32014 MISSION 73.7 0.751 0.820 98.12015 MISSION 62.6 0.596 1.160 105.1Year Division AIDI AIFI MAIFI CAIDI2006 NORTH BAY 232.3 1.423 1.472 163.22007 NORTH BAY 119.0 1.076 1.802 110.62008 NORTH BAY 571.5 1.639 1.886 348.72009 NORTH BAY 155.3 1.210 1.031 128.32010 NORTH BAY 161.8 1.233 1.401 131.22011 NORTH BAY 202.8 1.332 1.230 152.32012 NORTH BAY 140.4 0.920 1.949 152.62013 NORTH BAY 114.0 0.996 1.730 114.52014 NORTH BAY 235.1 1.250 2.721 188.12015 NORTH BAY 135.4 1.059 2.161 127.9Year Division AIDI AIFI MAIFI CAIDI2006 NORTH VALLEY 310.3 2.267 2.129 136.92007 NORTH VALLEY 267.4 1.586 2.133 168.62008 NORTH VALLEY 1,564.4 2.313 4.194 676.42009 NORTH VALLEY 281.4 1.396 3.159 201.52010 NORTH VALLEY 552.3 1.843 1.979 299.72011 NORTH VALLEY 625.3 2.033 2.133 307.52012 NORTH VALLEY 514.0 1.886 2.947 272.62013 NORTH VALLEY 139.4 1.093 1.962 127.62014 NORTH VALLEY 173.2 1.177 1.778 147.22015 NORTH VALLEY 479.6 1.787 2.595 268.3Year Division AIDI AIFI MAIFI CAIDI2006 PENINSULA 204.7 1.717 1.570 119.22007 PENINSULA 82.9 0.764 1.062 108.52008 PENINSULA 436.5 1.673 2.110 261.02009 PENINSULA 127.2 1.069 0.895 119.02010 PENINSULA 163.6 1.565 1.475 104.62011 PENINSULA 112.7 1.195 0.939 94.32012 PENINSULA 101.1 1.144 1.709 88.42013 PENINSULA 94.3 0.885 1.322 106.52014 PENINSULA 98.4 1.061 1.363 92.82015 PENINSULA 76.2 0.867 1.841 87.9

22
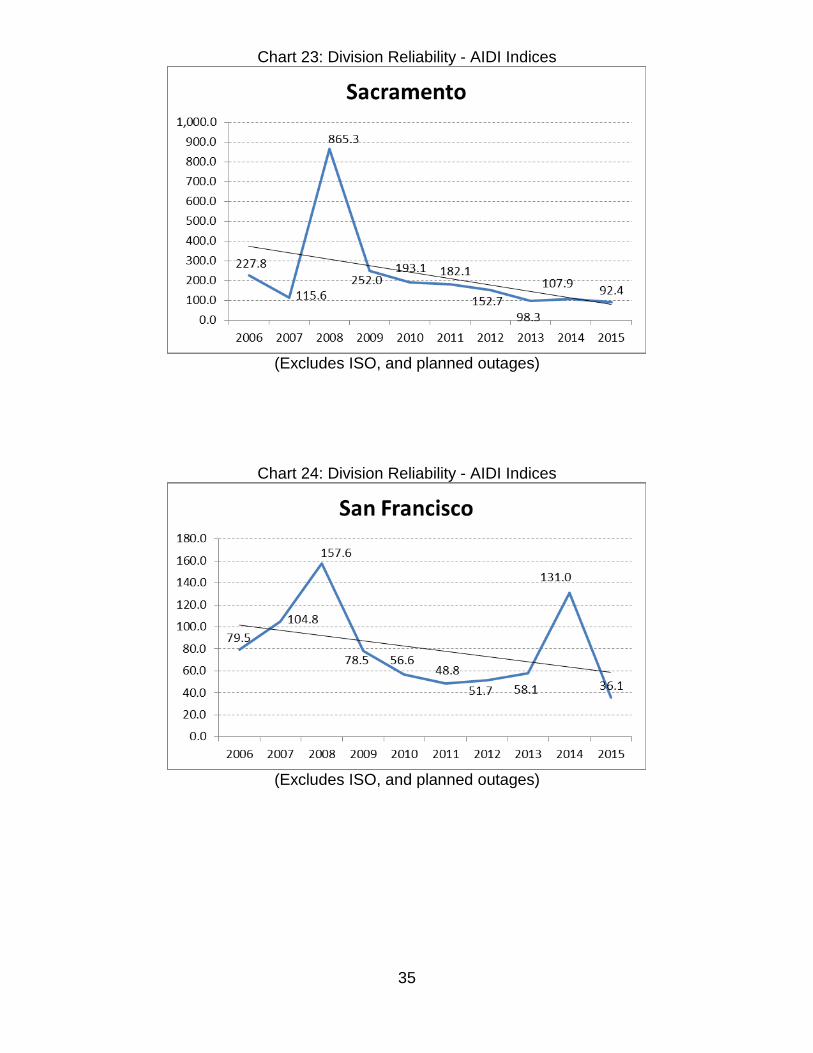
Year Division AIDI AIFI MAIFI CAIDI2006 SACRAMENTO 227.8 1.386 1.903 164.42007 SACRAMENTO 115.6 0.853 1.054 135.62008 SACRAMENTO 865.3 1.878 2.284 460.92009 SACRAMENTO 252.0 1.383 1.826 182.22010 SACRAMENTO 193.1 1.115 1.423 173.22011 SACRAMENTO 182.1 1.203 1.897 151.42012 SACRAMENTO 152.7 1.335 2.142 114.42013 SACRAMENTO 98.3 0.983 1.697 100.02014 SACRAMENTO 107.9 0.913 1.437 118.22015 SACRAMENTO 92.4 0.894 1.843 103.3Year Division AIDI AIFI MAIFI CAIDI2006 SAN FRANCISCO 79.5 0.872 0.301 91.12007 SAN FRANCISCO 104.8 1.048 0.386 100.02008 SAN FRANCISCO 157.6 0.866 0.259 182.02009 SAN FRANCISCO 78.5 0.804 0.139 97.62010 SAN FRANCISCO 56.6 0.709 0.086 79.92011 SAN FRANCISCO 48.8 0.569 0.217 85.92012 SAN FRANCISCO 51.7 0.611 1.051 84.62013 SAN FRANCISCO 58.1 0.657 0.332 88.42014 SAN FRANCISCO 131.0 0.780 0.353 167.92015 SAN FRANCISCO 36.1 0.521 0.544 69.3Year Division AIDI AIFI MAIFI CAIDI2006 SAN JOSE 302.5 1.446 1.030 209.22007 SAN JOSE 101.0 0.950 1.010 106.32008 SAN JOSE 177.3 1.001 1.169 177.12009 SAN JOSE 89.7 0.839 0.830 106.92010 SAN JOSE 103.6 0.920 0.594 112.62011 SAN JOSE 113.8 0.988 0.793 115.22012 SAN JOSE 85.2 0.844 0.972 100.92013 SAN JOSE 99.7 0.962 1.037 103.72014 SAN JOSE 98.9 0.975 1.066 101.42015 SAN JOSE 75.6 0.763 1.197 99.1Year Division AIDI AIFI MAIFI CAIDI2006 SIERRA 377.5 2.173 1.014 173.72007 SIERRA 234.7 1.635 2.011 143.52008 SIERRA 1,235.0 2.115 2.042 583.92009 SIERRA 823.2 2.007 1.507 410.22010 SIERRA 774.9 2.288 1.568 338.72011 SIERRA 1,034.4 2.191 2.764 472.22012 SIERRA 243.2 1.481 3.224 164.22013 SIERRA 156.7 1.411 3.222 111.12014 SIERRA 194.8 1.411 2.349 138.12015 SIERRA 181.9 1.274 3.240 142.8

23
Year Division AIDI AIFI MAIFI CAIDI2006 SONOMA 304.6 1.706 0.843 178.52007 SONOMA 158.9 1.194 1.806 133.12008 SONOMA 454.0 1.337 1.184 339.52009 SONOMA 185.0 1.181 1.610 156.62010 SONOMA 205.2 1.384 1.017 148.22011 SONOMA 246.0 1.283 1.532 191.82012 SONOMA 208.4 1.109 2.030 187.92013 SONOMA 181.7 1.119 2.536 162.32014 SONOMA 214.9 1.270 2.049 169.32015 SONOMA 119.1 0.868 2.004 137.3Year Division AIDI AIFI MAIFI CAIDI2006 STOCKTON 300.9 2.115 2.783 142.32007 STOCKTON 184.9 1.640 1.829 112.72008 STOCKTON 284.3 1.472 2.217 193.22009 STOCKTON 411.9 1.795 3.117 229.42010 STOCKTON 386.3 1.711 1.603 225.82011 STOCKTON 473.7 1.766 1.182 268.22012 STOCKTON 166.1 1.166 2.095 142.42013 STOCKTON 115.6 1.462 2.137 79.12014 STOCKTON 107.6 0.803 1.444 134.02015 STOCKTON 125.3 1.035 2.285 121.1Year Division AIDI AIFI MAIFI CAIDI2006 YOSEMITE 355.5 2.380 2.979 149.42007 YOSEMITE 228.2 1.605 1.419 142.22008 YOSEMITE 318.9 1.627 1.604 196.02009 YOSEMITE 261.1 1.415 1.760 184.52010 YOSEMITE 711.1 2.015 3.164 352.92011 YOSEMITE 1,172.0 1.984 2.632 590.82012 YOSEMITE 147.7 1.311 4.168 112.62013 YOSEMITE 189.1 1.362 3.429 138.92014 YOSEMITE 135.6 1.290 2.669 105.22015 YOSEMITE 112.3 1.072 3.180 104.8

24
b. Division Reliability Indices for the past 10 years excluding planned outages, ISO outages and Major Event Days
Table 6: Division reliability Indices
Year Division AIDI AIFI MAIFI CAIDI2006 CENTRAL COAST 222.2 1.621 2.644 137.12007 CENTRAL COAST 212.5 1.850 2.691 114.92008 CENTRAL COAST 246.4 1.644 2.406 149.92009 CENTRAL COAST 218.6 1.902 2.959 115.02010 CENTRAL COAST 171.1 1.511 2.928 113.22011 CENTRAL COAST 156.8 1.513 1.576 103.62012 CENTRAL COAST 137.4 1.244 2.184 110.42013 CENTRAL COAST 119.7 1.291 1.958 92.72014 CENTRAL COAST 122.1 1.088 1.835 112.32015 CENTRAL COAST 102.0 0.847 1.845 120.4Year Division AIDI AIFI MAIFI CAIDI2006 DE ANZA 107.1 0.877 1.404 122.12007 DE ANZA 95.5 0.870 1.106 109.82008 DE ANZA 104.8 0.911 1.495 115.02009 DE ANZA 109.5 0.842 1.565 130.02010 DE ANZA 116.4 0.958 1.151 121.52011 DE ANZA 62.6 0.625 1.187 100.12012 DE ANZA 74.6 0.668 1.109 111.72013 DE ANZA 77.0 0.821 1.138 93.82014 DE ANZA 89.3 0.890 1.213 100.32015 DE ANZA 51.2 0.476 1.171 107.6Year Division AIDI AIFI MAIFI CAIDI2006 DIABLO 145.0 1.305 1.466 111.22007 DIABLO 122.1 1.101 1.577 110.92008 DIABLO 139.5 1.335 1.922 104.52009 DIABLO 146.7 1.282 1.165 114.42010 DIABLO 104.3 1.225 1.216 85.12011 DIABLO 66.8 0.808 1.235 82.72012 DIABLO 98.8 1.186 1.363 83.32013 DIABLO 80.4 1.001 1.237 80.32014 DIABLO 66.1 0.892 1.220 74.12015 DIABLO 74.0 0.856 1.669 86.5Year Division AIDI AIFI MAIFI CAIDI2006 EAST BAY 142.4 1.071 0.872 133.02007 EAST BAY 164.6 1.297 1.003 126.92008 EAST BAY 96.4 0.821 0.828 117.52009 EAST BAY 125.2 1.049 0.896 119.42010 EAST BAY 90.5 0.874 0.678 103.42011 EAST BAY 88.1 0.868 0.830 101.52012 EAST BAY 100.6 1.289 1.278 78.02013 EAST BAY 63.0 0.832 1.155 75.62014 EAST BAY 64.8 0.726 1.299 89.22015 EAST BAY 45.0 0.586 1.079 76.9

25
Year Division AIDI AIFI MAIFI CAIDI2006 FRESNO 214.1 1.757 2.215 121.92007 FRESNO 230.2 1.759 2.224 130.92008 FRESNO 176.2 1.485 1.737 118.62009 FRESNO 136.5 1.167 1.768 116.92010 FRESNO 115.0 1.054 1.846 109.12011 FRESNO 81.6 0.815 1.685 100.12012 FRESNO 98.6 1.043 2.323 94.52013 FRESNO 92.4 1.068 2.063 86.52014 FRESNO 79.4 0.983 1.709 80.72015 FRESNO 70.0 0.849 1.829 82.4Year Division AIDI AIFI MAIFI CAIDI2006 HUMBOLDT 521.5 2.113 3.114 246.82007 HUMBOLDT 396.1 1.669 3.250 237.32008 HUMBOLDT 393.5 1.933 2.927 203.62009 HUMBOLDT 224.1 1.573 2.341 142.52010 HUMBOLDT 402.9 2.158 1.505 186.72011 HUMBOLDT 227.0 1.448 1.887 156.82012 HUMBOLDT 276.6 1.560 4.330 177.32013 HUMBOLDT 210.4 1.170 2.437 179.82014 HUMBOLDT 212.4 1.217 1.809 174.52015 HUMBOLDT 276.3 1.621 2.418 170.5Year Division AIDI AIFI MAIFI CAIDI2006 KERN 173.9 1.470 1.842 118.32007 KERN 123.9 1.131 1.580 109.52008 KERN 139.7 1.181 1.101 118.32009 KERN 100.2 1.085 1.439 92.42010 KERN 120.4 1.076 1.408 111.92011 KERN 112.5 0.979 1.340 114.82012 KERN 88.1 0.981 1.218 89.82013 KERN 87.5 1.027 1.133 85.22014 KERN 81.0 0.936 1.635 86.52015 KERN 80.3 0.862 1.850 93.2Year Division AIDI AIFI MAIFI CAIDI2006 LOS PADRES 205.4 1.672 2.631 122.82007 LOS PADRES 141.3 1.171 2.683 120.72008 LOS PADRES 136.2 1.331 2.756 102.32009 LOS PADRES 100.8 0.999 1.333 100.82010 LOS PADRES 110.5 1.159 1.722 95.32011 LOS PADRES 89.9 0.970 1.666 92.72012 LOS PADRES 94.8 1.008 1.652 94.12013 LOS PADRES 86.7 0.726 0.960 119.52014 LOS PADRES 95.2 1.043 1.135 91.22015 LOS PADRES 72.2 0.687 1.408 105.1

26
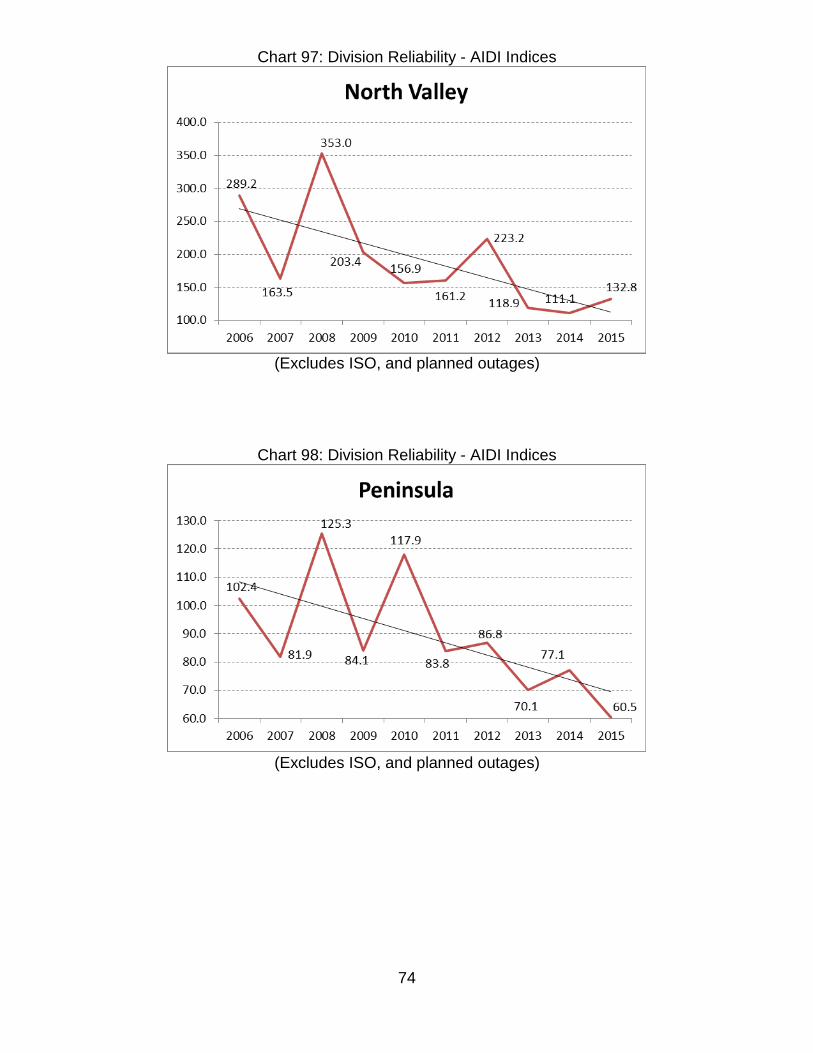
Year Division AIDI AIFI MAIFI CAIDI2006 MISSION 84.0 0.916 1.212 91.82007 MISSION 83.4 0.832 1.022 100.32008 MISSION 81.3 0.884 1.408 91.92009 MISSION 87.2 0.731 0.848 119.22010 MISSION 101.4 0.910 0.723 111.52011 MISSION 62.9 0.781 0.586 80.62012 MISSION 91.2 0.905 0.860 100.72013 MISSION 67.8 0.736 0.775 92.12014 MISSION 62.9 0.672 0.770 93.62015 MISSION 56.7 0.543 1.054 104.4Year Division AIDI AIFI MAIFI CAIDI2006 NORTH BAY 135.3 1.073 1.345 126.12007 NORTH BAY 118.3 1.073 1.800 110.32008 NORTH BAY 155.5 1.205 1.685 129.02009 NORTH BAY 112.6 1.033 0.915 109.02010 NORTH BAY 133.9 1.035 1.294 129.32011 NORTH BAY 110.7 1.074 1.094 103.12012 NORTH BAY 109.7 0.791 1.646 138.82013 NORTH BAY 101.8 0.910 1.455 111.92014 NORTH BAY 114.6 0.875 2.505 131.02015 NORTH BAY 97.4 0.904 1.977 107.8Year Division AIDI AIFI MAIFI CAIDI2006 NORTH VALLEY 289.2 2.142 2.076 135.02007 NORTH VALLEY 163.5 1.344 1.947 121.62008 NORTH VALLEY 353.0 1.674 3.451 210.82009 NORTH VALLEY 203.4 1.182 3.026 172.12010 NORTH VALLEY 156.9 1.220 1.814 128.72011 NORTH VALLEY 161.2 1.218 1.557 132.32012 NORTH VALLEY 223.2 1.505 2.576 148.32013 NORTH VALLEY 118.9 1.035 1.904 114.92014 NORTH VALLEY 111.1 0.968 1.521 114.82015 NORTH VALLEY 132.8 1.062 1.926 125.0Year Division AIDI AIFI MAIFI CAIDI2006 PENINSULA 102.4 1.073 1.080 95.42007 PENINSULA 81.9 0.758 1.058 108.02008 PENINSULA 125.3 1.007 1.836 124.42009 PENINSULA 84.1 0.832 0.771 101.12010 PENINSULA 117.9 1.324 1.060 89.02011 PENINSULA 83.8 1.047 0.782 80.02012 PENINSULA 86.8 0.999 1.528 86.92013 PENINSULA 70.1 0.785 1.114 89.42014 PENINSULA 77.1 0.898 1.164 85.92015 PENINSULA 60.5 0.752 1.602 80.4

27
Year Division AIDI AIFI MAIFI CAIDI2006 SACRAMENTO 146.4 1.147 1.769 127.62007 SACRAMENTO 112.4 0.833 1.037 135.02008 SACRAMENTO 192.0 1.251 1.713 153.42009 SACRAMENTO 135.1 1.095 1.542 123.42010 SACRAMENTO 118.6 0.875 1.082 135.52011 SACRAMENTO 107.9 0.991 1.693 108.92012 SACRAMENTO 130.1 1.194 1.969 108.92013 SACRAMENTO 93.0 0.937 1.566 99.22014 SACRAMENTO 94.4 0.807 1.258 117.02015 SACRAMENTO 80.1 0.799 1.557 100.3Year Division AIDI AIFI MAIFI CAIDI2006 SAN FRANCISCO 62.2 0.781 0.259 79.72007 SAN FRANCISCO 104.0 1.040 0.386 99.92008 SAN FRANCISCO 64.1 0.684 0.259 93.82009 SAN FRANCISCO 75.6 0.784 0.103 96.42010 SAN FRANCISCO 49.6 0.652 0.066 76.02011 SAN FRANCISCO 45.3 0.540 0.211 83.92012 SAN FRANCISCO 47.0 0.570 1.008 82.62013 SAN FRANCISCO 52.0 0.604 0.302 86.12014 SAN FRANCISCO 41.5 0.457 0.235 90.82015 SAN FRANCISCO 33.9 0.504 0.501 67.2Year Division AIDI AIFI MAIFI CAIDI2006 SAN JOSE 107.6 0.866 0.932 124.22007 SAN JOSE 100.3 0.945 1.008 106.12008 SAN JOSE 90.3 0.769 1.005 117.42009 SAN JOSE 75.8 0.739 0.808 102.52010 SAN JOSE 69.4 0.758 0.525 91.62011 SAN JOSE 101.5 0.900 0.685 112.82012 SAN JOSE 80.6 0.793 0.945 101.62013 SAN JOSE 96.7 0.914 0.977 105.72014 SAN JOSE 76.0 0.806 1.026 94.42015 SAN JOSE 65.9 0.678 1.008 97.2Year Division AIDI AIFI MAIFI CAIDI2006 SIERRA 271.6 1.838 0.881 147.82007 SIERRA 164.8 1.353 1.464 121.82008 SIERRA 277.4 1.507 1.545 184.12009 SIERRA 262.9 1.337 1.219 196.62010 SIERRA 194.0 1.332 1.124 145.62011 SIERRA 179.5 1.168 1.401 153.72012 SIERRA 182.4 1.322 2.906 137.92013 SIERRA 109.9 1.279 3.085 85.92014 SIERRA 142.2 1.210 2.128 117.52015 SIERRA 123.2 1.115 2.813 110.5

28
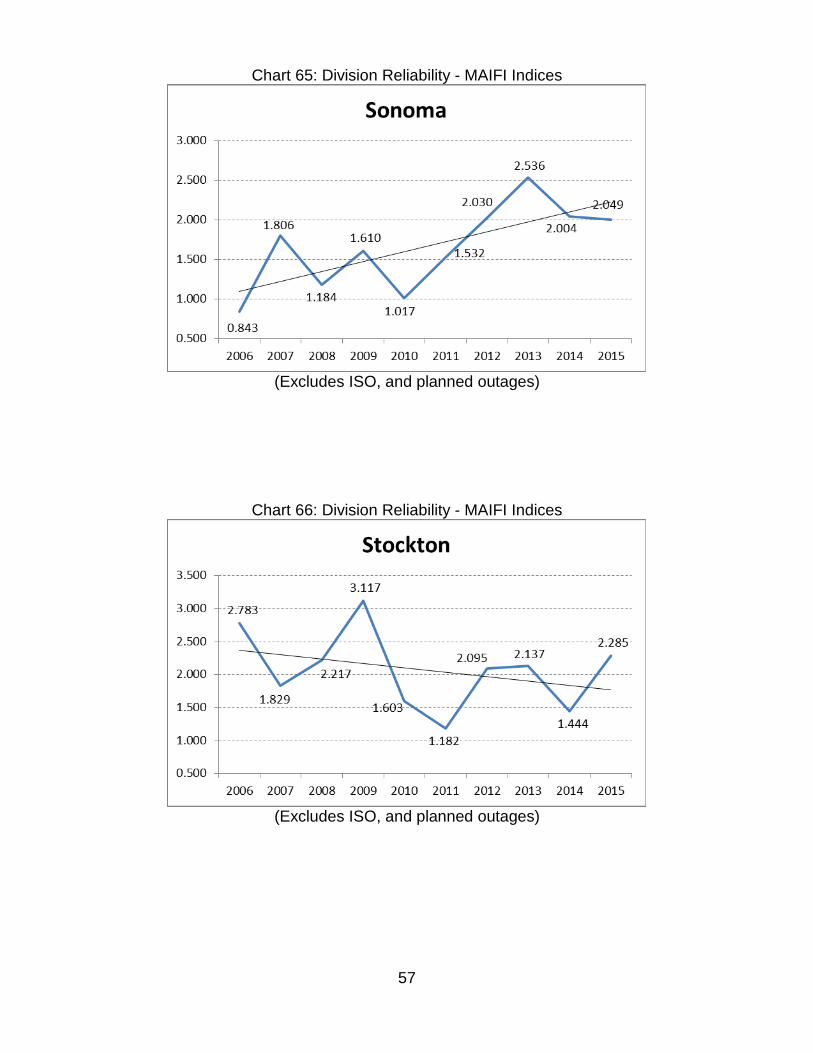
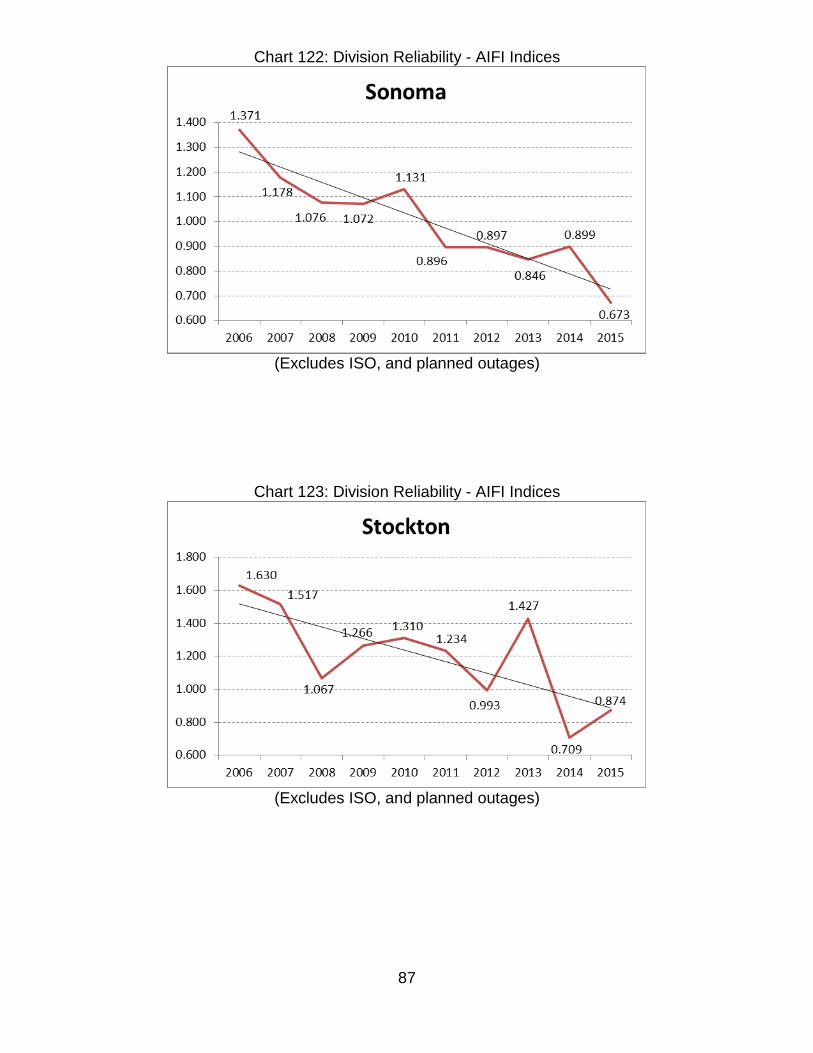
Year Division AIDI AIFI MAIFI CAIDI2006 SONOMA 170.7 1.371 0.794 124.52007 SONOMA 157.4 1.178 1.806 133.62008 SONOMA 158.7 1.076 0.952 147.52009 SONOMA 154.9 1.072 1.357 144.42010 SONOMA 151.4 1.131 0.818 133.92011 SONOMA 103.4 0.896 1.341 115.42012 SONOMA 117.9 0.897 1.730 131.52013 SONOMA 113.4 0.846 2.256 134.02014 SONOMA 113.7 0.899 1.587 126.62015 SONOMA 73.0 0.673 1.531 108.5Year Division AIDI AIFI MAIFI CAIDI2006 STOCKTON 195.7 1.630 2.499 120.12007 STOCKTON 150.0 1.517 1.781 98.92008 STOCKTON 160.6 1.067 1.825 150.52009 STOCKTON 160.1 1.266 2.697 126.42010 STOCKTON 166.2 1.310 1.402 126.82011 STOCKTON 180.5 1.234 0.898 146.22012 STOCKTON 91.1 0.993 1.972 91.82013 STOCKTON 106.5 1.427 2.025 74.62014 STOCKTON 89.7 0.709 1.309 126.42015 STOCKTON 96.9 0.874 1.947 110.9Year Division AIDI AIFI MAIFI CAIDI2006 YOSEMITE 264.3 2.065 2.784 128.02007 YOSEMITE 152.9 1.349 1.240 113.42008 YOSEMITE 205.2 1.303 1.511 157.52009 YOSEMITE 183.4 1.186 1.486 154.62010 YOSEMITE 226.3 1.474 2.598 153.52011 YOSEMITE 207.9 1.279 1.811 162.52012 YOSEMITE 140.8 1.272 4.088 110.72013 YOSEMITE 187.8 1.344 3.259 139.72014 YOSEMITE 117.6 1.226 2.446 96.02015 YOSEMITE 102.3 0.984 2.638 103.9

29
c. Charts for Division Reliability Indices for the past 10 years
i. Charts for Division Reliability Indices for the past 10 years with linear trend line excluding ISO and planned outages and including MED
1. AIDI Performance Results (MED Included)
Chart 11: Division Reliability - AIDI Indices
(Excludes ISO, and planned outages)
Chart 12: Division Reliability - AIDI Indices
(Excludes ISO, and planned outages)

30
Chart 13: Division Reliability - AIDI Indices
(Excludes ISO, and planned outages)
Chart 14: Division Reliability - AIDI Indices
(Excludes ISO, and planned outages)

31
Chart 15: Division Reliability - AIDI Indices
(Excludes ISO, and planned outages)
Chart 16: Division Reliability - AIDI Indices
(Excludes ISO, and planned outages)

32
Chart 17: Division Reliability - AIDI Indices
(Excludes ISO, and planned outages)
Chart 18: Division Reliability - AIDI Indices
(Excludes ISO, and planned outages)

33
Chart 19: Division Reliability - AIDI Indices
(Excludes ISO, and planned outages)
Chart 20: Division Reliability – AIDI Indices
(Excludes ISO, and planned outages)
34
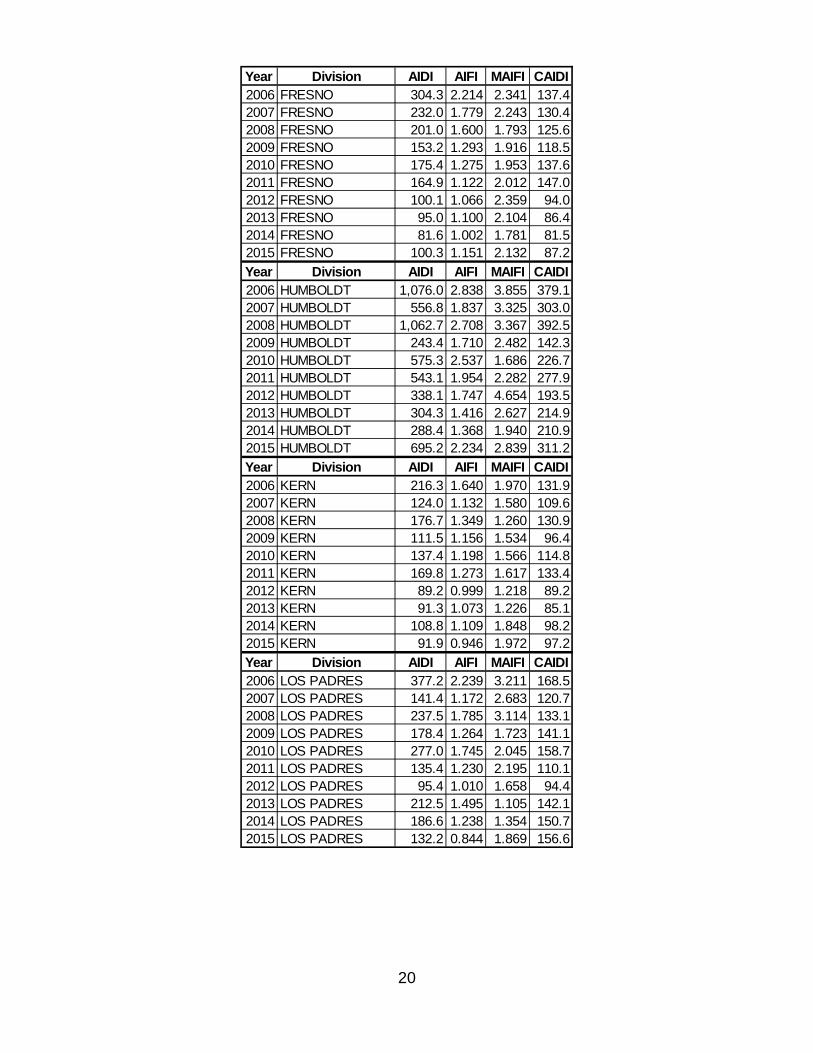
Chart 21: Division Reliability - AIDI Indices
(Excludes ISO, and planned outages)
Chart 22: Division Reliability - AIDI Indices
(Excludes ISO, and planned outages)
35
Chart 23: Division Reliability - AIDI Indices
(Excludes ISO, and planned outages)
Chart 24: Division Reliability - AIDI Indices
(Excludes ISO, and planned outages)

36
Chart 25: Division Reliability - AIDI Indices
(Excludes ISO, and planned outages)
Chart 26: Division Reliability – AIDI Indices
(Excludes ISO, and planned outages)

37
Chart 27: Division Reliability – AIDI Indices
(Excludes ISO, and planned outages)
Chart 28: Division Reliability - AIDI Indices
(Excludes ISO, and planned outages)

38
Chart 29: Division Reliability - AIDI Indices
(Excludes ISO, and planned outages)

39
2. AIFI Performance Results (MED Included)
Chart 30: Division Reliability - AIFI Indices
Chart 31: Division Reliability - AIFI Indices
(Excludes ISO, and planned outages)

40
Chart 32: Division Reliability - AIFI Indices
(Excludes ISO, and planned outages)
Chart 33: Division Reliability - AIFI Indices
(Excludes ISO, and planned outages)

41
Chart 34: Division Reliability - AIFI Indices
(Excludes ISO, and planned outages)
Chart 35: Division Reliability - AIFI Indices
(Excludes ISO, and planned outages)

42
Chart 36: Division Reliability - AIFI Indices
(Excludes ISO, and planned outages)
Chart 37: Division Reliability - AIFI Indices
(Excludes ISO, and planned outages)

43
Chart 38: Division Reliability - AIFI Indices
(Excludes ISO, and planned outages)
Chart 39: Division Reliability - AIFI Indices
(Excludes ISO, and planned outages)

44
Chart 40: Division Reliability - AIFI Indices
(Excludes ISO, and planned outages)
Chart 41: Division Reliability - AIFI Indices
(Excludes ISO, and planned outages)

45
Chart 42: Division Reliability - AIFI Indices
(Excludes ISO, and planned outages)
Chart 43: Division Reliability - AIFI Indices
(Excludes ISO, and planned outages)

46
Chart 44: Division Reliability - AIFI Indices
(Excludes ISO, and planned outages)
Chart 45: Division Reliability - AIFI Indices
(Excludes ISO, and planned outages)

47
Chart 46: Division Reliability - AIFI Indices
(Excludes ISO, and planned outages)
Chart 47: Division Reliability - AIFI Indices
(Excludes ISO, and planned outages)

48
Chart 48: Division Reliability - AIFI Indices
(Excludes ISO, and planned outages)

49
3. MAIFI Performance Results (MED Included)
Chart 49: Division Reliability - MAIFI Indices
(Excludes ISO, and planned outages)
Chart 50: Division Reliability - MAIFI Indices
(Excludes ISO, and planned outages)

50
Chart 51: Division Reliability - MAIFI Indices
(Excludes ISO, and planned outages)
Chart 52: Division Reliability - MAIFI Indices
(Excludes ISO, and planned outages)

51
Chart 53: Division Reliability - MAIFI Indices
(Excludes ISO, and planned outages)
Chart 54: Division Reliability - MAIFI Indices
(Excludes ISO, and planned outages)

52
Chart 55: Division Reliability - MAIFI Indices
(Excludes ISO, and planned outages)
Chart 56: Division Reliability - MAIFI Indices
(Excludes ISO, and planned outages)

53
Chart 57: Division Reliability - MAIFI Indices
(Excludes ISO, and planned outages)
Chart 58: Division Reliability - MAIFI Indices
(Excludes ISO, and planned outages)

54
Chart 59: Division Reliability - MAIFI Indices
(Excludes ISO, and planned outages)
Chart 60: Division Reliability - MAIFI Indices
(Excludes ISO, and planned outages)

55
Chart 61: Division Reliability - MAIFI Indices
(Excludes ISO, and planned outages)
Chart 62: Division Reliability - MAIFI Indices
(Excludes ISO, and planned outages)

56
Chart 63: Division Reliability - MAIFI Indices
(Excludes ISO, and planned outages)
Chart 64: Division Reliability - MAIFI Indices
(Excludes ISO, and planned outages)
57
Chart 65: Division Reliability - MAIFI Indices
(Excludes ISO, and planned outages)
Chart 66: Division Reliability - MAIFI Indices
(Excludes ISO, and planned outages)

58
Chart 67: Division Reliability - MAIFI Indices
(Excludes ISO, and planned outages)

59
4. CAIDI Performance Results (MED Included)
Chart 68: Division Reliability - CAIDI Indices
Chart 69: Division Reliability - CAIDI Indices
(Excludes ISO, and planned outages)

60
Chart 70: Division Reliability - CAIDI Indices
(Excludes ISO, and planned outages)
Chart 71: Division Reliability - CAIDI Indices
(Excludes ISO, and planned outages)

61
Chart 72: Division Reliability - CAIDI Indices
(Excludes ISO, and planned outages)
Chart 73: Division Reliability - CAIDI Indices
(Excludes ISO, and planned outages)

62
Chart 74: Division Reliability - CAIDI Indices
(Excludes ISO, and planned outages)
Chart 75: Division Reliability - CAIDI Indices
(Excludes ISO, and planned outages)

63
Chart 76: Division Reliability - CAIDI Indices
(Excludes ISO, and planned outages)
Chart 77: Division Reliability - CAIDI Indices
(Excludes ISO, and planned outages)

64
Chart 78: Division Reliability - CAIDI Indices
(Excludes ISO, and planned outages)
Chart 79: Division Reliability - CAIDI Indices
(Excludes ISO, and planned outages)

65
Chart 80: Division Reliability - CAIDI Indices
(Excludes ISO, and planned outages)
Chart 81: Division Reliability - CAIDI Indices
(Excludes ISO, and planned outages)

66
Chart 82: Division Reliability - CAIDI Indices
(Excludes ISO, and planned outages)
Chart 83: Division Reliability - CAIDI Indices
(Excludes ISO, and planned outages)

67
Chart 84: Division Reliability - CAIDI Indices
(Excludes ISO, and planned outages)
Chart 85: Division Reliability - CAIDI Indices
(Excludes ISO, and planned outages)

68
Chart 86: Division Reliability - CAIDI Indices
(Excludes ISO, and planned outages)

69
ii. Charts for Division Reliability Indices for the past 10 years with linear trend line excluding ISO, planned outages and MED
1. AIDI Performance Results (MED Excluded)
Chart 87: Division Reliability - AIDI Indices
(Excludes ISO, and planned outages)
Chart 88: Division Reliability - AIDI Indices
(Excludes ISO, and planned outages)

70
Chart 89: Division Reliability - AIDI Indices
(Excludes ISO, and planned outages)
Chart 90: Division Reliability - AIDI Indices
(Excludes ISO, and planned outages)

71
Chart 91: Division Reliability - AIDI Indices
(Excludes ISO, and planned outages)
Chart 92: Division Reliability - AIDI Indices
(Excludes ISO, and planned outages)

72
Chart 93: Division Reliability - AIDI Indices
(Excludes ISO, and planned outages)
Chart 94: Division Reliability - AIDI Indices
(Excludes ISO, and planned outages)

73
Chart 95: Division Reliability - AIDI Indices
(Excludes ISO, and planned outages)
Chart 96: Division Reliability - AIDI Indices
(Excludes ISO, and planned outages)
74
Chart 97: Division Reliability - AIDI Indices
(Excludes ISO, and planned outages)
Chart 98: Division Reliability - AIDI Indices
(Excludes ISO, and planned outages)

75
Chart 99: Division Reliability - AIDI Indices
(Excludes ISO, and planned outages)
Chart 100: Division Reliability - AIDI Indices
(Excludes ISO, and planned outages)

76
Chart 101: Division Reliability - AIDI Indices
(Excludes ISO, and planned outages)
Chart 102: Division Reliability - AIDI Indices
(Excludes ISO, and planned outages)

77
Chart 103: Division Reliability - AIDI Indices
(Excludes ISO, and planned outages)
Chart 104: Division Reliability - AIDI Indices
(Excludes ISO, and planned outages)

78
Chart 105: Division Reliability - AIDI Indices
(Excludes ISO, and planned outages)

79
2. AIFI Performance Results (MED Excluded)
Chart 106: Division Reliability - AIFI Indices
(Excludes ISO, and planned outages)
Chart 107: Division Reliability - AIFI Indices
(Excludes ISO, and planned outages)

80
Chart 108: Division Reliability - AIFI Indices
(Excludes ISO, and planned outages)
Chart 109: Division Reliability - AIFI Indices
(Excludes ISO, and planned outages)

81
Chart 110: Division Reliability - AIFI Indices
(Excludes ISO, and planned outages)
Chart 111: Division Reliability - AIFI Indices
(Excludes ISO, and planned outages)

82
Chart 112: Division Reliability - AIFI Indices
(Excludes ISO, and planned outages)
Chart 113: Division Reliability - AIFI Indices
(Excludes ISO, and planned outages)

83
Chart 114: Division Reliability - AIFI Indices
(Excludes ISO, and planned outages)
Chart 115: Division Reliability - AIFI Indices
(Excludes ISO, and planned outages)

84
Chart 116: Division Reliability - AIFI Indices
(Excludes ISO, and planned outages)
Chart 117: Division Reliability - AIFI Indices
(Excludes ISO, and planned outages)

85
Chart 118: Division Reliability - AIFI Indices
(Excludes ISO, and planned outages)
Chart 119: Division Reliability - AIFI Indices
(Excludes ISO, and planned outages)

86
Chart 120: Division Reliability - AIFI Indices
(Excludes ISO, and planned outages)
Chart 121: Division Reliability - AIFI Indices
(Excludes ISO, and planned outages)
87
Chart 122: Division Reliability - AIFI Indices
(Excludes ISO, and planned outages)
Chart 123: Division Reliability - AIFI Indices
(Excludes ISO, and planned outages)

88
Chart 124: Division Reliability - AIFI Indices
(Excludes ISO, and planned outages)
89
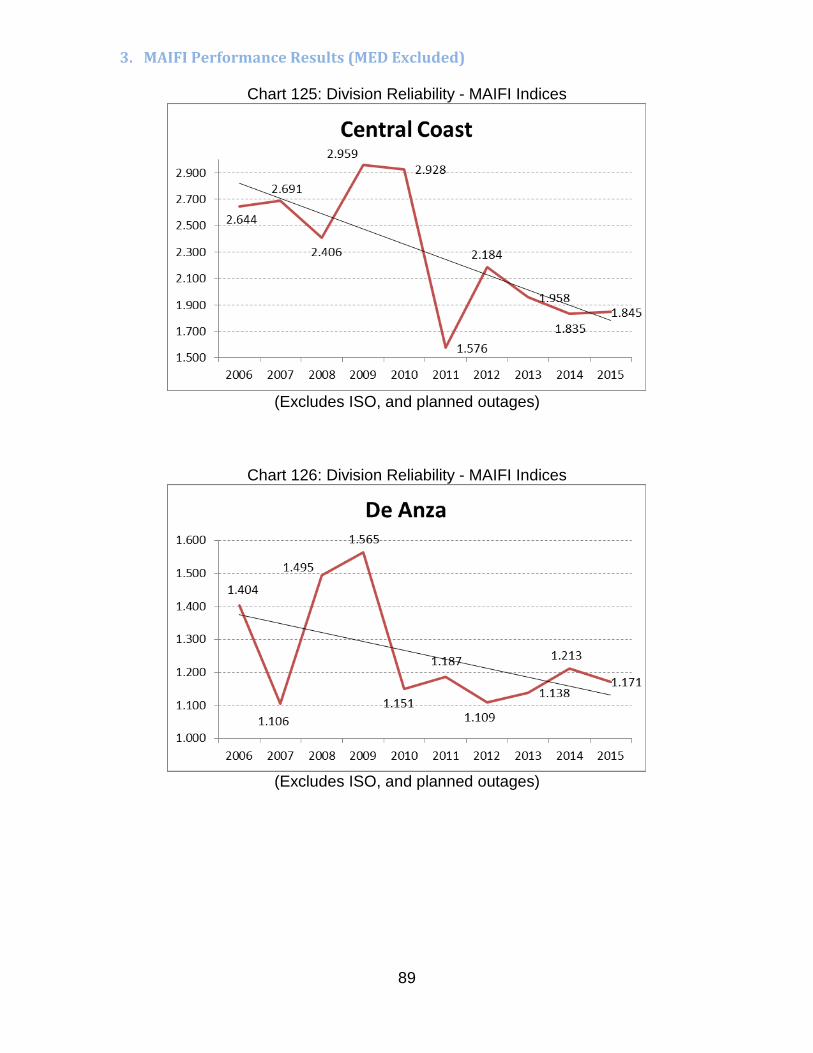
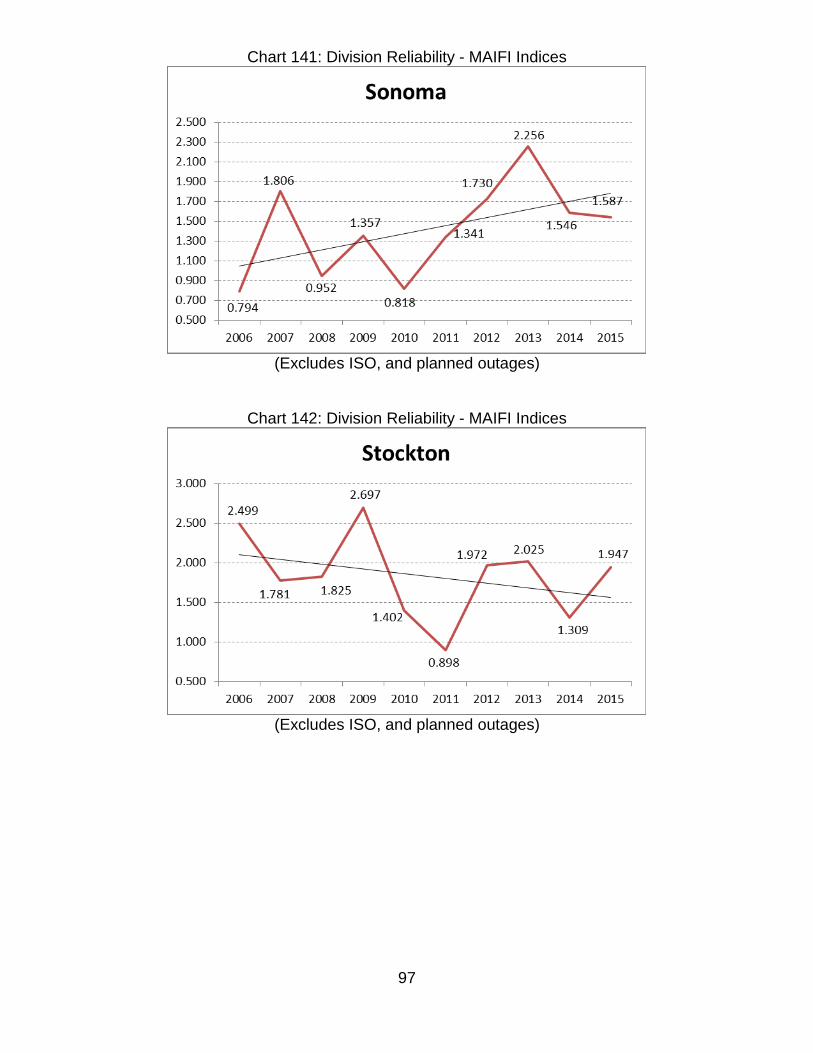
3. MAIFI Performance Results (MED Excluded)
Chart 125: Division Reliability - MAIFI Indices
(Excludes ISO, and planned outages)
Chart 126: Division Reliability - MAIFI Indices
(Excludes ISO, and planned outages)

90
Chart 127: Division Reliability - MAIFI Indices
(Excludes ISO, and planned outages)
Chart 128: Division Reliability - MAIFI Indices
(Excludes ISO, and planned outages)

91
Chart 129: Division Reliability - MAIFI Indices
(Excludes ISO, and planned outages)
Chart 130: Division Reliability - MAIFI Indices
(Excludes ISO, and planned outages)

92
Chart 131: Division Reliability - MAIFI Indices
(Excludes ISO, and planned outages)
Chart 132: Division Reliability - MAIFI Indices
(Excludes ISO, and planned outages)

93
Chart 133: Division Reliability - MAIFI Indices
(Excludes ISO, and planned outages)
Chart 134: Division Reliability - MAIFI Indices
(Excludes ISO, and planned outages)

94
Chart 135: Division Reliability - MAIFI Indices
(Excludes ISO, and planned outages)
Chart 136: Division Reliability - MAIFI Indices
(Excludes ISO, and planned outages)

95
Chart 137: Division Reliability - MAIFI Indices
(Excludes ISO, and planned outages)
Chart 138: Division Reliability - MAIFI Indices
(Excludes ISO, and planned outages)

96
Chart 139: Division Reliability - MAIFI Indices
(Excludes ISO, and planned outages)
Chart 140: Division Reliability - MAIFI Indices
(Excludes ISO, and planned outages)
97
Chart 141: Division Reliability - MAIFI Indices
(Excludes ISO, and planned outages)
Chart 142: Division Reliability - MAIFI Indices
(Excludes ISO, and planned outages)

98
Chart 143: Division Reliability - MAIFI Indices
(Excludes ISO, and planned outages)

99
4. CAIDI Performance Results (MED Excluded)
Chart 144: Division Reliability - CAIDI Indices
(Excludes ISO, and planned outages)
Chart 145: Division Reliability - CAIDI Indices
(Excludes ISO, and planned outages)

100
Chart 146: Division Reliability - CAIDI Indices
(Excludes ISO, and planned outages)
Chart 147: Division Reliability - CAIDI Indices
(Excludes ISO, and planned outages)

101
Chart 148: Division Reliability - CAIDI Indices
(Excludes ISO, and planned outages)
Chart 149: Division Reliability - CAIDI Indices
(Excludes ISO, and planned outages)

102
Chart 150: Division Reliability - CAIDI Indices
(Excludes ISO, and planned outages)
Chart 151: Division Reliability - CAIDI Indices
(Excludes ISO, and planned outages)

103
Chart 152: Division Reliability - CAIDI Indices
(Excludes ISO, and planned outages)
Chart 153: Division Reliability - CAIDI Indices
(Excludes ISO, and planned outages)

104
Chart 154: Division Reliability - CAIDI Indices
(Excludes ISO, and planned outages)
Chart 155: Division Reliability - CAIDI Indices
(Excludes ISO, and planned outages)

105
Chart 156: Division Reliability - CAIDI Indices
(Excludes ISO, and planned outages)
Chart 157: Division Reliability - CAIDI Indices
(Excludes ISO, and planned outages)

106
Chart 158: Division Reliability - CAIDI Indices
(Excludes ISO, and planned outages)
Chart 159: Division Reliability - CAIDI Indices
(Excludes ISO, and planned outages)

107
Chart 160: Division Reliability - CAIDI Indices
(Excludes ISO, and planned outages)
Chart 161: Division Reliability - CAIDI Indices
(Excludes ISO, and planned outages)

108
Chart 162: Division Reliability - CAIDI Indices
(Excludes ISO, and planned outages)

109
d. Division and System Reliability Indices Performance Variances (Five-Year Average)
This section contains additional division reliability information, as required by Decision 04-10-034, and Decision 16-01-008, Appendix B, footnote 6. This section explains threshold variations (unplanned outages only) in division and/or system reliability indices relative to the prior five-year averages (excluding major events, as defined per the IEEE 1366 methodology). This section also highlights the large outage events in each division that exceeded the reporting threshold. Table 7 summarizes the 2015 division indices that meet the reporting requirement thresholds of 10 percent or more for the division, and 5 percent or more at the system level worse than the five year rolling average of reliability performance per D. 04-10-034.8 An “X” indicates that the 2015 Division and system index exceeded the 10 percent and 5 percent threshold, respectively, and is thus discussed in detail in this section.
Table 7 – 2015 Indices excluding Major Events (Meeting the Reporting Requirement Thresholds)
8 As in prior reports, PG&E does not interpret this reporting requirement as applying to those indices where 2015 reliability was better than the prior five-year average.
SAIDI SAIFI MAIFI CAIDISYSTEM X
CENTRAL COAST XDE ANZA DIABLO XEAST BAY FRESNO
HUMBOLDT KERN X
LOS PADRES MISSION X
NORTH BAY XNORTH VALLEY
PENINSULA XSACRAMENTO SAN FRANCISCO X
SAN JOSE XSIERRA X
SONOMA STOCKTON X YOSEMITE

110
Table 8: Division and System Reliability Indices Performance Variances (Excluding MED)
Year Division SAIDI SAIFI MAIFI CAIDI2010 SYSTEM 130.3 1.106 1.250 117.82011 SYSTEM 109.6 0.974 1.163 112.52012 SYSTEM 110.7 1.036 1.796 106.82013 SYSTEM 95.8 0.969 1.523 98.92014 SYSTEM 90.1 0.877 1.390 102.8
5-Yr Ave 10-14 Avg 107.3 0.992 1.424 107.82015 SYSTEM 80.7 0.786 1.584 102.7
% Difference -24.8% -20.8% 11.2% -4.7%
Year Division SAIDI SAIFI MAIFI CAIDI2010 CENTRAL COAST 171.1 1.511 2.928 113.22011 CENTRAL COAST 156.8 1.513 1.576 103.62012 CENTRAL COAST 137.4 1.244 2.184 110.42013 CENTRAL COAST 119.7 1.291 1.958 92.72014 CENTRAL COAST 122.1 1.088 1.835 112.3
5-Yr Ave 10-14 Avg 141.4 1.329 2.096 106.42015 CENTRAL COAST 102.0 0.847 1.845 120.4
% Difference -27.9% -36.3% -12.0% 13.1%
Year Division SAIDI SAIFI MAIFI CAIDI2010 DE ANZA 116.4 0.958 1.151 121.52011 DE ANZA 62.6 0.625 1.187 100.12012 DE ANZA 74.6 0.668 1.109 111.72013 DE ANZA 77.0 0.821 1.138 93.82014 DE ANZA 89.3 0.890 1.213 100.3
5-Yr Ave 10-14 Avg 84.0 0.792 1.160 105.52015 DE ANZA 51.2 0.476 1.171 107.6
% Difference -39.0% -39.9% 1.0% 2.0%
Year Division SAIDI SAIFI MAIFI CAIDI2010 DIABLO 104.3 1.225 1.216 85.12011 DIABLO 66.8 0.808 1.235 82.72012 DIABLO 98.8 1.186 1.363 83.32013 DIABLO 80.4 1.001 1.237 80.32014 DIABLO 66.1 0.892 1.220 74.1
5-Yr Ave 10-14 Avg 83.3 1.022 1.254 81.12015 DIABLO 74.0 0.856 1.669 86.5
% Difference -11.1% -16.3% 33.1% 6.7%

111
Division Reliability Indices 2010-2015
(Excluding MED)
Year Division SAIDI SAIFI MAIFI CAIDI2010 EAST BAY 90.5 0.874 0.678 103.42011 EAST BAY 88.1 0.868 0.830 101.52012 EAST BAY 100.6 1.289 1.278 78.02013 EAST BAY 63.0 0.832 1.155 75.62014 EAST BAY 64.8 0.726 1.299 89.2
5-Yr Ave 10-14 Avg 81.4 0.918 1.048 89.52015 EAST BAY 45.0 0.586 1.079 76.9
% Difference -44.7% -36.2% 3.0% -14.1%
Year Division SAIDI SAIFI MAIFI CAIDI2010 FRESNO 115.0 1.054 1.846 109.12011 FRESNO 81.6 0.815 1.685 100.12012 FRESNO 98.6 1.043 2.323 94.52013 FRESNO 92.4 1.068 2.063 86.52014 FRESNO 79.4 0.983 1.709 80.7
5-Yr Ave 10-14 Avg 93.4 0.993 1.925 94.22015 FRESNO 70.0 0.849 1.829 82.4
% Difference -25.1% -14.5% -5.0% -12.5%
Year Division SAIDI SAIFI MAIFI CAIDI2010 HUMBOLDT 402.9 2.158 1.505 186.72011 HUMBOLDT 227.0 1.448 1.887 156.82012 HUMBOLDT 276.6 1.560 4.330 177.32013 HUMBOLDT 210.4 1.170 2.437 179.82014 HUMBOLDT 212.4 1.217 1.809 174.5
5-Yr Ave 10-14 Avg 265.9 1.511 2.394 175.02015 HUMBOLDT 276.3 1.621 2.418 170.5
% Difference 3.9% 7.3% 1.0% -2.6%
Year Division SAIDI SAIFI MAIFI CAIDI2010 KERN 120.4 1.076 1.408 111.92011 KERN 112.5 0.979 1.340 114.82012 KERN 88.1 0.981 1.218 89.82013 KERN 87.5 1.027 1.133 85.22014 KERN 81.0 0.936 1.635 86.5
5-Yr Ave 10-14 Avg 97.9 1.000 1.347 97.62015 KERN 80.3 0.862 1.850 93.2
% Difference -18.0% -13.8% 37.4% -4.5%

112
Division Reliability Indices 2010-2015
(Excluding MED)
Year Division SAIDI SAIFI MAIFI CAIDI2010 LOS PADRES 110.5 1.159 1.722 95.32011 LOS PADRES 89.9 0.970 1.666 92.72012 LOS PADRES 94.8 1.008 1.652 94.12013 LOS PADRES 86.7 0.726 0.960 119.52014 LOS PADRES 95.2 1.043 1.135 91.2
5-Yr Ave 10-14 Avg 95.4 0.981 1.427 98.62015 LOS PADRES 72.2 0.687 1.408 105.1
% Difference -24.3% -30.0% -1.3% 6.6%
Year Division SAIDI SAIFI MAIFI CAIDI2010 MISSION 101.4 0.910 0.723 111.52011 MISSION 62.9 0.781 0.586 80.62012 MISSION 91.2 0.905 0.860 100.72013 MISSION 67.8 0.736 0.775 92.12014 MISSION 62.9 0.672 0.770 93.6
5-Yr Ave 10-14 Avg 77.2 0.801 0.743 95.72015 MISSION 56.7 0.543 1.054 104.4
% Difference -26.6% -32.2% 41.9% 9.1%
Year Division SAIDI SAIFI MAIFI CAIDI2010 NORTH BAY 133.9 1.035 1.294 129.32011 NORTH BAY 110.7 1.074 1.094 103.12012 NORTH BAY 109.7 0.791 1.646 138.82013 NORTH BAY 101.8 0.910 1.455 111.92014 NORTH BAY 114.6 0.875 2.505 131.0
5-Yr Ave 10-14 Avg 114.1 0.937 1.599 122.82015 NORTH BAY 97.4 0.904 1.977 107.8
% Difference -14.7% -3.5% 23.7% -12.2%
Year Division SAIDI SAIFI MAIFI CAIDI2010 NORTH VALLEY 156.9 1.220 1.814 128.72011 NORTH VALLEY 161.2 1.218 1.557 132.32012 NORTH VALLEY 223.2 1.505 2.576 148.32013 NORTH VALLEY 118.9 1.035 1.904 114.92014 NORTH VALLEY 111.1 0.968 1.521 114.8
5-Yr Ave 10-14 Avg 154.3 1.189 1.874 127.82015 NORTH VALLEY 132.8 1.062 1.926 125.0
% Difference -13.9% -10.7% 2.8% -2.2%

113
Division Reliability Indices 2010-2015
(Excluding MED)
Year Division SAIDI SAIFI MAIFI CAIDI2010 PENINSULA 117.9 1.324 1.060 89.02011 PENINSULA 83.8 1.047 0.782 80.02012 PENINSULA 86.8 0.999 1.528 86.92013 PENINSULA 70.1 0.785 1.114 89.42014 PENINSULA 77.1 0.898 1.164 85.9
5-Yr Ave 10-14 Avg 87.1 1.011 1.130 86.22015 PENINSULA 60.5 0.752 1.602 80.4
% Difference -30.6% -25.6% 41.8% -6.8%
Year Division SAIDI SAIFI MAIFI CAIDI2010 SACRAMENTO 118.6 0.875 1.082 135.52011 SACRAMENTO 107.9 0.991 1.693 108.92012 SACRAMENTO 130.1 1.194 1.969 108.92013 SACRAMENTO 93.0 0.937 1.566 99.22014 SACRAMENTO 94.4 0.807 1.258 117.0
5-Yr Ave 10-14 Avg 108.8 0.961 1.514 113.92015 SACRAMENTO 80.1 0.799 1.557 100.3
% Difference -26.4% -16.8% 2.9% -11.9%
Year Division SAIDI SAIFI MAIFI CAIDI2010 SAN FRANCISCO 49.6 0.652 0.066 76.02011 SAN FRANCISCO 45.3 0.540 0.211 83.92012 SAN FRANCISCO 47.0 0.570 1.008 82.62013 SAN FRANCISCO 52.0 0.604 0.302 86.12014 SAN FRANCISCO 41.5 0.457 0.235 90.8
5-Yr Ave 10-14 Avg 47.1 0.565 0.364 83.92015 SAN FRANCISCO 33.9 0.504 0.501 67.2
% Difference -28.0% -10.7% 37.5% -19.9%
Year Division SAIDI SAIFI MAIFI CAIDI2010 SAN JOSE 69.4 0.758 0.525 91.62011 SAN JOSE 101.5 0.900 0.685 112.82012 SAN JOSE 80.6 0.793 0.945 101.62013 SAN JOSE 96.7 0.914 0.977 105.72014 SAN JOSE 76.0 0.806 1.026 94.4
5-Yr Ave 10-14 Avg 84.8 0.834 0.832 101.22015 SAN JOSE 65.9 0.678 1.008 97.2
% Difference -22.3% -18.7% 21.2% -4.0%

114
Division Reliability Indices 2010-2015
(Excluding MED)
Year Division SAIDI SAIFI MAIFI CAIDI2010 SIERRA 194.0 1.332 1.124 145.62011 SIERRA 179.5 1.168 1.401 153.72012 SIERRA 182.4 1.322 2.906 137.92013 SIERRA 109.9 1.279 3.085 85.92014 SIERRA 142.2 1.210 2.128 117.5
5-Yr Ave 10-14 Avg 161.6 1.262 2.129 128.12015 SIERRA 123.2 1.115 2.813 110.5
% Difference -23.8% -11.7% 32.1% -13.8%
Year Division SAIDI SAIFI MAIFI CAIDI2010 SONOMA 151.4 1.131 0.818 133.92011 SONOMA 103.4 0.896 1.341 115.42012 SONOMA 117.9 0.897 1.730 131.52013 SONOMA 113.4 0.846 2.256 134.02014 SONOMA 113.7 0.899 1.587 126.6
5-Yr Ave 10-14 Avg 120.0 0.934 1.546 128.32015 SONOMA 73.0 0.673 1.531 108.5
% Difference -39.1% -27.9% -1.0% -15.4%
Year Division SAIDI SAIFI MAIFI CAIDI2010 STOCKTON 166.2 1.310 1.402 126.82011 STOCKTON 180.5 1.234 0.898 146.22012 STOCKTON 91.1 0.993 1.972 91.82013 STOCKTON 106.5 1.427 2.025 74.62014 STOCKTON 89.7 0.709 1.309 126.4
5-Yr Ave 10-14 Avg 126.8 1.135 1.521 113.22015 STOCKTON 96.9 0.874 1.947 110.9
% Difference -23.6% -23.0% 28.0% -2.0%
Year Division SAIDI SAIFI MAIFI CAIDI2010 YOSEMITE 226.3 1.474 2.598 153.52011 YOSEMITE 207.9 1.279 1.811 162.52012 YOSEMITE 140.8 1.272 4.088 110.72013 YOSEMITE 187.8 1.344 3.259 139.72014 YOSEMITE 117.6 1.226 2.446 96.0
5-Yr Ave 10-14 Avg 176.1 1.319 2.840 132.52015 YOSEMITE 102.3 0.984 2.638 103.9
% Difference -41.9% -25.4% -7.1% -21.6%

115
i. System and Division Performance Assessment
1. System Performance Assessment Table 9: System MAIFI Performance
System MAIFI Performance System MAIFI performance of 1.584 was within the range of the past five years but was 0.16 (or 11.2%) higher than the previous 5-year average of 1.424 as shown in the table above and illustrated in the figure below.
Chart 163 – System MAIFI Performance
This reflects both improvement in the ability to record when a momentary has occurred, and PG&E’s success in shortening the duration of outages. For example, an event that would have involved a 30 minute outage in the past but, due to improved technology and the Smart Grid is now a 1 minute outage reduces SAIDI and SAIFI but increases MAIFI, as it is now considered a momentary outage. As explained in footnote 4 on page 13, on November 18, 2011, PG&E’s EON recording system was removed from service. Since then, momentary outage data is being collected from SCADA devices and through the use of SmartMeters. Data collection from the SmartMeters is more effective than the previous EON system since SmartMeters don’t rely on customer
Year Division SAIDI SAIFI MAIFI CAIDI2010 SYSTEM 130.3 1.106 1.250 117.82011 SYSTEM 109.6 0.974 1.163 112.52012 SYSTEM 110.7 1.036 1.796 106.82013 SYSTEM 95.8 0.969 1.523 98.92014 SYSTEM 90.1 0.877 1.390 102.8
5-Yr Ave 10-14 Avg 107.3 0.992 1.424 107.82015 SYSTEM 80.7 0.786 1.584 102.7
% Difference -24.8% -20.8% 11.2% -4.7%

116
volunteers having EON devices securely connected inside their buildings. The increased frequency of momentary outages recorded in 2012 and following years does not indicate an actual increase in momentary outages in 2012 and after as compared to prior years, but is a result of this improved method for recording momentary outages. PG&E believes that the 11% increase is due to the change in data collection methods, and not a change in performance. PG&E’s 2015 System MAIFI performance (1.584) is very close to the three year average from 2012-2014 (1.570), the three years with the same data collection approach. In addition to the change in data collection methodology, the higher than average 2015 System MAIFI was attributed to the following: 1. The November 2nd, 2015 heavy rain and lighting from the northwest storms created
numerous momentary outages throughout the system and contributed 0.033 customer-interruptions to the system’s MAIFI.
2. On May 7th, 2015 lighting and thunderstorms developed in the early morning of the 7th, created momentary outages throughout Central Coast, Central Valley, and Northern Region, and contributed 0.029 to the system’s MAIFI.
3. On November 15th, 2015 heavy rain from the northwest storms created momentary outages throughout the system and contributed 0.023 to the system’s MAIFI.
4. On December 10th lighting created numerous outages throughout the service territory and contributed 0.022 to the system’s MAIFI.

117
2. Central Coast Division Performance Assessment Central Coast Division CAIDI Performance
Table 10: Central Coast CAIDI Performance
Central Coast Division CAIDI Performance Central Coast Division’s 2015 CAIDI performance of 120.4 minutes was 14 minutes (or 13.1%) higher than the previous 5-year average of 106.4 as shown in the table above and illustrated in the figure below.
Chart 164 – Central Coast Division CAIDI Performance
The higher than average 2015 Central Coast CAIDI was attributed to the following: 1. On September 19th the Tassajara wildfires in Monterey County caused by a third party
began near a wooden pole on Laureles 1111 distribution circuit. Damage to the Laureles 1111 circuit was substantial, and resulted in an extended outage affecting 521 customers. The total number of customer-minutes for which customers on that feeder did not have power was 869,818 minutes, or an average of 1,670 minutes for those 521 customers. If this event were not included, the Central Coast Division CAIDI would have been 117.1 minutes, a drop of 3.3 minutes.
Year Division SAIDI SAIFI MAIFI CAIDI2010 CENTRAL COAST 171.1 1.511 2.928 113.22011 CENTRAL COAST 156.8 1.513 1.576 103.62012 CENTRAL COAST 137.4 1.244 2.184 110.42013 CENTRAL COAST 119.7 1.291 1.958 92.72014 CENTRAL COAST 122.1 1.088 1.835 112.3
5-Yr Ave 10-14 Avg 141.4 1.329 2.096 106.42015 CENTRAL COAST 102.0 0.847 1.845 120.4
% Difference -27.9% -36.3% -12.0% 13.1%

118
3. Diablo Division Performance Assessment
Diablo Division MAIFI Performance Table 11: Diablo Division MAIFI Performance
Diablo Division MAIFI Performance Diablo Division’s 2015 MAIFI performance of 1.669 was higher than the previous 5-year average of 1.254 (or 33.1%) as shown in the table above and illustrated in the figure below.
Chart 165 – Diablo Division MAIFI Performance
The higher than average 2015 Diablo Division MAIFI was attributed to the following:
1. On June 22nd, 2015 momentary outages on the Pittsburg-Kirker- USP 115 KV line were caused by birds on the transmission structures contributing 0.082 customer-interruptions to Diablo’s MAIFI.
2. On July 17th, 2015 there are numerous distribution momentary outages on the Contra Costa 2116 circuit due to birds. On the same day, the Willow Pass 2107 and Willow Pass 2108 circuits had momentary outages of unknown cause. These contributed 0.063 customer-
Year Division SAIDI SAIFI MAIFI CAIDI2010 DIABLO 104.3 1.225 1.216 85.12011 DIABLO 66.8 0.808 1.235 82.72012 DIABLO 98.8 1.186 1.363 83.32013 DIABLO 80.4 1.001 1.237 80.32014 DIABLO 66.1 0.892 1.220 74.1
5-Yr Ave 10-14 Avg 83.3 1.022 1.254 81.12015 DIABLO 74.0 0.856 1.669 86.5
% Difference -11.1% -16.3% 33.1% 6.7%

119
interruptions to Diablo’s MAIFI. 3. On November 2nd, 2015 heavy rain and lighting created numerous momentary outages on the
Balfour 1101, Brentwood 2105, Rossmoor 1103, Lake Wood 2224, and Tide Water 2106 circuits. These contributed 0.059 customer-interruptions to Diablo’s MAIFI.
4. On September 27th, 2015 three feeders (Willow Pass 2107, 2108, and Tide Water 2108) experienced momentary outages due to squirrel activities in the area, contributing 0.043 customer-interruptions to Diablo’s MAIFI.
5. On December 23rd, 2015 Rossmoor 1102 and 1107 experienced momentary outages due to an unknown cause for Rossmoor 1102, and fire burning on cross-arm for Rossmoor 1107 contributing 0.036 customer-interruptions to the Diablo’s MAIFI.
6. On January 22nd, 2015 Tide Water 2107 experienced a momentary outage of unknown cause contributing to 0.035 customer-interruptions to the Diablo’s MAIFI.

120
4. Kern Division Performance Assessment Kern Division MAIFI Performance
Table 12: Kern Division MAIFI Performance
Kern Division MAIFI Performance Kern Division’s 2015 MAIFI performance of 1.85 was above the range of the past five years, and it was higher than the previous 5-year average of 1.347 (or 37.4%) as shown in the table above and illustrated in the figure below.
Chart 166 – Kern Division MAIFI Performance
The higher than average 2015 Kern Division MAIFI was attributed to the following:
1. On February 10th at approximately 04:02 AM the 115 kV Kern – Front line circuit breakers opened creating a momentary interruption at Kern and Front substations. This interruption was of “unknown cause” and contributed 0.411 customer-interruptions to Kern’s MAIFI.
Year Division SAIDI SAIFI MAIFI CAIDI2010 KERN 120.4 1.076 1.408 111.92011 KERN 112.5 0.979 1.340 114.82012 KERN 88.1 0.981 1.218 89.82013 KERN 87.5 1.027 1.133 85.22014 KERN 81.0 0.936 1.635 86.5
5-Yr Ave 10-14 Avg 97.9 1.000 1.347 97.62015 KERN 80.3 0.862 1.850 93.2
% Difference -18.0% -13.8% 37.4% -4.5%
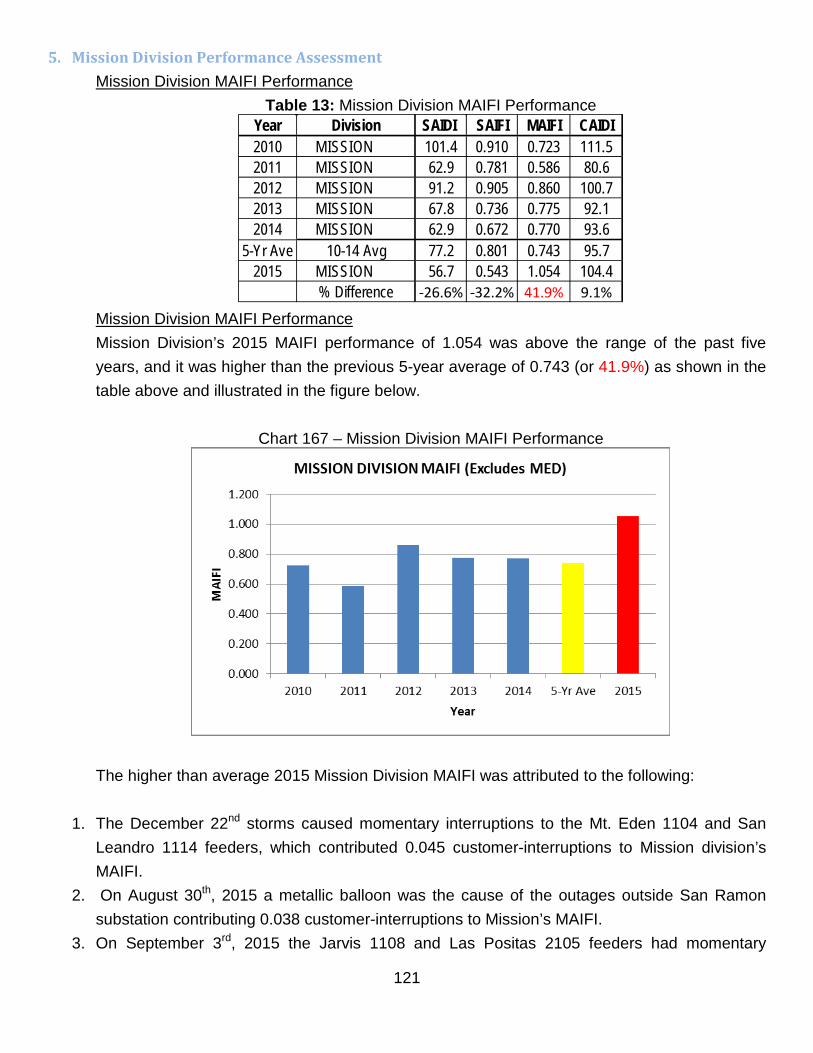
121
5. Mission Division Performance Assessment Mission Division MAIFI Performance
Table 13: Mission Division MAIFI Performance
Mission Division MAIFI Performance Mission Division’s 2015 MAIFI performance of 1.054 was above the range of the past five years, and it was higher than the previous 5-year average of 0.743 (or 41.9%) as shown in the table above and illustrated in the figure below.
Chart 167 – Mission Division MAIFI Performance
The higher than average 2015 Mission Division MAIFI was attributed to the following:
1. The December 22nd storms caused momentary interruptions to the Mt. Eden 1104 and San Leandro 1114 feeders, which contributed 0.045 customer-interruptions to Mission division’s MAIFI.
2. On August 30th, 2015 a metallic balloon was the cause of the outages outside San Ramon substation contributing 0.038 customer-interruptions to Mission’s MAIFI.
3. On September 3rd, 2015 the Jarvis 1108 and Las Positas 2105 feeders had momentary
Year Division SAIDI SAIFI MAIFI CAIDI2010 MISSION 101.4 0.910 0.723 111.52011 MISSION 62.9 0.781 0.586 80.62012 MISSION 91.2 0.905 0.860 100.72013 MISSION 67.8 0.736 0.775 92.12014 MISSION 62.9 0.672 0.770 93.6
5-Yr Ave 10-14 Avg 77.2 0.801 0.743 95.72015 MISSION 56.7 0.543 1.054 104.4
% Difference -26.6% -32.2% 41.9% 9.1%

122
outages of “unknown cause”, which contributed 0.037 customer-interruptions to Mission’s MAIFI.
4. On July 30th, 2015 Mt. Eden 1106, 1107, 1108, and San Leandro 1114 feeders had numerous momentary outages of “unknown cause” which contributed 0.034 customer-interruptions to Mission’s MAIFI.
5. On July 27th, 2015 the Jarvis 1112 and Las Positas 2108 feeders had momentary outages of “unknown cause” which contributed 0.033 customer-interruptions to Mission’s MAIFI.
6. On July 16th, 2015 a metallic balloon was the primary cause for the momentary outage at Jarvis substation, and a squirrel was another cause for the momentary outage at Newark substation. Both of these events contributed 0.029 customer-interruptions to Mission’s MAIFI.
7. On July 26th, 2015 momentary outages at San Leandro substation, Bancroft 0401 feeder, San Leandro U-1116, and Ward 0401 of “unknown cause” contributed 0.021 customer-interruptions to Mission’s MAIFI.

123
6. North Bay Division Performance Assessment North Bay Division MAIFI Performance
Table 14: North Bay Division MAIFI Performance
North Bay Division MAIFI Performance North Bay Division’s 2015 MAIFI performance of 1.977 was within the range of the past five years but was 0.378 (or 23.7%) higher than the previous 5-year average of 1.599 as shown in the table above and illustrated in the figure below.
Chart 168 – North Bay Division MAIFI Performance
The higher than average 2015 North Bay Division MAIFI was attributed to the following:
1. The November 2nd, 2015 storm event brought lighting and heavy rain to North Bay Division, causing numerous momentary outages at various substations within the division which contributed 0.213 customer-interruptions to North Bay’s MAIFI.
2. On October 10th, 2015 a momentary outage of “unknown cause” on the 115 KV Ignacio – Mare Island #2 transmission contributed 0.192 customer-interruptions to the North Bay’s MAIFI.
Year Division SAIDI SAIFI MAIFI CAIDI2010 NORTH BAY 133.9 1.035 1.294 129.32011 NORTH BAY 110.7 1.074 1.094 103.12012 NORTH BAY 109.7 0.791 1.646 138.82013 NORTH BAY 101.8 0.910 1.455 111.92014 NORTH BAY 114.6 0.875 2.505 131.0
5-Yr Ave 10-14 Avg 114.1 0.937 1.599 122.82015 NORTH BAY 97.4 0.904 1.977 107.8
% Difference -14.7% -3.5% 23.7% -12.2%

124
7. Peninsula Division Performance Assessment Peninsula Division MAIFI Performance
Table 15: Peninsula Division MAIFI Performance
Peninsula Division MAIFI Performance Peninsula Division’s 2015 MAIFI performance of 1.602 was above the range of the past five years and was 0.472 (or 41.8%) higher than the previous 5-year average of 1.13 as shown in the table above and illustrated in the figure below.
Chart 169 – Peninsula Division MAIFI Performance
The higher than average 2015 Peninsula Division MAIFI was attributed to the following:
1. On November 9th, 2015 storms with lighting and heavy rain caused momentary outages on the Sneath Lane – Pacifica 60 KV transmission line which contributed 0.118 customer-interruptions to Peninsula’s MAIFI.
2. On November 15th, 2015 storms with heavy rain from the south of the service territory caused numerous 4 kV and 12 kV breaker level momentary outages which contributed 0.084 customer-interruptions to Peninsula’s MAIFI.
3. On August 28th, 2015 at approximately 09:29 PM, a contractor’s equipment hit the base of a
Year Division SAIDI SAIFI MAIFI CAIDI2010 PENINSULA 117.9 1.324 1.060 89.02011 PENINSULA 83.8 1.047 0.782 80.02012 PENINSULA 86.8 0.999 1.528 86.92013 PENINSULA 70.1 0.785 1.114 89.42014 PENINSULA 77.1 0.898 1.164 85.9
5-Yr Ave 10-14 Avg 87.1 1.011 1.130 86.22015 PENINSULA 60.5 0.752 1.602 80.4
% Difference -30.6% -25.6% 41.8% -6.8%

125
steel tower of the 115 kV line San Mateo – Martin #4 caused numerous distribution lines to have momentary outages which contributed 0.06 customer-interruptions to Peninsula’s MAIFI.
4. On October 15th, 2015 lightning caused momentary outages contributing 0.047 customer-interruptions to Peninsula’s MAIFI.
5. On September 26th, 2015, an operator error caused a momentary outage to the Glenwood – Menlo transmission line which contributed 0.045 customer-interruptions to Peninsula’s MAIFI.

126
8. San Francisco Division Performance Assessment San Francisco Division MAIFI Performance
Table 16: San Francisco Division MAIFI Performance
San Francisco Division MAIFI Performance San Francisco Division’s 2015 MAIFI performance of 0.501 was within the range of the past five years but was 0.137 (or 37.5%) higher than the previous 5-year average of 0.364 as shown in the table above and illustrated in the figure below.
Chart 170 – San Francisco Division MAIFI Performance
The higher than average 2015 San Francisco Division MAIFI was attributed to the following:
1. On December 11th, 2015 lightning caused a momentary outage to the P-1106 feeder which contributed 0.049 customer-interruptions to San Francisco’s MAIFI.
2. On November 10th, 2015 a momentary outage at Station A of an “unknown cause” contributed 0.036 customer-interruptions to San Francisco’s MAIFI.
3. On November 24th, 2015 storm related activities caused momentary outages to the Station Y-1119 feeder which contributed 0.029 customer-interruptions to the San Francisco’s MAIFI.
Year Division SAIDI SAIFI MAIFI CAIDI2010 SAN FRANCISCO 49.6 0.652 0.066 76.02011 SAN FRANCISCO 45.3 0.540 0.211 83.92012 SAN FRANCISCO 47.0 0.570 1.008 82.62013 SAN FRANCISCO 52.0 0.604 0.302 86.12014 SAN FRANCISCO 41.5 0.457 0.235 90.8
5-Yr Ave 10-14 Avg 47.1 0.565 0.364 83.92015 SAN FRANCISCO 33.9 0.504 0.501 67.2
% Difference -28.0% -10.7% 37.5% -19.9%

127
9. San Jose Division Performance Assessment San Jose Division MAIFI Performance
Table 17: San Jose Division MAIFI Performance
San Jose Division MAIFI Performance San Jose Division’s 2015 MAIFI performance of 1.008 was above the range of the past five years and higher than the previous 5-year average of 0.176 (or 21.2%) as shown in the table above and illustrated in the figure below.
Chart 171 – San Jose Division MAIFI Performance
The higher than average 2015 San Jose Division MAIFI was attributed to the following:
1. On November 15th, 2015 heavy rain and windy conditions caused numerous distribution momentary outages to the Evergreen and Stone substations. In addition, a momentary outage on the Swift 2107 feeder contributed 0.032 customer-interruptions at San Jose’s MAIFI.
2. On October 22nd, 2015 the Edenvale 2108, 2109, and 2110 feeders had momentary outages of an “unknown cause” which contributed 0.031 customer-interruptions at San Jose’s MAIFI.
3. On June 28th, 2015 the Evergreen 2103, Edenvale 2108, and McKee 1111 feeders had momentary outages due to various causes which contributed 0.03 customer-interruptions at San Jose’s MAIFI.
Year Division SAIDI SAIFI MAIFI CAIDI2010 SAN JOSE 69.4 0.758 0.525 91.62011 SAN JOSE 101.5 0.900 0.685 112.82012 SAN JOSE 80.6 0.793 0.945 101.62013 SAN JOSE 96.7 0.914 0.977 105.72014 SAN JOSE 76.0 0.806 1.026 94.4
5-Yr Ave 10-14 Avg 84.8 0.834 0.832 101.22015 SAN JOSE 65.9 0.678 1.008 97.2
% Difference -22.3% -18.7% 21.2% -4.0%

128
10. Sierra Division Performance Assessment Sierra Division MAIFI Performance
Table 18: Sierra Division MAIFI Performance
Sierra Division MAIFI Performance Sierra Division’s 2015 MAIFI performance of 2.813 was within the range of the past five years but was 0.684 (or 32.1%) higher than the previous 5-year average of 2.129 as shown in the table above and illustrated in the figure below.
Chart 172 – Sierra Division MAIFI Performance
The higher than average 2015 Sierra Division MAIFI was attributed to the following:
1. On May 7th, 2015 rain and lightning storm caused numerous transmission momentary outages to the Drum – Higgins 115 kV line, Drum - Rio – OSO #2 tap line, and the Drum – Grass Valley 60 kV line. These outages contributed 0.406 customer-interruptions to Sierra’s MAIFI.
2. On June 5th, 2015 lighting activity caused numerous momentary outages to the Drum – Wiemar 60 kV and Colgate – Allegheny 60 kV lines. These outages contributed 0.147customer-interruptions to Sierra’s MAIFI.
Year Division SAIDI SAIFI MAIFI CAIDI2010 SIERRA 194.0 1.332 1.124 145.62011 SIERRA 179.5 1.168 1.401 153.72012 SIERRA 182.4 1.322 2.906 137.92013 SIERRA 109.9 1.279 3.085 85.92014 SIERRA 142.2 1.210 2.128 117.5
5-Yr Ave 10-14 Avg 161.6 1.262 2.129 128.12015 SIERRA 123.2 1.115 2.813 110.5
% Difference -23.8% -11.7% 32.1% -13.8%
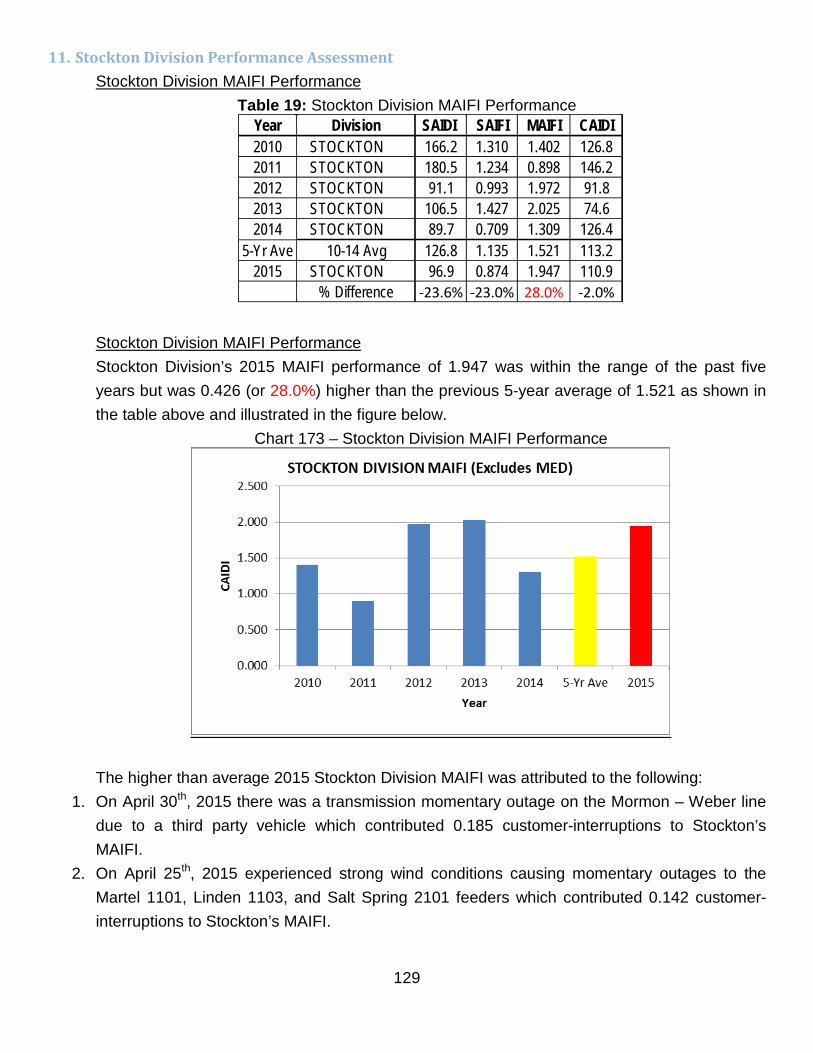
129
11. Stockton Division Performance Assessment Stockton Division MAIFI Performance
Table 19: Stockton Division MAIFI Performance
Stockton Division MAIFI Performance Stockton Division’s 2015 MAIFI performance of 1.947 was within the range of the past five years but was 0.426 (or 28.0%) higher than the previous 5-year average of 1.521 as shown in the table above and illustrated in the figure below.
Chart 173 – Stockton Division MAIFI Performance
The higher than average 2015 Stockton Division MAIFI was attributed to the following:
1. On April 30th, 2015 there was a transmission momentary outage on the Mormon – Weber line due to a third party vehicle which contributed 0.185 customer-interruptions to Stockton’s MAIFI.
2. On April 25th, 2015 experienced strong wind conditions causing momentary outages to the Martel 1101, Linden 1103, and Salt Spring 2101 feeders which contributed 0.142 customer-interruptions to Stockton’s MAIFI.
Year Division SAIDI SAIFI MAIFI CAIDI2010 STOCKTON 166.2 1.310 1.402 126.82011 STOCKTON 180.5 1.234 0.898 146.22012 STOCKTON 91.1 0.993 1.972 91.82013 STOCKTON 106.5 1.427 2.025 74.62014 STOCKTON 89.7 0.709 1.309 126.4
5-Yr Ave 10-14 Avg 126.8 1.135 1.521 113.22015 STOCKTON 96.9 0.874 1.947 110.9
% Difference -23.6% -23.0% 28.0% -2.0%

130
ii. 2015 Excludable Major Event Day (MED) CAIDI Performance
Excludable Major Event Day (MED) In 2015 This section contains PG&E’s report on weather related excludable major event day (MED) for each division in which CAIDI9 varied by 25 percent or more in the division benchmark, as required by Decision 04-10-034 and Decision 16-01-008, Appendix B, footnote 6. Per D.04-10-034, the division benchmark is calculated from the rolling average of the prior 10 weather-related excludable major events.10 PG&E is also required by D.04-10-034 to provide such a report for the system, where the system performance varies by more than 10 percent from the rolling average of the prior 10 weather-related system-wide excludable major event days, whichever yields more event days. There were six major events, 9 Major Event Days in total, in 2015.
Table 20 – Summary MED days
9 Per Decision 16-01-008, Appendix B footnote 6, Decision 04-10-034 only applies to PG&E:
• Investigate and report on all weather-related excludable major events for each division in which CAIDI varies by 25 percent or more from the division benchmark. The division benchmarks are calculated from the rolling average of the prior 10 weather-related excludable events as defined by IEEE 1366.
10 A major event is based on the IEEE definition. As in prior reports, PG&E is using the “prior ten weather related excludable major events” prior to the calendar year that is the subject of the report.
2015 Major Events MED123
April 6, 2015 4
June 8,2015 567
December 13, 2015 8
December 24, 2015 9
February 6-8, 2015
July 18-19, 2015

131
The first major event days of the year, February 6th – 8th, 2015, involved a series of strong Pacific storms that moved into PG&E’s service territory producing heavy rain and south winds. South wind gusts near fifty mph were observed along the coast, and wind gusts near sixty mph were observed in the northern Sacramento Valley. Generally, four to eight inches of rain were observed across the elevated terrain in the northern part of the territory, with some locations topped eight inches, and Bucks Lake in North Valley Division recorded nine inches of rain. Table 21 summarizes the system and division CAIDI performances during this event and the average of the prior ten weather related major events.
(February 6-8, 2015 vs. Prior 10 MED)
Table 21 – February 6-8, 2015 CAIDI Performance
System / Division
Average CAIDI of Prior 10 System / Division Specific Excludable ME
February 6-8, 2015 / Division Specific
CAIDI
Percent Difference From the Prior CAIDI Average
Exceeds the Investigation Threshold?
SYSTEM 253.9 395.4 55.7% YesCENTRAL COAST 278.6 128.5 -53.9% NoDE ANZA 180.0 104.8 -41.8% NoDIABLO 161.4 87.5 -45.8% NoEAST BAY 212.5 76.3 -64.1% NoFRESNO 86.8 100.8 16.2% NoHUMBOLDT 402.4 787.7 95.8% YesKERN 144.8 67.9 -53.1% NoLOS PADRES 225.5 95.0 -57.9% NoMISSION 111.2 51.5 -53.7% NoNORTH BAY 277.1 254.1 -8.3% NoNORTH VALLEY 649.0 964.9 48.7% YesPENINSULA 145.9 158.1 8.4% NoSACRAMENTO 123.9 132.0 6.6% NoSAN FRANCISCO 240.5 135.1 -43.8% NoSAN JOSE 114.4 123.5 8.0% NoSIERRA 295.0 489.0 65.7% YesSONOMA 265.5 248.5 -6.4% NoSTOCKTON 354.8 135.7 -61.8% NoYOSEMITE 249.3 128.0 -48.6% No

132
1. February 6-8, 2015 Major Event Days
1.1 System CAIDI Assessment
Table 22 – System Historical Performance
As indicated in Table 22, the system CAIDI value of 395.4 minutes for the February 6th – 8th major event was within the range of the prior ten excludable major events. However, this CAIDI value was 55.7% higher than the 253.9 minute average of the prior 10 weather-related excludable major events. The average number of sustained outages per day on February 6th – 8th was 35% higher than the average of the corresponding prior 10 excludable major events. Further review of this major event shows that February 6th was hardest hit with 881 sustained outages which is 220% higher than the daily average of the prior 10 major excludable events. The high CAIDI value along with the high number of sustained outages during this event illustrates the severity of this three-day storm in comparison to the past ten weather-related events.
System / Division Major Event Day CAIDI SO / DaySYSTEM December 17, 2012 443.1 102SYSTEM December 21, 2012 549.2 199SYSTEM December 23, 2012 287.2 439SYSTEM April 8, 2013 167.4 447SYSTEM June 23, 2013 160.5 96SYSTEM November 21-22, 2013 254.5 419SYSTEM August 24, 2014 302.5 209SYSTEM December 3, 2014 144.1 373SYSTEM December 11-12, 2014 278.0 728SYSTEM December 30, 2014 202.6 643
Average of 10 excludable major events 253.9 400
SYSTEM February 6-8, 2015 395.4 540% Difference 55.7% 35%

133
1.2 Humboldt Division CAIDI Assessment
Table 23 – Humboldt Division Historical Performance
As indicated in Table 23, the Humboldt division CAIDI value of 787.7 minutes for the February 6th – 8th major event exceeded the range of the prior ten excludable major events. However, this CAIDI value was 95.8% higher than the 402.4 minute average of the prior 10 weather-related excludable major events. The average number of sustained outages per day on February 6th – 8th was 194% higher than the average of the corresponding prior 10 excludable major events. The high CAIDI value along with the high number of sustained outages during this event illustrates the severity of this three-day storm in comparison to the past ten weather-related events. The top four outages on February 6-8, 2015 were:
• A tree related outage on the Mendocino – Willits – Ft. Bragg transmission line affected 2,629 customers. The total customer-minutes in which the customers did not have power due to this tree related outage were 4,528,676 minutes, or an average restoration time of 1,723 minutes/customer. This transmission outage contributed 40.3 minutes to the overall February 6-8, 2015 CAIDI performance in the Humboldt division.
• The Ft. Bragg 1102 outage due to equipment failure (circuit breaker 1102/2 failed) contributed 37.5 minutes to the February 6-8, 2015 CAIDI performance in the Humboldt Division.
• The Philo 1101 feeder outage caused when a tree fell through the distribution line due to strong wind and heavy rain contributed 35.9 minutes to the overall February 6-8, 2015 CAIDI performance in the Humboldt division.
• A separate transmission line outage on the Mendocino – Willits – Ft. Bragg 60 KV line due to a tree falling into the line contributed 4.5 minutes to the overall CAIDI performance in the Humboldt division.
System / Division Major Event Day CAIDI SO / DayHUMBOLDT December 17, 2012 177.6 4HUMBOLDT December 21, 2012 136.7 14HUMBOLDT December 23, 2012 369.9 47HUMBOLDT April 8, 2013 149.5 38HUMBOLDT June 23, 2013 109.1 5HUMBOLDT November 21-22, 2013 418.2 62HUMBOLDT August 24, 2014 199.7 6HUMBOLDT December 3, 2014 145.6 7HUMBOLDT December 11-12, 2014 533.3 87HUMBOLDT December 30, 2014 205.0 6
Average of 10 excludable major events 402.4 35
HUMBOLDT February 6-8, 2015 787.7 104% Difference 95.8% 194%

134
1.3 North Valley Division CAIDI Assessment
Table 24 – North Valley Division Historical Performance
As indicated in Table 24, the system CAIDI value of 964.9 minutes for the February 6th – 8th major event was within the range of the prior ten excludable major events. However, this CAIDI value was 48.7% higher than the 649 minute average of the prior 10 weather-related excludable major events. The average number of sustained outages per day on February 6th – 8th was 106% higher than the average of the corresponding prior 10 excludable major events. The high CAIDI value along with the high number of sustained outages during this event illustrates the severity of this three-day storm in comparison to the past ten weather-related events.
The top outages on February 6-8, 2015 were:
• A tree related outage on the Caribou – Westwood transmission line contributing 138.1
minutes to the overall February 6-8, 2015 CAIDI performance in the North Valley division. • Another tree related outage on the Caribou – Westwood #2 transmission line caused
numerous 21 kV lines outages. This outage contributed 53.2 minutes to the overall February 6-8, 2015 CAIDI performance in the North Valley division.
System / Division Major Event Day CAIDI SO / DayNORTH VALLEY December 17, 2012 101.9 15NORTH VALLEY December 21, 2012 1,436.5 79NORTH VALLEY December 23, 2012 958.5 62NORTH VALLEY April 8, 2013 407.6 13NORTH VALLEY June 23, 2013 120.7 2NORTH VALLEY November 21-22, 2013 351.2 25NORTH VALLEY August 24, 2014 298.2 3NORTH VALLEY December 3, 2014 92.7 20NORTH VALLEY December 11-12, 2014 264.6 58NORTH VALLEY December 30, 2014 444.9 57
Average of 10 excludable major events 649.0 35
NORTH VALLEY February 6-8, 2015 964.9 71% Difference 48.7% 106%

135
1.4 Sierra Division CAIDI Assessment
Table 25 – Sierra Division Historical Performance
As indicated in Table 25, the system CAIDI value of 489 minutes for the February 6th – 8th major event exceeded the range of the prior ten excludable major events and was 65.7% higher than the 253.9 minute average of the prior 10 weather-related excludable major events. The average number of sustained outages per day on February 6th – 8th was 34% higher than the average of the corresponding prior 10 excludable major events. The high CAIDI value along with the high number of sustained outages during this event illustrates the severity of this three-day storm in comparison to the past ten weather-related events. The top outages on February 6-8, 2015 are:
• A transmission line outage on the Columbia Hill – Pike City – Alleghany 60 KV line due to tree falling into the line contributed 25.2 minutes to the overall February 6-8, 2015 CAIDI performance in the Sierra division.
• Numerous distribution lines outages, i.e. Brunswick 1102, 1103, 1105, Placerville 2106, Apple Hill 1104, Grass Valley 1103, and Columbia Hill 1101 due to trees falling into lines contributed 116.2 minutes to the overall February 6-8, 2015 CAIDI performance in the Sierra Division.
• A transmission outage on the Pike City – Alleghany 60 KV line of “unknown cause” contributed 23.1 minutes to the overall February 6-8, 2015 CAIDI performance in the Sierra division.
System / Division Major Event Day CAIDI SO / DaySIERRA December 17, 2012 137.5 4SIERRA December 21, 2012 195.9 10SIERRA December 23, 2012 290.7 32SIERRA April 8, 2013 153.0 7SIERRA June 23, 2013 95.4 2SIERRA November 21-22, 2013 359.8 44SIERRA August 24, 2014 186.6 5SIERRA December 3, 2014 125.6 34SIERRA December 11-12, 2014 220.8 77SIERRA December 30, 2014 339.2 103
Average of 10 excludable major events 295.0 30
SIERRA February 6-8, 2015 489.0 40% Difference 65.7% 34%

136
2. April 6, 2015 Major Event Day The second major event day was on April 6, 2015, a late winter-storm moved through the service area producing moderate rain showers, with gusty south winds from thirty to forty mph, and thunderstorms. Nearly one thousand cloud-to-ground lightning strikes were recorded across the Sacramento Valley and San Joaquin Valleys. Table 26 summarizes the system and division CAIDI performances during this event and the average of the prior ten weather related major events.
(April 6, 2015 vs. Prior 10 MED)
Table 26 – April 6, 2015 CAIDI Performance
System / Division
Average CAIDI of Prior 10 System / Division Specific Excludable ME
April 6, 2015 / Division Specific
CAIDI
Percent Difference From the Prior CAIDI Average
Exceeds the Investigation Threshold?
SYSTEM 253.9 193.5 -23.8% NoCENTRAL COAST 278.6 98.0 -64.8% NoDE ANZA 180.0 46.4 -74.2% NoDIABLO 161.4 112.0 -30.6% NoEAST BAY 212.5 0.0 -100.0% NoFRESNO 86.8 13.8 -84.1% NoHUMBOLDT 402.4 433.8 7.8% NoKERN 144.8 66.9 -53.8% NoLOS PADRES 225.5 169.8 -24.7% NoMISSION 111.2 74.3 -33.2% NoNORTH BAY 277.1 124.0 -55.3% NoNORTH VALLEY 649.0 205.5 -68.3% NoPENINSULA 145.9 216.0 48.1% YesSACRAMENTO 123.9 9.8 -92.1% NoSAN FRANCISCO 240.5 0.0 -100.0% NoSAN JOSE 114.4 94.8 -17.1% NoSIERRA 295.0 48.6 -83.5% NoSONOMA 265.5 117.8 -55.6% NoSTOCKTON 354.8 43.7 -87.7% NoYOSEMITE 249.3 111.2 -55.4% No

137
2.1 Peninsula Division CAIDI Assessment
Table 27 – Peninsula Division Historical Performance
As indicated in Table 27, the Peninsula Division CAIDI value of 216 minutes for the April 6th, 2015 major event day was within the range of the prior ten excludable major events. However, this CAIDI value was 48.1% higher than the 145.9 minutes average of the prior 10 weather-related excludable major events.
• This higher CAIDI value was due to an outage on the Menlo 1102 circuit when a bird contacted a transformer, causing the fuse to blow.
System / Division Major Event Day CAIDI SO / DayPENINSULA December 2, 1012 107.8 50PENINSULA December 17, 2012 90.4 2PENINSULA December 21, 2012 65.7 6PENINSULA December 23, 2012 83.3 15PENINSULA April 8, 2013 247.5 66PENINSULA June 23, 2013 528.4 2PENINSULA November 21-22, 2013 116.5 4PENINSULA December 3, 2014 179.2 27PENINSULA December 11-12, 2014 125.0 39PENINSULA December 30, 2014 113.4 23
Average of 10 excludable major events 145.9 23
PENINSULA April 6, 2015 216.0 1% Difference 48.1% -96%
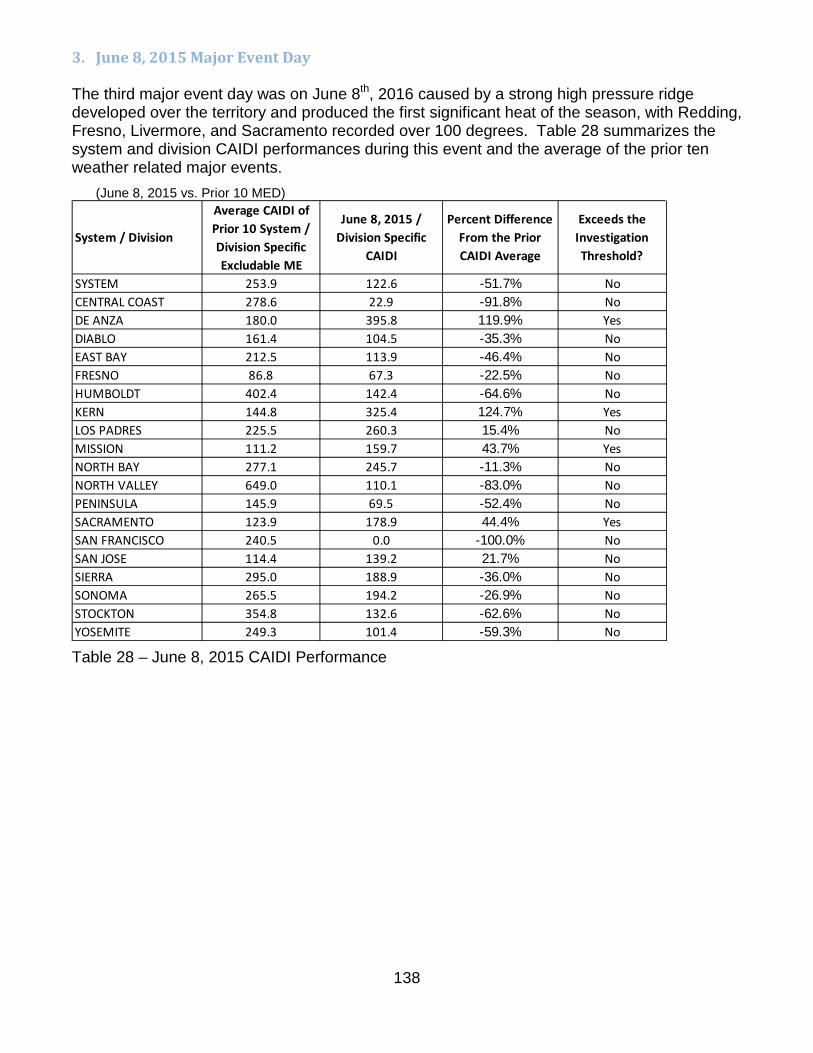
138
3. June 8, 2015 Major Event Day The third major event day was on June 8th, 2016 caused by a strong high pressure ridge developed over the territory and produced the first significant heat of the season, with Redding, Fresno, Livermore, and Sacramento recorded over 100 degrees. Table 28 summarizes the system and division CAIDI performances during this event and the average of the prior ten weather related major events.
(June 8, 2015 vs. Prior 10 MED)
Table 28 – June 8, 2015 CAIDI Performance
System / Division
Average CAIDI of Prior 10 System / Division Specific Excludable ME
June 8, 2015 / Division Specific
CAIDI
Percent Difference From the Prior CAIDI Average
Exceeds the Investigation Threshold?
SYSTEM 253.9 122.6 -51.7% NoCENTRAL COAST 278.6 22.9 -91.8% NoDE ANZA 180.0 395.8 119.9% YesDIABLO 161.4 104.5 -35.3% NoEAST BAY 212.5 113.9 -46.4% NoFRESNO 86.8 67.3 -22.5% NoHUMBOLDT 402.4 142.4 -64.6% NoKERN 144.8 325.4 124.7% YesLOS PADRES 225.5 260.3 15.4% NoMISSION 111.2 159.7 43.7% YesNORTH BAY 277.1 245.7 -11.3% NoNORTH VALLEY 649.0 110.1 -83.0% NoPENINSULA 145.9 69.5 -52.4% NoSACRAMENTO 123.9 178.9 44.4% YesSAN FRANCISCO 240.5 0.0 -100.0% NoSAN JOSE 114.4 139.2 21.7% NoSIERRA 295.0 188.9 -36.0% NoSONOMA 265.5 194.2 -26.9% NoSTOCKTON 354.8 132.6 -62.6% NoYOSEMITE 249.3 101.4 -59.3% No

139
3.1 De Anza Division CAIDI Assessment
Table 29 – De Anza Division Historical Performance As indicated in Table 33, the De Anza Division CAIDI value of 395.8 minutes for the June 8th , 2015 major event day was within the range of the prior ten excludable major events. However, this CAIDI value was 119.9% higher than the 180 minutes average of the prior 10 weather-related excludable major events. • This higher CAIDI value was due to an outage on the Vasona 1108 circuit. This outage was due to a failed underground transformer. Without this event, the June 8th CAIDI performance would have been 177.8 minutes.
System / Division Major Event Day CAIDI SO / DayDE ANZA December 2, 1012 210.9 20DE ANZA December 17, 2012 57.9 10DE ANZA December 21, 2012 188 7DE ANZA December 23, 2012 183.7 18DE ANZA April 8, 2013 36.1 2DE ANZA June 23, 2013 542.3 1DE ANZA November 21-22, 2013 277.3 2DE ANZA December 3, 2014 150.4 36DE ANZA December 11-12, 2014 192.7 13DE ANZA December 30, 2014 235.2 17
Average of 10 excludable major events 180.0 13
DE ANZA June 8, 2015 395.8 9% Difference 119.9% -28%
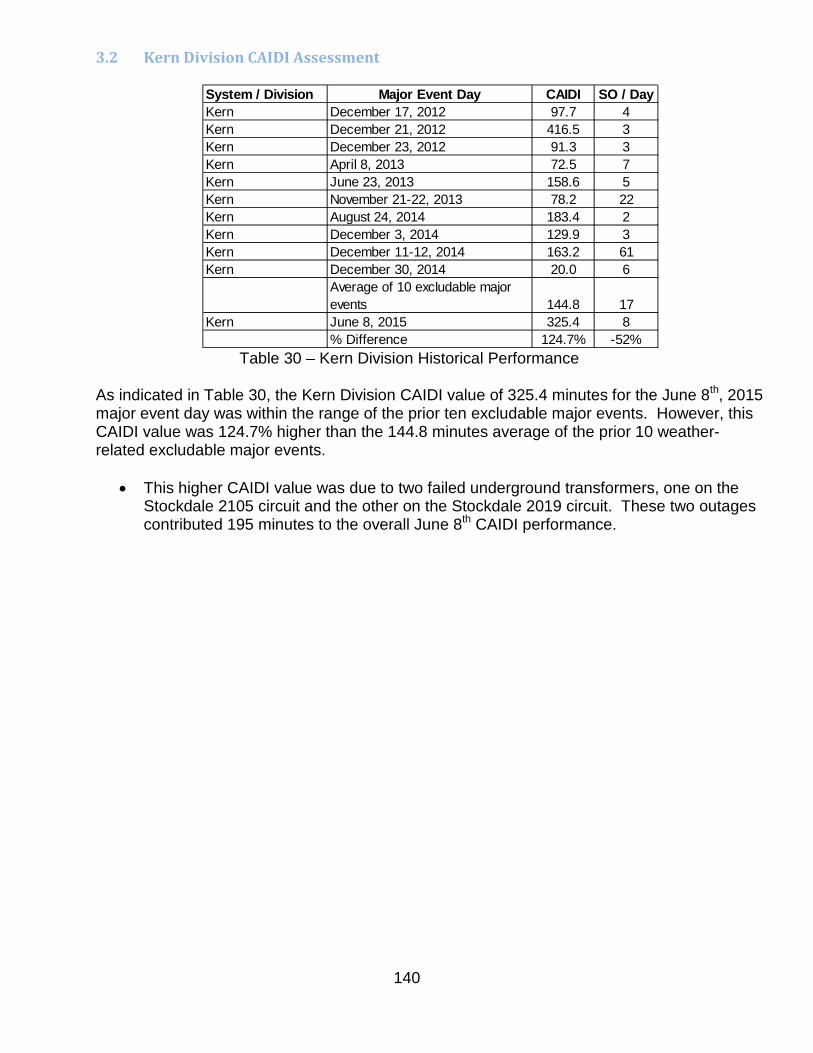
140
3.2 Kern Division CAIDI Assessment
Table 30 – Kern Division Historical Performance As indicated in Table 30, the Kern Division CAIDI value of 325.4 minutes for the June 8th, 2015 major event day was within the range of the prior ten excludable major events. However, this CAIDI value was 124.7% higher than the 144.8 minutes average of the prior 10 weather-related excludable major events.
• This higher CAIDI value was due to two failed underground transformers, one on the Stockdale 2105 circuit and the other on the Stockdale 2019 circuit. These two outages contributed 195 minutes to the overall June 8th CAIDI performance.
System / Division Major Event Day CAIDI SO / DayKern December 17, 2012 97.7 4Kern December 21, 2012 416.5 3Kern December 23, 2012 91.3 3Kern April 8, 2013 72.5 7Kern June 23, 2013 158.6 5Kern November 21-22, 2013 78.2 22Kern August 24, 2014 183.4 2Kern December 3, 2014 129.9 3Kern December 11-12, 2014 163.2 61Kern December 30, 2014 20.0 6
Average of 10 excludable major events 144.8 17
Kern June 8, 2015 325.4 8% Difference 124.7% -52%

141
3.3 Mission Division CAIDI Assessment
Table 31 – Mission Division CAIDI Assessment As indicated in Table 31, Mission division’s CAIDI value of 159.7 for the June 8th major event was within the range of the prior ten excludable major events. However, this CAIDI value was 43.7% higher than the 111.2 minute average of the prior 10 weather-related excludable major events and related to one outage.
This higher CAIDI value was associated with the following top five outages: • Dixon Landing 2106 circuit – due to a failed underground cable. • Dumbarton 1102 circuit – due to a burned-open jumper. • Vineyard 2107 circuit – due to a failed underground transformer. • San Ramon 2104 circuit – due to a failed overhead transformer. • Newark 1106 circuit – due to a failed pad-mounted transformer.
These five outages contributed 21.2 minutes to the overall June 8th CAIDI performance.
System / Division Major Event Day CAIDI SO / DayMISSION December 17, 2012 168.2 1MISSION December 21, 2012 381.9 3MISSION December 23, 2012 101.2 7MISSION April 8, 2013 67.9 11MISSION June 23, 2013 101.3 3MISSION November 21-22, 2013 85.2 15MISSION August 24, 2014 87.1 3MISSION December 3, 2014 240.7 4MISSION December 11-12, 2014 140.7 8MISSION December 30, 2014 135.7 31
Average of 10 excludable major events 111.2 9
MISSION June 8, 2015 159.7 12% Difference 43.7% 33%

142
3.4 Sacramento Division CAIDI Assessment
Table 32 – Sacramento Division CAIDI Assessment
As indicated in Table 32,The Sacramento Division CAIDI value of 178.9 minutes for the June 8th, 2015 major event day was within the range of the prior ten excludable major events. However, this CAIDI value was 44.4% higher than the 123.9 minutes average of the prior 10 weather-related excludable major events.
This higher CAIDI value was due to the following top four outages:
• Suisun 1105 circuit – due to a failed overhead transformer. • Peabody 2105 circuit – due to a failed pad-mounted transformer. • Peabody 2107 circuit – due to a failed underground transformer. • Suisun 1108 circuit – due to a failed overhead transformer.
These four outages contributed 36.1 minutes to the overall June 8th CAIDI performance.
System / Division Major Event Day CAIDI SO / DaySACRAMENTO December 17, 2012 79.1 11SACRAMENTO December 21, 2012 116.3 8SACRAMENTO December 23, 2012 137.3 43SACRAMENTO April 8, 2013 116.1 40SACRAMENTO June 23, 2013 48.4 8SACRAMENTO November 21-22, 2013 139.0 32SACRAMENTO August 24, 2014 40.3 9SACRAMENTO December 3, 2014 222.2 23SACRAMENTO December 11-12, 2014 150.7 19SACRAMENTO December 30, 2014 91.1 34
Average of 10 excludable major events 123.9 23
SACRAMENTO June 8, 2015 178.9 18% Difference 44.4% -22%

143
4. July 18, and July 19, 2015 Major Event Days The fourth major event day occurred on July 18th thru July 19th, 2015. Tropical moisture associated with former Hurricane Dolores drifted over service territory, creating atmospheric instability combined with abundant tropical moisture, initiated a widespread thunderstorm outbreak across the San Joaquin Valley and Central Coast. Table 33 summarizes the system and division CAIDI performances during this event and the average of the prior ten weather related major events.
(July 18-19, 2015 vs. Prior 10 MED)
Table 33 – July 18-19, 2015 CAIDI Performance
System / Division
Average CAIDI of Prior 10 System / Division Specific Excludable ME
July 18-19, 2015 / Division Specific
CAIDI
Percent Difference From the Prior CAIDI Average
Exceeds the Investigation Threshold?
SYSTEM 253.9 169.4 -33.3% NoCENTRAL COAST 278.6 81.7 -70.7% NoDE ANZA 180.0 146.7 -18.5% NoDIABLO 161.4 144.8 -10.3% NoEAST BAY 212.5 0.0 -100.0% NoFRESNO 86.8 119.0 37.1% YesHUMBOLDT 402.4 252.9 -37.1% NoKERN 144.8 163.9 13.1% NoLOS PADRES 225.5 437.7 94.1% YesMISSION 111.2 250.2 125.1% YesNORTH BAY 277.1 161.4 -41.8% NoNORTH VALLEY 649.0 119.6 -81.6% NoPENINSULA 145.9 42.0 -71.2% NoSACRAMENTO 123.9 418.6 237.9% YesSAN FRANCISCO 240.5 108.3 -55.0% NoSAN JOSE 114.4 106.6 -6.7% NoSIERRA 295.0 12.4 -95.8% NoSONOMA 265.5 71.2 -73.2% NoSTOCKTON 354.8 173.8 -51.0% NoYOSEMITE 249.3 97.2 -61.0% No

144
4.1 Fresno Division CAIDI Assessment
Table 34 – Fresno Division CAIDI Assessment As indicated in Table 34, the Fresno Division CAIDI value of 119 minutes for the July 18th thru July 19th, 2015 major event day was within the range of the prior ten excludable major events. However, this CAIDI value was 37.1% higher than the 86.8 minutes average of the prior 10 weather-related excludable major events.
The average number of sustained outages per day from July 18th thru 19th, 2015 were 418% higher than the average of the corresponding prior 10 excludable major events. This illustrates the intensity of the storm event in this division and the causes of the outages.
System / Division Major Event Day CAIDI SO / DayFRESNO December 17, 2012 84.2 10FRESNO December 21, 2012 68.1 9FRESNO December 23, 2012 40.8 9FRESNO April 8, 2013 110.5 27FRESNO June 23, 2013 27.9 6FRESNO November 21-22, 2013 74.7 20FRESNO August 24, 2014 22.6 3FRESNO December 3, 2014 65.2 8FRESNO December 11-12, 2014 82.2 27FRESNO December 30, 2014 392.1 4
Average of 10 excludable major events 86.8 14
FRESNO July 18-19, 2015 119.0 73% Difference 37.1% 418%
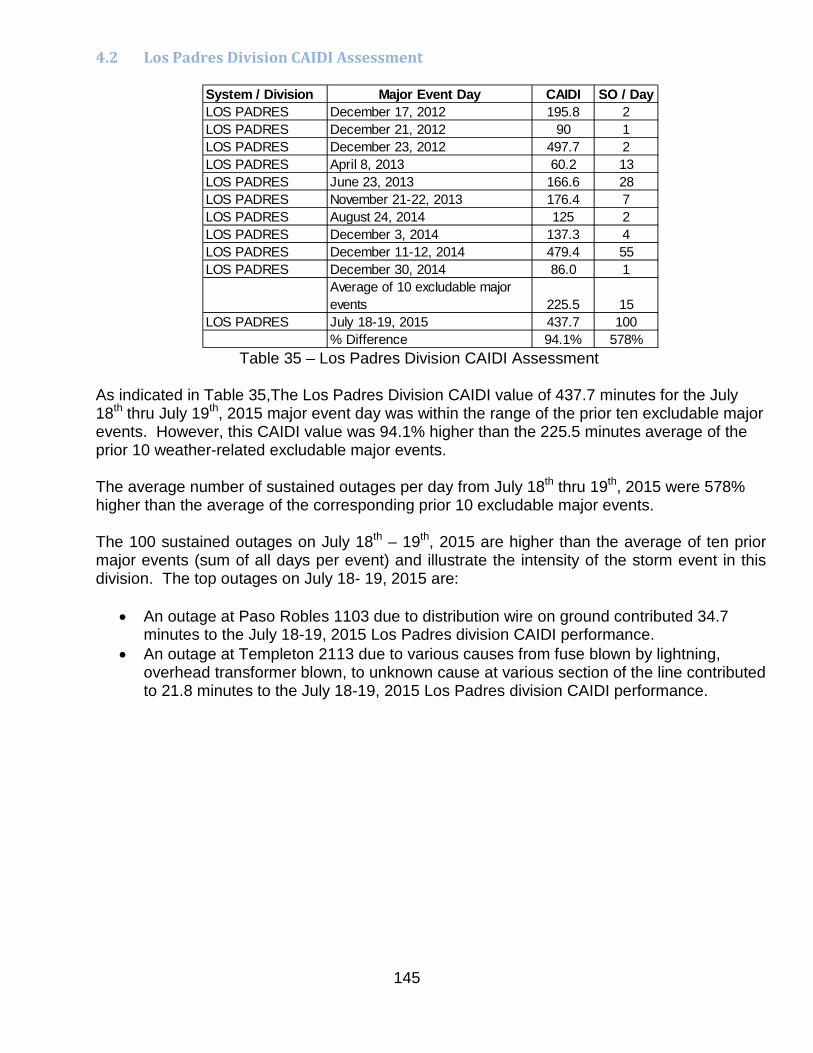
145
4.2 Los Padres Division CAIDI Assessment
Table 35 – Los Padres Division CAIDI Assessment As indicated in Table 35,The Los Padres Division CAIDI value of 437.7 minutes for the July 18th thru July 19th, 2015 major event day was within the range of the prior ten excludable major events. However, this CAIDI value was 94.1% higher than the 225.5 minutes average of the prior 10 weather-related excludable major events.
The average number of sustained outages per day from July 18th thru 19th, 2015 were 578% higher than the average of the corresponding prior 10 excludable major events.
The 100 sustained outages on July 18th – 19th, 2015 are higher than the average of ten prior major events (sum of all days per event) and illustrate the intensity of the storm event in this division. The top outages on July 18- 19, 2015 are:
• An outage at Paso Robles 1103 due to distribution wire on ground contributed 34.7 minutes to the July 18-19, 2015 Los Padres division CAIDI performance.
• An outage at Templeton 2113 due to various causes from fuse blown by lightning, overhead transformer blown, to unknown cause at various section of the line contributed to 21.8 minutes to the July 18-19, 2015 Los Padres division CAIDI performance.
System / Division Major Event Day CAIDI SO / DayLOS PADRES December 17, 2012 195.8 2LOS PADRES December 21, 2012 90 1LOS PADRES December 23, 2012 497.7 2LOS PADRES April 8, 2013 60.2 13LOS PADRES June 23, 2013 166.6 28LOS PADRES November 21-22, 2013 176.4 7LOS PADRES August 24, 2014 125 2LOS PADRES December 3, 2014 137.3 4LOS PADRES December 11-12, 2014 479.4 55LOS PADRES December 30, 2014 86.0 1
Average of 10 excludable major events 225.5 15
LOS PADRES July 18-19, 2015 437.7 100% Difference 94.1% 578%

146
4.3 Mission Division CAIDI Assessment
Table 36 – Mission Division CAIDI Assessment As indicated in Table 36, The Mission Division CAIDI value of 250.2 minutes for the July 18th thru July 19th, 2015 major event day was within the range of the prior ten excludable major events. However, this CAIDI value was 125.1% higher than the 111.2 minutes average of the prior 10 weather-related excludable major events.
This higher CAIDI value was due to the following:
• An outage on the Las Positas 2104 feeder due to an underground conductor failure. This outage contributed 28.5 minutes to the July 18-19, 2015 Mission division CAIDI performance.
• An outage on the Castro Valley 1101 feeder due to an underground transformer failure that contributed 110.8 minutes to the July 18-19, 2015 Mission division CAIDI performance.
System / Division Major Event Day CAIDI SO / DayMISSION December 17, 2012 168.2 1MISSION December 21, 2012 381.9 3MISSION December 23, 2012 101.2 7MISSION April 8, 2013 67.9 11MISSION June 23, 2013 101.3 3MISSION November 21-22, 2013 85.2 15MISSION August 24, 2014 87.1 3MISSION December 3, 2014 240.7 4MISSION December 11-12, 2014 140.7 8MISSION December 30, 2014 135.7 31
Average of 10 excludable major events 111.2 9
MISSION July 18-19, 2015 250.2 2% Difference 125.1% -83%
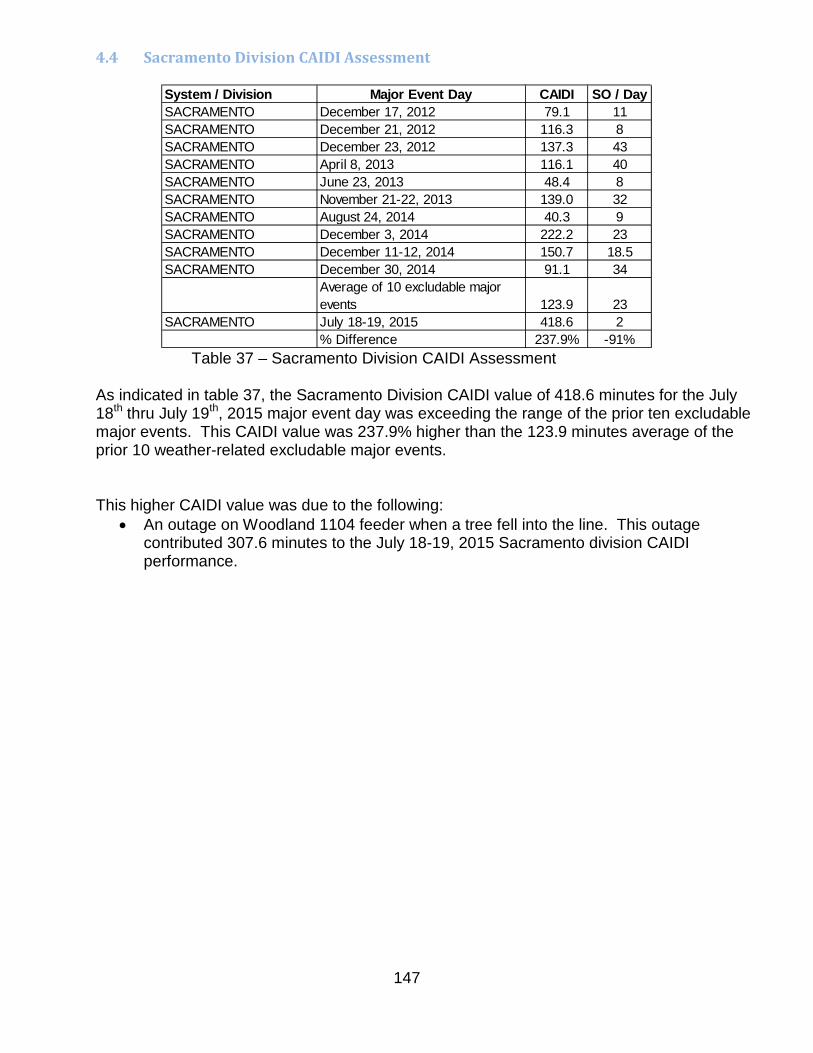
147
4.4 Sacramento Division CAIDI Assessment
Table 37 – Sacramento Division CAIDI Assessment
As indicated in table 37, the Sacramento Division CAIDI value of 418.6 minutes for the July 18th thru July 19th, 2015 major event day was exceeding the range of the prior ten excludable major events. This CAIDI value was 237.9% higher than the 123.9 minutes average of the prior 10 weather-related excludable major events.
This higher CAIDI value was due to the following: • An outage on Woodland 1104 feeder when a tree fell into the line. This outage
contributed 307.6 minutes to the July 18-19, 2015 Sacramento division CAIDI performance.
System / Division Major Event Day CAIDI SO / DaySACRAMENTO December 17, 2012 79.1 11SACRAMENTO December 21, 2012 116.3 8SACRAMENTO December 23, 2012 137.3 43SACRAMENTO April 8, 2013 116.1 40SACRAMENTO June 23, 2013 48.4 8SACRAMENTO November 21-22, 2013 139.0 32SACRAMENTO August 24, 2014 40.3 9SACRAMENTO December 3, 2014 222.2 23SACRAMENTO December 11-12, 2014 150.7 18.5SACRAMENTO December 30, 2014 91.1 34
Average of 10 excludable major events 123.9 23
SACRAMENTO July 18-19, 2015 418.6 2% Difference 237.9% -91%

148
5. December 13, 2015 Major Event Day The fifth major event day happened on December 13th, 2015; a strong cold front moved into the northern part of the territory and produced strong wind gusts, a period of very heavy rainfall, and significant outage activity. The front swiftly progressed south through the remainder of the territory. Widespread wind gusts from 40 - 55 mph were observed across the Sacramento Valley and Redding recorded a gust near 60 mph. Table 38 summarizes the system and division CAIDI performances during this event and the average of the prior ten weather related major events.
(December 13, 2015 vs. Prior 10 MED)
Table 38 – December 13, 2015 CAIDI Performance
System / Division
Average CAIDI of Prior 10 System / Division Specific Excludable ME
December 13, 2015 / Division Specific
CAIDI
Percent Difference From the Prior CAIDI Average
Exceeds the Investigation Threshold?
SYSTEM 253.9 127.7 -49.7% NoCENTRAL COAST 278.6 74.2 -73.4% NoDE ANZA 180.0 71.7 -60.2% NoDIABLO 161.4 31.6 -80.4% NoEAST BAY 212.5 91.1 -57.1% NoFRESNO 86.8 23.7 -72.7% NoHUMBOLDT 402.4 268.4 -33.3% NoKERN 144.8 144.1 -0.5% NoLOS PADRES 225.5 291.3 29.2% YesMISSION 111.2 176.0 58.3% YesNORTH BAY 277.1 146.4 -47.2% NoNORTH VALLEY 649.0 157.9 -75.7% NoPENINSULA 145.9 119.6 -18.0% NoSACRAMENTO 123.9 142.3 14.9% NoSAN FRANCISCO 240.5 144.6 -39.9% NoSAN JOSE 114.4 77.2 -32.5% NoSIERRA 295.0 139.2 -52.8% NoSONOMA 265.5 230.6 -13.2% NoSTOCKTON 354.8 146.7 -58.6% NoYOSEMITE 249.3 110.8 -55.5% No

149
5.1 Los Padres Division CAIDI Assessment
Table 39 – Los Padres Division CAIDI Assessment
As indicated in table 39, the Los Padres Division CAIDI value of 291.3 minutes for the December 13th, 2015 major event day was within the range of the prior ten excludable major events. However, this CAIDI value was 29.2% higher than the 225.5 minutes average of the prior 10 weather-related excludable major events. This higher CAIDI value was due to the following:
• An outage on Santa Maria 1105 feeder due to an underground transformer failure. This outage contributed 194.5 minutes to the December 13th, 2015 Los Padres division CAIDI performance.
System / Division Major Event Day CAIDI SO / DayLOS PADRES December 17, 2012 195.8 2LOS PADRES December 21, 2012 90.0 1LOS PADRES December 23, 2012 497.7 2LOS PADRES April 8, 2013 60.2 13LOS PADRES June 23, 2013 166.6 28LOS PADRES November 21-22, 2013 176.4 7LOS PADRES August 24, 2014 125.0 2LOS PADRES December 3, 2014 137.3 4LOS PADRES December 11-12, 2014 479.4 55LOS PADRES December 30, 2014 86.0 1
Average of 10 excludable major events 225.5 15
LOS PADRES December 13, 2015 291.3 6% Difference 29.2% -59%

150
5.2 Mission Division CAIDI Assessment
Table 40 – Mission Division CAIDI Assessment
As indicated in table 40, the Mission Division CAIDI value of 176 minutes for the December 13th, 2015 major event day was within the range of the prior ten excludable major events. However, this CAIDI value was 58.3% higher than the 111.2 minutes average of the prior 10 weather-related excludable major events.
This higher CAIDI value was due to the following:
• An outage on the Jarvis 1110 feeder due to underground switch failures. This outage contributed 83 minutes to the December 13th, 2015 Mission division CAIDI performance.
System / Division Major Event Day CAIDI SO / DayMISSION December 17, 2012 168.2 1MISSION December 21, 2012 381.9 3MISSION December 23, 2012 101.2 7MISSION April 8, 2013 67.9 11MISSION June 23, 2013 101.3 3MISSION November 21-22, 2013 85.2 15MISSION August 24, 2014 87.1 3MISSION December 3, 2014 240.7 4MISSION December 11-12, 2014 140.7 8MISSION December 30, 2014 135.7 31
Average of 10 excludable major events 111.2 9
MISSION December 13, 2015 176.0 6% Difference 58.3% -33%

151
6. December 24, 2015 Major Event Day The sixth major event day occurred on Christmas Eve. An active Christmas Eve storm moved though the territory producing low elevation snow, isolated thunderstorms, and even a pair of tornadoes. Table 41 summarizes the system and division CAIDI performances during this event and the average of the prior ten weather related major events.
(December 24, 2015 vs. Prior 10 MED)
Table 41 – December 24, 2015 CAIDI Performance
System / Division
Average CAIDI of Prior 10 System / Division Specific Excludable ME
December 24, 2015 / Division Specific CAIDI
Percent Difference From the Prior CAIDI Average
Exceeds the Investigation Threshold?
SYSTEM 253.9 344.5 35.7% YesCENTRAL COAST 278.6 113.9 -59.1% NoDE ANZA 180.0 0.0 -100.0% NoDIABLO 161.4 0.0 -100.0% NoEAST BAY 212.5 0.0 -100.0% NoFRESNO 86.8 21.8 -74.9% NoHUMBOLDT 402.4 726.8 80.6% YesKERN 144.8 119.0 -17.8% NoLOS PADRES 225.5 542.0 140.3% YesMISSION 111.2 165.5 48.9% YesNORTH BAY 277.1 230.2 -16.9% NoNORTH VALLEY 649.0 102.3 -84.2% NoPENINSULA 145.9 448.7 207.6% YesSACRAMENTO 123.9 140.4 13.3% NoSAN FRANCISCO 240.5 242.4 0.8% NoSAN JOSE 114.4 100.0 -12.6% NoSIERRA 295.0 293.3 -0.6% NoSONOMA 265.5 139.8 -47.3% NoSTOCKTON 354.8 261.1 -26.4% NoYOSEMITE 249.3 75.9 -69.5% No

152
6.1 System CAIDI Assessment
Table 42 – System CAIDI Assessment
As indicated in table 42, the System CAIDI value of 344.5 minutes for the December 24th, 2015 major event day was within the range of the prior ten excludable major events. However, this CAIDI value was 35.7% higher than the 253.9 minutes average of the prior 10 weather-related excludable major events.
This higher CAIDI value was due to the following:
• A tree related outage on the Maple Creek – Hoopa 60kV transmission line contributed 57.3 minutes to the December 24th, 2015 System CAIDI performance.
• An outage on Low Gap 1101 feeder at multiple locations due to snow and tree damage on the line contributed 29.6 minutes to the December 24th, 2015 System CAIDI performance.
• An outage on the West Point – Valley Spring 60 kV transmission line due to a third party car hitting the transmission pole contributed 18.3 minutes to the December 24th, 2015 System CAIDI performance.
System / Division Major Event Day CAIDI SO / DaySYSTEM December 17, 2012 443.1 102SYSTEM December 21, 2012 549.2 199SYSTEM December 23, 2012 287.2 439SYSTEM April 8, 2013 167.4 447SYSTEM June 23, 2013 160.5 96SYSTEM November 21-22, 2013 254.5 419SYSTEM August 24, 2014 302.5 209SYSTEM December 3, 2014 144.1 373SYSTEM December 11-12, 2014 278.0 728SYSTEM December 30, 2014 202.6 643
Average of 10 excludable major events 253.9 400
SYSTEM December 24, 2015 344.5 135% Difference 35.7% -66%
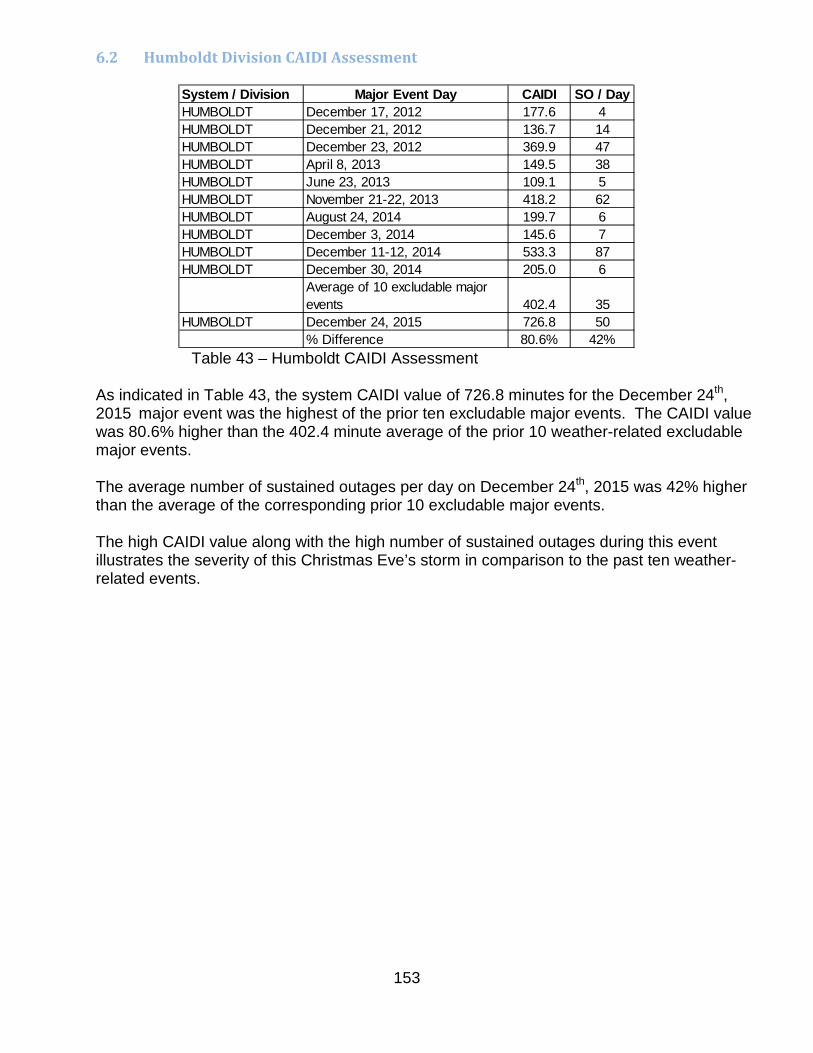
153
6.2 Humboldt Division CAIDI Assessment
Table 43 – Humboldt CAIDI Assessment
As indicated in Table 43, the system CAIDI value of 726.8 minutes for the December 24th, 2015 major event was the highest of the prior ten excludable major events. The CAIDI value was 80.6% higher than the 402.4 minute average of the prior 10 weather-related excludable major events. The average number of sustained outages per day on December 24th, 2015 was 42% higher than the average of the corresponding prior 10 excludable major events. The high CAIDI value along with the high number of sustained outages during this event illustrates the severity of this Christmas Eve’s storm in comparison to the past ten weather-related events.
System / Division Major Event Day CAIDI SO / DayHUMBOLDT December 17, 2012 177.6 4HUMBOLDT December 21, 2012 136.7 14HUMBOLDT December 23, 2012 369.9 47HUMBOLDT April 8, 2013 149.5 38HUMBOLDT June 23, 2013 109.1 5HUMBOLDT November 21-22, 2013 418.2 62HUMBOLDT August 24, 2014 199.7 6HUMBOLDT December 3, 2014 145.6 7HUMBOLDT December 11-12, 2014 533.3 87HUMBOLDT December 30, 2014 205.0 6
Average of 10 excludable major events 402.4 35
HUMBOLDT December 24, 2015 726.8 50% Difference 80.6% 42%

154
6.3 Los Padres Division CAIDI Assessment
Table 44 – Los Padres CAIDI Assessment
As indicated in table 44, the Los Padres Division CAIDI value of 542 minutes for the December 24th, 2015 major event day exceeds the range of the prior ten excludable major events. This CAIDI value is 140.3% higher than the 225.5 minutes average of the prior 10 weather-related excludable major events.
This higher CAIDI value was due to the following:
• An outage on Foot Hill 1101 feeder due to equipment failure contributed 542 minutes to the December 24th, 2015 Los Padres division CAIDI performance.
System / Division Major Event Day CAIDI SO / DayLOS PADRES December 17, 2012 195.8 2LOS PADRES December 21, 2012 90.0 1LOS PADRES December 23, 2012 497.7 2LOS PADRES April 8, 2013 60.2 13LOS PADRES June 23, 2013 166.6 28LOS PADRES November 21-22, 2013 176.4 7LOS PADRES August 24, 2014 125.0 2LOS PADRES December 3, 2014 137.3 4LOS PADRES December 11-12, 2014 479.4 55LOS PADRES December 30, 2014 86.0 1
Average of 10 excludable major events 225.5 15
LOS PADRES December 24, 2015 542.0 1% Difference 140.3% -93%

155
6.4 Mission Division CAIDI Assessment
Table 45 – Mission CAIDI Assessment
As indicated in table 45, the Mission Division CAIDI value of 165.5 minutes for the December 24th, 2015 major event day was within the range of the prior ten excludable major events. However, this CAIDI value was 48.9% higher than the 111.2 minutes average of the prior 10 weather-related excludable major events. This higher CAIDI value was due to the following:
• A failed overhead transformer connection on the Newark 2107 circuit. • A failed overhead transformer on the Grant 1102 circuit.
System / Division Major Event Day CAIDI SO / DayMISSION December 17, 2012 168.2 1MISSION December 21, 2012 381.9 3MISSION December 23, 2012 101.2 7MISSION April 8, 2013 67.9 11MISSION June 23, 2013 101.3 3MISSION November 21-22, 2013 85.2 15MISSION August 24, 2014 87.1 3MISSION December 3, 2014 240.7 4MISSION December 11-12, 2014 140.7 8MISSION December 30, 2014 135.7 31
Average of 10 excludable major events 111.2 9
MISSION Decmber 24, 2015 165.5 2% Difference 48.9% -78%

156
6.5 Peninsula Division CAIDI Assessment
Table 46 – Peninsula CAIDI Assessment
As indicated in table 46, the Peninsula Division CAIDI value of 448.7 minutes for the December 24th, 2015 major event day was within the range of the prior ten excludable major events. However, this CAIDI value was 207.6% higher than the 145.9 minutes average of the prior 10 weather-related excludable major events.
This higher CAIDI value was due to the following:
• An outage on the Belmont 1103 circuit due to a tree falling through the 12 kV line. • An underground cable failure on the East Grand 1104 circuit.
These two outages contributed 393.7 minutes to the overall December 24th CAIDI event.
System / Division Major Event Day CAIDI SO / DayPENINSULA December 17, 2012 107.8 50PENINSULA December 21, 2012 90.4 2PENINSULA December 23, 2012 65.7 6PENINSULA April 8, 2013 83.3 15PENINSULA June 23, 2013 247.5 66PENINSULA November 21-22, 2013 528.4 2PENINSULA August 24, 2014 116.5 4PENINSULA December 3, 2014 179.2 27PENINSULA December 11-12, 2014 125.0 39PENINSULA December 30, 2014 113.4 23
Average of 10 excludable major events 145.9 23
PENINSULA Decmber 24, 2015 448.7 3% Difference 207.6% -87%

157
3. System and Division Indices Based on IEEE 1366 for the past 10 years including Planned Outages and including and excluding MED 2015 was the eighth year out of the last nine years with improved reliability (2008 was the exception) in terms of the total duration of sustained outages for the entire year per customer (including planned outages but excluding major events). Since 2006, PG&E has consistently reduced the total duration of power outages per customer from 195.7 minutes to 95.8 minutes, a 51 percent improvement, as shown in Table 47 below.
Table 47: Combine Transmission and Distribution System Indices with Planned Outages
SAIDI SAIFI MAIFI CAIDI SAIDI SAIFI MAIFI CAIDI2006 311.4 1.833 1.785 169.9 195.7 1.450 1.588 135.02007 184.6 1.357 1.575 136.1 167.0 1.306 1.526 127.92008 448.7 1.666 1.835 269.3 181.5 1.299 1.597 139.72009 235.2 1.404 1.547 167.5 157.5 1.206 1.398 130.62010 276.6 1.496 1.492 185.0 157.2 1.207 1.257 130.22011 311.8 1.392 1.490 223.9 141.8 1.087 1.180 130.52012 161.8 1.219 1.927 132.7 131.5 1.125 1.805 116.92013 138.3 1.167 1.643 118.5 116.8 1.065 1.533 109.72014 151.3 1.131 1.571 133.8 110.2 0.965 1.400 114.22015 145.5 1.051 1.773 138.4 95.8 0.870 1.549 110.1
Major Event Day (MED) ExcludedMajor Event Day (MED) IncludedYear
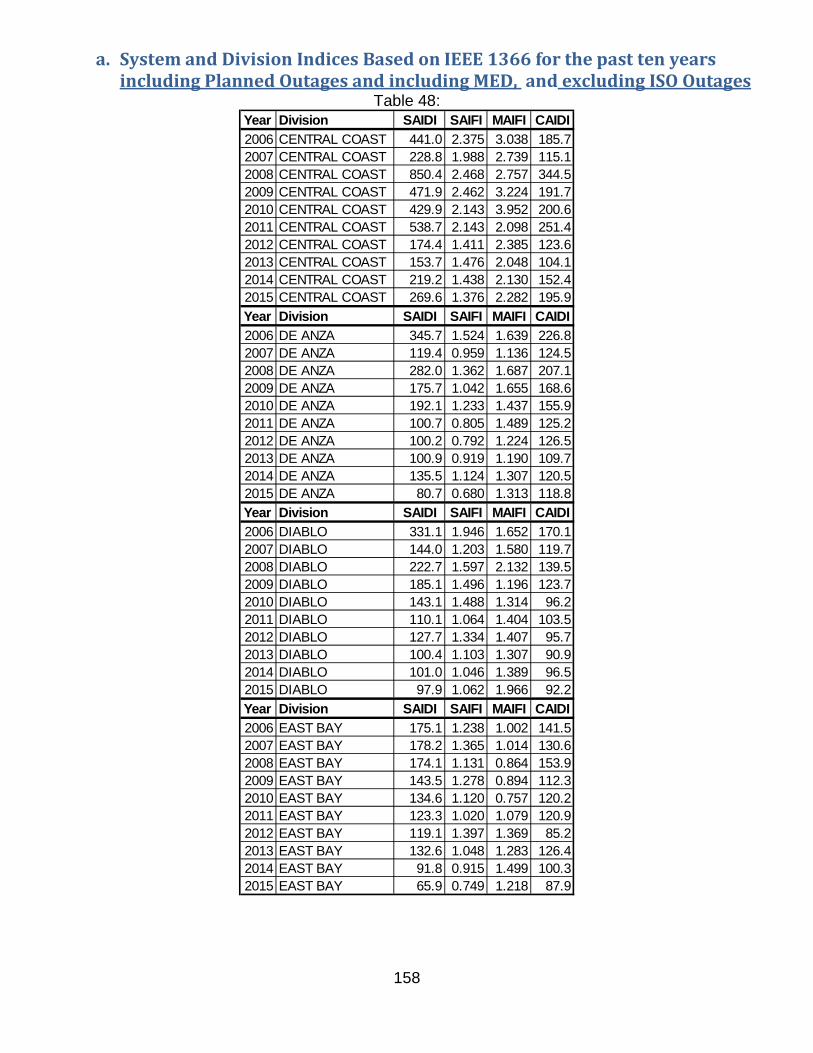
158
a. System and Division Indices Based on IEEE 1366 for the past ten years including Planned Outages and including MED, and excluding ISO Outages
Table 48:
Year Division SAIDI SAIFI MAIFI CAIDI2006 CENTRAL COAST 441.0 2.375 3.038 185.72007 CENTRAL COAST 228.8 1.988 2.739 115.12008 CENTRAL COAST 850.4 2.468 2.757 344.52009 CENTRAL COAST 471.9 2.462 3.224 191.72010 CENTRAL COAST 429.9 2.143 3.952 200.62011 CENTRAL COAST 538.7 2.143 2.098 251.42012 CENTRAL COAST 174.4 1.411 2.385 123.62013 CENTRAL COAST 153.7 1.476 2.048 104.12014 CENTRAL COAST 219.2 1.438 2.130 152.42015 CENTRAL COAST 269.6 1.376 2.282 195.9Year Division SAIDI SAIFI MAIFI CAIDI2006 DE ANZA 345.7 1.524 1.639 226.82007 DE ANZA 119.4 0.959 1.136 124.52008 DE ANZA 282.0 1.362 1.687 207.12009 DE ANZA 175.7 1.042 1.655 168.62010 DE ANZA 192.1 1.233 1.437 155.92011 DE ANZA 100.7 0.805 1.489 125.22012 DE ANZA 100.2 0.792 1.224 126.52013 DE ANZA 100.9 0.919 1.190 109.72014 DE ANZA 135.5 1.124 1.307 120.52015 DE ANZA 80.7 0.680 1.313 118.8Year Division SAIDI SAIFI MAIFI CAIDI2006 DIABLO 331.1 1.946 1.652 170.12007 DIABLO 144.0 1.203 1.580 119.72008 DIABLO 222.7 1.597 2.132 139.52009 DIABLO 185.1 1.496 1.196 123.72010 DIABLO 143.1 1.488 1.314 96.22011 DIABLO 110.1 1.064 1.404 103.52012 DIABLO 127.7 1.334 1.407 95.72013 DIABLO 100.4 1.103 1.307 90.92014 DIABLO 101.0 1.046 1.389 96.52015 DIABLO 97.9 1.062 1.966 92.2Year Division SAIDI SAIFI MAIFI CAIDI2006 EAST BAY 175.1 1.238 1.002 141.52007 EAST BAY 178.2 1.365 1.014 130.62008 EAST BAY 174.1 1.131 0.864 153.92009 EAST BAY 143.5 1.278 0.894 112.32010 EAST BAY 134.6 1.120 0.757 120.22011 EAST BAY 123.3 1.020 1.079 120.92012 EAST BAY 119.1 1.397 1.369 85.22013 EAST BAY 132.6 1.048 1.283 126.42014 EAST BAY 91.8 0.915 1.499 100.32015 EAST BAY 65.9 0.749 1.218 87.9

159
Year Division SAIDI SAIFI MAIFI CAIDI2006 FRESNO 325.6 2.314 2.343 140.72007 FRESNO 257.9 1.890 2.256 136.52008 FRESNO 227.4 1.754 1.798 129.72009 FRESNO 185.0 1.461 1.902 126.62010 FRESNO 204.0 1.377 1.957 148.12011 FRESNO 187.0 1.215 2.023 153.92012 FRESNO 122.1 1.158 2.361 105.42013 FRESNO 121.5 1.225 2.115 99.22014 FRESNO 104.0 1.095 1.775 95.02015 FRESNO 115.2 1.238 2.135 93.1Year Division SAIDI SAIFI MAIFI CAIDI2006 HUMBOLDT 1,131.7 3.063 3.857 369.52007 HUMBOLDT 619.9 2.055 3.326 301.72008 HUMBOLDT 1,136.5 3.027 3.366 375.52009 HUMBOLDT 356.1 2.041 2.489 174.52010 HUMBOLDT 737.8 2.860 1.719 258.02011 HUMBOLDT 762.1 2.439 2.280 312.52012 HUMBOLDT 388.7 1.904 4.673 204.22013 HUMBOLDT 342.4 1.518 2.650 225.52014 HUMBOLDT 350.5 1.514 1.955 231.52015 HUMBOLDT 738.9 2.388 2.842 309.4Year Division SAIDI SAIFI MAIFI CAIDI2006 KERN 245.7 1.776 1.976 138.32007 KERN 146.1 1.237 1.603 118.12008 KERN 192.0 1.509 1.216 127.32009 KERN 126.9 1.258 1.493 100.82010 KERN 152.4 1.264 1.583 120.62011 KERN 189.8 1.367 1.622 138.82012 KERN 107.7 1.066 1.229 101.02013 KERN 103.2 1.168 1.202 88.32014 KERN 131.4 1.204 1.847 109.22015 KERN 104.5 1.022 1.976 102.3Year Division SAIDI SAIFI MAIFI CAIDI2006 LOS PADRES 411.0 2.374 3.219 173.12007 LOS PADRES 154.4 1.247 2.686 123.82008 LOS PADRES 262.0 1.931 3.067 135.72009 LOS PADRES 200.3 1.367 1.714 146.52010 LOS PADRES 293.1 1.818 2.055 161.22011 LOS PADRES 159.1 1.333 2.195 119.42012 LOS PADRES 124.0 1.142 1.633 108.62013 LOS PADRES 242.3 1.618 1.095 149.72014 LOS PADRES 202.2 1.298 1.378 155.82015 LOS PADRES 148.2 0.931 1.899 159.1

160
Year Division SAIDI SAIFI MAIFI CAIDI2006 MISSION 130.3 1.095 1.259 119.02007 MISSION 100.1 0.907 1.024 110.32008 MISSION 119.9 1.054 1.516 113.72009 MISSION 103.2 0.826 0.902 124.92010 MISSION 123.6 1.053 0.785 117.42011 MISSION 88.9 0.900 0.693 98.72012 MISSION 106.2 0.967 0.886 109.82013 MISSION 89.9 0.877 0.838 102.62014 MISSION 84.8 0.805 0.826 105.42015 MISSION 71.7 0.654 1.162 109.6Year Division SAIDI SAIFI MAIFI CAIDI2006 NORTH BAY 261.7 1.554 1.473 168.42007 NORTH BAY 150.5 1.203 1.803 125.12008 NORTH BAY 589.1 1.782 1.979 330.62009 NORTH BAY 186.2 1.354 1.011 137.52010 NORTH BAY 179.8 1.320 1.402 136.22011 NORTH BAY 244.3 1.508 1.224 162.02012 NORTH BAY 164.5 1.046 1.950 157.32013 NORTH BAY 146.4 1.144 1.731 128.02014 NORTH BAY 253.2 1.362 2.714 185.92015 NORTH BAY 156.3 1.171 2.162 133.5Year Division SAIDI SAIFI MAIFI CAIDI2006 NORTH VALLEY 378.8 2.457 2.130 154.22007 NORTH VALLEY 304.6 1.708 2.141 178.32008 NORTH VALLEY 1,625.4 2.527 4.194 643.32009 NORTH VALLEY 335.0 1.651 3.143 203.02010 NORTH VALLEY 609.0 2.007 2.002 303.52011 NORTH VALLEY 703.6 2.331 2.141 301.82012 NORTH VALLEY 543.4 2.003 2.952 271.42013 NORTH VALLEY 179.2 1.251 1.974 143.22014 NORTH VALLEY 212.1 1.285 1.837 165.12015 NORTH VALLEY 505.6 1.920 2.603 263.4Year Division SAIDI SAIFI MAIFI CAIDI2006 PENINSULA 217.5 1.777 1.571 122.42007 PENINSULA 93.9 0.818 1.062 114.92008 PENINSULA 438.6 1.908 2.060 229.92009 PENINSULA 140.8 1.162 0.893 121.12010 PENINSULA 185.2 1.670 1.450 110.92011 PENINSULA 131.5 1.254 0.965 104.92012 PENINSULA 115.0 1.200 1.709 95.82013 PENINSULA 107.3 0.934 1.333 114.82014 PENINSULA 111.6 1.127 1.368 99.02015 PENINSULA 90.5 0.941 1.842 96.2

161
Year Division SAIDI SAIFI MAIFI CAIDI2006 SACRAMENTO 251.8 1.483 1.904 169.82007 SACRAMENTO 136.5 0.961 1.055 142.12008 SACRAMENTO 894.5 2.030 2.300 440.62009 SACRAMENTO 266.9 1.471 1.836 181.52010 SACRAMENTO 215.9 1.210 1.439 178.32011 SACRAMENTO 210.1 1.306 1.922 160.92012 SACRAMENTO 182.2 1.478 2.157 123.32013 SACRAMENTO 123.1 1.106 1.716 111.32014 SACRAMENTO 128.4 1.006 1.452 127.72015 SACRAMENTO 113.0 1.009 1.849 112.0Year Division SAIDI SAIFI MAIFI CAIDI2006 SAN FRANCISCO 87.6 0.924 0.301 94.82007 SAN FRANCISCO 113.6 1.098 0.387 103.52008 SAN FRANCISCO 164.6 0.927 0.272 177.62009 SAN FRANCISCO 81.9 0.854 0.136 95.92010 SAN FRANCISCO 67.6 0.765 0.098 88.42011 SAN FRANCISCO 60.0 0.622 0.216 96.62012 SAN FRANCISCO 62.3 0.673 1.052 92.52013 SAN FRANCISCO 64.8 0.706 0.334 91.82014 SAN FRANCISCO 141.7 0.860 0.351 164.82015 SAN FRANCISCO 44.2 0.569 0.559 77.7Year Division SAIDI SAIFI MAIFI CAIDI2006 SAN JOSE 320.6 1.534 1.030 209.02007 SAN JOSE 122.4 1.070 1.011 114.52008 SAN JOSE 192.0 1.105 1.175 173.82009 SAN JOSE 102.5 0.920 0.818 111.42010 SAN JOSE 125.3 1.036 0.608 121.02011 SAN JOSE 131.6 1.065 0.808 123.62012 SAN JOSE 102.9 0.932 0.993 110.32013 SAN JOSE 122.1 1.089 1.038 112.12014 SAN JOSE 124.6 1.101 1.075 113.12015 SAN JOSE 90.1 0.872 1.211 103.4Year Division SAIDI SAIFI MAIFI CAIDI2006 SIERRA 421.5 2.356 1.048 178.92007 SIERRA 276.4 1.808 2.056 152.92008 SIERRA 1,221.3 2.354 2.051 518.82009 SIERRA 851.6 2.219 1.535 383.82010 SIERRA 788.5 2.415 1.608 326.62011 SIERRA 1,066.3 2.404 2.900 443.52012 SIERRA 269.9 1.582 3.229 170.62013 SIERRA 175.3 1.483 3.276 118.22014 SIERRA 208.9 1.467 2.431 142.52015 SIERRA 197.3 1.378 3.315 143.2

162
Year Division SAIDI SAIFI MAIFI CAIDI2006 SONOMA 339.1 1.842 0.843 184.12007 SONOMA 196.9 1.362 1.808 144.62008 SONOMA 485.6 1.511 1.175 321.32009 SONOMA 216.1 1.374 1.574 157.32010 SONOMA 244.0 1.523 1.018 160.22011 SONOMA 286.9 1.438 1.529 199.52012 SONOMA 234.6 1.235 2.032 189.92013 SONOMA 210.8 1.260 2.537 167.32014 SONOMA 239.3 1.374 2.071 174.22015 SONOMA 140.7 0.985 2.005 142.8Year Division SAIDI SAIFI MAIFI CAIDI2006 STOCKTON 330.9 2.251 2.789 147.02007 STOCKTON 199.7 1.719 1.829 116.22008 STOCKTON 304.6 1.637 2.212 186.12009 STOCKTON 445.1 1.897 3.146 234.62010 STOCKTON 408.9 1.806 1.604 226.52011 STOCKTON 502.1 1.862 1.202 269.72012 STOCKTON 192.4 1.286 2.105 149.62013 STOCKTON 135.0 1.552 2.145 87.02014 STOCKTON 138.5 0.923 1.471 150.02015 STOCKTON 135.8 1.105 2.291 122.8Year Division SAIDI SAIFI MAIFI CAIDI2006 YOSEMITE 412.4 2.569 2.994 160.52007 YOSEMITE 252.8 1.725 1.420 146.52008 YOSEMITE 344.7 1.831 1.626 188.22009 YOSEMITE 287.5 1.570 1.722 183.22010 YOSEMITE 737.9 2.109 3.166 349.82011 YOSEMITE 1,201.5 2.098 2.642 572.72012 YOSEMITE 166.1 1.392 4.181 119.32013 YOSEMITE 204.7 1.403 3.466 145.92014 YOSEMITE 147.6 1.342 2.683 110.02015 YOSEMITE 130.6 1.162 3.183 112.4Year Division SAIDI SAIFI MAIFI CAIDI2006 SYSTEM 311.4 1.833 1.785 169.92007 SYSTEM 184.6 1.357 1.575 136.12008 SYSTEM 448.7 1.666 1.835 269.32009 SYSTEM 235.2 1.404 1.547 167.52010 SYSTEM 276.6 1.496 1.492 185.02011 SYSTEM 311.8 1.392 1.490 223.92012 SYSTEM 161.8 1.219 1.927 132.72013 SYSTEM 138.3 1.167 1.643 118.52014 SYSTEM 151.3 1.131 1.571 133.82015 SYSTEM 147.2 1.052 1.873 140.0

163
b. System and Division Indices Based on IEEE 1366 for the past 10 years including Planned Outages and excluding ISO, and MED
Table 49:
Year Division SAIDI SAIFI MAIFI CAIDI2006 CENTRAL COAST 243.3 1.773 2.650 137.32007 CENTRAL COAST 226.9 1.978 2.699 114.82008 CENTRAL COAST 272.9 1.820 2.373 150.02009 CENTRAL COAST 243.3 2.043 3.008 119.12010 CENTRAL COAST 210.2 1.672 2.937 125.82011 CENTRAL COAST 197.8 1.658 1.603 119.32012 CENTRAL COAST 159.7 1.339 2.206 119.32013 CENTRAL COAST 147.2 1.444 1.973 102.02014 CENTRAL COAST 141.8 1.171 1.835 121.22015 CENTRAL COAST 118.6 0.934 1.848 126.9Year Division SAIDI SAIFI MAIFI CAIDI2006 DE ANZA 117.9 0.920 1.404 128.22007 DE ANZA 118.6 0.955 1.106 124.12008 DE ANZA 120.4 1.033 1.459 116.62009 DE ANZA 121.3 0.900 1.587 134.82010 DE ANZA 135.6 1.019 1.167 133.02011 DE ANZA 80.9 0.718 1.181 112.72012 DE ANZA 92.1 0.742 1.110 124.12013 DE ANZA 98.9 0.909 1.155 108.82014 DE ANZA 111.2 0.987 1.211 112.62015 DE ANZA 68.2 0.561 1.182 121.7Year Division SAIDI SAIFI MAIFI CAIDI2006 DIABLO 163.5 1.384 1.466 118.22007 DIABLO 143.6 1.201 1.578 119.62008 DIABLO 160.1 1.475 1.952 108.62009 DIABLO 170.6 1.401 1.157 121.82010 DIABLO 127.5 1.336 1.221 95.42011 DIABLO 98.0 0.934 1.245 104.92012 DIABLO 121.2 1.291 1.369 93.92013 DIABLO 97.4 1.081 1.246 90.02014 DIABLO 84.8 0.953 1.240 89.02015 DIABLO 87.8 0.935 1.674 93.9Year Division SAIDI SAIFI MAIFI CAIDI2006 EAST BAY 149.5 1.094 0.872 136.62007 EAST BAY 175.8 1.344 1.006 130.82008 EAST BAY 114.0 0.959 0.810 118.82009 EAST BAY 129.8 1.181 0.847 109.92010 EAST BAY 98.7 0.902 0.682 109.42011 EAST BAY 106.5 0.906 0.850 117.52012 EAST BAY 108.9 1.301 1.300 83.72013 EAST BAY 76.3 0.867 1.172 88.02014 EAST BAY 75.5 0.795 1.283 95.02015 EAST BAY 51.1 0.611 1.079 83.6

164
Year Division SAIDI SAIFI MAIFI CAIDI2006 FRESNO 235.1 1.853 2.217 126.92007 FRESNO 256.0 1.870 2.237 136.92008 FRESNO 202.6 1.626 1.741 124.62009 FRESNO 168.2 1.331 1.758 126.42010 FRESNO 143.5 1.157 1.848 124.02011 FRESNO 98.3 0.894 1.689 110.02012 FRESNO 120.5 1.135 2.325 106.22013 FRESNO 118.8 1.192 2.074 99.72014 FRESNO 101.6 1.076 1.704 94.52015 FRESNO 84.8 0.935 1.832 90.7Year Division SAIDI SAIFI MAIFI CAIDI2006 HUMBOLDT 576.9 2.306 3.116 250.12007 HUMBOLDT 459.1 1.886 3.250 243.42008 HUMBOLDT 526.2 2.254 2.922 233.42009 HUMBOLDT 336.6 1.904 2.348 176.82010 HUMBOLDT 564.6 2.472 1.539 228.42011 HUMBOLDT 439.7 1.914 1.886 229.72012 HUMBOLDT 327.1 1.717 4.349 190.62013 HUMBOLDT 248.4 1.296 2.435 191.72014 HUMBOLDT 274.4 1.363 1.823 201.32015 HUMBOLDT 319.8 1.774 2.421 180.2Year Division SAIDI SAIFI MAIFI CAIDI2006 KERN 203.3 1.605 1.848 126.72007 KERN 145.7 1.236 1.603 117.92008 KERN 155.0 1.290 1.079 120.12009 KERN 115.4 1.186 1.398 97.32010 KERN 135.1 1.142 1.423 118.32011 KERN 132.3 1.072 1.345 123.42012 KERN 106.5 1.048 1.229 101.62013 KERN 98.9 1.110 1.120 89.12014 KERN 101.8 1.041 1.623 97.82015 KERN 92.8 0.937 1.855 99.0Year Division SAIDI SAIFI MAIFI CAIDI2006 LOS PADRES 238.7 1.803 2.639 132.42007 LOS PADRES 154.3 1.246 2.686 123.82008 LOS PADRES 163.2 1.469 2.722 111.12009 LOS PADRES 122.6 1.102 1.324 111.22010 LOS PADRES 126.6 1.232 1.732 102.72011 LOS PADRES 113.5 1.072 1.666 105.82012 LOS PADRES 123.3 1.139 1.626 108.22013 LOS PADRES 116.3 0.848 0.950 137.22014 LOS PADRES 110.5 1.101 1.159 100.32015 LOS PADRES 88.1 0.773 1.438 113.9

165
Year Division SAIDI SAIFI MAIFI CAIDI2006 MISSION 90.4 0.951 1.212 95.12007 MISSION 99.9 0.906 1.024 110.32008 MISSION 92.9 0.922 1.425 100.72009 MISSION 96.6 0.761 0.876 126.92010 MISSION 113.8 0.974 0.714 116.82011 MISSION 77.1 0.806 0.627 95.62012 MISSION 103.5 0.941 0.885 109.92013 MISSION 84.2 0.808 0.776 104.32014 MISSION 74.0 0.726 0.777 102.02015 MISSION 65.6 0.601 1.055 109.3Year Division SAIDI SAIFI MAIFI CAIDI2006 NORTH BAY 164.7 1.204 1.346 136.82007 NORTH BAY 149.7 1.200 1.801 124.82008 NORTH BAY 181.8 1.258 1.777 144.52009 NORTH BAY 143.3 1.175 0.896 122.02010 NORTH BAY 151.9 1.122 1.295 135.32011 NORTH BAY 151.0 1.246 1.088 121.22012 NORTH BAY 133.8 0.916 1.647 146.02013 NORTH BAY 133.8 1.057 1.456 126.62014 NORTH BAY 132.3 0.984 2.499 134.52015 NORTH BAY 117.9 1.014 1.977 116.2Year Division SAIDI SAIFI MAIFI CAIDI2006 NORTH VALLEY 357.3 2.330 2.077 153.32007 NORTH VALLEY 200.6 1.466 1.954 136.92008 NORTH VALLEY 385.7 1.804 3.448 213.82009 NORTH VALLEY 257.1 1.436 3.010 179.12010 NORTH VALLEY 213.6 1.383 1.837 154.42011 NORTH VALLEY 239.2 1.515 1.565 157.92012 NORTH VALLEY 252.2 1.622 2.580 155.52013 NORTH VALLEY 158.6 1.193 1.916 132.92014 NORTH VALLEY 150.0 1.076 1.580 139.42015 NORTH VALLEY 158.7 1.195 1.934 132.9Year Division SAIDI SAIFI MAIFI CAIDI2006 PENINSULA 115.1 1.132 1.081 101.72007 PENINSULA 92.8 0.811 1.058 114.52008 PENINSULA 136.0 1.222 1.786 111.32009 PENINSULA 97.4 0.922 0.769 105.62010 PENINSULA 139.4 1.430 1.036 97.52011 PENINSULA 102.5 1.106 0.807 92.72012 PENINSULA 100.6 1.054 1.528 95.42013 PENINSULA 83.0 0.834 1.125 99.62014 PENINSULA 90.1 0.967 1.166 93.22015 PENINSULA 74.8 0.826 1.602 90.6

166
Year Division SAIDI SAIFI MAIFI CAIDI2006 SACRAMENTO 170.0 1.243 1.770 136.82007 SACRAMENTO 133.4 0.941 1.039 141.72008 SACRAMENTO 218.9 1.365 1.734 160.42009 SACRAMENTO 150.0 1.183 1.552 126.82010 SACRAMENTO 141.3 0.981 1.087 144.02011 SACRAMENTO 135.7 1.092 1.719 124.32012 SACRAMENTO 159.6 1.338 1.984 119.32013 SACRAMENTO 117.6 1.059 1.587 111.02014 SACRAMENTO 114.6 0.898 1.273 127.52015 SACRAMENTO 100.7 0.913 1.562 110.3Year Division SAIDI SAIFI MAIFI CAIDI2006 SAN FRANCISCO 70.3 0.832 0.259 84.52007 SAN FRANCISCO 112.7 1.089 0.387 103.52008 SAN FRANCISCO 71.1 0.734 0.272 96.82009 SAN FRANCISCO 78.9 0.832 0.100 94.82010 SAN FRANCISCO 60.7 0.708 0.078 85.82011 SAN FRANCISCO 56.2 0.591 0.211 95.22012 SAN FRANCISCO 57.6 0.632 1.009 91.22013 SAN FRANCISCO 58.8 0.653 0.304 90.02014 SAN FRANCISCO 52.2 0.537 0.234 97.32015 SAN FRANCISCO 41.8 0.551 0.516 75.8Year Division SAIDI SAIFI MAIFI CAIDI2006 SAN JOSE 125.6 0.952 0.932 131.92007 SAN JOSE 121.8 1.065 1.009 114.32008 SAN JOSE 105.0 0.872 1.011 120.42009 SAN JOSE 88.6 0.819 0.797 108.12010 SAN JOSE 91.0 0.874 0.539 104.12011 SAN JOSE 119.2 0.975 0.701 122.22012 SAN JOSE 98.3 0.882 0.966 111.52013 SAN JOSE 118.8 1.040 0.978 114.22014 SAN JOSE 101.4 0.929 1.035 109.12015 SAN JOSE 80.4 0.785 1.022 102.3Year Division SAIDI SAIFI MAIFI CAIDI2006 SIERRA 315.0 2.016 0.907 156.32007 SIERRA 206.4 1.525 1.508 135.42008 SIERRA 274.0 1.710 1.555 160.22009 SIERRA 291.4 1.538 1.247 189.52010 SIERRA 227.8 1.460 1.164 156.12011 SIERRA 232.1 1.371 1.534 169.32012 SIERRA 209.0 1.423 2.911 146.82013 SIERRA 128.2 1.350 3.139 94.92014 SIERRA 156.2 1.266 2.210 123.52015 SIERRA 138.4 1.218 2.884 113.6

167
Year Division SAIDI SAIFI MAIFI CAIDI2006 SONOMA 204.9 1.506 0.794 136.02007 SONOMA 195.3 1.346 1.808 145.12008 SONOMA 187.5 1.239 0.942 151.32009 SONOMA 185.8 1.264 1.321 146.92010 SONOMA 190.2 1.270 0.818 149.82011 SONOMA 143.6 1.049 1.338 137.02012 SONOMA 143.6 1.022 1.733 140.52013 SONOMA 141.0 0.979 2.257 144.02014 SONOMA 138.2 1.023 1.589 135.22015 SONOMA 94.3 0.790 1.532 119.5Year Division SAIDI SAIFI MAIFI CAIDI2006 STOCKTON 225.3 1.764 2.505 127.72007 STOCKTON 164.8 1.596 1.781 103.32008 STOCKTON 180.6 1.211 1.819 149.22009 STOCKTON 194.2 1.368 2.725 142.02010 STOCKTON 188.8 1.405 1.403 134.42011 STOCKTON 208.9 1.336 0.912 156.42012 STOCKTON 118.6 1.109 1.981 106.92013 STOCKTON 125.7 1.516 2.033 82.92014 STOCKTON 120.4 0.829 1.336 145.32015 STOCKTON 107.3 0.944 1.952 113.6Year Division SAIDI SAIFI MAIFI CAIDI2006 YOSEMITE 321.2 2.253 2.799 142.52007 YOSEMITE 177.3 1.468 1.241 120.82008 YOSEMITE 231.0 1.489 1.533 155.22009 YOSEMITE 209.5 1.321 1.467 158.52010 YOSEMITE 252.8 1.570 2.598 161.12011 YOSEMITE 237.2 1.394 1.819 170.12012 YOSEMITE 159.2 1.352 4.101 117.72013 YOSEMITE 203.2 1.385 3.296 146.72014 YOSEMITE 129.6 1.278 2.460 101.42015 YOSEMITE 120.4 1.073 2.641 112.3Year Division SAIDI SAIFI MAIFI CAIDI2006 SYSTEM 195.7 1.450 1.588 135.02007 SYSTEM 167.0 1.306 1.526 127.92008 SYSTEM 181.5 1.299 1.597 139.72009 SYSTEM 157.5 1.206 1.398 130.62010 SYSTEM 157.2 1.207 1.257 130.22011 SYSTEM 141.8 1.087 1.180 130.52012 SYSTEM 131.5 1.125 1.805 116.92013 SYSTEM 116.8 1.065 1.533 109.72014 SYSTEM 110.2 0.965 1.400 114.22015 SYSTEM 96.0 0.871 1.593 110.2

168
c. Charts for System and Division Indices Based on IEEE 1366 for the past 10 years including Planned Outages and including and excluding MED
i. Charts for System and Division Reliability Indices based on IEEE 1366 for the past 10 years with linear trend line, and including planned outages and excluding ISO, and MED
1. SAIDI Performance Results (MED Excluded)
Chart 174: Division Reliability – SAIDI Indices
(Excludes ISO and MED)
Chart 175: Division Reliability – SAIDI Indices
(Excludes ISO and MED)

169
Chart 176: Division Reliability – SAIDI Indices
(Excludes ISO and MED)
Chart 177: Division Reliability – SAIDI Indices
(Excludes ISO and MED)

170
Chart 178: Division Reliability – SAIDI Indices
(Excludes ISO and MED)
Chart 179: Division Reliability – SAIDI Indices
(Excludes ISO and MED)

171
Chart 180: Division Reliability – SAIDI Indices
(Excludes ISO and MED)
Chart 181: Division Reliability – SAIDI Indices
(Excludes ISO and MED)

172
Chart 182: Division Reliability – SAIDI Indices
(Excludes ISO and MED)
Chart 183: Division Reliability – SAIDI Indices
(Excludes ISO and MED)

173
Chart 184: Division Reliability – SAIDI Indices
(Excludes ISO and MED)
Chart 185: Division Reliability – SAIDI Indices
(Excludes ISO and MED)

174
Chart 186: Division Reliability – SAIDI Indices
(Excludes ISO and MED)
Chart 187: Division Reliability – SAIDI Indices
(Excludes ISO and MED)

175
Chart 188: Division Reliability – SAIDI Indices
(Excludes ISO and MED)
Chart 189: Division Reliability – SAIDI Indices
(Excludes ISO and MED)

176
Chart 190: Division Reliability – SAIDI Indices
(Excludes ISO and MED)
Chart 191: Division Reliability – SAIDI Indices
(Excludes ISO and MED)

177
Chart 192: Division Reliability – SAIDI Indices
(Excludes ISO and MED)
Chart 193: Division Reliability – SAIDI Indices
(Excludes ISO and MED)

178
2. SAIFI Performance Results (MED Excluded)
Chart 194: Division Reliability – SAIFI Indices
(Excludes ISO and MED)
Chart 195: Division Reliability – SAIFI Indices
(Excludes ISO and MED)

179
Chart 196: Division Reliability – SAIFI Indices
(Excludes ISO and MED)
Chart 197: Division Reliability – SAIFI Indices
(Excludes ISO and MED)

180
Chart 198: Division Reliability – SAIFI Indices
(Excludes ISO and MED)
Chart 199: Division Reliability – SAIFI Indices
(Excludes ISO and MED)

181
Chart 200: Division Reliability – SAIFI Indices
(Excludes ISO and MED)
Chart 201: Division Reliability – SAIFI Indices
(Excludes ISO and MED)

182
Chart 202: Division Reliability – SAIFI Indices
(Excludes ISO and MED)
Chart 203: Division Reliability – SAIFI Indices
(Excludes ISO and MED)

183
Chart 204: Division Reliability – SAIFI Indices
(Excludes ISO and MED)
Chart 205: Division Reliability – SAIFI Indices
(Excludes ISO and MED)

184
Chart 206: Division Reliability – SAIFI Indices
(Excludes ISO and MED)
Chart 207: Division Reliability – SAIFI Indices
(Excludes ISO and MED)

185
Chart 208: Division Reliability – SAIFI Indices
(Excludes ISO and MED)
Chart 209: Division Reliability – SAIFI Indices
(Excludes ISO and MED)

186
Chart 210: Division Reliability – SAIFI Indices
(Excludes ISO and MED)
Chart 211: Division Reliability – SAIFI Indices
(Excludes ISO and MED)

187
Chart 212: Division Reliability – SAIFI Indices
(Excludes ISO and MED)
Chart 213: Division Reliability – SAIFI Indices
(Excludes ISO and MED)

188
3. MAIFI11 Performance Results (MED Excluded)
Chart 214: Division Reliability – MAIFI Indices
(Excludes ISO and MED)
Chart 215: Division Reliability – MAIFI Indices
(Excludes ISO and MED)
11 As discussed in footnote 4 on page 12 above, on November 18, 2011 the EON recording system was removed from service. Momentary outage data is now being collected from SCADA devices and through the use of Smart Meters. Data collection from the Smart Meters is more effective than the previous EON system since Smart Meters don’t rely on customer volunteers having EON devices securely connected inside their buildings. The increased frequency of momentary outages recorded in 2012 and following years does not indicate an actual increase in momentary outages in 2012 and after as compared to prior years, but is a result of this improved method for recording momentary outages.

189
Chart 216: Division Reliability – MAIFI Indices
(Excludes ISO and MED)
Chart 217: Division Reliability – MAIFI Indices
(Excludes ISO and MED)

190
Chart 218: Division Reliability – MAIFI Indices
(Excludes ISO and MED)
Chart 219: Division Reliability – MAIFI Indices
(Excludes ISO and MED)

191
Chart 220: Division Reliability – MAIFI Indices
(Excludes ISO and MED)
Chart 221: Division Reliability – MAIFI Indices
(Excludes ISO and MED)

192
Chart 222: Division Reliability – MAIFI Indices
(Excludes ISO and MED)
Chart 223: Division Reliability – MAIFI Indices
(Excludes ISO and MED)

193
Chart 224: Division Reliability – MAIFI Indices
(Excludes ISO and MED)
Chart 225: Division Reliability – MAIFI Indices
(Excludes ISO and MED)

194
Chart 226: Division Reliability – MAIFI Indices
(Excludes ISO and MED)
Chart 227: Division Reliability – MAIFI Indices
(Excludes ISO and MED)

195
Chart 228: Division Reliability – MAIFI Indices
(Excludes ISO and MED)
Chart 229: Division Reliability – MAIFI Indices
(Excludes ISO and MED)

196
Chart 230: Division Reliability – MAIFI Indices
(Excludes ISO and MED)
Chart 231: Division Reliability – MAIFI Indices
(Excludes ISO and MED)

197
Chart 232: Division Reliability – MAIFI Indices
(Excludes ISO and MED)
Chart 233: Division Reliability – MAIFI Indices
(Excludes ISO and MED)

198
4. CAIDI Performance Results (MED Excluded)
Chart 234: Division Reliability – CAIDI Indices
(Excludes ISO and MED)
Chart 235: Division Reliability – CAIDI Indices
(Excludes ISO and MED)

199
Chart 236: Division Reliability – CAIDI Indices
(Excludes ISO and MED)
Chart 237: Division Reliability – CAIDI Indices
(Excludes ISO and MED)

200
Chart 238: Division Reliability – CAIDI Indices
(Excludes ISO and MED)
Chart 239: Division Reliability – CAIDI Indices
(Excludes ISO and MED)

201
Chart 240: Division Reliability – CAIDI Indices
(Excludes ISO and MED)
Chart 241: Division Reliability – CAIDI Indices
(Excludes ISO and MED)

202
Chart 242: Division Reliability – CAIDI Indices
(Excludes ISO and MED)
Chart 243: Division Reliability – CAIDI Indices
(Excludes ISO and MED)

203
Chart 244: Division Reliability – CAIDI Indices
(Excludes ISO and MED)
Chart 245: Division Reliability – CAIDI Indices
(Excludes ISO and MED)

204
Chart 246: Division Reliability – CAIDI Indices
(Excludes ISO and MED)
Chart 247: Division Reliability – CAIDI Indices
(Excludes ISO and MED)

205
Chart 248: Division Reliability – CAIDI Indices
(Excludes ISO and MED)
Chart 249: Division Reliability – CAIDI Indices
(Excludes ISO and MED)

206
Chart 250: Division Reliability – CAIDI Indices
(Excludes ISO and MED)
Chart 251: Division Reliability – CAIDI Indices
(Excludes ISO and MED)

207
Chart 252: Division Reliability – CAIDI Indices
(Excludes ISO and MED)
Chart 253: Division Reliability – CAIDI Indices
(Excludes ISO and MED)

208
ii. Charts for System and Division Reliability Indices based on IEEE 1366 for the past 10 years including planned outages and including MED
1. SAIDI Performance Results (MED Included)
Chart 254: Division Reliability – SAIDI Indices
(Excludes ISO)
Chart 255: Division Reliability – SAIDI Indices
(Excludes ISO)

209
Chart 256: Division Reliability – SAIDI Indices
(Excludes ISO)
Chart 257: Division Reliability – SAIDI Indices
(Excludes ISO)

210
Chart 258: Division Reliability – SAIDI Indices
(Excludes ISO)
Chart 259: Division Reliability – SAIDI Indices
(Excludes ISO)

211
Chart 260: Division Reliability – SAIDI Indices
(Excludes ISO)
Chart 261: Division Reliability – SAIDI Indices
(Excludes ISO)
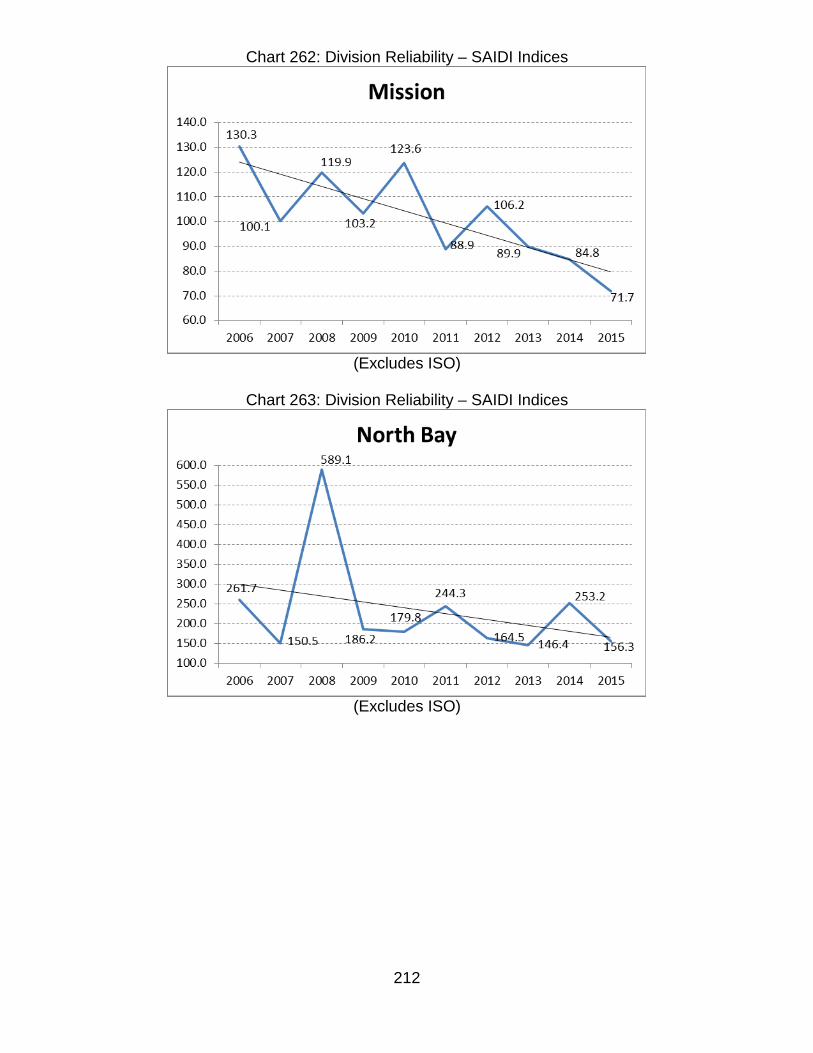
212
Chart 262: Division Reliability – SAIDI Indices
(Excludes ISO)
Chart 263: Division Reliability – SAIDI Indices
(Excludes ISO)

213
Chart 264: Division Reliability – SAIDI Indices
(Excludes ISO)
Chart 265: Division Reliability – SAIDI Indices
(Excludes ISO)

214
Chart 266: Division Reliability – SAIDI Indices
(Excludes ISO)
Chart 267: Division Reliability – SAIDI Indices
(Excludes ISO)

215
Chart 268: Division Reliability – SAIDI Indices
(Excludes ISO)
Chart 269: Division Reliability – SAIDI Indices
(Excludes ISO)

216
Chart 270: Division Reliability – SAIDI Indices
(Excludes ISO)
Chart 271: Division Reliability – SAIDI Indices
(Excludes ISO)

217
Chart 272: Division Reliability – SAIDI Indices
(Excludes ISO)
Chart 273: Division Reliability – SAIDI Indices
(Excludes ISO)

218
2. SAIFI Performance Results (MED Included)
Chart 274: Division Reliability – SAIFI Indices
(Excludes ISO)
Chart 275: Division Reliability – SAIFI Indices
(Excludes ISO)

219
Chart 276: Division Reliability – SAIFI Indices
(Excludes ISO)
Chart 277: Division Reliability – SAIFI Indices
(Excludes ISO)

220
Chart 278: Division Reliability – SAIFI Indices
(Excludes ISO)
Chart 279: Division Reliability – SAIFI Indices
(Excludes ISO)

221
Chart 280: Division Reliability – SAIFI Indices
(Excludes ISO)
Chart 281: Division Reliability – SAIFI Indices
(Excludes ISO)

222
Chart 282: Division Reliability – SAIFI Indices
(Excludes ISO)
Chart 283: Division Reliability – SAIFI Indices
(Excludes ISO)

223
Chart 284: Division Reliability – SAIFI Indices
(Excludes ISO)
Chart 285: Division Reliability – SAIFI Indices
(Excludes ISO)

224
Chart 286: Division Reliability – SAIFI Indices
(Excludes ISO)
Chart 287: Division Reliability – SAIFI Indices
(Excludes ISO)

225
Chart 288: Division Reliability – SAIFI Indices
(Excludes ISO)
Chart 289: Division Reliability – SAIFI Indices
(Excludes ISO)

226
Chart 290: Division Reliability – SAIFI Indices
(Excludes ISO)
Chart 291: Division Reliability – SAIFI Indices
(Excludes ISO)

227
Chart 292: Division Reliability – SAIFI Indices
(Excludes ISO)
Chart 293: Division Reliability – SAIFI Indices
(Excludes ISO)

228
3. MAIFI12 Performance Results (MED Included)
Chart 294: Division Reliability – MAIFI Indices
(Excludes ISO)
Chart 295: Division Reliability – MAIFI Indices
(Excludes ISO)
12 See footnote 4 on page 12.

229
Chart 296: Division Reliability – MAIFI Indices
(Excludes ISO)
Chart 297: Division Reliability – MAIFI Indices
(Excludes ISO)

230
Chart 298: Division Reliability – MAIFI Indices
(Excludes ISO)
Chart 299: Division Reliability – MAIFI Indices
(Excludes ISO)

231
Chart 300: Division Reliability – MAIFI Indices
(Excludes ISO)
Chart 301: Division Reliability – MAIFI Indices
(Excludes ISO)

232
Chart 302: Division Reliability – MAIFI Indices
(Excludes ISO)
Chart 303: Division Reliability – MAIFI Indices
(Excludes ISO)

233
Chart 304: Division Reliability – MAIFI Indices
(Excludes ISO)
Chart 305: Division Reliability – MAIFI Indices
(Excludes ISO)

234
Chart 306: Division Reliability – MAIFI Indices
(Excludes ISO)
Chart 307: Division Reliability – MAIFI Indices
(Excludes ISO)

235
Chart 308: Division Reliability – MAIFI Indices
(Excludes ISO)
Chart 309: Division Reliability – MAIFI Indices
(Excludes ISO)
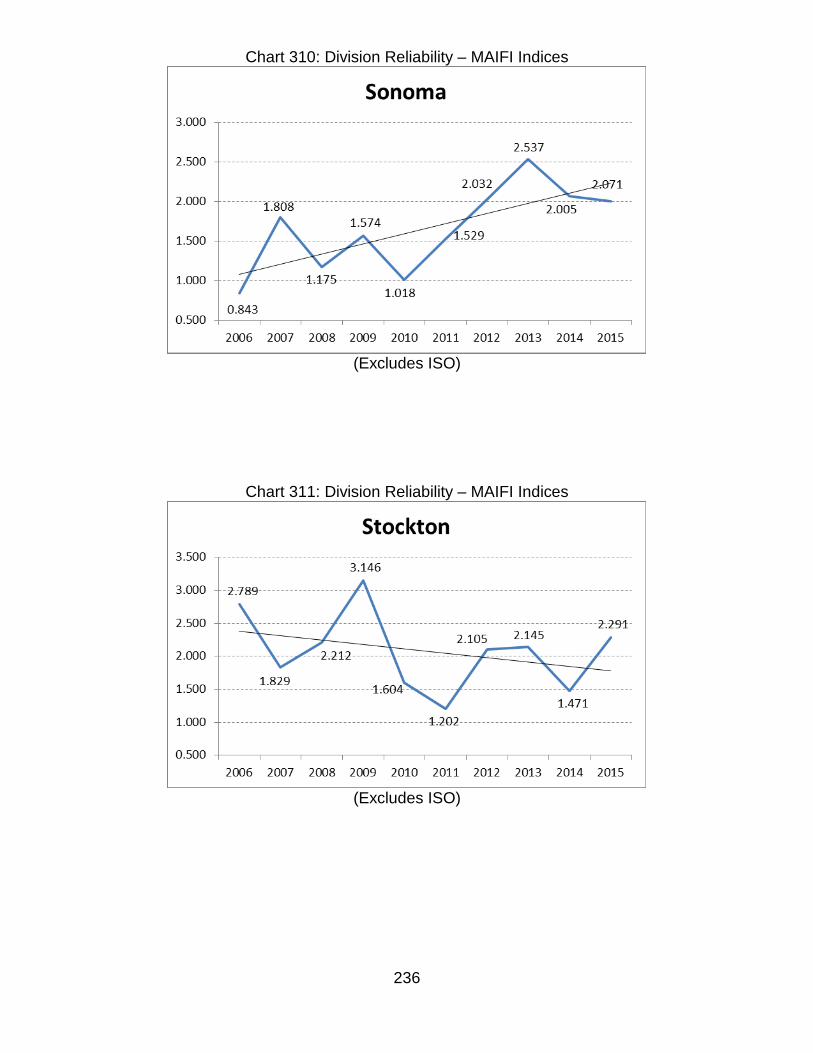
236
Chart 310: Division Reliability – MAIFI Indices
(Excludes ISO)
Chart 311: Division Reliability – MAIFI Indices
(Excludes ISO)

237
Chart 312: Division Reliability – MAIFI Indices
(Excludes ISO)
Chart 313: Division Reliability – MAIFI Indices
(Excludes ISO)

238
4. CAIDI Performance Results (MED Included)
Chart 314: Division Reliability – CAIDI Indices
(Excludes ISO)
Chart 315: Division Reliability – CAIDI Indices
(Excludes ISO)

239
Chart 316: Division Reliability – CAIDI Indices
(Excludes ISO)
Chart 317: Division Reliability – CAIDI Indices
(Excludes ISO)
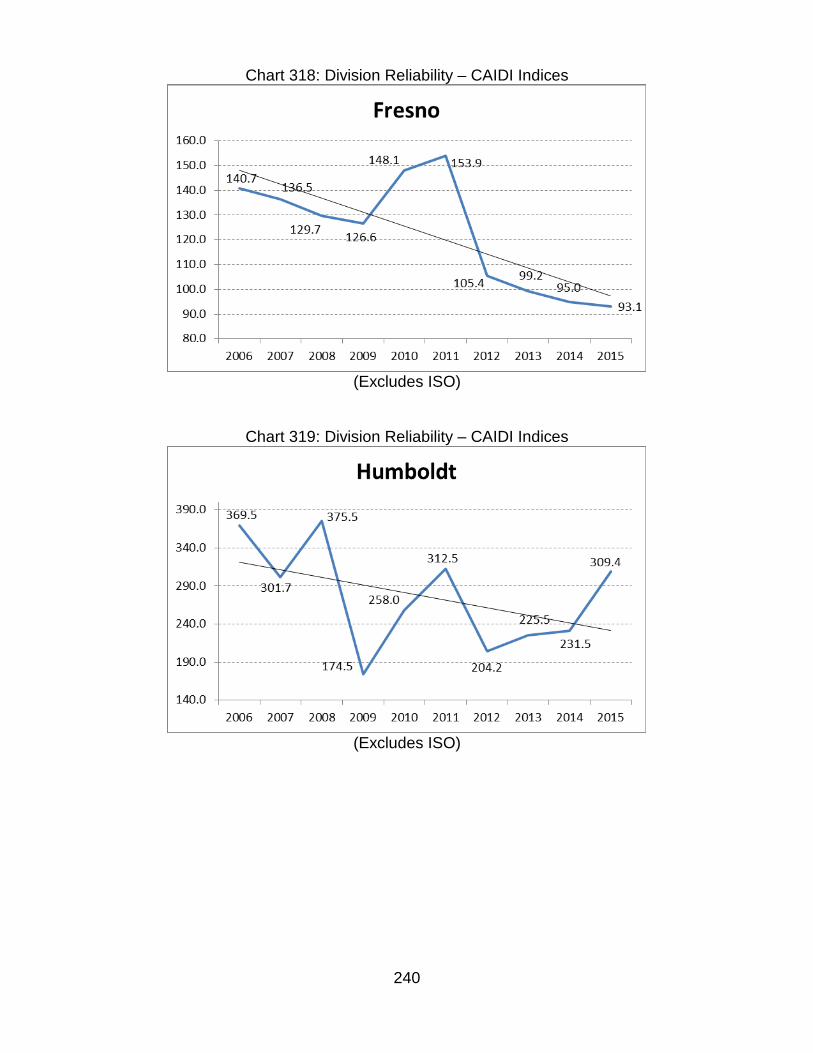
240
Chart 318: Division Reliability – CAIDI Indices
(Excludes ISO)
Chart 319: Division Reliability – CAIDI Indices
(Excludes ISO)

241
Chart 320: Division Reliability – CAIDI Indices
(Excludes ISO)
Chart 321: Division Reliability – CAIDI Indices
(Excludes ISO)

242
Chart 322: Division Reliability – CAIDI Indices
(Excludes ISO)
Chart 323: Division Reliability – CAIDI Indices
(Excludes ISO)
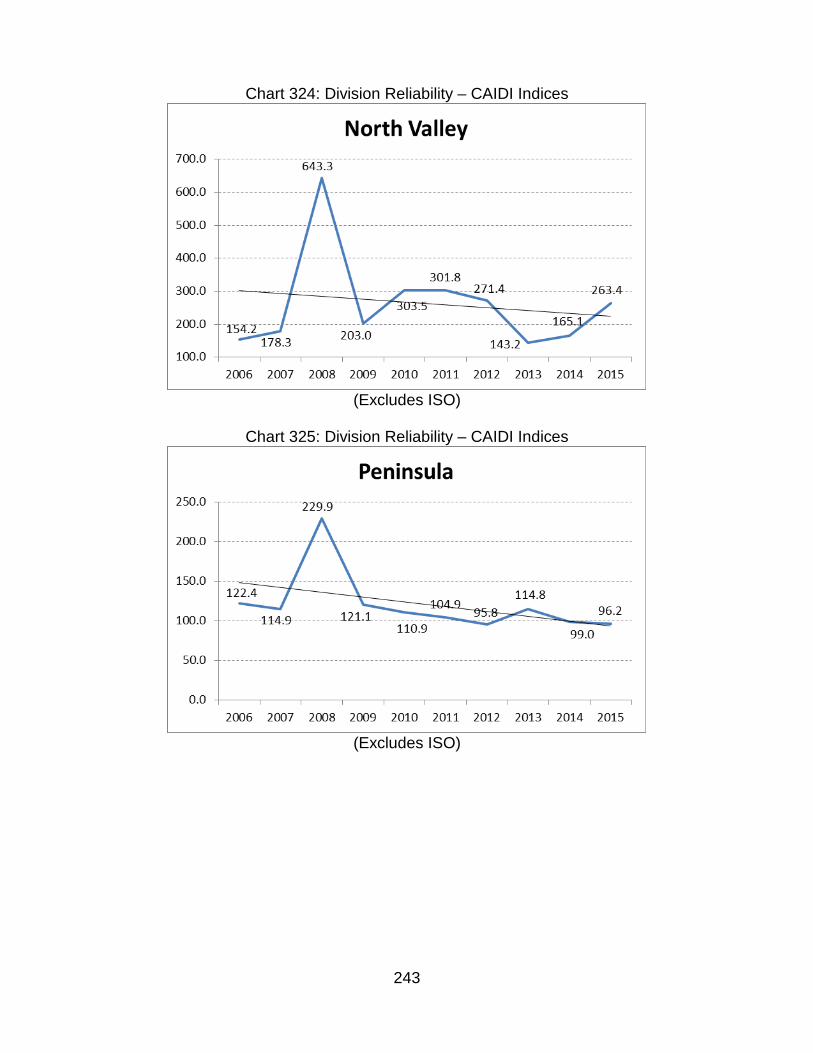
243
Chart 324: Division Reliability – CAIDI Indices
(Excludes ISO)
Chart 325: Division Reliability – CAIDI Indices
(Excludes ISO)

244
Chart 326: Division Reliability – CAIDI Indices
(Excludes ISO)
Chart 327: Division Reliability – CAIDI Indices
(Excludes ISO)

245
Chart 328: Division Reliability – CAIDI Indices
(Excludes ISO)
Chart 329: Division Reliability – CAIDI Indices
(Excludes ISO)

246
Chart 330: Division Reliability – CAIDI Indices
(Excludes ISO)
Chart 331: Division Reliability – CAIDI Indices
(Excludes ISO)

247
Chart 332: Division Reliability – CAIDI Indices
(Excludes ISO)
Chart 333: Division Reliability – CAIDI Indices
(Excludes ISO)

248
d. The number of planned outages, date, and location of planned outages in each division on an annual basis.
PG&E is submitting detailed planned outage information on a confidential basis under seal as required by Appendix B of Decision 16-01-008, at footnote 7. Listed below is a summary of planned outages by year from 2006 through 2015:
Table 50: Ten Years Planned Outage Summary (2006-2015) Year Total Planned Outages 2006 10345 2007 11916 2008 11089 2009 11319 2010 12377 2011 17248 2012 17010 2013 21986 2014 18030 2015 18895

249
4. Service Territory Map
PG&E Service Territory

250
5. Top 1% of Worst Performing Circuits (WPC) excluding Major Event Day (MED)
PG&E’s selection of its worst performing circuits is comprised of two lists. List #1 (see Table 51 below) is ranked by the highest number of sustained outages the average customer on the circuit experiences on an annual basis (AIFI). List #2 (see Table 52 below) is ranked by the highest total number of sustained outage minutes that the average customer on the circuit experiences on an annual basis (AIDI). PG&E recognized that a given circuit could appear on both the AIDI and AIFI lists of worst performing circuits. In consideration of this overlap, in order to include one percent of its total number of circuits (32 circuits), PG&E identified 19 circuits on each list, five of which are on both lists, for a net of 33 individual circuits.
For purposes of this reliability report, PG&E’s focus in developing the worst performing circuit lists has been on the impact to the average customer on the circuit. This is different than a focus on a circuit’s impact or contribution to overall system reliability performance. For example, a circuit with 50 customers that experienced 5 sustained outages affecting the entire circuit (a total customer count of 250 sustained outages) would have a higher worst performing circuit ranking than a circuit with 1,000 customers where each customer experienced 3 sustained outages (a total customer count of 3,000 sustained outages). For purposes of the worst performing circuit list, the fact that the average customer on the smaller circuit experienced five sustained outages caused that circuit to rank as performing worse than a circuit where the average customer only experienced three sustained outages.
Consistent with Decision 16-01-008, PG&E has used three years of outage data (2013 – 2015) in developing the worst performing circuit lists. PG&E has excluded outage data involving planned outages, ISO outages and major event days. PG&E has also limited its review to mainline circuit outages only (in other words, only outages involving an Oil Circuit Breaker (OCB), a recloser, or an interrupter). Finally, PG&E has excluded outages in which the circuit was in an abnormal configuration. An abnormal circuit configuration occurs when additional customers are temporarily added to a circuit in order to support construction or maintenance work performed on an adjacent circuit. Analysis has shown that outages associated with abnormal circuit configurations would skew the results of the worst performing circuit lists. PG&E believes that its approach best defines a worst performing circuit.
Turning to Table 51, the list of the worst performing circuits by outage frequency, the worst circuit was the Borden 1103 circuit. The Borden 1103 circuit experienced an average of 4.3 mainline sustained outages (resulting in the operation of a circuit breaker or an automatic recloser) per year from 2013 – 2015. The average customer on the circuit experienced 3.51 sustained outages per year over this three year period.
Table 52, by comparison, focuses on the duration of the sustained outages. Here, the Otter 1102 circuit was the worst performing circuit. For this circuit, the average customer on the circuit experienced 853 sustained outage minutes per year over the three year period.
Five circuits, Alpine 1102, Challenge 1101, Garberville 1102, Otter 1102, and Wilkins Slough 1101, appear on both lists. These five circuits are highlighted in Tables 51 and 52. Additionally, circuits are

251
marked with an asterisk (*) which indicate they are “deficient” since they would have shown up in both the 2014 and 2015 list (see the “Deficient” Worst Performing Section below for further details).
Table 51: AIFI Worst Performing Circuit for 2015
Table 52: AIDI Worst Performing Circuit for 2015
# Division Substation Circuit NameTotal
CustomersCircuit Miles % OH % UG
3 Yr Avg Mainline Outages
3 Yr Avg AIFI
1 YOSEMITE BORDEN BORDEN 1103 703 128 99% 1% 4.3 3.512 SIERRA EL DORADO PH EL DORADO PH 2101 4,604 216 99% 1% 9.0 3.183 SACRAMENTO WILKINS SLOUGH WILKINS SLOUGH 1101* 169 85 100% 0% 4.0 3.174 DIABLO ROSSMOOR ROSSMOOR 1108 2,844 57 51% 49% 3.3 3.025 SIERRA BRUNSWICK BRUNSWICK 1103* 3,214 101 88% 12% 5.0 2.786 STOCKTON ALPINE ALPINE 1102 309 3 0% 100% 2.7 2.667 HUMBOLDT GARBERVILLE GARBERVILLE 1102* 1,783 215 95% 5% 11.0 2.628 FRESNO TULARE LAKE TULARE LAKE 1106* 123 72 99% 1% 3.3 2.579 KERN LAMONT LAMONT 1104 358 79 100% 0% 3.7 2.53
10 YOSEMITE RIVERBANK RIVERBANK 1711* 1,451 58 83% 17% 5.0 2.4511 HUMBOLDT GARBERVILLE GARBERVILLE 1101* 1,237 238 99% 1% 7.0 2.3712 STOCKTON SALT SPRINGS SALT SPRINGS 2102* 2,000 93 77% 23% 2.7 2.3113 DIABLO TASSAJARA TASSAJARA 2106 2,899 46 9% 91% 3.0 2.2814 YOSEMITE RIVERBANK RIVERBANK 1712 1,245 71 95% 5% 3.3 2.2715 CENTRAL COAST OTTER OTTER 1102 532 87 87% 13% 4.0 2.2716 NORTH VALLEY CHALLENGE CHALLENGE 1101 698 71 99% 1% 3.0 2.2517 STOCKTON WEST POINT WEST POINT 1102 2,769 298 99% 1% 4.3 2.2218 SACRAMENTO MERIDIAN MERIDIAN 1101 434 86 100% 0% 2.3 2.1719 FRESNO KEARNEY KEARNEY 1104 1,457 102 99% 1% 4.3 2.11
# Division Substation Circuit NameTotal
CustomersCircuit Miles % OH % UG
3 Yr Ave Mainline Outages
3 Yr Avg AIDI
1 CENTRAL COAST OTTER OTTER 1102 532 87 87% 13% 4.0 853.192 NORTH VALLEY RISING RIVER RISING RIVER 1101* 727 82 98% 2% 4.0 821.513 NORTH VALLEY CHALLENGE CHALLENGE 1101 * 698 71 99% 1% 3.0 791.004 HUMBOLDT FRUITLAND FRUITLAND 1141* 373 41 100% 0% 2.7 760.025 HUMBOLDT HOOPA HOOPA 1101* 2,008 199 94% 6% 5.7 758.576 SACRAMENTO WILKINS SLOUGH WILKINS SLOUGH 1101* 169 85 100% 0% 4.0 740.287 HUMBOLDT WILLOW CREEK WILLOW CREEK 1103* 1,527 126 99% 1% 4.0 628.138 STOCKTON ALPINE ALPINE 1102* 309 3 0% 100% 2.7 618.709 SIERRA ALLEGHANY ALLEGHANY 1101* 1,070 114 98% 2% 3.7 613.67
10 KERN POSO MOUNTAIN POSO MOUNTAIN 2101 146 84 100% 0% 3.7 590.2811 FRESNO TULARE LAKE TULARE LAKE 2108 105 77 99% 1% 3.0 582.3812 YOSEMITE INDIAN FLAT INDIAN FLAT 1104* 599 44 55% 45% 2.0 556.3213 HUMBOLDT GARBERVILLE GARBERVILLE 1102* 1,783 215 95% 5% 11.0 546.4614 SIERRA PIKE CITY PIKE CITY 1101* 412 52 97% 3% 2.3 527.9315 FRESNO DUNLAP DUNLAP 1102* 718 115 69% 31% 6.3 523.7316 HUMBOLDT ORICK ORICK 1101 90 13 94% 6% 0.7 502.8117 FRESNO ANGIOLA ANGIOLA 1102 96 50 99% 1% 2.7 500.5718 FRESNO DUNLAP DUNLAP 1103* 915 106 94% 6% 3.3 485.1519 KERN KERN OIL KERN OIL 1106 668 78 92% 8% 3.0 440.86

252
Cost Effective Reliability Remediation:
For purposes of this reliability report, PG&E has identified circuits with the worst AIDI and AIFI performance based on the sustained outage impacts to the average customer on that circuit. However, PG&E generally focuses on circuits with larger numbers of customers to maximize the cost effectiveness of remediating poor reliability performing circuits. Specifically, PG&E identifies the worst performing circuits for cost effective remediation based on the highest total number of customers experiencing sustained outages (CESO) on a circuit. The reliability remediation of these worst performing circuits is addressed in PG&E’s Targeted Circuit Program. In addition to the Targeted Circuit Program, internal reviews of unplanned outages are performed on a regular basis. The objective of the outage review process is to identify and minimize chronic reliability issues that affect smaller number of customers. Cost effective remediation work that addresses those circuits identified from the outage review process are incorporated into PG&E’s base reliability work.
In the Targeted Circuit Program, PG&E’s distribution engineers analyze the causes and characteristics of historical outages as well as review the current circuit design in order to identify targeted work that will improve the circuit’s reliability performance. The typical targeted circuit work includes, as appropriate for the circuit, installing new fuses and line reclosers, replacing overhead and underground conductors, installing new fault indicators, reframing poles to increase phase separation, installing animal/bird guards, repairing or replacing deteriorated equipment, completing pending reliability related maintenance work, performing infrared inspections, and trimming trees. It typically takes two to three years for a targeted circuit project to be initiated, engineered, and constructed. As forecast in PG&E’s 2017 General Rate Case (GRC), PG&E expects to complete an average of 37 circuits in the Targeted Circuit Program per year through 2019, at a cost of $24.5 million in 2016 and $26.0 million in 2017 through 2019.
The anticipated goal of the Targeted Circuit Program is to achieve a 25 percent reliability performance improvement per circuit. The actual historical results for the Targeted Circuit Program have seen an average 30 to 50 percent reliability performance improvement per circuit since 2009. As reported in the 2014 GRC, the Targeted Circuit Program had a benefit to cost ratio of 3.1 to 1 based on the Values of Service analysis.
Most of the listed worst performing circuits have high CESO values. As a result, most of the worst performing circuits have been or will be incorporated into the Targeted Circuit Program. For those worst performing circuits not incorporated into the Targeted Circuit Program, PG&E will evaluate what remedial action, if any, is appropriate. This includes determining whether any remediation action has been or will be performed through the outage review process.

253
“Deficient” Worst Performing Circuits: The circuits listed below are “deficient” (WPC) circuits in response to section 5b of CPUC D 16-008-001, Appendix B: 1. WILKINS SLOUGH 1101
i. An explanation of why it was ranked as a "deficient" circuit: • Three year (2012-2014) average AIFI score of 2.52 and an average AIDI score of
533.13.13 • Three year (2013-2015) average AIFI score of 3.17 and an average AIDI score of
740.28. ii. A historical record of the metric:
• AIFI 2011 = 1.08 • AIFI 2012 = 1.74 • AIFI 2013 = 3.63 • AIFI 2014 = 2.22 • AIFI 2015 = 3.62
• AIDI 2011 = 176.48 • AIDI 2012 = 349.61 • AIDI 2013 = 869.75 • AIDI 2014 = 442.48 • AIDI 2015 = 898.73
iii. An explanation of why it was on the deficiency list again: Even though this is the first year that PG&E has submitted a “worst performing circuit” list, we are treating this circuit as being “on the deficiency list again” because it was also one of the worst performing circuits based on a review of a three year average AIFI and AIDI from 2012 through 2014. The results appear to be driven by poor 2013 and 2015 performance.
iv. An explanation of what is being done to improve the circuit's future performance: This is the first year of this report. As of the date of this report, PG&E does not have any firm plans with respect to what can cost-effectively be done to improve the performance of this circuit. We will be reviewing this circuit in the coming months to determine whether there are cost effective actions that can be taken to improve reliability.
v. A quantitative description of the utility's expectation for that circuit's future performance: As discussed above, PG&E has not determined what can or should cost effectively be done, so we do not anticipate a significant change in the performance of this circuit except for changes due to the weather.
2. BRUNSWICK 1103 i. An explanation of why it was ranked as a "deficient" circuit:
• Three year (2012-2014) average AIFI score of 2.75. 13 As explained earlier in the report, AIDI is the average time in minutes a customer on this circuit is without power in a given year, and AIFI is the number of times the average customer experiences a sustained outage in a given year.

254
• Three year (2013-2015) average AIFI score of 2.78. ii. A historical record of the metric:
• AIFI 2011 = 0.34 • AIFI 2012 = 2.06 • AIFI 2013 = 1.97 • AIFI 2014 = 4.22 • AIFI 2015 = 2.15
iii. An explanation of why it was on the deficiency list again: Even though this is the first year that PG&E has submitted a “worst performing circuit” list, we are treating this circuit as being “on the deficiency list again” because it was also one of the worst performing circuits based on a review of a three year average AIFI from 2012 through 2014. The results appear to be driven by a poor 2014 performance.
iv. An explanation of what is being done to improve the circuit's future performance: This circuit was part of the 2012 Targeted Circuit program which installed additional mainline protective devices. PG&E will be reviewing this circuit and see if any additional changes could be made to enhance the circuit reliability.
v. A quantitative description of the utility's expectation for that circuit's future performance: As discussed above, PG&E has not determined what can or should cost effectively be done, so we do not anticipate a significant change in the performance of this circuit except for changes due to the weather.
3. GARBERVILLE 1102 i. An explanation of why it was ranked as a "deficient" circuit:
• Three year (2012-2014) average AIFI score of 4.21 and AIDI score of 799.24. • Three year (2013-2015) average AIFI score of 2.62 and AIDI score of 546.46.
ii. A historical record of the metric: • AIFI 2011 = 4.39 • AIFI 2012 = 7.36 • AIFI 2013 = 1.70 • AIFI 2014 = 3.50 • AIFI 2015 = 2.67
• AIDI 2011 = 488.85 • AIDI 2012 = 1232.92 • AIDI 2013 = 191.92 • AIDI 2014 = 936.09 • AIDI 2015 = 509.61
iii. An explanation of why it was on the deficiency list again: Even though this is the first year that PG&E has submitted a “worst performing circuit” list, we are treating this circuit as being “on the deficiency list again” because it was also one of the worst performing circuits based on a review of a three year average AIFI and AIDI from 2012 through 2014. The results appear to be driven by poor 2012 and 2014 performance.
iv. An explanation of what is being done to improve the circuit's future performance:

255
This circuit was part of the 2011 Targeted Circuit program which installed additional mainline protective devices and maintenance work. Additionally, in 2013 PG&E had re-conductored over one mile of OH conductor with larger conductor. PG&E will be reviewing this circuit and see if any changes could be made to enhance the circuit reliability.
v. A quantitative description of the utility's expectation for that circuit's future performance: As discussed above, PG&E has not determined what can or should cost effectively be done, so we do not anticipate a significant change in the performance of this circuit except for changes due to the weather.
4. TULARE LAKE 1106 i. An explanation of why it was ranked as a "deficient" circuit:
• Three year (2012-2014) average AIFI score of 2.78. • Three year (2013-2015) average AIFI score of 2.57.
ii. A historical record of the metric: • AIFI 2011 = 1.00 • AIFI 2012 = 2.66 • AIFI 2013 = 3.48 • AIFI 2014 = 2.21 • AIFI 2015 = 2.01
iii. An explanation of why it was on the deficiency list again: Even though this is the first year that PG&E has submitted a “worst performing circuit” list, we are treating this circuit as being “on the deficiency list again” because it was also one of the worst performing circuits based on a review of a three year average AIFI from 2012 through 2014. The results appear to be driven by a poor 2013 performance.
iv. An explanation of what is being done to improve the circuit's future performance: This is the first year of this report. As of the date of this report, PG&E does not have any firm plans with respect to what can cost-effectively be done to improve the performance of this circuit. We will be reviewing this circuit in the coming months to determine whether there are cost effective actions that can be taken to improve reliability.
v. A quantitative description of the utility's expectation for that circuit's future performance: As discussed above, PG&E has not determined what can or should cost effectively be done, so we do not anticipate a significant change in the performance of this circuit except for changes due to the weather.
5. RIVERBANK 1711 i. An explanation of why it was ranked as a "deficient" circuit:
• Three year (2012-2014) average AIFI score of 2.49 • Three year (2013-2015) average AIFI score of 2.45
ii. A historical record of the metric: • AIFI 2011 = 0.28 • AIFI 2012 = 2.44 • AIFI 2013 = 2.38 • AIFI 2014 = 2.75

256
• AIFI 2015 = 2.25 iii. An explanation of why it was on the deficiency list again:
Even though this is the first year that PG&E has submitted a “worst performing circuit” list, we are treating this circuit as being “on the deficiency list again” because it was also one of the worst performing circuits based on a review of a three year average AIFI and AIDI from 2012 through 2014. The results appear to be driven by continued poor performance from 2012-2015.
iv. An explanation of what is being done to improve the circuit's future performance: This circuit was part of the 2015 Targeted Circuit program with construction being completed in 2016. This project installed additional mainline protective devices and maintenance work.
v. A quantitative description of the utility's expectation for that circuit's future performance: Based on results shown by other, similar circuits after targeted circuit work, PG&E anticipates that the work proposed will improve reliability performance by 15 percent or more.
6. GARBERVILLE 1101
i. An explanation of why it was ranked as a "deficient" circuit: • Three year (2012-2014) average AIFI score of 3.24 • Three year (2013-2015) average AIFI score of 2.37
ii. A historical record of the metric: • AIFI 2011 = 3.43 • AIFI 2012 = 4.83 • AIFI 2013 = 0.93 • AIFI 2014 = 3.90 • AIFI 2015 = 2.28
iii. An explanation of why it was on the deficiency list again: Even though this is the first year that PG&E has submitted a “worst performing circuit” list, we are treating this circuit as being “on the deficiency list again” because it was also one of the worst performing circuits based on a review of a three year average AIFI and AIDI from 2012 through 2014. The results appear to be driven by poor 2012 and 2014 performance.
iv. An explanation of what is being done to improve the circuit's future performance: This circuit was part of the 2012 Targeted Circuit program, which reconductored 700 feet of OH conductor, installed additional sectionalizing devices, and performed additional maintenance work. An additional 7,000 feet of mainline reconductor is scheduled for completion in 2017 as part of the deteriorated conductor program. PG&E will be reviewing this circuit and see if any changes could be made to enhance the circuit reliability.
v. A quantitative description of the utility's expectation for that circuit's future performance: As discussed above, PG&E has not determined what can or should cost effectively be done, so we do not anticipate a significant change in the performance of this circuit except for changes due to the weather. We will be reviewing this circuit in the coming months to determine whether there are cost effective actions that can be taken to improve reliability.
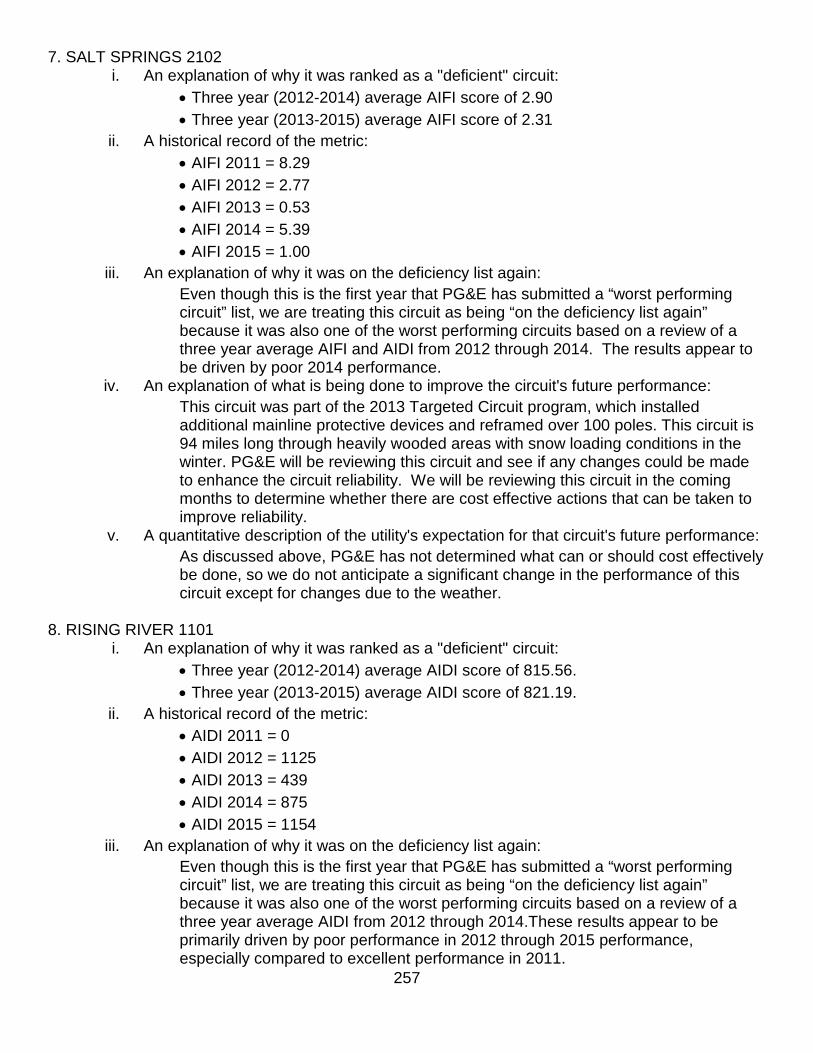
257
7. SALT SPRINGS 2102 i. An explanation of why it was ranked as a "deficient" circuit:
• Three year (2012-2014) average AIFI score of 2.90 • Three year (2013-2015) average AIFI score of 2.31
ii. A historical record of the metric: • AIFI 2011 = 8.29 • AIFI 2012 = 2.77 • AIFI 2013 = 0.53 • AIFI 2014 = 5.39 • AIFI 2015 = 1.00
iii. An explanation of why it was on the deficiency list again: Even though this is the first year that PG&E has submitted a “worst performing circuit” list, we are treating this circuit as being “on the deficiency list again” because it was also one of the worst performing circuits based on a review of a three year average AIFI and AIDI from 2012 through 2014. The results appear to be driven by poor 2014 performance.
iv. An explanation of what is being done to improve the circuit's future performance: This circuit was part of the 2013 Targeted Circuit program, which installed additional mainline protective devices and reframed over 100 poles. This circuit is 94 miles long through heavily wooded areas with snow loading conditions in the winter. PG&E will be reviewing this circuit and see if any changes could be made to enhance the circuit reliability. We will be reviewing this circuit in the coming months to determine whether there are cost effective actions that can be taken to improve reliability.
v. A quantitative description of the utility's expectation for that circuit's future performance: As discussed above, PG&E has not determined what can or should cost effectively be done, so we do not anticipate a significant change in the performance of this circuit except for changes due to the weather.
8. RISING RIVER 1101 i. An explanation of why it was ranked as a "deficient" circuit:
• Three year (2012-2014) average AIDI score of 815.56. • Three year (2013-2015) average AIDI score of 821.19.
ii. A historical record of the metric: • AIDI 2011 = 0 • AIDI 2012 = 1125 • AIDI 2013 = 439 • AIDI 2014 = 875 • AIDI 2015 = 1154
iii. An explanation of why it was on the deficiency list again: Even though this is the first year that PG&E has submitted a “worst performing circuit” list, we are treating this circuit as being “on the deficiency list again” because it was also one of the worst performing circuits based on a review of a three year average AIDI from 2012 through 2014.These results appear to be primarily driven by poor performance in 2012 through 2015 performance, especially compared to excellent performance in 2011.

258
iv. An explanation of what is being done to improve the circuit's future performance: This circuit is part of the 2017 Targeted Circuit program, which proposes to install additional mainline protective devices.
v. A quantitative description of the utility's expectation for that circuit's future performance: Based on results shown by other, similar circuits after targeted circuit work, PG&E anticipates that the work proposed will improve reliability performance by 15 percent or more.
9. CHALLENGE 1101 i. An explanation of why it was ranked as a "deficient" circuit:
• Three year (2012-2014) average AIDI score of 1502.17 • Three year (2013-2015) average AIDI score of 791.00.
ii. A historical record of the metric: • AIDI 2011 = 751.35 • AIDI 2012 = 3029.69 • AIDI 2013 = 337.00 • AIDI 2014 = 1087.45 • AIDI 2015 = 942.24
iii. An explanation of why it was on the deficiency list again: Even though this is the first year that PG&E has submitted a “worst performing circuit” list, we are treating this circuit as being “on the deficiency list again” because it was also one of the worst performing circuits based on a review of a three year average AIDI from 2012 through 2014. These results appear to be primarily driven by poor 2012, 2014, and 2015 performance.
iv. An explanation of what is being done to improve the circuit's future performance: This circuit is 71 miles long, including over 70 miles of overhead conductor. This circuit was part of the 2013 Targeted Circuit program, which included installing new mainline protective and sectionalizing devices and maintenance work. We will be reviewing this circuit in the coming months to determine whether there are cost effective actions that can be taken to improve reliability.
v. A quantitative description of the utility's expectation for that circuit's future performance: As discussed above, PG&E has not determined what can or should cost effectively be done, so we do not anticipate a significant change in the performance of this circuit except for changes due to the weather.
10. FRUITLAND 1141 i. An explanation of why it was ranked as a "deficient" circuit:
• Three year (2012-2014) average AIDI score of 786.06 • Three year (2013-2015) average AIDI score of 760.02
ii. A historical record of the metric: • AIDI 2011 = 172.01 • AIDI 2012 = 101.76 • AIDI 2013 = 143.97 • AIDI 2014 = 2136.48 • AIDI 2015 = 0

259
iii. An explanation of why it was on the deficiency list again: Even though this is the first year that PG&E has submitted a “worst performing circuit” list, we are treating this circuit as being “on the deficiency list again” because it was also one of the worst performing circuits based on a review of a three year average AIDI from 2012 through 2014. The Fruitland 1141 circuit is on both the 2012-2014 list and on the 2013- 2015 list due to poor performance in 2014. That in turn was due to a single lengthy outage, which was more than four times the combined outages of the other four years shown above. In fact, there were no sustained outages at all in 2015 on this circuit.
iv. An explanation of what is being done to improve the circuit's future performance: PG&E does not believe that any additional work is needed to improve the performance of the Fruitland 1141 circuit, as 2015’s performance was exemplary.
v. A quantitative description of the utility's expectation for that circuit's future performance: A single wire-down outage initially caused by vegetation and further complicated by outages to interconnected circuits contributed to 90% of the customer minutes for 2014. The customer minutes for this single outage are more than four times the other four years combined. This circuit will likely be on next year’s list, which will be based on preliminary 2014-2016 data and will therefore include the unusual 2014 results. PG&E does not foresee this circuit being on the worst performing circuits list after next year, in other words once the 2014 data will no longer impact the 3 year average.
11. HOOPA 1101
i. An explanation of why it was ranked as a "deficient" circuit: • Three year (2012-2014) average AIDI score of 517.73 • Three year (2013-2015) average AIDI score of 758.57
ii. A historical record of the metric: • AIDI 2011 = 522.72 • AIDI 2012 = 429.30 • AIDI 2013 = 894.20 • AIDI 2014 = 222.77 • AIDI 2015 = 1152.80
iii. An explanation of why it was on the deficiency list again: Even though this is the first year that PG&E has submitted a “worst performing circuit” list, we are treating this circuit as being “on the deficiency list again” because it was also one of the worst performing circuits based on a review of a three year average SAIFI from 2012 through 2014. These results appear to be primarily driven by poor performance in 2013 and 2015.
iv. An explanation of what is being done to improve the circuit's future performance: This is the first year of this report. As of the date of this report, PG&E does not have any firm plans with respect to what can cost-effectively be done to improve the performance of this circuit.

260
This circuit length is 199 miles, 187 of which are overhead conductor in remote areas. We will be reviewing this circuit in the coming months to determine whether there are cost effective actions that can be taken to improve reliability.
v. A quantitative description of the utility's expectation for that circuit's future performance: As discussed above, PG&E has not determined what can or should cost effectively be done for this circuit, so we are not able to provide a quantitative description of anticipated future performance.
12. WILLOW CREEK 1103 i. An explanation of why it was ranked as a "deficient" circuit:
• Three year (2012-2014) average AIDI score of 698.71. • Three year (2013-2015) average AIDI score of 628.13.
ii. A historical record of the metric: • AIDI 2011 = 364.77 • AIDI 2012 = 783.93 • AIDI 2013 = 512.16 • AIDI 2014 = 797.36 • AIDI 2015 = 574.53
iii. An explanation of why it was on the deficiency list again: Even though this is the first year that PG&E has submitted a “worst performing circuit” list, we are treating this circuit as being “on the deficiency list again” because it was also one of the worst performing circuits based on a review of a three year average AIDI from 2012 through 2014. These results appear to be primarily driven by poor 2012 and 2014 performance.
iv. An explanation of what is being done to improve the circuit's future performance: This circuit is 126 miles long, including over 124 miles of overhead conductor. This circuit was part of the 2014 Targeted Circuit program, which included reconductoring over 900 feet of conductor, installation of mainline protective and sectionalizing devices, and maintenance work.
v. A quantitative description of the utility's expectation for that circuit's future performance: As shown in the first year after the completion of this project, the AIDI for the circuit has improved by 223 minutes in 2015.
13. ALPINE 1102 i. An explanation of why it was ranked as a "deficient" circuit:
• Three year (2012-2014) average AIDI score of 517.73 • Three year (2013-2015) average AIDI score of 618.70
ii. A historical record of the metric: • AIDI 2011 = 1562.27 • AIDI 2012 = 681 • AIDI 2013 = 455 • AIDI 2014 = 416.65 • AIDI 2015 = 983.26
iii. An explanation of why it was on the deficiency list again:

261
Even though this is the first year that PG&E has submitted a “worst performing circuit” list, we are treating this circuit as being “on the deficiency list again” because it was also one of the worst performing circuits based on a review of a three year average SAIFI from 2012 through 2014. These results appear to be primarily driven by poor performance in 2012 and 2015.
iv. An explanation of what is being done to improve the circuit's future performance: This is the first year of this report. As of the date of this report, PG&E does not have any firm plans with respect to what can cost-effectively be done to improve the performance of this circuit. We will be reviewing this circuit in the coming months to determine whether there are cost effective actions that can be taken to improve reliability.
v. A quantitative description of the utility's expectation for that circuit's future performance: As discussed above, PG&E has not determined what can or should cost effectively be done, so we do not anticipate a significant change in the performance of this circuit except for changes due to the weather.
14. ALLEGHANY 1101 i. An explanation of why it was ranked as a "deficient" circuit:
• Three year (2012-2014) average AIDI score of 1056.85 • Three year (2013-2015) average AIDI score of 613.67
ii. A historical record of the metric: • AIDI 2011 = 1248.08 • AIDI 2012 = 1526.30 • AIDI 2013 = 295.72 • AIDI 2014 = 1340.92 • AIDI 2015 = 205.44
iii. An explanation of why it was on the deficiency list again: Even though this is the first year that PG&E has submitted a “worst performing circuit” list, we are treating this circuit as being “on the deficiency list again” because it was also one of the worst performing circuits based on a review of a three year average AIDI from 2012 through 2014. These results appear to be primarily driven by poor performance in 2012, and 2014, especially when compared to greatly improved performance in 2013 and 2015.
iv. An explanation of what is being done to improve the circuit's future performance: This is the first year of this report. As of the date of this report, PG&E does not have any firm plans with respect to what can cost-effectively be done to improve the performance of this circuit. This circuit was part of PG&E’s 2013 Targeted Circuit program, which reconductored 2700 feet of OH Conductor with larger wire to withstand snow loading and upgraded to recloser controls for SCADA visibility and remote restoration. 2014 performance was driven by two outages that resulted in over one million customer minutes. Restoration was delayed due to severe weather and remote location. This circuit is 114 miles long, 111 of which is overhead conductor in a remote area. We will be reviewing this circuit in the coming months to determine whether there are cost effective actions that can be taken to improve reliability.
v. A quantitative description of the utility's expectation for that circuit's future performance:

262
As discussed above, PG&E has not determined what can or should cost effectively be done, so we do not anticipate a significant change in the performance of this circuit except for changes due to the weather.
15. INDIAN FLAT 1104
i. An explanation of why it was ranked as a "deficient" circuit: • Three year (2012-2014) average AIDI score of 532.79 • Three year (2013-2015) average AIDI score of 556.32
ii. A historical record of the metric: • AIDI 2011 = 0 • AIDI 2012 = 72.05 • AIDI 2013 = 119.65 • AIDI 2014 = 1413.99 • AIDI 2015 = 136.77
iii. An explanation of why it was on the deficiency list again: Even though this is the first year that PG&E has submitted a “worst performing circuit” list, we are treating this circuit as being “on the deficiency list again” because it was also one of the worst performing circuits based on a review of a three year average AIDI from 2012 through 2014. These results appear to be primarily driven by poor performance in 2014.
iv. An explanation of what is being done to improve the circuit's future performance: This is the first year of this report. As of the date of this report, PG&E does not have any firm plans with respect to what can cost-effectively be done to improve the performance of this circuit. This circuit is 44 miles long in Yosemite National Park. We will be reviewing this circuit in the coming months to determine if there are cost effective actions that can be taken to improve reliability.
v. A quantitative description of the utility's expectation for that circuit's future performance: A single outage initially caused by vegetation contributed all the customer outage minutes for 2014. This circuit will likely be on next year’s list, which will be based on preliminary 2014-2016 data and will therefore include the unusual 2014 results. PG&E does not foresee this circuit being on the worst performing circuits list after next year, in other words once the 2014 data will no longer impact the 3 year average.
16. PIKE CITY 1101 i. An explanation of why it was ranked as a "deficient" circuit:
• Three year (2012-2014) average SAIFI score of 584.68 • Three year (2013-2015) average SAIFI score of 527.93
ii. A historical record of the metric: • AIDI 2011 = 214.15 • AIDI 2012 = 345.25 • AIDI 2013 = 1082.88

263
• AIDI 2014 = 330.75 • AIDI 2015 = 176.40
iii. An explanation of why it was on the deficiency list again: Even though this is the first year that PG&E has submitted a “worst performing circuit” list, we are treating this circuit as being “on the deficiency list again” because it was also one of the worst performing circuits based on a review of a three year average SAIFI from 2012 through 2014. These results appear to be primarily driven by poor performance in 2013.
iv. An explanation of what is being done to improve the circuit's future performance: This is the first year of this report. As of the date of this report, PG&E does not have any firm plans with respect to what can cost-effectively be done to improve the performance of this circuit. This circuit is approximately 52 miles long, including 50 miles of overhead conductor. PG&E does not believe that any additional work is needed to improve the performance of the Pike City 1101, as 2014 and 2015 performance has improved over 2013 performance.
v. A quantitative description of the utility's expectation for that circuit's future performance: A single outage initially caused by a failed capacitor bank caused overhead conductors to fall to the ground. This single outage contributed over 75% of the customer minutes for 2013. The customer minutes in 2013 are more than the sum of the other 4 years. PG&E does not foresee this circuit to be on the worst performing circuits list moving forward as 2013 data will no longer impact the 3 year average. Depending on the weather we would anticipate performance in line with the 2014 and 2015, as shown above.
17. DUNLAP 1102
i. An explanation of why it was ranked as a "deficient" circuit: • Three year (2012-2014) average AIDI score of 817.96. • Three year (2013-2015) average AIDI score of 523.73.
ii. A historical record of the metric: • AIDI 2011 = 799.58 • AIDI 2012 = 1016.29 • AIDI 2013 = 922.29 • AIDI 2014 = 510.61 • AIDI 2015 = 137.77
iii. An explanation of why it was on the deficiency list again: Even though this is the first year that PG&E has submitted a “worst performing circuit” list, we are treating this circuit as being “on the deficiency list again” because it was also one of the worst performing circuits based on a review of a three year average AIDI from 2012 through 2014. These results appear to be primarily driven by poor 2011, 2012 and 2013 performance, especially compared to excellent performance in 2015.
iv. An explanation of what is being done to improve the circuit's future performance:

264
This circuit is 115 miles long, including 79 miles of overhead conductor. This circuit was part of the 2014 Targeted Circuit program, which installed additional mainline protective devices and performed maintenance work. PG&E does not believe that any additional work is needed to improve the performance of the Dunlap 1101, as 2014 and 2015 performance has improved over 2013 performance.
v. A quantitative description of the utility's expectation for that circuit's future performance:
Based on the work already completed as part of the Targeted Circuit program, we anticipate future performance to approximate the 2015 performance, depending of course on the weather and other variables beyond our control.
18. DUNLAP 1103
i. An explanation of why it was ranked as a "deficient" circuit: • Three year (2012-2014) average AIDI score of 629. • Three year (2013-2015) average AIDI score of 485.15
ii. A historical record of the metric: • AIDI 2011 = 0.00 • AIDI 2012 = 510.05 • AIDI 2013 = 643.78 • AIDI 2014 = 737.90 • AIDI 2015 = 10.81
iii. An explanation of why it was on the deficiency list again: Even though this is the first year that PG&E has submitted a “worst performing circuit” list, we are treating this circuit as being “on the deficiency list again” because it was also one of the worst performing circuits based on a review of a three year average AIDI from 2012 through 2014. These results appear to be primarily driven by poor performance in 2013 and 2014 AIDI performance, especially when compared to excellent performance in 2011 and 2015.
iv. An explanation of what is being done to improve the circuit's future performance: This is the first year of this report. As of the date of this report, PG&E does not have any firm plans with respect to what can cost-effectively be done to improve the performance of this circuit. This circuit length is 106 miles, including 99 miles of overhead conductor through remote portions of National Parks and Forests. We will be reviewing this circuit in the coming months to determine whether there are cost effective actions that can be taken to improve reliability.
v. A quantitative description of the utility's expectation for that circuit's future performance: As discussed above, PG&E has not determined what can or should cost effectively be done, so we do not anticipate a significant change in the performance of this circuit except for changes due to the weather.

265
6. Top 10 major unplanned power outage events of 2015 Significant Outage Events Of 2015
Table 2015 lists the ten largest outage events experienced during 2015. PG&E interprets this reporting requirement as the ten events (individual days or in some cases a group of consecutive days) with a significant number of customer interruptions in the system or a portion of the system. These events are listed in descending order of customer interruptions.
Table 53 - Ten Largest 2015 Outage Events
Rank
Description
Date
Number of Customers Affected *
Longest Customer
Interruption (Hours)
# of People Used
To Restore Service
IEEE Major
Event? 1 A series of strong Pacific storms moved into CA producing very heavy rain and gusty south winds. South wind gusts near 50
mph were observed along the coast with gusts near 60 mph observed in the northern Sacramento Valley. Generally 4 - 8 inches of rain were observed across the elevated terrain in the northern part of the territory. Some locations topped 8 inches with Bucks Lake for example, recording 9 inches of rain during the series.
2/6/2015 - 2/8/2015
389567 2836 Yes
2 Tropical moisture associated with former Hurricane Dolores drifted over the territory. Atmospheric instability combined with the abundant tropical moisture initiated a widespread thunderstorm outbreak across the San Joaquin Valley and Central Coast. More than 6000 cloud to ground strikes were recorded.
7/18/2015 - 7/19/2015
154459
925 Yes
3 A strong cold front (squall line) moved into the northern part of the territory and produced strong wind gusts, a period of very heavy rainfall, and significant outage activity. The front swiftly progressed south through the remainder of the territory. Widespread wind gusts from 40 - 55 mph were observed across the Sacramento Valley and Redding recorded a gust near 60 mph.
12/13/2015 142059 364 Yes
4 A late winter-storm moved through the territory producing moderate rain showers, gusty south winds from 30 - 40 mph, and thunderstorms. Nearly 1000 cloud to ground lighting strikes were recorded across the Sacramento and San Joaquin Valleys
4/6/2015 - 4/7/2015
134789 442 Yes
5 A strong high pressure ridge developed over the territory and produced the first significant heat of the season. Some selected high temperature readings: Redding 107, Fresno 106, Livermore 106, Sacramento 104, Santa Rosa 99, and San Jose 91.
6/8/2015 99439 1104 Yes
6 The first widespread rain and snow producing system of the fall/winter season passed through the territory. Thunderstorms also developed and near 500 cloud to ground lightning strikes were recorded. Wind gusts from 25 - 35 mph were observed.
11/2/2015 92777 33 No
7 A large transmission outage in the central coast at Moss Landing occurred. No significant adverse weather was recorded. 10/18/2015 69906 1080 No 8 A potent Pacific weather system produced wind gusts to 40 - 50 mph across the lower elevations with gusts near 60 - 70 mph
across the exposed, higher terrain. Most of the adverse weather and resultant outage impacts were observed across the northern part of the PG&E service territory.
12/10/2015 64533 602 No
9 A cold frontal system with moderate rain showers moved through the territory and was followed by gusty northwest winds primarily along the coast. Peak winds gusts from 40 - 50 mph were observed.
11/15/2015 59547 554 No
10 An upper level weather system moved over the territory and produced rain showers, breezy winds, and thunderstorms. The PG&E lightning detection network recorded 456 lightning strikes in the territory.
5/7/2015 57241 1740 No
* Note: Values exclude single distribution line transformer and planned outages

266
7. Summary List of Major Event Day (MED) per IEEE 1366 Major Event Day IEEE Standard 1366 defines MED as follows:
IEEE Standard 1366-2003 uses a statistically-based method of identifying excludable events. Specifically, the IEEE standard provides for the exclusion of all outages occurring on any day where its SAIDI is greater than “TMED” where: TMED ≡ e average over 5 yrs. of Ln (daily SAIDI) + 2.5 * STD DEV of 5 yrs. of Ln (daily SAIDI)
The IEEE 1366 Standard includes outage resulting from the failure of a single line transformer. Table 54 – 2015 Major Event Day Date Description Reason
2/6/2015 - 2/8/2015 A series of strong Pacific storms moved into CA producing very heavy rain and gusty south winds. South wind gusts near 50 mph were observed along the coast with gusts near 60 mph observed in the northern Sacramento Valley. Generally 4 - 8 inches of rain were observed across the elevated terrain in the northern part of the territory. Some locations topped 8 inches with Bucks Lake for example, recording 9 inches of rain during the series.
IEEE MED*
4/6/2015 A late winter-storm moved through the territory producing moderate rain showers, gusty south winds from 30 - 40 mph, and thunderstorms. Nearly 1000 cloud to ground lighting strikes were recorded across the Sacramento and San Joaquin Valleys
IEEE MED*
6/8/2015 A strong high pressure ridge developed over the territory and produced the first significant heat of the season. Some selected high temperature readings: Redding 107, Fresno 106, Livermore 106, Sacramento 104, Santa Rosa 99, and San Jose 91.
IEEE MED*
7/18/2015 - 7/19/2015 Tropical moisture associated with former Hurricane Dolores drifted over the territory. Atmospheric instability combined with the abundant tropical moisture initiated a widespread thunderstorm outbreak across the San Joaquin Valley and Central Coast. More than 6000 cloud to ground strikes were recorded.
IEEE MED*
12/13/2015 A strong cold front (squall line) moved into the northern part of the territory and produced strong wind gusts, a period of very heavy rainfall, and significant outage activity. The front swiftly progressed south through the remainder of the territory. Widespread wind gusts from 40 - 55 mph were observed across the Sacramento Valley and Redding recorded a gust near 60 mph.
IEEE MED*
12/24/2015 An active Christmas Eve storm moved though the territory producing low elevation snow, isolated thunderstorms, and even a pair of tornadoes
IEEE MED*
*MED is defined as Major Events Day

267
7.1 Major Event Day (MED) Discussions:
February 6-8, 2015 Major Event Day Table 55 below indicates the number of customers without service at periodic intervals for this event (02/06/2015 – 02/08/2015). The numbers of customers noted in the table are for only those divisions identified in Table 55, which represents the excludable portion of these events. Table 55 – February 6-8
Outage Duration
Customers Affected
Cumulative %
0 TO 1 HRS 119,116 30.24% 1 TO 5 HRS 168,942 73.13%
5 TO 10 HRS 40,933 83.52% 10 TO 15 HRS 20,532 88.73% 15 TO 20 HRS 8,440 90.88% 20 TO 24 HRS 5,000 92.15%
>=1 AND <=2 Days 21,473 97.60% >=2 AND <=3 Days 5,769 99.06% >=3 AND <=4 Days 3,443 99.94% >=4 AND <=5 Days 256 100.00%
Total 393,904
Chart 334: February 6-8, 2015 MED
Note: The number of customer outages segmented by hourly restoration periods requires a level of detail not normally maintained by PG&E in its central computerized records. The information shown here is what PG&E has been able to reconstruct from several databases and may have a margin of error of up to 5%.

268
April 6th, 2015 Major Event Day Table 56 below indicates the number of customers without service at periodic intervals for this event (04/06/2015). The numbers of customers noted in the table are for only those divisions identified in Table 56, which represents the excludable portion of these events. Table 56 - April 6
Outage Duration
Customers Affected
Cumulative %
0 TO 1 HRS 5,885 6.77% 1 TO 5 HRS 80,671 99.57%
5 TO 10 HRS 354 99.98% 10 TO 15 HRS 15 99.99% 15 TO 20 HRS 5 100.00%
Total 86,930
Chart 335: April 6, 2015 MED
Note: The number of customer outages segmented by hourly restoration periods requires a level of detail not normally maintained by PG&E in its central computerized records. The information shown here is what PG&E has been able to reconstruct from several databases and may have a margin of error of up to 5%.

269
June 8th, 2015 Major Event Day Table 57 below indicates the number of customers without service at periodic intervals for this event (06/08/2015). The numbers of customers noted in the table are for only those divisions identified in Table 57, which represents the excludable portion of these events. Table 57 – June 8
Outage Duration
Customers Affected
Cumulative %
0 TO 1 HRS 28,156 27.04% 1 TO 5 HRS 71,603 95.82%
5 TO 10 HRS 2,671 98.38% 10 TO 15 HRS 1,344 99.67% 15 TO 20 HRS 151 99.82%
20 TO 24 HRS 71 99.89% >=1 AND <=2 days 117 100.00%
Total 104,113
Chart 336: June 8th, 2015 MED
Note: The number of customer outages segmented by hourly restoration periods requires a level of detail not normally maintained by PG&E in its central computerized records. The information shown here is what PG&E has been able to reconstruct from several databases and may have a margin of error of up to 5%.

270
July 18 -19, 2015 Major Event Day Table 58 below indicates the number of customers without service at periodic intervals for this event (07/18/2015 – 07/19/2015). The numbers of customers noted in the table are for only those divisions identified in Table 58, which represents the excludable portion of these events. Table 58 – July 18-19
Outage Duration
Customers Affected
Cumulative %
0 TO 1 HRS 45,354 29.73% 1 TO 5 HRS 85,272 85.63%
5 TO 10 HRS 12,107 93.57% 10 TO 15 HRS 7,022 98.17% 15 TO 20 HRS 1,216 98.97%
20 TO 24 HRS 311 99.17% >=1 AND <=2 days 1,223 99.97% >=2 AND <=3 days 41 100.00%
Total 152,546
Chart 337: July 18-19, 2015 MED
Note: The number of customer outages segmented by hourly restoration periods requires a level of detail not normally maintained by PG&E in its central computerized records. The information shown here is what PG&E has been able to reconstruct from several databases and may have a margin of error of up to 5%.

271
December 13th, 2015 Major Event Day Table 61 below indicates the number of customers without service at periodic intervals for this event (12/13/2015). The numbers of customers noted in the table are for only those divisions identified in Table 61, which represents the excludable portion of these events. Table 60 – December 13
Outage Duration
Customers Affected
Cumulative %
0 TO 1 HRS 59,588 40.84% 1 TO 5 HRS 76,324 93.16%
5 TO 10 HRS 7,267 98.14% 10 TO 15 HRS 1,458 99.14% 15 TO 20 HRS 564 99.53% 20 TO 24 HRS 58 99.57%
>=1 AND <=2 Days 630 100.00% Total 145,889
Chart 338: December 13th, 2015 MED
Note: The number of customer outages segmented by hourly restoration periods requires a level of detail not normally maintained by PG&E in its central computerized records. The information shown here is what PG&E has been able to reconstruct from several databases and may have a margin of error of up to 5%.

272
December 24th, 2015 Major Event Day Table 62 below indicates the number of customers without service at periodic intervals for this event (12/24/2015). The numbers of customers noted in the table are for only those divisions identified in Table 62, which represents the excludable portion of these events. Table 61 – December 24
Outage Duration
Customers Affected
Cumulative %
0 TO 1 HRS 10,008 25.06% 1 TO 5 HRS 17,904 69.88%
5 TO 10 HRS 8,234 90.49% 10 TO 15 HRS 445 91.61% 15 TO 20 HRS 133 91.94% 20 TO 24 HRS 0 91.94%
>=1 AND <=2 Days 395 92.93% >=2 AND <=3 Days 2,582 99.39% >=3 AND <=4 Days 243 100.00%
Total 39,944
Chart 339: December 24th, 2015 MED
Note: The number of customer outages segmented by hourly restoration periods requires a level of detail not normally maintained by PG&E in its central computerized records. The information shown here is what PG&E has been able to reconstruct from several databases and may have a margin of error of up to 5%.

273
8. Historical Ten Largest Unplanned Outage Events for 2005-2014 Table 63 - Ten Largest 2014 Outage Events
Rank
Description
Date
Number of Customers Affected *
Longest Customer
Interruption (Hours)
# of People Used To Restore
Service (Major Events) **
IEEE Major
Event? 1 The strongest storm event in more than 3 years slammed the territory with strong winds and heavy rain showers starting
on 12/11. Rain and unsettled weather began Wednesday along the north coast and then a very strong cold front developed and intensified Wednesday evening and overnight into Thursday and very slowly progressed through the territory bringing very heavy rain and strong southerly winds. The gusty southerly winds reached up to 50 mph across the Santa Cruz mountains, near 70 mph across elevated Bay Area terrain, and near 120 mph across the Sierra Crest. Over 3 inches of rain fell across many Bay Area locations and over 2 inches for northern Central Valley by Thursday afternoon.
12/11/2014 - 12/12/2014
467394 77 Yes
2 A strong but dry storm system originating from Western Canada dropped south through the Service Area and produced very strong north to northeast winds from Tuesday morning through early Wednesday. Gusts in excess of 60 mph were reported across the Bay Area elevated terrain and foothills across the Sierra Nevada. A strong mountain wave moved into San Jose division from the east, resulting in reported gusts above 50 mph in downtown San Jose.
12/30/2014 – 12/31/2014
296402 67 Yes (Dec 30th)
3 A strong storm moved in from the southwest, bringing heavy rain and gusty southeast winds to many areas, especially the Central Coast and San Joaquin Valley. A secondary line of heavy showers with imbedded thundershowers developed over the San Joaquin Valley during the early afternoon hours, which caused significant outage activity. Wind gusts up to 47 mph were also observed across the lower elevations.
2/28/2014 – 3/1/2014
167137
55 N
4 Two strong Pacific weather systems produced an impressive round of precipitation across the territory Tuesday and Wednesday. Accompanying the rain showers were breezy to gusty southerly winds that developed through the San Joaquin Valley and adjacent elevated terrain. Rainfall totals were 7 inches across the Santa Cruz Mountains and the Central Sierra and generally 2 - 4 inches across the lower elevations in the Bay Area.
12/02/2014 – 12/04/2014
138447 34 Yes (Dec 3rd)
5 An “Atmospheric River” weather event delivered significant rain and high-elevation mountain snow to the territory. The abundant rain and gusty south winds to 40 mph at times produced a prolonged stretch of light to moderate elevated outage activity. Rain totals from the event were highest across the central Sierra and the north coast where 7 – 15 inches of rain fell during the event.
2/7/2014 – 2/8/2014
102832 35 N
6 At 3:20 AM on Sun 8/24/2014 a magnitude 6.0 earthquake was observed in the North Bay Area near American Canyon, Ca. An earthquake summary poster from USGS can be found here: http://earthquake.usgs.gov/earthquakes/eqarchives/poster/2014/20140824.pdf
8/24/2014 99705
30 Yes
7 A strong ridge of high pressure and lack of the marine layer and sea-breeze combined to produce hot temperatures for Bay Area interior valleys and across the interior. Maximum temperatures reached over 100 in Santa Rosa and Livermore on Sunday and up to 105 across the interior Central Valley.
6/8/2014 – 6/9/2014
83962 39 N
8 A wet weather system delivered heavy rain across Northern California and the Sierra, along with moderate rain throughout the Bay Area. After the front moved through, thunderstorms developed and produced 331 lightning strikes within the PG&E territory.
9/25/2014 61597
23 N
9 A weather system delivered the first widespread rain of the season south of a Salinas to Sonora line and also produced a northwest gust front down the San Joaquin Valley where gusts up to 40 mph were observed in Fresno and Bakersfield.
10/31/2014 55145 22 N
10 The weather system with a very moist air mass slid through the Bay Area early Thursday morning and produced light showers and drizzly conditions that resulted in isolated significant outage activity in the east Bay Area.
9/18/2014 39860 17 N
* Note: Values exclude single distribution line transformer and planned outages. ** Note: This data is requested only for Major Event days.

274
Table 64 - Ten Largest 2013 Outage Events
Rank
Description
Date
Number of Customers Affected *
Longest Customer
Interruption (Hours)
# of People Used To Restore
Service (Major Events) **
CPUC Major
Event? 1 On 11/19 into 11/20, a weather system moved into the territory and delivered up to 2 inches of rain over elevated terrain.
It was the first significant rain storm of the season. Then on 11/21 into 11/22 surface low pressure over southern California combined with developing high pressure in Nevada to deliver very strong north to northeast winds across the north half of the Service Territory. Winds were very strong over elevated terrain; wind gusts up to 65 mph were observed in the Oakland hills (Oakland North RAWS) and to 101 mph in the northern Sierra Nevada. (The wind gust at Oakland north was second only to the January 4th mega-storm gust of 71 mph). Wind speeds near 45 - 50 mph were also observed over lower elevation locations such as Oakland and Santa Rosa.
11/19/2013 - 11/22/2013
385,017 143 N
2 The marine layer surged onto the coast and delivered coastal mist and drizzle which ultimately resulted in an insulator flashover event. The event was preceded by a series of brisk wind events which may have increased salt contamination along the coast.
6/23/2013 170,429 15 N
3 Fair and dry weather was observed on 11/12/2013. An unplanned outage occurred in the Bellota substation. 11/12/2013 113,266
10 N
4 High pressure built over California and maximum temperatures from 99 - 107 were observed along the Central Valley. Temperature maximums near the coast were in the 60s to 70s with 70s - 90s for coastal to intermediate valleys. Most customers were impacted by trouble on the Transmission system.
7/19/2013 99,738 18 N
5 Overnight Sunday into the early morning hours of Monday April 8, 2013, a strong Pacific Jet Stream drove a small but intense cold front with very gusty northwest winds into the California coast and Bay Area. Gusts along the coast reached generally into the 50 - 60 mph range with the peak gust of 75 mph recorded at a station on the west edge of San Francisco County.
4/8/2013 93,200 42 N
6 A strong ridge of high pressure built over California bringing extreme heat to all locations except the coast and immediate coastal valleys. High temperatures on 7/1 near the coast ranged from the 70s - 80s with 90s - low 100s for coastal Valleys. Temperatures were extreme in the interior with maximum temperatures up to 111 in the Central Valley. The heat intensified on 7/2 where maximum soared again into the 100s, with Redding observing a 116 degree maximum.
7/1/2013-7/2/2013
93,194
29 N
7 On Sunday a weak area of low pressure moved west to east through the Territory bringing increasing clouds, light showers and snow showers over the Sierra and a few light stray showers elsewhere, primarily across the south. Most customers were impacted by a fault on a substation relay.
3/3/2013 69,578 11 N
8 A classic California October offshore wind event unfolded 10/3/2013 as surface high pressure built north of the Service Territory. Wind speeds were generally 20 – 35 mph with gusts to 40 – 55 across the Sacramento valley, northern Sierra Nevada and elevated terrain around the Bay Area.
10/3/2013 56,573
25 N
9 The ridge of high pressure dramatically amplified delivering significant heat across the Territory. Maximum temperatures across the interior valley locations reached above 105 with Red Bluff reaching 112 degrees. Overnight temperatures remained warm on the far ends of the valley, with minimum temperatures only dipping into the upper 70s in the southern San Joaquin and mid 80s in the northern Sacramento Valley.
6/8/2013 52,442 22 N
10 A cold and dynamic weather system dropped southwestward into the territory and brought cooler and very unsettled weather in the form of rain, snow and gusty winds. Winds were strongest over elevated terrain of the Bay Area – Altamont pass gusted to 69 mph.
10/27/2013 49,692 36 N
* Note: Values exclude single distribution line transformer and planned outages. ** Note: This data is requested only for Major Event days.

275
Table 65 - Ten Largest 2012 Outage Events
Rank
Description
Date
Number of Customers Affected *
Longest Customer
Interruption (Hours)
# of People Used
To Restore Service (Major
Events)**
CPUC Major
Event?
1 The final and strongest storm of an ‘Atmospheric River’ series moved through the territory on 12/02/2012 delivering widespread gusts of 50-70 mph in the northern Sacramento Valley. The strongest wind observed was in Plumas National Forest where a gust of 102 mph was recorded. This system also brought heavy amounts of rain across northern California where localized flooding and mudslides were reported in numerous locations. Precipitation totals from the entire series (See Rank #3) topped 20 inches in the wettest locations in the north.
12/02/2012 298,393 80 N
2 A series of moderate to strong storms impacted the Service Area delivering rain, wind, thunderstorms and several feet of snow across the northern mountains and Sierra. The second storm in the series moved onto the Humboldt coast during the evening of 12/21 and then progressed south and east through the territory overnight into 12/22. The third and strongest storm of the series developed just off the coast and pushed a vigorous cold front through the Service Area on 12/23. Gusts up to 80 mph were observed over elevated terrain. Yet another round of heavy mountain snow fell across the north and the Sierra. Up to 6 feet of snow fell in some locations across the north during the series making restoration difficult.
12/21/2012 – 12/23/2012
195,099 172 N
3 The first storm of the ‘Atmospheric River’ series moved into the territory on 11/28 and delivered strong south winds up to 50-60 mph and heavy rains. The second and stronger system impacted the Territory 11/29 through 11/30. This system brought significant rainfall totals across the north half of the Territory with up to 10” observed in the wettest locations across elevated terrain. After a brief break on 12/1 the final and strongest storm of the series moved through on 12/2 (see Rank 1).
11/28/2012 – 11/30/2012
183,145
71 N
4 On 1/20 a strong Pacific weather system with an associated well-organized frontal band pushed north to south through the territory. This system delivered heavy rains and gusty southerly winds to most locations and was the first rain in a month or more for many locations across the south half of the territory.
1/20/2012 – 1/21/2012
168,496 40 N
5 On 3/16 a system impacted Northern Region and the Bay Area with heavy showers, gusty southerly winds, and a few lightning strikes. On 3/17 this system progressed south through Central Coast and Central Valley Divisions bringing heavy rains, thunderstorms and gusty winds. On 3/18, snow levels fell as cold air filtered in resulting in low snow outage activity from Grass Valley south into Fresno division.
3/16/2012 – 3/18/2012
146,602 63 N
6 Overnight Sunday, 10/21/2012 into Monday, 10/22/2012 a cold front associated with a unusually cold, early-season storm swept west to east across the PG&E Service Area bringing a variety of adverse weather including rain, wind, thunderstorms and low snow. Two tornados also formed in the eastern Sacramento Valley and Sierra foothills.
10/22/2012 129,801 22 N
7 A vigorous late season weather system swept through the Service Area on 6/4 – 6/5 and brought a variety of adverse weather conditions. This system delivered over 700 lightning strikes across the Service Territory with the majority occurring in the northern Sacramento Valley. Winds gusting to 40 mph came up abruptly in the San Joaquin causing numerous wind related outages.
6/4/2012 – 6/5/2012
93,735 22 N
8 On 12/17 a weakening front moved through the Service Area bringing rain showers and breezy southerly winds up to 35-40 mph across the Sacramento Valley. Showers progressed into the southern San Joaquin overnight into 12/18. Post-frontal northwest winds then developed across the San Joaquin Valley, with gusts up to 35 mph observed at Fresno.
12/17/2012 – 12/18/2012
83,063 18 N
9 A Pacific storm system and associated cold front and swept through the north half of the PG&E Service Area. The front brought brisk south winds of 30 to 40 mph, with higher gusts over elevated terrain. During the afternoon, thunderstorms formed along the north coast and northern Sacramento Valley in the post-frontal environment.
3/31/2012 68,165 21 N
10 Non weather related event. 7/21/2012 47,182 30 N * Note: Values exclude single distribution line transformer and planned outages. ** Note: This data is requested only for Major Event days.

276
Table 66 - Ten Largest 2011 Outage Events
Rank
Description
Date
Number of Customers Affected *
Longest Customer
Interruption (Hours)
# of People Used
To Restore Service (Major
Events)**
CPUC Major
Event?
1 A series of cold and powerful storms moved through the Service Area with the majority of outages resulting from low snow and gusty winds. The bulk of outage activity occurred overnight Sat 19th to Sun 20th as strong southeasterly wind gusts were observed in many locations (SF Apt 45 mph, Stockton 44 mph, Redding 45 mph, Bakersfield 40 mph). Excessive low elevation snowfall caused significant outage activity. Yosemite Division was hard hit with low snow (snow totals - 38” reported at 4200’ above Oakhurst)
Mar 17 -22 581,949 256 1,839*** Y-Partial (See
Table 4)
2 After a short respite from inclement weather, another strong and cold storm moved into the Service Area on March 24th. Once again, strong southerly wind gusts were observed (SF Apt 38 mph, Oakland 37 mph). Low elevation snow was the main adverse weather issue with Sierra, North Valley, Stockton, and Yosemite Divisions hard hit with low snow. (snow totals - 13” in Shingletown, 25” at 3700’ along Highway 88, 34” at the 4200’ above Oakhurst)
Mar 24 – 27
464,767 504
1,839*** Y-Partial (See
Table 4)
3 A series of cold storms moved across the Service Area starting Valentine’s day until Feb 19. On the 17th very cold air filtered into the region lowering snow levels enough to create low snow related outages across the Coast Ranges of Humboldt Divisions, and down the entire Sierra Nevada foothills. The hardest hit divisions were Humboldt, Yosemite, and Sierra. (Snow totals - 14” in Shingletown, 38” at 3700’ on Highway 88, 12” at 2600’ in Humboldt County). Snow recorded down to 500 feet in Humboldt.
Feb 15 – 19
357,802 151 N
4 High pressure in the Great Basin and low pressure off the southern California coast set the stage for strongest northeast wind event to hit the Service Area in the last 20 years. Gusts up to 50 mph were common in the Sierra with the highest gust of 94 mph recorded on Mt. Elizabeth in the Yosemite division. Winds were quite strong in the Valley as well (Stockton 52 mph, Redding 40 mph, Fresno 36 mph)
Nov 30 – Dec 1
325,942 131 N
5 A strong and cold storm affected the entire Service Area with low snow falling in the Northern Region and gusty southerly winds and heavy rains further east and south. The hardest hit divisions were Humboldt, North Valley, and Sierra. (Snow totals – 18” in Shingletown, 20” in Susanville, 19” in Grass Valley). Snow recorded down to 500 feet in Humboldt.
Feb 24 - 25 187,851 152 N
6 An early season storm moved through the Service Area bringing moderate southerly winds and heavy precipitation rates. In Ukiah, more than a half inch of rain fell within one hour in the early morning. The Central Valley Region experienced the most outages. These were mainly pole fires/flashover caused by the first rain to fall in the area after months of prolonged dry weather.
Oct 5 100,357 24 N
7 Widespread thunderstorm activity broke out across the southern part of the Service Area early in the morning with the biggest impacts in Fresno and Kern divisions. The Bakersfield area in Kern was hit particularly hard by lightning, with Kern Division recording 3833 lightning strikes for the day.
Sept 10 77,443 69 N
8 A late season cold storm moved through the Service Area with low snow outage conditions across divisions in the Sierra Nevada, especially the Sierra Division. (8” of snow at 3700’ along Highway 88) Thunderstorms and associated lightning also broke out across the Central Valley. Impacts were minimal in the Bay Area and Central Coast Regions.
May 15 62,863 30
N
9 A non-weather related outage day with maximum temperatures along the Central Valley in the mid-80s. The outage count was only slightly above average for a June day; however, a large number of customers in the East Bay were affected by two distribution substation outages.
Jun 12 50,028 15 N
10 The first warm day of the spring was observed in many areas. San Jose had a high of 84. This could have contributed to the above average outage total. No other adverse weather was reported. The largest impacts were recorded in the San Francisco and San Jose Divisions.
Apr 1 44,177 6 N
* Note: Values exclude single distribution line transformer and planned outages. ** Note: This data is requested only for Major Event days. *** Note: During the course of the March 17-27, 2011 storms, approximately 1,839 PG&E Operations, Maintenance and Construction (OM&C) employees responded. These employees included electric and gas construction crews, troublemen, meter technicians, clerical staff, gas and electric estimators and meter readers. Resources were dispatched and moved from lesser impacted areas to the more heavily impacted areas. In addition to PG&E personnel, 110 vegetation crews, 10 contract crews (approximately 200 individuals), and 36 mutual aid crews (approximately 175 individuals) were utilized to supplement existing resources.

277
Table 67 - Ten Largest 2010 Outage Events
Rank
Description
Date
Number of Customers Affected *
Longest Customer
Interruption (Hours)
# of People Used
To Restore Service (Major
Events)**
CPUC Major
Event?
1 A strong jet stream developed over the Eastern Pacific, which spawned a series of outage producing weather events that included: - Three impulses of strong winds; gust above 50 mph each day (Jan 18, 19, 20) - Periods of moderate to heavy rainfall (Jan 18, 19, 20, 21) - Bands of thundershower activity (several thousand strikes Jan 18-21) - Heavy snowfall at low elevations of the Sierra Nevada (Jan 21, 22)
Jan 18-24 1,169,513 497 3,830 *** Y
2 A strong storm system with several impulses moved through the entire Service Area during the Dec 17 – 20 period bringing gusty winds and heavy rain. Wind gusts during the period: 43 mph at Stockton, 43 mph at Salinas, 46 mph at SFO, 43 at Red Bluff.
Dec 17-20 215,116 120 N
3 A series of cold storms brought significant snow to low elevations in the Sierra Nevada foothills. The snow came early in the season, when deciduous trees still retained most of their leaves. Excessive snow loading occurred on trees causing large limbs to break off and fall onto power lines. Snowfall amounts ranged from near 1 foot at the 3000’ elevation, to several feet above 5000’. This storm produced the most low elevations snow in November in the last 15 years.
Nov 20-21 215,245 186 N
4 Storm system with strong south winds on Dec 28 (gusts to 47 mph at Marysville, 41mph at Stockton, 46 mph SFO) followed by strong northwest winds on Dec 29 (gusts to 46 mph at San Jose, 41 mph at Stockton, 43 at Bakersfield, 46 mph at SFO).
Dec 28-29 180,370
47 N
5 A late season storm brought rain, thunderstorms, and wind. Over 500 lightning strikes were recorded. The storm was particularly strong along the Central Coast and in the southern San Joaquin Valley. Reported wind gusts: 45 mph at Salinas, 46 mph at Santa Maria, 46 mph at Bakersfield 46.
Apr 11-12 122,050 73 N
6 Early season storm brought thunderstorms to Northern Region (over 1000 strikes recorded) along with rain to other parts of the Service Area. In many cases, this was the first rain of the season causing flashover outages.
Sep 8-10 114,402 60 N
7 An early season storm brought high winds and heavy rain to primarily the Northern Region. Redding recorded a peak wind gust of 49 mph. Santa Rosa recorded 4.75” of rainfall.
Oct 24 111,522 43 N
8 Storm system swept across the Service Area bringing rain and gusty winds. Reported wind gusts: 41 mph at Salinas, 41 mph at Bakersfield.
Dec 4-5 98,041 21 N
9 Heat wave conditions resulted in the hottest two days of the summer. Maximum temperatures exceeded 110 in portions of the Central Valley (111 at Bakersfield on 8/25). Maximum temperatures between 100 and 110 were reported both days at many coastal valley areas (109 at Ukiah on 8/25, 107 at Santa Rosa on 8/24, 105 at Livermore on 8/25).
Aug 24-25 97,616 82 N
10 Heat wave affected the service area, on both days Central Valley maximum temperatures ranged between 100 and 110; maximum temperatures above 100 were reported in coastal valleys on 6/27.
Jun 27-28 87,751 38 N
* Note: Values exclude single distribution line transformer and planned outages. *** Note: This data is requested only for Major Event days. *** Note: During the course of the January 18, 2010 Storm approximately 3,830 PG&E Operations, Maintenance and Construction (OM&C) employees responded. These employees included electric and gas construction crews, troublemen, gas service representatives, meter technicians, clerical staff, gas and electric estimators and meter readers. Resources were dispatched and moved from lesser impacted areas to the more heavily impacted areas. In addition to PG&E personnel, 1000 vegetation workers and 60 contract crews (approximately 360 individuals) were utilized to supplement existing resources.

278
Table 68 - Ten Largest 2009 Outage Events
Rank
Description
Date
Number of Customers Affected *
Longest Customer
Interruption (Hours)
# of People Used
To Restore Service (Major
Events)**
CPUC Major
Event?
1 A strong early season storm affected the entire service area with many stations reporting wind gusts over 50 mph (57 mph at Ft. Funston (SF), 56 mph at Fairfield, 55 mph at Oroville, 51 mph at Monterey). Single day rainfall totals ranged between two and five inches at many locations (4.54 in. at Watsonville, 4.27 in. at Fairfield, and 3.66 in. at Napa). National Weather Service records indicate this storm was the strongest October rain and wind event since 1962.
10/13–10/14
617,589 244*** 4,400 **** Y
2 A strong cold front produced significant snowfall on Feb. 13 in the 1500-3000 ft. range of the northern and central Sierra foothills (up to 2 feet of snow at 3000 ft. and @ 1 foot at 2000 ft.). A second storm followed on Feb.15 producing widespread heavy rain and strong wind gusts to the entire Service Area (67 mph at Valley Ford, 59 mph at Oroville, 50 mph at Redding, and Ft. Funston (SF), 47 mph at Salinas, 43 mph at San Luis Obispo. A third storm on Feb 16 delivered additional rainfall and wind gusts in the 30 to 40 mph range at several locations.
2/13-2/17 340,582 107 N
3 A large cluster of thunderstorms produced widespread lightning activity in the Bay Area and Sacramento Valley on Sep. 12. The lightning activity was followed by a weak weather front the next day that produced the first light rain of the season over much Northern California resulting in flashover related outages.
9/12-9/14 190,671 92 N
4 A strong cold front produced significant snowfall at the 1000-3000 ft. range of the Sierra foothills (up to 2 feet of snow was observed at 3000 ft., @ 1 foot at 1500 ft.) Light snow was reported at locations in the Central Valley.
12/7 147,630
113 N
5 Strong northerly winds developed across the entire Service Area with the gusts in the 45 to 55 mph range in the Bay Area and Sacramento Valley (52 mph at Fairfield, 49 mph at Sacramento, 45 mph at Red Bluff)
11/28 119,504 84 N
6 Strong north to northwest winds in the 40 to 60 mph range followed the passage of a weak weather front through the service area (58 mph at Ft. Funston (SF), 58 mph at SF Airport, 50 mph at San Carlos, 46 mph at Stockton)
4/14 116,406 45 N
7 An area of low pressure produced a large outbreak of thunderstorms with widespread lightning overnight on Jun. 3, continuing into the morning of June 4.
6/3-6/4 98.187 38 N
8 Strong north to northwest winds in the 45 to 55 mph range were recorded throughout the Sacramento and San Joaquin Valleys following the passage of a weak weather front (52 mph at Merced, 49 mph at Stockton, 47 mph at Modesto and Madera, 46 mph at Red Bluff, 45 mph at Fresno).
10/27 70,901 20 N
9 A winter storm accompanied by periods of moderate to heavy rainfall and scattered thundershower activity crossed the service area. Rainfall totals of up to 2 inches were reported.
12/12 54,111 41
N
10 Widespread thunderstorm activity resulted in several hundred lightning strikes in Areas 4, 5, 6 and 7. 5/28 52,705 22
N
* Note: Values exclude single distribution line transformer and planned outages. ** Note: This data is requested only for Major Event days. *** Note: This duration was due to the lack of access caused by flooding in the Stockton area. Access was granted after waters receded. Work was the completed and service was restored to the six customers remaining out of service. **** Note: Approximately 4,400 PG&E Operations, Maintenance & Construction (OM&C) employees responded. In addition to PG&E personnel, 400 vegetation workers and 42 contract crews (approximately 210 individuals) were utilized to supplement existing resources.

279
Table 69 - Ten Largest 2008 Outage Events
Rank
Description
Date
Number of Customers Affected *
Longest Customer
Interruption (Hours)
# of People Used
To Restore Service (Major
Events)**
CPUC Major
Event?
1 Strongest storm system since December 1995 affected the entire service area on Jan 4. Wind gusts exceeded 65 mph at many low elevation sites throughout the service area (Redding 70 mph, Beale AFB 69 mph, Sacramento Apt. 66 mph, Pt. San Pablo 83 mph), with some coastal hills and foothill sites gusting to over 80 mph (Los Gatos, elev. 2000 ft. 105 mph, Big Rock , Marin Co. elev. 1500 ft. 83 mph). Rainfall totals on Jan 4 ranged up to 4 inches with storm totals above 6 inches in the North Bay counties. Multiple lightning strikes were reported on Jan 4 and 5.
1/3 – 1/6 1,631,765 290 7,130 *** Y
2 A series of cold winter storms crossed the state. The first system (Jan 24-25) delivered gusty winds (generally in the 30 to 50 mph range), up to 2 inches of rain and snow below 2000 ft. A second system focused on the southern half of the service territory brought additional rain and thundershower activity along with even gustier winds (Santa Maria 67 mph, Bakersfield 49 mph).
1/24 – 1/27 303,168 172 N
3 A storm system with wind gusts in the 25 to 40 mph range crossed the state. Most locations reported under one inch of rain with a few coastal stations reaching two inches total.
10/31 – 11/1
189,811 50 N
4 The first rains of the winter season were accompanied by winds generally gusting from 25 to 35 mph (Red Bluff 44 mph). A large number of flashover incidents were likely triggered by the combination of light rain and power lines heavily sooted after the widespread summer season wildfires.
10/3 – 10/4 147,703
65 N
5 Gusty winds with periods of moderate rain accompanied a weather system that crossed the state. Wind gusts were generally in the 30 to 50 mph range (SF Airport 47 mph, Stockton 47 mph, Merced 45 mph).
2/2 – 2/3 121,865 65 N
6 Gusty winds from this storm were strongest in the southern half of the service area. Gusts between 50 and 55 mph were reported at SF Airport, Salinas, Santa Maria, Red Bluff and Bakersfield.
2/23 – 2/24
113,086 101 N
7 A weather front brought gusty winds and periods of moderate to heavy rain to the state. Post-frontal west to northwest wind gusts were strongest in the Bay Area (SF Apt 54 mph, Hayward 63 mph, Oakland 47 mph, Salinas 51 mph)
12/25 111,134 102 N
8 Gusty north winds generally in the 25 to 35 mph range were reported in the north. San Joaquin and Central Coast winds gusted from 30 to over 50 mph (Santa Maria 41 mph, Stockton 45 mph, Madera 52 mph, Merced 47 mph)
5/22 105, 635 102 N
9 Gusty north winds developed on the evening of Feb 13 and continued through Feb 14. Winds were generally in the 30 to 45 mph range, with strongest gusts in the Central Valley (Redding 48 mph, Marysville 48 mph, Sacramento 47 mph)
2/13 – 2/14
98,788 47 N
10 Gusty north winds between 20 and 35 mph resulted in a record breaking early season heat wave. Bay Area and Central Valley temperatures ranged from 100 to 105F
5/15 84,659 28 N
* Note: Values exclude single distribution line transformer and planned outages. ** Note: This data is requested only for Major Event days. *** Note: Approximately 6,000 PG&E Operations, Maintenance & Construction (OM&C) employees responded. In addition to PG&E personnel, 300-350 vegetation crews (approximately 700 individuals),
70 contract crews (approximately 450 individuals) and 28 mutual assistance crews (approximately 170 individuals) from Southern California Edison (SCE), San Diego Gas and Electric (SDG&E), City of Gridley, City of Redding, and Sierra Pacific Power were utilized to supplement existing resources

280
Table 70 - Ten Largest 2007 Outage Events
Rank
Description
Date
Number of Customers Affected *
Longest Customer
Interruption (Hours)
# of People Used
To Restore Service (Major
Events)**
CPUC Major
Event?
1 Gusty winds and rain Feb 26 and 27. Peak wind speeds of 30-45 mph Bay Area (Oakland 40 mph, SF approximately 43 mph). Interior valley reported 25-40 mph gusts, strongest in the San Joaquin Valley (Fresno 38 mph). Rainfall generally below one inch. Snow levels lowered to 2000 ft. as far south as the San Joaquin Valley on Feb 27.
2/26 - 2/28
266,764 214 ***
N
2 Heat wave centered around July 5. Maximums between 105-115 degrees in the interior valleys, 95-110 degrees in the coastal valleys. 7/4 - 7/7
172,778 20 N
3 Widespread lightning with subtropical rain. Lightning all three days but extensive strikes on Aug 30 over Areas 3 and 4 8/29 - 8/31
149,883 75
N
4 Early summer hot temperatures in the interior; maximums 100-105 degrees in the Central Valley, upper 80’s to low 100’s in the coastal valleys. North winds 20-25 mph
6/14 - 6/16
137,977
27 N
5 Light rain across Central and North Areas. Winds generally below 25 mph. Lightning on Sep 21 in the evening continuing through Sep 22 mainly in San Joaquin Valley and foothills. Many outages reported due to insulator flashover resulting from light rain.
9/22 100,606 33
N
6 Rain, gusty winds and scattered thundershowers Feb 22. Peak winds at Redding - 51 mph on the Feb 21 and 44 mph on Feb 22nd. Bay Area gusts from 25-35 mph (Oakland 37 mph) on the Feb 22nd. Over 2 inches of rain in Eureka, less than one inch most other locations
2/22 - 2/23
96,420 79 N
7 Light rain far north, winds below 25 mph. Cold morning temperatures. 1/16 91,695 24 N 8 Thunderstorms / lightning in the Sierra foothills of Area 4 and 5. Afternoon temperatures between 95-100 degrees in the Central Valley 7/24 70,602 29 N 9 Light rain across the Service Area. Many outages reported due to insulator flashover resulting from light rain.
10/10 62,434 34 N
10 Moderately strong winds occurred across the Central and Northern Service Areas with gusts up to 50 mph. 12/27 59,594 20 N * Note: Values exclude single distribution line transformer and planned outages. ** Note: This data is requested only for Major Event days. *** Note: Reflects an outage at two customer locations in a remote area that experiences deep snow with limited access.

281
Table 71 - Ten Largest 2006 Outage Events
Rank
Description
Date
Number of Customers
Affected
Longest Customer
Interruption (Hours)
# of People Used To Restore Service
(Major Event)**
CPUC Major
Event? 1 A severe and long lasting heat wave affected the service area. In many locations three day average temperatures were the highest
recorded in over 50 years. Consecutive days with maximum temperatures over 110 F were recorded throughout the Central Valley, and many coastal valleys reported consecutive days with maximum temperatures over 105 F. Sacramento set an all-time record of 11 days in a row with maximum temperatures over 100 F. An unusual feature of this heat wave was high nighttime temperatures. Sacramento, San Jose and Fresno set records for the highest minimum temperatures ever recorded.
7/21 - 7/27 651,217 119
Y See
Table 4
2 A strong storm moved across the service area on Dec 26. Strong post-frontal winds occurred Dec 27-28. Southerly winds gusted from 45 to 55 mph in the Sacramento Valley and Bay Area on Dec 26th, accompanied by rainfall totals ranging from ½ to 3 inches. Gusty west to northwest winds were recorded after the front passed on Dec 27th. Bay Area wind gusts generally ranged from 45-60 mph, and gusts in the 35 to 50 mph range were reported in both northern and southern portions of the service area. North to northwesterly wind gusts in the 25 to 40 mph range continued into the afternoon of Dec 28th
12/26-12/28
528,496 125 2460 Y
See Table 4
3 The storm of Jan 1-2 was a continuation of a series of storms that began at the end of the 2005. Gusts from 45 to over 60 mph were common in the Sacramento Valley and Bay Area; 35 to 55 mph along the Central Coast, and 30 to 45 mph in the San Joaquin Valley. Rainfall amounts ranging from ½ to 2 inches fell on grounds that had been saturated by a series of late December storms.
1/1 – 1/5
(12/30/05-1/5/06)*
504,072
(1,101,718)
129
(155)
3522*** Y See
Table 4
4 A strong storm occurred on February 27-28. Bay Area wind gusts generally ranged from 45 to 70 mph; SF Airport reported a wind gust of 71 mph. Gusts to 50 mph were reported in many other parts of the service area. Moderate to heavy rain accompanied the strong winds with up to four inches of rain reported along the north coast and in the northern interior. Bands of thunderstorms rolled through the service area on Feb 28.
2/26 – 2/28 331,813 45
Y See
Table 4
5 Strong high pressure resulted in heat wave conditions over most of the service area. On June 22, temperatures ranged from 100 to 110 throughout the Central Valley, Bay Area and coastal valley temperatures ranged from 95 to 105. On Jun 23, a weak sea breeze cooled off the Bay Area slightly, but interior valley temperatures continued to climb resulting in readings generally between 105 and 115 through June 25 (117 @ Red Bluff on Jun 25)
6/22 – 6/25 164,582 31 N
6 The first significant wind and rain storm of the winter occurred during the Dec 8-10 period. Wind gusts generally ranged from 30 to 40 mph on Dec 8 and 9 (45 mph @ SF Apt, 45 mph @ Hanford); and from 25-35 mph on Dec 10 (38 mph @ Oakland, 37 mph @ Redding). Rainfall totals were generally under ½ inch on Dec 8 (0,58 at Santa Rosa), between ¼ and ¾ inch on Dec 9 (0.99 inches at Sacramento); and under ¼ inch on Dec 10. Thunderstorms were reported in the Sacramento Valley on Dec 9.
12/8 – 12/10
146,770 39 N
7 A cold air mass brought periods of rain, wind, thundershowers and low elevation snow to the service area. On Mar 9, winds gusts ranged from 25 to 45 mph through most of the service area (46 mph @ SF Apt). Lightning mainly confined to coast areas on Mar 10, and coastal areas and San Joaquin Valley on Mar 11. Large accumulations of low elevation snow were reported in the foothills of the Central (10 inches at Angels Camp) and Southern Sierra (14 inches at 1500 ft.). In the coastal mountains between six and 12 inches was reported.
3/9 – 3/14 138,997 94
Y
See Table 4
8 During this four day period, several storms crossed through the service territory. Strong winds, rain and thunderstorms occurred on March 3, especially affecting the San Joaquin Valley. Fresno reported a wind gust of 41 mph. Wind gusts above 40 mph were recorded in Humboldt County on March 4. The final weather front of this series occurred on Mar 5. Peak winds gusted to 55 mph along the north coast, and an additional one to three inches of rain was reported in parts of the Bay Area, North Coast and Sacramento Valley
3/02 – 3/05 113,235 66 Y
See Table 4
9 A surge of subtropical moisture moved over the service area resulting in periods of heavy rainfall (1.14 inches at Sacramento, 1.02 inches at Stockton) and moderately gusty winds in the 20-35 mph range. Lightning activity was strong in the northern and central San Joaquin Valley.
4/04 – 4/05 102,052 31 Y See
Table 4 10 A weather front produced 40-45 mph wind gusts in the northern Sacramento Valley, 10 mph gusts elsewhere. Rainfall totals ranged
from ¼ to one inch along the north coast and northern Sacramento Valley, less than ¼ inch elsewhere. 1/28 85,089 73 N
Note: Values exclude single distribution line transformer and planned outages. The events listed as CPUC Major Events only include the outages for excludable counties. Otherwise the events include the system values. * Note: The values in parenthesis reflect the totals for the entire event from Dec 30, 2005 to Jan 5, 2006 as noted in Section 1. ** Note: This data is requested only for Major Event Days. *** Note: Approximately 3,300 PG&E Operations, Maintenance & Construction (OM&C) employees responded. In addition to PG&E personnel, a total of 27 Contract Crews (approximately 142 individuals) and 20 Mutual Assistance Crews (approximately 80 individuals) from Southern California Edison (SCE) were utilized to supplement existing resources.

282
Table 72 - Ten Largest 2005 Outage Events
Rank
Description
Date
Number of Customers Affected *
Longest Customer
Interruption (Hours)
# of People Used
To Restore Service (Major
Events)**
CPUC Major
Event?
1 A series of strong storms struck the service area (these storms were preceded by several wet events that affected the North Bay and North Coast). The Dec 30 event was strongest in the north. The Eureka NWS office reported 90+ mph winds in the Humboldt Bay area and widespread gusts in excess of 70 mph. Northern Sacramento Valley locations reported strong wind gusts; e.g. 53 mph at Redding. North Coast and North Bay rainfall amounts were in the 3 to 5 inch range. The Dec 31 event affected the entire service area. Wind gusts above 50 mph were recorded in all areas except the Southern San Joaquin Valley; 59 mph at Red Bluff, 58 mph at Arcata, 51 mph at Santa Rosa; 53 mph at Sonoma; 59 mph at Rio vista; 77 mph at Pt. San Pablo (SF Bay); 62 mph at Ft. Funston (SF); 60 mph at SF Airport; 52 mph at Los Banos. An additional one to three inches of rain fell across northern and central California on Dec 31.
12/30 – 12/31 597,646 155 3522*** Y
2 A strong weather front delivered wind gusts over 50 mph at many locations in the southern 2/3 of the service area; 53 mph at Beale AFB (Marysville), 53 mph at Mather AFB (Sacramento), 48 mph at SF Airport, 53 mph at Bellota, 51 mph at Stockton, 55 mph at San Luis Obispo, 56 mph at Stockdale (Bakersfield). Rainfall totals were generally less than one inch.
01/07 – 01/09 278,360 149 N
3 A strong weather front accompanied by heavy rain and strong gusty winds targeted the central portion of the service area. Peak wind gusts included 50 mph at Valley Ford, 49 mph at Rio Vista, 55 mph at Ft. Funston, 53 mph at SF Airport, 49 mph at San Luis Obispo. Many coastal locations received between one to three inches of rain. The number of customer’s affected (252,679) is a system total for December 18-20. However, PG&E excluded only the following divisions on the following days: December 18 (Diablo, East Bay, North Bay, North Coast, Peninsula, Sacramento, Stockton), December 19 (North Coast, Peninsula, Sacramento), December 20 (North Coast).
12/18 – 12/20 252,679 49 Y Noted in Table 4
4 A series of weather fronts affected the service area over this four day period resulting in a prolonged period of rainy and blustery weather. Some localized flooding was reported with rainfall totals in the two to four inch range. The strongest winds were on Mar 22 with peak gusts of 45 mph at SF Airport, 45 mph at Rio Vista, 44 mph at Sacramento, 43 mph at Redding and 33 mph at Fresno.
03/19 – 03/22 209,867
55 N
5 A weather front crossed the service area producing strong gusty winds in the Bay Area and Sacramento Valley. Peak gusts included 54 mph at Valley Ford, 51 mph at Table Mountain and Corning, 63 mph at Pt. San Pablo, 51 mph at Pleasanton, 64 mph at SF Airport, and 55 mph at Ft. Funston. Rainfall totals were generally between one and two inches in the North Bay and Sacramento Valley.
12/01 – 12/02 199,923 26 N
6 The series of storms that affected the service area on Dec 26-28 produced moderate rain and gusty winds (30-45 mph) in the north on Dec 26, heavy rain north (one to three inches) and gusty winds south; 44 mph at Stockton, 46 mph Bakersfield, 45 mph Santa Maria on Dec 27, and another one to two inches of rain north on Dec 28.
12/26 – 12/28 124,753 26 N
7 Transmission relay malfunction (Moraga-Oakland Station X, 115kV line #3). 11/20 116,513 9 N 8 A strong lightning storm developed a band of subtropical moisture that mainly affected the Bay Area, southern Sacramento Valley
and San Joaquin Valley. 09/20 110,271 41 N
9 A weather front affected the central part of the service area bringing gusty winds and widespread shower activity. Strongest peak wind gusts were 44 mph at Salinas, 40 mph at Pleasanton, 38 mph at Bethel Island and 28 mph at Fresno. Thunderstorm activity was reported in the Bay Area, southern Sacramento Valley, and San Joaquin Valley, with numerous lightning strikes recorded.
02/21 105,652 37 N
10 A weak weather front crossed the service area followed by gusty northwesterly winds. Peak gusts were 37 mph at SF Airport, 36 mph at Eureka, 36 mph at Redding and 36 mph at Rio Vista. Rainfall totals were less than one-half inch.
10/15 85,802 37 N
* Note: Values exclude single distribution line transformer and planned outages. ** Note: This data is requested only for Major Event Days. *** Note: Approximately 3,300 PG&E Operations, Maintenance & Construction (OM&C) employees responded. In addition to PG&E personnel, a total of 27 Contract Crews (approximately 142 individuals) and 20 Mutual Assistance Crews (approximately 80 individuals) from Southern California Edison (SCE) were utilized to supplement existing resources.

283
9. The Number of Customer Inquiries on Reliability Data and the Number of Days per Response
The following table provides the total number of customer inquiries, and PG&E response times for the year 2015.
Note: ESR = Electric Service Reliability (Recurring Outages). This Includes ESR cases created on or after January 1, 2015 and closed as of December 31, 2015.
Total Cases
Closed0-7 Days
Closed8-14 Days
Closed> 14 Days
% Closed0-7 Days
% Closed8-14 Days
% Closed> 14 Days
259 255 4 0 98% 2% 0%Sacramento 102 100 2 0 98% 2% 0%Sierra 157 155 2 0 99% 1% 0%
30 30 0 0 100% 0% 0%North Valley 30 30 0 0 100% 0% 0%
177 176 1 0 99% 1% 0%Diablo 104 103 1 0 99% 1% 0%North Bay 73 73 0 0 100% 0% 0%
91 89 2 0 98% 2% 0%East Bay 46 45 1 0 98% 2% 0%San Francisco 45 44 1 0 98% 2% 0%
68 67 1 0 99% 1% 0%Humboldt 18 18 0 0 100% 0% 0%Sonoma 50 49 1 0 98% 2% 0%
28 27 1 0 96% 4% 0%Kern 28 27 1 0 96% 4% 0%
59 59 0 0 100% 0% 0%Fresno 59 59 0 0 100% 0% 0%
119 118 1 0 99% 1% 0%Mission 119 118 1 0 99% 1% 0%
82 81 1 0 99% 1% 0%Central Coast 41 41 0 0 100% 0% 0%Los Padres 41 40 1 0 98% 2% 0%
111 111 0 0 100% 0% 0%Peninsula 111 111 0 0 100% 0% 0%
162 161 1 0 99% 1% 0%De Anza 44 43 1 0 98% 2% 0%San Jose 118 118 0 0 100% 0% 0%
115 111 2 2 97% 2% 2%Stockton 74 72 1 1 97% 1% 1%Yosemite 41 39 1 1 95% 2% 2%
- -1301 1285 14 2 99% 1% 0%
SAN JOSE
STOCKTON
GRAND TOTAL
HAYWARD
SALINAS
SAN CARLOS
2015 ESR CLOSED CASES
SOUTHBAKERSFIELD
FRESNO
AUBURN
CHICO
CONCORD
SAN FRANCISCO
SANTA ROSA
NORTH

284
10. Appendix A – Definitions, Acronyms & Abbreviations AIDI – Average Interruption Duration Indices
Customer: A metered electrical service point for which an active bill account is established at a
specific location.
CAIDI: Customer Average Interruption Duration Index The Customer Average Interruption Duration Index (CAIDI) represents the average time required to
restore service.
CESO: A term that counts the number of Customers Experiencing Sustained Outages. DART – Distribution Asset Reconciliation Tools – a distribution asset database used by PG&E.
Distribution system: That portion of an electric system that delivers electric energy from
transformation points on the transmission system to the customer. PG&E defines its distribution
system as line voltage less than 50 kilovolts (KV). The distribution system is generally considered to
be anything from the distribution substation fence to the transformer prior to stepping down the
voltage to the customer premise.
EON: EON stands for Enhanced Outage Notification, now retired, that was used to identify and
record momentary outages. Customers agreed to put EON devices in their homes and the device
would send PG&E information when the customer experienced and outages. The EON project was
used prior to the availability of SmartMeter data.
IEEE – The Institute of Electrical and Electronics Engineers, Inc.
ILIS – Integrated Logging and Information System – The tool PG&E’s distribution operators use to log
electric outages.
ISO: The California Independent System Operator. The ISO operates the transmission system
throughout most of the State of California, including throughout PG&E’s service territory.
Major Event: Designates an event that exceeds reasonable design and or operational limits of the
electric power system. A Major Event includes at least one Major Event Day. See also: Major Event Day.
Major Event Day (MED): A day in which the daily system, System Average Interruption Duration
Index (SAIDI) exceeds a Major Event Day threshold value. For the purposes of calculating daily
system SAIDI, any interruption that spans multiple calendar days is accrued to the day on which the
interruption began.
MAIFI: Momentary Average Interruption Frequency Index

285
The Momentary Average Interruption Frequency Index (MAIFI) indicates the average frequency of
momentary interruptions.
Momentary interruption: The brief (five minutes or less) loss of power delivery to one or more
customers caused by the opening and closing operation of an interrupting device. Two circuit breaker
or recloser operations (each operation being an open followed by a close) that briefly interrupt service
to one or more customers are included as two momentary interruptions. ODB – Operations Database - ODB is the outage database for PG&E
Planned outage: The intentional disabling of a component’s capability to deliver power, done at a
preselected time, usually for the purposes of construction, preventative maintenance, or repair.
SAIDI: System Average Interruption Duration Index The System Average Interruption Duration Index (SAIDI) indicates the total duration of interruption for
the average customer during a predefined period of time. It is commonly measured in minutes or
hours of interruption.
SAIFI: System Average Interruption Frequency Index The System Average Interruption Frequency Index (SAIFI) indicates how often the average customer
experiences a sustained interruption over a predefined period of time.
SCADA: Supervisory Control and Data Acquisition – an online database for distribution operators to
remotely gather information and control the distribution system.
Sustained interruption: Any interruption not classified as a part of a momentary event. That is, any
interruption that lasts more than five minutes.
Unplanned interruption: The loss of electric power to one or more customers that does not result
from a planned outage.