Embed Size (px)
Citation preview

2013 Annual ReportComprehensive Annual Financial Report
For Years Ended December 31, 2013 and 2012

2 DRPA 2013 Comprehensive Annual Financial Report
Introductory Section
Government Finance Officers Association
Certificate ofAchievementfor Excellencein FinancialReporting
Presented to
Delaware River Port Authority
For its Comprehensive AnnualFinancial Report
for the Fiscal Year Ended
December 31, 2012
Executive Director/CEO
For the twenty-first consecutive year the Delaware River Port Authority
was awarded the Certificate of Achievement for
Excellence in Financial Reportingby the Government Finance Officers Association of the United States and Canada for its 2012 Comprehensive
Annual Financial Report.

DRPA 2013 Comprehensive Annual Financial Report
Introductory Section
3
Chairman’s Letter. . . . . . . . . . . . . . . . . . . . . . . . . . . . . . . . . . . . . . . . . . . . . . . . . . . . . . . . . . . . . . . . . . . . . . . . . . . . . . . . . . . . . . . . . . . . . . . . . . .Board of Commissioners. . . . . . . . . . . . . . . . . . . . . . . . . . . . . . . . . . . . . . . . . . . . . . . . . . . . . . . . . . . . . . . . . . . . . . . . . . . . . . . . . . . . . . . . . .Organizational Chart . . . . . . . . . . . . . . . . .. . . . . . . . . . . . . . . . . . . . . . . . . . . . . . . . . . . . . . . . . . . . . . . . . . . . . . . . . . . . . . . . . . . . . . . . . . . . . .Officers and Executive Staff . . . . . . . . . . . . . . . . . . . . . . . . . . . . . . . . . . . . . . . . . . . . . . . . . . . . . . . . . . . . . . . . . . . . . . . . . . . . . . . . . . . . . . .Facilities.. . . . . . . . . . . . . . . . .. . . . .. . . . . . . . . . . . . . . . . . . . . . . . . . . . . . . . . . . . . . . . . . . . . . . . . . . . . . . . . . . . . . . . . . . . . . . . . . . . . . . . . . . . . .Report of the Chief Executive Officer. . . . . . . . . . . . . . . . . . . . . . . . . . . . . . . . . . . . . . . . . . . . . . . . . . . . . . . . . . . . . . . . . . . . . . . . . . . .Letter of Transmittal... . . . . . . . . . . . . . . . . . . . . . .. . . . . . . . . . . . . . . . . . . . . . . . . . . . . . . . . . . . . . . . . . . . . . . . . . . . . . . . . . . . . . . . . . . . . .
56889
1115
Financial Section
Introductory Section
Statistical Section (Unaudited)
Independent Auditor’s Report . . . . . . . . . . . . . . . . . . . . . . . . . . . . . . . . . . . . . . . . . . . . . . . . . . . . . . . . . . . . . . . . . . . . . . . . . . . . . . . . . . .Management’s Discussion and Analysis (Unaudited). . . . . . . . . . . . . . . . . . . . . . . . . . . . . . . . . . . . . . . . . . . . . . . . . . . . . . . . .
Combined Financial Statements: Combined Statements of Net Position. . . . . . .. . . . . . . . . . . . . . . . . . . . . . . . . . . . . . . . . . . . . . . . . . . . . . . . . . . . . . . . . . . . . . . . . . Combined Statements of Revenues, Expenses and Changes in Net Position . . . . . . . . . . . . . . . . . . . . . . . . . . . Combined Statements of Cash Flows .. . . . . . . . . . . . . . . . . . . . . . . . . . . . . . . . . . . . . . . . . . . . . . . . . . . . . . . . . . . . . . . . . . . . . . . . Notes to Combined Financial Statements. . . . . . . . . . . . . . . . . . . . . . . . . . . . . . . . . . . . . . . . . . . . . . ... . . . . . . . . . . . . . . . . . . .Required Supplementary Information (Unaudited): Schedule of Funding Progress for Health Benefits Plan.. . . . . . . . . . . . . . . . . . . . . . . . . . . . . . . . . . . . . . . . . . . . . . . . . . . .Supplementary Information: Combined Supplemental Schedule of Net Position Information by Fund .. . ..... . . . . . . . . . . . . . . . . . . . . . . . . . . Combined Supplemental Schedule of Changes in Fund Net Position Information by Fund. . . . . . . . . . . . . . . . . . . . .... . . . . . . . . . . . . . . . . . . . . . . . . . . . . . . . . . . . . . . . . . . Supplemental Schedule of Net Position Information for Bond and Project Funds . . . . . . . . . . . . . . . . . . . . . . . . Supplemental Schedule of Changes in Net Position Information for Bond and Project Funds.. . . . . . . . . . . . . . . . . . . . . . . . . . . . . . . . . . . . . . . . . . . . . . . . . . . . . . . . . . . . . . . . . . . . . . . . . . . . . . . . .
2325
34363840
87
88
9091
92
Prepared by the Office of the Chief Financial Officer
Financial Trends: Net Position. . . . . . . . . . . . . . . . . . . . . . . . . . . . . . . . . . . . . . . . . . . Changes in Net Position. . . . . . . . . . . . . . . . . . . . . . . . . . . . .Revenue Capacity Data: Schedule of Major Revenues by Source.. . . . . . . . . . Schedule of Toll Revenue by Bridge.. . . . . . . . . . . . . . Schedule of Bridge Cash Toll Rates. . . . . . . . . . . . . . . Schedule of Bridge Traffic By Vehicle Classification. . . . . . . . . . . . . . . . . . . . . . . . . . . Schedule of Bridge Traffic By Bridge.. . . . . . . . . . . . . . Schedule of PATCO Transit System Operating Revenues.. . . . . . . . . . . . . . . . . . . . . . . . . . . . . . Schedule of PATCO Passenger Fares. . . . . . . . . . . . . . Schedule of PATCO Transit System Ridership. . . .Debt Capacity: Schedule of Debt Service Coverage.. . . . . . . . . . . . . . Schedule of Funded Debt. . . . . . . . . . . . . . . . . . . . . . . . . . . Schedule of Ratio of Debt per Customer. . . . . . . . . .
99
99
99
99
100
100101
101101101102
Demographic and Economic Data: Schedule of Economic Statistics for the Pennsylvania Port District. . . . . . . . . . . Schedule of Top Ten Employers in the Pennsylvania Port District. . . . . . . . . . . . Schedule of Economic Statistics for the New Jersey Port District. . . . . . . . . . . . . Schedule of Top Ten Employers in the New Jersey Port District. . . . . . . . . . . . . .Operating Information: Schedule of Bridge Operating Revenues. . Schedule of General Expenses By Function. . . . . . . . . . . . . . . . . . . . . . . . . . . . . . . . . . Schedule of Operating Statistics. . . . . . . . . . . . Schedule of Full-Time Authority Employees.. . . . . . . . . . . . . . . . . . . . . . . . . . . . . . . . . . Schedule of Capital Expenditures.... . . . . . . . Schedule of Capital Asset Statistics. . . . . . . . Schedule of Bridge & PATCO Operations. . . .
9595
969696
9797
979797
989898
Table of Contents
Comprehensive Annual Financial Report For Years Ended December 31, 2013 and 2012

4 DRPA 2013 Comprehensive Annual Financial Report

DRPA 2013 Comprehensive Annual Financial Report
Introductory Section
5
Introductory Section
Chairman’s Letter
July 26, 2014
To Our Customers and Bondholders:
In March of 2014, Pennsylvania Governor Tom Corbett appointed me to serve as chairman of the Board of Commissioners for the Delaware River Port Authority. As a life-long resident of Southeastern Pennsylvania, I understand how important the assets of the DRPA are to the local community. Whether crossing the bridges to head down the shore or riding PATCO to work, our bridges and train system provide vital lines of transportation to millions of travelers annually. Under my chairmanship, I will continue to follow Governor Corbett’s efforts to return the DRPA to its original core mission: Providing safe, reliable, customer-friendly transportation to the people of southeastern Pennsylvania and southern New Jersey. Under Gov. Corbett’s leadership, the DRPA has achieved tremendous accomplishments. The Authority has undertaken a complete overhaul of its PATCO train line that will include a completely refurbished fleet of train cars and a fully rehabilitated track crossing the Ben Franklin Bridge. In addition, the Authority has completed one of the largest capital projects in its history with the re-decking of the Walt Whitman Bridge. All of this was accomplished at the same time the Authority paid down more than $100 million in debt. I look forward to continuing this track record of success. The Authority’s four bridges carry an average of 258,000 vehicles each day. PATCO moves almost 40,000 passengers each workday, or an estimated 10.5 million each year; people who are vital to the success of the region’s economy. These figures demonstrate the public’s reliance on the Authority’s transportation infrastructure and we must look at all aspects of our operations as stewards of important transportation assets and other resources that we hold in trust for the public. I regard stewardship and public service as the root of our mission and purpose and we must focus on all aspects of caring for, maintaining, operating and protecting these assets. Safety and security is of paramount importance. I am committed to fostering changes that will strengthen the role we play in serving our customers, our employees, the community and the entire region. Excellence in stewardship begins with building credibility and trust and requires the commitment of every member of our organization to serve with openness, integrity and competence. I look forward to leading this effort and providing our customers with the safe and reliable interstate transportation.
Sincerely,
Hon. Jim Cawley Chairman, Delaware River Port Authority Lt. Governor, Commonwealth of Pennsylvania
Hon. Jim CawleyChairman, DRPA

6 DRPA 2013 Comprehensive Annual Financial Report
Introductory Section
Board of Commissioners
William R. SASSOBoard ChairmanStradley Ronon Stevens & Young
Pennsylvania
Andrew J. REILLYAttorneySwartz Campbell
Michelle KICHLINE, ESQ.Chester County
Hon. Robert M.MCCORDState TreasurerCommonwealth of Pennsylvania
Walter D’ALESSIOVice ChairmanNorthMarq Capital
Joann BELLGovernment Relations ExecutivePugliese Associates
Hon. Eugene DEPASQUALEAuditor GeneralCommonwealth of Pennsylvania
Hon. Jim CAWLEYChairmanLieutenant GovernorCommonwealth of Pennsylvania
HonorableTom CorbettGovernorCommonwealth of Pennsylvania

DRPA 2013 Comprehensive Annual Financial Report
Introductory Section
7
Jeffrey L. NASHVice ChairmanFreeholderCamden County Boardof Chosen Freeholders
Denise Y. MASONVice PresidentHSBC Bank USA
E. Frank DIANTONIOPresident Construction & General Laborers Union Local 172
Charles FENTRESSRetired Police SergeantDelaware River Port Authority
Albert F. FRATTALIBusiness ManagerReinforced Iron Workers Local 405
Tamarisk L. JONESDirector of Health and Senior ServicesGloucester County
Richard SWEENEYFinancial Secretary, Business RepresentativeIronworkers #399
Ricardo V. TAYLOR, JR.School AdministratorPennsauken Township
New Jersey
HonorableChris ChristieGovernorState of New Jersey

8 DRPA 2013 Comprehensive Annual Financial Report
Introductory Section
– All Legal – Claims Administration– Corporate Secretary Function
– Betsy Ross Bridge– Walt Whitman Bridge– Commodore Barry Bridge– Ben Franklin Bridge – Revenue Operations
– Fleet Operations
Organizational Chart
John T. HansonChief Executive Officer, DRPAPresident, PATCO
Michael J. Conallen, Jr.Deputy Chief Executive Officer
Danielle L. McNichol, Esq.General Counsel Corporate Secretary
Archer & GreinerNew Jersey Counsel
Duane Morris, LLPPennsylvania Counsel
James M. WhiteActing, Chief Financial Officer
Toni P. Brown, Esq.Chief Administrative Officer
Timothy M. PulteChief Operating Officer
Michael P. VenutoChief Engineer
Officers & Executive Staff
– Betsy Ross Bridge– Walt Whitman Bridge– Commodore Barry Bridge– Ben Franklin Bridge– Transit Unit
– Internal and External Audits– Whistleblower Hotline– Investigations (Non-EEO)
– Capital Planning– Special Projects– Real Estate
– Safety
– Planning/Design– Construction
& Maintenance– Engineering
Administration– Traffic Management– Port Projects Way & Power–
Equipment– Safety–
BOARD
Chief ExecutiveOfficer
General Counsel
Chief OperatingOfficer
Director, Government Relations Director, Corporate Communications & Community Relations
Deputy Chief Executive Officer
– Accounting– Budget– Revenue
– Revenue Audit– Purchasing (DRPA/PATCO)– Contract Administration
– Accounting– Payroll (DRPA/PATCO)– Budget– Analysis
Director, Finance
Director, Revenue
Director, PATCO Finance
– Systems Development– Production Systems
Director, Information
Services
– Transit Services
– Business Development– EEO– Customer Service– Mail Room– Printing Services– Benefits Administration
Chief Administrative Officer
– Personnel– Employee Training
Director, Engineering
Police Chief
Director, Emergency Management
& Homeland Security
PATCOGeneral Manager
Chief FinancialOfficer
Board AppointedTreasurer
Inspector General
Board AppointedCorporate Secretary
– Fare Collection– Passenger Services– Contracted Service (Freedom Call Center)
Director, PATCO Fare Collection
Operations
Thomas W. Raftery III Inspector General
John D. RinkPATCO General Manager
Bennett M. CorneliusPATCO Assistant General Manager
DeputyGeneral Counsel
Assistant General Manager
Director, Human Resource Services
Director, Risk Management & Safety
Directors,Bridges

DRPA 2013 Comprehensive Annual Financial Report
Introductory Section
9DRDRPAPA 22010133 CComprehhensiive AAnnu lal FFiinancial Repo
Benjamin Franklin BridgeOpened: July 1,1926
Walt Whitman BridgeOpened: May 16, 1957
Commodore Barry BridgeOpened: February 1, 1974
Betsy Ross BridgeOpened: April 30, 1976
PATCOOpened: February 15, 1969
RiverLink Ferry SystemAssumed operations on: April 1, 2000
Facilities

10 DRPA 2013 Comprehensive Annual Financial Report
Introductory Section

DRPA 2013 Comprehensive Annual Financial Report
Introductory Section
11
John T. HansonChief Executive Officer, DRPAPresident of PATCO
The Delaware River Port Authority (DRPA) and Port Authority Transit Corporation (PATCO) achieved a decrease in its 2013 operating budget, an accomplishment duly noted by our commissioners, the news media and our bondholders. Despite a nearly 70 percent jump in employee pension costs from 2012, our 2013 annual operating budget fell 6.3 percent to a total of $257.7 million.
We achieved those savings through several years of 1) aggressive cost-cutting, 2) prudent, strategic financial management, and 3) identifying and implementing operating efficiencies
The DRPA, for example, has saved $4 million over last year – and is on-track to save approximately $6 million in 2014 – by restructuring the letters of credit that support our 2008 and 2010 revenue refunding bonds. The DRPA also cut interest costs by restructuring $196 million in outstanding debt late in 2012. Interest-related savings in 2013 alone amounted to about $11 million.
Wall Street rewarded these cost-cutting measures. On Nov. 25, Standard & Poor’s raised its rating on Delaware River Port Authority bonds to “A” from “A-.” S&P also assigned its long-term “A” rating to the DRPA series 2013, $476.6 million revenue bonds and declared a “stable” outlook for DRPA securitized debt. In addition, Moody’s affirmed our “A3” bond rating and declared a “stable” financial outlook for the DRPA, while S&P upgraded DRPA Port District Project Bonds from BBB- to BBB, stable outlook.
For all of the returns produced through strategic financial management and aggressive cost-cutting, our progress in identifying and implementing operating efficiencies has proved important, too.
During the last year, project teams from the DRPA and PATCO completed a Lean Six Sigma™ pilot initiative that helped reduce process defects and waste. In addition, a newly established DRPA Strategic Planning Committee evaluated and integrated best practices and recommendations made in the 2012 management audit report.
Report of theChief Executive Officer

12 DRPA 2013 Comprehensive Annual Financial Report
Introductory Section
Efficiency also prevailed as we made solid progress toward completion of several of the largest capital projects in DRPA history.
On Oct. 30, all seven lanes of the Walt Whitman Bridge opened to motor vehicle traffic for the first time in four years. Although minor work related to completing the construction still remained, the $140 million bridge re-decking project reached its final customer-facing milestone on-time and under budget.
At PATCO, work continues on our $194 million rail car overhaul program. The first set of the newly refurbished “prototype” rail cars have been delivered from the Alstom plant in Hornell, N.Y. and are currently undergoing required testing. All 120 rail cars are scheduled to be completed by the fourth quarter of 2016
PATCO and the DRPA will also continue a $103 million project to rehabilitate the north and south passenger rail tracks crossing the Delaware River on the Benjamin Franklin Bridge. Plans call for the replacement of wood ties, running rails, electrical cabling and information/switching systems and supporting steel trusses by the end of 2015.
While proud of our work, we understand that progress is no cause for complacency. In order to deliver optimal results, we must continue to build and strengthen our leadership capacity, enhance the skills and knowledge base of our workforce, improve communications and performance, and maintain an engaged, motivated team.
We need to adopt a holistic and proactive approach to stewardship of the important transportation assets that we hold in trust for our community. We are focused on all aspects of caring for these assets and operating, maintaining, improving and protecting them is our priority. We need to look critically at how well our organization anticipates and satisfies customer needs. We must apply more creativity, energy and efficiency to improving our stewardship of public assets, and carefully consider the investments in equipment, infrastructure and human resources that will be necessary to make this goal a reality.
Our four bridges carry an average of 258,000 vehicles each day. PATCO moves almost 40,000 passengers each workday, or an estimated 10.5 million each year; people who are vital to the success of the region’s businesses and economy. These figures demonstrate the public’s reliance on the Authority’s transportation infrastructure and we must look at all aspects of our operations at the bridges, PATCO and One Port Center from this new perspective – as stewards of public assets - and work together to make changes that will strengthen the role we play in serving our customers, our employees, the community and the entire region.
We will meet these challenges with a renewed commitment to stewardship and to building credibility and earning the trust of those we serve. Prepared to capably manage the tasks ahead, we look forward to a successful 2014.
Yours truly,
John T. Hanson Chief Executive Officer, Delaware River Port Authority President, Port Authority Transit Corporation

DRPA 2013 Comprehensive Annual Financial Report
Introductory Section
13RPA 2013 Comprehensive Annual Financial Report 1

14 DRPA 2013 Comprehensive Annual Financial Report
Introductory Section

15DRPA is an equal opportunity employer
Mailing Address: PO Box 1949 Camden New Jersey 08101-1949 Telephone: (856) 968-2000
DELAWARE RIVER PORT AUTHORITY of Pennsylvania & New Jersey
TO THE BOARD OF COMMISSIONERSOF THE DELAWARE RIVER PORT AUTHORITY
The comprehensive annual financial report of the Delaware River Port Authority (“the Authority”) for the year ended December 31, 2013, is hereby submitted. Responsibility for both the accuracy of the data and the completeness and fairness of the presentation, including all disclosures, rests with the Authority. To the best of our knowledge and belief, the enclosed data is accurate in all material respects and is reported in a manner designed to present fairly the combined financial position and results of operations of the Authority. All disclosures necessary to enable the reader to gain an understanding of the Authority’s financial activities have been included.
The Authority’s Indentures of Trust require an annual audit of the Authority’s financial statements by a firm of independent auditors. Additionally, as a recipient of funds from the Federal Transit Administration for projects involving the PATCO Transit System, the Authority is required to have a single audit performed annually by an independent auditor in accordance with the Single Audit Act of 1984, as amended in 1996, and OMB Circular A-133. The purpose of the single audit is to determine the adequacy of the Authority’s internal controls and compliance with applicable laws and regulations relating to the receipt of federal assistance. The Authority retains an independent auditor to satisfy these audit requirements. The report of the independent auditor on the combined financial statements of the Authority is included in the financial section of this report. The Authority’s management is responsible for the content and presentation of the audited financial report.
Management of the Authority is responsible for establishing and maintaining a system of internal control designed to ensure that the assets of the Authority are protected from loss, theft or misuse and to ensure that adequate accounting data is compiled to allow for the preparation of financial statements in conformity with Generally Accepted Accounting Principles (GAAP) in the United States. The internal controls are designed to provide reasonable, but not absolute, assurance that these objectives are met. The concept of reasonable assurance recognizes that: (1) the cost of a control should not exceed the resulting benefits; and (2) the analysis of costs and benefits requires estimates and judgments by management.
In addition, as a recipient of federal financial assistance, the Authority is required to ensure that adequate internal controls are in place to ensure compliance with applicable laws and regulations relating to that federal assistance. These internal controls are subject to periodic evaluation by the Office of the Inspector General and by the management of the Authority.
The combined financial statements of the Authority are prepared using the accrual method of accounting in accordance with GAAP. Management has provided a narrative
June 30, 2014

16 DRPA 2013 Comprehensive Annual Financial Report
Introductory Section
introduction, overview, and analysis to accompany the basic financial statements in the Management’s Discussion and Analysis (MD&A). This letter of transmittal is designed to complement the MD&A and should be read in conjunction with it. The Delaware River Port Authority’s MD&A can be found immediately following the report of the independent auditors.
The Delaware River Port Authority is a public corporate instrumentality of the Commonwealth of Pennsylvania and the State of New Jersey created with the consent of Congress by compact legislation between the Commonwealth of Pennsylvania and the State of New Jersey. The Authority, which has no stockholders or equity holders was created in 1952 as a successor to the Delaware River Joint Commission which was created in 1931. The Authority is governed by a 16-member Board of Commissioners. The Governor of New Jersey appoints eight commissioners with the advice and consent of the Senate of New Jersey. The Governor of Pennsylvania appoints six commissioners, with the Auditor General and the State Treasurer of Pennsylvania serving as ex-officio commissioners for Pennsylvania. Commissioners serve five-year terms without compensation. The Board of Commissioners establishes policy and plans for the operations of the Authority. A Chief Executive Officer is appointed by the Board of Commissioners to implement policy and to manage the daily operations of the Authority.
The Board of Commissioners of the Delaware River Port Authority has five committees established under the authority of its Bylaws. They are: the Operations and Maintenance Committee, Projects Committee, Executive Committee, Finance Committee, and Export Development and International Trade Committee. These committees adhere to the rules and leadership structure outlined in Article IX of the DRPA Bylaws. These Committees act pursuant to the power vested under the bylaws.
The Board of Commissioners of the Delaware River Port Authority has also established, under the authority of resolution DRPA-10-040, an Audit Committee that is chaired by the Auditor General of Pennsylvania. The Audit Committee is charged with overseeing an independent financial, forensic and performance audit. The Board of The Delaware River Port Authority also adopted an Audit Committee charter through resolution DRPA-10-141. This resolution specifies that the purpose of the Audit Committee is to assist the board in fulfilling its oversight responsibility relating to: (1) the Authority’s internal and external audit process, the financial reporting process, and the risk assessment and internal controls over financial reporting; (2) Compliance with applicable laws, policies, and accounting and auditing standards, and (3) Communication between the Authority’s management, internal and external auditors, experts, other advisors, and the Board.
The Audit Committee adheres to the rules and leadership structure outlined in resolutions DRPA-10-040 and DRPA-10-141. The Audit Committee acts pursuant to the power vested under these two resolutions. It is not vested with any power under the bylaws.
In addition, to the aforementioned committees, the Board of Commissioners adopted resolutions DRPA 10-10-071 and DRPA 12-112, which established the Compensation and Labor Committees, respectively, to review the Authority’s compensation issues and current labor agreement, labor/employee relations and non-represented employee issues. These committees, similar to the Audit Committee, act pursuant to the power vested under these two authorizing resolutions and are not vested with any power under the bylaws.

DRPA 2013 Comprehensive Annual Financial Report
Introductory Section
17
The Authority is vested with the ownership, control, operation, and collection of tolls and revenues of certain bridges spanning the Delaware River; namely, the Benjamin Franklin, Walt Whitman, Commodore Barry and Betsy Ross bridges. The Authority has also constructed and owns a high-speed transit system which is operated by its wholly owned subsidiary, the Port Authority Transit Corporation (PATCO). The transit system operates between Philadelphia, Pennsylvania and Lindenwold, New Jersey. The Authority’s Office of the Chief Operating Officer manages the RiverLink Ferry System which runs daily between Penn’s Landing in Philadelphia and the Camden Waterfront during the months of May through September.
BUDGET PROCESSThe Authority prepares both operating and capital budgets annually. The annual operating
budget is a financial planning tool for the associated fiscal year; it also sets the maximum spending limit for the Authority. Each of the Authority’s Chief Officers and staff contribute to the development of a preliminary operating budget based on the expected staffing and funding levels necessary to operate the Authority’s facilities in an efficient and safe manner. After individual departmental budgets are reviewed at budget hearings conducted by the Operating Budget Review Committee, (which consists of the Chief Executive Officer, Deputy Chief Executive Officer, Chief Financial Officer, Chief Operating Officer, General Counsel, the General Manager of PATCO and other senior staff), a proposed operating budget is presented by the Chief Executive Officer to the Finance Committee and ultimately to the Board of Commissioners for its review and approval. Any subsequent addition of funds to the total operating budget requires the approval of the Board of Commissioners.
A five-year capital budget is also prepared through a similar process and submitted to the Finance Committee, and subsequently to the Board of Commissioners for approval. The capital budget is a planning document identifying the Authority’s potential commitments. The approval of the capital budget does not in itself authorize any specific project. Specific approval by the Board of Commissioners is required before any capital project may commence. The foundation for the major capital budget projects (those projects greater than $200K) is the biennial inspection which inspects all four bridges and PATCO. This inspection is required by the 1998 Revenue Bond Indenture. Smaller capital projects are identified by various operating and administrative departments.
Expenditures are monitored continuously throughout the year by the Finance Division to ensure that each department is in compliance with the approved operating budget and the established Policies and By-Laws of the Authority.
A Master Plan, detailing Port District and economic development projects, is distributed to the States, county and municipal governments, commissions, public corporations and authorities, and the private sector, when prepared by the Authority. The last update to the Master Plan was made in early 2013. When updated, the Authority approves amendments to each Master Plan as necessary to facilitate the implementation of new projects within the Port District. Updates and amendments to the Master Plan are approved through the Board of Commissioners.
In accordance with the Authority’s governing Revenue and Port District Project Bond Indentures, the next year’s annual budget must be submitted to the respective bond trustees by December 31 of each year.

18 DRPA 2013 Comprehensive Annual Financial Report
Introductory Section
FACTORS AFFECTING FINANCIAL CONDITIONDuring the past several years, the Authority has taken significant strategic steps to
strengthen its financial position through: cost-containment of personnel and non-personnel expenditures, increasing its liquidity through growth in its General Fund, and restructuring its debt and swap portfolios. The latter policy is primarily in response to: changing financial markets, the exercise of various swaptions (in 2006, 2008 and 2010), passage of a board resolution mandating the liquidation of the Authority’s swap portfolio in an orderly and strategic fashion, the necessity of funding its various annual five-year Capital Programs, and the adoption of a 2012 Finance Action plan by the Authority’s Board of Commissioners. (which was implemented in 2012 and 2013).
The implementation of the aforementioned strategic initiatives were key factors in the ratings upgrade by Standard and Poor’s on all of the Authority’s bonds in late November 2013, just prior to the issuance of the new 2013 revenue bonds. In addition, in November 2013, Moody’s Investor Services also increased the outlook on all of the Authority’s bonds to “positive.”
DEBT MANAGEMENTIn 2012, the Authority’s Board approved a comprehensive finance plan to: use the
Authority’s General Fund for the early redemption of up to $120 million of its fixed-rate debt, reduce the costs of its underlying letters of credit (on its 2008 and 2010 Revenue Refunding Bonds), and refund a large portion of its Port District Project Bond debt. The Authority successfully took actions to pay down approximately $96 million in Revenue Bond and Port District Project Bond debt in April 2012, substantially reducing its 2012 debt service and improving its debt coverage ratio on its senior debt. In addition, the Authority executed the second part of its finance plan by issuing $153 million in Port District Project Refunding Bonds, Series 2012, to refund and redeem all of the outstanding principal balance and interest accrued on the Authority’s outstanding Port District Project Bonds, Series B of 1998, Series B of 1999 and Series A of 2001. As a result of these actions, the par amount of the Authority’s Port District Bond debt decreased from approximately $315 million to approximately $187 million.
In 2013, the Authority continued the execution of its financial plan by significantly reducing its Direct Pay Letter of Credit (DPLOC) facility costs for its 2008 and 2010 Revenue Refunding Bonds.
In March, the Authority entered into new DPLOCs with three (3) new banks for its 2010 Revenue Refunding Bonds. Annual letter of credit facility fees, which formerly ranged from 1.35% to 1.675%, were reduced to a range of 0.45% to 0.70%, resulting in an estimated $4 million partial-year reduction in overall fees. (The full year impact of these reduced facility fees for 2014 will be approximately $6 million.) In June, the Authority renewed its DPLOC agreements with its two (2) existing banks, and, as a consequence reduced its facility fees from 1.35% to 0.65% to 0.70%.

DRPA 2013 Comprehensive Annual Financial Report
Introductory Section
19
In August 2013, the Authority’s Board authorized the issuance of up to $550 million in new revenue bonds, to fund a significant portion of its existing 2013 Capital Program. In late December, the Authority issued new revenue bonds (the 2013 Revenue Bonds), at attractive fixed rates, in the amount of $476.6 million. The bonds were issued at a premium netting the Authority an additional $11.8 million in proceeds.
With this issuance, the Authority reimbursed its General Fund, which had been used to fund the capital program for the sixteen (16) month period from August 2012 through November 2013, in the amount of $101.3 million. The Authority’s total bond debt increased to $1.6 billion at year-end, up from $1.2 billion at the prior’s year end.
LOCAL ECONOMYFrom the latest data available, it appears that population growth increased slightly in the
Pennsylvania and New Jersey counties within the Port District since 2011. The unemployment rate in the the Pennsylvania counties has decreased slightly while increasing slightly in the New Jersey counties since 2011. Additional information can be found in the Statistical Section of this report.
LONG-TERM FINANCIAL PLANNINGAn important component of the Authority’s long-term financial plan is ensuring that it has
sufficient revenue to meet its operating and capital requirements. With assistance from its Financial Advisors, the Authority uses a long-term forecasting model, which creates a multi-year forecast of its revenues and expenses. The model incorporates numerous independent variables (including operating revenue and expense estimates, debt service coverages and capacity, etc.) in order to determine the annual cash flow required to create sufficient bonding capacity to finance its five-year capital plan. Results from a traffic engineering study, completed in November 2013, which contains projections for a ten-year period, were incorporated into this model for use in developing forecasts for the 2013 revenue bond issue, later in the year.
As mentioned in the “Budget Process” section of this document, each year, the Authority develops a five-year capital plan which details the anticipated capital expenditures during this five-year period. The 2014 Capital Plan, developed, during the year, and approved in December 2013, outlined numerous bridge, transit system, security and technology project expenditures approaching $746.2 million (net of federal funding), for the five-year period commencing in 2014. As of December 31, 2013, the Authority had funded approximately $3.6 million in capital expenditures using the new bond project funds.
BRIDGE TOLL AND PASSENGER FARE SCHEDULESThere have been no changes to the Authority’s bridge toll and passenger fare schedules
since July 2011. Please see Note 18 for the current toll and fare schedules.

20 DRPA 2013 Comprehensive Annual Financial Report
Introductory Section
AWARDS AND ACCOMPLISHMENTSThe Government Finance Officers Association of the United States and Canada (GFOA)
awarded a Certificate of Achievement for Excellence in Financial Reporting to the Delaware River Port Authority for its comprehensive annual financial report for the fiscal year ended December 31, 2012. This was the twenty-first consecutive year that the Authority has achieved this prestigious award. In order to be awarded a Certificate of Achievement, a government must publish an easily readable and efficiently organized comprehensive annual financial report. This report must satisfy both GAAP and applicable legal requirements and employ best practices identified by the GFOA.
A Certificate of Achievement is valid for a period of one year only. We believe our current comprehensive annual financial report continues to meet the Certificate of Achievement Program’s requirements and we are submitting it to GFOA to determine its eligibility for another certificate.
The preparation of this report would not have been possible without the dedication and efficiency of the entire staff of the Finance, Administrative Services and Government & Corporate Communications Departments. I would especially like to express my appreciation to the members of these Departments who contributed to the preparation of this report. Special thanks must also be given to the Chairman, Vice-Chairman, Chief Executive Officer, Deputy Chief Executive Officer and the Finance and Audit Committees of the Board for maintaining the highest standards in the management of the Delaware River Port Authority’s finances. Special thanks also to the DRPA Inspector General Thomas W. Raftery III for his leadership in facilitating this financial audit.
Respectfully submitted,
James M. White, Jr. Acting Chief Financial Officer

Financial Section

Financial Section

Independent Auditor's Report
To the Board of Commissioners Delaware River Port Authority
Report on the Financial Statements We have audited the accompanying combined financial statements of Delaware River Port Authority and subsidiary, which comprise the combined statements of net position as of December 31, 2013 and 2012, and the related combined statements of revenues, expenses, and changes in net position and cash flows for the years then ended, and the related notes to the combined financial statements.
Management’s Responsibility for the Financial Statements Management is responsible for the preparation and fair presentation of these combined financial statements in accordance with accounting principles generally accepted in the United States of America; this includes the design, implementation, and maintenance of internal control relevant to the preparation and fair presentation of combined financial statements that are free from material misstatement, whether due to fraud or error.
Auditor’s Responsibility Our responsibility is to express an opinion on these combined financial statements based on our audits. We conducted our audits in accordance with auditing standards generally accepted in the United States of America. Those standards require that we plan and perform the audit to obtain reasonable assurance about whether the combined financial statements are free from material misstatement.
An audit involves performing procedures to obtain audit evidence about the amounts and disclosures in the combined financial statements. The procedures selected depend on the auditor’s judgment, including the assessment of the risks of material misstatement of the combined financial statements, whether due to fraud or error. In making those risk assessments, the auditor considers internal control relevant to the entity’s preparation and fair presentation of the combined financial statements in order to design audit procedures that are appropriate in the circumstances, but not for the purpose of expressing an opinion on the effectiveness of the entity’s internal control. Accordingly, we express no such opinion. An audit also includes evaluating the appropriateness of accounting policies used and the reasonableness of significant accounting estimates made by management, as well as evaluating the overall presentation of the combined financial statements.
We believe that the audit evidence we have obtained is sufficient and appropriate to provide a basis for our audit opinion.
OpinionIn our opinion, the combined financial statements referred to above present fairly, in all material respects, the net position of the Delaware River Port Authority and subsidiary as of December 31, 2013 and 2012, and the changes in net position and cash flows for the years then ended in accordance with accounting principles generally accepted in the United States of America.
Emphasis of Matter As discussed in Note 21 to the financial statements, Delaware River Port Authority adopted the provisions of Governmental Accounting Standards Board (GASB) Statement No. 65, Items Previously Reported as Assets and Liabilities. Our opinion is not modified with respect to this matter.
McGladrey LLP
Member of the RSM International network of independent accounting, tax and consulting firms. 23

24 DRPA 2013 Comprehensive Annual Financial Report
Other Matters
Required Supplementary Information
Accounting principles generally accepted in the United States of America require that management’s discussion and analysis and the schedule of funding progress for health benefits be presented to supplement the combined financial statements. Such information, although not a part of the combined financial statements, is required by the Governmental Accounting Standards Board, who considers it to be an essential part of financial reporting for placing the combined financial statements in an appropriate operational, economic, or historical context. We have applied certain limited procedures to the required supplementary information in accordance with auditing standards generally accepted in the United States of America, which consisted of inquiries of management about the methods of preparing the information and comparing the information for consistency with management’s responses to our inquiries, the combined financial statements, and other knowledge we obtained during our audit of the combined financial statements. We do not express an opinion or provide any assurance on the information because the limited procedures do not provide us with sufficient evidence to express an opinion or provide any assurance.
Other Information
Our audits were conducted for the purpose of forming an opinion on the combined financial statements as a whole. The supplemental schedules on pages 88 to 92 and the introductory and statistical sections are presented for purposes of additional analysis and are not a required part of the combined financial statements.
The supplemental schedules on pages 88 to 92 are the responsibility of management and were derived from and relates directly to the underlying accounting and other records used to prepare the combined financial statements. Such information has been subjected to the auditing procedures applied in the audit of the combined financial statements and certain additional procedures, including comparing and reconciling such information directly to the underlying accounting and other records used to prepare the combined financial statements or to the combined financial statements themselves, and other additional procedures in accordance with auditing standards generally accepted in the United States of America. In our opinion, the information is fairly stated, in all material respects, in relation to the combined financial statements as a whole.
The introductory and statistical sections have not been subjected to the auditing procedures applied in the audit of the combined financial statements, and accordingly, we do not express an opinion or provide any assurance on them.
Blue Bell, Pennsylvania June 30, 2014

Financial Section
DRPA 2013 Comprehensive Annual Financial Report 25
As management of the Delaware River Port Authority (the Authority), we offer readers of our fi nancial statements this narrative overview and analysis of the fi nancial activities of the Authority for the years ended December 31, 2013 and 2012. We encourage readers to consider the information presented here in conjunction with additional information that we have furnished in our letter of transmittal, which can be found on pages 15-20 of this report. All amounts, unless otherwise indicated, are expressed in thousands of dollars.
FINANCIAL HIGHLIGHTS (IN THOUSANDS)
• Operating revenues were $328,124 in 2013, an increase of $724 or 0.22% over 2012. The increase was primarily related to the slight increase in toll revenues.
• The $1,053 increase in toll revenues (up 0.36%) during the year was primarily attributable to higher commercial vehicle volume and reduced automobile volume resulting in an average toll increase from $6.0901 in 2012 to $6.1375 in 2013.
• Bridge traffic decreased by 0.2 million vehicles (down 0.42%) during the year 2013.Traffic on the bridges was largely impacted by general economic conditions in the region and one less day of operation in 2013 vs. 2012 (due to leap year in 2012).
• The Port Authority Transit Corporation (PATCO) is a wholly-owned subsidiary of the Delaware River Port Authority (DRPA) and is subsidized by the Delaware River Port Authority. Operating expenses exceeded operating revenues for PATCO by $16,749 in 2013 and by $14,222 in 2012. The operating loss increased by $2,527 from 2013 to 2012, an increase of 17.7%.
• PATCO passenger fare revenues decreased by 0.49%, primarily resultant from the impact of decreased PATCO ridership of 70,514 (down 0.66%). Net fare revenues decreased by $127,000, or by 0.49%.
• Total “non-restricted” investments increased by $101.8 million, an increase of 34.1%. This significant increase primarily was related to the increase in the General Fund balances. General Fund cash equivalents and investment balances increased by $128,681 (up 44.9%) to total $415,390 at year end. The General Fund increase was largely due to the reimbursement of $101.3 million in funds which were used to fund capital expenditures from the period August 2012 through November 2013.
Management’s Discussion & Analysis(Unaudited)

Financial Section
26 DRPA 2013 Comprehensive Annual Financial Report
FINANCIAL POSITION SUMMARY
A large portion of the Authority’s net position are capital assets (e.g., land, buildings, machinery, and equipment), less any related debt used to acquire those assets that is still outstanding. The Authority uses these capital assets mainly to provide bridge facilities and transit services to customers; consequently, these assets are not available for future spending. Although the Authority’s investment in its capital assets is reported net of related debt, it should be noted that the resources needed to repay this debt must be provided from other sources, since the capital assets themselves cannot be used to liquidate these liabilities.
• Total “restricted investments for capital projects” (revenue bond project funds) increased by $345.2 million, attributable to the Authority’s receipt of $348.8 million in net proceeds (after all closing costs and reimbursements to the General Fund) from the new revenue bond issue. (At year-end 2012, the Authority had exhausted its project funds from the 2010 revenue bond issue). At year-end, the bond project fund balance was $345.2 million.
• Bridge and general administration expenses decreased by a combined $8,628 or by 8.6% vs. 2013 expenses. The reduction is principally attributable to the decrease in biennial inspection costs in 2013 v. 2012 (there was no biennial inspection in 2013) and significantly lower letter of credit costs.
• The Authority’s total debt increased by $466,927 or by 39.3% during the current year, as the Authority issued $476.6 million in new revenue bonds to fund a significant portion of its five-year Capital Plan.
• During 2013, the Authority renewed and restructured its Direct Pay Letter of Credit facilities with its five (5) banks, in March and July. As a result, letter of credit costs dropped by approximately $4 million during the year. (The full year impact will reduce such costs by over $6 million).
• Economic development expenditures totaled $4,371 in 2013, a decrease in such expenditures of $4,324 vs. 2012 (a 49.7% decrease) vs. 2012 activity. The Authority’s economic development spending now reflects only previously committed projects, as
• the Authority’s Board approved a discontinuation of any new economic development projects in 2010.
• The assets of the Authority exceeded its liabilities at the close of 2013 resulting in net position of $511,389. Net position increased by $92,560 during the year.
• Debt service coverage for revenue bond debt (as calculated based on the 1998 Bond Indenture) increased to 3.28 times from 2.81 times in 2012, as net revenues available for debt service increased by $8.8 million and senior debt service decreased by $7.5 million.

Financial Section
DRPA 2013 Comprehensive Annual Financial Report 27
Summary of Changes in Net Position
Operating revenues Operating expenses Excess before depreciation and other non-operating income and expenses Depreciation Operating income Non-operating loss and expenses, net Income before capital contributions Capital contributions Change in net position
Delaware River Port Authority’s Net Position
Current and other assets Capital assets Total assets Deferred outfl ows of resources Long-term liabilities outstanding Other liabilities Total liabilities Net position: Net investment in capital assets Restricted Unrestricted (defi ciency) Total net position
Restatement of balances Net position, January 1, 2012 as previously stated Cumulative effect of adoption of GASB No. 65 Net position, January 1, 2012 as restated
In 2013, net position increased in the amount of $92,560. The main factors impacting this increase include: continued strong operating revenues, a decrease in operating expenses, resulting in net income before capital contributions of $74.9 million (up from net income of $61.1 million in 2012). In 2012, net position increased in the amount of $86,131. Factors impacting this increase include: signifi cantly higher revenues and a signifi cant decrease in non-operating expenses (which includ-ed an $11.3 million reduction in interest expense from 2011).
For comparative purposes, net position as of January 1, 2011 was decreased by $9,429 for the cumulative effect of adoption of GASB No. 65. Net position as of January 1, 2011 decreased from $286,929 to $277,500.
2013
$1,023,5861,273,4542,297,040
129,0291,823,498
91,1821,914,680
213,138159,521138,730
$511,389
2013
$328,124(140,118)
188,006(54,801)133,205(58,318)74,88717,673
$92,560
2012(Restated)$494,3191,240,9281,735,247
183,9511,430,965
69,4041,500,369
272,905143,692
2,232 $418,829
2012(Restated)$327,400(146,498)
180,902(55,018)125,884(64,795)61,08925,042
$86,131
2011(Restated)$650,0241,177,8911,827,915
189,9121,582,842
102,2871,685,129
214,632185,219(67,153)
$332,698
2011(Restated)$299,548(138,601)
160,947(49,216)111,731(89,554)22,17733,021
$55,198
$341,281(8,583)
$332,698)

Financial Section
28 DRPA 2013 Comprehensive Annual Financial Report
REVENUE SUMMARYSummary of revenues for the year ended December 31, 2013 and the amount and percentage change in relation to prior year amounts is as follows:
Operating: Bridge tolls PATCO passenger fares Other Cruise Terminal Total operating Non-Operating: Investment income Other Other grant revenues Capital contributions
Total Revenues (before change in fair value)Change in fair value of derivativesTOTAL REVENUES
2013Amount$293,863
25,9088,353
-328,124
5,58149
2,77617,673
$354,203(953)
$353,250
Percentof Total
80.77%7.18%2.36%0.00%
90.31%
1.60%0.01%1.17%6.91%
100.00%- -
Increase/(Decrease)From 2012
$1,053(127)(200)
(2)724
(222)5
(1,456)(7,369)
($8,318)(2,788)
($11,106)
PercentIncrease
(Decrease)0.36%
-0.49%-2.34%
-100.00%0.22%
-3.83%11.36%
-34.40%-29.43%
-2.29%-151.93%
-3.05%
• Total revenues in 2013 decreased by $11,106, or by 3.05%, primarily due to the decrease in non-operating revenues capital contributions and other grants revenues, which decreased by $7.4 million and by $1.5 million, respectively.
• Total operating revenues in 2013 increased slightly by 0.22%, due to an increase in bridge toll revenue.
• Bridge toll revenue increased by $1.1 million, or by 0.36% during 2013 (Bridge tolls accounted for almost 81% of total revenues.) In 2013, traffi c decreased by 0.42% but revenue increased $1,053 due to a higher average toll.
• The year-to-year average toll rate increase, from $6.0901 to $6.1375, refl ects a slight increase of commercial vehicle traffi c and a small decrease in automobile traffi c.
• PATCO passenger fare revenues de-creased by 0.49%, primarily resultant from the impact of decreased PATCO ridership of 71 thousand (0.67%).
2012Amount$292,810
26,0358,553
2327,400
5,80344
4,23225,042
$362,2511,835
$364,356
Bridge Tolls,80.77%
PATCOFares, 7.18%
Other GrantRevenues,1.17%
Other, 2.37%PPC, 0.00%
InvestmentIncome,1.60%
CapitalContributions,
6.91%
REVENUES BY SOURCE

Financial Section
DRPA 2013 Comprehensive Annual Financial Report 29
• Bridge and General Administration (G&A) expenses for DRPA operations decreased by a combined $8,628 (or 8.58%) versus 2012. Major factors impacting the reduced expenses include: signifi cantly lower biennial inspection costs and letter of credit facility fees.
• PATCO operational expenses increased by $2,138 (or by 5.06%), primarily attributable to an increase in purchased power usage, expenses relating to the general liability reserve and payroll-related expenses.
• Total operating expenses decreased by $6,597 or 3.27%, attributable to the decrease in Bridge and General Administration (as cited above) and depreciation expenses.
• Economic development expenditures totaled $4,371 in 2013, a decrease of $4,324 (or 49.7%) from expenditures in 2012. The decrease refl ects the funding of previously authorized projects committed to prior to the Authority’s discontinuation of any new economic development projects beyond 2010.
• Total non-operating expenses decreased by $10,938, attributable to lower interest expense payments (down $7,756) and the decrease in economic development activities (down $4,324).
• Total expenses decreased by $17,535 largely attributable to the large decreases in both total DRPA operating expenses and non-operating expenses cited above.
EXPENSE SUMMARYA summary of expenses for the year ended December 31, 2013 and the amount and percentage change in relation to prior year amounts is as follows:
Operating: Bridge PATCO General Administration Other River Link Ferry Depreciation Total operating Non-Operating: Interest Expense Bond Issuance Costs Amortization Economic Development Total Non-Operating TOTAL EXPENSES
2013Amount
$53,04244,39438,932
3,68862
54,801194,919
58,7842,516
1004,371
65,771$260,690
Percentof Total
20.24%15.19%15.91%
1.30%0.01%
19.77%72.43%
23.92%0.49%0.04%3.13%
27.57%100.00%
Increase/(Decrease)From 2012
($3,283)2,138
(5,345)7733
(217)(6,597)
(7,756)1,142
-(4,324)
(10,938)($17,535)
PercentIncrease/(Decrease)
-5.83%5.06%
-12.07%2.13%
113.79%-0.39%-3.27%
-11.66%83.11%0.00%
-49.73%-14.26%
-6.30%
2012Amount
$56,32542,25644,277
3,61129
55,018201,516
66,5401,374
1008,695
76,709$278,225
Bridge, 20.24%
PATCO, 15.19%
GeneralAdministration,
15.91%Other, 1.30%
RiverLink Ferry,0.01%
Depreciation,19.77%
InterestExpense ,23.92%
Bond IssuanceCosts, 0.49%
Amortization,0.04%
EconomicDevelopment,
3.13%
EXPENSES BY SOURCE

Financial Section
30 DRPA 2013 Comprehensive Annual Financial Report
SUMMARY OF CASH FLOW ACTIVITIESThe following shows a summary of the major sources and uses of cash and cash equivalents. Cash equivalents are considered highly liquid investments with a maturity of three months or less.
Cash fl ow from operating activities Cash fl ow from non-capital fi nancing activities Cash fl ow from capital and related fi nancing activities Cash fl ow from investing activities Net increase (decrease) in cash and cash equivalents Cash and cash equivalents, beginning
Cash and cash equivalents, ending
Capital Assets and Debt Administration
Capital Assets. The Authority’s investment in capital assets for its activities through December 31, 2013 amounted to $1,273,454 (net of accumulated depreciation), an increase of $32,526 over the previous year. This investment in capital assets includes land, bridges, transit system, port enhancements, buildings and machinery. The total percentage increase in the Authority’s investment in capital assets for the current year was 2.62%.
Major capital asset events during the current year included the following:• Redecking suspended span and anchorage spans work at the
Walt Whitman Bridge in the amount of $29,109.• PATCO track rehabilitation across the Ben Franklin Bridge in the amount of $5,097. • PATCO transit car overhaul in the amount of $12,802• Replacement of PATCO pole line and power cable in the amount of $5,346.
2013$186,605
(2,149)336,339
(496,165)
24,6305,899
$30,529
2012$186,336
(696)(338,655)153,002
(13)5,912
$5,899
2011$168,451
2,653(235,361)
63,932
(325)6,237
$5,912

Financial Section
DRPA 2013 Comprehensive Annual Financial Report 31
Delaware River Port Authority’s Capital Assets(Net of depreciation)
Land Construction in progress Bridges and related buildings and equipment Transit property and equipment Port enhancements Total
Additional information on the Authority’s capital assets can be found in Note 7 on page 53 of this report.
Long-term debt. In late December, the Authority issued new revenue bonds (the 2013 Rev-enue Bonds), at attractive fi xed rates, in the amount of $476.6 million. With this issuance, the Authority reimbursed its General Fund, which had been used to fund the capital program, for the sixteen (16) month period from August 2012 through November 2013, in the amount of $101.3 million. The Authority’s total bond debt increased to $1,654,715 (shown below by issue) at year-end, up from $1,187,788 at the prior’s year end. Of this amount, $1,450,720 (or 87.7%) represents revenue bond debt backed by toll revenue from the Authority’s bridg-es. The remaining debt of $203,995 represents subordinated obligations of the Authority. The Authority’s debt portfolio consists of $1,000,205 (or 60.4%) in fi xed-rate debt, with the remaining $654,510 in variable rate mode; the variable rate debt is backed by fi ve (5) direct-pay bank letters of credit, from several banks.
2011$74,225241,748600,506258,971
2,441$1,177,891
2013$74,225290,453634,795271,767
2,214$1,273,454
2012$74,225304,030604,153256,381
2,139$1,240,928
Delaware River Port Authority’s Outstanding Debt(Revenue, Revenue Refunding, Port District Project and Port District Refunding Bonds)
1998 Port District Project Bonds 1999 Revenue Bonds 1999 Port District Project Bonds 2001 Port District Project Bonds 2008 Revenue Refunding Bonds 2010 Revenue Refunding Bonds 2010 Revenue Bonds 2012 Port District Project Refunding Bonds 2013 Revenue Bonds Total (net of amortizing premium and discount and loss on refunding)
2011$58,005
41,335143,341113,124335,380350,000307,804
- -
$1,348,989
2013$ -
- 31,080
- 304,510350,000307,854172,915488,356
$1,654,715
2012$ -
- 34,250 -
320,355350,000307,830175,353
- $1,187,788
Additional information on the Authority’s outstanding debt can be found in the Letter of Transmittal on page 15 and in Note 12 beginning on page 60 of this report.

Financial Section
32 DRPA 2013 Comprehensive Annual Financial Report
Bond Ratings: In late 2012, with the issuance of new port district project refunding bonds, both Moody’s and S&P raised the outlook on the Authority’s debt Moody’s changed the out-look on all bonds from “negative” to “stable”, while S&P increased the outlook on all bonds from “stable” to “positive”.
During the latter part of 2013, the Authority experienced its fi rst major change in its bond ratings since 2010. In November, just prior to the issuance of new revenue bonds, Standard and Poor’s (S&P) upgraded the Authority’s outstanding revenue bonds to “A” (from “A-“), with a stable outlook, and also raised the underlying rating on the outstanding port district project bonds to “BBB” (from “BBB-“). The ratings change refl ected the Authority’s strong fi nancial management with historical operating results under budget by 6.3% since 2003, its strong liquidity position (especially in its General Fund), the Board of Commissioners’ mandate to exit economic development, its focus on debt management restructuring and its focus on its “core infrastructure assets.”
Moody’s affi rmed the current underlying revenue bond (A3) and port district project bond (Baa3) ratings with a “stable” outlook.
The underlying debt ratings on the Authority’s bond issues, as of December 31, 2013, are shown below:
Issue: Moody’s: S&P: Revenue and Revenue Refunding Bonds A3 A (2008, 2010 and 2013 bonds) Stable Stable
Port District Project and Port District Project Baa3 BBB Refunding Bonds (1999 and 2012 bonds) Stable Stable
Additional information related to the Authority’s bond ratings, including its “jointly supported transactions” ratings on its 2008 and 2010 Revenue Refunding Bonds can be found in the sub-section entitled “Bond Ratings” under Note 12 on pages 71-72 and “Commitments” under Note 17 on pages 74-78 of this report.

Financial Section
DRPA 2013 Comprehensive Annual Financial Report 33
Economic Factors and Next Year’s Budgets The following factors were considered in preparing the Authority’s budget for the 2014 year: • Slow or little growth in the overall regional economy.• No bridge toll or PATCO fare increases during 2014.• Budgeted bridge traffi c is expected to drop by 0.8 million vehicles to 47.3 million vehicles,
attributable to economic factors and a three-day adjustment for inclement weather.• Bridge toll revenues projected to approach $290.7 million, attributable to an increase of
$0.1 million in budgeted toll revenues vs. 2013. (Net toll revenues include a three-day adjustment for the projected impact of inclement weather and an increase in average toll).
• Decrease of 2.1% in projected total PATCO fares and other revenues versus 2013, decreasing from $26.8 million to $26.2 million. The large drop in revenues is resultant from an anticipated reduction in the passenger ridership, largely attributable to the major Ben Franklin Bridge/PATCO track rehabilitation project. Ridership is budgeted to decrease by 163,000 riders (or by 1.6%) vs. the 2013 budget, to a total of 10.2 million riders annually.
• Biennial inspection costs estimated to be $2.9 million in 2014, a budgeted increase of $2.7 million (no biennial inspection in 2013).
• DRPA operating expense increase of $1.8 million, or a 2.1% increase, primarily attributable to increased employer contribution for pension and insurance costs. The PATCO operating budget increased by $0.97 million, or by 2.1%, attributable primarily to payroll, pension-related and purchased power costs. The combined DRPA and PATCO budgeted operating expenses are expected to increase by $2.7 million to total $133.8 million, or a 2.1% increase over 2013.
• An increase of approximately $15.9 million (or 13.8%) in budgeted total debt service, primarily resultant from the full-year impact in 2014 of the issuance of the 2013 Revenue Bonds in late December of 2013. Total debt service is projected to be $131.8 million for 2014.
• Bank direct pay letters of credit costs (related to the 2008 and 2010 Revenue Refunding variable rate bonds) are expected to decrease signifi cantly by approximately $1.9 million, a 28.8% decrease. This signifi cant reduction in budgeted LOC fees is attributable to the Authority’s 2013 restructuring efforts.
• Capital Budget expenditures for 2014 are budgeted to be approximately $163.3 million, up substantially from the $119.3 million budgeted for 2013. This increase in expenditures refl ects several signifi cant projects, including the BFB/PATCO Track rehabilitation and PATCO fl eet car rehabilitation projects, which together are budgeted to approach $103 million in expenditures in 2014.
The Authority’s actual financial results could vary materially from management’s expectations because of changes in the above factors, and other risks and uncertainties that adversely impact the Authority’s operations.
Requests for InformationThis financial report is designed to provide a general overview of the Authority’s activities for
all of those with an interest in the Authority’s activities through December 31, 2013. Questions from interested parties concerning any of the information provided in this report or requests for additional financial information should be addressed to the Office of the Chief Financial Officer, Delaware River Port Authority, One Port Center, 2 Riverside Drive, P.O. Box 1949, Camden, NJ 08101-1949.

Financial Section
34 DRPA 2013 Comprehensive Annual Financial Report
Delaware River Port Authority
Combined Statements of Net PositionDecember 31, 2013 and 2012(amounts expressed in thousands)
20122013 (Restated)
AssetsCurrent Assets
Cash and cash equivalents 26,232$ 829$Investments 400,328 298,513Accounts receivable, net of allowance for uncollectibles 11,691 8,866Accrued interest receivable 475 540Transit system and storeroom inventories 6,512 6,794Economic development loans - current 1,925 1,830Prepaid expenses 2,323 1,354Restricted assets
Cash and cash equivalents 4,297 5,070Investments 206,411 151,631Accrued interest receivable 4 4
Total current assets 660,198 475,431
Noncurrent AssetsRestricted investments for capital projects 345,216 -
Capital assets, net of accumulated depreciationLand 74,225 74,225Construction in progress 290,453 304,030Bridges and related buildings and equipment 634,795 604,153Transit property and equipment 271,767 256,381Port enhancements 2,214 2,139
Total capital assets 1,273,454 1,240,928
OtherEconomic development loans, net of allowance for uncollectibles 16,776 17,392Debt insurance costs, net of amortization 1,396 1,496
Total other assets 18,172 18,888Total noncurrent assets 1,636,842 1,259,816Total assets 2,297,040 1,735,247
Deferred Outflows of ResourcesAccumulated decrease in fair value of hedging derivatives 114,318 166,703Loss on refunding of debt 14,711 17,248
Total deferred outflows of resources 129,029 183,951
(Continued)

Financial Section
DRPA 2013 Comprehensive Annual Financial Report 35
Delaware River Port Authority
Combined Statements of Net Position (Continued)December 31, 2013 and 2012(amounts expressed in thousands)
20122013 (Restated)
LiabilitiesCurrent Liabilities
Accounts payableRetained amounts on contracts 8,938$ 10,065$Other 19,356 21,816
Accrued liabilitiesClaims and judgments 1,500 1,490Self-insurance 1,709 1,907Pension 1,867 555Sick and vacation leave benefits 1,031 1,099Other 1,189 1,099
Unearned revenue 3,408 3,245Liabilities payable from restricted assets
Accrued interest payable 13,534 9,113Bonds payable - current 38,650 19,015
Total current liabilities 91,182 69,404
Noncurrent LiabilitiesAccrued liabilities
Claims and judgments 5,354 4,402Self-insurance 1,978 1,345Sick and vacation leave benefits 3,091 3,295Other post employment benefits 41,502 41,363
Unearned revenue 5,274 5,741Premium payment payable - derivative companion instrument 33,588 37,969Derivative instrument - interest rate swap 116,646 168,077Bonds payable, net of unamortized discounts and premiums 1,616,065 1,168,773
Total noncurrent liabilities 1,823,498 1,430,965Total liabilities 1,914,680 1,500,369
Net Position
Net investment in capital assets 213,138 272,905Restricted for:
Debt requirements 140,743 122,010Port projects 18,778 21,682
Unrestricted 138,730 2,232
Total net position 511,389$ 418,829$
See Notes to Combined Financial Statements.

Financial Section
36 DRPA 2013 Comprehensive Annual Financial Report
Delaware River Port Authority
Combined Statements of Revenues, Expenses and Changes in Net PositionYears Ended December 31, 2013 and 2012(amounts expressed in thousands)
20122013 (Restated)
Operating RevenuesBridges
Tolls 293,863$ 292,810$Other operating revenues 6,451 6,372
Total bridge operating revenues 300,314 299,182
Transit systemPassenger fares 25,908 26,035Other operating revenues 1,699 1,957
Total transit system operating revenues 27,607 27,992
Port of Philadelphia and CamdenCruise terminal - 2
Total Port of Philadelphia and Camden - 2
OtherMiscellaneous 203 224
Total operating revenues 328,124 327,400
Operating ExpensesOperations 97,436 98,581Community impact 3,688 3,611General and administration 38,932 44,277Port of Philadelphia and Camden 62 29Depreciation 54,801 55,018
Total operating expenses 194,919 201,516Operating income 133,205 125,884
(Continued)

Financial Section
DRPA 2013 Comprehensive Annual Financial Report 37
Delaware River Port Authority
Combined Statements of Revenues, Expenses and Changes in Net Position (Continued)Years Ended December 31, 2013 and 2012(amounts expressed in thousands)
20122013 (Restated)
Nonoperating Revenues (Expenses)Investment income 5,581$ 5,803$Change in fair value of derivative instruments (953) 1,835
4,628 7,638Interest expense (58,784) (66,540)Amortization expense (100) (100)Economic development activities (4,371) (8,695)Other nonoperating revenues 49 44Other grant revenues 2,776 4,232Bond issuance costs (2,516) (1,374)
Total nonoperating revenues (expenses) (58,318) (64,795)Income before capital contributions 74,887 61,089
Capital ContributionsFederal and state capital improvement grants 17,673 25,042
Change in net position 92,560 86,131
Net Position, January 1, (as restated) 418,829 332,698
Net Position, December 31, 511,389$ 418,829$
See Notes to Combined Financial Statements.

Financial Section
38 DRPA 2013 Comprehensive Annual Financial Report
Delaware River Port Authority
Combined Statements of Cash FlowsYears Ended December 31, 2013 and 2012(amounts expressed in thousands)
2013 2012Cash Flows from Operating Activities
Receipts from customers and users 327,157$ 326,211$Payments for other goods or services (69,415) (77,799)Payments for employees services (71,186) (62,120)Other receipts 49 44
Net cash provided by operating activities 186,605 186,336
Cash Flows from Noncapital Financing ActivitiesPayments for economic development activities (4,371) (8,695)Repayments of economic development loans 521 458Grants received 1,701 7,541
Net cash used in noncapital financing activities (2,149) (696)
Cash Flows from Capital and Related Financing ActivitiesAcquisition and construction of capital assets (88,503) (122,921)Proceeds from sales of capital assets 49 146Capital contributions received 16,770 25,043Proceeds from capital debt 488,403 175,557Payment of bond issuance costs (2,698) (1,374)Payment on capital debt refunding - (196,760)Principal paid on bonded debt (19,015) (140,895)Interest paid on debt (58,667) (77,451)
Net cash provided by (used in) capital and relatedfinancing activities 336,339 (338,655)
Cash Flows from Investing ActivitiesProceeds from sales and maturities of investments 633,140 1,273,801Purchase of investments (1,135,377) (1,127,253)Interest received 6,072 6,454
Net cash (used in) provided by investing activities (496,165) 153,002Net increase (decrease) in cash and cash equivalents 24,630 (13)
(Continued)

Financial Section
DRPA 2013 Comprehensive Annual Financial Report 39
Delaware River Port Authority
Combined Statements of Cash Flows (Continued)Years Ended December 31, 2013 and 2012(amounts expressed in thousands)
2013 2012Cash and Cash Equivalents, January 1,(including $5,070 and $4,379 reported as restricted) 5,899$ 5,912$
Cash and Cash Equivalents, December 31,(including $4,297 and $5,070 reported as restricted) 30,529$ 5,899$
Reconciliation of Operating Income to Net CashProvided by Operating Activities:
Operating income 133,205$ 125,884$Adjustments to reconcile operating income to net cash
provided by operating activities:Depreciation 54,801 55,018Changes in assets and liabilities:
(Increase) in accounts receivable (665) (95)Decrease (increase) in transit system and storeroom inventories 282 (683)(Increase) decrease in prepaid expenses (969) 2,903(Decrease) increase in accounts payable and accrued wages (2,460) 975Increase (decrease) in accrued pension payable 1,312 (391)Decrease in unearned revenue (304) (1,094)Increase in claims and self-insurance 1,397 2,007Decrease in sick and vacation leave benefits payable (272) (297)Increase in other accrued liabilities 229 2,065
Other revenues 49 44
Net cash provided by operating activities 186,605$ 186,336$
Noncash Investing, Capital and Financing Activities:Accretion of interest on premium payment payable - derivative
companion instrument 1,776$ 1,985$(Increase) decrease in accumulated change in fair value of
hedging derivatives resulting from change in fair value (52,385)$ (7,086)$
Grant revenue included in accounts receivable 1,487$ 412$
Capital contributions included in accounts receivable 4,199$ 3,296$
Acquisition of capital assets included in accounts payable 8,938$ 10,065$
See Notes to Combined Financial Statements.

Financial Section
40 DRPA 2013 Comprehensive Annual Financial Report
Delaware River Port Authority
Notes to Combined Financial Statements
Note 1. Summary of Significant Accounting Policies
Description of Operations: The Delaware River Port Authority (the “Authority”) is a public corporateinstrumentality of the Commonwealth of Pennsylvania (the “Commonwealth”) and the State of NewJersey (the “State”), created with the consent of Congress by compact legislation between theCommonwealth and the State. The Authority has no stockholders or equity holders. The Authority isvested with the ownership, control, operation, and collection of tolls and revenues of certain bridgesspanning the Delaware River; namely, the Benjamin Franklin, Walt Whitman, Commodore Barry, andBetsy Ross bridges. The Authority has also constructed and owns a high-speed transit system that isoperated by the Port Authority Transit Corporation (“PATCO”). The transit system operates betweenPhiladelphia, Pennsylvania and Lindenwold, New Jersey.
The costs of providing facilities and services to the general public on a continuing basis are recoveredprimarily in the form of tolls and fares. The Authority is a member of the E-ZPass Interagency Group, thelargest interoperable Electronic Toll Collection System in the world, comprised of twenty-five (25)agencies in fifteen (15) states. Through December 2013, customer participation in the E-ZPass electronictoll collection process grew to approximately sixty-seven (67%) of its toll collection activity during rushhour periods. Toll revenues collected through E-ZPass now exceed sixty-six percent (66%) of total tollrevenues. The Office of the Chief Operating Officer manages the RiverLink Ferry System which runsdaily between Penn’s Landing in Philadelphia and the Camden Waterfront, as well as the Authority’seleven story office building in Camden, New Jersey.
Basis of Presentation: The Authority is a single enterprise fund and maintains its records on the accrualbasis of accounting. Enterprise Funds account for activities (i) that are financed with debt that is securedsolely by a pledge of the net revenues from fees and charges of the activity; or (ii) that are required by lawor regulations that the activity’s cost of providing services, including capital cost (such as depreciation ordebt service), be recovered with fees and charges, rather than with taxes or similar revenues; or (iii) thatthe pricing policies of the activity establish fees and charges designed to recover its costs, includingcapital costs (such as depreciation or debt service). Under the accrual basis of accounting, revenues arerecorded when earned and expenses are recorded when the related liability is incurred.
Cash and Cash Equivalents: The Authority considers all highly liquid investments with a maturity of threemonths or less when purchased to be cash equivalents (Note 2). In addition, according to the variousIndentures of Trust which govern the flow and accounting of the Authority’s financial resources, certainaccounts are required to be maintained in order to comply with the provisions of the Indentures of Trust.For the accounts that are restricted, the Authority has recorded the applicable cash and cash equivalentsas restricted on the combined financial statements (Note 11).
Investment in Securities: Investments are stated at fair value, generally based on quoted market prices.Certain investments are maintained in connection with the Authority’s funded debt (Notes 3 and 12).Likewise, as with cash and cash equivalents, the accounts that are restricted as per the variousIndentures of Trust have been recorded as restricted investments on the combined financial statements(Note 11).
Accounts Receivable: The Authority establishes a provision for the estimated amount of uncollectibleaccounts based upon periodic analysis of collection history.
Transit System Inventory: Transit system inventory, consisting principally of spare parts for maintenanceof transit system facilities, is stated at the lower of cost (first-in, first-out method) or market.
Debt Issuance Costs, Bond Premiums, Bond Discounts and Loss on Refunding: As more fully describedin Note 21, during 2013, the Authority adopted GASB Statement No. 65, Items Previously Reported asAssets and Liabilities. Under this statement, debt issuance costs, except for insurance costs arerecognized as expenses in the period incurred. Bond insurance costs are amortized by the straight-linemethod from the issue date to maturity. Loss on refunding of debt is classified as a deferred outflow ofresources. Premiums, discounts and loss on refunding arising from the issuance of the revenue bondsand port district project bonds are amortized by the effective interest method from the issue date tomaturity.

Financial Section
DRPA 2013 Comprehensive Annual Financial Report 41
Delaware River Port Authority
Notes to Combined Financial Statements
Note 1. Summary of Significant Accounting Policies (Continued)
Investment in Facilities: Investment in facilities is stated at cost, which generally includes expenses forlegal expenses incurred during the construction period. Investment in facilities also includes the costincurred for port-related projects, and improvements, enlargements and betterments to the originalfacilities. Replacements of existing facilities (except for primarily police and certain other vehicles whoseestimated useful life is two years or less) are also recorded at cost. The related costs and accumulateddepreciation of the property replaced are removed from the respective accounts, and any gain or loss ondisposition is credited or charged to non-operating revenues or expenses. Assets capitalizable generallyhave an original cost of five thousand dollars ($5) or more and a useful life in excess of one year.Depreciation and amortization are provided using the straight-line method over the estimated useful livesof the related assets, including those financed by federal and state contributions (Notes 7 and 15).
Asset lives used in the calculation of depreciation are generally as follows:
Bridges, freeways and tunnels 100 yearsBuildings, stations and certain bridge components 35 - 50 yearsElectrification, signals and communication system 30 - 40 yearsTransit cars, machinery and equipment 10 - 25 yearsComputer equipment, automobiles and other equipment 3 - 10 yearsMaintenance and Repairs: Maintenance and repair costs considered necessary to maintain bridgefacilities in good operating condition are charged to operations as incurred.
Self-insurance: The Authority provides for the uninsured portion of potential public liability and workers’compensation claims through self-insurance programs and charges current operations for estimatedclaims to be paid (Note 16).
Economic Development Activities: The Authority establishes loan loss provisions for economicdevelopment loans receivable, based upon collection history and analysis of creditor’s ability to pay. TheAuthority has established a loss reserve in the amount of $1,345 as of December 31, 2013 and 2012 forits economic development loans outstanding.
Net Position: Net position is classified in the following three components:
Net Investment in Capital Assets: This component of net position consists of capital assets, net ofaccumulated depreciation, reduced, by the outstanding balances of any bonds, notes or otherborrowings that are attributable to the acquisition, construction, or improvement of those assets. Ifthere are significant unspent related debt proceeds at year-end, the portion of the debt attributable tothe unspent proceeds is not included in the calculation of net investment in capital assets. Rather,that portion of the debt is included in the same net position component as the unspent proceeds.
Restricted: This component of net position consists of external constraints imposed by creditors (suchas debt covenants), grantors, contributors, laws or regulations of other governments, or constraintsimposed by law through constitutional provisions or enabling legislation, that restricts the use of netposition.
Unrestricted: This component of net position consists of a net position that does not meet thedefinition of “restricted” or “net investment in capital assets.” This component includes net positionthat may be allocated for specific purposes by the Board. A deficiency will require future funding.

Financial Section
42 DRPA 2013 Comprehensive Annual Financial Report
Delaware River Port Authority
Notes to Combined Financial Statements
Note 1. Summary of Significant Accounting Policies (Continued)
Operating and Non-operating Revenues and Expenses: Operating revenues include all revenues derivedfrom facility charges (i.e., toll revenues, which include E-ZPass revenues), PATCO operations (passengerfare, advertising and parking), and other revenue sources. Non-operating revenues principally consist ofinterest income earned on various interest-bearing accounts and on investments in debt securities.
Operating expenses include expenses associated with the operation, maintenance and repair of thebridges, PATCO, PPC operations, and general administrative expenses. Non-operating expensesprincipally include expenses attributable to the Authority’s interest on funded debt and economicdevelopment activities.
When both restricted and unrestricted resources are available for use, it is the Authority’s policy to userestricted resources first, then unrestricted resources as they are needed.
Debt Management: Total outstanding bond debt reflected on the balance sheet is net of unamortizedbond discounts and premiums (Note 12). The Authority presently has two active interest rate hedge(swap) agreements (derivative instruments) with UBS AG (Paine Webber) to hedge interest rates on aportion of its outstanding long-term debt (Note 4).
Derivative Instruments and the Related Companion Instruments: The Authority has entered into twointerest rate swap agreements with Bank of America, N.A. for the primary purposes of investing and forthe aforementioned purpose of hedging interest rates on its outstanding long-term debt. In accordancewith Governmental Accounting Standards Board Statement No. 53, Accounting and Financial Reportingfor Derivative Instruments, all activity related to the interest rate swap agreements has been recorded onthe combined financial statements and is further detailed in Note 4.
Budget: In accordance with Section 5.15 of the 1998 Revenue Refunding Bonds Indenture of Trust andits Supplemental Indentures and Section 5.07 of the 1998, 1999 and 2001 Port District Project BondIndentures of Trust, the Authority must annually adopt an Annual Budget on or before December 31 forthe ensuing year. Section 5.15 of the 1998 Revenue Bond Indenture of Trust requires that the Authority,on or before December 31, in each fiscal year, adopt a final budget for the ensuing fiscal year of (i)operational expenses, (ii) the PATCO Subsidy, (iii) the amount to be deposited to the credit of theMaintenance Reserve Fund, and (iv) the estimated amounts to be deposited into the Debt Service Fund,the Debt Service Reserve Fund, and the Rebate Fund. Each Annual Budget must also contain theAuthority’s projections of revenues for the ensuing fiscal year demonstrating compliance with thecovenant as to facility charges as set forth in Section 5.09 of the Indentures of Trust. On or beforeDecember 31 in each fiscal year, the Authority must file a copy of the Annual Budget for the ensuing fiscalyear with the Trustees.
The Port District Project Bond Indentures require the following: the adopted budget must set forth, interalia, the PATCO Subsidiary, the amount of any operating subsidy paid or payable by the Authority to orfor the account of any other subsidiary of the Authority (including, without limitation, the Port ofPhiladelphia and Camden) and all other material operating expenses of the Authority payable from theGeneral Fund. (See Note 11 for description of funds established under the Trust Indentures.) TheAuthority must also include the debt service payable on the Bonds and any Additional Subordinatedindebtedness during the ensuing fiscal year and all amounts required to be paid by the Authority into theDebt Service Reserve Fund or the Rebate Fund or to any Reserve Fund Credit Facility issuer during theensuing fiscal year. On or before December 31, in each fiscal year, the Authority must file a copy of theAnnual Budget for the ensuing fiscal year with the Trustees and Credit Facility Issuer.
The Authority may at any time adopt an amended or supplemental Annual Budget for the remainder ofthe then-current fiscal year, which shall be treated as the Annual Budget under the provisions of theIndentures of Trust. A copy of any amended or supplemental Annual Budget must be promptly filed withthe Trustee.

Financial Section
DRPA 2013 Comprehensive Annual Financial Report 43
Delaware River Port Authority
Notes to Combined Financial Statements
Note 1. Summary of Significant Accounting Policies (Continued)
Interfunds: Interfund receivables/payables represent amounts that are owed, other than charges forgoods and services rendered, to/from a particular fund. These receivables/payables are eliminated duringthe aggregation process.
Reclassifications: Certain reclassifications have been made in the 2012 comparative statements to be inconformity with the 2013 presentation.
Use of Estimates: The preparation of financial statements in conformity with accounting principlesgenerally accepted in the United States of America requires management to make estimates andassumptions that affect the reported amounts of assets and liabilities and disclosure of contingent assetsand liabilities at the date of the combined financial statements and the reported amounts of revenues andexpenses during the reporting period. Actual results could differ from those estimates.
Income Taxes: The Authority is a public corporate instrumentality of the State of New Jersey and theCommonwealth of Pennsylvania, and is described in its amended governing Compact, has been “deemedto be exercising an essential government function in effectuating such purposes,” and therefore is exemptfrom income taxes pursuant to the Internal Revenue Code (Section 115).
Note 2. Cash and Cash Equivalents
Custodial Credit Risk Related to Deposits: Custodial credit risk is the risk that, in the event of a bankfailure, the Authority’s deposits might not be recovered. The Authority does not have a deposit policy forcustodial credit risk. As of December 31, 2013 and 2012, the Authority’s bank balances of $55,146 and$55,806 (including certificates of deposit of $22,197 and $46,427 classified as investments in thestatement of net position), respectively, were exposed to custodial credit risk as follows:
2013 2012
Uninsured and uncollateralized 50,054$ 51,889$
Uninsured and collateralized (collateral held by bank'sdepartment or agent, but not in the Authority's name) 855$ 894$
Note 3. Investment in Securities
The Authority’s investments in various securities are maintained for specified funds in accordance withthe provisions of the Indenture of Trust adopted as of July 1, 1998.
Custodial Credit Risk Related to Investments: For an investment, custodial credit risk is the risk that, inthe event of the failure of the counterparty, the Authority will not be able to recover the value of itsinvestments or collateral securities that are in possession of an outside party. Of the Authority’sinvestments at December 31, 2013 and 2012, $929,758 and $403,717, respectively, consisted ofinvestments in asset backed securities, commercial paper, corporate bonds and notes, mortgage pass-through securities, municipal bonds, repurchase agreements, U.S. federal agency notes and bonds, andU.S. government treasuries, are uninsured, not registered in the name of the Authority, and held by thecounterparty’s trust department or agent but not in the Authority’s name.

Financial Section
44 DRPA 2013 Comprehensive Annual Financial Report
Delaware River Port Authority
Notes to Combined Financial Statements
Note 3. Investment in Securities (Continued)
As of December 31, 2013 and 2012, the Authority had the following investments:
Investment Maturities 2013 2012
Asset backed securities 228.08 months average 914$ 2,990$Commercial paper 6.20 months average 51,575 51,575Corporate bonds and notes 18.63 months average 49,728 55,848Mortgage pass-through securities 216.95 months average 3,897 1,681Municipal bonds 109.77 months average 2,556 2,430Repurchase agreements daily 933 881Short-term investments 1.00 months average 771,245 249,949U.S. federal agency notes and bonds 17.22 months average 1,304 1,801U.S. government treasuries 26.08 months average 47,606 36,562
929,758 403,717Certificates of deposits held at banks 22,197 46,427
Total 951,955$ 450,144$
The weighted average maturity of the Authority’s investment portfolio was 4.97 and 9.97 months as ofDecember 31, 2013 and 2012, respectively.
The short-term investments listed above consist of money market funds. Since it is the policy of theAuthority to utilize these funds for the purchase of investments with longer maturities, these amountshave been classified as investments in the statement of net position as opposed to cash and cashequivalents.
Interest Rate Risk: The Authority’s General Fund investment policy limits investment maturities as ameans of managing its exposure to fair value losses arising from increasing interest rates and is asfollows: the average effective duration of the portfolio is not to exceed twenty-four months, and themaximum effective duration of any individual security is not to exceed five years, unless otherwisespecified.
Credit Risk: Investments are purchased in accordance with the 1998 Indenture of Trust and itsSupplemental Indenture and General Fund investment parameters and generally include U.S.government obligations, money market funds, obligations of U.S. agencies or instrumentalities, andobligations of public agencies or municipalities rated in either of the two highest rating categories byStandard & Poor’s Ratings or Moody’s Investors Services. In accordance with the 1998 Indenture of Trustand its Supplemental Indentures, the Authority invests in corporate bonds and commercial paper rated A-1 by Standard and Poor’s Corporation. Guaranteed Income Contracts are collateralized by U.S.government and agency securities, and debt obligations having a rating in the highest rating categoryfrom Moody’s Investors Service or Standard and Poor’s Rating Services.
At its February 20, 2013 meeting, the Authority’s Board approved Resolution 13-034, adopting a newcomprehensive General Fund investment policy, which revised and refined its existing investment policy.The policy clearly defines the approved, and non-approved, investment vehicles, in which its existinginvestment management firms may invest the Authority’s funds. This policy became effective July 1,2013.

Financial Section
DRPA 2013 Comprehensive Annual Financial Report 45
Delaware River Port Authority
Notes to Combined Financial Statements
Note 3. Investment in Securities (Continued)
As of December 31, 2013, the following are the actual ratings by Standard & Poors:
ActualRating
Asset BackedSecurities
CommercialPaper
CorporateBonds
Mortgage Pass-through
SecuritiesMunicipal
BondsRepurchaseAgreements
FederalAgency Notes
U.S.GovernmentTreasuries
AAA -$ -$ 2,098$ -$ 131$ -$ -$ -$AA+ 340 51,575 3,545 3,897 252 - 1,304 47,606AA - - 4,369 - - - - -AA- 5 - 10,476 - - - - -A+ - - 9,666 - 272 - - -A - - 9,535 - - - - -A- - - 8,705 - - - - -A2 - - 450 - - - - -BAA1 - - 731 - - - - -BBB - - 153 - - - - -D 569 - - - - - - -Unrated - - - - 1,900 933 - -
914$ 51,575$ 49,728$ 3,897$ 2,555$ 933$ 1,304$ 47,606$
As of December 31, 2013, the following are the actual ratings by Moody’s:
ActualRating
Asset BackedSecurities
CommercialPaper
CorporateBonds
Mortgage Pass-through
SecuritiesMunicipal
BondsRepurchaseAgreements
FederalAgency Notes
U.S.GovernmentTreasuries
AAA 340$ -$ 2,098$ 3,897$ -$ -$ 1,304$ 47,606$AAA- - - 314 - - - - -AA1 - - 1,662 - - - - -AA2 - - 5,864 - - - - -AA3 - 51,575 7,772 - - - - -A - - 2,452 - - - - -A- - - 731 - - - - -AA - - 351 - 383 - - -A1 - - 11,276 - 272 - - -A2 5 - 8,391 - - - - -A3 - - 2,947 - - - - -Ba1 - - - - 1,900 - - -Baa1 - - 1,009 - - - - -Baa2 - - 4,377 - - - - -BBB - - 484 - - - - -C 569 - - - - - - -Unrated - - - - - 933 - -
914$ 51,575$ 49,728$ 3,897$ 2,555$ 933$ 1,304$ 47,606$
Concentration of Credit Risk: The Authority’s investment policy on the concentration of credit risk for itsGeneral Fund investments states that no limitations exist on the purchase of investments in obligations ofthe U.S. government and U.S. federal agencies since they are fully guaranteed by the U.S. government.For the purchase of investments in obligations of all other issuers, total investments held from any oneissuer shall not exceed ten percent (10%) of the aggregate market value of the entire portfolio, except forrepurchase agreements, which, from any one issuer, shall not exceed twenty-five percent (25%) of theaggregate market value of the portfolio.

Financial Section
46 DRPA 2013 Comprehensive Annual Financial Report
Delaware River Port Authority
Notes to Combined Financial Statements
Note 3. Investment in Securities (Continued)
Concentration of Credit Risk (Continued): As of December 31, 2013 and 2012, the Authority has $51,575and $51,575 of investments in General Electric commercial paper and Fortis Funding commercial paper,respectively. These investments are held under the Indentures of Trust (Debt Service Reserve Funds)and represent 5% and 11% of the Authority’s total investments, respectively.
Note 4. Derivative Instruments
In accordance with the requirements of GASB 53 related to derivative instruments, the Authority engageda financial advisory firm to analyze the effectiveness of the two “cash-flow hedges” (specifically the 1995and 1999 Revenue Bond swaptions). Both swaptions were found to be substantially effective. AtDecember 31, 2013 and 2012, the value of the Pay-fixed interest rate swap (1995 Revenue BondSwaption) was $51,708 and $75,803, respectively. At December 31, 2013 and 2012, the value of thePay-fixed interest rate swap (1999 Revenue Bond Swaption) was $62,610 and $90,900, respectively. ThePay-fixed interest rate swaps are classified as deferred outflows on the Combined Statement of NetPosition and total $114,318 and $166,703 at December 31, 2013 and 2012, respectively.
The fair value balances and notional amounts of derivative instruments outstanding at December 31,2013 and 2012, classified by type, and the changes in fair value of such derivative instruments for theyear then ended as reported in the 2013 and 2012 financial statements are as follows (debit (credit)):
Classifi- Classifi-cation cation
2013 2012 2013 2012 2013 2012Investment derivatives
Receive-fixed interest rateswaption (1999 PDP,Series B, Debt Service Interest DerivativeReserve Fund) revenue (120)$ 159$ instrument (305)$ (185)$ 10,436$ 10,436$
Receive-fixed interest rateswaption (1999 RevenueBonds Debt Service Interest DerivativeReserve Fund) revenue (458) 605 instrument (1,159) (701) 39,657 39,657
Pay-fixed interest rate Interest Derivativeswap revenue (375) 1,071 instrument (114) (489) 24,595 24,595
Cash flow hedgesPay-fixed interest rateswap (1995 Revenue Deferred DerivativeBonds Swaption) outflow 24,096 3,675 instrument (51,708) (75,803) 304,510 320,355
Pay-fixed interest rateswap (1999 Revenue Deferred DerivativeBonds Swaption) outflow 28,290 3,410 instrument (62,610) (90,900) 331,840 350,000
Changes in Fair Value Fair Value at December 31,
Amount Amount Notional
As of December 31, 2010, the Authority determined that a portion of the cash flow hedge, pay-fixedinterest rate swap, with a notional amount of $403,035, no longer met the criteria for effectiveness due tothe partial 2010 refunding of the 1999 Revenue Bonds (Note 12). The fair values of the interest rateswaptions and swaps are indicative values based on mid-market levels as of the close of business onDecember 31, 2013 and 2012, and were derived from proprietary models based upon well-recognizedfinancial principles and reasonable estimates about relevant future market conditions.

Financial Section
DRPA 2013 Comprehensive Annual Financial Report 47
Delaware River Port Authority
Notes to Combined Financial Statements
Note 4. Derivative Instruments (Continued)
Objective and Terms of Hedging Derivative Instruments: The following table summarizes the objectiveand terms of the Authority’s hedging instruments outstanding at December 31, 2013:
Notional Effective MaturityType Objective Amount Date Date Terms
Pay-fixed interest Hedge of changes Pay 5.447%;rate swap (1995 in cash flows of the receive 66%Revenue Bonds 2008 Revenue of one-monthSwaption) Refunding Bonds 304,510$ 01/01/06 01/01/26 LIBOR
Pay-fixed interest Hedge of changes Pay 5.738%;rate swap (1999 in cash flows of the receive 66%Revenue Bonds 2010 Revenue of one-monthSwaption) Refunding Bonds 356,435 01/01/10 01/01/26 LIBOR
1995 Revenue Bonds Swaption: On May 2, 2001, the Authority entered into the 1995 Revenue BondsSwaption with UBS AG in the initial notional amount of $358,215. Under the 1995 Revenue BondsSwaption, UBS AG had the option, exercisable 120 days preceding January 1, 2006, January 1, 2007,and January 1, 2008, to elect to have the 1995 Revenue Bonds Swaption commence on the January 1next succeeding the exercise of the option. Under the 1995 Revenue Bonds Swaption, (i) UBS AG wasobligated to pay to the Authority $7,144 on January 1, 2006, as an exercise premium amount; (ii) UBS AGis obligated to pay periodic payments (payable monthly) to the Authority based upon a variable rate of66% of the USD-LIBOR-BBA index; and (iii), the Authority is obligated to pay periodic payments (payablemonthly) to UBS AG based upon a fixed rate of 5.447% per annum. The periodic interest rates areapplied to the notional amount of the 1995 Revenue Bonds Swaption, which amortizes annually,commencing January 1, 2007, from its initial notional amount. Only the net difference in the periodicpayments is to be exchanged between the Authority and UBS AG.
The periodic payment obligations of the Authority under the 1995 Revenue Bonds Swaption are securedand payable equally and ratably with Bonds issued under the 1998 Revenue Bond Indenture. Regularlyscheduled periodic payments to be made by the Authority under the 1995 Revenue Bonds Swaption areinsured by Ambac Assurance. In addition to other Events of Default and Termination Events (as definedin the 1995 Revenue Bond Swaption), there exists an Additional Termination Event with respect to theAuthority if the credit rating of Bonds issued under the 1998 Revenue Bond Indenture (without referenceto municipal bond insurance or credit enhancement) falls below “Baa3” with respect to Moody’s InvestorsService (“Moody’s”) or “BBB-” with respect to Standard & Poor’s Ratings Group (“S&P”) or Fitch Ratings(“Fitch”), or the Bonds cease to be rated by one of Moody’s, S&P or Fitch (and such rating agencies arestill in the business of rating obligations such as the Bonds). However, as provided in the 1995 RevenueBond Swaption, so long as no Insurer Credit Event (as defined therein) has occurred, no EarlyTermination Date can be designated unless Ambac Assurance has consented in writing thereto.
In consideration for entering into the 1995 Revenue Bonds Swaption, the Authority received a net up-front, non-refundable option payment in the amount of $22,446 from UBS AG, which has been recordedon the combined financial statements as a noncurrent liability (premium payment payable – derivativecompanion instrument). In accordance with the provisions of Governmental Accounting Standards BoardStatement No. 53, Accounting and Financial Reporting for Derivative Instruments, this derivativecompanion instrument is considered a “borrowing” resulting from the intrinsic value of the swaption atinception. During the option period, interest accretes at the effective rate implied by the cash flows on theborrowing at inception. Once the swaption is exercised, and becomes an active swap, a portion of theswap interest payments are attributed to principal and interest payments on the borrowing.

Financial Section
48 DRPA 2013 Comprehensive Annual Financial Report
Delaware River Port Authority
Notes to Combined Financial Statements
Note 4. Derivative Instruments (Continued)
1995 Revenue Bonds Swaption (Continued): On September 3, 2005, UBS AG advised the Authority thatit was exercising its option on this swaption as of January 1, 2006. As a result, UBS AG paid the Authority$7,144 on January 3, 2006 as an exercise premium, which has been recorded as a deferred revenue andis being amortized as interest revenue over the life of the interest rate swap agreement. The Authoritymade its initial net monthly swap payment in February 2006. The Authority is current on its monthly netswap interest payments to UBS AG, which have totaled $14.4 million as of December 31, 2013.
On June 21, 2012, Moody’s downgraded UBS’ long-term ratings from Aa3 to A2. The ratings of thecounterparty (UBS AG) to the 1995 Revenue Bonds Swap by Moody’s, S&P, and Fitch are A2, A, and A,respectively, as of December 31, 2013. As of December 31, 2013, the 1995 Revenue Bond Swaption hada mark- to- mark value of ($71,564). (As of December 31, 2013, the notional value of the swap was$304.5 million.)
The following schedule represents the accretion of interest and amortization of the premium paymentpayable – derivative companion instrument through the term of the interest rate swap agreement, at aneffective interest rate of 4.62324%:
ImputedYear Ending Beginning Interest Debt Ending
December 31, Balance Accrual Payment Balance
2014 13,673$ 632$ (2,371)$ 11,934$2015 11,934 552 (2,226) 10,2602016 10,260 475 (2,073) 8,6622017 8,662 400 (1,911) 7,1512018 7,151 331 (1,741) 5,741
2019-2023 5,741 791 (5,810) 7222024-2025 722 45 (767) -
1999 Revenue Bonds Swaption: On May 2, 2001, the Authority entered into the 1999 Revenue BondsSwaption with UBS AG in the initial notional amount of $403,035. Under the 1999 Revenue BondsSwaption, UBS AG had the option, exercisable 120 days preceding January 1, 2010, January 1, 2011,and January 1, 2012, to elect to have the 1999 Revenue Bonds Swaption commence on the January 1next succeeding the exercise of the option. Under the 1999 Revenue Bonds Swaption, if exercised, (i)UBS AG is obligated to pay periodic payments (payable monthly) to the Authority based upon a variablerate of 66% of the USD-LIBOR-BBA index, and (ii), the Authority is obliged to pay periodic payments(payable monthly) to UBS AG based upon a fixed rate of 5.738% per annum. The periodic interest ratesare applied to the notional amount of the 1999 Revenue Bonds Swaption, which amortizes annually,commencing January 1, 2011, from its initial notional amount. Only the net difference in the periodicpayments is to be exchanged between the Authority and UBS AG.

Financial Section
DRPA 2013 Comprehensive Annual Financial Report 49
Delaware River Port Authority
Notes to Combined Financial Statements
Note 4. Derivative Instruments (Continued)
1999 Revenue Bonds Swaption (Continued): Once exercised, the 1999 Revenue Bonds Swaption wouldcontinue (unless earlier terminated) through January 1, 2026. The periodic payment obligations of theAuthority under the 1999 Revenue Bonds Swaption (if exercised) are secured and payable equally andratably with Bonds issued under the 1998 Revenue Bond indenture. Regularly scheduled periodicpayments to be made by the Authority under the 1999 Revenue Bonds Swaption are insured by AmbacAssurance. In addition to other Events of Default and Termination Events (as defined in the 1999Revenue Bonds Swaption), there exists an Additional Termination Event with respect to the Authority ifthe credit rating of Bonds issued under the 1998 Revenue Bond Indenture (without reference to municipalbond insurance or credit enhancement), falls below “Baa3” with respect to Moody’s or “BBB-” with respectto S&P or Fitch, or the Bonds cease to be rated by one of Moody’s, S&P or Fitch (and such ratingagencies are still in the business of rating obligations such as the Bonds). However, as provided in the1999 Revenue Bond Swap, so long as no Insurer Credit Event (as defined therein) has occurred, no EarlyTermination Date can be designated unless Ambac Assurance has consented in writing thereto.
In consideration for entering into the 1999 Revenue Bonds Swaption, the Authority received a net up-front, non-refundable option payment in the amount of $20,142 from UBS AG, which has been recordedon the combined financial statements as a noncurrent liability (premium payment payable – derivativecompanion instrument). In accordance with the provisions of Governmental Accounting Standards BoardStatement No. 53, Accounting and Financial Reporting for Derivative Instruments, this derivativecompanion instrument is considered a “borrowing” resulting from the intrinsic value of the swaption atinception. During the option period, interest accretes at the effective rate implied by the cash flows on theborrowing at inception. Once the swaption is exercised, and becomes an active swap, a portion of theswap interest payments are attributed to principal and interest payments on the borrowing.
On September 3, 2009, UBS AG advised the Authority that it was exercising its option on this swaption asof January 1, 2010. The Authority began making net interest payments to USB AG, the counterparty,commencing in February 2010, representing January’s net interest payment. The Authority is current onits monthly net interest swap payments, having paid $17.4 million to UBS AG as of December 31, 2013.
On June 21, 2012, Moody’s downgraded UBS’ long-term ratings from Aa3 to A2. The ratings of thecounterparty (UBS AG) to the 1999 Revenue Bonds Swap by Moody’s, S&P, and Fitch are A2, A, and A,respectively, as of December 31, 2013. As of December 31, 2013, the 1999 Revenue Bond Swaption hada mark- to- mark value of ($99,622). (As of December 31, 2013, the notional value of the swap was$356.4 million.)
The following schedule represents the accretion of interest and amortization of the premium paymentpayable – derivative companion instrument through the term of the interest rate swap agreement, at aneffective interest rate of 4.71425%:
ImputedYear Ending Beginning Interest Debt Ending
December 31, Balance Accrual Payment Balance
2014 19,915$ 939$ (3,453)$ 17,401$2015 17,401 820 (3,245) 14,9762016 14,976 706 (3,025) 12,6572017 12,657 595 (2,793) 10,4592018 10,459 496 (2,547) 8,408
2019-2023 8,408 1,183 (8,528) 1,0632024-2025 1,063 67 (1,130) -

Financial Section
50 DRPA 2013 Comprehensive Annual Financial Report
Delaware River Port Authority
Notes to Combined Financial Statements
Note 4. Derivative Instruments (Continued)
Net Swap Payments: Using rates as of December 31, 2013 and assuming the rates are unchanged forthe remaining term of the bonds, the following table shows the debt service requirements and net swappayments for the Authority’s hedged variable rate bonds:
Year TotalEnding Bonds and
December 31, Principal Interest Total Fixed Pay Var. Received Net Pay Swaps
2014 29,455$ 699$ 30,154$ 35,028$ 696$ 34,332$ 64,486$2015 37,920 652 38,572 32,904 654 32,250 70,8222016 40,035 601 40,636 30,660 609 30,051 70,6872017 42,290 548 42,838 28,291 562 27,729 70,5672018 44,645 492 45,137 25,789 513 25,276 70,413
2019-2023 263,740 1,501 265,241 86,217 1,713 84,504 349,7452024-2026 196,425 82 196,507 11,409 227 11,182 207,689
654,510$ 4,575$ 659,085$ 250,298$ 4,974$ 245,324$ 904,409$
Swap Interest PaymentsVariable Rate Bonds
Objective and Terms of Investment Derivative Instruments: On August 21, 2000, the Authority enteredinto two (2) interest rate agreements with Bank of America, N.A. in the notional amounts of $39,657 (the“2000 Swaption #1”) and $10,436 (the “2000 Swaption #2”, and together with the 2000 Swaption #1, the“2000 Swaptions”). Under the 2000 Swaptions, Bank of America, N.A. has the option on certain futuredates (two business days preceding July 1, 2005 and each January 1 and July 1 thereafter through andincluding July 1, 2025 with respect to the 2000 Swaption #1 and two business days preceding January 2,2006 and each July 1 and January 1 thereafter through and including July 1, 2025 with respect to the2000 Swaption #2) to cause the 2000 Swaption #1 or the 2000 Swaption #2, as applicable, to commenceon the next succeeding January 1 or July 1. If an option is exercised, the 2000 Swaption #1, or the 2000Swaption #2, as applicable, would continue (unless earlier terminated) through January 1, 2026. TheAuthority’s obligations under the 2000 Swaptions are general unsecured corporate obligations.
If the options relating to the 2000 Swaption #1 or the 2000 Swaption #2 are exercised, Bank of America,N.A. is obligated to pay periodic interest payments (payable monthly) to the Authority based upon a fixedrate of 5.9229% per annum and the Authority is obligated to pay periodic interest payments (payablemonthly) to Bank of America, N.A. at a variable rate based upon the Securities Industry and FinancingMarkets Association (SIFMA) (formerly the BMA Municipal Swap Index) (a tax-exempt variable rateindex). Only the net difference in the periodic payments owed would be exchanged between Bank ofAmerica, N.A. and the Authority. As of December 31, 2013, Bank of America, N.A. has not exercised itsoptions on the aforementioned swaptions with a value totaling ($1,141).
In consideration for entering into the 2000 Swaptions, the Authority received net up-front, non-refundableoption payments in the aggregate amount of $1,400 from Bank of America, N.A., which represented thetime value for holding the written option. Such payments have been recorded as deferred revenue andamortized as interest revenue in prior years.
Risks Related to Derivative Instruments:
Credit Risk: For the year ended December 31, 2013, the Authority is not exposed to credit risk onits hedging derivative instruments or investment derivatives as all such derivative instruments arein a liability position based on their fair values. The credit ratings of the counterparties, however,are A2, A, and A as rated by Moody’s, S&P, and Fitch, respectively.

Financial Section
DRPA 2013 Comprehensive Annual Financial Report 51
Delaware River Port Authority
Notes to Combined Financial Statements
Note 4. Derivative Instruments (Continued)
Interest Rate Risk: The Authority is exposed to interest rate risk on its derivative instruments. Onits pay-variable, received-fixed interest rate swaptions, as the Securities Industry and FinancingMarkets Association (SIFMA) rate increases, the Authority’s net payments on the swaptions, ifexercised, increases. On its pay-fixed, receive-variable interest rate swaps, as the LIBOR ratedecreases, the Authority’s net payments on the swaps increases. While the Authority’s netpayments may increase, these increases are partially offset by the variable rate bonds rate.
Basis Risk: The Authority is exposed to basis risk on its pay-fixed interest rate swap hedgingderivative instruments because the variable-rate payments received by the Authority on thesehedging derivative instruments are based on a rate or index other than interest rates the Authoritypays on its hedged variable-rate debt, which is remarketed every five (5) days.
Termination Risk: The Authority or its counterparties may terminate a derivative instrument if theother party fails to perform under the terms of the contract.
Rollover Risk: The Authority is not exposed to rollover risk on its hedging derivative instruments.The Authority’s hedging derivative instruments terminate on the same day as the hedged debtmatures, unless the Authority opts for earlier termination.
Market-Access Risk: If a particular option is exercised and refunding bonds are not issued, theaffected series of bonds would not be refunded, and the Authority would make net swappayments as required by the terms of the applicable aforementioned contracts. If the option isexercised and the variable-rate bonds issued, the actual difference ultimately recognized by thetransaction will be affected by the relationship between the interest rate terms of the to-be-issuedvariable-rate bonds versus the payment as stipulated in the swaption agreement.
Swap Management Policy: On December 28, 2009, the Authority’s Board approved a resolution (DRPA-09-099, entitled “Use Debt-Related Swap Agreements”) which, among other things, declared: (i) “that it isthe direction and intention of the Board that the DRPA not enter into any new debt-related swapagreements...”, and (ii) that the staff of the Authority” takes all steps necessary to immediately begin theprocess of recommending to the Board whether, when, and how to terminate the Authority’s currentswaps, with all such terminations, if determined to be advisable, to occur in a methodical and carefulmanner which avoids to the fullest extent possible additional costs or risks may be associated withtermination; and that staff report to the Finance Committee of the Board on a monthly basis the status ofall current swap agreements…”
Note 5. Accounts Receivable
Accounts receivable for December 31, 2013 and 2012 are as follows:2013 2012
Reimbursements from governmental agencies - capitalimprovements to the PATCO system due from theFederal Transit Administration 4,199$ 3,296$
Reimbursements from governmental agencies - FTA, DOT,FEMA, PEMA, and U.S. and NJ Homeland Security 1,487 412
Development projects 3,500 3,500E-ZPass in transit 4,348 4,031Other 1,657 1,127Gross receivables 15,191 12,366Less: allowance for uncollectibles (3,500) (3,500)
Net total receivables 11,691$ 8,866$

Financial Section
52 DRPA 2013 Comprehensive Annual Financial Report
Delaware River Port Authority
Notes to Combined Financial Statements
Note 6. Changes in Long-Term Liabilities
Long-term liability activity for the year ended December 31, 2013 is as follows:
Beginning Ending Due withinBalance Increases Decreases Balance 1 year
Bonds and loans payable1999 Port District Project Bonds 34,250$ -$ (3,170)$ 31,080$ 3,405$2008 Revenue Refunding Bonds 320,355 - (15,845) 304,510 16,7102010 Revenue Refunding Bonds 350,000 - - 350,000 12,7452010 Revenue Bonds 308,375 - - 308,375 -2012 Port District Project Refunding Bonds 153,030 - - 153,030 5,7902013 Revenue Bonds - 476,585 - 476,585 -Less: issuance discounts/premiums 21,778 11,818 (2,461) 31,135 -
Total bonds payable 1,187,788 488,403 (21,476) 1,654,715 38,650
Other liabilitiesClaims and judgments 5,892 3,330 (2,368) 6,854 1,500Self-insurance 3,252 2,040 (1,605) 3,687 1,709Sick and vacation leave 4,394 86 (358) 4,122 1,031Deferred revenue 8,986 619 (923) 8,682 3,312Other (includes net OPEB obligation) 41,363 5,443 (5,304) 41,502 -Premium payment payable - derivative
companion instrument 37,969 1,776 (6,157) 33,588 5,824Derivative instrument - interest rate swap 168,077 - (51,431) 116,646 -
Total long-term liabilities 1,457,721$ 501,697$ (89,622)$ 1,869,796$ 52,026$
Long-term liability activity for the year ended December 31, 2012 is as follows:
BeginningBalance Ending Due within
(as restated) Increases Decreases Balance 1 yearBonds and loans payable
1998 Port District Project Bonds 58,195$ -$ (58,195)$ -$ -$1999 Revenue Bonds 41,335 - (41,335) - -1999 Port District Project Bonds 145,080 - (110,830) 34,250 3,1702001 Port District Project Bonds 112,270 - (112,270) - -2008 Revenue Refunding Bonds 335,380 - (15,025) 320,355 15,8452010 Revenue Refunding Bonds 350,000 - - 350,000 -2010 Revenue Bonds 308,375 - - 308,375 -2012 Port District Project Refunding Bonds - 153,030 - 153,030 -Less: issuance discounts/premiums (1,646) 24,278 (854) 21,778
Total bonds payable 1,348,989 177,308 (338,509) 1,187,788 19,015
Other liabilitiesClaims and judgments 3,996 2,120 (224) 5,892 1,490Self-insurance 3,141 1,924 (1,813) 3,252 1,907Sick and vacation leave 4,691 273 (570) 4,394 1,099Deferred revenue 10,080 20,257 (21,351) 8,986 3,245Other (includes net OPEB obligation) 39,550 6,055 (4,242) 41,363 -Premium payment payable - derivative
companion instrument 42,458 1,985 (6,474) 37,969 6,157Derivative instrument - interest rate swap 176,999 - (8,922) 168,077 -
Total long-term liabilities 1,629,904$ 209,922$ (382,105)$ 1,457,721$ 32,913$

Financial Section
DRPA 2013 Comprehensive Annual Financial Report 53
Delaware River Port Authority
Notes to Combined Financial Statements
Note 7. Investment in Facilities
Capital assets for the year ended December 31, 2013 were as follows:
Beginning EndingBalance Increases Decreases Balance
Capital assets not being depreciatedLand 74,225$ -$ -$ 74,225$Construction in progress 304,030 87,468 (101,045) 290,453
Total capital assets not being depreciated 378,255 87,468 (101,045) 364,678
Capital assets being depreciatedBridges and related building and equipment 1,059,369 65,056 - 1,124,425Transit property and equipment 470,756 35,578 (141) 506,193Port enhancements 6,254 411 - 6,665
Total capital assets being depreciated 1,536,379 101,045 (141) 1,637,283
Less: accumulated depreciation for:Bridges and related building and equipment (455,216) (34,414) - (489,630)Transit property and equipment (214,375) (20,052) - (234,427)Port enhancements (4,115) (335) - (4,450)
Total accumulated depreciation (673,706) (54,801) - (728,507)Total capital assets being depreciated, net 862,673 46,244 (141) 908,776
Total capital assets, net 1,240,928$ 133,712$ (101,186)$ 1,273,454$
Capital assets for the year ended December 31, 2012 were as follows:
Beginning EndingBalance Increases Decreases Balance
Capital assets not being depreciatedLand 74,225$ -$ -$ 74,225$Construction in progress 241,748 118,056 (55,774) 304,030
Total capital assets not being depreciated 315,973 118,056 (55,774) 378,255
Capital assets being depreciatedBridges and related building and equipment 1,039,623 39,528 (19,782) 1,059,369Transit property and equipment 461,995 16,229 (7,468) 470,756Port enhancements 6,257 17 (20) 6,254
Total capital assets being depreciated 1,507,875 55,774 (27,270) 1,536,379
Less: accumulated depreciation for:Bridges and related building and equipment (439,118) (32,319) 16,221 (455,216)Transit property and equipment (203,024) (22,345) 10,994 (214,375)Port enhancements (3,815) (354) 54 (4,115)
Total accumulated depreciation (645,957) (55,018) 27,269 (673,706)Total capital assets being depreciated, net 861,918 756 (1) 862,673
Total capital assets, net 1,177,891$ 118,812$ (55,775)$ 1,240,928$
Total depreciation expense for the years ended December 31, 2013 and 2012 was $54,801 and $55,018,respectively.

Financial Section
54 DRPA 2013 Comprehensive Annual Financial Report
Delaware River Port Authority
Notes to Combined Financial Statements
Note 8. Deferred Compensation Plan
The Authority offers its employees a deferred compensation plan in accordance with Internal RevenueCode Section 457. The plan, available to all full-time employees, permits them to defer a portion of theirsalary until future years. The deferred compensation is not available to employees until termination,retirement, death, or unforeseeable emergency. The Authority does not make any contributions to theplan. To comply with changes in federal regulations and GASB 32, Accounting and Financial Reportingfor Internal Revenue Code 457 Deferred Compensation Plans, the Authority amended the plan in 1998 sothat all amounts of compensation deferred under the plan, all property and rights purchased with thoseamounts, and all income attributable to those amounts, property, or rights are solely the property of theemployees.
Note 9. Pension Plans
Employees of the Authority participate in the Pennsylvania State Employees’ Retirement System, thePublic Employees’ Retirement System of New Jersey, or the Teamsters Pension Plan of Philadelphia andVicinity.
Pennsylvania State Employees’ Retirement System:
Plan Description: Permanent full-time and part-time employees are eligible and required to participate inthis cost-sharing multiple-employer defined benefit plan that provides pension, death and disabilitybenefits. A member may retire after completing three years of service and after reaching normalretirement age (the age of 60, except police officers at age 50, or the age at which 35 years of servicehas been completed, whichever occurs first). Benefits vest after five years of service. If an employeeterminates his or her employment after at least five years of service but before the normal retirement age,he or she may receive pension benefits immediately or defer pension benefits until reaching retirementage. Employees who retire after reaching the normal retirement age with at least three years of creditedservice are entitled to receive pension benefits equal to 2.50% of their final average compensation(average of the three highest years in earnings) times the number of years for which they were aparticipant in the plan. The pension benefits received by an employee who retires after five years ofcredited service but before normal retirement age are reduced for the number of years that person isunder normal retirement age.
Pension provisions include death benefits, under which the surviving beneficiary may be entitled toreceive the employee’s accumulated contributions less the amount of pension payments that theemployee received, the present value of the employees’ account at retirement less the amount of pensionbenefits received by the employee, the same pension benefits formerly received by the employee, or one-half of the monthly pension payment formerly received by the employee. The maximum pension benefit tothe employee previously described may be reduced depending on the benefits elected for the survivingbeneficiary.
The Pennsylvania State Employees’ Retirement System issues a publicly available annual financialreport, including financial statements, which may be obtained by writing to Pennsylvania StateEmployees’ Retirement System, 30 North Third Street, Harrisburg, Pennsylvania 17108-1147.
Funding Policy: The contribution requirements of plan members and the Authority are established andamended by the Pennsylvania State Employees’ Retirement System Board. As of January 1, 2002,employees are required to contribute 6.25% of their gross earnings to the plan. The Authority wasrequired to, and did, contribute an actuarially determined amount to the plan, which equaled 12.57%,9.42% and 6.03%, of covered payroll in 2013, 2012 and 2011, respectively. In 2013, 2012 and 2011, theAuthority’s required contributions to the plan were $5,407, $4,084, and $2,604, respectively, whichrepresented 100% of the required contribution for the aforementioned years.

Financial Section
DRPA 2013 Comprehensive Annual Financial Report 55
Delaware River Port Authority
Notes to Combined Financial Statements
Note 9. Pension Plans (Continued)
New Jersey Public Employees Retirement System (NJ PERS):
Plan Description: Permanent full-time employees, hired after January 1, 2002, who were members ofNJPERS when they were hired, are eligible to participate in the cost-sharing multiple-employer definedbenefit plan (administered by the New Jersey Division of Pensions and Benefits). The PERS wasestablished in 1955. The PERS provides retirement, death and disability, and medical benefits to qualifiedmembers. Vesting and benefit provisions are established by N.J.S.A. 43:15A and 43:3B.
Funding Policy: The contribution requirements of plan members are determined by State statute. Inaccordance with Chapter 92, P.L. 2007 and Chapter 103, P.L. 2007, plan members enrolled in the PublicEmployees’ Retirement System were required to contribute 5.5% of their annual covered salary, effectiveJuly 1, 2007. However, under the new provisions of Chapter 78, P.L. 2011, employee pensioncontribution rates will be increased by the following amounts: the employee pension contribution rate willincrease from 5.5% to 6.5% of salary, effective October 1, 2011. An additional increase to be phased overthe next 7 years will bring the total pension contribution rate to 7.5% of salary. The phased increase from6.5% to 7.5% will be applied equally over a 7-year period beginning July 1, 2012. The contribution ratewill increase by 0.14% each year with the first payroll of July 2012 until the 7.5% contribution rate isreached in July 2018. The State Treasurer has the right under the current law to make temporaryreductions in member rates based on the existence of surplus pension assets in the retirement system;however, the statute also requires the return to the normal rate when such surplus pension assets nolonger exist. The Authority is billed annually for its normal contribution, plus any accrued liability. TheAuthority began sending employee contributions to NJ PERS beginning in January 2006. The fiscal year2008 was the first year that the Authority was required to, and did, contribute an actuarially determinedamount to the plan. For the years ended December 31, 2013, 2012 and 2011, the Authority’s totalcontribution to the plan was $83, $117 and $135, respectively, which represented 100% of the requiredcontribution for the aforementioned years. For the years ended December 31, 2013, 2012 and 2011, thecontributions consisted of a normal contribution amount of $25, $33 and $45, respectively and an accruedliability amount of $58, $84 and $90, respectively.
Teamsters Pension Plan of Philadelphia and Vicinity:
Plan Description: Certain represented employees are eligible and required to participate in the TeamstersPension Plan of Philadelphia and Vicinity, which is a cost-sharing, multiple-employer benefit plan whichprovides pension, death and disability benefits. A member may retire at the later of (a) the date theemployee reaches 65 or (b) the tenth anniversary of the employee’s commencement of participation inthe plan. Additionally, employees are eligible for early retirement after 10 years of participation in the planand (a) completion of 30 years of vested service or (b) attainment of age 50 and completion of 10 years ofvested service. Benefits vest after 10 years of service. An employee who retires on or after his or hernormal retirement age is entitled to receive benefits based on his or her credited years of servicemultiplied by a monthly benefit rate, which is determined based on the employer’s daily contributions. Thebenefits are subject to maximum rates that vary according to employer daily contribution rates. Membersmay also receive benefits after early retirement at reduced rates depending on age at retirement.
An employee who qualifies for disability retirement benefits (total and permanent disability with 10 yearsof vested service and 5 years of continuous service with at least 300 covered days of contributions) isentitled to receive two hundred dollars per month until retirement age, when retirement benefits wouldcommence.
Provisions include surviving spouse death benefits, under which the surviving spouse is entitled to a 50%survivor annuity in certain cases.

Financial Section
56 DRPA 2013 Comprehensive Annual Financial Report
Delaware River Port Authority
Notes to Combined Financial Statements
Note 9. Pension Plans (Continued)
Teamsters Pension Plan of Philadelphia and Vicinity (Continued):
The Teamsters Pension Plan of Philadelphia and Vicinity issues a publicly available annual financialreport, including financial statements, which may be obtained by writing to Teamsters Pension Plan ofPhiladelphia and Vicinity, Fourth and Cherry Streets, Philadelphia, Pennsylvania 19106.
Funding Policy: The Teamsters Pension Plan is controlled by the Teamsters Pension Plan of Philadelphiaand Vicinity Board. The employer’s contribution requirements are determined under the terms of oneCollective Bargaining Agreement in force between the employer and the Teamsters. During 2013, theAuthority was required to and did contribute twenty-one dollars and eighty cents ($21.80) per day for eachPATCO participating employee. The Authority’s contributions totaled 8.02%, 8.22% and 9.81% of coveredpayroll in 2013, 2012 and 2011, respectively. The employees of the Authority make no contributions tothe plan. The Authority contributed $1,066, $1,076, and $1,077 in 2013, 2012 and 2011, respectively,which represented 100% of the required contribution for the aforementioned years.
Note 10. Post-Employment Healthcare Plan
Plan Description: The Authority provides certain health care and life insurance benefits for retiredemployees, where such benefits are established and amended by the Authority’s Board ofCommissioners. The Authority’s plan provides two agent multiple-employer post-employment healthcareplans which cover two retiree populations: eligible retirees under the age of sixty-five (65) receive benefitsthrough Amerihealth and eligible retirees sixty-five (65) and over receive benefits through the UnitedHealth Group (in partnership with AARP) and Aetna. Life insurance benefits to qualifying retirees areprovided through Prudential. The plans are administered by the Authority; therefore, premium paymentsare made directly by the Authority to the insurance carriers.
Funding Policy: Employees become eligible for retirement benefits based on hire date and years ofservice. For employees hired after January 1, 2007, no subsidized retiree benefits are offered. Thecontribution requirements of plan members and the Authority are established and may be amended bythe Authority’s Board of Commissioners. Plan members receiving benefits contribute the followingamounts: $65 per month for retiree-only coverage for the base plan, $130 per month for retiree/spouse(or retiree/child) coverage, and $195 per month for retiree/family (or children) coverage to age sixty-five(65) for the base plan, and $55 per month per retiree, per dependent for both the United Health Group (inpartnership with AARP) and Aetna coverages. An additional amount is required for those retirees, underage sixty-five (65), who opt to participate in the “buy-up plan” for retirees and their dependents.
Retirees: The Authority presently funds its current retiree post employment benefit costs on a “pay-as-you-go” basis and, as shown above, receives annual contributions from retirees to offset a portion of thisannual cost. The Authority’s contributions to the plan for the years ended 2013, 2012, and 2011 were$5,304, $4,242, and $4,242, respectively.
Future Retirees: In accordance with Statement No.45 of the Government Accounting Standards Board,the Authority is required to expense the annual required contribution of the employer (ARC), an amountactuarially determined in accordance with the parameters of Statement No. 45. The ARC represents alevel of funding that, if paid on an ongoing basis, is projected to cover normal cost each year andamortize any unfunded actuarial liabilities (or funding excess) over a period not to exceed thirty (30)years. The ARC includes the costs of both current and future retirees. The current ARC was determinedto be $4,963 at an unfunded discount rate of 5%. As stated above, the Authority has funded the cost ofexisting retirees in the amount of $5,304 and has accrued the benefit costs for future eligible employees,but has not yet begun funding this outstanding liability. The Authority began funding a portion of thisoutstanding liability during June 2014. See Note 22.

Financial Section
DRPA 2013 Comprehensive Annual Financial Report 57
Delaware River Port Authority
Notes to Combined Financial Statements
Note 10. Post-Employment Healthcare Plan (Continued)
Annual OPEB Cost: The Authority’s annual required contribution (ARC), the interest on the net OPEBobligation, the adjustment to the ARC, the increase or decrease in the net OPEB obligation, the netOPEB obligation, and the percentage of annual OPEB cost contributed to the plan for 2013, 2012 and2011 are as follows:
2013 2012 2011
Annual Required Contribution (ARC) 4,963$ 5,347$ 5,230$Interest on the net OPEB Obligation 2,068 1,978 1,897Adjustment to the ARC (1,588) (1,270) (1,270)Annual OPEB Cost 5,443 6,055 5,857Pay as You Go Cost (Existing Retirees) (5,304) (4,242) (4,242)
Increase (Decrease) in the Net OPEB Obligation 139 1,813 1,615
Net OPEB Obligation, January 1 41,363 39,550 37,935
Net OPEB Obligation, December 31 41,502$ 41,363$ 39,550$
Percentage of Annual OPEB Cost Contributed 97% 70% 72%
Funded Status and Funding Progress: As of January 1, 2013, the most recent actuarial valuation date,the Authority’s Plan was 0% funded. The actuarial accrued liability for benefits was $112,923, and theactuarial value of plan assets was $0, resulting in an unfunded actuarial accrued liability (UAAL) of$112,923. The covered payroll (annual payroll of active employees covered by the plan) was $43,453 andthe ratio of the UAAL to the covered payroll was 259.9%. (For additional information, please refer to the“Required Supplementary Information Schedule of Funding Progress for Health Benefits Plan” shown atthe end of the footnote section.) Actuarial valuations of an ongoing plan involve estimates of the value ofreported amounts and assumptions about the probability of occurrence of events far into the future.
Examples include assumptions about future employment, mortality and the healthcare cost trend.Amounts determined regarding the funded status of the plan and the annual required contributions of theemployer are subject to continual revision as actual results are compared with past expectations and newestimates are made about the future. The schedule of funding progress, presented as requiredsupplementary information following the notes to the financial statements, presents multiyear trendinformation that shows whether the actuarial value of the plan assets is increasing or decreasing overtime relative to the actuarial accrued liabilities for benefits.
Actuarial Methods and Assumptions: Projections of benefits for financial reporting purposes are based onthe substantive plan (the plan as understood by the employer and plan members) and include the typesof benefits provided at the time of each valuation and the historical pattern of sharing benefit costsbetween the employer and plan members to that point. The actuarial methods and assumptions usedinclude techniques that are designed to reduce short-term volatility in actuarial accrued liabilities and theactuarial value of assets, consistent with the long-term perspective of the calculations.

Financial Section
58 DRPA 2013 Comprehensive Annual Financial Report
Delaware River Port Authority
Notes to Combined Financial Statements
Note 10. Post-Employment Healthcare Plan (Continued)
Actuarial Methods and Assumptions (Continued): In the January 1, 2013 actuarial valuation, the projectedunit credit actuarial cost method was used. Under this method an actuarial accrued liability is determinedas the actuarial present value of the portion of projected benefits which is allocated to service before thecurrent plan year. In addition, a normal cost is determined as the actuarial present value of the portion ofprojected benefits which is allocated to service in the current plan year for each active participant underthe assumed retirement age. The UAAL is being amortized (straight-line) for thirty (30) year on an openbasis. The actuarial assumptions included the following:
Mortality: The mortality table employed in the valuation was the RP2000 Healthy Table Male andFemale.
Inflation Rate: 2.5% per annum compounded annually.
Discount Rate: Future costs have been discounted at the rate of 5.00% compounded annually forGASB 45 purposes.
Turnover: Assumptions for terminations of employment other than for death or retirement will vary byage and years of service with rates of turnover based on State Employees Retirement System ofPennsylvania.
Disability: No terminations of employment due to disability were assumed. Retirees resulting from adisability were factored into the determination of age at retirement.
Age of Retirement: The assumption that the active participants, on average, will receive their benefitswhen eligible, but no earlier than age 55.
Spousal Coverage: Married employees will remain married.
Prior Service: No prior service for active employees was assumed.
Health Care Cost Trend Rate:
Year Pre-65 Post 65Initial Trend 01/01/15 to 01/01/18 9.0% 9.0%Ultimate Trend 01/01/19 to later 5.0% 5.0%Grading Per Year 1.0% 1.0%
Projected Salary Increase: Annual salary increase is 2.5%.
Administration Expenses: The annual cost to administer the retiree claims was assumed at 2.5%which was included in the annual health care costs.
Employee Contributions: It was assumed that employees will contribute two thousand six hundredand eleven ($2,611) per year for family medical coverage and eight hundred eighty four ($884) forsingle medical coverage.

Financial Section
DRPA 2013 Comprehensive Annual Financial Report 59
Delaware River Port Authority
Notes to Combined Financial Statements
Note 11. Indentures of Trust
The Authority is subject to the provisions of the following indentures of Trust: Revenue Refunding Bondsof 1998, dated July 1, 1998; the Revenue Refunding Bonds of 2008, dated July 25, 2008 and theRevenue Refunding Bonds of 2010 and the 2010 Revenue Bonds (Series D), dated May 15, 2010 andJuly 15, 2010; and the 2013 Revenue Bonds with TD Bank N.A., dated December 1, 2013, respectively(collectively the “Bond Resolution”); the Port District Project Bonds of 1999, dated December 1, 1999, the2012 Port District Project Refunding Bonds, dated December 1, 2012, and the 2013 Revenue Bonds withTD Bank N.A., dated December 1, 2013.
The Bond Resolution requires the maintenance of the following accounts:
Project Fund: This restricted account was established in accordance with Section 6.02 of theBond Resolution. The Project Fund is held by the Trustee and is applied to pay the cost of theProjects and is pledged, pending application to such payment of costs for the security of thepayment of principal and interest on the Revenue, Revenue Refunding, and Project Bonds (the“Bonds”).
Debt Service Fund: This restricted account was established in accordance with Section 6.04 ofthe Bond Resolution for the payment of maturing interest and principal on the Bonds. Thebalance on deposit must be sufficient to enable the Trustee to withdraw amounts equal to interestdue on the Bonds, principal amounts maturing on Bonds, accrued interest included in thepurchase price of the bonds purchased for retirement, and sinking fund installments whenpayments are required.
Debt Service Reserve Fund: This restricted account was established in accordance with Section6.05 of the Bond Resolution. The amount of funds on deposit must be maintained at a level equalto the Maximum Debt Service to insure funds are available for payment of Debt Service.
Bond Redemption Fund: This restricted account was established in accordance with section 6.06of the Bond Resolution to account for amounts received from any source for the redemption ofBonds, other than mandatory sinking fund payments.
Rebate Fund: This restricted account was established in accordance with Section 6.07 of thebond Resolution account for amounts deposited from time to time in order to comply with thearbitrage rebate requirements of Section 148 of the Code as applicable to any Series of Tax-Exempt Bonds issued.
Revenue Fund: This unrestricted account was established in accordance with Section 6.03 of theBond Resolution for the Authority to deposit all Revenues. On or before the 20th day of eachcalendar month, the Trustee shall, to the extent money is available, after deduction of cash andinvestment balances for the 15% working capital reserve, transfer to or credit funds needed in thefollowing order: (1) the Debt Service Fund, (2) the Debt Service Reserve Fund, (3) any ReserveFund Credit Facility Issuer, (4) the Trustee’s Rebate Fund, (5) the Maintenance Reserve Fund,(6) the General Fund.
Maintenance Reserve Fund: This restricted account was established in accordance with Section6.08 of the Bond Resolution. These funds are maintained for reasonable and necessaryexpenses with respect to the system for major repairs, renewals, replacements, additions,betterments, enlargements, improvements and extraordinary expenses, all to the extent notprovided for in the then current Annual Budget. Money in this account is pledged for the securityof payment principal and interest on the bonds. Whenever the amount in this account exceedsthe “Maintenance Reserve Fund Requirement”, the excess shall be deposited in the GeneralFund. The “Maintenance Reserve Fund Requirement” on any date is at least $3,000.
General Fund: This unrestricted account was established in accordance with Section 6.09 of theBond Resolution. All excess funds of the Authority are recorded in the General Account. If theAuthority is not in default in the payment of bond principal or interest and all fund requirementsare satisfied, the excess funds may be used by the Authority for any lawful purpose.

Financial Section
60 DRPA 2013 Comprehensive Annual Financial Report
Delaware River Port Authority
Notes to Combined Financial Statements
Note 12. Funded and Long-Term Debt
At December 31, 2013, the Authority had $1,654,715 in Revenue, Revenue Refunding, and Port DistrictProject Bonds outstanding, consisting of bonds issued in 1999, 2008, 2010, 2012 and 2013. The 1999Port District Project Bonds were issued to an Indenture of Trust dated December 1, 1999. The 2008Revenue Refunding Bonds were issued pursuant to the Indenture of Trust dated July 1, 1998, assupplemented by a Fourth Supplemental Indenture dated October 1, 2007 and a Fifth SupplementalIndenture dated July 15, 2008. The 2010 Revenue Refunding Bonds were issued pursuant to anIndenture of Trust as previously supplemented by five supplemental indentures thereto and as furthersupplemented by a Sixth Supplemental Indenture dated as of March 15, 2010. The 2010 Revenue Bondswere issued pursuant to Indenture of Trust, dated as of July 1, 1998, a Sixth Supplemental Indenture,dated as of March 15, 2010, and a Seventh Supplemental Indenture, dated as of July 1, 2010. The 2012Port District Project Refunding Bonds were issued pursuant to an Indenture of Trust dated December 1,2012. The 2013 Revenue Bonds were issued pursuant an Indenture of Trust, a Ninth SupplementalIndenture, dated as of December 1, 2013.
1998 Port District Project Bonds (fully redeemed in 2012): On September 2, 1998, the Authority issued$84,705 of Port District Project Bonds, Series of 1998, to provide funds to finance all or a portion of thecost of certain economic development and capital projects, including reimbursing the Authority for thecost of economic development projects financed with Authority funds.
On December 20, 2012, all remaining 1998 Port District Project Bonds were redeemed, prior to maturity,at a redemption price of 100% using proceeds from the issuance of the 2012 Port District ProjectRefunding Bonds.
1999 Revenue Bonds (fully redeemed in 2012): On December 22, 1999, the Authority issued $422,310 ofRevenue Bonds of 1999 to provide funds, together with other funds available to finance, refinance orreimburse a portion of the costs of certain capital projects undertaken or to be undertaken by theAuthority.
On June 30, 2010, the Authority partially redeemed $349,360 in bonds with the issuance of $350,000 in2010 Revenue Refunding Bonds. On April 26, 2012, the Authority fully redeemed, prior to maturity, theremaining $24,225 of its 1999 Revenue Bonds.
1999 Port District Project Bonds: On December 22, 1999, the Authority issued $272,095 to provide fundsto finance (a) all or a portion of the cost of certain port improvement and economic development projectswithin the Port District, (b) a deposit of cash or a Reserve Fund Credit Facility to the credit of the DebtService Reserve Fund established under the 1999 Port District Project Bond Indenture and (c) all or aportion of the costs and expenses of the Authority relating to the issuance and sale of the 1999 PortDistrict Project Bonds (Series A and B).
The 1999 Port District Project Bonds are general corporate obligations of the Authority. The 1999 PortDistrict Project Bonds are not secured by a lien or charge on, or pledge of, any revenues or other assetsof the Authority other than the monies, if any, on deposit from time to time in the Funds established underthe 1999 Port District Project Bond Indenture. No tolls, rents, rates or other such charges are pledged forthe benefit of the 1999 Port District Project Bonds. The 1999 Port District Project Bonds are equally andratably secured by the funds on deposit in the Funds established under the 1999 Port District ProjectBond Indenture, except for the Rebate Fund. The 1999 Port District Project Bonds are payable from suchFunds and from other monies of the Authority legally available.
The 1999 Port District Project Bonds are subject to optional redemption and mandatory sinking fundredemption prior to maturity as more fully described herein.
The scheduled payment of principal and interest on the 1999 Port District Project Bonds when due areguaranteed under an insurance policy issued concurrently with the delivery of the 1999 Port DistrictProject Bonds by Financial Security Assurance Inc.
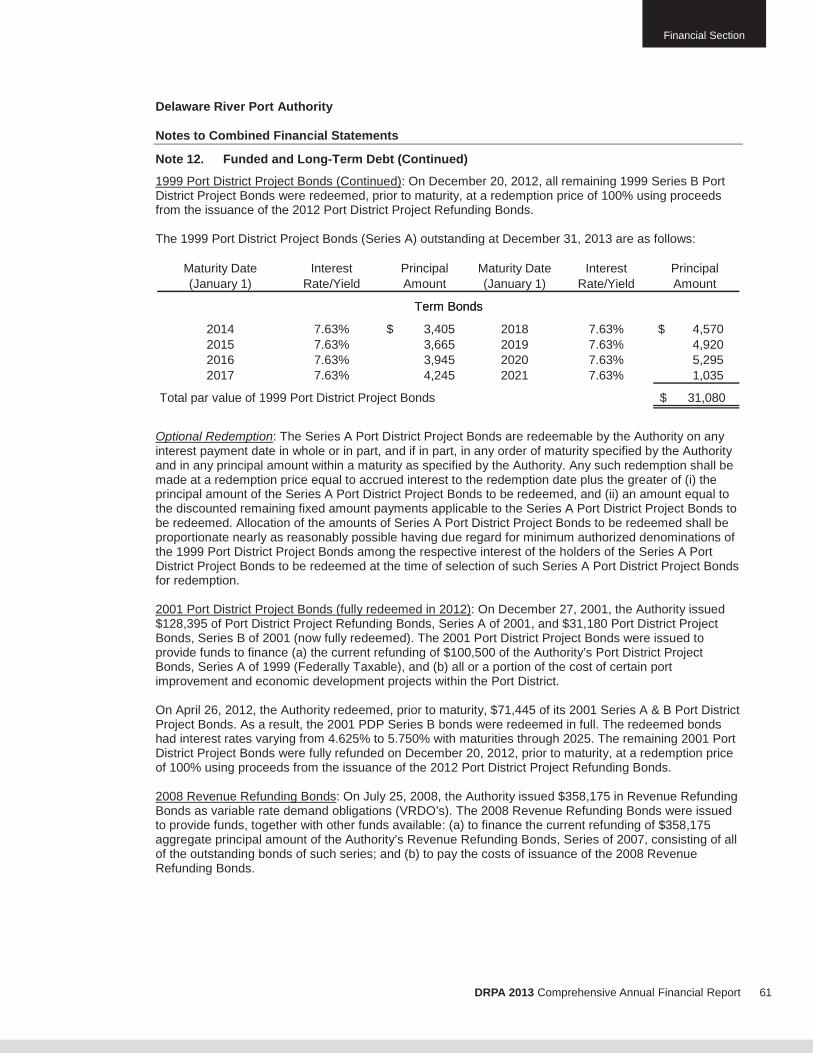
Financial Section
DRPA 2013 Comprehensive Annual Financial Report 61
Delaware River Port Authority
Notes to Combined Financial Statements
Note 12. Funded and Long-Term Debt (Continued)
1999 Port District Project Bonds (Continued): On December 20, 2012, all remaining 1999 Series B PortDistrict Project Bonds were redeemed, prior to maturity, at a redemption price of 100% using proceedsfrom the issuance of the 2012 Port District Project Refunding Bonds.
The 1999 Port District Project Bonds (Series A) outstanding at December 31, 2013 are as follows:
Maturity Date Interest Principal Maturity Date Interest Principal(January 1) Rate/Yield Amount (January 1) Rate/Yield Amount
2014 7.63% 3,405$ 2018 7.63% 4,570$2015 7.63% 3,665 2019 7.63% 4,9202016 7.63% 3,945 2020 7.63% 5,2952017 7.63% 4,245 2021 7.63% 1,035
Total par value of 1999 Port District Project Bonds 31,080$
Term BondsTerm Bonds
Optional Redemption: The Series A Port District Project Bonds are redeemable by the Authority on anyinterest payment date in whole or in part, and if in part, in any order of maturity specified by the Authorityand in any principal amount within a maturity as specified by the Authority. Any such redemption shall bemade at a redemption price equal to accrued interest to the redemption date plus the greater of (i) theprincipal amount of the Series A Port District Project Bonds to be redeemed, and (ii) an amount equal tothe discounted remaining fixed amount payments applicable to the Series A Port District Project Bonds tobe redeemed. Allocation of the amounts of Series A Port District Project Bonds to be redeemed shall beproportionate nearly as reasonably possible having due regard for minimum authorized denominations ofthe 1999 Port District Project Bonds among the respective interest of the holders of the Series A PortDistrict Project Bonds to be redeemed at the time of selection of such Series A Port District Project Bondsfor redemption.
2001 Port District Project Bonds (fully redeemed in 2012): On December 27, 2001, the Authority issued$128,395 of Port District Project Refunding Bonds, Series A of 2001, and $31,180 Port District ProjectBonds, Series B of 2001 (now fully redeemed). The 2001 Port District Project Bonds were issued toprovide funds to finance (a) the current refunding of $100,500 of the Authority’s Port District ProjectBonds, Series A of 1999 (Federally Taxable), and (b) all or a portion of the cost of certain portimprovement and economic development projects within the Port District.
On April 26, 2012, the Authority redeemed, prior to maturity, $71,445 of its 2001 Series A & B Port DistrictProject Bonds. As a result, the 2001 PDP Series B bonds were redeemed in full. The redeemed bondshad interest rates varying from 4.625% to 5.750% with maturities through 2025. The remaining 2001 PortDistrict Project Bonds were fully refunded on December 20, 2012, prior to maturity, at a redemption priceof 100% using proceeds from the issuance of the 2012 Port District Project Refunding Bonds.
2008 Revenue Refunding Bonds: On July 25, 2008, the Authority issued $358,175 in Revenue RefundingBonds as variable rate demand obligations (VRDO’s). The 2008 Revenue Refunding Bonds were issuedto provide funds, together with other funds available: (a) to finance the current refunding of $358,175aggregate principal amount of the Authority’s Revenue Refunding Bonds, Series of 2007, consisting of allof the outstanding bonds of such series; and (b) to pay the costs of issuance of the 2008 RevenueRefunding Bonds.

Financial Section
62 DRPA 2013 Comprehensive Annual Financial Report
Delaware River Port Authority
Notes to Combined Financial Statements
Note 12. Funded and Long-Term Debt (Continued)
2008 Revenue Refunding Bonds (Continued): The 2008 Revenue Refunding Bonds were issued pursuantto the Compact, the New Jersey Act, the Pennsylvania Act (as such terms are defined herein) and anIndenture of Trust dated as of July 1, 1998, by and between the Authority and TD Bank, N.A., Cherry Hill,New Jersey, as successor to Commerce Bank, N.A. (the “Trustee”), as supplemented by a FirstSupplemental Indenture dated as of July 1, 1998, a Second Supplemental Indenture dated as of August15, 1998, a Third Supplemental Indenture dated as of December 1, 1999, a Fourth SupplementalIndenture dated as of October 1, 1997 and a Fifth Supplemental Indenture dated as of July 15, 2008 (the“Fifth Supplemental Indenture”) (collectively, the “1998 Revenue Bond Indenture”).
The 2008 Revenue Refunding Bonds, together with all other indebtedness outstanding under the 1998Revenue Bond Indenture and any parity obligations hereafter issued under the 1998 Revenue BondIndenture, are equally and ratably payable solely from and secured by a lien on and security interest in (i)the Net Revenues described herein, (ii) all moneys, instruments and securities at any time and from heldby the Authority or the Trustee in any Fund created or established under the 1998 Revenue BondIndenture and (iii) the proceeds of all the foregoing, except for the moneys, instruments and securitiesheld in the 1998 General Fund and the 1998 Rebate Fund. The 2008A Letter of Credit (as defined herein)secures only the 2008A Revenue Refunding Bonds and the 2008B Letter of Credit (as defined herein)secures only the 2008B Revenue Refunding Bonds.
The 2008 Revenue Refunding Bonds are subject to purchase on the demand of the holder at a priceequal to principal plus accrued interest on seven days’ notice and delivery to the Authority’s tender agent,TD Bank, N.A. The tender agent shall provide a copy of said notice to the applicable remarketing agent,who is authorized to use its best efforts to sell the repurchased bonds at a price equal to 100 percent ofthe principal plus accrued interest to the purchase date.
Under irrevocable direct pay letters of credit (“DPLOC”) issued by Bank of America, N.A. and TD Bank,N.A., the trustee or the remarketing agent is entitled to draw an amount sufficient to pay the purchaseprice of the bonds delivered to it. The letters of credit require the Authority to make immediate payment ofany draws under the line and were valid through July 23, 2013. In 2013, the letters of credit wereextended as noted below.
The Authority is required to pay annual facility fees to Bank of America, N.A. and TD Bank, N.A. for theletters of credit. The fee was calculated based on 1.35% of the gross amount available under the linebased on the Authority’s bond ratings, as determined by Moody’s and S&P. In addition, the Authority isrequired to pay an annual remarketing fee, payable quarterly in arrears, equal to 0.07% of the aggregateprincipal amount of the bonds outstanding at the beginning of the period.
On June 28, 2013, the Authority amended and extended its DPLOC with TD Bank, N.A. supporting the2008 Revenue Refunding Bonds, Series B, to expire on December 31, 2017. In addition, the Authorityamended and extended its DPLOC with the Bank of America, N.A., effective on July 22, 2013, to expireon July 22, 2016.The new LOC fees range from 0.65% to 0.70%. The annual remarketing fees remainedunchanged.

Financial Section
DRPA 2013 Comprehensive Annual Financial Report 63
Delaware River Port Authority
Notes to Combined Financial Statements
Note 12. Funded and Long-Term Debt (Continued)
2008 Revenue Refunding Bonds (Continued): The 2008 Revenue Refunding Bonds outstanding atDecember 31, 2013 are as follows:
Maturity Date Interest Principal Maturity Date Interest Principal(January 1) Rate/Yield Amount (January 1) Rate/Yield Amount
2026 Variable 144,245$ 2026 Variable 160,265$
Total par value of 2008 Revenue Refunding Bonds 304,510$
Interest Rate Mode: WeeklyRate Determination Date: Generally each WednesdayInterest Payment Dates: First Business Day of each monthRate in Effect at December 31, 2013: Series A - 0.03%; Series B - 0.03%
Series A Series B
Optional Redemption: While in the Weekly Mode, the 2008A Revenue Refunding Bonds are subject tooptional redemption by the Authority, in whole or in part, in Authorized Denominations on any BusinessDay, at redemption price equal to the principal amount thereof, plus accrued interest, if any, to theRedemption Date. While in the Weekly Mode, the 2008B Revenue Refunding Bonds are subject tooptional redemption by the Authority, in whole or in part, in Authorized Denominations on any BusinessDay, at a redemption price equal to the principal amount thereof, plus accrued interest, if any, to theRedemption Date.
Sinking Fund Redemption: The 2008 Revenue Refunding Bonds are subject to mandatory redemption inpart on January 1 of each year and in the respective principal amounts set forth below at one hundredpercent (100%) of the principal amount of 2008 Revenue Refunding Bonds to be redeemed, plus interestaccrued to the Redemption Date, from funds which the Authority covenants to deposit in the 2008ABonds Sinking Fund Account created in the 1998 Debt Service Fund established pursuant to 1998Revenue Bond Indenture, in amounts sufficient to redeem on January 1 of each year the principal amountof such 2008 Revenue Refunding Bonds for each of the years set forth below:
January 1 Series A Series B Total
2014 7,915$ 8,795$ 16,710$2015 8,345 9,275 17,6202016 8,800 9,775 18,5752017 9,280 10,310 19,5902018 9,785 10,870 20,6552019 10,315 11,465 21,7802020 10,880 12,090 22,9702021 11,475 12,745 24,2202022 12,100 13,440 25,5402023 12,755 14,175 26,9302024 13,455 14,945 28,4002025 14,185 15,760 29,9452026 14,955 16,620 31,575
144,245$ 160,265$ 304,510$
Sinking Fund Installments

Financial Section
64 DRPA 2013 Comprehensive Annual Financial Report
Delaware River Port Authority
Notes to Combined Financial Statements
Note 12. Funded and Long-Term Debt (Continued)
2010 Revenue Refunding Bonds: On June 30, 2010, the Authority issued $350,000 in Revenue RefundingBonds, Series A of 2010, Revenue Refunding Bonds, Series B of 2010 and Revenue Refunding Bonds,Series C of 2010 as variable rate demand obligations (“VRDOs”). The 2010 Revenue Refunding Bondswere issued pursuant to the Indenture of Trust dated as of July 1, 1998 by and between the Authority andTD Bank, N.A., Cherry Hill, New Jersey, as successor to Commerce Bank, N.A. (“Trustee”), as previouslysupplemented by five supplemental indentures thereto and as further supplemented by a SixthSupplemental Indenture (“Sixth Supplemental Indenture”) dated as of March 15, 2010 (collectively, “1998Revenue Bond Indenture”). The 2010 Revenue Refunding Bonds were issued to provide funds, togetherwith other available funds, to (i) currently refund $349,360 aggregate principal amount of the Authority’soutstanding Revenue Bonds, Series of 1999, (ii) fund any required deposit to the 1998 Debt ServiceReserve Fund (defined herein), and (iii) pay the costs of issuance of the 2010 Revenue Refunding Bonds.
The 2010 Revenue Refunding Bonds are subject to purchase on the demand of the holder at a price equalto principal plus accrued interest on seven days’ notice and delivery to the Authority’s tender agent, TDBank, N.A. The tender agent shall provide a copy of said notice to the applicable remarketing agent, who isauthorized to use its best efforts to sell the repurchased bonds at a price equal to 100 percent of theprincipal plus accrued interest to the purchase date.
Under irrevocable letters of credit issued by J.P. Morgan Chase, N.A., Bank of America, N.A. and PNCBank, N.A., the trustee or the remarketing agent is entitled to draw an amount sufficient to pay thepurchase price of the bonds delivered to it. The letters of credit require the Authority to make immediatepayment of any draws under the line and were valid through March 29, 2013. In 2013, the letters of creditwere replaced as noted below.
The Authority was required to pay annual facility fees to J.P. Morgan Chase, N.A., Bank of America, N.A.and PNC Bank, N.A. for the letters of credit in percentages varying from 1.35% to 1.675% of the grossamount available under the LOC, through March 21, 2013, when these LOCs were replaced. In addition,the Authority was required to pay an annual remarketing fee, payable quarterly in arrears, equal to 0.10%of the aggregate principal amount of the bonds outstanding at the beginning of the period. On March 21,the Authority completed its LOC substitution/replacement program, replacing the existing LOC providerswith three new banks: Royal Bank (Series A), Barclays Bank (Series B), and Bank of New York Mellon(Series C). The LOC fees were reduced, ranging from 0.45% to 0.70%, and the remarketing fee for eachseries was reduced to 0.08%/annum.
The 2010 Revenue Refunding Bonds outstanding at December 31, 2013 were as follows:
Maturity Date Interest Principal(January 1) Rate/Yield Amount
Series A 2026 Variable 150,000$Series B 2026 Variable 150,000Series C 2026 Variable 50,000
Total par value of 2010 Revenue Refunding Bonds 350,000$
Interest rate Mode: WeeklyRate Determination Date: Generally each WednesdayRate in Effect at December 31, 2013: Series A - 0.04%; Series B - 0.04%; Series C -0.05%
Optional Redemption: While in the Weekly Mode, each Series of the 2010 Revenue Refunding Bonds issubject to optional redemption by the Authority, in whole or in part, in Authorized Denominations on anyBusiness Day, at a redemption price equal to the principal amount thereof, plus accrued interest, if any, tothe applicable Redemption Date.

Financial Section
DRPA 2013 Comprehensive Annual Financial Report 65
Delaware River Port Authority
Notes to Combined Financial Statements
Note 12. Funded and Long-Term Debt (Continued)
2010 Revenue Refunding Bonds (Continued):
Mandatory Sinking Fund Redemption: The 2010 Revenue Refunding Bonds are subject to mandatoryredemption in part on January 1 of each year and in the respective principal amounts set forth below at100% of the principal amount of 2010 Revenue Refunding Bonds to be redeemed, plus interest accruedto the Redemption Date, from funds which the Authority covenants to deposit in the 2010A Bonds SinkingFund Account, 2010B Bonds Sinking Fund Account, and 2010C Bonds Sinking Fund Account created inthe 1998 Debt Service Fund established pursuant to 1998 Revenue Bond Indenture, in amounts sufficientto redeem on January 1 of each year the principal amount of such 2010 Revenue Refunding Bonds foreach of the years set forth below:
January 1 Series A Series B Series C Total
2014 5,460$ 5,460$ 1,825$ 12,745$2015 8,700 8,700 2,900 20,3002016 9,195 9,195 3,070 21,4602017 9,730 9,730 3,240 22,7002018 10,280 10,280 3,430 23,9902019 10,875 10,875 3,625 25,3752020 11,500 11,500 3,830 26,8302021 12,160 12,160 4,055 28,3752022 12,855 12,860 4,285 30,0002023 13,595 13,595 4,530 31,7202024 14,375 14,375 4,790 33,5402025 15,200 15,200 5,065 35,4652026 16,075 16,070 5,355 37,500
150,000$ 150,000$ 50,000$ 350,000$
Sinking Fund Installments
2010 Revenue Bonds: On July 15, 2010, the Authority issued $308,375 in Revenue Bonds, Series D of2010 (the “2010 Revenue Bonds”). The 2010 Revenue Bonds were issued by means of a book-entry-onlysystem evidencing ownership and transfer of 2010 Revenue Bonds on the records of The DepositoryTrust Company, New York, New York (“DTC”), and its participants. Interest on the 2010 Revenue Bondswill be payable semi-annually on January 1 and July 1 of each year commencing January 1, 2011 (eachan “Interest Payment Date”).
The 2010 Revenue Bonds were issued pursuant to the Compact, the New Jersey Act, the PennsylvaniaAct (as such terms are defined herein) and an Indenture of Trust, dated as of July 1, 1998, by andbetween the Authority and TD Bank, N.A., Cherry Hill, New Jersey, as successor to Commerce Bank,N.A. (the “Trustee”), as supplemented by a First Supplemental Indenture, dated as of July 1, 1998, aSecond Supplemental Indenture, dated as of August 15, 1998, a Third Supplemental Indenture, dated asof December 1, 1999, a Fourth Supplemental Indenture, dated as of October 1, 2007, a FifthSupplemental Indenture, dated as of July 15, 2008, a Sixth Supplemental Indenture, dated as of March15, 2010, and a Seventh Supplemental Indenture, dated as of July 1, 2010 (collectively, the “1998Revenue Bond Indenture”). The 2010 Revenue Bonds were issued for the purpose of: (i) financing aportion of the costs of the Authority’s approved Capital improvement Program; (ii) funding the DebtService Reserve Requirement for the 2010 Revenue Bonds; and (iii) paying the costs of issuance of the2010 Revenue Bonds (Series D). (Note: As per its 2008 Reimbursement Resolution, upon issuance of the2010 Revenue Bonds, the Authority reimbursed its General Fund, for approximately $100 million, for priorcapital expenditures made during the period October 2008 through July 2010).

Financial Section
66 DRPA 2013 Comprehensive Annual Financial Report
Delaware River Port Authority
Notes to Combined Financial Statements
Note 12. Funded and Long-Term Debt (Continued)
2010 Revenue Bonds (Continued): The 2010 Revenue Bonds are limited obligations of the Authority andare payable solely from the sources referred to in the 2010 Revenue Bonds and the 1998 Revenue BondIndenture. Neither the credit nor the taxing power of the Commonwealth of Pennsylvania (the“Commonwealth”) or the State of New Jersey (the “State”) or of any county, city, borough, village,township or other municipality of the Commonwealth or the State is or shall be pledged for the payment ofthe principal, redemption premium, if any, or interest on the 2010 Revenue Bonds. The 2010 RevenueBonds are not and shall not be deemed to be a debt or liability of the Commonwealth or the State or ofany such county, city, borough, village, township or other municipality, and neither the Commonwealthnor the State nor any such county, city, borough, village, township or other municipality is or shall beliable for the payment of such principal or, redemption premium, or interest. The Authority has no taxingpower.
Mandatory Sinking Fund Redemption: The 2010 Revenue Bonds maturing January 1, 2035 andJanuary 1, 2040 are subject to mandatory redemption prior to maturity by the Authority, in part, onJanuary 1 of each year in the respective principal amounts set forth below at 100% of the principalamount thereof, plus accrued interest to the Redemption Date from sinking fund installments which arerequired to be paid in amounts sufficient to redeem on January 1 of each year the principal amount ofsuch 2010 Revenue Bonds specified for each of the years set forth below. Payment of principal andinterest on the 2010 Revenue Bonds (the “2010 Insured Bonds”), in the principal amount of $60,000maturing January 1, 2040 is guaranteed under an insurance policy issued by Assured Guaranty MunicipalCorp. (formerly known as Financial Security Assured, Inc.).
The 2010 Revenue Bonds outstanding at December 31, 2013 are as follows:
Maturity Date Interest Principal Maturity Date Interest Principal(January 1) Rate/Yield Amount (January 1) Rate/Yield Amount
2027 5.00% 3,465$2028 5.00% 17,2102029 5.00% 18,0702030 5.00% 18,975
57,720
2031 5.00% 16,245$ 2036 5.00% 14,5752031 5.05% 3,675 2036 5.00% 10,8602032 5.00% 17,055 2037 5.00% 15,3102032 5.05% 3,865 2037 5.00% 11,4002033 5.00% 17,905 2038 5.00% 16,0752033 5.05% 4,060 2038 5.00% 11,9702034 5.00% 18,810 2039 5.00% 16,8752034 5.05% 4,260 2039 5.00% 12,5702035 5.00% 19,750 2040 5.00% 17,7202035 5.05% 4,475 2040 5.00% 13,200
250,655
Total par value of 2010 Revenue Bonds 308,375Less unamortized bond discount (521)
Total 2010 Revenue Bonds, net 307,854$
Serial Bonds
Term Bonds
Financial Section
DRPA 2013 Comprehensive Annual Financial Report 67
Delaware River Port Authority
Notes to Combined Financial Statements
Note 12. Funded and Long-Term Debt (Continued)
2010 Revenue Bonds (Continued):
Optional Redemption: The 2010 Revenue Bonds are subject to redemption at the option of the Authority,prior to maturity, in whole or in part (and if in part, in such order of maturity or within a maturity as theAuthority shall specify, or if the Authority shall fail to specify, by lot or by such other method as the PayingAgent determines to be fair and reasonable and in any principal amount in Authorized Denominations) atany time on or after January 1, 2020. Any such redemption shall be made at a redemption price equal to100% of the principal amount of the 2010 Bonds to be redeemed, plus accrued interest to theRedemption Date.
2012 Port District Project Refunding Bonds: On December 20, 2012, the Authority issued $153,030 inPort District Project Refunding Bonds, Series 2012. The Port District Project Refunding Bonds, Series2012 (the “2012 Bonds”) were issued pursuant to the Compact, the New Jersey Act, the Pennsylvania Act(as such terms are defined herein) and an Indenture of Trust (the "Indenture") dated as of December 1,2012, between the Authority and TD Bank, N.A., Cherry Hill, New Jersey, as trustee (the "Trustee").The2012 Bonds were issued to (i) refund and redeem all of the outstanding principal balance of and interestaccrued on the Authority's outstanding Port District Project Bonds, Series B of 1998, (the "1998 RefundedBonds"), Port District Project Bonds, Series B of 1999 (the "1999 Refunded Bonds"), and Port DistrictProject Bonds, Series A of 2001 (the "2001 Refunded Bonds").
The refunding resulted in a loss (difference between the reacquisition price and the net carrying amountof the old debt) of $7 million. This difference, reported in the accompanying financial statements as adeferred outflow of resources, is being charged to operations through the year 2025 using the effectiveinterest method. The Authority completed the refunding to reduce its total debt service payments over thenext 15 years by $69.3 million and to obtain an economic gain (difference between the present values ofthe old debt and new debt service payments) of $37 million. See Note 13.
The 2012 Bonds are general corporate obligations of the Authority. The 2012 Bonds are not secured by alien or charge on, or pledge of, any revenues or other assets of the Authority other than the moneys, ifany, on deposit from time to time in the Funds established under the Indenture, except for the RebateFund. No tolls, rents, rates or other charges are pledged for the benefit of the 2012 Bonds. The 2012Bonds are equally and ratably secured by the monies, if any, on deposit in the Funds established underIndenture, except for the Rebate Fund. The 2012 Bonds are payable from such Funds and from othermonies of the Authority legally available therefore.
Redemption Provisions:
Optional Redemption: The 2012 Bonds maturing on or after January 1, 2024 are subject to redemptionprior to maturity at the option of the Authority on or after January 1, 2023, in whole at any time, or in partat any time and from time to time, in any order of maturity specified by the Authority and within a maturityas selected by the Trustee as provided in the Indenture and as summarized below under the subheading“Redemption Provisions – Selection of 2012 Bonds to be Redeemed.” Any such redemption shall bemade at a redemption price equal to the principal amount of the Bonds to be redeemed plus interestaccrued to the date fixed for redemption.
Payment of Redemption Price: Notice of redemption having been given in the manner provided in theIndenture, or written waivers of notice having been filed with the Trustee prior to the date set forredemption, the 2012 Bonds (or portions thereof) so called for redemption shall become due and payableon the redemption date so designated and interest on such 2012 Bonds (or portions thereof) shall ceaseto accrue from the redemption date whether or not such Bonds shall be presented for payment. Theprincipal amount of all 2012 Bonds so called for redemption, together with the redemption premium, ifany, payable with respect thereto and accrued and unpaid interest thereon to the date of redemption,shall be paid (upon presentation and surrender of such 2012 Bonds) by the Paying Agent out of theappropriate Fund or other funds deposited for the purpose.

Financial Section
68 DRPA 2013 Comprehensive Annual Financial Report
Delaware River Port Authority
Notes to Combined Financial Statements
Note 12. Funded and Long-Term Debt (Continued)
2012 Port District Project Refunding Bonds (Continued):
Redemption Provisions (Continued):
Selection of 2012 Bonds to be Redeemed: If less than all of the 2012 Bonds are to be redeemed and paidprior to maturity, 2012 Bonds registered in the name of the Authority shall be redeemed before other 2012Bonds are redeemed. Thereafter, the portion of 2012 Bonds to be redeemed shall be selected by theAuthority, or if no such selection is made, by lot by the Trustee from among all Outstanding 2012 Bondseligible for redemption. In the case of a partial redemption of 2012 Bonds when 2012 Bonds ofdenominations greater than the minimum Authorized Denomination are Outstanding, then for all purposesin connection with such redemption, each principal amount equal to the minimum AuthorizedDenomination shall be treated as though it were a separate 2012 Bond for purposes of selecting the 2012Bonds to be redeemed, provided that no 2012 Bonds shall be redeemed in part if the principal amount tobe Outstanding following such partial redemption is not an Authorized Denomination.
The 2012 Port District Project Refunding Bonds outstanding at December 31, 2013 are as follows:
Maturity Date Interest Principal Maturity Date Interest Principal(January 1) Rate/Yield Amount (January 1) Rate/Yield Amount
2014 3.00% 5,790$ 2021 5.00% 12,350$2015 4.00% 5,800 2022 5.00% 14,0852016 5.00% 6,030 2023 3.00% 2402017 5.00% 6,335 2023 5.00% 14,5452018 2.00% 225 2024 5.00% 15,5202018 5.00% 6,425 2025 5.00% 16,3002019 5.00% 6,975 2026 5.00% 17,1152020 5.00% 7,320 2027 5.00% 17,975
153,030
Total par value of 2012 Port District Project Refunding Bonds 153,030Add unamortized bond premium 19,885
Total 2012 Port District Project Refunding Bonds, net 172,915$
2013 Revenue Bonds: On December 18, 2013, the Delaware River Port Authority issued its RevenueBonds, Series of 2013 in the aggregate principal amount of $476,585,000. The 2013 Revenue Bondswere issued by means of a book-entry-only system evidencing ownership and transfer of 2013 RevenueBonds on the records of The Depository Trust Company, New York, New York (“DTC”), and itsparticipants. Interest on the 2013 Revenue Bonds will be payable semi-annually on January 1 and July 1of each year commencing July 1, 2014 (each an “Interest Payment Date”).
The 2013 Revenue Bonds were issued pursuant to the Compact, the New Jersey Act, the PennsylvaniaAct (as such terms are defined herein) and an Indenture of Trust, dated as of July 1, 1998, by andbetween the Authority and TD Bank, National Association, Cherry Hill, New Jersey, as successor toCommerce Bank, National Association, as trustee (the “Trustee”), as heretofore supplemented from timeto time, including as supplemented by a Ninth Supplemental Indenture, dated as of December 1, 2013(collectively, the “1998 Revenue Bond Indenture”). The 2013 Revenue Bonds are being issued for thepurpose of: (i) financing a portion of the costs of the Authority’s approved capital improvement program;(ii) funding a deposit to the 1998 Debt Service Reserve Fund established under and as specificallydefined in the 1998 Revenue Bond Indenture; and (iii) paying the costs of issuance of the 2013 RevenueBonds.

Financial Section
DRPA 2013 Comprehensive Annual Financial Report 69
Delaware River Port Authority
Notes to Combined Financial Statements
Note 12. Funded and Long-Term Debt (Continued)
2013 Revenue Bonds (Continued): The 2013 Revenue Bonds are limited obligations of the Authority andare payable solely from the sources referred to in the 2013 Revenue Bonds and the 1998 Revenue BondIndenture. Neither the credit nor the taxing power of the Commonwealth of Pennsylvania (the“Commonwealth”) or the State of New Jersey (the “State”) or of any county, city, borough, village,township or other municipality of the Commonwealth or the State is or shall be pledged for the payment ofthe principal, redemption premium, if any, or interest on the 2013 Revenue Bonds. The 2013 RevenueBonds are not and shall not be deemed to be a debt or liability of the Commonwealth or the State or ofany such county, city, borough, village, township or other municipality, and neither the Commonwealthnor the State nor any such county, city, borough, village, township or other municipality is or shall beliable for the payment of such principal, redemption premium, or interest. The Authority has no taxingpower.
The 2013 Revenue Bonds outstanding at December 31, 2013 are as follows:
Maturity Date Interest Principal Maturity Date Interest Principal(January 1) Rate/Yield Amount (January 1) Rate/Yield Amount
2027 5.000% 23,560$ 2034 5.000% 33,355$2027 4.125% 845 2034 4.625% 8102028 5.000% 25,615 2035 5.000% 35,8702029 5.000% 26,895 2036 5.000% 37,6602030 5.000% 28,070 2037 5.000% 36,5402030 4.500% 170 2038 4.750% 3,0002031 5.000% 29,650 2038 5.000% 41,5152032 4.500% 31,135 2039 5.000% 43,5902033 5.000% 32,535 2040 5.000% 45,770
476,585Total par value of 2013 Revenue Bonds 476,585Add unamortized bond premium 11,771Total 2013 Revenue Bonds, net 488,356$
Optional Redemption: The 2013 Revenue Bonds are subject to redemption at the option of the Authority,prior to maturity, in whole or in part (and if in part, in such order of maturity or within a maturity as theAuthority shall specify, or if the Authority shall fail to specify, by lot or by such other method as the PayingAgent determines to be fair and reasonable and in any principal amount in Authorized Denominations), atany time on or after January 1, 2024. Any such redemption shall be made at a redemption price equal to100% of the principal amount of the 2013 Revenue Bonds to be redeemed, plus accrued interest to theRedemption Date.

Financial Section
70 DRPA 2013 Comprehensive Annual Financial Report
Delaware River Port Authority
Notes to Combined Financial Statements
Note 12. Funded and Long-Term Debt (Continued)
Maturities of Principal and Interest on Bonds: The following presents the principal and interest due on allbonds outstanding as of December 31, 2013 (assuming the letter of credit agreements with respect to thevariable rate 2008 and 2010 Revenue Refunding Bonds are renewed over the term of the bonds and thebonds are remarketed):
Years Ending December 31, Principal Interest* Total
2014 38,650$ 22,198$ 60,848$2015 47,385 21,671 69,0562016 50,010 21,054 71,0642017 52,870 20,398 73,2682018 55,865 19,708 75,5732019-2023 330,505 87,331 417,8362024-2028 334,030 68,126 402,1562029-2033 248,305 56,609 304,9142034-2038 316,235 28,506 344,7412039-2041 149,725 1,548 151,273
1,623,580 347,149$ 1,970,729$
Net unamortized bond discounts and premiums 31,135
1,654,715$
* Does not include the net swap payments on the Authority’s hedged variable ratebonds as detailed on page 34 (Note 4).
The interest on variable rate debt is computed using the interest rate effective at December 31, 2013. Theinterest rates on the Authority’s variable rate debt are set by the remarketing agent and are reset weekly.As of December 31, 2013, the outstanding balance on the 2008 and 2010 Revenue Refunding Bondswas $654,510, which is reported in the table above as maturing in 2014 through 2026.
In June 2013, the letters of credit supporting the 2008 variable rate bonds were renewed and extendedwith Bank of America, N.A. and TD Bank, N.A. to July 2016 and December 2017, respectively. If the letterof credit agreements supporting the 2008 variable rate bonds are not renewed in 2016 and 2017 and the2008 bonds are mandatorily redeemed, the 2016 debt service requirements will be $169,195, rather thanthe $50,010 shown in the table above and the 2017 debt service requirements will be $174,980, ratherthan the $52,870 shown in the table above.
In March 2013, the letters of credit supporting the 2010 variable rate bonds were replaced with newletters of credit from Royal Bank of Canada (Series A), Barclay’s Bank PLC (Series B), and The Bank ofNew York Mellon (Series C), which expire in March 2016, March 2015, and March 2016, respectively. Ifthe letter of credit agreements supporting the 2010 Series A and Series C variable rate bonds are notrenewed in 2016 and the 2010 Series A and Series C bonds are mandatorily redeemed, the 2016 debtservice requirements will be $206,595, rather than the $50,010 shown in the table above. If the letter ofcredit agreement supporting the 2010 Series B variable rate bonds is not renewed in 2015 and the 2010Series B bonds are mandatorily redeemed, the 2015 debt service requirement will be $165,330, ratherthan the $47,385 shown in the table above.
Interest on all of the Authority’s fixed rate debt (revenue bonds and port district project bonds issued in1999, 2010, 2012 and 2013) is payable semi-annually on January 1 and July 1 in each year. Interest onthe 2008 and 2010 Revenue Refunding Bonds is payable monthly on the first business day of eachmonth. The Authority is current on all of its monthly debt service payments on all obligations.

Financial Section
DRPA 2013 Comprehensive Annual Financial Report 71
Delaware River Port Authority
Notes to Combined Financial Statements
Note 12. Funded and Long-Term Debt (Continued)
Debt Authorized But Not Issued: At its August 2013 meeting, the Authority’s Board authorized theissuance, sale and delivery of up to $550 million in taxable or tax-exempt fixed rate bonds, to fund the5-year 2013 Capital Plan (DRPA-13-094). This resolution rescinded and repealed all prior resolutions(DRPA-09-064 and DRPA-13-030) and any prior inconsistent resolutions. In December 2013, theAuthority issued $476.6 million in fixed rate bonds (the 2013 Revenue Bonds) based on this resolution.
Bond Ratings (Unaudited):
Moody’s Investors Service Bond Ratings (Moody’s): Concurrent with the issuance of the $153.03 millionin Port District Project Refunding Bonds, on November 30, 2012, Moody’s affirmed the ratings on allAuthority Revenue and Port District Project Bonds; however, the outlook improved from “negative” to“stable” on all bonds. (This represented the first change in Moody’s ratings since it had assigned a“negative” outlook on all the Authority’s bonds in March of 2010).
Concurrent with the Authority’s issuance of the $476.6 million in new revenue bonds, in its report datedNovember 22, 2013, Moody’s assigned a rating of “A3” to the 2013 Revenue Bonds, and affirmed itsexisting ratings on all Authority bonds (revenue bonds at “A3”, port district bonds at “Baa3”). The outlookremains at “stable” for all bonds. As of December 31, 2013, these ratings and outlook remain in place.
Standard & Poor’s Ratings Services Bond Ratings (S&P): Concurrent with the issuance of $153.03 millionin Port District Project Refunding Bonds, on November 30, 2012, S&P affirmed the ratings on all AuthorityRevenue and Port District Project Bonds; however the outlook improved from “stable” to “positive” on allbonds. (This represented the first change in S&P’s ratings outlook since it had assigned a “stable”outlook on all the Authority’s bonds since July 2009).
Concurrent with the Authority’s issuance of $476.6 million in new revenue bonds, in its report datedNovember 27, 2013, S&P assigned a rating of “A” on the new series, and upgraded the Authority’s ratingson both its revenue and refunding bonds (from “A-“ to “A”) and on its port district project bonds (from“BBB-“ to “BBB”). The outlook is “stable” for all Authority bonds. As of December 31, 2013, these ratingsand outlook remain in place.
Ratings on Jointly Supported Transactions: Moody’s Investors Service (“Moody’s”) and Standard & Poor’sRatings Services, a division of The McGraw-Hill Companies, Inc. (“S&P”), initially assigned their municipalbond ratings to the 2008 Revenue Refunding Bonds based upon the understanding that upon delivery ofthe 2008A Revenue Refunding Bonds or 2008B Revenue Refunding Bonds, the respective Letter ofCredit securing the payment when due of the principal of, or purchase price of 2008A Revenue RefundingBonds or 2008B Revenue Refunding Bonds tendered for purchase and not otherwise remarketed andinterest on the 2008A Revenue Refunding Bonds or 2008B Revenue Refunding Bonds will be deliveredby Bank of America, N.A. and TD Bank, N.A., respectively.

Financial Section
72 DRPA 2013 Comprehensive Annual Financial Report
Delaware River Port Authority
Notes to Combined Financial Statements
Note 12. Funded and Long-Term Debt (Continued)
Bond Ratings (Unaudited) (Continued):
Ratings on Jointly Supported Transactions (Continued): The long-term ratings assigned by Moody’s andS&P reflect each organization’s approach to rating jointly supported transactions and are based upon theDirect Pay Letters of Credit provided by Bank of America, N.A. for the 2008A Revenue Refunding Bondsand TD Bank, N.A. for the 2008B Revenue Refunding Bonds. Since a loss to a bondholder of a 2008ARevenue Refunding Bond or a 2008B Revenue Refunding Bond would occur only if both the bankproviding the applicable Letter of Credit and the Authority default in payment, Moody’s and S&P haveassigned a long-term rating to the 2008 Revenue Refunding Bonds based upon the joint probability ofdefault by both applicable parties. In determining the joint probability of default, Moody’s considers thelevel of correlation between the bank providing the applicable Letter of Credit and the Authority. Moody’shas determined that there is a low level of correlation between the bank providing the applicable Letter ofCredit and the Authority.
No provider of a Letter of Credit is obligated to maintain its present or any other credit rating and shallhave no liability if any such credit rating is lowered, withdrawn, or suspended.
Note 13. 2012 Current Refunding of Debt
As detailed in Note 12, on December 20, 2012, the Authority issued $153,030 in Port District ProjectRefunding Bonds to currently refund $196,760 in aggregate principal amount of the Authority’soutstanding 1998 Series B Port District Project Bonds ($55,475), 1999 Series B Port District ProjectBonds ($107,880), and 2001 Series A Port District Project Bonds ($33,405). The refunding was executedby the Authority to reduce its total debt service payments by $69.3 million over the next 15 years.
As a result of the current refunding of the Port District Bonds, the Authority incurred a loss on refunding of$6,966, which is being amortized as a component of interest expense over the life of the newly issued,refunding debt.
The following schedule details the difference between the cash flow required to service the old debt (therefunded portion of the Port District Project Bonds) and the new debt (2012 Port District ProjectRefunding Bonds). In addition, the economic gain from the refunding, which represents the differencebetween the present value of the aforementioned old debt service and the present value of theaforementioned new debt service requirements, discounted at the effective interest rate of 2.89%,adjusted for any additional cash, is as flows:
Cash Flow DifferenceOld debt service cash flows 303,610$Less prior receipts 11,291Prior net cash flows 292,319
New debt service cash flows 222,997Cash flows savings 69,322$
Economic GainPresent value of cash flow difference 36,975$

Financial Section
DRPA 2013 Comprehensive Annual Financial Report 73
Delaware River Port Authority
Notes to Combined Financial Statements
Note 14. Conduit Debt Obligations
The Authority is authorized to plan, finance, develop, acquire, construct, purchase, lease, maintain,market, improve and operate any project within the Port District including, but not limited to, any terminal,terminal facility, transportation facility, or any other facility of commerce or economic development activity,from funds available after appropriate allocation for maintenance of bridge and other capital facilities.Utilizing this authorization, the Authority has issued certain debt bearing its name to lower the cost ofborrowing for specific governmental entities. This debt is commonly referred to as conduit (or non-commitment) debt. Typically, the debt proceeds are used to finance facilities within the Authority’sjurisdiction that are transferred to the third party either by lease or by sale. The underlying lease ormortgage loan agreement, which serves as collateral for the promise of payments by the third party, callsfor payments that are essentially the same as collateral for the promise of payments by the third party,calls for payments that are essentially the same as those required by the debt. These payments are madeby the third-party directly to an independent trustee, who is appointed to service and administer thearrangement. The Authority assumes no responsibility for repayment of this debt beyond the resourcesprovided by the underlying leases or mortgage loans.
As of December 31, 2013, there was one series of Charter School Project Bonds outstanding, issued forthe LEAP Academy Charter School, Inc. The corresponding aggregate principal totaling $8,500 is treatedstrictly as conduit debt obligations under Interpretation No. 2 of the Governmental Accounting StandardsBoard (GASB) and accordingly is not included in the financial statements. The following schedule detailsthe series together with the amount outstanding:
1/1/2012 12/31/2012 12/31/2013Issue Issued Beginning Ending Ending
Issue Date Amount Balance Paid Balance Paid Balance
Charter School ProjectBonds, Series 2003 09/01/03 8,500$ 7,040$ 285$ 6,755$ 295$ 6,460$
The Authority was advised by the bond trustee, and counsel for LEAP Academy, that LEAP had lost itstax exemption for failure to file Form 990 for the past three years. LEAP bonds were issued through theAuthority; however, DRPA has no responsibility for repayment of this debt, as the debt is guaranteed byRutgers University. After various appeal in September 2013, the IRS rescinded its letter thereby fullyreinstating LEAP’s tax exemption.
Note 15. Government Contributions for Capital Improvements, Additions and Other Projects
The Authority receives contributions in aid for financing capital improvements to the rapid transit systemfrom the Federal Transit Administration and other government agencies. Capital improvement grant fundsof $17,673 and $25,042 were received in 2013 and 2012, respectively. The Authority receives federal andstate grants for specific construction purposes that are subject to review and audit by the grantoragencies. Although such audits could result in disallowances under terms of the grants, it is the opinion ofmanagement that any required reimbursements will not be material to the Authority’s net position.

Financial Section
74 DRPA 2013 Comprehensive Annual Financial Report
Delaware River Port Authority
Notes to Combined Financial Statements
Note 16. Contingencies
Public Liability claim exposures are self-insured by the Authority within its self insured retention limit of $5million for each occurrence, after which, exists a $25 million limit of Claims made Excess LiabilityInsurance per occurrence, and in the aggregate, to respond to any large losses exceeding the retention.The Authority, excluding PATCO, self-insures the initial $1 million limit, per accident, for Workers’Compensation claims, after which a $5 million limit of Excess Workers’ Compensation insurance isretained to respond to significant claims. (Note: PATCO was completely self-insured for Workers’Compensation claim until 2014 when DRPA-14-020 approved the purchase of Excess Workers’Compensation insurance for PATCO.) PATCO self-insures the initial $1 million limit, per accident, forWorkers’ Compensation claims, after which a $5 million limit of Excess Workers’ Compensation insuranceis retained to respond to significant claims.
Self-Insurance 2013 2012
Beginning balance 3,252$ 3,141$Incurred claims 2,040 1,924Payment of claims (1,605) (1,813)Other - administrative fees, recoveries - -
Ending balance 3,687$ 3,252$
The Authority is involved in various actions arising in the ordinary course of business and from Workers’Compensation claims. In the opinion of management, the ultimate outcome of these actions will not havea material adverse effect on the Authority’s combined net position and combined results of operations.
The Authority purchases commercial insurance for all other risks of loss, e.g. bridge and non-bridgeproperty, crime, terrorism, etc. The Authority reviews annually, and where appropriate, adjusts policy losslimits and deductibles as recommended by its insurance consultants in response to prevailing marketconditions, loss experience, and revenues. Policy loss limits are established with the professionalassistance of independent insurance broker consultants to ensure that sufficient coverage exists toaccommodate the maximum probable loss that may result in the ordinary course of business. In addition,the amounts of settlements for the last three years have not exceeded the insurance coverage providedin those years.
Per Article 5.11 of the 1998 Bond Indenture, the Authority must certify and submit to the bond trustee, byApril 30 of each year, that it has sufficient coverage with regards to “multi-risk insurance” (on DRPA andPATCO facilities), “use and occupancy insurance” (i.e., business interruption), etc. The Authoritysubmitted its annual certification to the bond trustee, prior to the deadline, in April 2013.
Note 17. Commitments
Development Projects: In support of previously authorized economic development projects, the DRPA’sBoard of Commissioners authorized loan guarantees to various banks to complete the financing aspectsof a particular project. The Authority’s Board has authorized loan guarantees in an amount not to exceed$27,000.

Financial Section
DRPA 2013 Comprehensive Annual Financial Report 75
Delaware River Port Authority
Notes to Combined Financial Statements
Note 17. Commitments (Continued)
Development Projects (Continued): As of December 31, 2013, the Authority had executed three (3) loanguarantees with various banks, totaling $11,400. The loan guarantees are as follows: L3 Communications($10.0 million), the Home Port Alliance ($0.9 million), and Ship Recycling Research ($0.5 million). Theseguarantees all remain in force; however, the Authority has made no cash outlays relating to theseguarantees.
L3 Communications Loan Guarantee: At its March 2010 meeting, the Authority’s Board approveda modification of the $10 million guarantee relating to a letter of credit (LOC) supporting the L3Communications project in order to accommodate a change in the bank providing the letter ofcredit, following the expiration of the original LOC. The guarantee survives the expiration of theoriginal LOC. Following the modification, in April 2010, NJ EDA provided a $20 million guaranteeto the LOC provider, while the Authority provided a $10 million guarantee in favor of NJ EDA,(and not the bank). The changes in the guarantee do not increase exposure or risk. As was thecase with the original guarantee, the Authority’s guarantee will be accessed only if NJ EDA mustpay more than $10 million on its guarantee.
Home Port Alliance Guarantee (extended 2012): On June 6, 2012, the Authority negotiated athree-year extension of the existing $0.9 million loan guarantee that supports a loan from TDBank, N.A. to the Home Port Alliance for the Battleship New Jersey.
Waterfront Renaissance Associates ($8 million guarantee terminated): As of November 2013,the Authority was released from all “claims, liability, demands…to the extent arising out of orrelating to any and all indebtedness owed by Waterfront Renaissance Associates, and inparticular any guaranty thereof.”
Community Impact: The Authority has an agreement with the City of Philadelphia (City) for CommunityImpact regarding the PATCO high-speed transit system (“Locust Street Subway Lease”). The agreementexpires on December 31, 2050. In 2013, the base amount payable to the City totaled $3,188 as adjustedfor the cumulative increases in the Consumer Price Index (CPI) between 1999 and 2012. Base paymentsfor 2014 through 2018 shall equal the previous year’s base payment adjusted by any increase in the CPIfor that year. For the years 2018 through 2050, the annual base payment shall equal one dollar.
In addition, for the duration of the lease the Authority is required to annually create a PATCO CommunityImpact Fund in the amount of $500, with payment of such fund to be divided annually betweencommunities within the Commonwealth and the State, based on PATCO track miles in the respectivestates.
The minimum commitment, adjusted for the effect of the increase in the CPI at December 31, 2013, is asfollows:
Year Amount
2014 3,708$2015 3,7472016 3,7872017 3,8272018 500Thereafter 16,000
31,569$

Financial Section
76 DRPA 2013 Comprehensive Annual Financial Report
Delaware River Port Authority
Notes to Combined Financial Statements
Note 17. Commitments (Continued)
OCIP Letters of Credit: In May 2008, the Authority entered into two new separate irrevocable standbyLetters of Credit with TD Bank, N.A. (formerly Commerce Bank) and Wachovia Bank in support of theAuthority’s “Owner Controlled Insurance Program (OCIP)”. Under this program, the Authority purchasedcoverage for all contractors working on major construction projects.
The Letter of Credit with Wells Fargo Bank (formerly Wachovia Bank) was for a four-year term in theamount of $5,000 with an expiration date of May 7, 2012. The Letter of Credit with TD Bank, N.A.(formerly Commerce Bank) was in an initial amount of $3,015 and automatically increased annually eachMay, in the amount of $816, until it expired on May 7, 2012.
During 2012, the Authority extended its OCIP for a six-month period. As a consequence, in consultationwith the insurance carrier, the Authority’s LOC requirement supporting the program was reduced by$5,000. The Letter of Credit with TD Bank, N.A. was renewed on May 7, 2012 in the amount of $5,462 toexpire on December 31, 2013, and again renewed on December 11, 2013 to expire December 31,2014.The OCIP Letter of Credit with Wells Fargo Bank, in the amount of $5,000, was not renewed.
At its January 2013 meeting, the Authority’s Board extended the OCIP from March 7, 2013 to June 30,2014.
As of December 31, 2013, the unused amount of the Letter of Credit totaled $5,462. No drawdowns havebeen made against any Letter of Credit.
Direct Pay Letters of Credit (2008 Revenue Refunding Bonds): The Authority’s 2008 Revenue RefundingBonds (Series A and B), are secured by irrevocable transferable Direct Pay Letters of Credit (DPLOC)issued by two credit providers, the Bank of America, N.A. and TD Bank, N.A., in the initial amounts of$172.6 million and $191.8 million, respectively. The Authority entered into separate ReimbursementAgreements with each credit provider to facilitate the issuance of said DPLOCs.
Each Letter of Credit is in an original stated amount which is sufficient to pay the unpaid principal amountof and up to fifty-three (53) days of accrued interest (at a maximum interest rate of 12%) on the related2008A Revenue Refunding Bonds or 2008B Revenue Refunding Bonds, when due, and the PurchasePrice of the 2008A Revenue Refunding Bonds or the 2008B Revenue Refunding Bonds tendered ordeemed tendered for purchase and not remarketed. The Credit Provider for the 2008A RevenueRefunding Bonds is only responsible for payments with respect to the 2008A Revenue Refunding Bondsfor which the 2008A Letter of Credit was issued and the Credit Provider for the 2008B RevenueRefunding Bonds is only responsible for payments with respect to the 2008B Revenue Refunding Bondsfor which the 2008B Letter of Credit was issued. The 2008A Letter of Credit and the 2008B Letter ofCredit were renewed in July of 2010 to expire in July of 2013.
As described in the Official Statement for the 2008 Revenue Refunding Bonds, “any draw under Letter ofCredit for principal, interest or Purchase Price creates a reimbursement obligation on the part of theAuthority that is secured by the 1998 Revenue Bond Indenture on a parity basis with the 2008 RevenueRefunding Bonds.” (Additional information related to this transaction and the accompanying Letters ofCredit can be found under Note 12).
These letters of credit were renewed with the Bank of America, N.A. and TD Bank, N.A. in 2013. The newletters of credit with Bank of America, N.A. and TD Bank, N.A. expire on July 22, 2016 and December 31,2017, respectively.

Financial Section
DRPA 2013 Comprehensive Annual Financial Report 77
Delaware River Port Authority
Notes to Combined Financial Statements
Note 17. Commitments (Continued)
Letter of Credit Provider Ratings (Unaudited): Ratings for these banks as of December 31, 2013 areshown below:
Moody's S&P Fitch Moody's S&P Fitch
Bank of America, N.A. (Series A) A2 A A P-1 A-1 F1Stable Negative Stable
TD Bank, N.A. (Series B) Aa3 AA- AA- P-1 A-1+ F1+Stable Stable Stable
Long-Term Short-Term
* In April 2012, at the Authority’s request, Fitch Ratings assigned a rating of “A/F1” (stable outlook) tothe Authority’s 2008 Series A Revenue Refunding Bonds, based on the DPLOC support provided bythe Bank of America, N.A. (“A/F1”, stable outlook) on the bonds.
Direct Pay Letters of Credit (2010 Revenue Refunding Bonds): The Authority’s 2010 Revenue RefundingBonds (Series A, B and C), were secured by irrevocable transferable Direct Pay Letters of Credit(DPLOC) issued by three credit providers, the Bank of America, N.A., JP Morgan Chase Bank, N.A. andPNC Bank, N.A. in the initial amounts of $152.6 million, $152.6 million and $50.9 million, respectively.The Authority entered into separate Reimbursement Agreements with each credit provider to facilitate theissuance of said DPLOCs. These DPLOC’s were terminated in March 2013, and replaced with new lettersof credit from Royal Bank of Canada (Series A), Barclay’s Bank PLC (Series B), and Bank of New YorkMellon (Series C). These new letters of credit expire on March 18, 2016, March 20, 2015, and March 18,2016, respectively.
Each Letter of Credit is an irrevocable transferable direct-pay obligation of the respective issuing CreditProvider to pay to the Trustee, upon request and in accordance with the terms thereof, amounts sufficientto pay the unpaid principal amount and up to fifty-three (53) days (or such greater number of days asrequired by the rating agencies) days’ accrued interest (at the maximum interest rate of 12%) on therelated 2010 Revenue Refunding bonds, 2010 Revenue Refunding Bonds or 2010 Revenue RefundingBonds when due, whether at the stated maturity thereof or upon acceleration or call for redemption, andamounts sufficient to pay the Purchase Price of the 2010 Revenue Refunding Bonds, the 2010 RevenueRefunding bonds or the 2010 Revenue Refunding bonds, as applicable, tendered for purchase and notremarketed. A draw under a Letter of Credit for principal and interest or Purchase Price creates aReimbursement Obligation (as defined in the 1998 Revenue Bond Indenture) on the part of the Authority.
Letter of Credit Provider Ratings (Unaudited): Ratings for these banks as of December 31, 2013 areshown below:
Moody's S&P Fitch Moody's S&P Fitch
Royal Bank of Canada Aa3 AA- AA P-1 A-1+ F1+Stable Stable Stable
Barclay's Bank PLC A2 A A P-1 A-1 F1Negative Stable Stable
Bank of New York Mellon Aa2 AA- AA- P-1 A-1 F1+Stable Stable Stable
Long-Term Short-Term

Financial Section
78 DRPA 2013 Comprehensive Annual Financial Report
Delaware River Port Authority
Notes to Combined Financial Statements
Note 17. Commitments (Continued)
Contractual Commitments: As of December 31, 2013, the Authority had board-approved contracts withremaining balances as follows:
TotalBenjamin Franklin Bridge:
Structural improvements 1,035$Pavement repairs 2,086Engineering services - program management 10,385Toll revenue transportation and processing 2,757Temporary toll, clerical, administration and custodians 3,648Other 3,739
Walt Whitman Bridge:Suspension rope investigation and painting 800Deck condition assessment and design 6,724Anchorage dehumidification design 2,984Other 75
Commodore Barry Bridge:Structural repairs 132Painting Design 494Roof Replacement 275Other 35
Betsy Ross Bridge:Bridge Inspection 32Resurfacing design services 79Other 64
PATCO System:Car overhaul program 162,979Ferry Ave. and Collingswood lot reconstruction 2,500Land surveying 1,552Radio system upgrades 931Track rehabilitation across BFB 107,671Escalator / elevator replacement 5,266Other 3,348
Other:Ferry system 543
320,134$

Financial Section
DRPA 2013 Comprehensive Annual Financial Report 79
Delaware River Port Authority
Notes to Combined Financial Statements
Note 18. Bridge and PATCO Fare Schedules
Bridge Fares: On July 1, 2011, the approved new bridge toll schedule was implemented as shown:
Class 1 - Motorcycle 5.00$Class 2 - Automobile 5.00Class 3 - Two Axle Trucks 15.00Class 4 - Three Axle Trucks 22.50Class 5 - Four Axle Trucks 30.00Class 6 - Five Axle Trucks 37.50Class 7 - Six Axle Trucks 45.00Class 8 - Bus 7.50Class 9 - Bus 11.25Class 10 - Senior Citizen (With 2 Tickets Only) 2.50Class 13 - Auto w/trailer (1 axle) 8.75
PATCO Passenger Fares: On July 1, 2011, a new fare schedule was implemented as shown:
Lindenwold/Ashland Woodcrest 3.00$Haddonfield/West Haddonfield/Collingswood 2.60Ferry Avenue 2.25New Jersey 1.60City Hall/Broadway/Philadelphia 1.40Off-peak Reduced Fare Program 0.70
As noted above, PATCO has a federally mandated reduced off-peak fare program for “elderly personsand persons with disabilities”. These off-peak rates increased from $0.62/trip to $0.70/trip.
Note 19. New Governmental Accounting Pronouncements
The Governmental Accounting Standards Board (GASB) has issued several statements that haveeffective dates that may impact future financial presentations. Management has not completed theprocess of evaluating the impact the following statements will have on the financial statements but hasdetermined that the effect of implementing GASB Statements No. 68 and No. 71 will be material to thefinancial statements.
GASB Statement No. 68, Accounting and Financial Reporting for Pensions—an amendment of GASBStatement No. 27, issued in June 2012, will be effective for the Authority beginning with the year endingDecember 31, 2015. This statement replaces the requirements of Statement No. 27, Accounting forPensions by State and Local Governmental Employers and Statement No. 50, Pension Disclosures, asthey relate to governments that provide pensions through pension plans administered as trusts or similararrangements that meet certain criteria. Statement 68 requires governments providing defined benefitpensions to recognize their long-term obligation for pension benefits as a liability for the first time, and tomore comprehensively and comparably measure the annual costs of pension benefits. The Statementalso enhances accountability and transparency through revised and new note disclosures and requiredsupplementary information (RSI).

Financial Section
80 DRPA 2013 Comprehensive Annual Financial Report
Delaware River Port Authority
Notes to Combined Financial Statements
Note 19. New Governmental Accounting Pronouncements (Continued)
GASB Statement No. 69, Government Combinations and Disposals of Government Operations, issuedJanuary 2013, will be effective for the Authority beginning with the year ending December 31, 2014. ThisStatement establishes accounting and financial reporting standards related to government combinationsand disposals of government operations. As used in this Statement, the term government combinationsincludes a variety of transactions referred to as mergers, acquisitions, and transfers of operations.
This Statement requires disclosures to be made about government combinations and disposals ofgovernment operations to enable financial statement users to evaluate the nature and financial effects ofthose transactions.
GASB Statement No. 70, Accounting and Financial Reporting for Nonexchange Financial Guarantees,issued April 2013, will be effective for the Authority beginning with the year ending December 31, 2014.Some governments extend financial guarantees for the obligations of another government, a not-for-profitentity, or a private entity without directly receiving equal or approximately equal value in exchange (anonexchange transaction). As a part of this nonexchange financial guarantee, a government commits toindemnify the holder of the obligation if the entity that issued the obligation does not fulfill its paymentrequirements. Also, some governments issue obligations that are guaranteed by other entities in anonexchange transaction. The objective of this Statement is to improve accounting and financial reportingby state and local governments that extend and receive nonexchange financial guarantees.
This Statement specifies the information required to be disclosed by governments that extendnonexchange financial guarantees. In addition, this Statement requires new information to be disclosedby governments that receive nonexchange financial guarantees.
GASB Statement No. 71, Pension Transition for Contributions Made Subsequent to Measurement Date,issued in November 2103, will be effective for the Authority beginning with the year ending December 31,2015. This statement amends paragraph 137 of GASB Statement No. 68 to require that, at transition, agovernment recognize a beginning deferred outflow of resources for its pension contributions, if any,made subsequent to the measurement date of the beginning net pension liability. GASB Statement No.68, as amended, continues to require that beginning balances for other deferred outflows of resourcesand deferred inflows of resources related to pensions be reported at transition only if it is practical todetermine all such amounts. The provisions of GASB No. Statement 71 should be appliedsimultaneously with the provisions of GASB No. Statement 68.
Note 20. Blended Component Unit
In 2013, the Authority adopted GASB Statement No. 61, The Financial Reporting Entity: Omnibus anamendment of GASB Statements No. 14 and No. 34. This Statement is intended to improve financialreporting for a governmental financial reporting entity by improving guidance for including, presenting,and disclosing information about component units and equity interest transactions of a financial reportingentity.
Port Authority Transit Corporation (PATCO) is a wholly-owned subsidiary of the DRPA, established tooperate and maintain the rapid transit system owned and constructed by DRPA. PATCO and DRPAshare the same board of Commissioners. A financial benefit or burden relationship exists between DRPAand PATCO as DRPA subsidizes the losses of PATCO and intends to continue to do so. PATCO’sfinancial results have been blended with those of DRPA in the financial statements.

Financial Section
DRPA 2013 Comprehensive Annual Financial Report 81
Delaware River Port Authority
Notes to Combined Financial Statements
Note 20. Blended Component Unit (Continued)
Rent of Transit System Facilities: All rapid transit system facilities used by PATCO are leasedfrom the Authority, under terms of an agreement dated April 18, 1969 and amended June 3,1974. The lease requires PATCO to operate and maintain the Locust-Lindenwold line. The termsof the amended agreement, which was made retroactive to January 1, 1974, and which is tocontinue from year to year, provide that PATCO pay a minimum annual rental of $6,122, whichapproximates the sum of the annual interest expense to the Authority for that portion of itsindebtedness attributable to the construction and equipping of the leased facilities plus theprovision for depreciation of the rapid transit facilities as recorded by the Authority. In addition,the lease requires PATCO to pay to the Authority any net earnings from operations for theLocust-Lindenwold line less a reasonable amount to be retained for working capital and operatingreserves.
PATCO’s outstanding liability to the DRPA for period January 1, 1974 to December 31, 2013related to this agreement totals $244,730.
Net Position: The net position totaling ($620,419) and ($597,548) as of December 31, 2013 and 2012,respectively, represents the total losses for PATCO since inception.
Condensed combining financial information applicable to DRPA and PATCO as of and for the year endedDecember 31, 2013 is as follows:
DRPA PATCO TotalCurrent assets 649,840$ 10,358$ 660,198$Receivable from primary government (712) 712 -Noncurrent assets 345,216 - 345,216Capital assets 1,273,454 - 1,273,454Other assets 18,172 - 18,172Intercompany - - -
Total assets 2,285,970 11,070 2,297,040
Deferred outflows 129,029 - 129,029
Total assets and deferred outflows 2,414,999 11,070 2,426,069
Current liabilities 84,716 6,466 91,182Noncurrent liabilities 1,803,965 19,533 1,823,498
Total liabilities 1,888,681 25,999 1,914,680
Lease agreement (244,730) 244,730 -Advances from Delaware River Port Authority (360,760) 360,760 -Net investment in capital assets 213,138 - 213,138Restricted net position 159,521 - 159,521Unrestricted 759,149 (620,419) 138,730
Total net position 526,318$ (14,929)$ 511,389$
December 31, 2013

Financial Section
82 DRPA 2013 Comprehensive Annual Financial Report
Delaware River Port Authority
Notes to Combined Financial Statements
Note 20. Blended Component Unit (Continued)
DRPA PATCO TotalOperating revenues
Bridge revenues 300,314$ -$ 300,314$Transit systems - 27,607 27,607Other 165 38 203
Total operating revenues 300,479 27,645 328,124
Operating expensesOperating expenses 95,724 44,394 140,118Depreciation 54,801 - 54,801
Total operating expenses 150,525 44,394 194,919
Operating income 149,954 (16,749) 133,205
Nonoperating revenues (expenses)Interest expense (58,784) - (58,784)Bond issuance costs (2,516) - (2,516)Economic development activities (4,371) - (4,371)Lease rental 6,122 (6,122) -Other 7,353 - 7,353
Total nonoperating revenues (expenses) (52,196) (6,122) (58,318)
Capital contributions 17,673 - 17,673
Change in net position 115,431 (22,871) 92,560
Net position, January 1, (as restated) 1,016,377 (597,548) 418,829
Net position, December 31, 1,131,808$ (620,419)$ 511,389$
Net cash provided by operating expenses 203,562$ (16,957)$ 186,605$Net cash (used in) provided by noncapital financing activities (19,589) 17,440 (2,149)Net cash provided by capital and related financing activities 336,339 - 336,339Net cash (used in) provided by investing activities (496,167) 2 (496,165)Net increase in cash and cash equivalents 24,145 485 24,630Cash and cash equivalents, January 1 5,327 572 5,899
Cash and cash equivalents, December, 31 29,472$ 1,057$ 30,529$
Year Ended December 31, 2013

Financial Section
DRPA 2013 Comprehensive Annual Financial Report 83
Delaware River Port Authority
Notes to Combined Financial Statements
Note 20. Blended Component Unit (Continued)
Condensed combining financial information applicable to DRPA and PATCO as of and for the year endedDecember 31, 2012 is as follows:
DRPA PATCO TotalCurrent assets 465,358$ 10,073$ 475,431$Receivable from primary government (464) 464 -Capital assets 1,240,928 - 1,240,928Other assets 18,888 - 18,888
Total assets 1,724,710 10,537 1,735,247
Deferred outflows 183,950 - 183,950
Total assets and deferred outflows 1,908,660 10,537 1,919,197
Current liabilities 62,698 6,706 69,404Noncurrent liabilities 1,411,553 19,411 1,430,964
Total liabilities 1,474,251 26,117 1,500,368
Lease agreement (238,608) 238,608 -Advances from Delaware River Port Authority (343,360) 343,360 -Net investment in capital assets 272,905 - 272,905Restricted net position 143,692 - 143,692Unrestricted 599,780 (597,548) 2,232
Total net position 434,409$ (15,580)$ 418,829$
December 31, 2012

Financial Section
84 DRPA 2013 Comprehensive Annual Financial Report
Delaware River Port Authority
Notes to Combined Financial Statements
Note 20. Blended Component Unit (Continued)
DRPA PATCO TotalOperating revenues
Bridge revenues 299,182$ -$ 299,182$Transit systems - 27,992 27,992Port of Philadelphia and Camden 2 - 2Other 181 43 224
Total operating revenues 299,365 28,035 327,400
Operating expensesOperating expenses 104,241 42,257 146,498Depreciation 55,018 - 55,018
Total operating expenses 159,259 42,257 201,516
Operating income 140,106 (14,222) 125,884
Nonoperating revenues (expenses)Interest expense (66,540) - (66,540)Bond issuance costs (1,374) - (1,374)Economic development activities (8,695) - (8,695)Lease rental 6,122 (6,122) -Other 11,814 - 11,814
Total nonoperating revenues (expenses) (58,673) (6,122) (64,795)
Capital contributions 25,042 - 25,042
Change in net position 106,475 (20,344) 86,131
Net position, January 1, (as restated) 909,902 (577,204) 332,698
Net position, December 31, (as restated) 1,016,377$ (597,548)$ 418,829$
Net cash provided by operating expenses 200,016$ (13,680)$ 186,336$Net cash (used in) provided by noncapital financing activities (14,191) 13,495 (696)Net cash used in capital and related financing activities (338,655) - (338,655)Net cash provided by investing activities 153,000 2 153,002Net increase (decrease) in cash and cash equivalents 170 (183) (13)Cash and cash equivalents, January 1 5,144 755 5,899
Cash and cash equivalents, December, 31 5,314$ 572$ 5,886$
Year Ended December 31, 2012

Financial Section
DRPA 2013 Comprehensive Annual Financial Report 85
Delaware River Port Authority
Notes to Combined Financial Statements
Note 21. Restatement of Net Position
In 2013, Delaware River Port Authority adopted GASB Statement No. 65, Items Previously Reported asAssets and Liabilities. As a result of adopting this statement, certain unamortized bond issuance costsincurred in prior years are no longer capitalized as assets on the statement of net position. Thecumulative effect of adopting GASB Statement No. 65 was $8,583, which was recognized as arestatement of the Authority’s 2012 beginning net position. Net position as of January 1, 2012 wasdecreased as follows:
Net position, January 1, 2012 as previously stated 341,281$Cumulative effect of adopting GASB No. 65 (8,583)
Net position, January 1, 2012 as restated 332,698$
As a result of implementing this statement, amortization expense for 2012 was reduced from $1,339 to$100, 2012 bond issuance costs of $1,374 were expensed and the change in net position for 2012 wasreduced from $86,266 to $86,131.
Additionally, losses on refunding of debt are no longer part of long-term debt, but are reclassifiedseparately as deferred outflows of resources on the statements of financial position.
Note 22. Subsequent Events
New SubAccount within General Fund for Capital Expenditures: The Authority’s Board approved aresolution (DRPA -14-056) establishing a separate unrestricted account or sub-account within theGeneral Fund “for the purpose of accounting for and utilizing specific General Fund monies for 2014Capital Program spending.” The Authority is in process of setting aside approximately $175 million intothis separate account for its “pay-go-capital fund”, which funds will be used to fund short-lived capitalassets and the remainder of the five-year 2014 Capital Program, after all bond project fund monies, fromthe 2013 Revenue Bond issue, are depleted. (This segregation of funds is expected to be completed inJuly 2014.) On a monthly basis, net General Fund transfers, as described in the Authority’s RevenueBond Indentures, will be deposited into this new account/sub-account.
Initial Contribution to the 115 Irrevocable Trust (Other Post-Employment Benefits): The Authority’s Boardpassed a resolution (DRPA-14-057) authorizing the Authority to make its initial OPEB Contribution, in theamount of $10.79 million into the Section 115 Irrevocable Trust established with PNC Bank. TheAuthority transferred funds in June 2014 to this trust account after the NJ Governor’s veto period hadexpired.
Insurance: Pursuant to DRPA-10-154, the Board authorized a $194 million contract to AlstomTransportation Inc. of Hornell, N.Y., for the overhaul of the entire 120 Port Authority Transit Corporationtransit fleet cars. The Authority issued PATCO-14-021 authorizing staff to secure “Rolling Stock Propertyinsurance” for the refurbished PATCO transit cars, which are being delivered to the Authority for use in itsPATCO operation over the next several years.
The property coverage is in the amount of $100 million, less a deductible of $100,000 per occurrence;however, a special $250,000 Flood deductible for non-Zone A (Woodcrest Passenger Station) applies inthe event of a flood, a special $250,000 Earth movement deductible applies in the event of an earthquakeand a special $250,000 Named Storm deductible, applies in the event the National Weather Servicenames a particular storm.

Financial Section
86 DRPA 2013 Comprehensive Annual Financial Report
Delaware River Port Authority
Notes to Combined Financial Statements
Note 22. Subsequent Events (Continued)
Status of Union Labor Negotiations: The collective bargaining agreement between the Authority and theIUOE expired on December 31, 2012. Employees continue to work with an expired contract while contractnegotiations are ongoing. The second largest labor organization representing Authority personnel is FOPLocal 30 (representing Authority and PATCO patrol officers, corporals and sergeants). The partiescurrently are involved in interest arbitration litigation in the Federal District Court, Camden, New Jersey.The collective bargaining agreement with the IBEW expired by its terms on December 31, 2011.Employees continue to work with an expired contract while contract negotiations are ongoing.
PATCO has a collective bargaining agreement with Teamsters’ Union Local 676, which representsoperating and maintenance personnel at PATCO which expired on May 31, 2011. Currently the partiesare involved in contract negotiations and the employees continue to work with an expired contract.
Federal Subpoena: The Authority has been served with a subpoena requiring document productionsconcerning economic development spending from 2008 to the present. The Authority is committed to fullcooperation. It is expected that compliance costs and counsel fees may be significant, but will notmaterially impact the Authority's financial position.
In late June 2014, the Authority’s Board was advised that there may be a compromise to a data storageeffort that was implemented to assist with the federal investigation. The Authority has directed its specialoutside counsel to continue to be open and transparent in providing assistance to the federal investigationand to assist in the effort to determine if a compromise has occurred.

Financial Section
DRPA 2013 Comprehensive Annual Financial Report 87
Delaware River Port Authority
Required Supplementary Information (Unaudited)Schedule of Funding Progress for Health Benefits PlanYear Ended December 31, 2013(amounts expressed in thousands)
ActuarialAccruedLiability UAAL as a
Actuarial (AAL) - Unfunded PercentageActuarial Value of Projected AAL Funded Covered of CoveredValuation Assets Unit Credit (UAAL) Ratio Payroll Payroll
Date (a) (b) (b-a) (a/b) (c) [(b-a)/c]
01/01/13 -$ 112,923$ 112,923$ - 43,453$ 259.9%
01/01/11 -$ 113,422$ 113,422$ - 46,949$ 241.6%
01/01/09 -$ 132,467$ 132,467$ - 51,071$ 259.4%

Financial Section
88 DRPA 2013 Comprehensive Annual Financial Report
Delaware River Port Authority
Combined Supplemental Schedule of Net Position Information by FundDecember 31, 2013(amounts expressed in thousands)
Maintenance Combined CombinedCapital Revenue Reserve General Bond ProjectFund Fund Fund Fund Funds Funds Total
AssetsCurrent Assets
Cash and cash equivalents -$ -$ -$ 26,232$ -$ -$ 26,232$Investments - 11,170 - 389,158 - - 400,328Accounts receivable, net of
allowance for uncollectibles - 4,680 - 7,011 - - 11,691Accrued interest receivable - - - 475 - - 475Transit system and storeroom inventories - 396 - 6,116 - - 6,512Economic development loans - current - - - 1,925 - - 1,925Prepaid expenses - 1,337 - 986 - - 2,323Restricted assets
RestrictedCash and cash equivalents - 3,760 - - - 537 4,297Investments - - 4,541 - 183,633 18,237 206,411Accrued interest receivable - - - - - 4 4
Total current assets - 21,343 4,541 431,903 183,633 18,778 660,198
Noncurrent AssetsRestricted investments for capital projects - - - - - 345,216 345,216
Capital assets, net ofaccumulated depreciationLand 74,200 - - 25 - - 74,225Construction in progress 290,453 - - - - - 290,453Bridges and related buildings
and equipment 634,795 - - - - - 634,795Transit property and equipment 271,767 - - - - - 271,767Port enhancements 2,214 - - - - - 2,214
Total capital assets 1,273,429 - - 25 - - 1,273,454
OtherEconomic development loans,
net of allowance for uncollectibles - - - 16,776 - - 16,776Debt insurance costs,
net of amortization 1,031 - - 365 - - 1,396Total other assets 1,031 - - 17,141 - - 18,172Total noncurrent assets 1,274,460 - - 17,166 - 345,216 1,636,842Total assets 1,274,460 21,343 4,541 449,069 183,633 363,994 2,297,040
Deferred Outflows of ResourcesAccumulated decrease in fair value
of hedging derivatives 114,318 - - - - - 114,318Loss on refunding of debt 14,711 - - - - - 14,711
Total deferred outflowsof resources 129,029 - - - - - 129,029
(Continued)

Financial Section
DRPA 2013 Comprehensive Annual Financial Report 89
Delaware River Port Authority
Combined Supplemental Schedule of Net Position Information by Fund (Continued)December 31, 2013(amounts expressed in thousands)
Maintenance Combined CombinedCapital Revenue Reserve General Bond ProjectFund Fund Fund Fund Funds Funds Total
LiabilitiesCurrent Liabilities
Accounts payableRetained amounts on contracts -$ 4$ -$ 8,934$ -$ -$ 8,938$Other - 8,829 - 10,527 - - 19,356
Accrued liabilitiesClaims and judgments - 245 - 1,255 - - 1,500Self-insurance - 819 - 890 - - 1,709Pension - 978 - 889 - - 1,867Sick and vacation leave benefits - 703 - 328 - - 1,031Other - 427 - 762 - - 1,189
Unearned revenue - - - 3,408 - - 3,408Liabilities payable from restricted assets
Accrued interest payable - - - - 13,534 - 13,534Bonds payable - current 29,455 - - 9,195 - - 38,650
Total current liabilities 29,455 12,005 - 36,188 13,534 - 91,182
Noncurrent LiabilitiesAccrued liabilities
Claims and judgments - 760 - 4,594 - - 5,354Self-insurance - 948 - 1,030 - - 1,978Sick and vacation leave benefits - 2,107 - 984 - - 3,091Other - 27,502 - 14,000 - - 41,502
Unearned revenue - 5,274 - - - - 5,274Premium payment payable - 33,588 - - - - - 33,588
derivative companion instrumentDerivative instrument - interest rate swap 115,182 - - - 1,464 - 116,646Bonds payable, net of unamortized
discounts, and premiums 1,426,981 - - 189,084 - - 1,616,065Total noncurrent liabilities 1,575,751 36,591 - 209,692 1,464 - 1,823,498Total liabilities 1,605,206 48,596 - 245,880 14,998 - 1,914,680
Net PositionNet investment in capital assets (168,296) - - 25 36,193 345,216 213,138Restricted for:
Debt requirements - 3,760 4,541 - 132,442 - 140,743Port projects - - - - - 18,778 18,778
Unrestricted (deficiency) (33,421) (31,013) - 203,164 - - 138,730
Total net position (201,717)$ (27,253)$ 4,541$ 203,189$ 168,635$ 363,994$ 511,389$
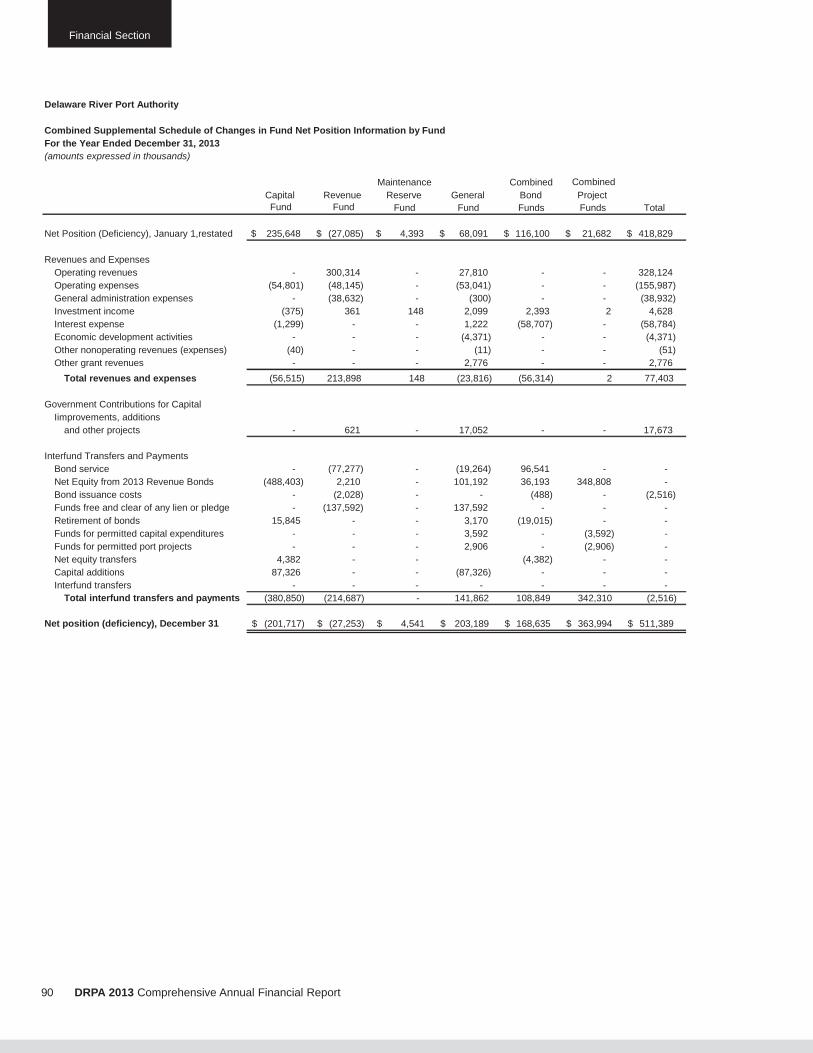
Financial Section
90 DRPA 2013 Comprehensive Annual Financial Report
Delaware River Port Authority
Combined Supplemental Schedule of Changes in Fund Net Position Information by FundFor the Year Ended December 31, 2013(amounts expressed in thousands)
Maintenance Combined CombinedCapital Revenue Reserve General Bond ProjectFund Fund Fund Fund Funds Funds Total
Net Position (Deficiency), January 1,restated 235,648$ (27,085)$ 4,393$ 68,091$ 116,100$ 21,682$ 418,829$
Revenues and ExpensesOperating revenues - 300,314 - 27,810 - - 328,124Operating expenses (54,801) (48,145) - (53,041) - - (155,987)General administration expenses - (38,632) - (300) - - (38,932)Investment income (375) 361 148 2,099 2,393 2 4,628Interest expense (1,299) - - 1,222 (58,707) - (58,784)Economic development activities - - - (4,371) - - (4,371)Other nonoperating revenues (expenses) (40) - - (11) - - (51)Other grant revenues - - - 2,776 - - 2,776
Total revenues and expenses (56,515) 213,898 148 (23,816) (56,314) 2 77,403
Government Contributions for CapitalIimprovements, additions
and other projects - 621 - 17,052 - - 17,673
Interfund Transfers and PaymentsBond service - (77,277) - (19,264) 96,541 - -Net Equity from 2013 Revenue Bonds (488,403) 2,210 - 101,192 36,193 348,808 -Bond issuance costs - (2,028) - - (488) - (2,516)Funds free and clear of any lien or pledge - (137,592) - 137,592 - - -Retirement of bonds 15,845 - - 3,170 (19,015) - -Funds for permitted capital expenditures - - - 3,592 - (3,592) -Funds for permitted port projects - - - 2,906 - (2,906) -Net equity transfers 4,382 - - (4,382) - -Capital additions 87,326 - - (87,326) - - -Interfund transfers - - - - - - -
Total interfund transfers and payments (380,850) (214,687) - 141,862 108,849 342,310 (2,516)
Net position (deficiency), December 31 (201,717)$ (27,253)$ 4,541$ 203,189$ 168,635$ 363,994$ 511,389$

Financial Section
DRPA 2013 Comprehensive Annual Financial Report 91
Delaware River Port Authority
Supplemental Schedule of Net Position Information for Bond and Project FundsDecember 31, 2013(amounts expressed in thousands)
1998 1999 2001Bond Bond Port District 1999 Port District Port District 2013 Total
Reserve Service Project Project Project Project Project CombinedAssetsCurrent Assets
Restricted assetsTemporarily restrictedCash and cash equivalents -$ -$ 4$ 60$ 473$ -$ -$ 537$Investments 131,483 52,150 - - 16,735 1,502 - 201,870Accrued interest receivable - - - - 4 - - 4
Total current assets 131,483 52,150 4 60 17,212 1,502 - 202,411
Noncurrent Investments - - - - - - 345,216 345,216Total assets 131,483 52,150 4 60 17,212 1,502 345,216 547,627
LiabilitiesCurrent Liabilities
Liabilities payable from restricted assetsAccrued interest payable - 13,534 - - - - - 13,534Bonds payable - current - - - - - - - -
Total current liabilities - 13,534 - - - - - 13,534
Noncurrent LiabilitiesDerivative instrument - interest rate swap 1,464 - - - - - - 1,464Bonds payable, net of
unamortized discounts and premiums - - - - - - - -Total noncurrent liabilities 1,464 - - - - - - 1,464Total liabilities 1,464 13,534 - - - - - 14,998
Net PositionNet investment in capital assets 36,193 - - - - - - 36,193Restricted for
Revenue and port district project bonds 93,826 - - - - - - 93,826Revenue and port district bond service - 38,616 - - - - - 38,616Port projects - - 4 60 17,212 1,502 - 18,778Capital Projects - - - - - - 345,216 345,216
Total net position 130,019$ 38,616$ 4$ 60$ 17,212$ 1,502$ 345,216$ 532,629$
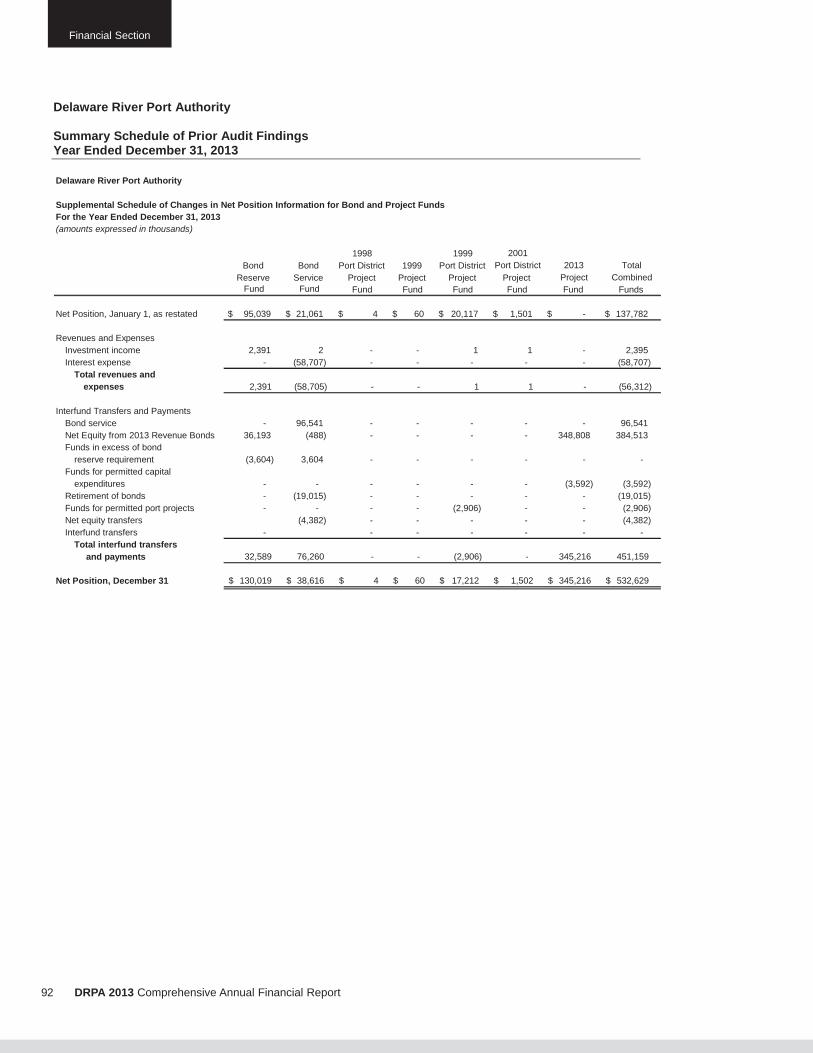
Financial Section
92 DRPA 2013 Comprehensive Annual Financial Report
Delaware River Port Authority
Summary Schedule of Prior Audit FindingsYear Ended December 31, 2013
Delaware River Port Authority
Supplemental Schedule of Changes in Net Position Information for Bond and Project FundsFor the Year Ended December 31, 2013(amounts expressed in thousands)
1998 1999 2001Bond Bond Port District 1999 Port District Port District 2013 Total
Reserve Service Project Project Project Project Project CombinedFund Fund Fund Fund Fund Fund Fund Funds
Net Position, January 1, as restated 95,039$ 21,061$ 4$ 60$ 20,117$ 1,501$ -$ 137,782$
Revenues and ExpensesInvestment income 2,391 2 - - 1 1 - 2,395Interest expense - (58,707) - - - - - (58,707)
Total revenues andexpenses 2,391 (58,705) - - 1 1 - (56,312)
Interfund Transfers and PaymentsBond service - 96,541 - - - - - 96,541Net Equity from 2013 Revenue Bonds 36,193 (488) - - - - 348,808 384,513Funds in excess of bond
reserve requirement (3,604) 3,604 - - - - - -Funds for permitted capital
expenditures - - - - - - (3,592) (3,592)Retirement of bonds - (19,015) - - - - - (19,015)Funds for permitted port projects - - - - (2,906) - - (2,906)Net equity transfers (4,382) - - - - - (4,382)Interfund transfers - - - - - - -
Total interfund transfersand payments 32,589 76,260 - - (2,906) - 345,216 451,159
Net Position, December 31 130,019$ 38,616$ 4$ 60$ 17,212$ 1,502$ 345,216$ 532,629$

Statistical Section

Statistical Section

Statistical Section
DRPA 2013 Comprehensive Annual Financial Report 95
FINANCIAL TREND DATA (Unaudited)
Last Ten Fiscal Years (In Thousands)
NET POSITION
2013 * 2012 * 2011 * 2010 * 2009 * 2008 2007 2006 2005 2004Net Investment in capital assets 213,138$ 272,905$ 214,632$ 239,390$ 325,973$ 281,146$ 245,959$ 244,194$ 245,211$ 224,189$Restricted 159,521 143,692 185,219 158,589 142,435 147,850 176,895 199,758 236,796 257,111Unrestricted (deficiency) 138,730 2,232 (67,153) (111,050) (138,043) (94,317) (92,855) (113,329) (158,624) (173,185)Total Net Assets 511,389$ 418,829$ 332,698$ 286,929$ 330,365$ 334,679$ 329,999$ 330,623$ 323,383$ 308,115$
* Figures for the years 2013, 2012, 2011, 2010 and 2009 include the implementation of Governmental Accounting Standards Board Statement No. 53, Accounting and Financial Reporting for Derivative Instruments.Figures for 2013, 2012 and 2011 include the implementation of Governmental Accounting Standards Board Statement No. 65 Items Previously Reported as Assets and Liabilities.Figures for the years 2010 and 2009 have been restated to remove the projected cost of bridge repainting.
CHANGES IN NET POSITION
2013 * 2012 * 2011 * 2010 * 2009 * 2008 2007 2006 2005 2004Operating RevenuesBridges:
Tolls 293,863$ 292,810$ 267,685$ 243,879$ 242,620$ 208,856$ 196,069$ 194,958$ 190,930$ 188,809$Other operating revenues 6,451 6,372 5,049 4,753 4,944 5,815 5,540 4,170 4,219 6,194Total bridge operating revenues 300,314 299,182 272,734 248,632 247,564 214,671 201,609 199,128 195,149 195,003
Transit system:Passenger fares 25,908 26,035 24,004 21,956 22,028 21,459 18,978 19,014 19,067 18,647Other operating revenues 1,699 1,957 1,817 1,968 1,606 1,507 1,438 1,600 1,871 1,221Total transit system operating revenues 27,607 27,992 25,821 23,924 23,634 22,966 20,416 20,614 20,938 19,868
Port of Philadelphia and Camden:AmeriPort - - - - - - - - 1,838 1,734Cruise terminal - 2 369 309 571 683 1,043 1,608 1,264 839RiverLink - - 68 61 62 73 50 72 51 50Total Port of Philadelphia and Camden - 2 437 370 633 756 1,093 1,680 3,153 2,623
Other:Miscellaneous 203 224 556 1,801 1,456 590 852 1,697 623 142
Total operating revenues 328,124 327,400 299,548 274,727 273,287 238,983 223,970 223,119 219,863 217,636
Operating Expenses:Operations 97,436 98,581 94,259 99,518 97,735 100,515 94,762 88,482 82,239 81,857Community impact 3,688 3,611 3,560 3,473 3,483 3,380 3,306 3,198 3,078 3,021General and administration 38,932 44,277 40,536 46,272 35,457 34,974 31,025 27,780 26,857 29,355Port of Philadelphia and Camden 62 29 246 824 1,269 1,447 1,698 1,824 3,548 3,683Depreciation 54,801 55,018 49,216 47,751 45,776 45,486 44,634 42,355 38,432 34,702
Total operating expenses 194,919 201,516 187,817 197,838 183,720 185,802 175,425 163,639 154,154 152,618
Operating Income 133,205 125,884 111,731 76,889 89,567 53,181 48,545 59,480 65,709 65,018
Non-operating Revenues (Expenses)Interest revenue (net of change in fair valueof derivative instruments) 4,628 7,638 13,633 (25,867) 8,718 17,592 26,704 28,383 27,282 28,391Interest expense (58,784) (66,540) (77,870) (72,527) (65,584) (75,654) (74,668) (78,267) (72,213) (73,621)Amortization expense (100) (100) (100) (1,511) (1,356) (1,353) (1,353) (1,346) (2,059) (2,114)Economic development activities (4,371) (8,695) (2,025) (39,657) (26,794) (3,960) (9,841) (7,050) (9,704) (14,850)Other 2,825 4,276 3,055 (1,366) (985) 457 (35) (1,065) (1,533) (2,280)Bond issuance costs (2,516) (1,374) - - - - - - - -Loss on abandonment of Aerial Tram project - - (18,318)Loss on disposal of capital assets - - (7,929)
Total non-operating revenues (expenses) (58,318) (64,795) (89,554) (140,928) (86,001) (62,918) (59,193) (59,345) (58,227) (64,474)
Income (Loss) Before Capital Contributions 74,887 61,089 22,177 (64,039) 3,566 (9,737) (10,648) 135 7,482 544
Capital Contributions:Federal and state capital improvement grants 17,673 25,042 33,021 20,603 11,443 14,417 10,024 12,076 7,786 6,452
Discontinued OperationsLoss on disposal of Ameriport - - - - - - - (4,971) - -
Change in Net Position 92,560$ 86,131$ 55,198$ (43,436)$ 15,009$ 4,680$ (624)$ 7,240$ 15,268$ 6,996$
* Figures for the years 2013, 2012, 2011, 2010 and 2009 include the implementation of Governmental Accounting Standards Board Statement No. 53, Accounting and Financial Reporting for Derivative Instruments.Figures for 2013, 2012 and 2011 include the implementation of Governmental Accounting Standards Board Statement No. 65 Items Previously Reported as Assets and Liabilities.Figures for the years 2010 and 2009 have been restated to remove the projected cost of bridge repainting.
The Authority’s net position improved significantly increasing by $92.6 million during 2013. It is the third successive year that the net position has increased in excess of $50 million. TheAuthority’s net position has improved from $286.9 million to $511.4 million, since 2010, largely due to higher toll revenues, which improved operating income (which exceeded $100 million, duringthe past 3 years). Interest expense has also dropped by $19 million annually since 2011, attributable to two major debt reduction initiatives implemented in 2012. The year-to-year increase in netpositon of $6.5 million during 2013 was attributable to continued strong operating revenues of $328.1 million (slightly higher than 2012), reduced operating expenses (decrease of $6.6 million),primarily in G&A, and reduced interest expense (decrease of $7.8 million), which was partially offset by reduced capital contributions (down $7.4 million).
Please refer to the following schedules for a historical view of the Authority’s financial performance.

Statistical Section
96 DRPA 2013 Comprehensive Annual Financial Report
REVENUE CAPACITY DATA (Unaudited)
Last Ten Fiscal Years (In Thousands)
MAJOR REVENUES BY SOURCE
2013 2012 2011 2010 2009 2008 2007 2006 2005 2004Bridge operating revenues $300,314 $299,182 $272,734 $248,632 $247,564 $214,671 $201,609 $199,128 $195,149 $195,003PATCO transit system operating revenues 27,607 27,992 25,821 23,924 23,634 22,966 20,416 20,614 20,938 19,868Port of Philadelphia and Camden - 2 437 370 633 756 1,093 1,680 3,153 2,623Interest income 5,581 5,803 4,968 8,176 9,252 17,592 26,704 28,383 27,282 28,391Total revenues $333,502 $332,979 $303,960 $281,102 $281,083 $255,985 $249,822 $249,805 $246,522 $245,885
TOLL REVENUE BY BRIDGE
2013 2012 2011 2010 2009 2008 2007 2006 2005 2004Walt Whitman Bridge $111,256 $111,900 $103,191 $95,180 $96,319 $82,198 $77,109 $77,528 $76,255 $75,001Ben Franklin Bridge 101,094 100,443 89,824 80,083 79,848 67,188 62,235 61,577 60,550 60,377Betsy Ross Bridge 33,578 34,084 32,295 30,610 29,062 27,590 26,734 26,906 26,305 26,581Commodore Barry Bridge 47,935 46,383 42,375 38,006 37,391 31,880 29,991 28,947 27,820 26,850Total toll revenues $293,863 $292,810 $267,685 $243,879 $242,620 $208,856 $196,069 $194,958 $190,930 $188,809
BRIDGE CASH TOLL RATES
2013 2012 2011 2010 2009 2008 2007 2006 2005 2004Class 1 - Motorcycle $5.00 $5.00 $5.00 $4.00 $4.00 $4.00 $2.00 $2.00 $2.00 $2.00Class 2 - Automobile 5.00 5.00 5.00 4.00 4.00 4.00 3.00 3.00 3.00 3.00Class 3 - Two Axle Trucks 15.00 15.00 15.00 12.00 12.00 12.00 9.00 9.00 9.00 9.00Class 4 - Three Axle Trucks 22.50 22.50 22.50 18.00 18.00 18.00 13.50 13.50 13.50 13.50Class 5 - Four Axle Trucks 30.00 30.00 30.00 24.00 24.00 24.00 18.00 18.00 18.00 18.00Class 6 - Five Axle Trucks 37.50 37.50 37.50 30.00 30.00 30.00 22.50 22.50 22.50 22.50Class 7 - Six Axle Trucks 45.00 45.00 45.00 36.00 36.00 36.00 27.00 27.00 27.00 27.00Class 8 - Bus 7.50 7.50 7.50 6.00 6.00 6.00 4.50 4.50 4.50 4.50Class 9 - Bus 11.25 11.25 11.25 9.00 9.00 9.00 6.75 6.75 6.75 6.75Class 10 - Senior Citizen (With Ticket Only) 2.50 2.50 2.50 2.00 2.00 2.00 1.00 1.00 1.00 1.00Class 13 - Auto w/trailer (1 axle) 8.75 8.75 8.75 6.00 6.00 6.00 5.25 5.25 5.25 5.25Class 14 - Senior Citizens (With 2 Tickets Only) - - - - - - 0.70 0.70 0.70 0.70
Major annual revenues (consisting primarily of bridge operating and PATCO transit system revenues, and interest income) have shown positive growth since 2004, increasing from$245.9 million to $333.5 million, an increase of almost $90 million annually. Revenues during the period 2008 and 2013 reflect the two major increases in bridge tolls and transitsystem fares, during 2008 and 2011. During 2013 bridge tolls increased only by $1.0 million over the previous year, while PATCO transit system operating revenues declined slightlyby $0.4 million.
Total PATCO transit system operating revenues (inclusive of fare, parking and advertising revenues) have increased over the ten-year period. During the past two years, PATCOfare revenues have exceeded $26 million while total operating revenues have exceeded $27 million. Total PATCO operating revenues declined by 1.2%, primarily due to a 71,000drop in ridership during 2013, a 0.6% decline.
The DRPA restructured its E-ZPass discount program on January 1, 2004. On September 14, 2008, the Authority implemented a new bridge toll schedule which increased tolls in each vehicle class andrestructured the E-ZPass and senior citizen programs. Additionally, passenger fares, with the exception of fares for elderly persons and persons with disabilities, were increased by 10% across allzones. On July 1, 2011, the Authority implemented a new bridge toll schedule which increased tolls in each vehicle class. The Authority also implemented a second 10% increase in PATCO passengerfares.
The DRPA restructured its E-ZPass discount program on January 1, 2004. On September 14, 2008, the Authority implemented a new bridge toll schedule which increased tolls in each vehicle class andrestructured the E-ZPass and senior citizen programs. Additionally, passenger fares, with the exception of fares for elderly persons and persons with disabilities, were increased by 10% across allzones. On July 1, 2011, the Authority implemented a new bridge toll schedule which increased tolls in each vehicle class.
The toll rates shown above are cash toll rates in effect for the period indicated. The DRPA restructured its E-ZPass discount program on January 1, 2004. On September 14, 2008, the Authorityimplemented a new bridge toll schedule which increased tolls in each vehicle class and restructured the E-ZPass and senior citizen programs. Additionally, passenger fares, with the exception of faresfor elderly persons and persons with disabilities, were increased by 10% across all zones. On July 1, 2011, the Authority implemented a new bridge toll schedule which increased tolls in each vehicleclass. The Authority also implemented a second 10% increase in PATCO passenger fares.
Bridge traffic continued its decline since 2008, although the change in traffic during 2013 reflected a rather small decline of 0.4%, or 200,000 vehicles. Factors for this steep declinesince 2008 are due to the overall poor recovery in traffic due to economic conditions, and the implementation of the aforementioned total increases.

Statistical Section
DRPA 2013 Comprehensive Annual Financial Report 97
REVENUE CAPACITY DATA (Unaudited) (Continued)
BRIDGE TRAFFIC BY VEHICLE CLASSIFICATION
2013 2012 2011 2010 2009 2008 2007 2006 2005 2004Vehicle classification:
Automobiles & light trucks 43,732 43,931 44,757 46,245 46,580 48,310 49,678 49,395 48,667 48,345Trucks 2,571 2,505 2,542 2,603 2,548 2,890 3,038 3,035 2,974 2,965Buses 231 236 250 260 276 287 301 314 317 331Senior citizens 1,344 1,405 1,440 1,305 1,229 1,906 1,998 2,032 2,005 2,054Other 2 3 3 1 4 6 61 89 102 113
Total traffic 47,880 48,080 48,992 50,414 50,637 53,399 55,076 54,865 54,065 53,808
BRIDGE TRAFFIC BY BRIDGE
2013 2012 2011 2010 2009 2008 2007 2006 2005 2004Walt Whitman Bridge 18,086 18,311 18,806 19,579 20,022 20,877 21,473 21,577 21,293 21,070Ben Franklin Bridge 18,292 18,285 18,286 18,459 18,571 19,296 19,759 19,600 19,363 19,371Betsy Ross Bridge 4,993 5,090 5,429 5,821 5,595 6,511 6,900 6,906 6,788 6,909Commodore Barry Bridge 6,509 6,394 6,471 6,555 6,449 6,715 6,944 6,782 6,621 6,458Total traffic 47,880 48,080 48,992 50,414 50,637 53,399 55,076 54,865 54,065 53,808
PATCO TRANSIT SYSTEM OPERATING REVENUES
2013 2012 2011 2010 2009 2008 2007 2006 2005 2004Passenger fares $25,908 $26,035 $24,004 $21,956 $22,028 $21,459 $18,978 $19,014 $19,067 $18,647Other revenues 1,699 1,957 1,817 1,968 1,606 1,507 1,438 1,600 1,871 1,221Total operating revenues $27,607 $27,992 $25,821 $23,924 $23,634 $22,966 $20,416 $20,614 $20,938 $19,868
On September 14, 2008, passenger fares, were increased by 10% across all zones. On July 1, 2011, passenger fares were increased by an additional 10%.
PATCO PASSENGER FARES
2013 2012 2011 2010 2009 2008 2007 2006 2005 2004Lindenwold/Ashland/Woodcrest $3.00 $3.00 $3.00 $2.70 $2.70 $2.70 $2.45 $2.45 $2.45 $2.45Haddonfield/West Haddonfield/Collingswood 2.60 2.60 2.60 2.35 2.35 2.35 2.15 2.15 2.15 2.15Ferry Avenue 2.25 2.25 2.25 2.05 2.05 2.05 1.85 1.85 1.85 1.85New Jersey 1.60 1.60 1.60 1.45 1.45 1.45 1.30 1.30 1.30 1.30City Hall/Broadway/Philadelphia 1.40 1.40 1.40 1.25 1.25 1.25 1.15 1.15 1.15 1.15
On September 14, 2008, passenger fares, were increased by 10% across all zones. On July 1, 2011, passenger fares were increased by an additional 10%.
PATCO TRANSIT SYSTEM RIDERSHIP
2013 2012 2011 2010 2009 2008 2007 2006 2005 2004Passengers 10,542 10,613 10,506 10,109 10,022 10,338 9,406 9,377 9,363 9,150
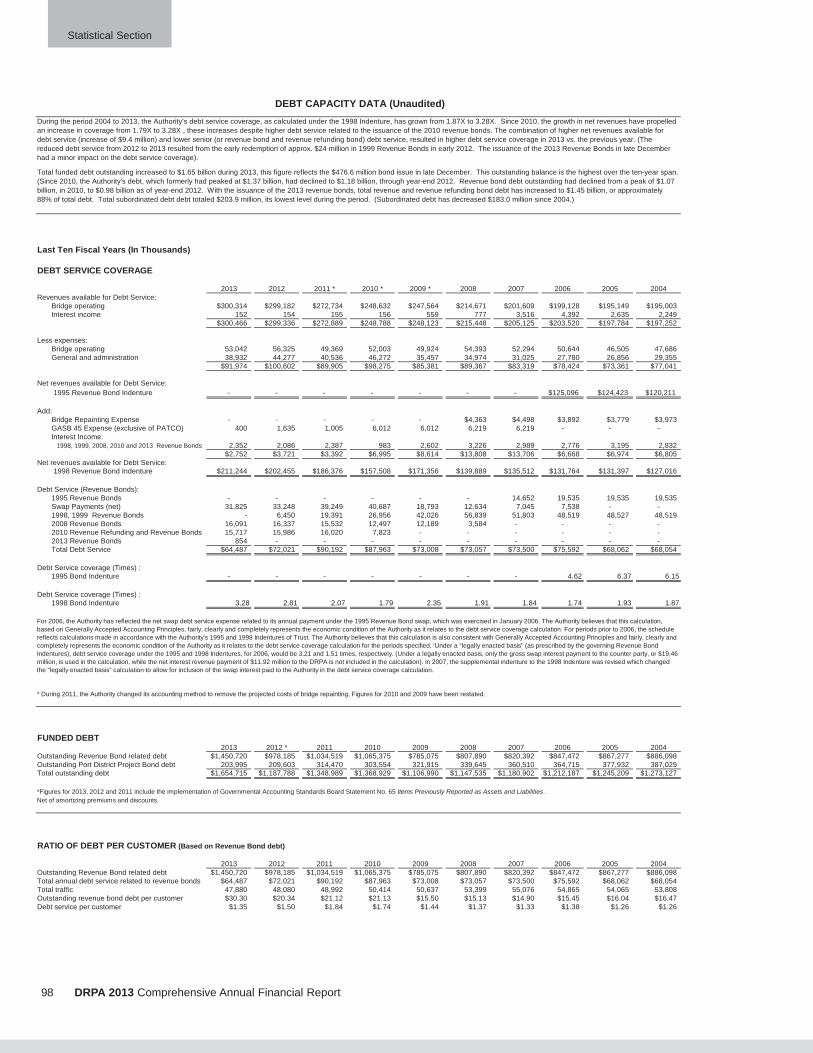
Statistical Section
98 DRPA 2013 Comprehensive Annual Financial Report
DEBT CAPACITY DATA (Unaudited)
Last Ten Fiscal Years (In Thousands)
DEBT SERVICE COVERAGE
2013 2012 2011 * 2010 * 2009 * 2008 2007 2006 2005 2004Revenues available for Debt Service:
Bridge operating $300,314 $299,182 $272,734 $248,632 $247,564 $214,671 $201,609 $199,128 $195,149 $195,003Interest income 152 154 155 156 559 777 3,516 4,392 2,635 2,249
$300,466 $299,336 $272,889 $248,788 $248,123 $215,448 $205,125 $203,520 $197,784 $197,252
Less expenses:Bridge operating 53,042 56,325 49,369 52,003 49,924 54,393 52,294 50,644 46,505 47,686General and administration 38,932 44,277 40,536 46,272 35,457 34,974 31,025 27,780 26,856 29,355
$91,974 $100,602 $89,905 $98,275 $85,381 $89,367 $83,319 $78,424 $73,361 $77,041
Net revenues available for Debt Service:1995 Revenue Bond Indenture - - - - - - - $125,096 $124,423 $120,211
Add:Bridge Repainting Expense - - - - - $4,363 $4,498 $3,892 $3,779 $3,973GASB 45 Expense (exclusive of PATCO) 400 1,635 1,005 6,012 6,012 6,219 6,219 - - -Interest Income:
1998, 1999, 2008, 2010 and 2013 Revenue Bonds 2,352 2,086 2,387 983 2,602 3,226 2,989 2,776 3,195 2,832$2,752 $3,721 $3,392 $6,995 $8,614 $13,808 $13,706 $6,668 $6,974 $6,805
Net revenues available for Debt Service:1998 Revenue Bond Indenture $211,244 $202,455 $186,376 $157,508 $171,356 $139,889 $135,512 $131,764 $131,397 $127,016
Debt Service (Revenue Bonds):1995 Revenue Bonds - - - - - - 14,652 19,535 19,535 19,535Swap Payments (net) 31,825 33,248 39,249 40,687 18,793 12,634 7,045 7,538 - -1998, 1999 Revenue Bonds - 6,450 19,391 26,956 42,026 56,839 51,803 48,519 48,527 48,5192008 Revenue Bonds 16,091 16,337 15,532 12,497 12,189 3,584 - - - -2010 Revenue Refunding and Revenue Bonds 15,717 15,986 16,020 7,823 - - - - - -2013 Revenue Bonds 854 - - - - - - - - -Total Debt Service $64,487 $72,021 $90,192 $87,963 $73,008 $73,057 $73,500 $75,592 $68,062 $68,054
Debt Service coverage (Times) :1995 Bond Indenture - - - - - - - 4.62 6.37 6.15
Debt Service coverage (Times) :1998 Bond Indenture 3.28 2.81 2.07 1.79 2.35 1.91 1.84 1.74 1.93 1.87
* During 2011, the Authority changed its accounting method to remove the projected costs of bridge repainting. Figures for 2010 and 2009 have been restated.
FUNDED DEBT2013 2012 * 2011 2010 2009 2008 2007 2006 2005 2004
Outstanding Revenue Bond related debt $1,450,720 $978,185 $1,034,519 $1,065,375 $785,075 $807,890 $820,392 $847,472 $867,277 $886,098Outstanding Port District Project Bond debt 203,995 209,603 314,470 303,554 321,915 339,645 360,510 364,715 377,932 387,029Total outstanding debt $1,654,715 $1,187,788 $1,348,989 $1,368,929 $1,106,990 $1,147,535 $1,180,902 $1,212,187 $1,245,209 $1,273,127
*Figures for 2013, 2012 and 2011 include the implementation of Governmental Accounting Standards Board Statement No. 65 Items Previously Reported as Assets and Liabilities .Net of amortizing premiums and discounts.
RATIO OF DEBT PER CUSTOMER (Based on Revenue Bond debt)
2013 2012 2011 2010 2009 2008 2007 2006 2005 2004Outstanding Revenue Bond related debt $1,450,720 $978,185 $1,034,519 $1,065,375 $785,075 $807,890 $820,392 $847,472 $867,277 $886,098Total annual debt service related to revenue bonds $64,487 $72,021 $90,192 $87,963 $73,008 $73,057 $73,500 $75,592 $68,062 $68,054Total traffic 47,880 48,080 48,992 50,414 50,637 53,399 55,076 54,865 54,065 53,808Outstanding revenue bond debt per customer $30.30 $20.34 $21.12 $21.13 $15.50 $15.13 $14.90 $15.45 $16.04 $16.47Debt service per customer $1.35 $1.50 $1.84 $1.74 $1.44 $1.37 $1.33 $1.38 $1.26 $1.26
During the period 2004 to 2013, the Authority’s debt service coverage, as calculated under the 1998 Indenture, has grown from 1.87X to 3.28X. Since 2010, the growth in net revenues have propelledan increase in coverage from 1.79X to 3.28X , these increases despite higher debt service related to the issuance of the 2010 revenue bonds. The combination of higher net revenues available fordebt service (increase of $9.4 million) and lower senior (or revenue bond and revenue refunding bond) debt service, resulted in higher debt service coverage in 2013 vs. the previous year. (Thereduced debt service from 2012 to 2013 resulted from the early redemption of approx. $24 million in 1999 Revenue Bonds in early 2012. The issuance of the 2013 Revenue Bonds in late Decemberhad a minor impact on the debt service coverage).
Total funded debt outstanding increased to $1.65 billion during 2013, this figure reflects the $476.6 million bond issue in late December. This outstanding balance is the highest over the ten-year span.(Since 2010, the Authority's debt, which formerly had peaked at $1.37 billion, had declined to $1.18 billion, through year-end 2012. Revenue bond debt outstanding had declined from a peak of $1.07billion, in 2010, to $0.98 billion as of year-end 2012. With the issuance of the 2013 revenue bonds, total revenue and revenue refunding bond debt has increased to $1.45 billion, or approximately88% of total debt. Total subordinated debt debt totaled $203.9 million, its lowest level during the period. (Subordinated debt has decreased $183.0 million since 2004.)
For 2006, the Authority has reflected the net swap debt service expense related to its annual payment under the 1995 Revenue Bond swap, which was exercised in January 2006. The Authority believes that this calculation,based on Generally Accepted Accounting Principles, fairly, clearly and completely represents the economic condition of the Authority as it relates to the debt service coverage calculation. For periods prior to 2006, the schedulereflects calculations made in accordance with the Authority’s 1995 and 1998 Indentures of Trust. The Authority believes that this calculation is also consistent with Generally Accepted Accounting Principles and fairly, clearly andcompletely represents the economic condition of the Authority as it relates to the debt service coverage calculation for the periods specified. ‘Under a “legally enacted basis” (as prescribed by the governing Revenue BondIndentures), debt service coverage under the 1995 and 1998 Indentures, for 2006, would be 3.21 and 1.51 times, respectively. (Under a legally enacted basis, only the gross swap interest payment to the counter party, or $19.46million, is used in the calculation, while the net interest revenue payment of $11.92 million to the DRPA is not included in the calculation). In 2007, the supplemental indenture to the 1998 Indenture was revised which changedthe “legally enacted basis” calculation to allow for inclusion of the swap interest paid to the Authority in the debt service coverage calculation.

Statistical Section
DRPA 2013 Comprehensive Annual Financial Report 99
DEMOGRAPHIC AND ECONOMIC DATA (Unaudited)
Last Ten Fiscal Years
PENNSYLVANIA PORT DISTRICT
2012 2011 2010 2009 2008 2007 2006 2005 2004 2003Population (1) 4,054,478 4,030,926 4,010,290 4,012,573 3,991,897 3,882,564 3,879,207 3,873,792 3,870,442 3,863,296Total Personal Income (1) 212,668,430$ $204,488,875 $195,158,270 $191,619,984 $189,058,438 $184,342,322 $174,120,302 $164,091,035 $155,961,239 $147,697,927Per Capita Personal Income (1) $52,453 $50,730 $48,664 $47,755 $47,361 $47,480 $44,886 $42,359 $40,295 $38,231Unemployment Rate (2) 8.75% 8.50% 8.71% 7.91% 5.37% 4.36% 4.26% 4.58% 5.00% 5.22%
Sources:(1) Bureau of Economic Analysis, Regional Economic Accounts, Metropolitan Divisions (Philadelphia, PA Metropolitan Division)(2) United States Department of Labor, Bureau of Labor Statistics, Local Area Unemployment Statistics
PENNSYLVANIA PORT DISTRICT TOP TEN EMPLOYERS
# of Employees % of Employment # of Employees % of Employment1. Jefferson Health System 19,100 0.95% 6. Catholic Health East 11,339 0.56%
2. University of Pennsylvania 16,160 0.81% 7. United Parcel Service. 10,261 0.51%
3. University Of Pennsylvania Health System 14,941 0.74% 8. Comcast Corporation 10,200 0.51%
4. Merck & Company, Inc 12,000 0.60% 9. Aramark Corp. 10,026 0.50%
5. Wal-Mart 11,445 0.57% 10. Supervalu Inc. (Acme) 10,000 0.50%
List excludes Federal Government Agencies (Federal Reserve Bank, U.S. Mint, U.S. District Court, Internal Revenue Service and U.S. Military), City Departments (Police and Fire Departments,Streets Department, Courts and the Water and Gas Company) and area School Systems (including Board of Education).
Source: Select Greater Philadelphia, Regional Data
NEW JERSEY PORT DISTRICT
2012 2011 2010 2009 2008 2007 2006 2005 2004 2003Population 2,438,673 2,425,526 2,422,041 2,419,475 2,411,118 2,401,441 2,391,435 2,378,301 2,364,176 2,342,408Total Personal Income 103,930,739$ $102,916,280 $101,195,650 $99,031,079 $98,568,702 $92,444,597 $89,285,614 $84,062,922 $80,794,632 $77,083,605Per Capita Personal Income $42,618 $42,430 $41,781 $40,931 $40,881 $38,495 $37,336 $35,346 $34,175 $32,908Unemployment Rate 10.20% 11.10% 11.51% 10.84% 6.07% 5.16% 5.44% 5.14% 5.45% 6.29%
Source: United States Department of Labor, Bureau of Labor Statistics, Local Area Unemployment Statistics
NEW JERSEY PORT DISTRICT TOP TEN EMPLOYERS
# of Employees % of Employment # of Employees % of Employment1. Virtua Health 8,900 0.71% 6. Cooper Health System 5,000 0.40%
2. Wells Fargo 8,870 0.70% 7. Kennedy Health System 4,973 0.39%
3. TD Bank 5,900 0.47% 8. St. Barnabus Health Care Sy 4,700 0.37%
4. Lourdes Health System 5,370 0.43% 9. PHH Mortgage 4,500 0.36%
5. Lockheed Martin Corp. 5,000 0.40% 10. Six Flags Theme Park 4,340 0.34%
List excludes Federal Government Agencies, City Departments, area School Systems (including Board of Education) and NJ Casinos
Sources: Select Greater Philadelphia, Regional Data, Ocean County Data Book, The Press, Atlantic City
EMPLOYMENT SHARES BY SECTOR: GREATER PHILADELPHIA REGION 2012
The following figures provide four key external factors during the ten years from 2003-2012 that affected the geographic region in which the Authority functions; this region consists of the Port District comprising ofthe counties of Bucks, Chester, Delaware, Montgomery, and Philadelphia in Pennsylvania, and the counties of Atlantic, Burlington, Camden, Cape May, Cumberland, Gloucester, Ocean, and Salem in NewJersey. Based on the most recent data, population growth in the region is at very modest levels with growth in the New Jersey counties at 4.1% since 2003 and in the Pennsylvania counties at 4.9% since 2003.The unemployment rate in the Philadelphia Metropolitan Region for the period of 2003 through 2012, reflected a high of 8.75% in 2012 and a low of 4.26% in 2006. Three of the region's top ten major employerswere health care organizations. The unemployment rate in the New Jersey Metropolitan Region for the period of 2003 through 2012, reflected a high of 11.51% in 2010 and a low of 5.14% in 2005. Five of theregion's top ten major employers in New Jersey were health care organizations. Please refer to the following schedules below for a historical view of the demographic information and area employers within thePort District.
Government, 15%
Other Services, 4%
Leisure and Hospitality,8%
Education, 21%Prof. and BusinessServices, 15%
Financial Activities, 7%
Information, 3%
Trade, Transp. AndUtilities, 18%
Manufacturing, 6%Const., NR. and Mining,
3%

Statistical Section
100 DRPA 2013 Comprehensive Annual Financial Report
OPERATING INFORMATION (Unaudited)
Last Ten Fiscal Years (In Thousands)
BRIDGE OPERATING REVENUES
2013 2012 2011 2010 2009 2008 2007 2006 2005 2004Toll revenues by vehicle classification:
Automobiles, light trucksand commuters $219,379 $220,379 $201,483 $184,439 $184,260 $155,009 $144,835 $143,843 $141,057 $139,471
Trucks 68,298 66,087 60,383 54,856 53,697 49,467 47,363 47,145 45,618 45,099Buses 2,310 2,370 2,271 2,074 2,187 1,640 1,434 1,500 1,515 1,655Senior citizens 3,360 3,512 3,123 2,308 2,268 2,389 1,999 2,033 2,005 2,054Other 516 462 425 202 208 351 438 437 735 530Discounts and deductions - - - - - - - - - -
Total toll revenues $293,863 $292,810 $267,685 $243,879 $242,620 $208,856 $196,069 $194,958 $190,930 $188,809Other bridge operating revenues - - - 4,753 4,944 5,815 5,540 4,170 4,219 6,194Total bridge operating revenues $293,863 $292,810 $267,685 $248,632 $247,564 $214,671 $201,609 $199,128 $195,149 $195,003
GENERAL EXPENSES BY FUNCTION
2013 2012 2011 2010 2009 2008 2007 2006 2005 2004Bridge operations:
Salaries and employee benefits $34,184 $32,790 $30,743 $31,743 $32,496 $31,551 $30,047 $29,059 $26,954 $27,450Equipment and supplies 209 159 194 259 212 212 176 156 136 106Maintenance and repairs 3,356 1,990 3,327 3,433 3,234 3,417 3,277 2,966 1,511 1,599Utilities 1,591 1,636 1,694 2,819 2,562 2,783 2,621 2,386 1,678 1,678Insurance 5,719 2,877 4,974 5,765 5,130 4,644 5,093 5,813 6,617 6,727Other 7,983 16,873 8,437 12,335 10,442 11,786 11,080 10,264 9,609 10,126
Total bridge operations 53,042 56,325 49,369 56,354 54,076 54,393 52,294 50,644 46,505 47,686
PATCO transit system:Maintenance of way and power 11,263 10,770 10,865 11,261 11,552 10,229 9,774 9,438 8,884 8,618Maintenance of equipment 6,547 6,157 6,149 7,666 7,156 6,696 6,679 6,370 7,046 6,345Purchased power 4,688 4,270 5,230 5,667 5,359 5,656 4,933 4,984 3,335 2,852Transportation 16,015 15,012 14,347 13,986 15,114 14,489 13,015 11,800 11,622 11,725General insurance 1,583 1,276 4,288 876 767 1,256 692 704 823 502Administration 4,298 4,771 4,011 8,059 7,863 7,795 7,375 4,542 4,024 4,129
Total PATCO transit system 44,394 42,256 44,890 47,515 47,811 46,121 42,468 37,838 35,734 34,171
Community impact 3,688 3,611 3,560 3,473 3,483 3,380 3,306 3,198 3,078 3,021General administration 38,932 44,277 40,536 46,272 35,457 34,974 31,025 27,780 26,857 29,355Port of Philadelphia and Camden 62 29 246 824 1,269 1,447 1,698 1,824 3,548 3,683Interest 58,784 66,540 77,870 72,527 65,584 75,654 74,668 78,267 72,213 73,621Total expenses $198,902 $213,038 $216,471 $226,965 $207,680 $215,969 $205,459 $199,551 $187,935 $191,537
Overall bridge operating revenues, and more specifically bridge toll revenues, have shown positive growth for the ten-year period shown below. As mentioned earlier,revenues for the fiscal years 2008 through 2010 increased significantly due to the 2008 toll increase, while revenues from 2011 through 2013 increased sharply due to themid-year 2011 toll increase. During 2013, total bridge operating revenues increased by $1.0 million, to total $293.9 million, a slight increase of less than 0.5%.
The DRPA restructured its E-ZPass discount program on January 1, 2004. On September 14, 2008, the Authority implemented a new bridge toll schedule which increased tolls in eachvehicle class and restructured the E-ZPass and senior citizen programs. Additionally, passenger fares, with the exception of fares for elderly persons and persons with disabilities, wereincreased by 10% across all zones. On July 1, 2011, the Authority implemented a new bridge toll schedule which increased tolls in each vehicle class. Please see Note 18 for the current tollschedule.
Since 2010, general expenses at DRPA and PATCO have shown a downward trend, decreasing from $226.96 million in 2010 to $198.55 million, a 12.5% decrease over the period. Totalexpenses for 2012 dropped below $200 million annually, the first time this has happened since 2006.
DRPA’s capital expenditures have increased since 2009, largely a result of a strengthened General Fund and the issuance of new revenue bonds to fund the annual andfive-year capital programs. During 2011 and 2012 capital expenditures, net of federal funding, exceeded $100 million for the first time during the ten-year period shown.2012 numbers were $40.8 million less than the highest totals of $158.8 million expended in 2011. 2013 expenditures continued this trend, decreasing by $30.6 million.
During the past several years total annual general expenses have declined from $227.0 million in 2010 to $198.9 million. During the period 2009 and 2010, theimplementation of GASB 45 impacted expenses, however, a lower liability accrual for both DRPA and PATCO beginning in 2011 contributed to the overall reduction inexpenses. PATCO purchased power costs have decreased from its peak of $5.7 million in 2008 to $4.7 million in 2013. While these expenses increased in the period2012 vs. 2013, the Authority has been able to significantly reduce potential purchased power costs as a result of its use of a reverse auction held in 2012. Reducedbiennial inspection and LOC costs, were largely responsible for the decrease in G&A and bridge operating expenses during 2013.

Statistical Section
DRPA 2013 Comprehensive Annual Financial Report 101
OPERATING INFORMATION (Unaudited) (Continued)
OPERATING STATISTICS
2013 2012 2011 2010 2009 2008 2007 2006 2005 2004DRPA
Total Traffic 47,880 48,080 48,992 50,414 50,637 53,399 55,076 54,865 54,065 53,808Non-Commercial Traffic 45,309 45,575 46,450 47,811 48,089 50,509 52,038 51,830 51,091 50,843Commercial Traffic 2,571 2,505 2,542 2,603 2,548 2,890 3,038 3,035 2,974 2,965Average Daily Traffic 131 132 134 138 139 146 151 150 148 147Average Toll per Customer $6.14 $6.09 $5.46 $4.84 $4.79 $3.91 $3.56 $3.55 $3.53 $3.51E-ZPass Traffic 29,635 29,098 28,983 28,911 28,367 28,130 27,987 26,946 25,522 24,481% of E-ZPass Traffic 61.9% 60.5% 59.2% 57.3% 56.0% 52.7% 50.8% 49.1% 47.2% 45.5%
PATCOTotal Passengers 10,542 10,613 10,506 10,109 10,022 10,338 9,406 9,377 9,363 9,150Average Daily Passengers 29 29 29 28 27 28 26 26 26 25Average Fare Per Passenger $2.46 $2.46 $2.28 $2.18 $2.20 $2.08 $2.02 $2.03 $2.04 $2.04
Average fare per passenger based on PATCO net passenger fare revenues.
FULL TIME AUTHORITY EMPLOYEES
2013 2012 2011 2010 2009 2008 2007 2006 2005 2004DRPA 572 567 564 582 595 589 589 553 554 570PATCO 308 296 302 309 305 301 302 355 358 373Total Full-time 880 863 866 891 900 890 891 908 912 943
CAPITAL EXPENDITURES
2013 2012 2011 2010 2009 2008 2007 2006 2005 2004Bridge and Transit System $87,468 $118,056 $158,812 $71,494 $75,481 $58,498 $23,395 $31,109 $44,501 $74,435
CAPITAL ASSET STATISTICS
Facility - Lane Miles 2013 2012 2011 2010 2009 2008 2007 2006 2005 2004Walt Whitman Bridge
Main Span (lane miles) 14.7 14.7 14.7 14.7 14.7 14.7 14.7 14.7 14.7 14.7Miles per Lane 2.1 2.1 2.1 2.1 2.1 2.1 2.1 2.1 2.1 2.1Number of Lanes 7 7 7 7 7 7 7 7 7 7
Ben Franklin BridgeMain Span (lane miles) 12.67 12.67 12.67 12.67 12.67 12.67 12.67 12.67 12.67 12.67Miles per Lane 1.81 1.81 1.81 1.81 1.81 1.81 1.81 1.81 1.81 1.81Number of Lanes 7 7 7 7 7 7 7 7 7 7
Betsy Ross BridgeMain Span (lane miles) 7.5 7.5 7.5 7.5 7.5 7.5 7.5 7.5 7.5 7.5Miles per Lane 1.25 1.25 1.25 1.25 1.25 1.25 1.25 1.25 1.25 1.25Number of Lanes 6 6 6 6 6 6 6 6 6 6
Commodore Barry BridgeMain Span (lane miles) 14.0 14.0 14.0 14.0 14.0 14.0 14.0 14.0 14.0 14.0Miles per Lane 2.8 2.8 2.8 2.8 2.8 2.8 2.8 2.8 2.8 2.8Number of Lanes 5 5 5 5 5 5 5 5 5 5
Track MileagePATCO Transit System 14.9 14.9 14.9 14.9 14.9 14.9 14.9 14.9 14.9 14.9
Number of PATCO NJ Stations 9 9 9 9 9 9 9 9 9 9Number of PATCO PA Stations 4 4 4 4 4 4 4 4 4 4

Statistical Section
102 DRPA 2013 Comprehensive Annual Financial Report
0 0
$300
$225
$150
$75
$8
$4
0
$12
$16
$20
$24
10
20
30
40
50
60
4
2
0
6
8
12
10
Note:• In January 2000, the Authority fully implemented E-ZPass, an electronic toll collection system, in conjunction
with a toll increase. At implementation, as an incentive to use E-ZPass, a 10% discount was offered to E-ZPass customers, and a modified commuter program became effective and available through E-ZPass.
• In 2004, most discount programs were eliminated and the commuter program was further modified. • On September 14, 2008, the Authority implemented a new bridge toll schedule which increased tolls in each
vehicle class and restructured the E-ZPass and senior citizen programs. PATCO fares also increased. • On July 1, 2011, the Authority implemented a 25% across-the-board toll increase and a 10% PATCO
passenger fare increase.
‘13‘04 ‘06 ‘07 ‘08 ‘09 ‘10 ‘11 ‘12
‘13‘04 ‘06 ‘07 ‘08 ‘09 ‘10 ‘11 ‘12 ‘13‘04 ‘06 ‘07 ‘08 ‘09 ‘10 ‘11 ‘12
‘04‘05
‘05 ‘05
‘05 ‘06 ‘07 ‘08 ‘09 ‘10 ‘11 ‘12 ‘13
DRPA Bridge Traffi c 2004-2013(in millions of vehicles)
PATCO Passenger Ridership 2004-2013(in millions of passengers)
DRPA Bridge Toll Revenues 2004-2013(in millions of dollars)
PATCO Passenger Fare Revenues 2004-2013(in millions of dollars)
Bridge & PATCO Operations

Statistical Section
DRPA 2013 Comprehensive Annual Financial Report 103
Delaware River Port Authority
Comprehensive Annual Financial Report
for the Year Ended December 31, 2013
PRODUCED BY: DRPA Corporate Communications
Fran O’BrienMichael D. Williams
PRINTED BY:DRPA Printing Services
FINANCIAL DATA COMPILED BY: Darcie DeBeaumontJennifer A. DePoder
Ronnie GilbertJames M. White, Jr., CCM

One Port Center • 2 Riverside Drive, PO Box 1949 • Camden, NJ 08101-1949 (856) 968-2000 • (215) 218-3750 • www.drpa.org