Embed Size (px)
Citation preview

Page 1 of 35
2013
-14
Ann
ual E
nerg
y Ef
ficie
ncy
Rep
ort
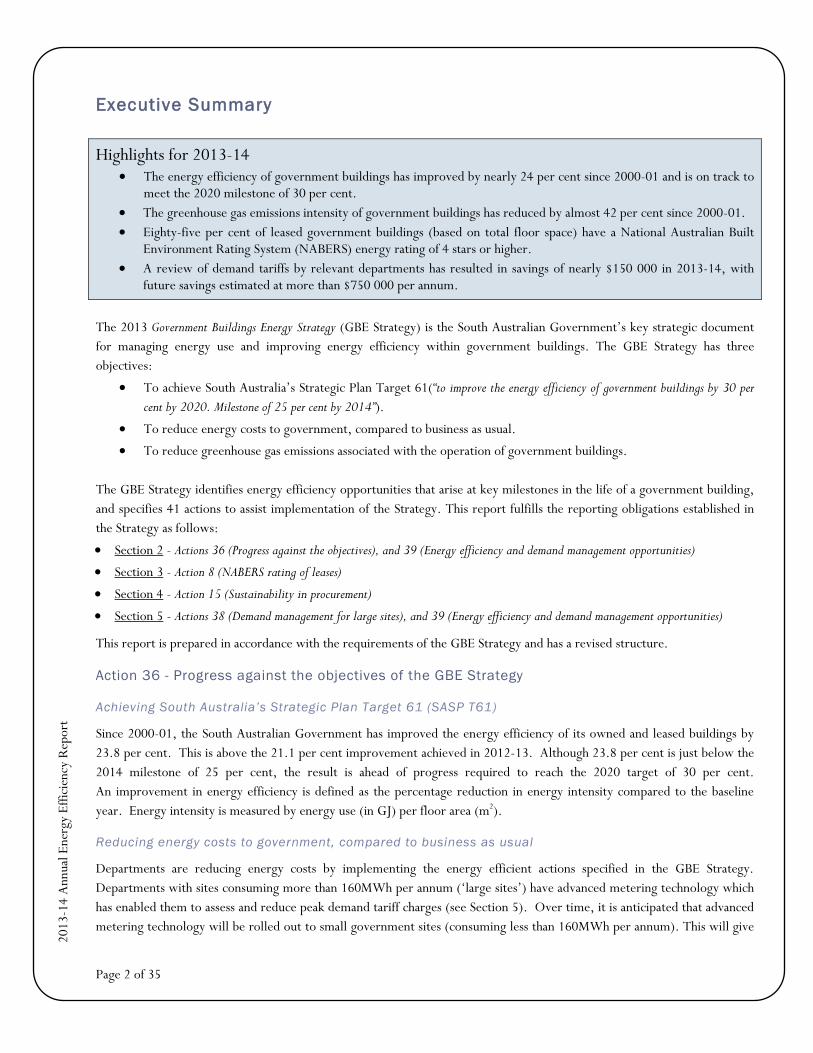
2013-14 ANNUAL ENERGY EFFICIENCY REPORT Reporting on the South Australian Government Buildings Energy Strategy
Contents EXECUTIVE SUMMARY ....................................................................................................... 2 1. INTRODUCTION ........................................................................................................ 4
1.1 CALCULATION OF ENERGY EFFICIENCY ........................................................................... 4 1.2 CALCULATION OF GREENHOUSE GAS INTENSITY ................................................................ 5 1.3 IMPACT OF CHANGES TO CALCULATION FACTORS AND METHODS ........................................... 5
2. WHOLE OF GOVERNMENT REPORTING – ACTIONS 36 AND 39 ................................................. 6 2.1 SOUTH AUSTRALIAN GOVERNMENT RESULT – ENERGY EFFICIENCY IMPROVEMENT – ACTION 36 ...... 6 2.2 SOUTH AUSTRALIAN GOVERNMENT RESULT – GREENHOUSE GAS REDUCTION – ACTION 36 ........... 9 2.3 ENERGY EFFICIENCY OPPORTUNITIES AND COST REDUCTIONS – ACTIONS 36 AND 39................... 10
3. NABERS RATINGS FOR OFFICE LEASES – ACTION 8 ................................................................ 10 4. SUSTAINABLE PROCUREMENT – ACTION 15 .......................................................................... 13
4.1 CASE STUDY: SUSTAINABLE INDUSTRIES EDUCATION CENTRE, TONSLEY TAFE ......................... 14 5. DEMAND MANAGEMENT FOR LARGE SITES – ACTIONS 38 AND 39 ................................................ 15 6. DEPARTMENTAL PERFORMANCE ...................................................................................... 18 APPENDIX A: INDIVIDUAL DEPARTMENT GRAPHS ...................................................................... 20
ATTORNEY-GENERAL’S DEPARTMENT (AGD) ....................................................................... 20 COURT’S ADMINISTRATION AUTHORITY (CAA) .................................................................... 20 DEPARTMENT FOR CORRECTIONAL SERVICES (DCS) ............................................................... 21 DEPARTMENT OF COMMUNITIES AND SOCIAL INCLUSION (DCSI) ................................................ 21 DEPARTMENT OF EDUCATION AND CHILD DEVELOPMENT (DECD) ............................................. 22 DEFENCE SA ............................................................................................................... 22 DEPARTMENT OF ENVIRONMENT, WATER AND NATURAL RESOURCES (DEWNR) ........................... 23 DEPARTMENT OF FURTHER EDUCATION, EMPLOYMENT, SCIENCE AND TECHNOLOGY (DFEEST) ......... 23 DEPARTMENT OF HEALTH AND AGEING (DHA) ..................................................................... 24 DEPARTMENT OF MANUFACTURING, INNOVATION, TRADE, RESOURCES AND ENERGY (DMITRE) ........ 24 DEPARTMENT OF THE PREMIER AND CABINET ....................................................................... 25 DEPARTMENT OF PLANNING, TRANSPORT AND INFRASTRUCTURE (DPTI) ..................................... 26 DEPARTMENT OF TREASURY AND FINANCE (DTF) .................................................................. 26 ENVIRONMENT PROTECTION AUTHORITY (EPA) ................................................................... 27 PRIMARY INDUSTRIES AND REGIONS SA (PIRSA) .................................................................... 27 SOUTH AUSTRALIAN FIRE AND EMERGENCY SERVICES COMMISSION (SAFECOM) ............................ 28 SOUTH AUSTRALIA POLICE (SAPOL) ................................................................................. 28 TAFE SA ................................................................................................................... 29
APPENDIX B: GBE STRATEGY ACTIONS TO BE REPORTED IN THE AEER ............................................ 30 APPENDIX C: GLOSSARY .................................................................................................... 31 APPENDIX D: CALCULATION OF ENERGY EFFICIENCY ................................................................. 33 APPENDIX E: CALCULATION OF GREENHOUSE GAS INTENSITY ....................................................... 34 APPENDIX F: CONVERSION FACTORS ..................................................................................... 35
Page 2 of 35
2013
-14
Ann
ual E
nerg
y Ef
ficie
ncy
Rep
ort
Executive Summary
Highlights for 2013-14 • The energy efficiency of government buildings has improved by nearly 24 per cent since 2000-01 and is on track to
meet the 2020 milestone of 30 per cent. • The greenhouse gas emissions intensity of government buildings has reduced by almost 42 per cent since 2000-01. • Eighty-five per cent of leased government buildings (based on total floor space) have a National Australian Built
Environment Rating System (NABERS) energy rating of 4 stars or higher. • A review of demand tariffs by relevant departments has resulted in savings of nearly $150 000 in 2013-14, with
future savings estimated at more than $750 000 per annum.
The 2013 Government Buildings Energy Strategy (GBE Strategy) is the South Australian Government’s key strategic document for managing energy use and improving energy efficiency within government buildings. The GBE Strategy has three objectives:
• To achieve South Australia’s Strategic Plan Target 61(“to improve the energy efficiency of government buildings by 30 per cent by 2020. Milestone of 25 per cent by 2014”).
• To reduce energy costs to government, compared to business as usual.
• To reduce greenhouse gas emissions associated with the operation of government buildings. The GBE Strategy identifies energy efficiency opportunities that arise at key milestones in the life of a government building, and specifies 41 actions to assist implementation of the Strategy. This report fulfills the reporting obligations established in the Strategy as follows:
• Section 2 - Actions 36 (Progress against the objectives), and 39 (Energy efficiency and demand management opportunities)
• Section 3 - Action 8 (NABERS rating of leases)
• Section 4 - Action 15 (Sustainability in procurement)
• Section 5 - Actions 38 (Demand management for large sites), and 39 (Energy efficiency and demand management opportunities)
This report is prepared in accordance with the requirements of the GBE Strategy and has a revised structure.
Action 36 - Progress against the objectives of the GBE Strategy
Achieving South Australia’s Strategic Plan Target 61 (SASP T61)
Since 2000-01, the South Australian Government has improved the energy efficiency of its owned and leased buildings by 23.8 per cent. This is above the 21.1 per cent improvement achieved in 2012-13. Although 23.8 per cent is just below the 2014 milestone of 25 per cent, the result is ahead of progress required to reach the 2020 target of 30 per cent. An improvement in energy efficiency is defined as the percentage reduction in energy intensity compared to the baseline year. Energy intensity is measured by energy use (in GJ) per floor area (m2).
Reducing energy costs to government, compared to business as usual
Departments are reducing energy costs by implementing the energy efficient actions specified in the GBE Strategy. Departments with sites consuming more than 160MWh per annum (‘large sites’) have advanced metering technology which has enabled them to assess and reduce peak demand tariff charges (see Section 5). Over time, it is anticipated that advanced metering technology will be rolled out to small government sites (consuming less than 160MWh per annum). This will give

Page 3 of 35
2013
-14
Ann
ual E
nerg
y Ef
ficie
ncy
Rep
ort
departments with small sites access to more sophisticated energy usage data and enable more accurate analysis of cost reductions due to energy efficiency activities.
Reducing Greenhouse Gas emissions intensity
Compared to the baseline year, the South Australian Government has reduced its Greenhouse Gas (GHG) Emissions Intensity (CO2-e/m2) from the operation of government buildings by 41.9 per cent. This is a moderate improvement on the 40.1 per cent result in 2012-13. The reduction in emissions intensity since 2000-01 has been achieved as a result of:
• changing emissions factors across reporting years, owing to South Australia’s commitment to invest in cleaner energy sources, and improved distribution networks
• improved energy efficiency practices in government buildings
• a focus on both energy efficiency and GHG reduction by many departments
• the purchase of GreenPower.
Results for each department for both energy efficiency and GHG intensity are summarised in Appendix A.
Action 8 – NABERS Ratings for Office Leases
The SA Government has a strong profile of energy efficient office buildings. The Department of Planning, Transport and Infrastructure manages the leases on behalf of government departments, with 85 per cent of the floor space of leased CBD buildings (over 2 000 m2) occupied in 2013-14 having a NABERS energy rating of 4.0 or more stars. As at 30 June 2014, 34 per cent of the floor area of total buildings (owned and leased) was 5.0 star, while less than five per cent was 3.0 star or less.
Action 15 – Sustainable Procurement
During 2013-14, procurement works included the upgrade and installation of sustainable features such as energy efficient lighting and solar photovoltaic (PV) systems. An energy life cycle assessment tool developed by the Department for Health and Ageing is being tested, and guidelines for the tool will be developed. Data to report against the specific requirements of Action 15 was not available for 2013-14. This will be addressed in future years. The TAFE SA Sustainable Industries Education Centre at Tonsley has incorporated various sustainable practices and principles throughout the design and construction process, and utilises these as an educational tool. Section 4 highlights some of the sustainable and efficient features of this best-practice facility.
Action 38 – Demand Management for large sites
For a large site, the Agreed Maximum Demand (AMD) negotiated with SA Power Networks, is reflected in its demand tariff. The AMD is the highest level of energy demand (measured in kVA) expected to be required at the site. A higher AMD results in a higher tariff. As demand tariffs comprise a significant portion of energy costs for large sites, determining the lowest possible level of maximum demand for a site can reduce costs. Additional charges apply when the agreed maximum is exceeded, so understanding the energy consumption patterns (demand profile) of a site is crucial to minimising costs. In 2013-14 many departments reviewed the demand profile of their largest energy-consuming sites. The subsequent reset of their AMD is estimated to have saved nearly $150,000 for the year. While all cost savings have not yet been realised, these changes in AMD have the potential to reduce future energy costs for government buildings by more than $750 000 annually.

Page 4 of 35
2013
-14
Ann
ual E
nerg
y Ef
ficie
ncy
Rep
ort
1. Introduction The South Australian Government Annual Energy Efficiency Report 2013-14 (AEER) has been prepared by the Energy Markets and Programs Division of the Department of State Development. This annual report provides a summary of the whole of government progress against the objectives of the Government Buildings Energy Strategy (GBE Strategy). A copy of the GBE Strategy can be viewed or downloaded at: www.sa.gov.au/ Topics/ Water, energy and environment/ Government energy efficiency initiatives. The Government Buildings Energy Group (GBE Group) includes representatives from all departments and is responsible for overseeing implementation of the Strategy. The three objectives of the GBE Strategy are:
• to achieve SASP T61 (to improve the energy efficiency of government buildings by 30 per cent by 2020)
• to reduce energy costs to government compared to business as usual
• to reduce greenhouse gas emissions associated with the operation of government buildings. The GBE Strategy, which covers the period 2013 – 2020, was approved by Cabinet in December 2013. The GBE Strategy replaces the 2002 SA Government Energy Efficiency Action Plan. It addresses the broader issue of sound energy management in government buildings and has an increased focus on health and education buildings, which account for over 75 per cent of total energy used in government buildings. There are 41 actions in the GBE Strategy, and a progress report on all actions is to be provided annually to the Government’s Senior Management Council (SMC) along with the AEER. Once noted by Cabinet, the AEER will be made publically available on www.sa.gov.au. The GBE Strategy actions include a number of reporting requirements, which are the drivers of this AEER:
• Action 36 (Progress against the objectives) – reported in Section 2
• Action 39 (Energy efficiency and demand management opportunities) – reported in Sections 2 and 5
• Actions 8 (NABERS rating of leases) – reported in Section 3
• Action 15 (Sustainability in procurement) – reported in Section 4
• Action 38 (Demand management for large sites) – reported in Section 5
The detailed requirements of these actions are listed in Appendix B. A full glossary of terms and acronyms, and a list of the government departments referred to in this report are at Appendix C. Implementation of the Strategy began in 2013-14. The format of this report differs from previous annual reports under the 2002 Energy Efficiency Action Plan. Over time, as implementation progresses, it is anticipated that more detailed information and a greater range of case studies will become available for inclusion in this report.
1.1 Calculation of Energy Effic iency For the purposes of monitoring the progress of SASP T61, a ‘government building’ is defined as a building in which public sector employees work, or where government administered services and activities are either partly or completely carried out (in the general government sector). Government buildings do not include infrastructure such as water pumps or air monitoring stations, and these are therefore not included in the measurement of SASP T61. The improvement in energy efficiency is measured by comparing the energy intensity in the current year with that in the baseline year (2000-01). Energy intensity is defined as energy use per floor area (GJ/m2). An explanation of the methodology used to calculate energy intensity and the simplified approach used in this report is contained in Appendix D.

Page 5 of 35
2013
-14
Ann
ual E
nerg
y Ef
ficie
ncy
Rep
ort
1.2 Calculation of Greenhouse Gas Intensity The Commonwealth Department of the Environment (DoE) publishes National Greenhouse Accounts (NGA) factors annually for both electricity and natural gas and these are used in the greenhouse gas (GHG) calculations for this report. Greenhouse gas intensity is expressed as kilograms of carbon dioxide-equivalent per floor area (kgCO2-e/m2). More information on the methodology used to calculate greenhouse gas intensity, and on the revision to the natural gas NGA factors for the baseline year (2000-01) is contained in Appendix E. The NGA factors are summarised in Appendix F.
1.3 Impact of Changes to Calculation Factors and Methods As in previous years, departments continue to improve data collection and calculation methods, and additional or corrected data gives rise to revisions to previously reported results. The impact on the previously reported 2012-13 results has been small. In summary: 1. The whole of government energy efficiency result for 2012-13 has been revised upwards from 20.75 to 21.10 per cent
due to: o corrections to previous data and recovery of previously unavailable data o using only one business measure (floor area in m2) to calculate energy intensity for all buildings.
2. A change to baseline greenhouse gas emissions factors for natural gas has changed the whole of government 2012-13 emissions intensity improvement from 38.6 to 40.1 per cent.
3. Changing from a ‘weighted’ to an ‘unweighted’ calculation method has also changed some departments’ 2012-13 energy efficiency result.
The details on changes to departmental results can be found in Section 6, while Appendices D and E further explain the changes to calculation methods.

Page 6 of 35
2013
-14
Ann
ual E
nerg
y Ef
ficie
ncy
Rep
ort
2. Whole of Government Reporting – Actions 36 and 39 Action 36 of the GBE Strategy requires reporting in the AEER on progress against the three objectives of the strategy:
• Achieving SASP T61 (energy efficiency in GJ/m2).
• Reducing GHG emissions associated with operation of government buildings (GHG intensity measured in kgCO2-e/m2).
• Reducing energy expenditure associated with operation of government buildings. Action 39 requires reporting on energy efficiency opportunities identified and undertaken by departments. In Section 2.3 below, reporting on the third aspect of Action 36 has been combined with reporting on Action 39, to reflect the connection between implementing energy efficiency opportunities and reducing energy expenditure. The Strategy also requires that all departments report under a single business measure - ‘floor area’ (m2). As discussed in Appendix D this simplifies the previous calculation which factored in multiple business measures.
2.1 South Austral ian Government Result – Energy Effic iency Improvement – Action 36
Since 2000-01 the amount of energy consumed by government buildings has reduced by almost 11 per cent. At the same time building floor area increased nearly 17 per cent. Energy efficiency (MJ/m2) has improved by 23.8 per cent.
Table 2.1: 2013-14 Result for Government Buildings Energy Efficiency Intensity
Total Energy Use (GJ) Total Area
(m2) Energy Intensity
(MJ per m2) 2013-14 Energy Efficiency Result
(Per Cent Improvement compared to 2000-01 Baseline) 2000-01 2013-14 2000-01 2013-14 2000-01 2013-14
2 501 600 2 227 900 4 823 000 5 635 800 518.7 395.3 23.78%
As demonstrated in Figure 2.1.2, while the 2013-14 energy efficiency result is just below the 25 per cent SASP T61 milestone, it is ahead of progress required to achieve the 2020 target of 30 per cent. Following the corrections to data and changes to the calculation method outlined in Appendix D, the baseline (2000-01) data has been reviewed and differs from that reported in the 2012-13 AEER. The previously reported 2012-13 result of a 20.75 per cent energy efficiency improvement has also been corrected and is now calculated to be 21.10 per cent.

Page 7 of 35
2013
-14
Ann
ual E
nerg
y Ef
ficie
ncy
Rep
ort
Figure 2.1.1: Annual Progress for Whole of Government Energy Efficiency
Figure 2.1.2: Annual Progress against Target for SASP T61
17.11%
21.10%
23.78%
+ 3.87% + 0.12%
+ 2.68%
0%
5%
10%
15%
20%
25%
2010-11 Result 2011-12 Change 2012-13 Change 2013-14 Change 2013-14 Result
SA Government- Annual Energy Efficiency Improvement against Baseline (%) SA Government- Annual Energy Efficiency Improvement against Baseline (%)
20.98%

Page 8 of 35
2013
-14
Ann
ual E
nerg
y Ef
ficie
ncy
Rep
ort
The charts below illustrate the change in fuel mix since 2000-01. Electricity has increased from 56 per cent to 67 per cent of fuel used in government buildings, while there has been a corresponding decline in the proportion of gas.
Figure 2.1.3: Fuel Split for Whole of Government Energy Use 2000-01
Figure 2.1.4: Fuel Split for Whole of Government Energy Use 2013-14
Whole of Government Energy Use (GJ) - Fuel Split 2000-01
Natural Gas 985 TJ (39%)
Electricity 1 408 TJ (56%)
LPG 108 TJ (4%)
Whole of Government Energy Use (GJ) - Fuel Split 2013-14
Electricity 1 493 TJ (67%)
LPG 72 TJ (3%)
Natural Gas 662 TJ (30%)

Page 9 of 35
2013
-14
Ann
ual E
nerg
y Ef
ficie
ncy
Rep
ort
2.2 South Austral ian Government Result – Greenhouse Gas Reduction – Action 36
Compared to the baseline year, GHG emissions are calculated to have reduced in intensity by 41.9 per cent. The total emissions from government buildings in the 2013-14 year were 163 000 tCO2-e lower than in the baseline year, which is the equivalent of the average annual emissions of around 50 000 cars1.
Figure 2.2: Annual Progress for Whole of Government GHG Intensity
Following the corrections to data and changes to the calculation method and Greenhouse Emissions Factors outlined in Appendix E of this report, the baseline (2000-01) data has been reviewed and differs from that reported in the 2012-13 AEER. The previously reported 2012-13 result of a 39.0 per cent improvement has also been corrected and this is now calculated to be 40.1 per cent.
Table 2.2: 2013-14 Result for South Australian Government GHG Intensity
Total Greenhouse Gas Emissions (tCO2-e)
Total Area (m2)
GHG Intensity (kgCO2-e per m2)
2013-14 GHG Intensity change (Per Cent Improvement
compared to 2000-01 Baseline) 2000-01 2013-14 2000-01 2013-14 2000-01 2013-14
507 200 344 200 4 823 000 5 635 800 105.16 61.08 41.92%
1 Calculation based on fuel consumption of average South Australian passenger car (10.9L/100km) driven 12 600 km per year producing 3 269 kgCO2-e per annum. (Source: ABS Cat. No. 9208.0 Survey of Motor Vehicle Use, Australia, June 2012, Tables 2 and 4). Emissions conversion based on 34.2 GJ/kL energy content and 69.6 kg CO2-e/GJ. (Source: Department of Environment National Greenhouse Accounts Factors July 2014, NGA Factor for General Transport Fuel Combustion, Table 4).
0
20
40
60
80
100
120
2001 2007 2008 2009 2010 2011 2012 2013 2014
Scope 1 + 2Scope 1 + 2 + 3
Greenhouse Gas Emissions Intensity: kgCO2-e/m2
SA Government Total Greenhouse Gas Emissions Intensity : kilograms CO2-equivalent (CO2-e) per m2

Page 10 of 35
2013
-14
Ann
ual E
nerg
y Ef
ficie
ncy
Rep
ort
2.3 Energy Effic iency Opportunities and Cost Reductions – Actions 36 and 39 General energy efficiency activities undertaken across government to reduce energy consumption and costs during 2013-14 are summarized below:
Ener
gy E
ffici
ency
Act
iviti
es u
nder
take
n 20
13-1
4 Building Management Systems
▫ Programming for public holidays and other periods of inactivity
▫ Motion sensors
▫ Lighting and HVAC upgrades to more efficient options
Feasibility studies
▫ Analysis of HVAC, lighting and other equipment upgrades to determine most efficient option and Return On Investment
(ROI) payback period
▫ Metering upgrades to determine consumption behaviour patterns, and prioritise areas requiring attention
▫ Equipment rationalisation and programming to energy saving settings
Mandatory Solar PhotoVoltaic (PV) Policy
▫ All new or substanitally refurbished buildings require minimum 5kW Solar PV System.
▫ Some departments mandate larger systems, many departments install PV that is additional to these policy requirements.

Page 11 of 35
2013
-14
Ann
ual E
nerg
y Ef
ficie
ncy
Rep
ort
3. NABERS Ratings for Office Leases – Action 8
Chapter 2 of the Government Buildings Energy (GBE) Strategy refers to New Leases, and is focused on maintaining and improving National Australian Built Environment Rating System (NABERS) ratings for office accommodation. The actions within this section of the GBE Strategy are based on the Government’s commitments within the South Australian Commercial Property Sector Agreement (2009)2. In addition, the Commonwealth Government’s Commercial Building Disclosure Program3 requires that lessors of office space of 2 000 m2 or more disclose the NABERS Energy rating of the base building at the time of sale or lease. This has assisted government tenants in procuring more energy efficient office accommodation.
The Department for Planning, Transport and Infrastructure (DPTI) and Energy Markets and Programs Division (EMPD) of the Department of State Development (DSD) are responsible for the GBE Strategy Action 8 reporting requirements for leasing:
Action 8 - Report through the AEER on: • The proportion of office leases with a NABERS Energy rating, and the breakdown of ratings, from 6.0 star to 1.0 star, and those with a commitment to achieve a 5.0 star rating. • The number of new or renewed leases that did not achieve a 5.0 star NABERS Energy rating, the reasons why, and any penalties imposed.
DPTI has a preference, where commercially viable, for departments to be accommodated in buildings which meet the 5.0 star NABERS rating required by the GBE Strategy. The breakdown of NABERS Ratings for leased office buildings is shown below. Buildings with leased area greater than or equal to 2 000 m2 are rated and Base Building Energy Ratings are performed.
Table 3.1: NABERS Base Building Ratings for Government Leased Office Buildings as at 30 June 2014
NABERS Energy Rating (Stars)
Number with Rating
Portion of Number of Leased Buildings
(%)
Area with Rating (m2)
Portion of Area (%)
5.0 6 24.0 67 800 34.0
4.5 6 24.0 43 100 21.6
4.0 6 24.0 57 700 29.0
3.5 3 12.0 20 900 10.5
3.0 1 4.0 2 100 1.1
2.5 2 8.0 5 100 2.6
Not rated 1 4.0 2 500 1.3
Total 25 100% 199 200 100%
In regard to the two buildings rated 2.5 stars as at 30 June 2014:
• for one, the building owner supplemented grant funds to upgrade the base building, and the new NABERS rating undertaken in September 2014 was 4.0 stars.
• the other has since been vacated, with the tenants relocated to a 5.0 star building in late November 2014. 2 South Australian Commercial Property Sector Agreement between the Minister for Sustainability and Climate Change and the Property Council of Australia Limited, June 2009. 3 Established by the Building Energy Efficiency Disclosure Act 2010.
Page 12 of 35
2013
-14
Ann
ual E
nerg
y Ef
ficie
ncy
Rep
ort
The following leases were committed to in 2013-14:
• 108 North Terrace, Adelaide (new lease in existing location) – 4.5 star NABERS
• 30 Flinders Street, Adelaide (new lease in new location) – 4.0 star NABERS
• 191 Pulteney Street, Adelaide (lease extension in existing location) – 4.0 star NABERS.
If a building does not perform to the NABERS rating specified in the leasing agreement, an energy management committee is formed between the building owner and tenant representatives to discuss opportunities for improvements. A number of leases have penalty clauses for not reaching or maintaining a prescribed level. All agreed ratings were achieved in 2013-14.
The GBE Strategy reporting requirements are intended to increase understanding of the barriers to improving energy efficiency in leased office accommodation. Further information regarding rating commitments and reason(s) new leases did not meet the 5.0 star target will be included in the 2014-15 report. Reporting will also note where new or renewed leases include an energy efficiency improvement (such as a higher NABERS rating or tenancy lighting upgrade). These actions are a standard part of DPTI’s management of leases. The recording and tracking of these actions (and of the reason that some were not undertaken) is a new requirement.
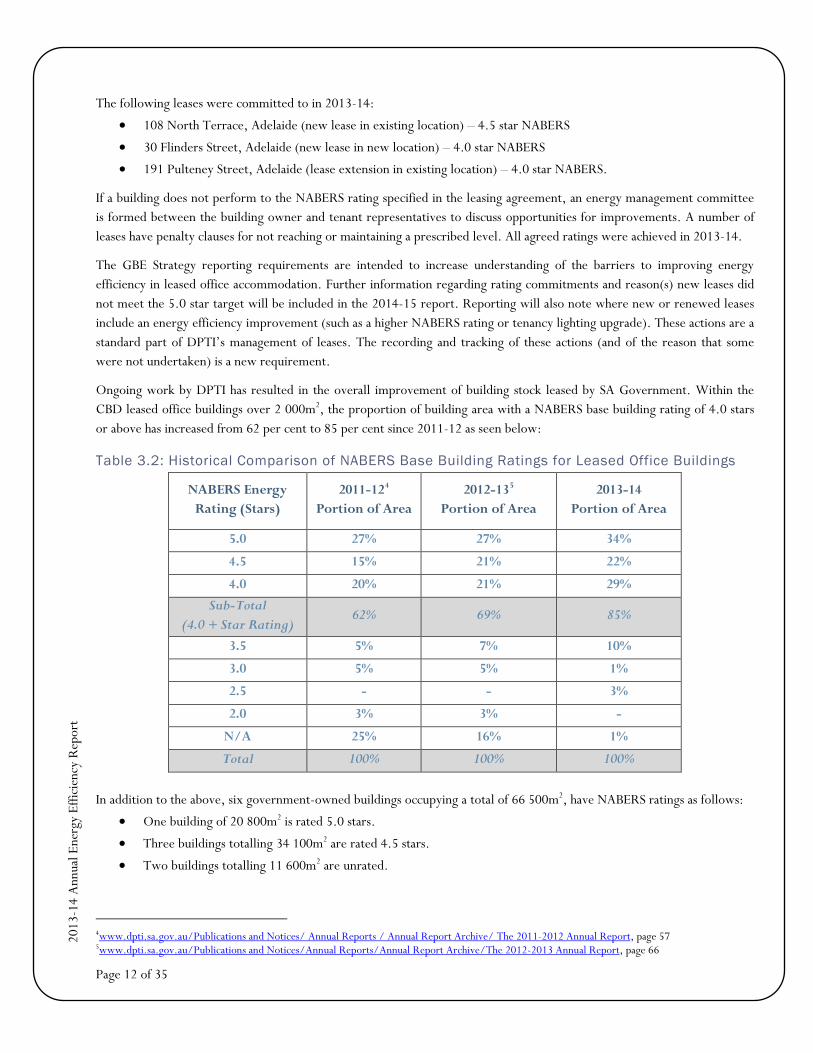
Ongoing work by DPTI has resulted in the overall improvement of building stock leased by SA Government. Within the CBD leased office buildings over 2 000m2, the proportion of building area with a NABERS base building rating of 4.0 stars or above has increased from 62 per cent to 85 per cent since 2011-12 as seen below:
Table 3.2: Historical Comparison of NABERS Base Building Ratings for Leased Office Buildings
NABERS Energy Rating (Stars)
2011-124 Portion of Area
2012-135 Portion of Area
2013-14 Portion of Area
5.0 27% 27% 34%
4.5 15% 21% 22%
4.0 20% 21% 29% Sub-Total
(4.0 + Star Rating) 62% 69% 85%
3.5 5% 7% 10%
3.0 5% 5% 1%
2.5 - - 3%
2.0 3% 3% -
N/A 25% 16% 1%
Total 100% 100% 100%
In addition to the above, six government-owned buildings occupying a total of 66 500m2, have NABERS ratings as follows:
• One building of 20 800m2 is rated 5.0 stars.
• Three buildings totalling 34 100m2 are rated 4.5 stars.
• Two buildings totalling 11 600m2 are unrated.
4www.dpti.sa.gov.au/Publications and Notices/ Annual Reports / Annual Report Archive/ The 2011-2012 Annual Report, page 57 5www.dpti.sa.gov.au/Publications and Notices/Annual Reports/Annual Report Archive/The 2012-2013 Annual Report, page 66

Page 13 of 35
2013
-14
Ann
ual E
nerg
y Ef
ficie
ncy
Rep
ort
4. Sustainable Procurement – Action 15 The GBE Strategy requires reporting on compliance with the Sustainable Procurement Board guideline (http://spb.sa.gov.au/sites/default/files/Sust%20Proc%20Guideline%20v1.0%20August%202010.pdf) under Action 15 shown below. All departments are responsible for reporting on this action. Action 15 - Report through the AEER on compliance with the Sustainable Procurement Guideline and the Life Cycle Costing Guideline, using the following KPIs: • The percentage of contracts that incorporate specific sustainability requirements. • The percentage of contract awards that have included life cycle costing. • The percentage of contracts that incorporate sustainability in the tender evaluation. The GBE Strategy also has a commitment to develop a specific life cycle assessment methodology, in Action 5. This method was developed by the Department of Health and Ageing (DHA). It is being trialled on further projects through DPTI in 2014-15. A guideline for the tool is also being developed and this will be incorporated into the Ecologically Sustainable Development (ESD) Guide Note – Planning, Design and Delivery. This methodology will also be incorporated into facility management contracts, as per GBE Strategy Action 23. As the Life Cycle Costing Guideline referenced in the GBE Strategy is no longer used, it will not be reported on here. However, elements of life cycle costing have been incorporated into the Supplier Selection Guideline, and life cycle assessment will be incorporated as described above. During 2013-14, departments have incorporated sustainability requirements including:
• energy efficient (T5) lighting
• NABERS star ratings in contracts for new building or retrofits
• meeting the mandatory requirement for a minimum solar panel installation of o 5kWcapacity for all new or substantially refurbished government owned buildings and o 1.5kW minimum capacity for new or substantially refurbished government owned residential buildings.
Tracking of these requirements within procurement contracts was not in place to capture 2013-14 Key Performance Indicator (KPI) data for Action 15. Each department will develop methods to track the specific sustainability requirements in contracts and tender evaluations, to facilitate reporting in 2014-15. It was also agreed by the GBE Group that only major projects (those greater than $150 000) would be reported on for Action 15. This is based on DPC Circular PC028 Construction which applies to projects over $150 000. Minor construction projects (not exceeding $150 000) are procured under the State Procurement Act 2004.

Page 14 of 35
2013
-14
Ann
ual E
nerg
y Ef
ficie
ncy
Rep
ort
4.1 Case Study: Sustainable Industries Education Centre, Tonsley TAFE To update ageing TAFE SA infrastructure, in 2010 the South Australia Government commissioned the $120m Sustainable Industries Education Centre (SIEC) at the 61 hectare former Mitsubishi site in Tonsley. The SIEC facility has brought together a suite of conventional and advanced building services and renewable energy technologies that are being installed in building projects across Australia. The intent was to showcase a range of technologies and provide relevant trade experience in the design, installation, commissioning and maintenance of efficient systems and plant.
The following ESD design principles have contributed to a 25 per cent reduction in energy consumption when compared to the superceded TAFE SA facilities.
• Reuse of the original Motor Assembly Building, where 90 per cent of the steel structure and over 70 per cent of the concrete slab was retained. Equipment and tools from divested campuses are also used.
• Spatial and energy efficiency is achieved by using shared spaces, resulting in minimised recurrent costs.
• The facility is filled with natural light, and energy efficient lighting is controlled by the Building Management System (BMS) where daylight harvest is insufficient.
• External air volumes through air conditioning systems were increased by 150 per cent compared to the previous sites, improving indoor air quality.
• High bay louvres and natural ventilation stacks achieve passive ventilation, while radiant in-slab heating is controlled via the BMS to minimise energy consumption. The implementation of the first South Australian application and one of the largest evaporation cooling shafts (shower tower) at the entrance creates a tempered environment in summer, while feeding information on evaporation and its resultant cooling effectiveness via the BMS. Additionally, the cooling towers can substitute for the chiller plant at times, providing substantial energy savings through free cooling.
• Roofing material performs well above Building Code of Australia (BCA) standards, to minimise solar gain and reduce peak loads.
• Use of standard dimensions and re-usable materials has reduced waste.
• Approximately 660 000 litres of rainwater is captured annually for non-potable demand, and its collection, re-use and filtration systems are controlled through the BMS. Water efficient fittings and fixtures are also installed.

Page 15 of 35
2013
-14
Ann
ual E
nerg
y Ef
ficie
ncy
Rep
ort
5. Demand Management for Large Sites – Actions 38 and 39 Demand Management was identified in the GBE Strategy (Chapter 6) as an area that could make a significant contribution towards achieving the GBE Strategy objectives. Understanding the demand (‘load’) profile of sites with large annual energy consumption enables departments to identify where the greatest savings can be achieved, and to focus efforts on these areas. For a large site the Agreed Maximum Demand (AMD), as negotiated with SA Power Networks (SAPN), is reflected in its demand tariff. The AMD is the highest level of energy demand (measured in kVA) expected to be required at the site. A higher AMD results in a higher charge. As demand tariffs comprise a significant portion of energy costs for large sites, determining the lowest possible level of maximum demand for a site can reduce costs. Additional charges apply when the agreed maximum is exceeded, so understanding the energy consumption patterns of a site is crucial to minimising costs. Action 38 of the GBE Strategy requires reporting on the review of sites consuming greater than 160MWh in relation to demand response, peak demand and load performance. Action 39 is to report on the corresponding demand management opportunities arising from the review of these sites. All departments are responsible for these actions. This reporting is based on departments completing the Demand Management Actions 26-28 of the GBE Strategy, listed below: Action 26 – Collect and collate load profile information for buildings consuming greater than 160MWh per year.
Action 27 – Assess major sites with the highest peak demand, the lowest load factor or the best demand response opportunities to identify priority energy cost reduction measures.
Action 28 – Explore the potential for demand management or load curtailment contracts for major sites, in consultation with SA Power Networks, an energy aggregator or relevant energy retailer.
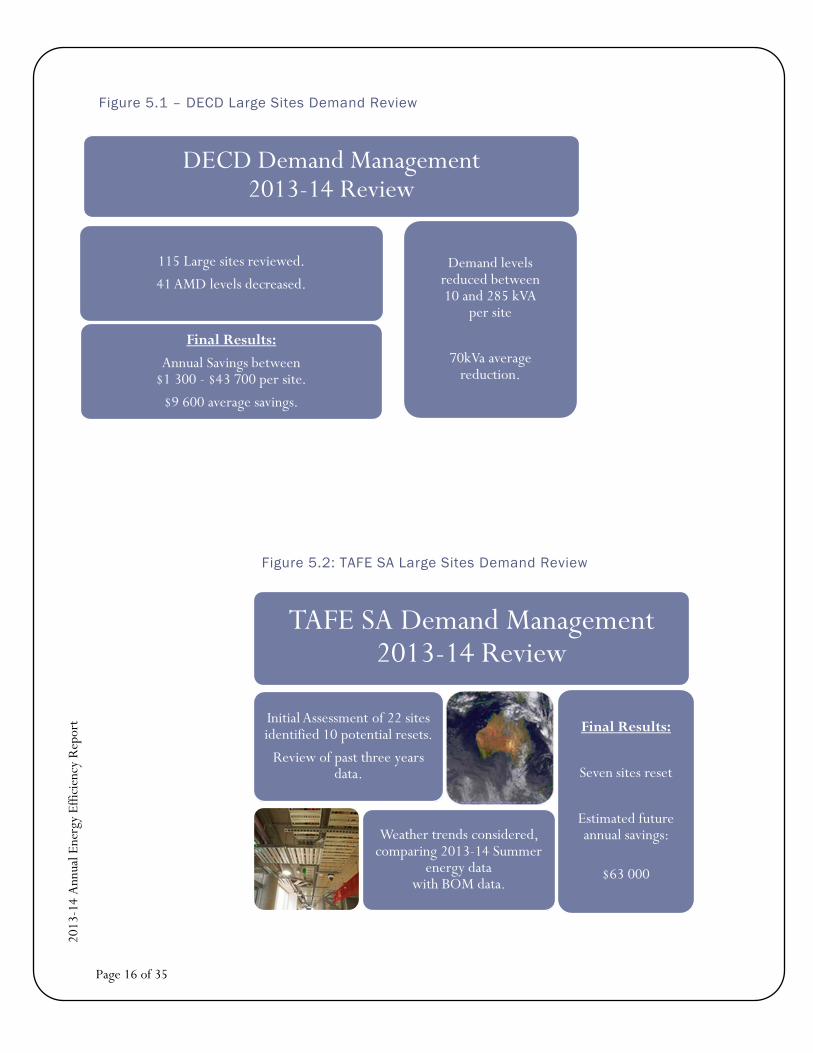
The majority of departments have completed a review of their sites. The Department of Health and Ageing (DHA) and South Australia Police (SAPOL) have been regularly reviewing demand management for a number of years, however for many other departments this was a new area of energy management. The Department of Education and Child Development (DECD) undertook its first major review of all 115 large sites in 2013-14. From this review, tariffs at 49 sites were changed and it is estimated that the annual savings from the updated tariffs will average almost $260 000. Highlights from the DECD review are shown below in Figure 5.1. Shared Services South Australia (within DPC) has assisted many departments in their reviews, gathering data on historic peaks, current tariffs and analysing potential AMD reset levels. Using this analysis, departments have reviewed the identified sites, assessing the most appropriate AMD for each site based on forecast future needs. Once a department has decided which sites to reset, it negotiates with SAPN to establish a new AMD. In considering sites for potential AMD reset levels, TAFE SA completed a further analysis, considering the influence of weather, particularly for the summer peak. Data from the Bureau of Meteorology (BOM) was reviewed for the days of high demand at the sites and the influence of weather considered when choosing the most appropriate maximum demand level. Highlights of this review are shown below in Figure 5.2.
Page 16 of 35
2013
-14
Ann
ual E
nerg
y Ef
ficie
ncy
Rep
ort
Figure 5.1 – DECD Large Sites Demand Review
Figure 5.2: TAFE SA Large Sites Demand Review
DECD Demand Management 2013-14 Review
115 Large sites reviewed.
41 AMD levels decreased.
Final Results: Annual Savings between
$1 300 - $43 700 per site. $9 600 average savings.
Demand levels reduced between 10 and 285 kVA
per site
70kVa average reduction.
TAFE SA Demand Management 2013-14 Review
Initial Assessment of 22 sites identified 10 potential resets.
Review of past three years data.
Weather trends considered, comparing 2013-14 Summer
energy data with BOM data.
Final Results:
Seven sites reset
Estimated future annual savings:
$63 000

Page 17 of 35
2013
-14
Ann
ual E
nerg
y Ef
ficie
ncy
Rep
ort
Table 5.1: Whole of Government 2013-14 Demand Management Review Summary
Department Number of Large Sites
Number of Sites
Assessed
AMD Level Reset Decision
Yes No Not Yet
Court’s Administration Authority 9 9 2 7 0 Department of Correctional Services 7 7 0 3 4 Department of Communities and Social Inclusion
9 9 0 9 0
Department of Education and Child Development
115 115 49 64 2
Department of Environment, Water and Natural Resources
9 9 0 3 6
Department of Health and Ageing 89 89 6 77 6 Department of the Premier and Cabinet 10 10 3 6 1 Department of Planning, Transport and Infrastructure
5 5 4 1 0
SA Metropolitan Fire Service 3 3 0 2 1 Department of Primary Industries and Regions SA
7 0 0 0 0
SA Fire and Emergency Services Commission
1 1 0 1 0
South Australia Police 22 22 2 20 0 TAFE SA 22 22 7 15 0 Whole of Government 308 301 73 208 20
During 2013-14, 12 departments reviewed the maximum demand levels of 301 large sites. Of these, seven departments decided to negotiate a reset of AMD for 73 sites. For 15 of these sites, the decision came into effect in 2013-14, saving at least $146 600. For the remaining 58 sites, new AMD levels were confirmed for commencement in the 2014-15 financial year, with estimated savings of more than $750,000 for the year. When assessing a site’s demand patterns, consideration is given to:
• the cost of the AMD tariff charge (the higher the AMD, the higher the tariff charge)
• the cost of any excess charges
• the frequency with which the AMD is approached, reached, or exceeded. It may therefore be the case that the existing AMD is the most financially viable. These sites are shown with a reset decision of ‘No’ in the table above. Some sites are still being considered and these sites are shown as ‘Not Yet’. One of the reasons for delaying a decision is the need to collect further summer usage data to ensure an appropriate peak level is chosen. In total, 93 sites have been identified as candidates for an AMD reset, with potential cumulative savings in excess of $1 000 000 dollars per annum. Over 69 per cent of this amount is anticipated to be achieved in the Health and Education sectors.

Page 18 of 35
2013
-14
Ann
ual E
nerg
y Ef
ficie
ncy
Rep
ort
6. Departmental Performance As this AEER covers the 2013-14 financial year, the Department list below reflects the South Australian Government structure as at 30 June 2014. Energy Efficiency is shown as EE in the table below.
Table 6.1: Departmental Results: 2012-13 and 2013-14 compared to baseline Department
2012-13 Reported Weighted6
EE Result % (Corrected Result7)
2012-13 Recalculated
Non-Weighted EE Result %
2013-14 Non-Weighted
EE Result %
2013-14 Greenhouse Gas Intensity
Improvement %
Attorney General’s Department 69.37 69.37 69.59 79.7 Court’s Administration Authority 28.43 28.43 32.59 52.8 Department of Correctional Services 9.81 9.81 10.17 37.1 Department of Communities and Social Inclusion 15.99 (20.63) 26.33 32.92 55.7 Department of Education and Child Development 11.96 (12.29) 14.47 15.79 36.8 Defence SA 22.91 22.91 30.04 30.2 Department of Environment, Water and Natural Resources
22.33 38.74 53.23 57.8
Department of Further Education, Employment, Science and Technology (DFEEST) - including TAFE SA
14.02 13.95 n/a 8 -
DFEEST - Corporate only 30.48 26.83 51.7 DFEEST – TAFE SA only 13.81 27.69 51.0
Department of Health and Ageing 23.03 23.27 26.87 38.2 Department of Manufacturing, Innovation, Trade, Resources and Energy
18.26 (23.10) 36.64 42.44 60.9
Department of the Premier and Cabinet -9.38 (-9.42) 0.30 -0.18 34.8 Department of Planning, Transport and Infrastructure
20.68 (24.20) 36.35 33.04 57.5
Department of Treasury and Finance 19.80 20.75 20.68 47.6 Environment Protection Authority 50.00 54.90 52.11 68.4 Department of Primary Industries and Regions SA 11.06 22.14 19.11 43.7 South Australian Fire and Emergency Services Commission
-75.62 (-15.64) 4.87 12.52 45.3
South Australia Police 39.40 39.40 41.72 53.6 Whole of Government 20.75 (21.08) 21.10 23.78 41.9
Table 6.1 demonstrates that improvements in energy efficiency and greenhouse gas intensity since 2000-01 vary across departments.
The energy efficiency result for 2012-13 has been re-calculated in accordance with the methodology described in Appendix D. The outcome is that the measured improvement of each department’s energy efficiency in 2012-13 either increased or did not change9.
6 As reported in the 2012-13 AEER. 7 Corrected results shown in brackets are changes arising from general corrections to 2012-13 or baseline data, although still using the same weighted method outlined in Appendix D. 8 TAFE SA and DFEEST Corporate reported separately from 2013-14. 9 The result for DFEEST (including TAFE SA) reduced by an insignificant amount - from 14.02 to 13.95 per cent.

Page 19 of 35
2013
-14
Ann
ual E
nerg
y Ef
ficie
ncy
Rep
ort
Figures 6.1 and 6.2 illustrate the departmental shares of government energy use. Appendix A provides further department level information.
Figure 6.1: Major Energy Use Departments
Figure 6.2: Minor Energy Use Departments
Health 50.96%
All others * See split
below 19.31%
DPC 6.38%
DECD 17.16%
TAFE SA 6.19%
Proportion of Whole of Government Energy Use 2013-14
* These departments are further expanded in the graph below

Page 20 of 35
2013
-14
Ann
ual E
nerg
y Ef
ficie
ncy
Rep
ort
Appendix A: Individual Department Graphs
Attorney-General’s Department (AGD)
Figure A.1: AGD Annual Energy Efficiency Improvement
In 2013-14, AGD’s energy efficiency improved by 70 per cent compared with the baseline year. Over this period its GHG emissions intensity fell from 286 to 58 kgCO2-e/m2 and total emissions reduced by 4 270 tCO2-e. This is equivalent to the average annual emissions of around 1300 cars.
Court’s Administration Authority (CAA)
Figure A.2: CAA Annual Energy Efficiency Improvement
In 2013-14, CAA’s energy efficiency improved by 33 per cent compared with the baseline year. Over this period its GHG emissions intensity fell from 125 kgCO2-e/m2 to 59 kgCO2-e/m2, and total emissions reduced by 4 050 tCO2-e. This is equivalent to the average annual emissions of around 1 240 cars.

Page 21 of 35
2013
-14
Ann
ual E
nerg
y Ef
ficie
ncy
Rep
ort
Department for Correctional Services (DCS)
Figure A.3: DCS Annual Energy Efficiency Improvement
In 2013-14, DCS’s energy efficiency improved by 10 per cent compared with the baseline year. Over this period its GHG emissions intensity fell from 147 kgCO2-e/m2 to 92 kgCO2-e/m2, and total emissions reduced by 4 060 tCO2-e. This is equivalent to the average annual emissions of around 1 240 cars.
Department of Communit ies and Social Inclusion (DCSI) Figure A.4: DCSI Annual Energy Efficiency Improvement
In 2013-14, DCSI’s energy efficiency improved by 33 per cent compared with the baseline year. The updated 2012-13 result is 26.33 per cent (15.99 per cent previously). DCSI’s GHG emissions intensity has fallen from 126 to 56 kgCO2-e/m2
since 2000-01. Total emissions have reduced by 7 530 tCO2-e. This is equivalent to the average annual emissions of around 2 300 cars.
-1.25%
10.17%
-2%
0%
2%
4%
6%
8%
10%
12%
14%
2010-11 Result 2011-12 Change 2012-13 Change 2013-14 Change 2013-14 Result
DCS - Annual Energy Efficiency Improvement against Baseline (%)

Page 22 of 35
2013
-14
Ann
ual E
nerg
y Ef
ficie
ncy
Rep
ort
Department of Education and Child Development (DECD)
Figure A.5: DECD Annual Energy Efficiency Improvement
In 2013-14, DECD’s energy efficiency improved by 16 per cent compared with the baseline year. The updated 2012-13 result is 14.47 per cent (11.96 per cent previously). DECD’s GHG emissions intensity has fallen from 43 to 27 kgCO2-e/m2
since 2000-01. Total emissions have reduced by 26 130 tCO2-e. This is equivalent to the average annual emissions of around 8 000 cars.
Defence SA
Figure A.6: Defence SA Annual Energy Efficiency Improvement
In 2013-14, Defence SA’s energy efficiency improved by 30 per cent compared with that of 2009 when they commenced operations. Over this period its GHG emissions intensity fell from 52 to 36 kgCO2-e/m2 and total emissions reduced by 16 tCO2-e. This is equivalent to the average annual emissions of five cars.
Page 23 of 35
2013
-14
Ann
ual E
nerg
y Ef
ficie
ncy
Rep
ort
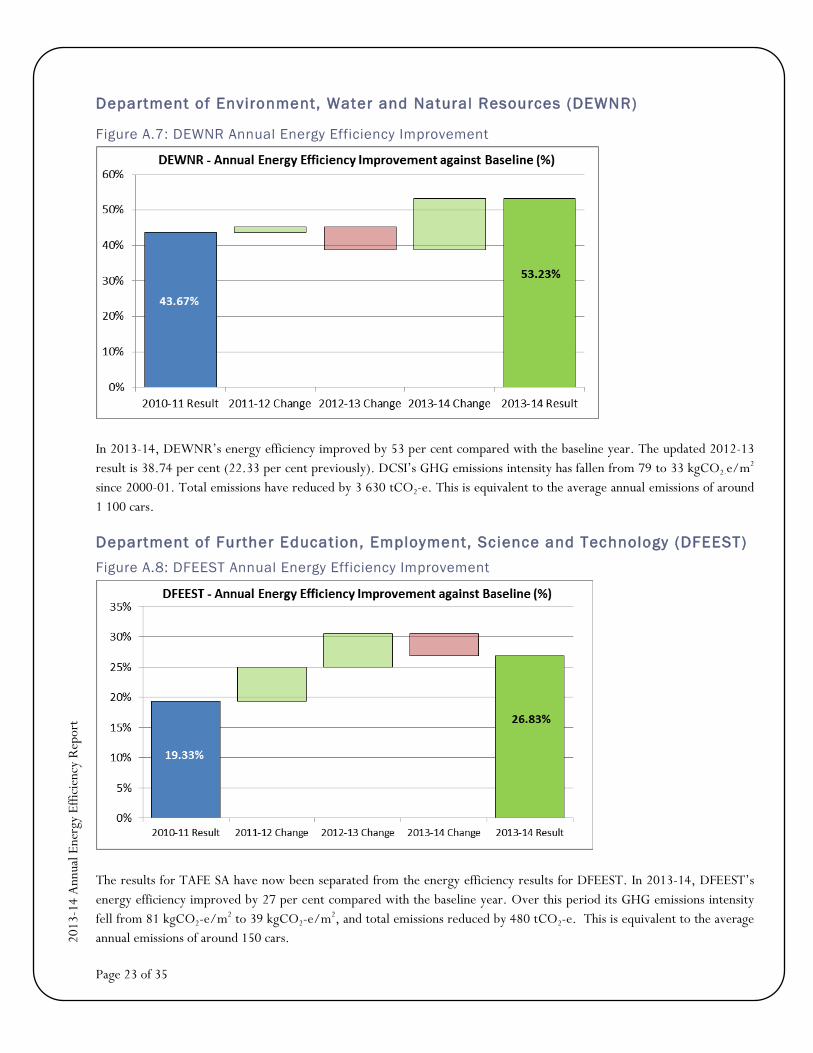
Department of Environment, Water and Natural Resources (DEWNR)
Figure A.7: DEWNR Annual Energy Efficiency Improvement
In 2013-14, DEWNR’s energy efficiency improved by 53 per cent compared with the baseline year. The updated 2012-13 result is 38.74 per cent (22.33 per cent previously). DCSI’s GHG emissions intensity has fallen from 79 to 33 kgCO2-e/m2
since 2000-01. Total emissions have reduced by 3 630 tCO2-e. This is equivalent to the average annual emissions of around 1 100 cars.
Department of Further Education, Employment, Science and Technology (DFEEST) Figure A.8: DFEEST Annual Energy Efficiency Improvement
The results for TAFE SA have now been separated from the energy efficiency results for DFEEST. In 2013-14, DFEEST’s energy efficiency improved by 27 per cent compared with the baseline year. Over this period its GHG emissions intensity fell from 81 kgCO2-e/m2 to 39 kgCO2-e/m2, and total emissions reduced by 480 tCO2-e. This is equivalent to the average annual emissions of around 150 cars.

Page 24 of 35
2013
-14
Ann
ual E
nerg
y Ef
ficie
ncy
Rep
ort
Department of Health and Ageing (DHA)
Figure A.9: DHA Annual Energy Efficiency Improvement
In 2013-14, DHA’s energy efficiency improved by 27 per cent compared with the baseline year. The updated 2012-13 result is 23.27 per cent (23.03 per cent previously). DHA’s GHG emissions intensity has fallen from 214 to 132 kgCO2-e/m2 since 2000-01. Total emissions have reduced by 50 960 tCO2-e. This is equivalent to the average annual emissions of around 15 600 cars.
Department of Manufacturing, Innovation, Trade, Resources and Energy (DMITRE)
Figure A.10: DMITRE Annual Energy Efficiency Improvement
In 2013-14, DMITRE’s energy efficiency improved by 42 per cent compared with the baseline year. The updated 2012-13 result is 36.64 per cent (18.26 per cent previously). DMITRE’s GHG emissions intensity has fallen from 117 to 46 kgCO2-e/m2 since 2000-01. Total emissions have reduced by 2 060 tCO2-e. This is equivalent to the average annual emissions of around 630 cars.
15.39%
26.87%
0%
5%
10%
15%
20%
25%
30%
2010-11 Result 2011-12 Change 2012-13 Change 2013-14 Change 2013-14 Result
DHA - Annual Energy Efficiency Improvement against Baseline (%)
37.61%
42.44%
0%
5%
10%
15%
20%
25%
30%
35%
40%
45%
2010-11 Result 2011-12 Change 2012-13 Change 2013-14 Change 2013-14 Result
DMITRE - Annual Energy Efficiency Improvement against Baseline (%)

Page 25 of 35
2013
-14
Ann
ual E
nerg
y Ef
ficie
ncy
Rep
ort
Department of the Premier and Cabinet
Figure A.11: DPC Annual Energy Efficiency Improvement
In 2013-14, DPC’s energy efficiency reduced by 0.2 per cent compared with the baseline year. The updated 2012-13 result is 0.3 per cent (-9.38 per cent previously). DPC’s GHG emissions intensity has fallen from 155 to 101 kgCO2-e/m2 since 2000-01. Total emissions have reduced by 9 450 tCO2-e. This is equivalent to the average annual emissions of around 2 900 cars. Energy consumption can be seen below split by division name, and also building function.
Figure A.11a: DPC Divisional Energy Use
Figure A.11b: DPC Building Energy Use
10.48%
-0.18% -2%
0%
2%
4%
6%
8%
10%
12%
2010-11 Result 2011-12 Change 2012-13 Change 2013-14 Change 2013-14 Result
DPC - Annual Energy Efficiency Improvement against Baseline (%)
Public Buildings
67% Other
Buildings 22%
Office - Tenant Light and Power
5%
DPC Total Energy - Proportion of use by Building Type 2013-14
Office buildings - combined services
6%

Page 26 of 35
2013
-14
Ann
ual E
nerg
y Ef
ficie
ncy
Rep
ort
Department of Planning, Transport and Infrastructure (DPTI)
Figure A.12: DPTI Annual Energy Efficiency Improvement
In 2013-14, DPTI’s energy efficiency improved by 33 per cent compared with the baseline year. The updated 2012-13 result is 36.35 per cent (20.68 per cent previously). DPTI’s GHG emissions intensity has fallen from 141 to 60 kgCO2-e/m2
since 2000-01. Total emissions have reduced by 20 280 tCO2-e. This is equivalent to the average annual emissions of around 6 200 cars.
Department of Treasury and Finance (DTF)
Figure A.13: DTF Annual Energy Efficiency Improvement
In 2013-14, DTF’s energy efficiency improved by 21 per cent compared with the baseline year. The updated 2012-13 result is 20.75 per cent (19.80 per cent previously). DTF’s GHG emissions intensity has fallen from 127 to 66 kgCO2-e/m2 since 2000-01. Total emissions have reduced by 1 910 tCO2-e. This is equivalent to the average annual emissions of around 580 cars.
48.47% 33.04%
0%
10%
20%
30%
40%
50%
60%
2010-11 Result 2011-12 Change 2012-13 Change 2013-14 Change 2013-14 Result
DPTI - Annual Energy Efficiency Improvement against Baseline (%)
Page 27 of 35
2013
-14
Ann
ual E
nerg
y Ef
ficie
ncy
Rep
ort
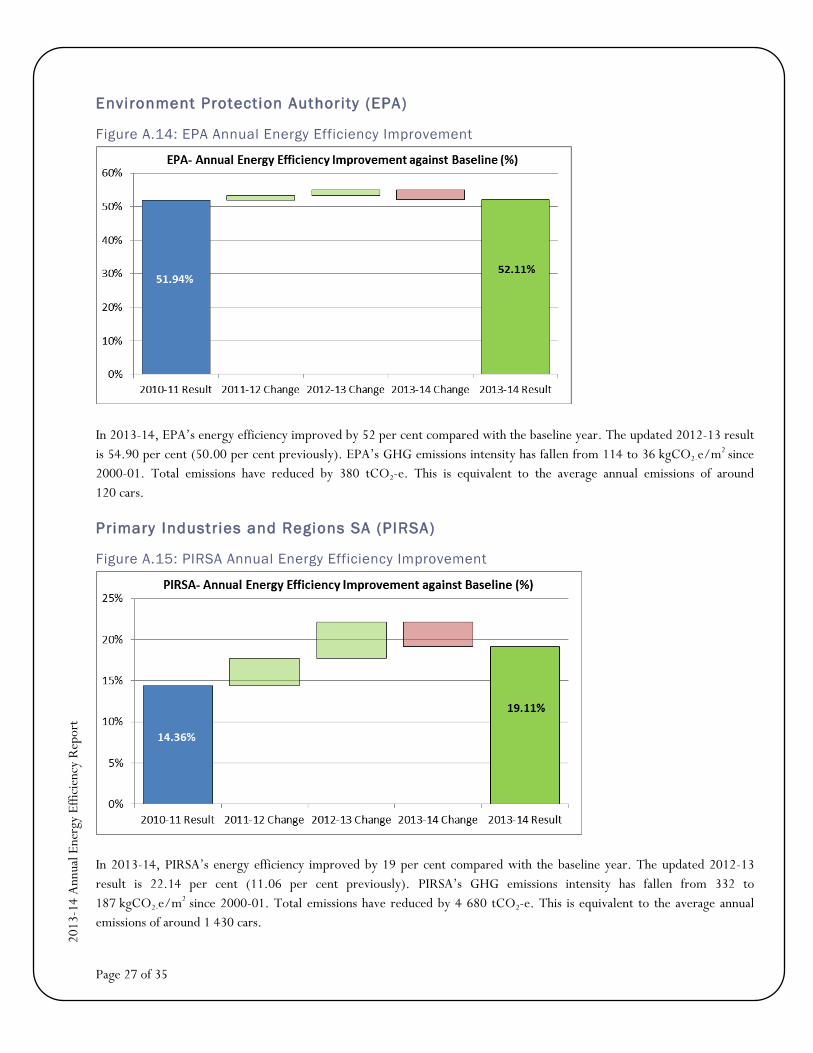
Environment Protection Authority (EPA)
Figure A.14: EPA Annual Energy Efficiency Improvement
In 2013-14, EPA’s energy efficiency improved by 52 per cent compared with the baseline year. The updated 2012-13 result is 54.90 per cent (50.00 per cent previously). EPA’s GHG emissions intensity has fallen from 114 to 36 kgCO2-e/m2 since 2000-01. Total emissions have reduced by 380 tCO2-e. This is equivalent to the average annual emissions of around 120 cars.
Primary Industries and Regions SA (PIRSA)
Figure A.15: PIRSA Annual Energy Efficiency Improvement
In 2013-14, PIRSA’s energy efficiency improved by 19 per cent compared with the baseline year. The updated 2012-13 result is 22.14 per cent (11.06 per cent previously). PIRSA’s GHG emissions intensity has fallen from 332 to 187 kgCO2-e/m2 since 2000-01. Total emissions have reduced by 4 680 tCO2-e. This is equivalent to the average annual emissions of around 1 430 cars.

Page 28 of 35
2013
-14
Ann
ual E
nerg
y Ef
ficie
ncy
Rep
ort
South Australian Fire and Emergency Services Commission (SAFECOM)
Figure A.16: SAFECOM Annual Energy Efficiency Improvement
In 2013-14, SAFECOM’s energy efficiency improved by 12.5 per cent compared with the baseline year. The updated 2012-13 result is 4.87 per cent (-75.62 per cent previously). The energy efficiency of MFS was calculated separately as a 26.1 per cent improvement in 2013-14. SAFECOM’s GHG emissions intensity has fallen from 58 to 32 kgCO2-e/m2 since 2000-01. Total emissions have reduced by 840 tCO2-e. This is equivalent to the average annual emissions of around 260 cars.
South Australia Police (SAPOL)
Figure A.17: SAPOL Annual Energy Efficiency Improvement
In 2013-14, SAPOL’s energy efficiency improved by 42 per cent compared with the baseline year. Over this period its GHG emissions intensity fell from 141 kgCO2-e/m2 to 65 kgCO2-e/m2, and total emissions reduced by 7 950 tCO2-e. This is equivalent to the average annual emissions of around 2 430 cars.
26.35%
41.72%
0%
5%
10%
15%
20%
25%
30%
35%
40%
45%
2010-11 Result 2011-12 Change 2012-13 Change 2013-14 Change 2013-14 Result
SAPOL - Annual Energy Efficiency Improvement against Baseline (%)

Page 29 of 35
2013
-14
Ann
ual E
nerg
y Ef
ficie
ncy
Rep
ort
TAFE SA
Figure A.18: TAFE SA Annual Energy Efficiency Improvement
In 2013-14, TAFE SA’s energy efficiency improved by 28 per cent compared with the baseline year. Over this period its GHG emissions intensity fell from 92 kgCO2-e/m2 to 45 kgCO2-e/m2, and total emissions reduced by 14 300 tCO2-e. This is equivalent to the average annual emissions of around 4 380 cars.

Page 30 of 35
2013
-14
Ann
ual E
nerg
y Ef
ficie
ncy
Rep
ort
Appendix B: GBE Strategy Actions to be reported in the AEER
New Leases
Action 8: Report through the Annual Energy Efficiency Report on:
• The proportion of office leases with a NABERS Energy rating, and the breakdown of ratings, from 6.0 to 1.0 star, and those with a commitment to achieve a 5.0 star rating.
• The number of new or renewed leases that did not achieve a 5.0 star NABERS Energy rating, the reasons why, and any penalties imposed.
Plant and Equipment
Action 15: Report through the Annual Energy Efficiency Report on compliance with the Sustainable Procurement Guideline and the Life Cycle Costing Guideline, using the following KPIs:
• The percentage of contracts that incorporate specific sustainability requirements.
• The percentage of contract awards that have included life cycle costing.
• The percentage of contracts that incorporate sustainability in the tender evaluation.
Reporting
Action 36: Continue to publish an Annual Energy Efficiency Report, reporting on progress against the three objectives of the GBE Strategy:
• Achieving SASP T61 (energy efficiency measured in GJ/m2).
• Reducing greenhouse gas emissions associated with operation of Government buildings (greenhouse intensity measured in kg CO2-e/m2).
• Reducing energy expenditure associated with operation of government buildings. Action 38: Report on findings from sites consuming greater than 160MWh in relation to demand response opportunities, peak demand performance and load factor performance. Action 39: Include in the Annual Energy Efficiency Report actions undertaken to identify and implement energy efficiency and demand management opportunities.

Page 31 of 35
2013
-14
Ann
ual E
nerg
y Ef
ficie
ncy
Rep
ort
Appendix C: Glossary AEER: Annual Energy Efficiency Report. AMD: Agreed Maximum Demand. BCA: Building Code Australia. BMS: Building Management System. Building Management Systems are used in buildings for automatic monitoring and control of services such as lighting, plumbing, fire services, heating and air conditioning systems. The term refers to a system that uses sensors, controls and activators. CBD: Central Business District. GJ: Giga Joules– unit of energy consumption. See Appendix F for other units of energy and conversion factors. GBE Strategy: Government Buildings Energy Strategy. GBE Group: Government Buildings Energy Group. GHG: Greenhouse Gas. HVAC: Heating, Ventilation and Air Conditioning. kVA: Kilovolt Ampere – a unit of apparent power in an electrical circuit. Apparent power is the total power available in the circuit, while the actual power drawn from the circuit and consumed is called working power, measured in kW. kW: Kilowatt – a unit of working power equivalent to an energy consumption rate of 1000 joules per second. kWh: Kilowatt hour –a unit of energy consumption, equivalent to one kilowatt of power expended for one hour. NABERS: National Australian Built Environment Rating System - is a national rating system that measures the environmental performance of Australian buildings, tenancies and homes. It incorporates measures of the energy efficiency, water usage, waste management and indoor environment quality of a building or tenancy and its’ subsequent impact on the environment. NABERS is managed nationally by the NSW Office of Environment and Heritage, on behalf of Commonwealth, state and territory governments. Power Factor: Power Factor is a measure of how effectively electrical power is being used, defined as the ratio of working power (kW) to apparent power (kVA). The higher the Power Factor, the more effectively electrical power is utilised. SASP: South Australia’s Strategic Plan. An updated plan was released by the Premier in 2011. See also T61. SCOPE 1: Scope 1 emissions cover direct emissions, at the point of emission release. Examples include fuel use, energy use, and manufacturing process activity.

Page 32 of 35
2013
-14
Ann
ual E
nerg
y Ef
ficie
ncy
Rep
ort
SCOPE 2: Scope 2 emissions covers indirect emissions from the generation of the electricity purchased and consumed by an organisation. They are physically produced by the burning of fuels such as coal or natural gas at the power station. SCOPE 3: Scope 3 emissions include all other indirect emissions. Factors reported are for:
(i) burning fossil fuels – their indirect emissions attributable to extraction, production and transport, and (ii) consuming purchased electricity – their indirect emissions from extraction, production and transport of fuel burned at generation and the indirect emissions attributable to the electricity lost in the transmission and distribution network.
T61: Target 61 of South Australia’s Strategic Plan (SASP); “Improve the energy efficiency of government buildings by 30 per cent by 2020 (baseline 2000-01). Milestone of 25 per cent by 2014.” Department List The following department list has been used for the purposes of this report:
• Attorney-General’s Department (AGD)
• Court’s Administration Authority (CAA)
• Defence SA
• Department for Correctional Services (DCS)
• Department of Communities and Social Inclusion (DCSI)
• Department for Education and Child Development (DECD)
• Department of Environment, Water and Natural Resources (DEWNR)
• Department of Further Education, Employment, Science and Technology (DFEEST)
• Department for Health and Ageing (DHA)
• Department for Manufacturing, Innovation, Trade, Resources and Energy (DMITRE)
• Department of the Premier and Cabinet (DPC)
• Department of Planning, Transport and Infrastructure (DPTI)
• Department of Primary Industries and Regions SA (PIRSA)
• Department of Treasury and Finance (DTF)
• Environment Protection Authority (EPA)
• South Australian Fire and Emergency Services Commission (SAFECOM)
• South Australia Police (SAPOL)
• TAFE SA The Department of State Development (DSD) was formed on 1 July 2014, merging DFEEST and DMITRE.

Page 33 of 35
2013
-14
Ann
ual E
nerg
y Ef
ficie
ncy
Rep
ort
Appendix D: Calculation of Energy Efficiency An improvement in energy efficiency for a government department is measured by comparing its energy intensity in the current year with that in the baseline year (2000-01). Energy intensity is defined as energy use per ‘business measure’. In past years a range of business measures have been used by departments, including floor area (m2), number of buildings and number of full time equivalent employees. The GBE Strategy required that all future reporting should be based on only one business measure – area (m2). Hence in this report energy intensity is defined as ‘energy use per floor area’ (GJ/m2). Example of calculation of Energy Intensity and Energy Efficiency improvement Department X occupied a building of 4 000 m2 and used 1 500 Giga-Joules (GJ) of energy in the 2013-14 year. As a result, the energy intensity of the building is: Energy efficiency improvement is measured by the change in energy intensity. For example, if the energy intensity of the same building was 500 MJ/m2 in the baseline year, the energy efficiency improvement is:
Change to method: Departmental results no longer weighted by divisions In previous years, where data on energy use in a department’s separate divisions was provided, a weighted method was used to calculate its energy efficiency result. This method weighted the energy efficiency result for each division by its proportion of total departmental energy consumption. This method created two inconsistencies:
• The weighted result for a department providing divisional information differed from its (unweighted) departmental result used to calculate the Whole of Government result.
• Some departments did not report by division, and these departments had only one (unweighted) result, which led to inconsistency in comparing departments.
This year, the GBE Group agreed to use a single unweighted method to calculate the energy efficiency improvement result for both the Whole of Government and each department. Following this change, the results for each department as reported in the 2012-13 AEER have been recalculated using the unweighted method, and are displayed in Table 6.1.
222 375375.000040015
mMJ
mGJ
mGJ
==
25%0.25MJ/m 500
MJ/m 375)(5002
2
==−

Page 34 of 35
2013
-14
Ann
ual E
nerg
y Ef
ficie
ncy
Rep
ort
Appendix E: Calculation of Greenhouse Gas Intensity The Commonwealth Department of the Environment (DoE) publishes National Greenhouse Accounts (NGA) factors annually for both electricity and natural gas and these are used in the greenhouse gas calculations for this report. Greenhouse gas intensity is expressed as kilograms of carbon dioxide-equivalent per floor area (kgCO2-e/m2). The NGA factors for both electricity and natural gas have reduced since 2000-01 due to:
• improvements in calculation methodology
• improvements in extraction and production methods, and distribution networks, resulting in a reduction in Scope 310 greenhouse gas emissions from fugitive emissions and transmission losses
• for electricity, the greening of the SA grid through increased renewable energy sources such as wind power. The National Greenhouse and Energy Reporting Scheme has enabled more accurate tracking of electricity emissions over time and the DoE has published a time series for electricity NGA factors, revised annually, to reflect these improvements. This has meant that electricity emissions can be accurately calculated for both 2000-01 and the reporting year, and a comparison made. However, a similar time series has not been available for natural gas. Hence previous versions of this report have used the most recently published NGA factor to calculate natural gas emissions for both the reporting year and the (2000-01) baseline year. This has meant that any reduction in the natural gas factor due to (real) improvements in gas production and distribution systems has not been captured in the calculation. 11
Given this discrepancy in treatment of emissions factors for the two fuels, the application of the NGA factor for natural gas has been revised. With existing data, it is not possible to distinguish the reduction in the gas factor since 2000-01 due to improved methodology from that due to more efficient production and distribution. In view of this, the natural gas factor published in 2000-01 has been used to estimate emissions in the base line year. This original 2000-01 natural gas factor is not as ‘accurate’ as the 2000-01 factor for electricity which is revised annually. However, it is a better estimate of the baseline value of the factor than the factor published for the current year. Consequently, greenhouse gas emissions for the 2000-01 baseline year are higher than those reported in last year’s AEER. The corrected greenhouse gas totals are tabled in Section 2.2 of this report, while Table F.2 in Appendix F shows the change in emission factors over time.
10 The Glossary in Appendix C includes definitions of Scope 1, 2 and 3 emissions. 11 The 2000-01 NGA factors for natural gas were 51.7 and 22.7 kgCO2-e for Scopes 1 and 3 respectively. The ‘latest estimates’ of the factors, applied to the 2013-14 data in this report, are lower – at 51.3 and 10.4 kgC02-e respectively.

Page 35 of 35
2013
-14
Ann
ual E
nerg
y Ef
ficie
ncy
Rep
ort
Appendix F: Conversion Factors
Table F.1: Energy Conversion Factors
Energy Type Typical Measurement
Abbreviation To convert to GJ, multiply by
Scope 1 Emission Scope 2 Emission Scope 3 Emission
Electricity 12 kiloWatt hour kWh 0.0036 - 169 kg CO2-e per GJ 30 kg CO2-e per GJ
Natural Gas MegaJoule MJ 0.001 51.33 kg CO2-e per GJ - 10.4 kg CO2-e per GJ
LPG kiloLitre kL 25.7 59.72 kg CO2-e per GJ - 5.0 kg CO2-e per GJ
Table F.2: Annual Emission Factors – South Australia
Electricity Natural Gas Financial Year**
Emission Factor Scope 2 kg CO2-e per GJ
Emission Factor Scope 3 kg CO2-e per GJ
Full fuel cycle Emission Factor (EF for scope 2 + EF for scope 3)
Emission Factor Scope 1 kg CO2-e per GJ
Emission Factor Scope 3 kg CO2-e per GJ
Full fuel cycle Emission Factor (EF for scope 1 + EF for scope 3)
1999/2000 257 36 293 51.7 22.7 74.4 2009/10 187 35 222 51.33 10.4 61.6
2010/11 180 32 212 51.33 10.4 61.6
2011/12 177 31 208 51.33 10.4 61.6
Latest Estimate 169 30 199 51.33 10.4 61.6 Source: National Greenhouse Accounts (NGA) Factors, released by the Department of the Environment, July 2014. Australian Greenhouse Office Factors and Methods Workbook December 2002 – provided by email 22 September 2014 to the GBE Secretariat ** The ‘latest estimate’ of the NGA factors is always a financial year behind the reporting year for the AEER – therefore the factors used in this report are those for 2012-13.
12 South Australian Emission Factors incorporate the generation of renewable energy (including GreenPower) across the state and therefore no separate Emission Factor for GreenPower is calculated or published. It should be noted however that entities purchasing GreenPower contribute to the overall state reduction in emissions.