Embed Size (px)
Citation preview
PNM
Energy Efficiency
Program
2013
Annual Report
Public Service Company of New Mexico (PNM)
March 26, 2014
PNM Energy Efficiency Program 2013 Annual Report 2
Table of Contents
Table of Contents ............................................................................................................................ 2 Introduction ..................................................................................................................................... 3 Program Results Summary ............................................................................................................. 5
Program Information ....................................................................................................................... 7 Residential Lighting .................................................................................................................... 7 Refrigerator Recycling ................................................................................................................ 8
ENERGY STAR® Home ............................................................................................................ 8
Community CFL ......................................................................................................................... 8 Easy Savings Kit ......................................................................................................................... 8
Refrigerator Replacement and CFL Installation ......................................................................... 8 Commercial Comprehensive ....................................................................................................... 8
Market Transformation ............................................................................................................... 9 Power Saver and Peak Saver Load Management ....................................................................... 9
Program Benefits and Goals ........................................................................................................... 9
Tariff Collections .......................................................................................................................... 11 Regulatory Proceedings ................................................................................................................ 11
Independent Evaluation ................................................................................................................ 12 Background and Purpose .......................................................................................................... 12 Summary of Findings and PNM Comments ............................................................................. 12
Energy Efficiency Rule Reporting Requirements ......................................................................... 19
C. (1) Independent Measurement and Verification Report ....................................................... 19 C. (2) Program Expenditures Not Included in the M&V Report .............................................. 19 C. (3 & 4) Budgeted Funds Not Spent and Material Variance in Costs ................................... 19
C. (5) Tariff Reconciliation....................................................................................................... 20 C. (6 & 9) Cost Allocation, Expenses by Program and Rate-of-Return ................................... 20
C. (7) Program-Specific Metrics ............................................................................................... 21
C. (8) Non-Energy Benefits ...................................................................................................... 22 C. (10) Self-Direct Programs .................................................................................................... 23
Appendix A – PNM Avoided Costs ............................................................................................. 24 Appendix B – Load Management Events ..................................................................................... 25

PNM Energy Efficiency Program 2013 Annual Report 3
Introduction
PNM submits this annual report on the performance of the PNM Energy Efficiency and Load
Management Program for calendar year 2013 (“2013 Program”). This annual report relies on the
independent evaluator measurement and verification report (“M&V Report”) which is submitted
as a separate document: “Evaluation of 2013 Public Service Company of New Mexico Energy
Efficiency & Demand Response Portfolio”, prepared by ADM Associates, Inc. (“ADM”).
The programs evaluated in this annual report include programs that were approved by the New
Mexico Public Regulation Commission (“NMPRC” or “Commission”) on June 23, 2011 in the
Final Order Partially Adopting Recommended Decision in Case No. 10-00280-UT and on
November 6, 2013 in the Final Order Partially Adopting Recommended Decision in Case No.
12-00317-UT. This report covers all costs incurred in the implementation of the programs and all
customer participation in the programs from January 1, 2013 through December 31, 2013.
The following programs are included in this annual report:
(1) Residential Lighting: Customers receive instant discounts on compact fluorescent
light bulbs (“CFLs”) and Light Emitting Diode bulbs (“LEDs”) purchased at 180
participating retail outlets.
(2) Refrigerator Recycling: Residential and commercial customers receive a rebate for
recycling a qualifying refrigerator or freezer. PNM provides free pick-up and recycles
more than 95 percent of the materials at an Albuquerque recycling center established
specifically for this program.
(3) Community CFL: PNM distributed CFLs at various community events. In addition,
PNM partnered directly with community groups in Silver City and Santa Fe to
distribute CFLs.
(4) ENERGY STAR Home: Homebuilders received incentives for every home they built
to ENERGY STAR standards, which are at least 15 percent more efficient than
standard homes.
(5) Refrigerator Replacement and CFL Installation: Income-qualified customers receive
new ENERGY STAR®
qualified refrigerators and CFLs installed by a contractor.
New Mexico Mortgage Finance Authority (“MFA”) administers this program as part
of their New Mexico Energy $mart program.
(6) Easy Savings Kit: PNM low-income customers receive a kit that contains an
assortment of energy efficient light bulbs of their choice of various wattages, a low-
flow showerhead and other items including educational information on low-cost ways
to save energy. Customers were able to enroll by mail or by returning prepaid cards
distributed at PNM Good Neighbor Fund events.
(7) Commercial Comprehensive: This flagship program for non-residential customers is
comprised of three components. The New Construction component offers incentives

PNM Energy Efficiency Program 2013 Annual Report 4
for completing new construction projects that are more energy efficient than what is
required by New Mexico building code; the Retrofit Rebate component allows
customers to select options from a menu and receive a specific rebate per unit, or they
can propose a system improvement that is not included on the pre-set menu and that
delivers verifiable savings; and the small business or QuickSaver™ component
provides small business customers (less than 100 kW demand) with an attractive,
low-cost option for directly installing energy saving measures.
(8) The Power Saver load management program controls refrigerated air conditioning
units in participating homes and small businesses during periods of peak demand.
PNM typically “dispatches” the Power Saver program during the hottest days of the
year. Power Saver participants are paid an annual incentive per unit that is controlled.
(9) The Peak Saver load management program is designed to help large commercial
customers reduce the amount of energy they require during peak demand periods. As
with the Power Saver program, PNM typically “dispatches” the Peak Saver program
during the hottest days of the year. Peak Saver participants are paid an annual
incentive based on the amount of peak demand managed by the program.
(10) Market Transformation: This program promotes the adoption of energy efficient
products and services, with the goal of inducing lasting behavioral changes in the
marketplace. The program funds educational and community outreach activities and
broad-based energy efficiency promotional efforts.
(11) Self-Direct: This program allows large customers (with energy usage greater than
seven million kWh per year) to receive credits for energy efficiency improvements
made at its facilities. Credits for approved self-direct programs may be used to offset
up to seventy percent of the energy efficiency tariff rider.
New Programs Approved November 2013
The following programs were approved by the Commission on November 6, 2013.
They are included in this report since there was implementation activity conducted in
December of 2013; however, these programs were not yet available for customer
participation at the end of 2013 and so there were no customer participation costs or
savings to include in this report.
(12) Whole House: Home owners and renters receive a home energy assessment
conducted by a trained home assessor, direct installation of CFLs, programmable
thermostat, low-flow showerheads and faucet aerators. Upon completion of a home
assessment, participants would be eligible for rebates of between $75 and $500 for
replacement of older HVAC units, refrigerators, dishwashers, clothes washers, and
advanced evaporative coolers. Participant cost is $40.
(13) Low-Income Home Efficiency: Similar to the Whole House program but for low-
income customers. Participants receive a free home energy assessment, free direct

PNM Energy Efficiency Program 2013 Annual Report 5
installation of CFLs, programmable thermostat, low-flow showerheads and faucet
aerators, and free replacement of their primary refrigerator if the unit qualifies. The
rebate forms provided as part of the Whole House Program will also be provided to
interested participants.
(14) Residential Stay Cool: Customers will have access to mail-in rebates for the
purchase of solid-media, advanced evaporative cooling units, ENERGY STAR
qualified room AC units, high SEER (14 and above) central AC units and ENERGY
STAR variable speed pool pumps.
(15) Student Efficiency Kits: Home efficiency and energy education kits will be
provided to fifth grade teachers to send home with their students. Training and energy
curriculum will also be provided for the teachers. The kits contain CFLs, a low-flow
showerhead and other items.
(16) Home Energy Reports: Multiple reports per year will be sent to targeted residential
customers comparing their energy usage statistics to average usage along with
recommendations and education about energy efficiency opportunities.
Program Results Summary
This is the sixth annual report on the PNM Energy Efficiency Program. Results are based upon
independent measurement and verification. The following is a short summary of the overall
results:
The 2013 Program was cost effective as measured by the Total Resource Cost ratio
(“TRC”). The TRC for the portfolio of programs was 1.911.
The total annual net savings after free rider and other adjustments was 75.6 GWh at the
customer meter or 80.9 GWh at the generator.
The load management programs were successful in recruiting customer participants, with
total capacity under the programs of about 62 MW.
Total program expenses were about $18.1M.
The average cost per kWh of lifetime energy savings from the energy efficiency
programs, not including Load Management, was 1.5¢/kWh.
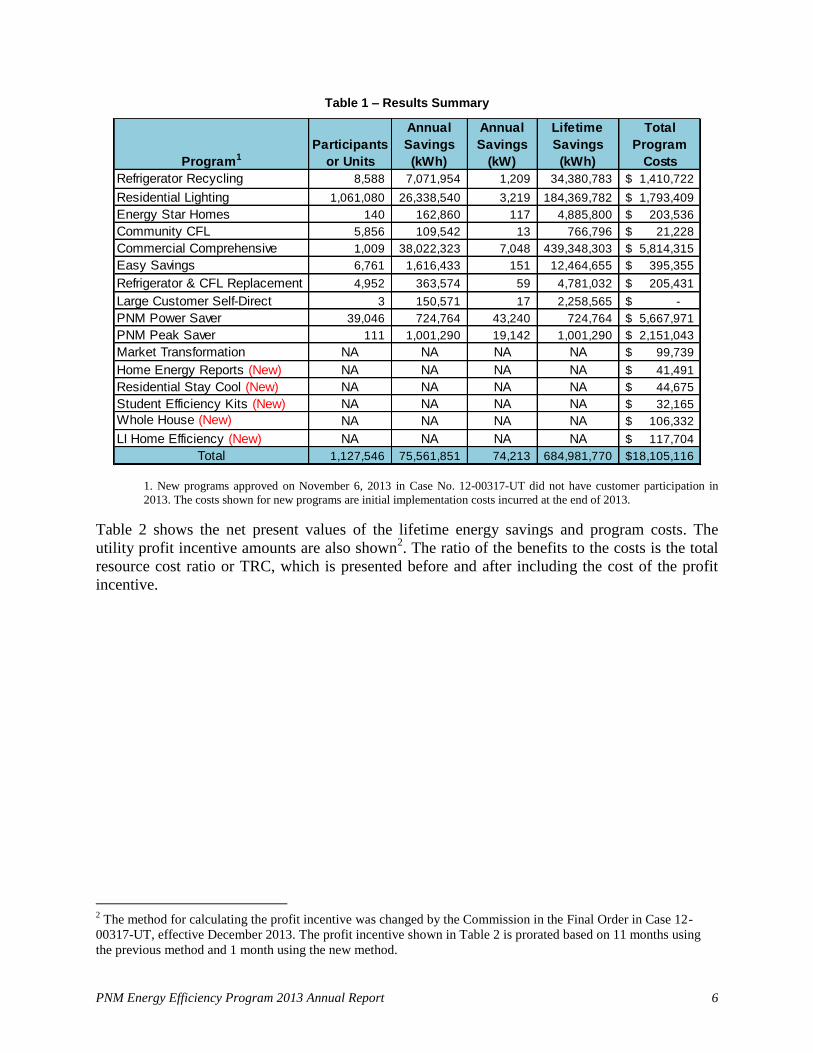
Table 1 shows the total number of customer participants, the annual energy and demand savings,
the lifetime energy savings, and the total costs for each of the programs for calendar year 2013.
An identical table can be found on page A-1 of the M&V Report (not including year-end
expenses for newly approved programs – see note below Table 1).
1 Programs included in the 2013 Annual Report were approved by the Commission based on being cost-effective
using the total resource cost (TRC) test. Amendments to the Efficient Use of Energy Act in 2013 changed the cost-
effectiveness criteria to the utility cost test (UCT). Cost effectiveness of future programs proposed to the
Commission will be based on the UCT.
PNM Energy Efficiency Program 2013 Annual Report 6
Table 1 – Results Summary
1. New programs approved on November 6, 2013 in Case No. 12-00317-UT did not have customer participation in
2013. The costs shown for new programs are initial implementation costs incurred at the end of 2013.
Table 2 shows the net present values of the lifetime energy savings and program costs. The
utility profit incentive amounts are also shown2. The ratio of the benefits to the costs is the total
resource cost ratio or TRC, which is presented before and after including the cost of the profit
incentive.
2 The method for calculating the profit incentive was changed by the Commission in the Final Order in Case 12-
00317-UT, effective December 2013. The profit incentive shown in Table 2 is prorated based on 11 months using
the previous method and 1 month using the new method.
Program1
Participants
or Units
Annual
Savings
(kWh)
Annual
Savings
(kW)
Lifetime
Savings
(kWh)
Total
Program
Costs
Refrigerator Recycling 8,588 7,071,954 1,209 34,380,783 1,410,722$
Residential Lighting 1,061,080 26,338,540 3,219 184,369,782 1,793,409$
Energy Star Homes 140 162,860 117 4,885,800 203,536$
Community CFL 5,856 109,542 13 766,796 21,228$
Commercial Comprehensive 1,009 38,022,323 7,048 439,348,303 5,814,315$
Easy Savings 6,761 1,616,433 151 12,464,655 395,355$
Refrigerator & CFL Replacement 4,952 363,574 59 4,781,032 205,431$
Large Customer Self-Direct 3 150,571 17 2,258,565 -$
PNM Power Saver 39,046 724,764 43,240 724,764 5,667,971$
PNM Peak Saver 111 1,001,290 19,142 1,001,290 2,151,043$
Market Transformation NA NA NA NA 99,739$
Home Energy Reports (New) NA NA NA NA 41,491$
Residential Stay Cool (New) NA NA NA NA 44,675$
Student Efficiency Kits (New) NA NA NA NA 32,165$
Whole House (New) NA NA NA NA 106,332$
LI Home Efficiency (New) NA NA NA NA 117,704$
Total 1,127,546 75,561,851 74,213 684,981,770 18,105,116$

PNM Energy Efficiency Program 2013 Annual Report 7
Table 2 – Program Benefits and Costs
1. New programs approved in Case No. 12-00317-UT did not have customer participation in 2013 and will be
evaluated for cost-effectiveness in 2014.
Program Information
Residential Lighting
In 2013, the Residential Lighting program exceeded its target with over 1,000,000 CFLs sold
through the program. There were a total of 180 participating retail stores in the Residential
Lighting program throughout 2013, comprised of 10 different retail chains that offered the
markdown rebates and 29 coupon stores. Participating retailers included large home
improvement stores, warehouse clubs, discount retailers, drug stores, and independent hardware
stores throughout the PNM service territory. The average incentive was $1.12 per CFL. Standard
CFLs accounted for 89% of sales through the program, and specialty bulbs comprised 11%.
PNM also added LEDs to its Residential Lighting program portfolio in Fall 2013. Discounted
LEDs were offered at two participating retail chains with a total of 11 locations.
Each participating retailer displayed point-of-purchase (“POP”) materials describing the benefits
of CFLs, the different CFL options available and information on the discounts provided by the
program. Retailers that offered the LED discount also displayed POP describing the new rebates
available on that technology, as well as the benefits of LED lighting. Residential Lighting
program field representatives provided participating stores with collateral and point-of-sale
materials, organized retailer training sessions and conducted 48 events throughout the year,
including several school and community events.
Program1
Profit
Incentive
NPV of
Economic
Benefits
NPV of
Program
Costs
NPV of
Program
Costs &
Profit
TRC
(Benefit-
Cost
Ratio)
TRC w/
Profit
Incentive
Refrigerator Recycling 80,812$ 1,281,087$ 1,043,425$ 1,118,113$ 1.23 1.15
Residential Lighting 384,833$ 5,875,533$ 2,488,605$ 2,844,273$ 2.36 2.07
Energy Star Homes 11,302$ 593,538$ 531,672$ 542,117$ 1.12 1.09
Community CFL 1,685$ 23,960$ 19,619$ 21,176$ 1.22 1.13
Commercial Comprehensive 924,520$ 16,849,740$ 7,491,991$ 8,346,446$ 2.25 2.02
Easy Savings 27,508$ 568,672$ 209,177$ 234,600$ 2.72 2.42
Refrigerator & CFL Replacement 10,897$ 165,832$ 143,420$ 153,491$ 1.16 1.08
Large Customer Self-Direct -$ -$ -$ -$
PNM Power Saver 195,866$ 5,020,174$ 3,787,847$ 3,968,869$ 1.33 1.26
PNM Peak Saver 85,775$ 2,271,927$ 1,280,373$ 1,359,647$ 1.77 1.67
Market Transformation 632$ -$ 92,180$ 92,764$
Home Energy Reports (New) 263$ NA NA NA NA NA
Residential Stay Cool (New) 283$ NA NA NA NA NA
Student Efficiency Kits (New) 204$ NA NA NA NA NA
Whole House (New) 673$ NA NA NA NA NA
LI Home Efficiency (New) 745$ NA NA NA NA NA
Total 1,725,996$ 32,650,463$ 17,088,310$ 18,681,496$ 1.91 1.75

PNM Energy Efficiency Program 2013 Annual Report 8
Refrigerator Recycling
JACO Environmental, Inc., the third-party contractor utilized for the Refrigerator Recycling
program, continues to operate a recycling center in Albuquerque. The facility disassembles all of
the refrigerators and freezers collected through the program. The 8,588 refrigerators and freezers
recycled in 2013 prevented the emission of approximately 26,180 metric tons of CO2 and CO2
equivalents into the atmosphere3, in addition to the CO2 reductions due to energy savings.
ENERGY STAR® Home
A total of 140 homes built in PNM service territory earned the ENERGY STAR qualification in
2013. Although fewer new homes were constructed as part of this program than in previous
years, the level of participation achieved was still a notable accomplishment given the fact that
builders had to adapt to the more stringent requirements of ENERGY STAR Version 3.0. The
additional requirements of building a Version 3.0 home caused many builders to cease
constructing ENERGY STAR qualified homes in 2013 and the PNM Energy Star Home program
was discontinued at the end of the year because it was no longer cost-effective.
Community CFL
In 2013 PNM distributed 3,856 CFLs at various events and an additional 2,000 CFLs through its
partnership with local community groups in Silver City and Santa Fe. At each event, PNM or its
partners distributed CFLs and educated customers on the benefits of using CFLs instead of
incandescent bulbs. The program served nearly 1,000 customers in various communities.
Easy Savings Kit
In 2013, a total of 6,761 kits were distributed to low-income PNM customers. Approximately
95.6% of these kits were distributed by mail to customers who enrolled after receiving a direct
mail postcard that was sent to nearly 25,000 PNM customers who had qualified for the Low
Income Home Energy Assistance Program (“LIHEAP”) in the prior year and who had not
received an Easy Savings Kit in the past. In 2013, PNM also began reaching income-qualified
customers through its Good Neighbor Fund events, where low income customers can get
assistance with their electric bills. Although PNM did not market this program through
community agencies in 2013, 78 kits were attributed to this delivery method.
Refrigerator Replacement and CFL Installation
PNM contracted with the New Mexico Mortgage Finance Authority (MFA) to install CFLs and
replace inefficient refrigerators in the homes of income-qualified PNM customers. MFA and its
subcontractors installed CFLs and replaced refrigerators as necessary in the homes of 312 PNM
customers in 2013 as part of this program.
Commercial Comprehensive
PNM contracted with KEMA Services, Inc. to implement the Commercial Comprehensive
energy efficiency program. This program is comprised of three sub-programs, the New
Construction program, the Retrofit Rebates program and QuickSaver, the small-business
program. The New Construction and Retrofit Rebates programs offer pre-set and custom
3 EPA Responsible Appliance Disposal (RAD) Program http://www2.epa.gov/rad/environmental-benefits

PNM Energy Efficiency Program 2013 Annual Report 9
incentives for installing qualifying equipment in new and existing buildings. Eligible equipment
includes energy efficient lighting, HVAC, refrigeration, and motors. In 2013, there were 316
customer projects in the New Construction and Retrofit Rebate programs. The projects
completed at these customers’ facilities resulted in 26,190,742 of net annual kWh saved and over
$2,000,000 in rebates paid.
PNM QuickSaver is a direct install program for small business customers who have an annual
peak electric demand of 100 kW or less. It offers business customers pre-set incentives for
installing qualifying lighting products and refrigeration in existing buildings. In 2013, the
program focused on continuing to train participating contractors for continued and successful
program implementation. More than $1,700,000 in incentives was paid on 693 customer projects,
which resulted in 11,831,581 of net annual kWh saved.
Market Transformation
The goal of the Market Transformation (“MT”) Program is to increase awareness of energy
efficiency to induce behavioral changes that result in the adoption of energy efficient measures.
In 2013, MT activities continued to focus on outreach across the PNM service territory to help
customers better understand how they use energy and how to make better-informed decisions on
the ways they can use energy more efficiently. This outreach took a variety of forms, including
community events, social media outreach through Facebook and Twitter, maintaining the Kill-A-
Watt device program in public libraries and promotional campaigns stressing the benefits of
energy efficiency.
Power Saver and Peak Saver Load Management
Peak Saver and Power Saver are the PNM load management programs. PNM customers with
annual peak demand of 150 kW or greater can participate in Peak Saver and customers with
annual peak demand of less than 150 kW, including residential customers, can participate in
Power Saver. The load management programs were successfully utilized to offset the need for
peaking resources during the summer of 2013. Appendix B shows the times and durations of the
load curtailment events in 2013. PNM dispatched the load management resource 16 times for a
total of 64.5 hours. The peak load curtailment amount was 62 MW as determined by ADM. The
total PNM system peak load for the year occurred at 5:00 PM MDT on June 27, 2013. As can be
seen from Appendix B, the load management programs were dispatched over this time period.
Program Benefits and Goals
The 2013 Program provided numerous benefits to the PNM system, customers, participating
customers, the environment and the New Mexico economy. The PNM Energy Efficiency
Program, now in its seventh year, is a key resource in the 2011 Integrated Resource Plan (“2011
IRP”). The 2011 IRP examined many different portfolio options that could be implemented to
meet expected growth in the demand for electricity from 2011 to 2030. Energy efficiency and
load management programs were consistently found to be lower-cost alternatives when
compared to meeting system needs with traditional supply-side resources. “The most cost-
effective portfolio meets electric system demand, provides acceptable system reliability and

PNM Energy Efficiency Program 2013 Annual Report 10
operational flexibility, meets renewable portfolio standards and other regulatory requirements,
and minimizes financial cost to the customer.”4
The most cost-effective portfolio includes the impacts of the 2013 Program and projected growth
of the programs that will allow PNM to achieve the minimum energy saving goals specified in
the Efficient Use of Energy Act (“Act”). Although the savings projections for each year included
in the 2011 IRP vary from the savings in the 2013 Program, the cumulative result for 2014
included in the 2011 IRP is consistent with what is projected in the annual report on the 2013
Program. Figure 1 shows the annual incremental savings, on the left axis, and annual cumulative
savings achieved through 2013 and projections through 2014 on the right axis.
Figure 1
Note * - 2014 savings are projected.
The Act requires that PNM achieve cumulative savings equivalent to at least 411 GWH by 2014,
based on five percent (5%) of PNM’s retail sales in 2005. PNM believes that if customer
participation meets the projections assumed in 2014, it will be able to achieve or exceed the
minimum savings specified in the Act.
A wide range of customers participated in the 2013 Program. In the Refrigerator Recycling
program, 8,588 inefficient refrigerators and freezers were removed from the market. 1,061,080
CFL bulbs were discounted through the Residential Lighting program and more than 8,000 low-
income customers benefited from the three low-income programs. 1,009 commercial customers,
including over 693 small commercial accounts, participated in the business energy efficiency
4 “Electric Integrated Resource Plan: 2011 – 2030, July 2011, p. 1.
2008 2009 2010 2011 2012 2013 2014 *
Annual Savings 35.2 39.9 58.8 57.6 79.3 75.6 77.3
Cumulative Savings 35 75 134 192 271 346 424
0
50
100
150
200
250
300
350
400
450
0
10
20
30
40
50
60
70
80
90
Cu
mu
lati
ve S
avin
gs (G
WH
)
Ne
t A
nn
ual
En
erg
y Sa
vin
gs (G
WH
)
Energy Efficiency Program Energy Savings
Annual Savings Cumulative Savings
PNM Energy Efficiency Program 2013 Annual Report 11
programs. In addition, over 28,000 residential customers and 4,000 business customers
participated in load management programs. Customers who participated in the programs received
additional benefits through direct incentives that offset the cost of energy efficient improvements
and through lower electric bills. The 2013 Program provided rebates and other incentives valued
at more than $7.8 million directly to customers.
The 2013 Program also had a significant impact on the New Mexico economy. Customer
incentives are designed to pay between 25 percent and 75 percent of the incremental cost of an
efficiency improvement. Using a multiplier factor of three, the economic impact of the customer
incentives would be about $23 million dollars. The 2013 Program also had a significant impact
on local employment. Most of the PNM programs are implemented by third-party contractors
who employ local staff. The 2013 Program directly supported approximately 40 local employees
of these third-parties. In addition, much of the $7.8 million in incentives paid to customers
supported additional employment by local companies that provided the energy efficiency
improvements.
Finally, the energy savings from the 2013 Program will result in a significant reduction in water
consumption and CO2 emissions. Estimated water savings and reductions of CO2 are shown in
Table 7, which can be found on page 23.
Tariff Collections
The costs of implementing the 2013 Program are recovered through the Energy Efficiency Rate
Rider No. 16 (“Rider”) on customers’ bills. The current Rider includes a program cost rate
element that is currently assessed monthly as a percentage (2.591%) of the monthly bill charge
and a profit incentive rate element also assessed monthly as a percentage (0.196%).
During calendar year 2013, PNM collected a total of $17,860,906 of program costs. Actual
program expenses for calendar year 2013 were $18,105,116 and over-collected program costs
from 2012 were $1,010,099. PNM also owes $350,623 in carrying charges on the monthly over-
collection balances. This resulted in a total over-collection of $1,116,512. PNM has submitted
the documentation for a tariff rider adjustment to account for this over-collection, including
Advice Notices and supporting testimony, in a separate filing concurrent with this annual report.
Beginning on August 21, 2011 PNM was authorized to earn a utility profit incentive (“Profit
Incentive’) as approved in NMPRC Case No. 10-00280-UT. The Final Order in Case 12-00317-
UT authorized PNM to earn a revised Profit Incentive. PNM has calculated a revised calendar
year 2013 Profit Incentive amount based on a prorated application of the Profit Incentive
methods approved in the two cases. PNM has submitted the documentation and supporting
testimony for the Profit Incentive reconciliation in a separate filing concurrent with this report.
Regulatory Proceedings
On October 5, 2012 PNM filed a new energy efficiency and load management program plan with
the Commission (Case No. 12-00317-UT). A hearing was held February 11 – 15, 2013 and the
Commission issued a Final Order approving the plan on November 6, 2013. PNM filed an
Advice Notice to modify the Energy Efficiency Rider No. 16 which became effective November
25, 2013.

PNM Energy Efficiency Program 2013 Annual Report 12
On July 23, 2013 PNM filed a motion to modify the 2013 calendar year budgets for certain
programs. The Commission approved the motion in their Order issued on August 7, 2013.5
Independent Evaluation
Background and Purpose
The Energy Efficiency Evaluation Committee appointed by the Commission selected ADM as
the state-wide independent evaluator and this selection was approved by the Commission on
November 8, 2012. The Commission approved the M&V budget and scope of work for a three
year term to conduct annual measurement and verification analysis for the years 2013 – 2015.
ADM conducted independent evaluation of the 2013 Program and its M&V Report is based on
data from January 1, 2013 through December 31, 2013. PNM worked closely with ADM to
provide the data necessary to complete the 2013 M&V Report. This included rebate processing
and participant files, budget data by program and avoided-cost information.
Summary of Findings and PNM Comments
All of the programs evaluated were found to be cost effective and the total portfolio of programs
was found to be cost effective. The results of the M&V analysis will be used to adjust a number
of technical assumptions made by PNM regarding program performance, including the average
savings per unit and the effective useful life of measures. The M&V Report also contains other
findings and recommendations in terms of improving marketing and customer satisfaction of
programs. A summary of some of the more important findings and recommendations, along with
comment from PNM, is provided below.
Evaluation Summary
After evaluating the high impact programs of the PNM DSM portfolio, ADM concluded that:
The programs are mature and established. PNM and third party implementation staff
have largely incorporated evaluation findings into their implementation processes and
savings estimates, providing for effectively-delivered programs with reliable savings
estimates.
Implementation contractors have a firm understanding of the local market
conditions. Third party implementers used by PNM have at this point been engaged for 4
to 5 program years. This length of experience has enabled the implementation contractors
to build an understanding of the local market and momentum in their program
administration. Particular examples of this include the development of long-standing
relationships with New Mexico business customers through the Commercial
Comprehensive program, and the participation of a wide swath of both small and large
retailers in the Residential Lighting program.
5“ Order on Unopposed Motion to Re-open Case and to Modify Program Budgets”, NMPRC August 7, 2013, Case
No. 10-00280-UT.

PNM Energy Efficiency Program 2013 Annual Report 13
Declining incremental costs and the upcoming shift to the UCT will strain the cost-
effectiveness of programs that do not have customer investment. Traditionally cost-
effective programs that do not require customer investment (such as Refrigerator
Recycling) show marginal cost-effectiveness under new guidelines.
Programs that have not been evaluated in recent years were not updated to reflect
new federal codes. Low Income CFL & Refrigerator Replacement as well as Easy
Savings both had low realization due to the Evaluators updating savings to reflect
impacts of the Energy Independence and Security Act (“EISA”) [which had the effect of
lowering the baseline savings assumptions].
Residential Programs
Refrigerator Recycling
ADM Conclusion & Recommendation:
Refrigerator Recycling and Low Income CFL & Refrigerator Replacement will both be
close to failing under the new UCT cost-effectiveness test (with UCT scores of 1.01 and
1.02, respectively). Though Refrigerator Recycling was not evaluated in 2013 (except for
cost-effectiveness testing), on the basis of these findings, the Evaluators recommend
decreasing the program incentive.
PNM Response:
ADM stated that the program will be marginally cost-effective in the future under the UCT. The
cost-effectiveness of the program under the UCT is highly dependent on the avoided costs used
in the calculation. To the extent avoided energy and demand cost values change, PNM will
adjust the rebate amount accordingly. It should also be noted that in 2011, research respondents
expressed a lack of satisfaction with the rebate amount. Low participation rates were also
observed; therefore, PNM increased the rebate amount from $30 to $50 and participation
increased.
Low Income CFL and Refrigerator Program
ADM Conclusions & Recommendations:
The program has very high participant satisfaction. Program participants responded
very positively when asked to rate their satisfaction with the overall process, and found
that the installers were courteous and careful with their homes. Further, most respondents
were very satisfied with the observed savings on their bill.
The program model is constrained and not fully-scalable. In relying upon MFA’s
weatherization outreach, this program model does not reach as many homes as needed to
obtain economies of scale. Outreach to specifically perform CFL and refrigerator
replacement is not cost-effective, and as such the installation of these measures is
dependent upon the participants needing weatherization services. PNM cannot derive

PNM Energy Efficiency Program 2013 Annual Report 14
savings from these projects as most of their low income customers use evaporative
cooling.
Program staff have not updated their savings calculations. The Evaluators found that
staff performing the savings calculations for this program were using prior evaluation
numbers as the basis for savings. Ordinarily, this is a justifiable approach. However, in
2013 this was found to overestimate savings due to the impact of EISA on CFL baselines
as well as the overall savings from refrigerators (for which the unit-specific metered
savings in 2013 were lower than in past years).
CFL saturation is increasing among low income customers. Staff at MFA reported
that they are finding fewer opportunities for installation of CFLs than in past program
years due to increased uptake of CFLs.
Report Low Income CFL & Refrigerator Replacement homes to Ecova in 2014.
This serves two purposes. (1), Ecova can be kept apprised of areas where outreach for
their new Low Income Home Efficiency Program should be limited and (2), if Ecova
finds it justifiable, they can follow up with Low Income CFL & Refrigerator Homes for
additional measures. (Ecova is PNM’s third-party contractor responsible for
implementing the new Whole House and Low Income Home Efficiency programs.)
Modify deemed savings based upon 2013 evaluation results. The findings from the
2013 evaluation better-reflect current market conditions than the last evaluation of this
program (which was conducted in 2010).
Guide implementers to install a higher lumen output for elderly customers.
Complaints about the quality of CFL lighting were entirely attributable to elderly
customers finding the lighting level to be too dim. Installers should be cognizant of this
segment’s lighting needs and install higher-wattage CFLs than typical to account for this
(such as using a 15W when they would normally use a 13W CFL). This would assist in
measure retention and acceptance.
PNM Response:
PNM will update the deemed savings assumptions for this program. PNM will work with
ECOVA to develop the appropriate strategy when working with past and potential participants in
the MFA program. PNM will emphasize the importance of lumen maintenance with MFA when
performing lighting retrofits for elderly customers.
Low Income Easy Savings Program
ADM Conclusions & Recommendations:
Many customers are still waiting to replace burnt out incandescent bulbs. 51.5% of
survey respondents indicated that they have not installed all six CFLs. Of these, 35.5%
are waiting for their incandescent light bulbs to burn out before replacement. These

PNM Energy Efficiency Program 2013 Annual Report 15
customers represent delayed savings potential, and the lack of quick installation of CFLs
purchased may lead to lower overall installation.
There is some available market for a second showerhead. Fifty-five percent of
respondents indicated having more than one shower in their residence. Of those 55.0%,
56.9% stated that they “definitely would have installed” an additional showerhead and
25.0% stated that they “probably would have installed” an additional showerhead if it
was included in the kit.
Some participants would be responsive to additional CFLs. Of the 69% of survey
respondents that installed all six CFLs received, 89% stated that they “definitely would
have installed” two additional CFLs if they were included with the kit.
Have marketing materials emphasize the cost of waiting. It was observed that a fair
amount of participants waiting until incandescent bulbs burnt out before installing.
Marketing materials should target this issue, with messages on the cost of waiting to
show the need for active replacement of incandescent bulbs.
Consider a second showerhead for the kit. Based on the survey findings, the
evaluators concluded that a second showerhead could be a cost-effective addition to the
kit.
Review the Quality Assurance/Quality Control processes. Two percent of respondents
indicated not receiving a showerhead. PNM and RAP (third-party implementer for the
Easy Savings Kit program) should review the QA/QC procedures in place at the point of
kit assembly in order to determine if there is an assembly issue or if participants are
losing delivered equipment.
PNM Response:
The kit does contain language about the cost of waiting to replace the incandescent lamps;
however, PNM will explore improved messaging options. PNM will work with the implementer
to discuss custom options. PNM will request documentation from the implementer for their
QA/QC policy.
PNM Power Saver Demand Response Program
ADM Conclusions:
Most of the Medium Commercial Component comprises multifamily housing
complexes. These units are paid at the commercial rate, though the return per-ton is more
in line with the residential population.
The program is used to a much greater extent than in past program years. In 2013,
there were 16 events called over the summer cooling season, including 13 events in June.

PNM Energy Efficiency Program 2013 Annual Report 16
ADM noted that both Power Saver and Peak Saver were cost-effective under the
TRC. However, ADM observed that to the extent that future programs are
evaluated on the UCT, the Power Saver program may fail UCT.
ADM Recommendations:
Adjust geographic labeling conventions. The program has both a “South” and a
“Southern New Mexico” designation. This is an aftereffect of the program’s gradual
expansion to the southern end of PNM’s service territory. It is recommended that the
“South” region be aggregated with the “Central” region in order to simplify the
population stratification. This could reduce the needed sample size for precision
requirements. The cities included in “South” are Belen, Los Lunas and Tijeras, which do
not have markedly different weather than Albuquerque.
Pay large multifamily housing complexes at the residential rebate rate. These units
are receiving a larger incentive due to the current program structure, though they do not
provide a higher return than standard residential facilities.
Consider adding a secondary rebate payment in years with a large number of
events. The Power Saver Program has run a much larger number of events since
inception. In 2009, only one event was run. This has gradually increased to a total of 16
in 2013. In order to maintain customer satisfaction and an appropriate compensation level
for the amount of curtailment asked of customers, PNM should consider an incentive
structure that provides more compensation when the program hits a specified number of
events.
PNM Response:
PNM and Comverge, the third-party implementer, agree that the consolidation of the “South”
region into “Central” will simplify sample design and evaluation without compromising
accuracy. PNM is in discussions with Comverge to include multi-family units that are “behind” a
single master-meter into the residential segment. PNM does not think that an added incentive is
required at this time. Despite the increase in events, the event hours are approximately 60% of
the allowed time of interruption. PNM believes that events happening on subsequent days results
in more satisfaction issues, than the number of overall events. Moreover, program cost
effectiveness would be adversely affected if the cost of incentives increased.
ADM found that both load management programs passed the TRC cost-effectiveness test.
However, they also reported that the Power Saver program would not pass the UCT. ADM made
the UCT calculation based only on one year’s costs and performance. The demand response
programs were approved and contracted based on a 10-year life and PNM believes the program
will pass both the TRC and the UCT when examined over the remaining life of the program
Commercial Programs
ADM Conclusions & Recommendations:

PNM Energy Efficiency Program 2013 Annual Report 17
The Commercial Comprehensive Program has very high participant satisfaction.
Program participants responded very positively when asked to rate their satisfaction with
various components of the program. Satisfaction was high for all metrics, including
incentive amounts, service provided by PNM staff, KEMA (the third-party
implementation contractor) staff, and Trade Allies, ease of application processes, and
performance of equipment installed.
The Commercial Comprehensive Program is showing a slow increase in non-
lighting participation. The Commercial Comprehensive Program has shown gradual
increases in non-lighting participation. This year was particularly anomalous in having
one large HVAC project account for nearly 40% of non-lighting Retrofit Rebates savings,
but even with that factored out, the program is showing increased uptake of non-lighting
measures. This will have to be accelerated, however, as the available opportunities for
savings from lighting retrofits will decline with the imposition of new standards for linear
and compact fluorescent lighting.
New Construction and Retro-commissioning Projects will benefit from cross-fuel
coordination. New Mexico Gas Company has a Commercial Solutions program
currently implemented by CLEAResult Consulting. In 2013, a first test of cross-fuel
coordination was completed in the joint-implementation and incentivizing of a retro-
commissioning project. This allowed for higher incentives, reduced implementation
costs, and the pursuit of more savings opportunities for this project. This is an avenue that
should be pursued and expanded upon in coming program years.
Uptake of envelope improvements, food service, and plug load measures has been
limited. These are avenues for deeper savings at several facility types that thus far have
seen little to no uptake. [These measures are available in the program but have relatively
low participation.]
New Construction displays lower participant satisfaction. The Evaluator noted several
interviews where New Construction participants felt dissatisfied with their experience
with the program. The pool of possible survey respondents is very limited due to the low
participation level of the New Construction component, but the rate of dissatisfaction
among these participants was notable. Many indicated a lack of awareness of options for
assistance with their program participation, as these participants may not have had the
chance to interact with an account manager or other PNM staff. Further, many of the
general contractors involved with new construction projects are not PNM Trade Allies
and are ill-informed of the program offerings and requirements.
Coordinate with El Paso Electric to establish a relationship with their PC Power
Management trade ally. PNM has not had success with this measure, whereas EPE has
had a fair amount of interest and uptake as a result of the efforts of a newly-established

PNM Energy Efficiency Program 2013 Annual Report 18
trade ally. PNM could attempt to reach out to this trade ally to see if they could be active
in northern New Mexico.
Develop an upstream component for desktop PCs and servers modeled after the
Southwest Public Service Business Computing program. Elsewhere in New Mexico,
the SPS upstream incentives for desktops in business applications have provided
significant savings, and the Evaluators believe this to be a duplicable model for PNM.
Assess whether compressed air improvements can be introduced into QuickSaver.
Automotive repair facilities accounted for 11.7% of 2013 QuickSaver participation, and
automotive repair survey respondents indicated that their compressed air systems were
their highest energy load. Many of these facilities are owner-operated and would not have
comprehensive system optimization as a standard business practice. Further savings
could be had through low-cost measures such as leak assessment and repair or system
pressure adjustment.
Target marketing to sectors with low diversity of participation. There are several
sectors with end-uses that are not being engaged through the program. The most notable
of these include restaurants, K-12 schools, and government facilities. These three facility
types have over 95% of their savings in 2013 from lighting, despite a wider range of
equipment classes to pursue. Governments and K-12 school districts may require
partnership and buy-in from higher level decision-makers, however, as the decision for
funding the improvements may not come at the facility-level. The restaurant sector has a
wide range of savings opportunities outside of lighting with the large loads from food
service and refrigeration equipment. These should be pursued where possible, as this is a
large and seemingly relative untapped area for potential savings.
PNM Response
PNM will work with KEMA to develop more means to promote products (such as PC’s as
mentioned above) via upstream channels. In certain regions nationally, KEMA is utilizing an
upstream approach to promote other energy efficient equipment; however, there have been many
challenges to overcome as the commercial market is more complicated than the residential
market. Specifically, with distributors that have national accounts – the billing systems are
centralized; therefore, creating a localized invoicing system applying specific utility incentives is
the most significant challenge.
PNM will contact El Paso Electric to discuss their PC power management program.
ADM mentioned that the foodservice sector has more saving potential than only lighting savings.
PNM agrees and KEMA has therefore been exploring a mid-stream approach to target
distributors of foodservice equipment.
PNM will explore the cost effectiveness of incorporating an air compression component into
QuickSaver.

PNM Energy Efficiency Program 2013 Annual Report 19
The incentive has been increased for certain plug load measures to increase participation.
PNM has developed a brochure for use with the Commercial Comprehensive program that
provides customers with information on PNM and NMGC programs. PNM has also had
preliminary discussions with NMGC to discuss options for the sharing of energy savings. This
could increase the cost-effectiveness of programs that result in gas and electric savings.
PNM’s New Construction program is focused on the design phase of the project, working with
the building owner and the engineering and design firm. Therefore, our outreach is not focused
on the general contractor. However, ADM’s input is duly noted, and PNM will follow-up with
KEMA to discuss a means of education outreach to the contractors performing the work.
Energy Efficiency Rule Reporting Requirements
This section of the annual report follows the reporting requirements and section headings as
specified in the NMPRC Energy Efficiency Rule Section 17.7.2.13.C(1 – 10)6.
C. (1) Independent Measurement and Verification Report
PNM contracted with ADM to conduct the independent evaluation of its energy efficiency
programs. The M&V Report is submitted as a separate document along with this annual report.
C. (2) Program Expenditures Not Included in the M&V Report
The expenditures for the Program in 2013 were $18,105,116. These expenditures include all
expenses incurred by PNM to develop and implement the individual programs. The same total
expenditure data was provided to ADM to be included in the M&V Report.
C. (3 & 4) Budgeted Funds Not Spent and Material Variance in Costs
The Commission originally approved program budgets in its order issued on June 23, 2011 in
Case No. 10-00280-UT. The latest budget modifications for programs approved in Case No. 10-
00280-UT were approved in the Commission order issued on August 7, 2013. New program
budgets were approved by the Commission in Case No. 12-00317-UT in its order issued on
November 6, 2013 and became effective in December 2013. The total approved budget for
calendar year 2013, reflecting all modifications and prorated to reflect one month under the new
budgets, was $16,834,051. Total expenses for the year were $18,105,116; therefore, total
spending was about eight percent (8%) above the approved budget. Table 3 shows the budgeted
amounts, the actual expenditures, and the percent variance.
6 PNM recognizes that there is disagreement regarding what version of the Energy Efficiency Rule is legally in
effect, if any. In developing this 2013 annual report, PNM has relied on the guidelines contained in the 2007 version
of the Rule, adapted to reflect variances from that version of the Rule as provided in the Final Order Granting
Blanket Variances in NMPRC Case No. 11-00439-UT (Nov. 22, 2011). PNM refers to that version as the Energy
Efficiency Rule.

PNM Energy Efficiency Program 2013 Annual Report 20
Table 3 – Budget and Actual Costs
The variations in actual costs from the budgeted costs are primarily due to customer participation
being higher or lower than projected. New programs did not have participation in 2013 since
they were only in effect for one month and the costs reflect the start-up activities. The budget
amounts for new programs in 2013 were based on one twelfth (1/12) of the annual approved
budgets and the variance in costs were due to implementation activities being higher or lower for
some programs.
C. (5) Tariff Reconciliation
(Please see Tariff Collections section on page 11)
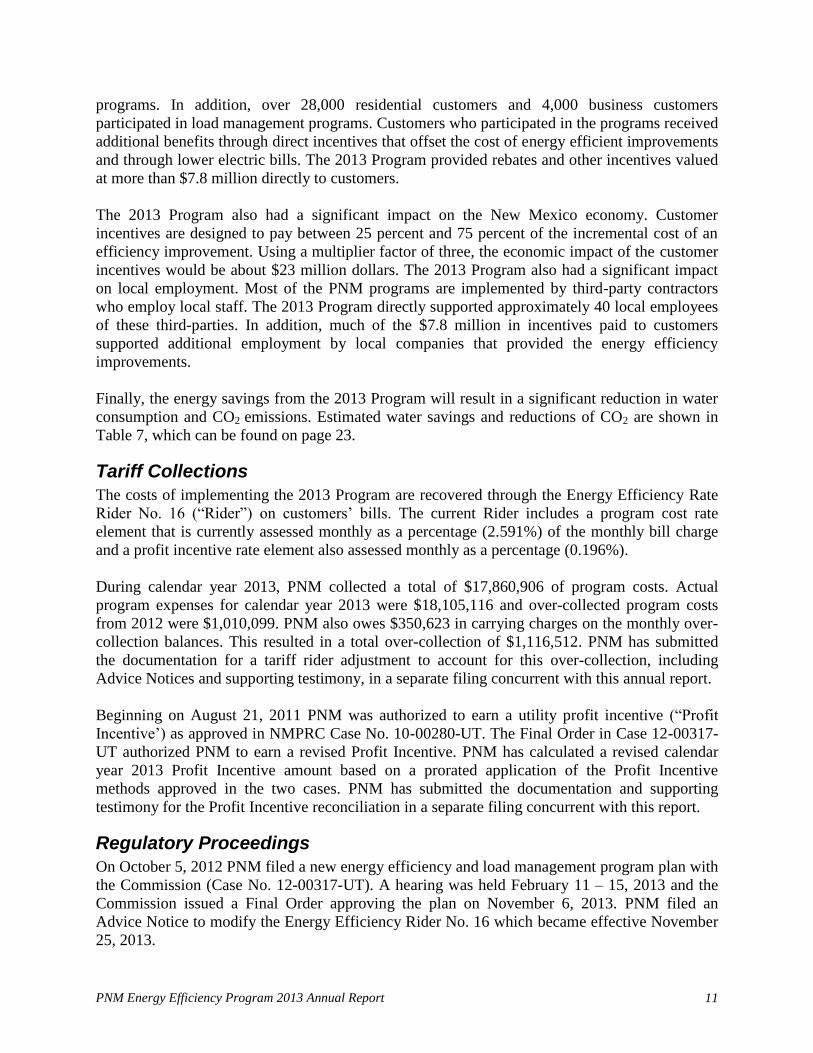
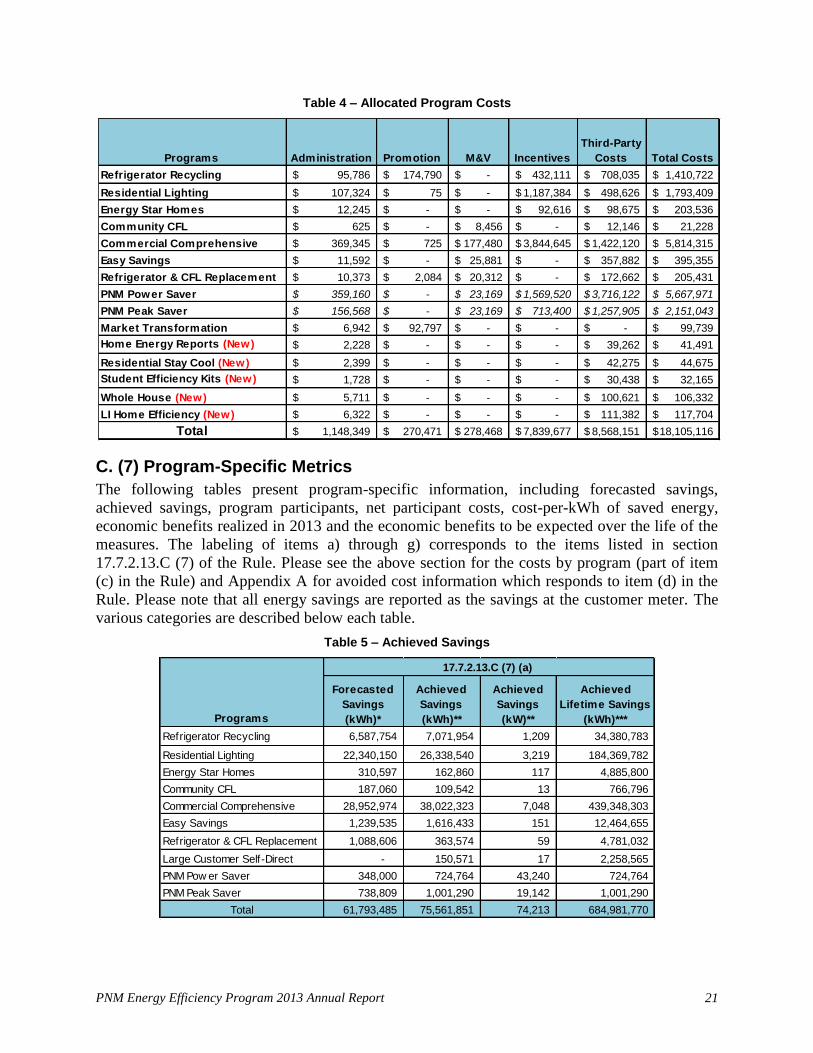
C. (6 & 9) Cost Allocation, Expenses by Program and Rate-of-Return
All 2013 Program expenses including labor, materials, third-party expenses and all other costs
are tracked through a unique set of account numbers. Likewise, all revenue collected through the
tariff rider is booked to a special regulatory asset account which is balanced against the expenses.
These costs and revenues are kept separate from PNM rate-base accounting; therefore, there is
no cross-subsidization and no impact on the PNM allowed rate-of-return. Costs specific to an
individual program, such as incentives and targeted promotion, are allocated directly to that
program. Shared costs, such as administration, are allocated to each program in proportion to
their direct costs. Table 4 shows the allocation of costs to the various programs for calendar year
2013.
Programs
Approved
2013 Budget
2013 Actual
Costs
Variance
%
Refrigerator Recycling 1,239,215$ 1,410,722$ 14%
Residential Lighting 1,682,164$ 1,793,409$ 7%
Energy Star Homes 191,938$ 203,536$ 6%
Community CFL 21,094$ 21,228$ 1%
Commercial Comprehensive 4,917,047$ 5,814,315$ 18%
Easy Savings 317,361$ 395,355$ 25%
Refrigerator & CFL Replacement 171,899$ 205,431$ 20%
PNM Power Saver 5,050,583$ 5,667,971$ 12%
PNM Peak Saver 2,818,148$ 2,151,043$ -24%
Market Transformation 113,247$ 99,739$ -12%
Home Energy Reports (New) 42,336$ 41,491$ -2%
Residential Stay Cool (New) 58,075$ 44,675$ -23%
Student Efficiency Kits (New) 26,256$ 32,165$ 23%
Whole House (New) 87,703$ 106,332$ 21%
LI Home Efficiency (New) 96,986$ 117,704$ 21%
Total 16,834,051$ 18,105,116$ 8%
PNM Energy Efficiency Program 2013 Annual Report 21
Table 4 – Allocated Program Costs
C. (7) Program-Specific Metrics
The following tables present program-specific information, including forecasted savings,
achieved savings, program participants, net participant costs, cost-per-kWh of saved energy,
economic benefits realized in 2013 and the economic benefits to be expected over the life of the
measures. The labeling of items a) through g) corresponds to the items listed in section
17.7.2.13.C (7) of the Rule. Please see the above section for the costs by program (part of item
(c) in the Rule) and Appendix A for avoided cost information which responds to item (d) in the
Rule. Please note that all energy savings are reported as the savings at the customer meter. The
various categories are described below each table.
Table 5 – Achieved Savings
Programs Administration Promotion M&V Incentives
Third-Party
Costs Total Costs
Refrigerator Recycling 95,786$ 174,790$ -$ 432,111$ 708,035$ 1,410,722$
Residential Lighting 107,324$ 75$ -$ 1,187,384$ 498,626$ 1,793,409$
Energy Star Homes 12,245$ -$ -$ 92,616$ 98,675$ 203,536$
Community CFL 625$ -$ 8,456$ -$ 12,146$ 21,228$
Commercial Comprehensive 369,345$ 725$ 177,480$ 3,844,645$ 1,422,120$ 5,814,315$
Easy Savings 11,592$ -$ 25,881$ -$ 357,882$ 395,355$
Refrigerator & CFL Replacement 10,373$ 2,084$ 20,312$ -$ 172,662$ 205,431$
PNM Power Saver 359,160$ -$ 23,169$ 1,569,520$ 3,716,122$ 5,667,971$
PNM Peak Saver 156,568$ -$ 23,169$ 713,400$ 1,257,905$ 2,151,043$
Market Transformation 6,942$ 92,797$ -$ -$ -$ 99,739$
Home Energy Reports (New) 2,228$ -$ -$ -$ 39,262$ 41,491$
Residential Stay Cool (New) 2,399$ -$ -$ -$ 42,275$ 44,675$
Student Efficiency Kits (New) 1,728$ -$ -$ -$ 30,438$ 32,165$
Whole House (New) 5,711$ -$ -$ -$ 100,621$ 106,332$
LI Home Efficiency (New) 6,322$ -$ -$ -$ 111,382$ 117,704$
Total 1,148,349$ 270,471$ 278,468$ 7,839,677$ 8,568,151$ 18,105,116$
Forecasted
Savings
(kWh)*
Achieved
Savings
(kWh)**
Achieved
Savings
(kW)**
Achieved
Lifetime Savings
(kWh)***
Refrigerator Recycling 6,587,754 7,071,954 1,209 34,380,783
Residential Lighting 22,340,150 26,338,540 3,219 184,369,782
Energy Star Homes 310,597 162,860 117 4,885,800
Community CFL 187,060 109,542 13 766,796
Commercial Comprehensive 28,952,974 38,022,323 7,048 439,348,303
Easy Savings 1,239,535 1,616,433 151 12,464,655
Refrigerator & CFL Replacement 1,088,606 363,574 59 4,781,032
Large Customer Self-Direct - 150,571 17 2,258,565
PNM Pow er Saver 348,000 724,764 43,240 724,764
PNM Peak Saver 738,809 1,001,290 19,142 1,001,290
Total 61,793,485 75,561,851 74,213 684,981,770
Programs
17.7.2.13.C (7) (a)

PNM Energy Efficiency Program 2013 Annual Report 22
(a) * Forecasted kWh savings are based on the target participation levels for program
year 2013 as contained in the program plan approved in NMPRC Case No. 10-
00280-UT, adjusted to reflect the most recent M&V values for unit savings.
** Achieved kWh and kW savings were determined by applying the validated net
savings per participant for each program, adjusted for the free-rider rate, times the
number of participants. Unit savings rates were adjusted based on the results
contained in the 2013 M&V Report.
*** Achieved lifetime savings are annual savings times the effective useful life of
the measure as determined in the 2013 M&V Report.
Table 6 – Program Participation and Economic Benefits
(b) Program participants are those who participated in calendar year 2013. For some
programs this value is estimated based on the number of units. Program units are the
number of measures installed or purchased.
(c) Participant costs are the participants’ costs to purchase and install the measures, less
the rebates customers received.
(d) Avoided costs are shown in Appendix A.
(e) The cost-per-kWh saved is determined by dividing the program cost by the lifetime
energy saved.
(f) The 2013 economic benefit for each program was determined by multiplying the
2013 avoided costs times the annual energy and demand savings.
(g) The net-present-value of the total economic benefits was determined by taking the
discounted value of the annual avoided costs times the annual savings over the
effective useful life of each program measure.
C. (8) Non-Energy Benefits
Table 7 shows the estimated CO2 emission reductions and water savings associated with the
PNM portfolio of programs. The annual avoided CO2 emissions for the 2013 Program were
determined through system modeling and the resulting rate of savings was multiplied by the
lifetime energy saving of the portfolio of programs. The water savings are determined by
Program
Participants
Program
Units
(c)
Participant
Costs
(e)
Cost per
kWh
Saved
(f)
2013
Economic
Benefits
(g)
NPV of Total
Economic
Benefits
Refrigerator Recycling 8,588 8,588 -$ 0.04$ 271,473$ 1,281,087$
Residential Lighting 132,635 1,061,080 1.13$ 0.01$ 890,646$ 5,875,533$
Energy Star Homes 140 140 3,310$ 0.04$ 26,936$ 593,538$
Community CFL 1,464 5,856 -$ 0.03$ 3,636$ 23,960$
Commercial Comprehensive 1,009 1,009 8,224$ 0.01$ 1,543,262$ 16,849,740$
Easy Savings 6,761 6,761 -$ 0.03$ 79,815$ 568,672$
Refrigerator & CFL Replacement 312 4,952 -$ 0.04$ 13,678$ 165,832$
Large Customer Self-Direct 3 3 -$ -$ -$ -$
PNM Pow er Saver 31,830 39,046 -$ NA 5,020,174$ 5,020,174$
PNM Peak Saver 111 111 -$ NA 2,271,927$ 2,271,927$
Total 182,853 1,127,546 11,535$ 10,121,545$ 32,650,463$
Programs
17.7.2.13.C (7) (b) 17.7.2.13.C (7)(c - g)

PNM Energy Efficiency Program 2013 Annual Report 23
multiplying the PNM average jurisdictional water consumption by the annual and lifetime energy
savings.
Table 7- Environmental Impacts
C. (10) Self-Direct Programs
PNM received and approved three applications for Self-Direct programs in 2013. PNM reviewed
the applications, communicated the approvals to the customers and notified the Commission. All
projects met the simple payback criteria of between one and seven years. Total annual energy
savings for the four projects were 150,571 kWh, and the average effective useful life was 15
years.
Emission
Impact
Avoided Electric
Emissions Rate
(Metric Tons/GWh)
Annual Avoided
Emissions
(Metric tons)
Lifetime Avoided
Emissions
(Metric tons)
CO2 Reduced 500.6 37,826 342,902
Water Impact
Water
Consumption
(gal/MWH)
Annual Water
Saved (gal)
Lifetime Water
Saved (gal)
Water Saved 354 26,748,895 242,483,547

PNM Energy Efficiency Program 2013 Annual Report 24
Appendix A – PNM Avoided Costs
The following table provides the avoided energy and demand costs for calendar year 2013. These
costs were used in the PNM TRC model and by ADM in its program evaluation. The costs are
the same as those submitted in Case No. 12-00317-UT, which was the most recently approved
energy efficiency case at the time the annual report was submitted.
Residential
Energy
Non-
Residential
Energy
Capacity
Units: $/kWh $/kWh $/kW-yr
2013 0.0209$ 0.0217$ $93.71
2014 0.0228$ 0.0238$ $93.71
2015 0.0244$ 0.0257$ $93.71
2016 0.0253$ 0.0267$ $93.71
2017 0.0265$ 0.0279$ $93.71
2018 0.0290$ 0.0302$ $93.71
2019 0.0366$ 0.0375$ $93.71
2020 0.0376$ 0.0385$ $93.71
2021 0.0387$ 0.0396$ $93.71
2022 0.0397$ 0.0407$ $93.71
2023 0.0408$ 0.0419$ $93.71
2024 0.0420$ 0.0431$ $93.71
2025 0.0432$ 0.0444$ $93.71
2026 0.0444$ 0.0457$ $93.71
2027 0.0456$ 0.0470$ $93.71
2028 0.0468$ 0.0483$ $93.71
2029 0.0481$ 0.0497$ $93.71
2030 0.0495$ 0.0511$ $93.71
2031 0.0509$ 0.0526$ $93.71

PNM Energy Efficiency Program 2013 Annual Report 25
Appendix B – Load Management Events
The following table lists the times and durations of the load management events in 2013.
Event Date
Event Start
Time (MDT)
Event End
Time (MDT)
Duration
(Hrs)
6/10/2013 2:00 PM 6:00 PM 4.0
6/11/2013 2:00 PM 6:00 PM 4.0
6/12/2013 2:00 PM 6:00 PM 4.0
6/13/2013 2:00 PM 6:00 PM 4.0
6/18/2013 2:00 PM 6:00 PM 4.0
6/19/2013 2:00 PM 6:00 PM 4.0
6/20/2013 2:00 PM 6:00 PM 4.0
6/21/2013 2:00 PM 6:00 PM 4.0
6/24/2013 2:00 PM 6:00 PM 4.0
6/25/2013 2:00 PM 4:30 PM 2.5
6/26/2013 2:00 PM 6:00 PM 4.0
6/27/2013 2:00 PM 6:00 PM 4.0
6/28/2013 2:00 PM 6:00 PM 4.0
7/9/2013 2:00 PM 6:00 PM 4.0
7/31/2013 2:00 PM 6:00 PM 4.0
8/26/2013 2:00 PM 8:00 PM 6.0
Total = 16 Events and 64.5 Event Hours