Embed Size (px)
Citation preview

1
STATE OF RHODE ISLAND PUBLIC UTILITIES COMMISSION
_________________________________________
|
In Re: The Narragansett Electric Company |
d/b/a National Grid | Docket No. XXXX
Annual Energy Efficiency Plan for 2022 |
_________________________________________ |
ANNUAL ENERGY EFFICIENCY PLAN FOR 2022
October 1, 2021

2
Contents
Introduction ......................................................................................................................................7
1 Introduction ...............................................................................................................................7
1.1 Cost-Effective Savings ................................................................................................................... 9
1.2 Benefits of Investment in Energy Efficiency ............................................................................... 11
1.3 The Planning Process and Major Changes .................................................................................. 13
1.4 How to Read This Plan ................................................................................................................ 14
Strategies and Approaches to Planning ............................................................................................. 15
2 Programs and Priorities ............................................................................................................ 15
2.1 Strategic Overview of Programs and Priorities ........................................................................... 15
2.1.1 Principles of Program Design .............................................................................................. 16
2.2 Residential Programs .................................................................................................................. 22
2.3 Income Eligible Programs ............................................................................................................ 27
2.4 Commercial and Industrial Programs ......................................................................................... 29
2.5 Cross-Cutting Programs .............................................................................................................. 37
2.5.1 Equity .................................................................................................................................. 37
2.5.2 Community-Based Initiative ................................................................................................ 45
2.5.3 Codes and Standards Support ............................................................................................. 46
2.5.4 Workforce Development .................................................................................................... 47
2.6 Participation ................................................................................................................................ 50
3 Pilots, Demonstrations, and Assessments .................................................................................. 52
4 Evaluation Measurement and Verification Plan ......................................................................... 54
5 Coordination with Other Energy Policies and Programs ............................................................. 55
5.1 System Reliability Procurement .................................................................................................. 55
5.2 Advanced Metering Functionality (AMF), Grid Modernization (Grid Mod), Rate Cases,
Renewables ............................................................................................................................................. 55
5.3 Act on Climate ............................................................................................................................. 56
5.3.1 Electrification, Heat Pumps, and Delivered Fuel Policy and Objectives ............................. 56
5.4 Codes and Standards Program and Accounting for New Codes and Standards ......................... 57
6 Multi-Year Strategies ................................................................................................................ 57

3
6.1 Combined Heat and Power ......................................................................................................... 57
Consistency with Standards .............................................................................................................. 58
7 Least Cost Procurement Law and Standards .............................................................................. 58
7.1 Prudency ..................................................................................................................................... 58
7.1.1 General Considerations of Prudency .................................................................................. 59
7.1.2 Equity .................................................................................................................................. 59
7.1.3 Parity Among Sectors .......................................................................................................... 60
7.1.4 Rate and Bill Impacts ........................................................................................................... 62
7.2 Reliability ..................................................................................................................................... 64
7.3 Environmentally Responsible ...................................................................................................... 65
7.3.1 Emissions Reductions .......................................................................................................... 66
7.3.2 Support for an Environmentally Responsible Local Jobs Infrastructure ............................. 66
7.3.3 Raised Customer Awareness of Environmental Issues and the Impacts of their Choices .. 66
7.4 Cost Effectiveness ....................................................................................................................... 67
7.5 Cost of Annual Plan Compared to the Cost of Energy Supply..................................................... 70
Funding Plan, Budget and Goals ....................................................................................................... 72
8 Savings Goals ............................................................................................................................ 72
8.1 Electric Portfolio Savings Goals ................................................................................................... 72
8.2 Natural Gas Portfolio Savings Goals ............................................................................................ 73
9 Annual Plan Compared to the Three-Year Plan .......................................................................... 73
10 Funding Plan and Budgets ......................................................................................................... 75
10.1 ISO-NE Capacity Market Revenue ............................................................................................... 78
10.2 Exceptions to the Natural Gas Energy Efficiency Program Charge ............................................. 79
10.3 Budgets ....................................................................................................................................... 79
10.4 Transferring Funds ...................................................................................................................... 80
10.5 Budget Management .................................................................................................................. 81
10.6 Notification of Large Customer Incentives ................................................................................. 82
11 Performance Incentive Plan ...................................................................................................... 82
12 Future Performance Metrics ..................................................................................................... 85
12.1 Testing Performance Metrics ...................................................................................................... 85

4
12.1.1 Carbon and Carbon Dioxide Equivalent (CO2e) Reductions ............................................... 86
12.1.2 Peak Hour Gas Demand Savings ......................................................................................... 86
12.2 Forward Looking Performance Metrics ...................................................................................... 86
12.2.1 Equity Metric Tracking ........................................................................................................ 86
13 Advancing Docket 4600 Principles and Goals ............................................................................. 87
Conclusion ....................................................................................................................................... 88
14 Miscellaneous Provisions .......................................................................................................... 88
15 Reporting Requirements ........................................................................................................... 89
16 Requested Rulings .................................................................................................................... 89
ATTACHMENTS ..................................................................................................................................... 90
Annual Plan Attachment 1. Residential and Income Eligible Energy Efficiency Solutions and Programs ....... 90
Annual Plan Attachment 2. Commercial and Industrial Energy Efficiency Solutions and Programs .............. 90
Annual Plan Attachment 3. Evaluation, Measurement & Verification Plan ............................................... 90
Annual Plan Attachment 4. Rhode Island Benefit Cost Test Description ................................................... 90
Annual Plan Attachment 5. Electric Energy Efficiency Program Tables ..................................................... 90
Annual Plan Attachment 6. Gas Energy Efficiency Program Tables .......................................................... 90
Annual Plan Attachment 7. Rate and Bill Impacts .................................................................................. 90
Annual Plan Attachment 8. Pilots, Demonstrations & Assessments ......................................................... 90
Annual Plan Attachment 9. Cross-Program Summary ............................................................................ 90
Annual Plan Attachment 10. Definitions ............................................................................................... 90
Annual Plan Attachment 11. Energy Efficiency Equity Working Group Final Report ................................... 90

5
Table of Tables
Table 1. 2022 Energy Efficiency Program Plan Summary ........................................................................... 10
Table 2. 2022 Active Demand Response Program Plan Summary .............................................................. 10
Table 3. Overview of 2022 Residential Energy Efficiency Programs ........................................................... 22
Table 4. Overview of 2021 Income Eligible Programs ................................................................................ 27
Table 5. Commercial and Industrial Programs ............................................................................................ 30
Table 6. Overview of 2022 Commercial and Industrial Energy Efficiency Programs .................................. 30
Table 7. EWG Recommendations and 2022 Plan Enhancements ............................................................... 37
Table 8 Continued Workforce Development Activities .............................................................................. 48
Table 9. New Workforce Development Activities for 2022 ........................................................................ 49
Table 10. Participation Definitions .............................................................................................................. 51
Table 11. Planned CHP Project Details ........................................................................................................ 57
Table 12: Rate and Bill Impact Results for the Electric Portfolio ................................................................ 63
Table 13: Rate and Bill Impact Results for the Natural Gas Portfolio ......................................................... 64
Table 14. Summary of Changes in Rates between 2021 and 2022 ............................................................. 64
Table 15. Electric Benefit Cost Ratios at Program, Sector, and Portfolio Level .......................................... 68
Table 16. Natural Gas Benefit Cost Ratios at Program, Sector, and Portfolio Level ................................... 69
Table 17. List of the Costs of Energy Efficiency and Costs of Energy Supply .............................................. 70
Table 18. Comparison of 2022 Electric Portfolio in Three-Year Plan Compliance Filing and 2022 Annual
Plan ............................................................................................................................................................. 73
Table 19. Comparison of 2022 Gas Portfolio in Three-Year Plan Compliance Filing and 2022 Annual Plan
.................................................................................................................................................................... 74
Table 20. Electric Energy Efficiency Portfolio Benefits Alignment for PIM Calculations ............................ 84
Table 21. Gas Energy Efficiency Portfolio Benefits Alignment for PIM Calculations .................................. 84
Table 22. Docket 4600 Goals for the Electric System ................................................................................. 87

6
Table of Figures
Figure 1. 2022 Annual Plan Total Benefits and Total Costs (RI Test) for the Electric Energy Efficiency and
Demand Response Portfolio, ....................................................................................................................... 11
Figure 2. 2022 Annual Plan Total Benefits and Total Costs (RI Test) for the Natural Gas Portfolio ........... 12
Figure 3. 2021 Graphical representation of Attachment 5 Table E-1 and total Electric Savings by Sector,
Cumulative .................................................................................................................................................. 60
Figure 4. 2021 Graphical representation of Attachment 6 Table G-1 and total Gas Savings by Sector,
Cumulative .................................................................................................................................................. 61

7
INTRODUCTION
1 Introduction
The Narragansett Electric Company d/b/a National Grid (National Grid or the Company) submits this
2022 Annual Energy Efficiency and Conservation Procurement Plan (Plan or Annual Plan) as the second
annual plan submitted within the fifth triennial plan (2021-2023 Three Year Energy Efficiency and
Conservation Procurement Plan) in fulfillment of The Comprehensive Energy Conservation, Efficiency
and Affordability Act of 2006.1
Energy efficiency is the most cost-effective way to meet customers’ energy needs and is foundational to
meeting Rhode Island’s greenhouse gas emissions reduction mandates set forth in the 2021 Act on
Climate legislation. Customers who directly participate in energy efficiency programs save energy and
see direct cost savings in the form of lower energy bills. Energy efficiency also lowers long-term base
load and peak demand and can reduce the need for additional generation, distribution, and
transmission infrastructure, benefiting all customers, regardless of direct participation in the Company's
efficiency programs. The purpose of the Annual Plan is to propose the programs the Company will
deliver to help Rhode Island energy consumers meet their energy needs through cost effective, reliable,
prudent, and environmentally responsible energy efficiency and demand response, and to identify their
costs, benefits, and energy savings.
The Annual Plan identifies the energy savings goals for 2022 and describes the detailed strategies,
programming, and investments the Company is undertaking to achieve these goals, in pursuit of the
overarching goals, savings, and benefits outlined in the 2021 -2023 Three-Year Energy Efficiency Plan. In
proposing this Plan, the Company is mindful of the prevailing economic conditions, including the
recovery of the Rhode Island economy due to the impacts of the COVID-19 pandemic. The Company is
also aware of the significant economic benefits that energy efficiency programming can offer towards
recovery. The planned programs and budgets attempt to maintain flexibility to ensure continued
delivery of energy efficiency services and maintain and build clean energy jobs for the 2022 program
year.
This Plan will create significant benefits for Rhode Island. In total, the Plan is expected to create
$358.7M in total benefits over the life of the installed electric, demand response, and natural gas energy
1 The RI Legislature recently passed an update to the 2006 Least Cost Procurement Legislation, specifically impacting the company’s transfer of funds to support the Efficient Buildings Fund administered by the Rhode Island Infrastructure Bank. Refer to R.I. Pub. Laws Ch. 224 (2021), http://webserver.rilin.state.ri.us/PublicLaws/law21/law21224.htm

8
efficiency measures.2 Investments made in energy efficiency to achieve these savings will add $358.9M
to Rhode Island’s Gross State Product (GSP),3 the equivalent of 3,231 job years. The projected lifetime
energy savings from this Plan will avoid 608,736 tons of carbon, the equivalent of removing 121,100
passenger vehicles from the road for one year. Energy savings and benefits are measured and verified by
third-party evaluation firms.
The electric portion of the Plan will save 1,145,371 lifetime MWh over the lifetime of the installed
energy efficiency measures, 127,561 net annual MWhs, 17,359 net annual kW from passive energy
efficiency, and 39,765 net annual kW from active demand response. The natural gas portion of the plan
will save 4,059,902 lifetime MMBtu over the lifetime of installed natural gas measures and 389,430
annual MMBtu. For all fuels (electric, gas, oil, propane), combined the plan will save 6,545,548 net
lifetime MMBtu and 726,108 net annual MMBtu.
This Plan is submitted in accordance with the Least Cost Procurement Law, R.I. Gen. Laws § 39-1-27.7,
the basis for which is the Comprehensive Energy Conservation, Efficiency, and Affordability Act of 2006,
R.I. Gen. Laws § 39-2-1.2, and the Least Cost Procurement Standards, as approved and adopted
pursuant to Order No. 23890 in Docket No. 50154 (referred to herein as the “LCP Standards”). This Plan
has been developed by National Grid with feedback provided by the Energy Efficiency Technical Working
Group (EE TWG) 5 and the Energy Efficiency and Resource Management Council (EERMC) and the Energy
Efficiency Equity Working Group (EWG).
The 2022 Plan satisfies the statutory requirements for Least Cost Procurement and the Least Cost
Procurement Standards and is consistent with the approved Three-Year Energy Efficiency Procurement
Plan (Three-Year Plan) for 2021-2023. The overarching goal of both Plans is to enable Rhode Island
2 Total benefits does not include quantified economic benefits.
3 RI GDP as of 2020: $60.2 Billion https://fred.stlouisfed.org/series/RINGSP
4 RI PUC Docket 5015, Least Cost Procurement Standards http://www.ripuc.ri.gov/eventsactions/docket/5015_LCP_Standards_05_28_2020_8.21.2020%20Clean%20Copy%20FINAL.pdf 5 Since 1991, a collaborative group has been meeting regularly to analyze and inform the Company’s electric and gas energy efficiency programs. The name of this group was modified in 2019 to the Energy Efficiency Technical Working Group (EE TWG) to better reflect the roles of the parties. Presently, members of the EE TWG include: The Company, the Division of Public Utilities and Carriers (Division or DPUC) and the Division’s consultant, Synapse Energy Economics (Synapse), the City of Providence, Green Energy Consumers Alliance, the Office of Energy Resources, and Acadia Center. In addition, the George Wiley Center, the Center for Justice, the Rhode Island Infrastructure Bank (RIIB), and several EERMC members and representatives from the EERMC’s Consulting Team participate in the EE TWG. Since 1991, membership in the EE TWG has varied because some organizations have withdrawn, and others have joined.

9
energy consumers to meet their energy needs through cost-effective, reliable, prudent, and
environmentally responsible energy efficiency.
1.1 Cost-Effective Savings
The primary goal of the Plan is to create energy and economic cost savings for Rhode Island consumers
through energy efficiency. To that end, the electric-funded portion of the Plan will create electric and
delivered fuels savings of 1,145,371 net lifetime MWhs, 127,561 net annual MWhs, and 17,359 net
annual kW from passive energy efficiency. In addition, the Plan will generate savings of 39,765 net
annual kW from active demand reduction measures. The natural gas-funded portion of the Plan will
create savings of 4,059,902 net lifetime MMBtus and 389,430 net annual MMBtus. The Plan will
generate total benefits of $358.7 Million over the life of the measures. Of these total benefits, $234.6
Million come from electric efficiency, passive demand reductions, and active demand response. $124.0
Million in benefits derive from natural gas efficiency. This adds up to significant benefits for Rhode
Island’s residential, commercial, industrial, and income eligible energy customers. The Annual Plan is
cost-effective, with a cost that is lower than the cost of energy supply for both electricity and natural gas
portfolios, satisfying the requirements prescribed in R.I. Gen. Laws § 39-1-27.7 (a)(2) and the Standards.
The Plan also satisfies PUC Order No. 22851 by demonstrating how it advances the Docket 4600
principles and goals for the electric system detailed in Section 0.6
Table 1 includes a high-level summary of the Electric-funded and Natural Gas-funded portions of the
Plan. Table 2 represents a more detailed table of the programs included under the "Active Demand
Response (kW)" column shown in Table 1.
6 PUC Report and Order No. 22851 accepting the Stakeholder Report. Written Order issued July 31, 2017.

10
Table 1. 2022 Energy Efficiency Program Plan Summary
Electric Programs by
Sector (3)
Implementation
Spending ($000)1)
Customer Contributio
n ($000)
Annual Savings (MWh)
Lifetime Savings (MWh)
¢/lifetime kWh
Summer Annual
Demand Savings (kW) (5)
Active Demand
Response (kW)
Total Benefits ($000) (7)
RI Test B/C Ratio
(7)
Participants (6)
Non-Income Eligible Residential
$32,998 $5,065 43,435 201,325 18.9 5,691 7,365 $59,680 1.57 383,409
Income Eligible Residential (3)
$16,801 $0 4,851 62,816 26.7 529 N/A $34,126 2.03 7,183
Commercial and Industrial
$59,131 $15,560 79,275 881,230 8.5 11,139 32,400 $140,814 1.76 3,005
Regulatory (2) $8,186
Subtotal $117,116 $20,625 127,561 1,145,371 12.0 17,359 39,765 $234,620 1.64 393,597
Gas Programs by
Sector
Implementation Spending
($000)
Customer Contribution
($000)
Annual Savings
(MMBtu)
Lifetime Savings
(MMBtu)
$/lifetime MMBtu
Total Benefits ($000)
RI Test B/C
Ratio Participants
Non-Income Eligible Residential
$14,976 $5,354 153,027 1,223,778 16.61 $27,715 1.36 161,436
Income Eligible Residential
$9,321 $0 25,642 491,932 18.95 $30,607 3.28 4,248
Commercial and Industrial
$9,508 $3,209 210,760 2,344,192 5.42 $65,726 4.56 1,056
Regulatory (2) $1,219
Subtotal $35,023 $8,563 389,430 4,059,902 10.74 $124,049 2.74 166,740
TOTAL Plan $152,140 $29,187
6,530,609
$358,669 1.89 560,338
(1) Implementation spending does not include customer contributions, shareholder incentive, or commitments.
(2) Regulatory Includes contributions to the Office of Energy Resources and EERMC.
(3) In addition to Income Eligible Residential programs, Income Eligible customers can participate in all Non-Income Eligible Residential programs.
(4) Electric Programs are funded by the Electric Energy Efficiency Charge but also include Delivered Fuels energy savings.
(5) The Summer Annual Demand Response (kW) measures passive demand savings.
(6) The unit measure for participation varies by program. See Attachment 5, Table E-7 and Attachment 6, G-7 for participation goals by program.
(7) “Total Benefits” and the “RI Test B/C Ratio” no longer include economic benefits previously included in the RI Test in the 2020 and 2021 plans.
Table 2. 2022 Active Demand Response Program Plan Summary
Programs Implementation
Spending ($000)
Customer
Contribution
($000)
Active Demand
Response (kW) $/kw (2)
Total Benefits
($000)
RI Test
B/C
Ratio
Participation
Residential
ConnectedSolutions
$1,802 $- 7,365 $245 $2,886 1.60 4,178
Commercial
ConnectedSolutions
$4,386 $- 32,400 $135 $10,621 2.42 180
Total $6,188 $- 39,765 $156 $13,507 2.18 4,358
(1) All Residential electric customers (including Income Eligible customers) are eligible to participate in the Residential ConnectedSolutions program if they
have the necessary equipment – a smart thermostat and central air conditioning, or a behind the meter battery.
(2) (Implementation Spending *1000) / Active Demand Response (kW)
(3) “Total Benefits” and the “RI Test B/C Ratio” no longer include economic benefits previously included in the RI Test in the 2020 and 2021 plans.

11
1.2 Benefits of Investment in Energy Efficiency
Each $1 spent on the electric energy efficiency portfolio will create $1.64 in monetized benefits over the
lifetime of the investment, and every $1 spent on the natural gas portfolio will create $2.74 in
monetized benefits over the lifetime of the investments. Figure 1 and Figure 2 below detail the costs
and benefits for the electric and gas portfolios, respectively, calculated using the RI Test. A detailed
summary of the benefits and costs included in the Rhode Island Test are included in Attachment 4
Rhode Island (RI) Benefit Cost Test.
Figure 1. 2022 Annual Plan Total Benefits and Total Costs (RI Test) for the Electric Energy Efficiency and Demand
Response Portfolio,7
As described in Attachment 4, unlike in the 2020 and 2021 Annual Plans, the primary calculation of
benefits conservatively excludes Economic Development because of concerns over double counting of
benefits with other categories. The monetized RI Test benefits for the electric energy efficiency and
demand response portfolio are calculated to be $235M. The monetized RI Test benefits for the gas
portfolio are calculated to be $124M.
7 For more information on how and why these costs and benefits are calculated and included, see Attachment 4 Rhode Island Benefit Cost Test Description. For more information on the costs and expenses summarized here see Attachments 5 and 6.
$0
$50,000
$100,000
$150,000
$200,000
$250,000
Costs Benefits
$(0
00
)
Reliability
Nitrous Oxide
Non-Electric ResourceBenefitsCarbon Benefits
Non-Resource Benefits
Capacity Benefits
Electric Energy Benefits
Shareholder Incentive
Customer Contribution
Implementation Expenses

12
Figure 2. 2022 Annual Plan Total Benefits and Total Costs (RI Test) for the Natural Gas Portfolio
The electric, gas, and delivered fuel energy efficiency measures proposed in this Plan will avoid over
608,736 tons of carbon.8 This is the equivalent of removing approximately 120,100 passenger vehicles
from the road for one year.9
The Company expects that investments made in energy efficiency under this Plan will add $$359M to
Rhode Island’s Gross State Product (GSP), the equivalent of 3,231 job years. 10 The vast majority of jobs
associated with the Annual Plan’s energy efficiency investments are local because they are tied to the
installation of equipment and materials. An analysis of National Grid’s 2020 energy efficiency programs
found that 73% of companies that deliver services on behalf of the Company’s energy efficiency
8 This takes into account the net impact of EE measures on carbon emissions. The marginal carbon emission rates are from “Avoided Energy Supply Components in New England: 2021 Report” Appendix K. 9 https://www.epa.gov/energy/greenhouse-gas-equivalencies-calculator 10 Macroeconomic multipliers for the economic growth and job creation benefits of investing in cost-effective energy efficiency from “Review of RI Test and Proposed Methodology” prepared for National Grid by the Brattle Group, January 31, 2019. These macroeconomic multipliers reflect the total impact to the Rhode Island economy and do not remove benefits counted elsewhere in the RI Test, so are shown as a separate economic impact analysis estimate.
$0
$20,000
$40,000
$60,000
$80,000
$100,000
$120,000
$140,000
Costs Benefits
$(0
00
)
Nitrous Oxide
Non-Gas ResourceBenefits
Carbon Benefits
Non-Resource Benefits
Natural Gas Benefits
Shareholder Incentive
Customer Contribution
Implementation Expenses

13
programs are either headquartered or have a presence in Rhode Island.11 Investments in energy
efficiency contribute to Rhode Island’s economy overall and benefit business owners and their
employees who deliver these programs and services.
The cost of procuring 1,145,371 net lifetime MWh electric energy efficiency savings through the Plan is
$62.1 million less than if that electric load was met by purchasing additional electric supply. The cost of
procuring 4,059,902 MMBtu lifetime natural gas energy efficiency savings through the Plan is $18.9
million less than if that natural gas load was met by purchasing additional natural gas supply.12
This Plan includes an investment of $122.6 million in the cost-effective electric energy efficiency
portfolio in 2022. If approved, this will be funded by $14.5 million in proceeds from the ISO New England
(ISO-NE) Forward Capacity Market (FCM), revenues from the existing energy efficiency program charge
of $0.01113 per kWh, and revenues from a fully reconciling mechanism of $0.005024 per kWh pursuant
to R.I. Gen. Laws § 39-1-27.7(c)(5) to fully fund the cost-effective electric energy efficiency programs for
2022.13
This Plan also includes an investment of $36.7 million in the cost-effective natural gas energy efficiency
portfolio in 2022. If approved, this investment will be funded by revenues from the existing energy
efficiency program charge of $0.871 per dekatherm for residential customers and $0.596 per dekatherm
for non-residential customers plus revenues from a fully reconciling mechanism of $0.417 per
dekatherm for residential customers and $0.264 per dekatherm for non-residential customers pursuant
to R.I. Gen. Laws § 39-1-27.7(c)(5) to fully fund the cost-effective natural gas energy efficiency programs
for 2022.14
1.3 The Planning Process and Major Changes
This plan benefited from the planning process undertaken in the 2020 calendar year that resulted in the
2021 – 2023 Three-Year Plan. This Annual Plan reflects a refinement of the planning that was
undertaken for the second year of that Three-Year Plan, including incorporating the latest Evaluation,
Measurement, and Verification (EM&V) studies and Avoided Cost study. The Three-Year Plan was
informed by the areas of opportunity identified in the Rhode Island Energy Efficiency Market Potential
Study (Market Potential Study) commissioned by the EERMC and completed by Dunsky Energy
Consulting in May 2020. The PUC selected the maximum potential identified by the study as the
approved Targets in Docket 5023. In setting these Targets, the EERMC did not apply the filters of
prudency and reliability that are required of the Company’s proposed investments in energy efficiency,
and that are applied in this and other Annual Plans.
11 Guidehouse, “Rhode Island 2020 Energy Efficiency Workforce Analysis Report,” May 1, 2021 (filed as part of National Grid’s 2020 Year-End Report). 12 For more information on how this was calculated, see Section 7.5 of the Main Text, “Cost of Annual Plan Compared to the Cost of Energy Supply” 13 See Attachment 5 Electric EE Program Tables, Table E-1 for list of funding sources and calculation of the charge. 14 See Attachment 6 Gas EE Program Tables, Table G-1 for list of funding sources and calculation of the charge.

14
This Annual Plan has also been guided by the LCP Standards in RI PUC Docket 5015. The Standards
include an extensive set of “principles of program design” referenced in Section 2.1.1.
The 2022 Plan is the first year without the Residential ENERGY STAR® Lighting program. As the highly
cost-efficient savings secured in previous plan cycles from lighting are reduced as a portion of program
portfolio savings, the Company continues to seek new opportunities to drive deeper savings and
transform additional markets. Consequently, this Plan continues to focus on building upon existing
customer relationships to encourage comprehensive measures that accrue greater savings over their
lifetime. Because these deeper and more comprehensive measures have higher upfront costs to secure
the levels of claimable energy savings provided by lighting in previous plan cycles (i.e. they produce
fewer savings per dollar invested), cost control and efficiency are key.
National Grid staff collaborated with the EERMC consultant team through a series of Deep Dive
Meetings to identify measures from the Market Potential Study and to inform the savings programs and
strategies included in this Annual Plan. This has resulted in specific emphasis on deeper measures of
weatherization (insulation and air sealing), heating and hot water measures, particularly for residential
and small business customers, and an increasing focus on combining sophisticated building and
equipment controls alongside high potential measures offered to commercial and industrial customers.
Building on the successes achieved through prior plans, this plan continues to expand active demand
response programs.
The Company has engaged the TWG throughout the planning process to leverage their expertise and
seek their feedback. In early 2021, TWG members were asked to identify their priorities for this Annual
Plan. TWG members also previewed and provided input on key themes and major changes in an Annual
Plan Outline Memorandum circulated in June 2021. The Company is grateful for the substantive
critiques and innovative ideas that have come through this process of continued engagement. The
Company has incorporated many priorities of TWG stakeholders into many components of this Annual
Plan. In particular, the discussions of equity have helped shape and elevate the Company’s explicit
equity commitments, establishing equity as an overarching strategic objective of this Annual Plan and
adding multiple specific, measurable actions across the portfolio of efficiency programs.
1.4 How to Read This Plan
For ease of review, this Plan has been organized to align with the revised LCP Standards. There are three
overarching sections: Strategies and Approaches to Planning; Consistency with Standards; and Funding
Plan, Budget and Goals. The Strategies and Approaches to Planning section provides a detailed
discussion of the Company’s approach to implementing the principles of program design outlined in the
LCP Standards and provides high-level program descriptions, along with the major enhancements and
innovations planned for 2022. This section also includes a discussion of program participation, pilots and
demonstrations and assessments, evaluation, measurement and verification, and coordination with
other energy programs. The Consistency with Standards section explains how the Plan meets Prudency
(including a detailed discussion of equity and rate and bill impacts), Reliability, Environmentally
Responsible, Cost Effectiveness, and comparison to alternative cost of supply requirements, as set forth
15
in the LCP Standards. The Funding Plan, Budget and Goals detail these elements and discusses the
performance incentive plan and performance metrics.
The eleven Attachments to this Annual Plan provide additional detail on specific Plan elements.
Attachment 1 Residential & IES Programs and Attachment 2 C&I Programs provide detail on program
eligibility criteria, offerings, implementation and delivery, customer feedback, 2021 changes with
accompanying rationale, and proposed evaluations for each program. Attachment 3 Evaluation,
Measurement, and Verification Plan reviews evaluation studies completed in 2020, details studies
planned for 2021, and provides a recap of historical studies. Attachment 4 RI Benefit Cost Test presents
the assessed cost-effectiveness of this Annual Plan. Attachments 5 and 6 contain funding, budgets,
goals, and cost-effectiveness tables for the electric and gas energy efficiency programs, respectively.
Attachment 7 Rate and Bill Impacts provides a detailed analysis of the electric and gas bill impacts
resulting from this Plan. Attachment 8 details, for each sector, 2021 Pilots, Demonstrations, and
Assessments. Attachment 9 Cross-Program Summary documents how the programs described in this
Plan relate to other specific National Grid programs. Attachment 10 Definitions provides definitions of
energy efficiency terms used throughout the annual plan. Attachment 11 Equity Working Group Final
Report provides a summary of actions taken through the working group.
STRATEGIES AND APPROACHES TO PLANNING
2 Programs and Priorities
2.1 Strategic Overview of Programs and Priorities
This Annual Plan is built as the second year of the 2021-2023 Three-Year Energy Efficiency Plan. The
Three-Year Plan set the Company on a trajectory to ensure that Rhode Island has a robust and resilient
energy efficiency infrastructure, particularly as the market for energy efficiency transforms with changes
in the lighting market. This Annual Plan will help continue the trajectory of Rhode Island homes and
businesses towards greater efficiency, while contributing to recovery from the COVID-19 pandemic and
its impacts on customers and economic conditions. The Plan seeks to guarantee that all Rhode Island
energy consumers, regardless of their geographic location, income, home ownership status, primary
language, business size, or other relevant barriers are empowered to be active in their energy choices,
control their energy use, and enjoy the economic, environmental, and cost savings benefits of energy
efficiency.
The Plan supports continued innovation and evolution, building enabling tools to accelerate the
transition of Rhode Island homes and businesses to increasing levels of efficiency in future years. It
balances the pursuit of energy and financial savings from current technologies and programs with the
need to also identify new technologies, finance channels, workforce development enhancements, and
programs to continue delivering savings to Rhode Island customers for years to come. The Plan achieves
savings by implementing the following key strategic priorities set out in the Three-Year Plan:
• Expand and deepen customer relationships.
• Drive adoption of comprehensive measures.

16
• Expand and evolve Active Demand Response.
• Achieve cost optimization and efficiency.
• Apply a pertinent equity lens across all EE program planning and delivery, with the input and
guidance of the Rhode Island Equity Working Group (EWG).
Section 2.1.1 explains how the principles of program design included in the new LCP Standards have
been applied to this Annual Plan, highlighting examples and providing direction on where deeper
discussion may be found within the Plan. Sections 2.2, 2.3, and 2.4 provide high-level summaries of
program designs and changes for 2022 to Residential, Income Eligible Services, and Commercial and
Industrial Programs. Section 2.5 offers detail on the cross-cutting programs for 2022, including the
Community-Based Initiative, codes and standards, workforce development, and equity. Lastly, Section
2.6 provides participant definitions and planned participation numbers.
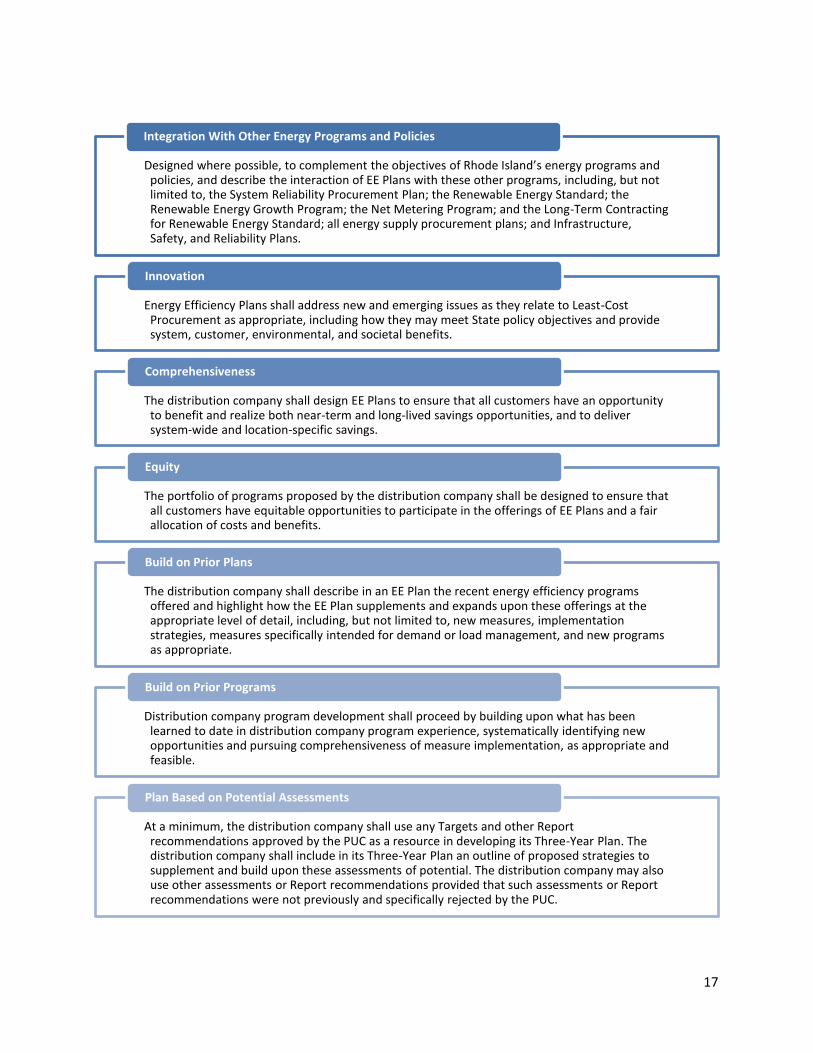
2.1.1 Principles of Program Design
This Annual Plan has been guided by the LCP Standards as updated in RI PUC Docket 5015, which
provide an extensive set of principles of program design, listed below. This Plan’s approach to
incorporating these principles follows, with references to other areas of the Plan that provide greater
detail.
17
Designed where possible, to complement the objectives of Rhode Island’s energy programs and policies, and describe the interaction of EE Plans with these other programs, including, but not limited to, the System Reliability Procurement Plan; the Renewable Energy Standard; the Renewable Energy Growth Program; the Net Metering Program; and the Long-Term Contracting for Renewable Energy Standard; all energy supply procurement plans; and Infrastructure, Safety, and Reliability Plans.
Integration With Other Energy Programs and Policies
Energy Efficiency Plans shall address new and emerging issues as they relate to Least-Cost Procurement as appropriate, including how they may meet State policy objectives and provide system, customer, environmental, and societal benefits.
Innovation
The distribution company shall design EE Plans to ensure that all customers have an opportunity to benefit and realize both near-term and long-lived savings opportunities, and to deliver system-wide and location-specific savings.
Comprehensiveness
The portfolio of programs proposed by the distribution company shall be designed to ensure that all customers have equitable opportunities to participate in the offerings of EE Plans and a fair allocation of costs and benefits.
Equity
The distribution company shall describe in an EE Plan the recent energy efficiency programs offered and highlight how the EE Plan supplements and expands upon these offerings at the appropriate level of detail, including, but not limited to, new measures, implementation strategies, measures specifically intended for demand or load management, and new programs as appropriate.
Build on Prior Plans
Distribution company program development shall proceed by building upon what has been learned to date in distribution company program experience, systematically identifying new opportunities and pursuing comprehensiveness of measure implementation, as appropriate and feasible.
Build on Prior Programs
At a minimum, the distribution company shall use any Targets and other Report recommendations approved by the PUC as a resource in developing its Three-Year Plan. The distribution company shall include in its Three-Year Plan an outline of proposed strategies to supplement and build upon these assessments of potential. The distribution company may also use other assessments or Report recommendations provided that such assessments or Report recommendations were not previously and specifically rejected by the PUC.
Plan Based on Potential Assessments

18
EE Plans shall include a Section outlining and discussing new strategies to make available the capital needed to effectively overcome barriers to implement projects in addition to direct financial incentives provided in order to cost-effectively achieve the Least Cost Procurement mandate. Such proposed strategies shall move beyond traditional financing strategies and shall include new capital availability strategies and partnerships that effectively overcome market barriers in each market segment in which it is feasible to do so.
Unlocks Capital and Effectively Uses Funding Sources
EE Plans shall address how the distribution company plans to integrate gas and electric energy efficiency programs to optimize customer energy efficiency and provide benefits from synergies between the two energy systems and their respective programs.
Integration of Gas and Electric Energy Efficiency Programs
Plans shall be developed to propose strategies to achieve the energy efficiency savings targets that shall be proposed by the Council and approved by the PUC for that three-year period. Such strategies shall secure energy, capacity, and system benefits and also be designed to ensure the programs will be delivered successfully, cost-effectively, and cost-efficiently over the long term. In addition to satisfying other provisions of these Standards, the EE Plans shall contribute to a sustainable energy efficiency economy in Rhode Island, respond to and transform evolving market conditions, strive to increase participation and customer equity, and provide widespread consumer benefits.
Strategies to Achieve Targets
Energy Efficiency investments shall be made on behalf of all customers. This will ensure consistency with existing program structure under which all customers pay for, and benefit from, Rhode Island’s efficiency programs.
Investments on Behalf of All Customers
All efforts to establish and maintain program capability shall be done in a manner that ensures quality delivery and is economical and efficient. The distribution company shall include wherever possible and practical partnerships with existing educational and job training entities.
Efficacy
While it is anticipated that rough parity among sectors can be maintained, as the limits of what is cost-effective are identified, there may be more efficiency opportunities identified in one sector than another. The distribution company shall design EE Plans to capture all resources that are cost-effective and lower cost than supply. The distribution company shall consult with the Council to address ongoing issues of parity.
Parity Among Sectors
The distribution company shall propose a portfolio of programs that is cost-effective. Any program with a quantified benefit-cost ratio greater than 1.0 (i.e., where quantified benefits are greater than quantified costs), should be considered cost-effective. Consistent with the PUC’s guidance issued in Docket No. 4600A, qualitative benefits and costs may be considered in determining cost-effectiveness. The portfolio must be cost-effective and programs must be cost-effective.
Cost-Effectiveness

19
This Annual Plan has been designed to integrate with Rhode Island’s energy programs and policies.
Section 5 Coordination with Other Energy Policies and Programs provides details on the Plan’s
connection to specific state policies. The program descriptions found in Attachment 1 Residential & IES
Programs and Attachment 2 C&I Programs offer additional specific detail on implementation and
delivery, how the energy efficiency programs help customers achieve additional state energy policy
goals, and information on energy programs beyond those run directly by the Company, such as
programs for connecting to renewable energy sources and electrification opportunities. This plan offers
innovations in program design alongside a systematic approach to bringing innovative new technologies
and approaches forward as outlined in Attachment 8 Pilots, Demonstrations and Assessments.
Comprehensiveness is a core design principle and a core strategy for both the 2021-2023 Three-Year
Plan and this Annual Plan. This Plan includes multiple enhancements to reach and engage more
customers, such as the simplified whole building pathway to capture more small and medium buildings
in new construction,15 and the scale-up of the Equipment and System Performance Optimization
Initiative16 to capture new customers and offer them more comprehensive approaches. The Commercial
and Industrial market sector approach and the Residential and Income Eligible whole building delivery
programs (EnergyWise, Multifamily, Income Eligible Services, and Income Eligible Multifamily) continue
the evolution to deep comprehensive savings packages that emphasize whole building and whole
system solutions, with integration of gas and electric energy efficiency to optimize and benefit from
synergies between the two energy systems.
The program designs included in this Plan build on prior plans and build on prior programs. The
detailed program descriptions provided in the Attachment 1 Residential & IES Programs and Attachment
2 C&I Programs offer snapshots and evidence of how programs are continuously evolving, building from
one plan year to the next. They show how high-level strategies within the Three-Year and Annual Plans
are translated into specific actions and activities that secure savings for customers and help to
contextualize specific program innovations and enhancements described only briefly in Sections 2.2, 2.3,
and 2.4. Attachments 1 and 2 provide details on new measures, implementation strategies, measures
specifically intended for demand or load management, and new programs. The Company intends to
work towards commitments in the Annual Plan that were made from the best information available at
the time. Should extenuating circumstances arise, the Company will inform stakeholders of the inability
to execute a commitment or need to revise.
Active demand response (or ConnectedSolutions) programming is a great example of how this Plan
builds on prior plans and programs. Active demand response was first offered as a residential pilot in
2016 and a C&I pilot in 2017. In 2019, these pilots were converted to standard programs and continued
15 See Attachment 2 C&I Programs, Section 2 Large C&I New Construction Program. 16 See Attachment 2 C&I Programs, Section 5.7 Equipment & System Performance Optimization.

20
in 2020 and 2021. In this Plan, the Company proposes to continue growing active demand response
offerings and expanding them to new technologies that will provide new program pathways to
additional peak demand savings.17 The ConnectedSolutions programs in this Plan will deliver demand
reductions that build upon prior success to grow participation and offerings for both commercial and
residential customers in pursuit of the Active Demand Response Targets approved in Docket 5023.
Equity is a core strategic priority of this 2022 Annual Plan that builds on the themes presented in the
2021 - 2023 Three-Year Plan. The Company is committed to ensuring all customers benefit from the
energy efficiency programs, regardless of circumstances such as their geographic location, income,
home ownership status, primary language, or business size. The Company also believes program-related
jobs and positive economic development impacts should reach all Rhode Island communities, with
particular emphasis on environmental justice/disadvantaged communities. Using an equity lens involves
consideration of how the programs have been traditionally planned, designed and delivered, as well as
the systemic and institutional structures that have made it easier for some customers to access the
energy efficiency programs than others. A full report on the Equity Working Group’s activities can be
found in Attachment 11.
This Annual Plan has benefited from the Market Potential Study, and the areas of opportunity it
identified have been considered in the program planning process. The RI PUC approved Targets, which
reflect the study’s maximum potential assessment assumed barrier reductions beyond current levels of
program design and further improved customer economics by assuming 100% incentives. The Company
has combined this with additional assessments and analysis of results from EM&V, program experience,
and customer and vendor feedback loops. Comprehensive projects emphasize capturing the specific
opportunities identified in the Market Potential Study. For example, the bundled incentive designs in
EnergyWise connect deep weatherization (insulation and air sealing) with additional heating and hot
water measures, the measures identified in the Market Potential Study with the highest potential.18 The
Commercial and Industrial programs too have systematically focused all programs on measures with
high potential. One easy to see result is the continued focus on bundling control technologies with high
potential building, HVAC, and lighting end uses.19 This Plan includes significant investments to ensure
workforce capacity to support customer adoption of high efficiency technologies, including advanced
control systems and air source heat pumps (see Section 2.5.4 Cross Cutting Programs, Workforce
Development).
17 See Attachment 1 Residential & IES Programs, Section 9 Residential ConnectedSolutions and Attachment 2 C&I Programs, Section 8 C&I ConnectedSolutions. 18 See Attachment 1 Residential & IES Programs, Section 2 EnergyWise Single Family. 19 See Attachment 2 C&I Programs, sections 3.1 Performance Lighting Plus, 6.1 and 6.2 Customer and Company Owned Street Light Equipment, 6.5.1 Upstream Lighting, 6.5.2 Upstream HVAC, and 7. Small Business Direct Install.

21
All program designs are connected to financing options to help unlock capital and effectively use
funding sources. This Plan consistently looks beyond direct financial incentives and traditional financing
strategies to design capital and program access strategies that respond to specific customer barriers. For
example, exploring new financing support for small and mid-size independent grocers through OBR (on-
bill repayment) or through an interest buy-down mechanism in partnership with third party providers of
debt capital, or thought adding incremental Regional Greenhouse Gas Initiative (RGGI) incentives for
weatherization related measures.20 We believe this access to capital will allow customers to commit to
projects more quickly or increase the number of measures installed. The Company is also exploring
expanded use of the Heat Loan to help multifamily property owners invest in more comprehensive
upgrades, regardless of meter type.21
The primary strategies to achieve savings goals are guided by our five strategic priorities: expand and
deepen customer relationships; drive adoption of comprehensive measures; expand active demand
response; achieve cost optimization and efficiency; and apply an equity lens across all planning and
delivery. Detailed strategies that target specific segments by responding to and seeking to transform
specific markets can be found in Attachment 1 Residential & IES Programs and Attachment 2 C&I
Programs.
Efficacy, or ensuring quality delivery that is economical and efficient, like comprehensiveness, is a core
strategy of the 2022 Annual Plan. As Rhode Island energy consumers face economic repercussions from
COVID-19, the Company has incorporated opportunities to balance the portfolio of energy savings
measures and program approaches to drive higher cost efficiencies (i.e. the amount of energy savings
per dollar invested) and minimize the impact on customer bills. The “efficacy” principle of program
design specifically calls for “practical partnerships with existing educational and job training entities.”
The Company will coordinate with the Department of Labor and Training’s Real Jobs Rhode Island
program22, the RI Department of Education’s PrepareRI initiative23, and other entities to help promote
existing solutions to reduce or eliminate duplication of effort and expenditures. For more information
see Section 2.52.5.4.
Cost effectiveness: The Company updates its cost effectiveness models during planning and as
evaluation data and program implementation insights arrive. Refer to Attachment 4 for details of the RI
Test as applied to the portfolio of 2022 Programs. The application of cost effectiveness as a design
principle at a program level as required by the LCP Standards, however, involves a balancing of the drive
for comprehensive projects with long-term measures, which tend to be complex and challenging for
customers to adopt and therefore have higher savings acquisition cost, with opportunities for highly cost
efficient savings provided through programming that requires less intensive customer support, such as
20 See Attachment 2 C&I Programs, Section 5.1 Grocery Initiative. 21 See Attachment 1 Residential & IES Programs, Section 3 Multifamily. 22 https://dlt.ri.gov/realjobsri/
23 https://www.prepare-ri.org/

22
upstream programming and work on codes and standards, as well as highly cost efficient programs such
as the Strategic Energy Management Planning with very large customers.
The intentional transformation of the lighting market to light-emitting diode (“LED”) technology is a
signature achievement of the design and implementation of prior Three-Year and Annual Plans. LED
lighting moved quickly from emerging technology to rapid scale up, as the Company pushed for rapid
adoption through multiple channels across the portfolio. This rapid adoption of high efficiency lighting
was a valuable opportunity for both customers and energy efficiency program offerings in Rhode Island.
The Company anticipates a saturated residential LED lighting market by the end of 2022, at which point
residential lighting will no longer be a significant driver of claimable savings or a cornerstone of
residential programs. The programs phased out residential upstream lighting in 2021 and in-home
installs will conclude in 2022.
When programs assess measure lives for energy efficiency products, they can be understood in two
ways: the usable life of the product, or the lifespan for which the utility energy efficiency program can
claim savings. The latter case is how the Company’s energy efficiency programs measure lifetime savings
and is often referred to as adjusted measure lives (AMLs).
AMLs seek to account for the decision customers make to purchase an energy efficient product and
whether the efficiency programs are still influencing that decision. This is done by measuring the
alternative efficiency technologies in the market, their saturation, prevalence, and trajectory. For
example, if today there were still a choice between incandescent lightbulbs and LED bulbs, then the
programs have the opportunity to convince customers to select a more efficient option and therefore
claim savings. If the market is moving rapidly towards only offering LED bulbs for customer purchase,
the Company must consider that a year from today or 5 years from today, customers may not have the
same choice of differing technologies. If LEDs are fully saturated in the market and are the only option to
purchase, PAs cannot claim they are causing those energy savings anymore because the market moved
to that point. Therefore, AMLs are adjusted down to account for this future loss of lesser efficient
products. Note that the long term presence of more efficient products in the market is due, in part, to
the Company’s efforts, and a mechanism should be created to give credit to the Company for its role in
transforming the market.
2.2 Residential Programs
In 2022, the Company will continue all residential programs offered in 2021, except for the ENERGY
STAR® Lighting program, while examining the potential of new technologies for inclusion in future years.
Table 3. Overview of 2022 Residential Energy Efficiency Programs
Program Name Program Description Changes for 2022
EnergyWise Single
Family
EnergyWise is a direct‐to‐customer in‐
home program that educates residents
on how their home can become more
• Equity reporting of minority
and/or women owned
Independent Insulation

23
Program Name Program Description Changes for 2022
(Funded by Electric
and Gas)
energy efficient. The program offers
single-family customers (buildings with
1-4 dwelling units) home energy
assessments, weatherization services,
and information regarding their energy
usage. The program addresses base
load electric use and heating, cooling,
and water heating energy loads in all
residential buildings. Participants
receive energy efficiency
recommendations and technical
assistance, as well as financial
incentives to replace inefficient items
such as lighting fixtures, appliances,
thermostats, and insulation. Upgrades
to efficient lighting, advanced power
strips, and water saving devices are
made if opportunities exist during the
initial visit. At the completion of the
assessment, the customer receives an
Energy Action Plan that indicates
additional energy savings
opportunities delivered through
National Grid’s various programs, as
well as solar opportunities provided
through statewide solar initiatives. The
program will continue to deliver
finance opportunities to customers,
such as the Heat Loan.
• Concierge service for electric
resistance heated homes to
facilitate the design and right
sizing of a heat pump electric
heating system installation.
• Continue workforce development
upskilling to support program
success.
• Introduce 100% weatherization
incentive for moderate income
customers, defined as households
at or below 80% state median
income.
• Optimize deeper energy upgrades
by pairing weatherization at time
of gas heating system upgrades
to encourage downsizing of
equipment, when possible.
Continue incentives research.
Multifamily
(Funded by Electric
and Gas)
This program offers comprehensive
energy services for market-rate
multifamily customers (buildings with
5+ dwelling units), including energy
assessments, incentives for heating
and domestic hot water systems,
cooling equipment, lighting, and
appliances. All types of multifamily
properties are eligible. A primary
point-of-contact is designated to
manage, and coordinate services
• Re-launch a tiered incentive
approach to encourage building
owners and facility managers to
include more residential unit
owners in multifamily projects.
• Provide greater customer choice
to the condominium market by
enabling customers to choose
their own ASHP contractor and

24
Program Name Program Description Changes for 2022
offered through the Company’s
existing portfolio. This program is
offered in conjunction with the C&I
Multifamily gas program where a site
may have a commercial meter or office
space but should be virtually
indistinguishable to the customer as
the Company’s single point of contact
will handle all program overlap and
offer a seamless customer experience.
assess the impact on
participation.
• Implement recommendations
from Multifamily Impact and
Process Evaluations.
• Leverage the Multifamily Census
and the Nonparticipant Study to
implement targeted marketing to
newly identified five to 20 unit
small- and medium-sized
multifamily owners not served to
date.
• Utilize customer research to
further explore new motivators
to increase customer
participation including Non-
Energy Impacts (NEIs).
• Explore financing opportunities
for property managers and
landlords to help reduce upfront
co-payment burdens.
• Explore different tactics that
provide opportunities to offer
relevant content in a more
personalized way to customers by
updating website landing pages,
partaking in community events,
and utilizing content hubs.
• Continue to provide professional
development opportunities for
multifamily energy auditors and
sub-contractors to improve sales
acumen and deepen savings.
• Provide clearer pre-
weatherization remediation
barrier resources to customers.

25
Program Name Program Description Changes for 2022
• Examine new technologies such
as monitoring-based
commissioning to help serve the
more unique needs of multifamily
buildings.
Residential New
Construction and
Building Energy
Code Support
(Funded by Electric
and Gas)
The Residential New Construction
(RNC) program promotes the
construction of high-performing
energy efficient single family,
multifamily, and income eligible
homes, as well as the education of
builders, tradespeople, designers, and
code officials.
• Provide a new HVAC consulting
support service (in coordination
with the ENERGY STAR HVAC
program) targeted to high
performance projects.
• Refresh program content related
to codes and standards to reflect
the State’s expected code
update.
Home Energy
Reports
(Funded by Electric
and Gas)
The Home Energy Reports (HER) program encourages energy efficiency behavior through personalized print and email reports and a seamlessly integrated website. Each of the communication channels displays energy consumption patterns and contains a normative comparison to similarly sized and similarly heated homes, as well as to an energy reduction goal for each customer. The Company will continue to deliver
Home Energy Reports that offer
enhanced feedback tools to inspire
customers to take actions that reduce
their energy consumption and increase
their participation in other energy
efficiency programs.
• Continue 1-click promotion
opportunities which were started
in 2021. Enables additional data
collection about customer
residence to customize future
marketing.
Residential
Consumer Products
(Funded by Electric
Only)
This program is run in collaboration
with other regional utilities to promote
the purchase of high efficiency
household appliances, including
kitchen appliances and electronics
carrying the ENERGY STAR® label. This
program trains retail sales staff about
• Roll out the ENERGY STAR® Retail
Products Platform (ESRPP) to
introduce ENERGY STAR most
efficient clothes washers and
refrigerators to the program.
26
Program Name Program Description Changes for 2022
products. The program also offers
refrigerator recycling.
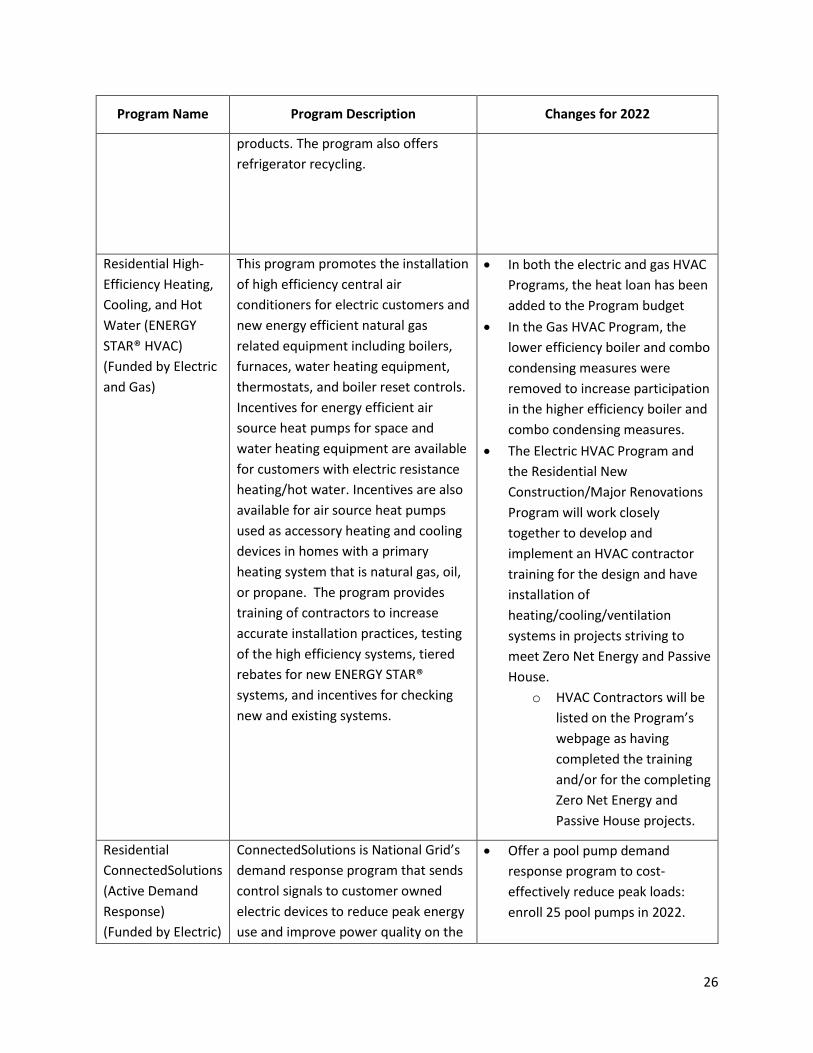
Residential High-
Efficiency Heating,
Cooling, and Hot
Water (ENERGY
STAR® HVAC)
(Funded by Electric
and Gas)
This program promotes the installation
of high efficiency central air
conditioners for electric customers and
new energy efficient natural gas
related equipment including boilers,
furnaces, water heating equipment,
thermostats, and boiler reset controls.
Incentives for energy efficient air
source heat pumps for space and
water heating equipment are available
for customers with electric resistance
heating/hot water. Incentives are also
available for air source heat pumps
used as accessory heating and cooling
devices in homes with a primary
heating system that is natural gas, oil,
or propane. The program provides
training of contractors to increase
accurate installation practices, testing
of the high efficiency systems, tiered
rebates for new ENERGY STAR®
systems, and incentives for checking
new and existing systems.
• In both the electric and gas HVAC
Programs, the heat loan has been
added to the Program budget
• In the Gas HVAC Program, the
lower efficiency boiler and combo
condensing measures were
removed to increase participation
in the higher efficiency boiler and
combo condensing measures.
• The Electric HVAC Program and
the Residential New
Construction/Major Renovations
Program will work closely
together to develop and
implement an HVAC contractor
training for the design and have
installation of
heating/cooling/ventilation
systems in projects striving to
meet Zero Net Energy and Passive
House.
o HVAC Contractors will be
listed on the Program’s
webpage as having
completed the training
and/or for the completing
Zero Net Energy and
Passive House projects.
Residential
ConnectedSolutions
(Active Demand
Response)
(Funded by Electric)
ConnectedSolutions is National Grid’s
demand response program that sends
control signals to customer owned
electric devices to reduce peak energy
use and improve power quality on the
• Offer a pool pump demand
response program to cost-
effectively reduce peak loads:
enroll 25 pool pumps in 2022.

27
Program Name Program Description Changes for 2022
grid. Consumers with eligible
controllable equipment (e.g. Smart
thermostats, batteries, and pool
pumps) can enroll to participate in
Connected Solutions. All electric
consumers are eligible to participate in
ConnectedSolutions.
2.3 Income Eligible Programs
The Company and the Parties want customers who meet the income eligibility requirements, have a
high proportion of energy burden and/or difficulty paying their electric bills to participate in, and benefit
from, the Company’s energy efficiency programs. Therefore, the income eligible sector of the customer
base is designated as a unique sector, and funding for this sector is subsidized by both non-income-
eligible residential customers and commercial and industrial customers using 14.3% of total
implementation funding for the electric programs, and 26.6% for natural gas programs. Total
implementation funding for income eligible electric programs increased 2.3% from 2021 levels from
$16.4M to $16.8M. Total implementation funding for income eligible gas programs increased 4.0% from
2021 levels from $9.0M to $9.3M in 2022.
Table 4. Overview of 2021 Income Eligible Programs
Program
Name Program Description Changes for 2022
Income
Eligible
Single Family
(Funded by
Electric and
Gas)
Income Eligible Single (IES)
Family Services are
delivered by local
Community Action Program
(CAP) agencies with
oversight provided by a Lead
Industry Partner. Three
levels of home energy
assessments are offered: (1)
lighting and appliance, (2)
heating and weatherization,
and (3) comprehensive
assessment. Customers who
qualify for the A-60 rate or
for the Low-Income Home
Energy Assistance Program
• Full implementation of a third-party support
model to expand CAP capacity for completing
weatherization jobs. This support will help ensure
customers have robust services across all CAP
territories and will improve the timelines for
completion of weatherization jobs.
• Rebuild and stabilize the number of qualified
AMP/weatherization and heating assessors. The
IES Program will prioritize assisting CAPs to train,
hire and retain assessors. Indicators of success
include training and hiring new assessors and
regularly tracking the number of assessors.

28
Program
Name Program Description Changes for 2022
(LIHEAP) are eligible to
receive all services and
equipment upgrades at no
cost.
• Implement a workforce development program
with a clear pathway to IES workforce
opportunities.
• Focused communication and engagement with
landlords on behalf of interested tenants. The
Company aims to increase renter participation, via
landlord outreach, to effectively improve the
equitable share of program resources
• Leverage the results from the research conducted
in 2021 on oil/propane heating systems to
decrease the amount of emergency oil/propane
heating systems replacements with like systems
and alternatively defer replacement in non-
emergency months with air source heat pump. In
parallel, funding sources will be sought out to fund
the fuel switching of oil/propane heating systems
to air source heat pumps heating systems.
• Develop a protocol for offering smart thermostats
to homes with central AC to improve efficiency
and operability and align with ConnectedSolutions
when possible. Develop a customer education
campaign on thermostat temperature control.
Income
Eligible
Multifamily
(Funded by
Electric and
Gas)
Comprehensive energy
services for multifamily
customers (buildings with 5+
dwelling units) that also
meet the criteria for
“income eligible” as defined
in Attachment 1 Residential
& IES Programs, Section 3.
Multifamily. These services
include energy assessments,
incentives for heating and
domestic hot water systems,
Air Source Heat Pumps,
cooling equipment, lighting,
and appliances. In most
cases, there are no costs to
• Launch a specific marketing and outreach
campaign for the income eligible multifamily
program.
• Leverage the Multifamily Census to identify new
prospective income eligible properties.
• Update the website landing page and program
brochure to increase ease and transparency of
program offerings.

29
Program
Name Program Description Changes for 2022
the customer for these
services as most income
eligible upgrades are
covered at 100%.
Income Eligible Multifamily
*Income Eligible Multifamily is combined with Multifamily above.
2.4 Commercial and Industrial Programs
The Commercial and Industrial (C&I) programs consistently offer highly cost-efficient savings. In
planning these programs, the Company continuously evaluates evolving customer needs and market
dynamics to develop enhancements that secure deeper, more comprehensive savings while evolving
program designs to drive market transformation across all customer classes and multiple end-uses.
The Company is observing a rapid reduction in claimable lighting savings due to a combination of market
saturation and evaluation impacts that limit savings due to the rapid market transformation underway.
Thus, in the 2022 plan, the Company has focused on new ways to help customers capture non-lighting
savings while continuing to help late adopters to leverage remaining lighting savings opportunities. The
specific priority measures are generally reflective of opportunities highlighted in the Market Potential
Study. The innovations and enhancements in this plan reflect many ideas and insights that have evolved
from the close collaboration with the EERMC and the EERMC consultant team, OER, the Division, and
our vendors, as well as customer feedback. Finally, the Company engaged a third-party consultant to
assess the barriers and opportunities associated with new and underutilized technologies listed in the
Market Potential Study, and this plan incorporates the early results of that assessment.
Specific areas of focus in 2022 to increase short- and long-term adoption of non-lighting:
• Implement recommendations from a 2021 study of market barriers and opportunities, which
explores measures highlighted in the Market Potential Study.
• Streamline and scale up the retro-commissioning process.
• Fund monitoring-based commissioning set-up costs.
• Scale up Small Business weatherization, leveraging additional funds provided by OER.
• Increase Active Demand Response (ADR) targets by 23% above 2021 estimates.
• Expand the focus on non-lighting measures and ADR within existing vendor-driven initiatives.
• Conduct targeted training activities for program delivery workforce on specific non-lighting
measures.
• Investigate several promising new measure offerings, such as enhanced rooftop unit (RTU)
controls and refrigerator leak repairs.

30
In addition to these focus areas, the plan describes the Company’s ongoing initiatives. Changes to these
program changes are summarized in Table 6 below and described in more detail in Attachment 2 C&I
Programs. Some initiatives focus on specific market segments, including industrial, grocery, chain
restaurant, and telecommunications. Other enhancements make participation easier or more attractive
(such as the Equipment and Systems Performance Optimization), provide attractive incentives for
specific customer classes (especially Small Business), and other enhancements are designed to reduce
barriers to comprehensive measure adoptions (e.g., the Whole Building Streamlined pathway in New
Construction introduced in 2021).
For each of the C&I programs listed in Table 5 below, an overview of 2022 offerings and changes is
provided in Table 6. For more detailed program descriptions and rationales for changes, please refer to
the program description tables in Attachment 2 C&I Programs.
Table 5. Commercial and Industrial Programs
Large Commercial and Industrial New Construction
Large Commercial and Industrial Retrofit
Small Business Direct Install
Connected Solutions (Active Demand Response)
Commercial and Industrial Multifamily Program
Table 6. Overview of 2022 Commercial and Industrial Energy Efficiency Programs
Program Name Program Description Changes for 2022
Large Commercial
and Industrial New
Construction and
Building Energy
Code Support
(Funded by Electric
and Gas)
This program encourages
energy efficiency in new
construction, major
renovations, planned
replacement of aging
equipment, and replacement
of failed equipment through
financial incentives and
technical assistance to
developers, manufacturers,
vendors, customers, and
design professionals. C&I
customers with annual
electric consumption greater
than 1,000,000 kWh per year
are eligible.
• Leverage available municipal electronic permitting information to identify trends and better characterize the State’s C&I new construction market.
• Update program elements to reflect the
state’s new energy code (adoption is
anticipated in early 2022)
• Revise the Performance Lighting Plus
initiative incentive offerings and
requirements in concert with
Massachusetts colleagues to ensure
greater ease of customer participation,
remove inconsistencies, and account for
changes in the lighting market. The
Company will collaborate with the lighting
sub-group of EERMC Consultants before
the offering is finalized and published to
customers.
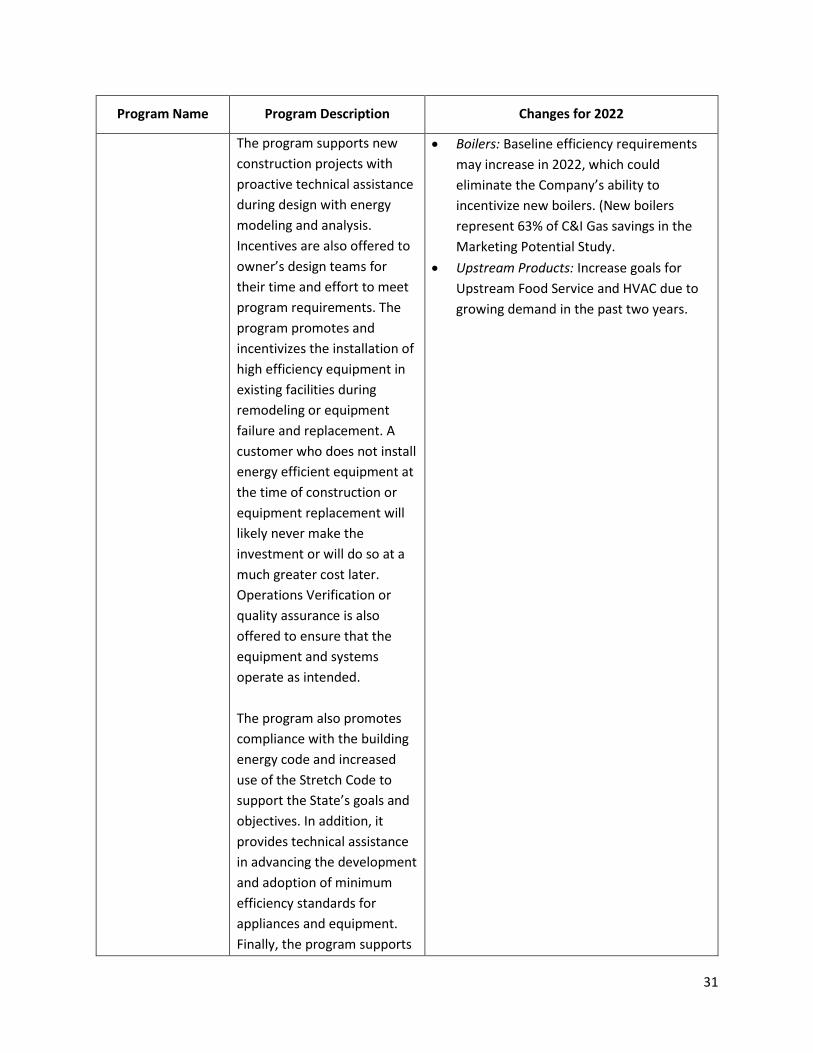
31
Program Name Program Description Changes for 2022
The program supports new
construction projects with
proactive technical assistance
during design with energy
modeling and analysis.
Incentives are also offered to
owner’s design teams for
their time and effort to meet
program requirements. The
program promotes and
incentivizes the installation of
high efficiency equipment in
existing facilities during
remodeling or equipment
failure and replacement. A
customer who does not install
energy efficient equipment at
the time of construction or
equipment replacement will
likely never make the
investment or will do so at a
much greater cost later.
Operations Verification or
quality assurance is also
offered to ensure that the
equipment and systems
operate as intended.
The program also promotes
compliance with the building
energy code and increased
use of the Stretch Code to
support the State’s goals and
objectives. In addition, it
provides technical assistance
in advancing the development
and adoption of minimum
efficiency standards for
appliances and equipment.
Finally, the program supports
• Boilers: Baseline efficiency requirements
may increase in 2022, which could
eliminate the Company’s ability to
incentivize new boilers. (New boilers
represent 63% of C&I Gas savings in the
Marketing Potential Study.
• Upstream Products: Increase goals for
Upstream Food Service and HVAC due to
growing demand in the past two years.
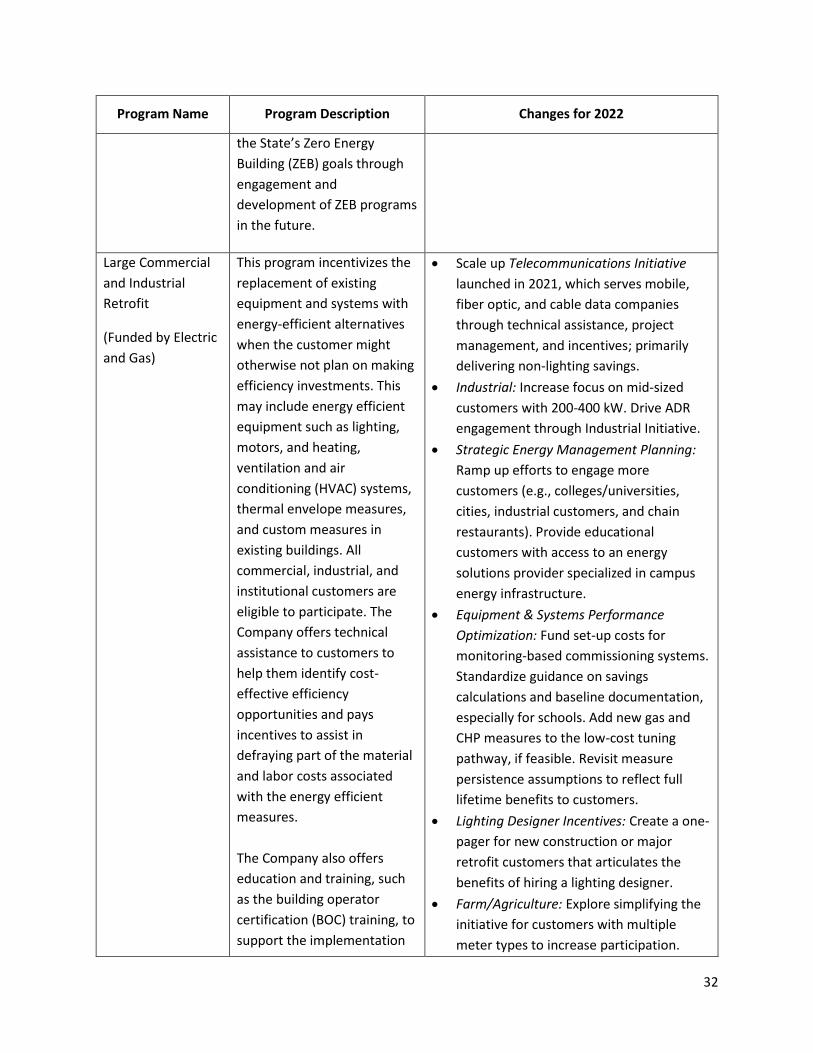
32
Program Name Program Description Changes for 2022
the State’s Zero Energy
Building (ZEB) goals through
engagement and
development of ZEB programs
in the future.
Large Commercial
and Industrial
Retrofit
(Funded by Electric
and Gas)
This program incentivizes the
replacement of existing
equipment and systems with
energy‐efficient alternatives
when the customer might
otherwise not plan on making
efficiency investments. This
may include energy efficient
equipment such as lighting,
motors, and heating,
ventilation and air
conditioning (HVAC) systems,
thermal envelope measures,
and custom measures in
existing buildings. All
commercial, industrial, and
institutional customers are
eligible to participate. The
Company offers technical
assistance to customers to
help them identify cost-
effective efficiency
opportunities and pays
incentives to assist in
defraying part of the material
and labor costs associated
with the energy efficient
measures.
The Company also offers
education and training, such
as the building operator
certification (BOC) training, to
support the implementation
• Scale up Telecommunications Initiative
launched in 2021, which serves mobile,
fiber optic, and cable data companies
through technical assistance, project
management, and incentives; primarily
delivering non-lighting savings.
• Industrial: Increase focus on mid-sized
customers with 200-400 kW. Drive ADR
engagement through Industrial Initiative.
• Strategic Energy Management Planning:
Ramp up efforts to engage more
customers (e.g., colleges/universities,
cities, industrial customers, and chain
restaurants). Provide educational
customers with access to an energy
solutions provider specialized in campus
energy infrastructure.
• Equipment & Systems Performance
Optimization: Fund set-up costs for
monitoring-based commissioning systems.
Standardize guidance on savings
calculations and baseline documentation,
especially for schools. Add new gas and
CHP measures to the low-cost tuning
pathway, if feasible. Revisit measure
persistence assumptions to reflect full
lifetime benefits to customers.
• Lighting Designer Incentives: Create a one-
pager for new construction or major
retrofit customers that articulates the
benefits of hiring a lighting designer.
• Farm/Agriculture: Explore simplifying the
initiative for customers with multiple
meter types to increase participation.

33
Program Name Program Description Changes for 2022
and adoption of energy
efficiency.
• Commercial Real Estate: Explore the
opportunity to develop a peer group of
local commercial real estate investors or
property managers interested in energy
efficiency. Determine the measure mix to
promote.
• Lodging: Support packaged terminal heat
pumps (PTHPs), potentially as a
prescriptive measure. Develop marketing
collateral explaining common measures
for lodging facilities (PTHP’s, guest room
energy management systems, lighting,
HVAC, kitchen equipment, etc.).
• Combined Heat & Power optimization:
Provide an additional incentive tier to CHP
systems that leverage biogas as a fuel
source and offer an Optimal Operation
and Maintenance Incentive for biogas CHP
systems to reduce economic barriers
associated with the installation, operation,
and maintenance.
• Combined Heat and Power: The Company
is currently working with a customer that
is pursuing an energy efficiency incentive
for a 13.3 megawatt combined heat and
power system that would provide
electricity, hot water, and CO2 to their
facility. The unique design of this system
will allow the customer to capture the
CO2 from the CHP and use the exhaust
CO2 for their business operation. The CO2
harvesting will substantially reduce the
greenhouse gas emissions from the CHP
plant, while also reducing or eliminating
the customers need to purchase food
quality CO2. The incentive cost per a unit
of energy is expected to be below $0.03
per lifetime kWh, making the project one

34
Program Name Program Description Changes for 2022
of the most cost-efficient offerings in the
energy efficiency portfolio.
• Upstream Products: Maintain strong
incentive support for Luminaire Level
Lighting Controls (LLLCs).
• Lighting: Savings will decline significantly
in 2022 due to a combination of slowing
demand (fewer LED conversion
opportunities remain) and evaluation
impacts that limit claimable savings as
LED’s have become much more common.
Net lifetime lighting savings, excluding
Small Business, will decline roughly 42%
compared to the 2021 plan.
Small Business
Direct Install
(Funded by Electric
and Gas)
This is a retrofit program that provides turn-key solutions to customers that consume less than 1,000,000 kWh per year. As part of the program, customers receive a free on‐ site energy assessment and a customized report detailing recommended energy efficient improvements. National Grid then completes retrofit installations at the customer’s convenience. The program serves small businesses of all types from restaurants to non‐profits, to small offices. National Grid pays up to 70% of installation and equipment costs and customers can finance the remaining share of the project over as many as 60 months (typically 24) on their electric bill, interest free, using the Small Business Revolving Loan Fund, providing funds are available.
• Maintain focus on non-lighting
opportunities (e.g., hood controls,
other HVAC controls) and savings.
• Dramatically increase the
weatherization volume for all fuel
types. This is possible due to a
$1,100,000 RGGI allocation to the
Company from OER for this purpose.
The Company has committed, at the
request of OER, to spend 50% of these
funds in areas hit hardest by COVID-19.
Many of these areas contain customers
who may be more comfortable
discussing our services in languages
other than English. The Company and
its vendor will deploy bilingual auditors.
In addition to English, the auditor will
speak either Spanish or Portuguese (the
most widely spoken languages besides
English in Rhode Island).
• Work to achieve 40% of installed
luminaires and retrofit kits with
integrated controls.
• Introduce a short, formal customer
satisfaction survey in 2022. In addition

35
Program Name Program Description Changes for 2022
to typical customer satisfaction
questions, the Company will ask an
optional question about whether the
business owner identifies as a woman,
minority, or LGBT. This will increase the
Company’s understanding the
customers it serves.
• Expand marketing to Woman and
Minority Owned Enterprises (WME).
This effort will extend beyond the WME
registered with the state and will seek
to develop relationships with groups
such as the RI Black Business
Association and the RI Hispanic
Chamber of Commerce to understand
how we can better serve these
businesses.
Commercial
ConnectedSolutions
(Active Demand
Response)
(Funded by Electric)
The Commercial Connected
Solutions or Active Demand
Response program is focused
on reducing peak electric
demand and associated costs
for large and small
commercial customers. All
customers, regardless of size
can participate. The program
is technology neutral and
provides a customer incentive
for verifiable shedding of load
in response to a signal or
communication from the
Company.
• At this time, no program changes are
anticipated related to Targeted or Daily
Dispatch for 2022. However, there has
been a shift in customer participation
from the Targeted Dispatch initiative to
the Daily Dispatch offering. The increased
enrollment in the Daily Dispatch is a
welcome trend, which generates greater
system benefits per curtailed MW than
the Target Dispatch offering. Additionally,
an ongoing review of summer 2021
performance may generate opportunities
to improve the program in 2022. However,
results are not expected until shortly after
the filing of this Plan. The Company will
share any proposed program changes
resulting from the evaluation with
stakeholders prior to implementing
changes.
• Coordinate with the Company’s other new
Energy Storage Initiatives, which test the
ability of grid-connected systems to
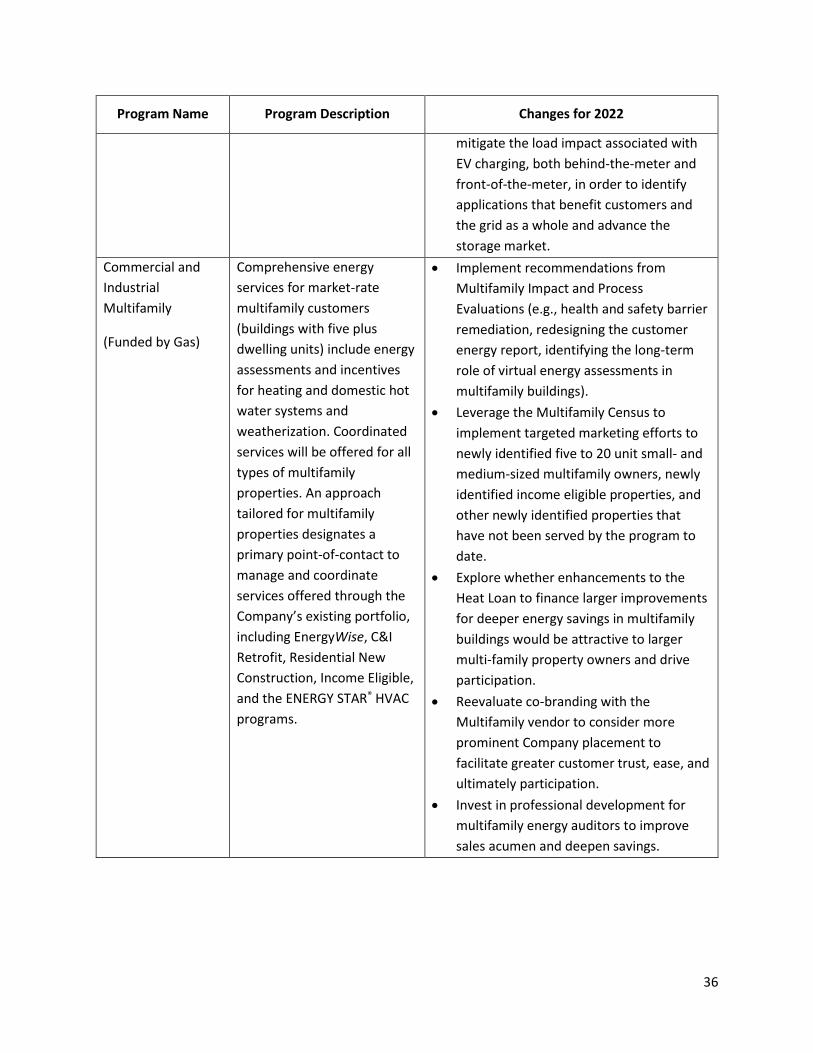
36
Program Name Program Description Changes for 2022
mitigate the load impact associated with
EV charging, both behind-the-meter and
front-of-the-meter, in order to identify
applications that benefit customers and
the grid as a whole and advance the
storage market.
Commercial and
Industrial
Multifamily
(Funded by Gas)
Comprehensive energy
services for market-rate
multifamily customers
(buildings with five plus
dwelling units) include energy
assessments and incentives
for heating and domestic hot
water systems and
weatherization. Coordinated
services will be offered for all
types of multifamily
properties. An approach
tailored for multifamily
properties designates a
primary point-of-contact to
manage and coordinate
services offered through the
Company’s existing portfolio,
including EnergyWise, C&I
Retrofit, Residential New
Construction, Income Eligible,
and the ENERGY STAR® HVAC
programs.
• Implement recommendations from
Multifamily Impact and Process
Evaluations (e.g., health and safety barrier
remediation, redesigning the customer
energy report, identifying the long-term
role of virtual energy assessments in
multifamily buildings).
• Leverage the Multifamily Census to
implement targeted marketing efforts to
newly identified five to 20 unit small- and
medium-sized multifamily owners, newly
identified income eligible properties, and
other newly identified properties that
have not been served by the program to
date.
• Explore whether enhancements to the
Heat Loan to finance larger improvements
for deeper energy savings in multifamily
buildings would be attractive to larger
multi-family property owners and drive
participation.
• Reevaluate co-branding with the
Multifamily vendor to consider more
prominent Company placement to
facilitate greater customer trust, ease, and
ultimately participation.
• Invest in professional development for
multifamily energy auditors to improve
sales acumen and deepen savings.

37
2.5 Cross-Cutting Programs
2.5.1 Equity
The Company is committed to using the rigor of the forthcoming Participation and Multifamily Census,
as well as the Nonparticipant Market Barriers Study, to understand how biases may have impacted
program and customer outcomes. The Company is not waiting for full study results to begin taking
action when clear opportunities to achieve greater equity in the programs exist. In 2022 the Company
commits to:
• Continuing to track and report renters and rental unit participation (see Section 12.2.1);
• Tracking and reporting on minority and women owned businesses that are providing services to
the EnergyWise program;
• Continuing to identify and encourage customers eligible for the discount rate to move to the
discount rate;24
• Encouraging participation in Residential Income Eligible Services (IES) for new customers
enrolled on the discount rate via a “welcome package”; and25
• Utilizing the Company’s new codes and standards advancement support service to target
nonparticipant markets across all sectors. While the program is in its infancy, this approach
overcomes traditional barriers of access by ensuring that efficiency levels are rising for all. See
Section 2.5.3 Cross Cutting Programs, Codes and Standards Support for more information.
• Also, as a part of National Grid’s 2021 Annual Energy Efficiency Program Plan (2021 Annual EE
Plan) and 2021-2023 Energy Efficiency Program Plan (2021-2023 EE Plan), the Company
committed to working with the RI Office of Energy Resources (OER) to co-host an Equity
Working Group (EWG). The objective of EWG was to provide the Company with
recommendations on incorporating equity into the planning, design, and delivery of the energy
efficiency programs. The EWG included over 20 people from diverse organizations and personal
backgrounds. EWG members met six times between May-August 2021 to discuss and
recommend strategies that could significantly increase equity in the energy efficiency programs.
A full report on the EWG’s activities can be found in Appendix 11. The EWG prioritized fourteen
recommendations, which the Company has used to develop additional, overarching equity-
related enhancements for this 2022 Annual Plan, as shown below in Table 7:
Table 7. EWG Recommendations and 2022 Plan Enhancements
24 See Attachment 1 Residential & IES Programs, Section 4 Income Eligible Services. 25 See Attachment 1 Residential & IES Programs, Section 4 Income Eligible Services.

38
Rhode Island Energy Efficiency Equity Working Group (EWG) Recommendations for
National Grid’s Annual Energy Efficiency Plan for 2022
1. Develop multilingual marketing and outreach materials. Use accessible language to target
audiences in each publication.
Current Activity Program collateral is provided in multiple languages on a case-by-case basis. The
Company has done research into how to reach multi-cultural customers better,
including a multi-cultural focused refrigerator recycling outreach campaign in
2020. The Company has also completed research on its primary customer
personas, which give consideration to educational backgrounds. The customer
personas have helped the Company understand what types of messaging may
resonate most with different customers.
2022
Enhancement(s)
1. All Residential and Income Eligible (IE) email and direct mail will more
consistently be translated into both English and Spanish.
2. Additionally, using lessons learned from the 2020 multi-cultural focused
refrigerator recycling outreach campaign, the Company will launch a new, larger
multi-cultural energy efficiency education campaign with the goal of increasing
energy efficiency awareness and program participation among multi-cultural
customers. Beginning with Hispanic customers, the effort will support the entire
customer journey using new linguistic and cultural elements for web pages,
customer toolkits, call-center support, and third-party partners. If the campaign
is successful, it will be expanded beyond Hispanic customers.
Determination of
Success
A comparison of baseline data against post campaign data.
2. Hire multilingual staff and partner with trusted leaders who have the same ethnic background
and that frequent popular community gathering places such as community centers and faith-
based organizations.
Current Activity The Company has three (3) Customer Advocates with multi-lingual capacity who
provide one-on-one individual assistance to customers through community-
based efforts.

39
2022
Enhancement(s)
1. Provide additional energy efficiency program training to the Company's
existing Customer Advocates so they can more effectively speak to the benefits
of the programs.
2. Hire an additional Customer Advocate that will focus on promoting the energy
efficiency programs. The new Customer Advocate will have community
organizing experience and will be multi-lingual. The Advocate will deliver energy
efficiency program information at community centers, faith-based organizations,
multi-family housing, and other community gathering places. The Customer
Advocate will leverage the expertise of existing community organizations that
serve diverse households. The new hire will occur by mid-2022, before summer
events begin.
Determination of
Success
1. The completion of additional energy efficiency training for the Company's
existing Customer Advocates.
2. The hire of a new Customer Advocate that will focus on energy efficiency.
3. The number of events the new Customer Advocate hosts/attends.
4. The number of customers reached at these events.
5. The number of customers that sign up for a home energy assessment or an
additional program related action as a direct result of the new Customer
Advocate's community-based outreach efforts.
3. Include in messaging that National Grid is not code enforcement so residents can feel more
comfortable.
Current Activity This information is not currently communicated in current program
communications.
2022
Enhancement(s)
1. Provide vendor call centers with scripts to help answer any customer/landlord
inquiries on this subject.
2. Consider adding the language to landlord outreach, as appropriate.
Determination of
Success
Whether or not a script has been provided to vendor call centers.
4. Develop age-appropriate marketing strategies to connect with various age groups that live in a
household such as utilizing social media, apps, and text messaging to reach new audiences and
help engage customers with their energy usage.
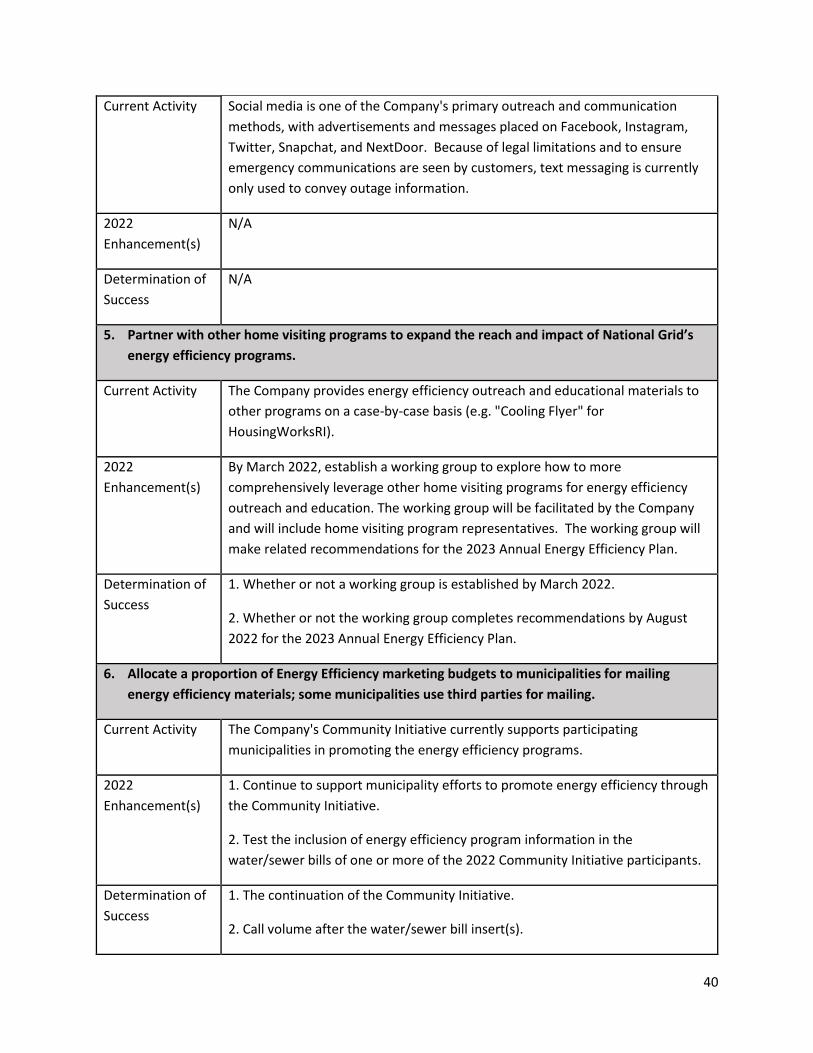
40
Current Activity Social media is one of the Company's primary outreach and communication
methods, with advertisements and messages placed on Facebook, Instagram,
Twitter, Snapchat, and NextDoor. Because of legal limitations and to ensure
emergency communications are seen by customers, text messaging is currently
only used to convey outage information.
2022
Enhancement(s)
N/A
Determination of
Success
N/A
5. Partner with other home visiting programs to expand the reach and impact of National Grid’s
energy efficiency programs.
Current Activity The Company provides energy efficiency outreach and educational materials to
other programs on a case-by-case basis (e.g. "Cooling Flyer" for
HousingWorksRI).
2022
Enhancement(s)
By March 2022, establish a working group to explore how to more
comprehensively leverage other home visiting programs for energy efficiency
outreach and education. The working group will be facilitated by the Company
and will include home visiting program representatives. The working group will
make related recommendations for the 2023 Annual Energy Efficiency Plan.
Determination of
Success
1. Whether or not a working group is established by March 2022.
2. Whether or not the working group completes recommendations by August
2022 for the 2023 Annual Energy Efficiency Plan.
6. Allocate a proportion of Energy Efficiency marketing budgets to municipalities for mailing
energy efficiency materials; some municipalities use third parties for mailing.
Current Activity The Company's Community Initiative currently supports participating
municipalities in promoting the energy efficiency programs.
2022
Enhancement(s)
1. Continue to support municipality efforts to promote energy efficiency through
the Community Initiative.
2. Test the inclusion of energy efficiency program information in the
water/sewer bills of one or more of the 2022 Community Initiative participants.
Determination of
Success
1. The continuation of the Community Initiative.
2. Call volume after the water/sewer bill insert(s).
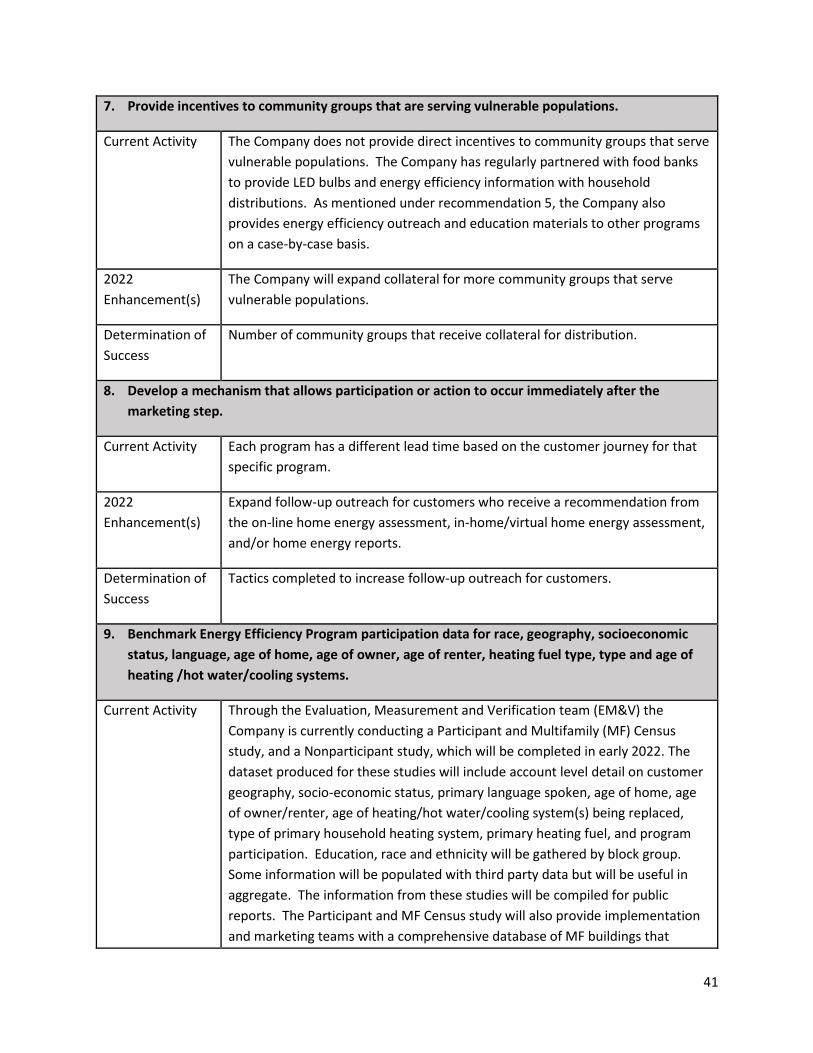
41
7. Provide incentives to community groups that are serving vulnerable populations.
Current Activity The Company does not provide direct incentives to community groups that serve
vulnerable populations. The Company has regularly partnered with food banks
to provide LED bulbs and energy efficiency information with household
distributions. As mentioned under recommendation 5, the Company also
provides energy efficiency outreach and education materials to other programs
on a case-by-case basis.
2022
Enhancement(s)
The Company will expand collateral for more community groups that serve
vulnerable populations.
Determination of
Success
Number of community groups that receive collateral for distribution.
8. Develop a mechanism that allows participation or action to occur immediately after the
marketing step.
Current Activity Each program has a different lead time based on the customer journey for that
specific program.
2022
Enhancement(s)
Expand follow-up outreach for customers who receive a recommendation from
the on-line home energy assessment, in-home/virtual home energy assessment,
and/or home energy reports.
Determination of
Success
Tactics completed to increase follow-up outreach for customers.
9. Benchmark Energy Efficiency Program participation data for race, geography, socioeconomic
status, language, age of home, age of owner, age of renter, heating fuel type, type and age of
heating /hot water/cooling systems.
Current Activity Through the Evaluation, Measurement and Verification team (EM&V) the
Company is currently conducting a Participant and Multifamily (MF) Census
study, and a Nonparticipant study, which will be completed in early 2022. The
dataset produced for these studies will include account level detail on customer
geography, socio-economic status, primary language spoken, age of home, age
of owner/renter, age of heating/hot water/cooling system(s) being replaced,
type of primary household heating system, primary heating fuel, and program
participation. Education, race and ethnicity will be gathered by block group.
Some information will be populated with third party data but will be useful in
aggregate. The information from these studies will be compiled for public
reports. The Participant and MF Census study will also provide implementation
and marketing teams with a comprehensive database of MF buildings that

42
includes building characteristics and an indicator of whether or not each building
has participated in a program.
2022
Enhancement(s)
1. Work with external stakeholders to determine if the data sets and each
related report should be refreshed on a regular basis.
2. Using internal data, establish a separate, regular report by Q2 2022 that
shows participation for the EnergyWise, Multifamily, and the Income Eligible
Single-Family programs at the zip code level. Utilize the report to target
outreach.
3. Continue gathering rental unit participation data and reporting on that
information quarterly at the “sector level meetings” with the RI Office of Energy
Resources, their Consultant Team, and the Division of Public Utilities and
Carriers.
Determination of
Success
1. Completion of the Participant, Nonparticipant, and MF Census studies.
2. Presentation of report results at a public meeting, such as the Energy
Efficiency Resource Management Council (EERMC).
3. Creation of a regular, zip code level participation report by Q2 2022 to target
outreach for the EnergyWise, MF, and Income Eligible Single-Family programs.
4. Whether or not rental unit participation data continues to be gathered and
reported quarterly at the “sector level meetings”.
10. Track late payments and shut offs.
Current Activity National Grid currently tracks this information and submits it to the RI PUC. The
report can be found at:
http://www.ripuc.ri.gov/eventsactions/docket/4770page.html, under Other
Compliance Reports, National Grid's Low-Income Monthly pursuant to Article II,
Section C.22.f. of the Amended Settlement Agreement.
2022
Enhancement(s)
None are needed since we already track this information and the data is public.
Determination of
Success
N/A
11. Align energy efficiency programs with healthcare and partner to achieve healthcare goals,
promote further engagement, and sharing health outcome and impact data.
Current Activity N/A

43
2022
Enhancement(s)
See recommendation 5. The working group will include healthcare home visiting
programs as a part of their discussions.
Determination of
Success
1. Whether or not a working group is established by March 2022.
2. Whether or not the working group completes recommendations by August
2022 for the 2023 Annual Energy Efficiency Plan.
12. Perform a full review of all HR policies and remove outdated policies that restrict hiring such as
background checks.
Current Activity Anyone that will be on a customers' property on the Company's behalf, or has
access to customer data, is required to go through a background check process.
There are different levels of background checks for different levels of customer
interaction. For individuals that go on customers' property, the background
check generally includes (among other things) a drug screening and an
assessment of criminal history. There is a “needs review" process any time there
is a negative finding. A candidate whose background check “needs review” is
notified so they can have the opportunity to provide further explanation.
Candidates can be granted an “exception” for any negative finding(s) that does
not directly impact the safety of a customer or their property.
2022
Enhancement(s)
The Company believes it has reached the right balance to ensure the safety of
customers and their property through its background check and exception
process.
Determination of
Success
N/A
13. Reduce barriers to professional development, as well as entry into the energy efficiency
workforce.
Current Activity One of the Company's lead vendors is collaborating with the RI Builders
Association, and their affiliate Residential Construction Workforce Partnership,
on their new training program for weatherization in September 2021. The lead
vendor's participation in these trainings will help ensure graduates are fully
prepared to work in the Energy Efficiency Programs.
2022
Enhancement(s)
1. Complete a workforce development needs assessment modeled after, and
building on, this report completed in MA: https://ma-eeac.org/wp-
content/uploads/Massachusetts-Energy-Efficiency-Workforce-Development-
FINAL-REPORT-CAREER-PROFILES.pdf. Data from the needs assessment can be

44
used to target future workforce development strategies, with diversity and
upskilling of a diverse workforce as major areas of focus.
2. Continue the lead vendor collaboration with the RI Builders Association, and
their affiliate Residential Construction Workforce Partnership, to complete at
least two additional Energy Efficiency Program related trainings in 2022. RI
Builders Association will report participant demographic information to the
Company from the September 2021 training. If necessary, the Company will
assist in the targeted recruitment of more diverse trainees for 2022. During
2022, the Company and/or its vendors will also collaborate with the RI Dept of
Human Services (DHS) on workforce development efforts from U.S. Department
of Energy training funds. RI DHS will also report participant demographic
information to the Company, so the Company can assist in the targeted
recruitment of more diverse trainees, if necessary.
Determination of
Success
1. Completion of a RI workforce development needs assessment by December
2022.
2. Collaboration with the RI Builders Association on two additional trainings in
2022.
3. Completion of recruitment assistance to RI Builders Association and RI DHS, if
necessary.
14. Collaborate with local diverse community organizations to train and certify potential workers
(Progresso Latino, Hispanic chamber of commerce, Cape Verdean community development).
Current Activity The Company and its vendors currently collaborate with entities such as Skills for
RI's Future; the University of RI's Energy Fellows program; and the RI Builders
Association and their affiliate Residential Construction Workforce Partnership,
for workforce development and training. Vendors and contractors also
complete additional on-the-job training for upskilling.
2022
Enhancement(s)
See recommendation 13. The new workforce development needs assessment,
as well as demographic reporting from the new trainings will help to determine
whether new recruitment and upskilling efforts with a focus on diversity are
necessary.
Determination of
Success
N/A

45
The Company will provide updates on the implementation of these enhancements in Q2 and Q4 of the
Company’s 2022 Annual Energy Efficiency Quarterly Reports to the Public Utilities Commission. The
EWG will continue to meet quarterly during 2022.
2.5.2 Community-Based Initiative
The Rhode Island Community-Based Initiative is designed to increase participation in the Rhode Island
Energy Efficiency commercial and residential energy efficiency programs and elevate local energy
priorities of a city or town. Cities and towns are selected to participate based on need, commitment
from the city or town, and the desire for a community-based approach to efficiency. The Company and
the municipality work to set pertinent community-based energy efficiency goals and align incentive
dollars for achieving the goals. Success of the Initiative is driven by advocacy from elected officials and
deep municipal engagement with residents and small businesses to achieve the established energy
efficiency goals. Examples of possible energy efficiency programs through which goals are identified:
• EnergyWise Home Energy Assessments
• Income Eligible Energy Assessments – single family and multifamily
• Refrigerator Recycling
• Replacement of inefficient cooling units with high-efficiency heat pumps
• Small Business Direct Install Program
• Demand Response
• Other: measures that may be underrepresented within the community
The Company provides marketing toolkits and trainings to municipalities to empower staff to promote
energy efficiency opportunities to their residents and small businesses. Frequent check-in calls allow the
communities to speak with the Company regarding progress toward goals, as well as conveyance of best
practices learned from other participating municipalities. The municipality promotes the Initiative
through events, engagement of key businesses, and local communications. In 2022, the Company will
also test energy efficiency program messaging through an insert in at least one participating city/town’s
water/sewer bill. At the end of the year, municipalities earn grant monies based on achieving the
agreed upon energy efficiency goals. These grant monies are then utilized for energy saving projects on
a municipal property, or on educational energy programs for community members.
In 2022, the emphasis for selecting the Cities to participate in the Program, in addition to energy
efficiency, will include elements of equity and workforce development. This will be an important
endeavor as COVID-19 greatly impacted the ability to engage with customers on the ground in the
community in 2020 and 2021.
In the first quarter of 2022, the Company will recruit Rhode Island municipalities based on opportunities
to increase residential and small business program participation. In addition, the Company will maintain
a dedicated engagement with the Aquidneck Island community to provide continuity in the ongoing
efficiency efforts in this region. As the Company has run this effort successfully since 2013, prior
participating communities may again be invited to participate.
46
Wi-Fi Thermostats and active demand response opportunities will remain a focus as the Company
strives to minimize energy peak demand. If such programs or efforts are part of a System Reliability Plan
(SRP) initiative, then they would follow SRP considerations noted in Section 5.1 and be detailed in the
System Reliability Plan. The initiative will continue to coordinate with the SRP team to determine
whether the RI System Data Portal (Portal), which was developed in 2018, could be a valuable tool for
the use of educating municipal leadership, as well as the Company in recruiting municipal participation.
Building upon the community-based approach stated above, the Company will also continue the
Community Solutions Initiative. This initiative targets geographic communities that encompass multiple
towns, industrial and technology parks, and other organized communities such as industry groupings
with common end uses (e.g., indoor agriculture). Community Solutions provides a single point of contact
for a given community to access all available Company solutions, including energy efficiency, EVs,
demand response, and emerging technologies.
Under this initiative, in 2020, quasi-public Quonset Development Corporation (QDC) signed a three-year
memorandum of understanding with the Company to provide businesses at the Quonset industrial park
in North Kingstown with access to enhanced incentives and technical services to identify and implement
energy efficiency projects. In 2020, these businesses received more than $2 million in incentives,
resulting in savings of over 8 million kWh and 120,000 therms per year, valued at over $1.4 million in
cost savings. Participating customers range from small industrial businesses to some of the largest
energy users in the state. In 2022, the Company will continue to provide energy-related trainings in
collaboration with QDC to expand program participation.
2.5.3 Codes and Standards Support
The Codes & Standards Technical Support Initiative (CSTS) develops and delivers technical guidance to a
wide variety of stakeholders to support energy efficiency policies applicable to the state’s building
sector. CSTS is a highly cost-effective initiative that unlocks sources of typically long-lived energy savings
and primarily benefits historical nonparticipants and customer segments considered “hard to reach”
(HTR) by raising efficiency baselines market wide. CSTS saves energy by: (1) increasing overall market
compliance with current minimum energy efficiency codes and standards, and (2) increasing the level of
energy efficiency required by such policies. The Company has successfully demonstrated both
approaches with respect to building energy codes.
In 2022, the Company will continue to support RI energy code compliance and advancement. CSTS
compliance support activities include training (classroom, webinar, and in-field), a “hotline” for project-
specific inquiries, and development and delivery of tools and resources that help fill market gaps. CSTS
has a broad reach, but our primary audiences are building code officials, design professionals (architects,
engineers), and builders/developers/contractors. CSTS will also continue to support energy code
advancement by developing and delivering proposals to strengthen the efficiency of the RI energy code.
The Company will submit these proposals for consideration during the state’s 2021 International Energy
Conservation Code (IECC) adoption process.
47
The Company also plans to extend these compliance and advancement support strategies to better
support appliance and equipment standards. CSTS will pursue opportunities to provide technical
guidance at the state and federal levels to advance appliance and equipment standards impacting RI
energy consumption. At the state level, CSTS will provide technical guidance for product standards that
have been adopted in other states but were excluded in RI's new package of product standards, such as
air purifiers and high color rendering index (CRI) fluorescent lamps. In preparation for implementation of
this new package of standards in 2023, CSTS will also coordinate with OER to investigate the opportunity
to support compliance with these standards, and potentially federal appliance standards, through a
similar approach to that currently employed for energy codes.
While active technical support of codes & standards aligns very well with stakeholder goals for this Plan
– most notably Innovation/Diversification of programs, Cost-efficiency, and Equity – there is currently no
agreed upon mechanism in place for the Company to claim savings for the energy savings resulting from
any of the CSTS activities described in this section. This constrains the Company’s ability to pursue this
promising opportunity to better align the portfolio with stakeholder goals. The Company will continue to
coordinate with stakeholders to develop a clear path to attribution or alternative means of receiving
credit towards its savings goals for these activities. Reaching an agreement will both guide future CSTS
activities and enable the Company to be compensated for services it is currently delivering in the
absence of such mechanism. Upon completion of the state’s current building code update process, the
Company will pursue compensation for code change proposals it developed and submitted in 2019 that
were successfully incorporated into (and increase the energy saved by) the state’s new energy code. The
Company will also pursue savings credit for the technical guidance it provided in support of the package
of appliance and equipment standards adopted by the state in 2021. The state’s new energy code and
product standards are both anticipated to produce material energy savings starting in 2023.
2.5.4 Workforce Development
In 2022, the Company plans to maintain its historical workforce development investments (see Table 8)
while also funding upskilling in specific areas where there is high confidence in delivering ratepayer
benefits (see Table 9). These investments drive customer benefits by improving installation quality and
increasing the industry’s capacity to install non-lighting measures in the near term while also
accelerating industry adoption of the advanced controls and high-efficiency HVAC systems identified in
the Market Potential Study as areas for growth.
The Company will also complete a Rhode Island Workforce Development Needs Assessment outlined in
Attachment 3, Evaluation, Measurement, and Verification, to ensure future workforce development
investments are preparing the present and future labor pool to meet the state’s energy efficiency goals.
Table 8 below shows continued workforce development activities, with 2022 budget levels providing a
steady level of service compared to 2021. These efforts will be supplemented by sales and marketing
focused training to program vendor/subcontractor sales and technical staff focused on promoting
deeper savings measures to customers.

48
Table 8 Continued Workforce Development Activities
Sector WFD
activity
Description Target
audience
Estimated
individuals
reached
2022
budget
Res HVAC
Check
trainings
HVAC installation best practices
training delivered as part of the
HVAC program
HVAC
technicians
70 $39,400
Res +
IE
Zero Net
Energy
training
High performance building best
practices training delivered as
part of the Residential New
Construction program
Design
professionals
builders /
contractors
200 $20,000
IE Miscellane
ous IE
training
Training on topics such as WiFi
thermostats and ASHPs delivered
as part of the Income Eligible
Single Family program
Weatherization
contractors,
auditors
20 $50,000
C&I Zero Net
Energy
training
High performance building best
practices training delivered as
part of the C&I New Construction
and Major Renovations program
Design
professionals
developers /
contractors
200 $20,000
C&I BOC
training
Building O&M best practices
training delivered as part of the
C&I Retrofit program
Facility
managers,
building
maintenance
staff
25 $37,000
All
sector
s
Codes &
Standards –
code
compliance
training
A suite of services which includes
training sessions (classroom,
webinar, and in-field), project-
specific “hotline” support, and
development and delivery of
tools and resources to fill
industry gaps.
Code officials,
design
professionals,
builders /
developers /
contractors
500 (note:
this only
includes
training
participant
s)
$200,000
Residential workforce development will focus on continued collaboration between the Company and its
vendors with entities such as Skills for RI's Future; the University of RI's Energy Fellows program; and the
RI Builders Association and their affiliate Residential Construction Workforce Partnership. To help
ensure new trainees come from diverse backgrounds, RI Builders Association has agreed to report
participant demographic information with the Company from a September 2021 weatherization training
and, if necessary, the Company will assist in the targeted recruitment of more diverse trainees for two
similar trainings in 2022. During 2022, the Company and/or its vendors will also collaborate with the RI
Dept of Human Services (DHS) on workforce development efforts from U.S. Department of Energy
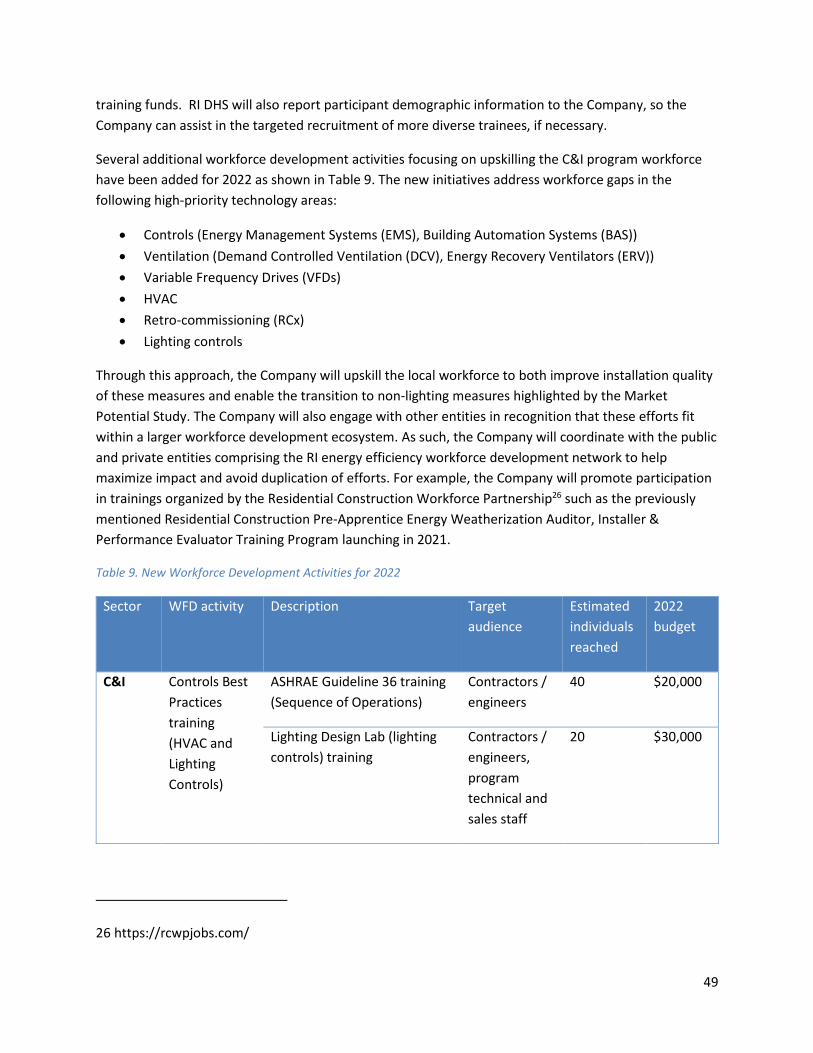
49
training funds. RI DHS will also report participant demographic information to the Company, so the
Company can assist in the targeted recruitment of more diverse trainees, if necessary.
Several additional workforce development activities focusing on upskilling the C&I program workforce
have been added for 2022 as shown in Table 9. The new initiatives address workforce gaps in the
following high-priority technology areas:
• Controls (Energy Management Systems (EMS), Building Automation Systems (BAS))
• Ventilation (Demand Controlled Ventilation (DCV), Energy Recovery Ventilators (ERV))
• Variable Frequency Drives (VFDs)
• HVAC
• Retro-commissioning (RCx)
• Lighting controls
Through this approach, the Company will upskill the local workforce to both improve installation quality
of these measures and enable the transition to non-lighting measures highlighted by the Market
Potential Study. The Company will also engage with other entities in recognition that these efforts fit
within a larger workforce development ecosystem. As such, the Company will coordinate with the public
and private entities comprising the RI energy efficiency workforce development network to help
maximize impact and avoid duplication of efforts. For example, the Company will promote participation
in trainings organized by the Residential Construction Workforce Partnership26 such as the previously
mentioned Residential Construction Pre-Apprentice Energy Weatherization Auditor, Installer &
Performance Evaluator Training Program launching in 2021.
Table 9. New Workforce Development Activities for 2022
Sector WFD activity Description Target
audience
Estimated
individuals
reached
2022
budget
C&I Controls Best
Practices
training
(HVAC and
Lighting
Controls)
ASHRAE Guideline 36 training
(Sequence of Operations)
Contractors /
engineers
40 $20,000
Lighting Design Lab (lighting
controls) training
Contractors /
engineers,
program
technical and
sales staff
20 $30,000
26 https://rcwpjobs.com/

50
C&I Manufacturer-
led trainings
The Company will coordinate and promote
participation in existing manufacturer trainings
in the following technology areas.
• Building / HVAC Controls (e.g. Johnson
Controls BAS and HVAC training courses)
• DCV and ERV (e.g. Trane Engineers
Newsletter Live Series)
• VFDs (e.g. Danfoss Drives training)
• HVAC (e.g. Mitsubishi heat pump training)
• Lighting Controls (e.g. Acuity wired lighting
systems course)
100 $50,000
C&I Industry
certifications
The Company will increase number of local
certified individuals by sponsoring certifications
in the following technology areas; sub-bullets
provide example certifications.
• Controls
o ISA Building Automation Systems
o BOMA Building Automation
Systems Certificate
• HVAC
o NATE Level 4
o ASHRAE Certified HVAC Designer
• RCx
o ASHRAE Building Commissioning
Professional
125 $125,000
2.6 Participation
Each program described in this Plan seeks to drive customer participation to deliver the benefits of
energy efficiency to customers throughout Rhode Island. The Plan is designed to provide equitable
access to savings and programs across sectors and market segments. For 2022, the Company will
continue to plan and report participation in ‘net’ terms, which takes into account free-ridership and
spillover, which are commonly referred to as net-to-gross factors. This method of accounting for
participants aligns participation numbers with energy savings numbers, which are already recorded in
net terms. This approach provides a more accurate connection between energy savings and the number
of customers who benefit from efficiency programs. Planned participation estimates are included in
Attachment 5 Electric EE Program Tables, Table E-7 and Attachment 6 Gas EE Program Tables, Table G-7.
The following table describes the definitions for how National Grid projects, tracks, and reports
participation in the efficiency programs.
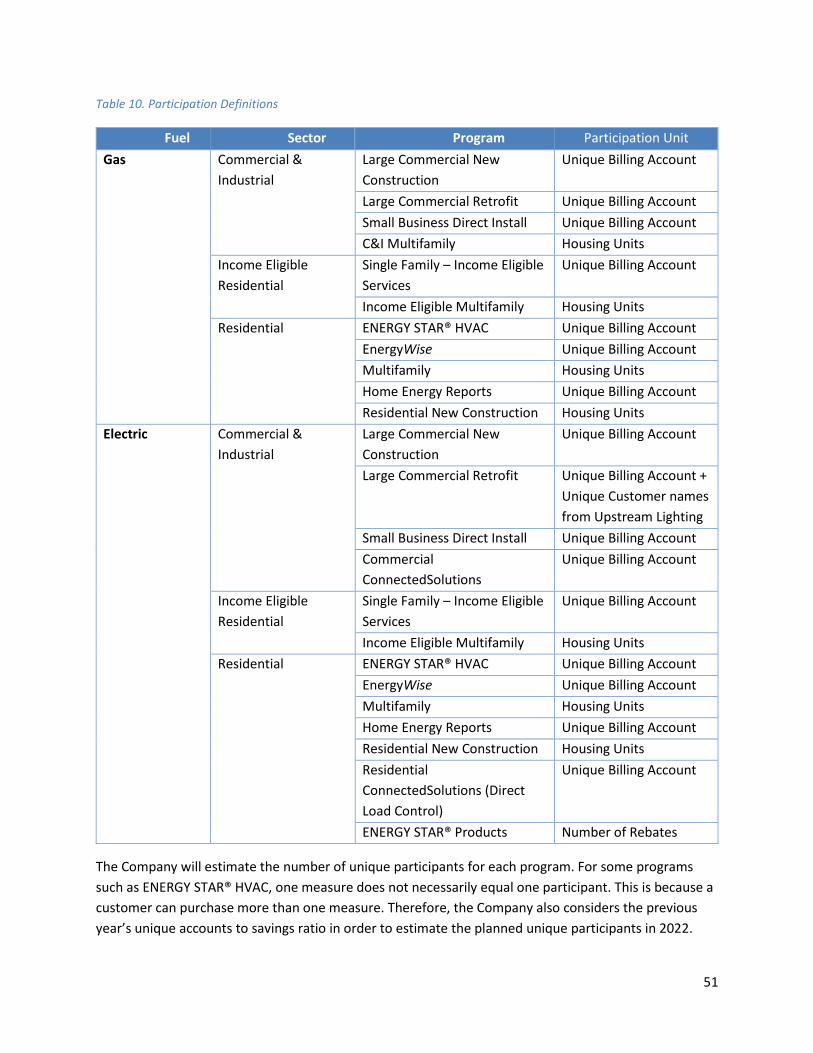
51
Table 10. Participation Definitions
Fuel Sector Program Participation Unit
Gas Commercial &
Industrial
Large Commercial New
Construction
Unique Billing Account
Large Commercial Retrofit Unique Billing Account
Small Business Direct Install Unique Billing Account
C&I Multifamily Housing Units
Income Eligible
Residential
Single Family – Income Eligible
Services
Unique Billing Account
Income Eligible Multifamily Housing Units
Residential ENERGY STAR® HVAC Unique Billing Account
EnergyWise Unique Billing Account
Multifamily Housing Units
Home Energy Reports Unique Billing Account
Residential New Construction Housing Units
Electric Commercial &
Industrial
Large Commercial New
Construction
Unique Billing Account
Large Commercial Retrofit Unique Billing Account +
Unique Customer names
from Upstream Lighting
Small Business Direct Install Unique Billing Account
Commercial
ConnectedSolutions
Unique Billing Account
Income Eligible
Residential
Single Family – Income Eligible
Services
Unique Billing Account
Income Eligible Multifamily Housing Units
Residential ENERGY STAR® HVAC Unique Billing Account
EnergyWise Unique Billing Account
Multifamily Housing Units
Home Energy Reports Unique Billing Account
Residential New Construction Housing Units
Residential
ConnectedSolutions (Direct
Load Control)
Unique Billing Account
ENERGY STAR® Products Number of Rebates
The Company will estimate the number of unique participants for each program. For some programs
such as ENERGY STAR® HVAC, one measure does not necessarily equal one participant. This is because a
customer can purchase more than one measure. Therefore, the Company also considers the previous
year’s unique accounts to savings ratio in order to estimate the planned unique participants in 2022.

52
This method allows for a better estimation of unique participants but can make it more difficult to
compare planned numbers across years.
In 2022, the Company will continue to drive participation through two main pathways – targeted
programs and broad-based programs. Targeted programs include the Company’s retrofit, new
construction, product rebate, and small business initiatives. These programs serve to drive deeper
savings to targeted customer segments and offer a wide array of energy efficiency measures. The
Company also reaches broad participation by promoting products upstream and through Home Energy
Reports. These broader based programs provide value by reaching a wide and diverse set of customers,
helping to provide more customers with access to energy savings, as well as acting as a gateway to drive
participation in other Company energy efficiency programs.
The Company has made steady progress with reaching new participants each year. From 2012-2020 the
Company served approximately 60% of its electric customers and 31% of its gas customers from its
targeted programs at least once (this analysis has removed duplicate participation across programs and
across years from 2012-2020). When Home Energy Reports and C&I upstream lighting participation are
added to these counts, a total of 90% of electric customers and 91% of gas customers participated over
this period. Home Energy Reports are included here because the program offers significant savings and
benefits to customers as well as drives customers to participate in other energy efficiency programs.
Planned In the 2022 Year-End report, the Company will remove any participation overlap to report
unique 2022 participants. See 2020 Year-end Report for further details on participation through 2020.
In 2022, the Company will continue its efforts to reach customers that have never participated in its
energy efficiency programs. The Company will also continue its efforts to reach customers that have
previously participated in its energy efficiency programs but who can still benefit from the installation of
additional energy efficiency measures. Many unique participants are still eligible for additional
programs. For example, a participant in the EnergyWise Single Family program may participate in the
HVAC program. The Company will continue to deliver innovative strategies to increase customer
participation and reach customer segments that are historically underrepresented. Also, the Company
will continue to track participation trends and will again provide a detailed analysis in its 2022 Year-End
Report showing additive and cumulative portfolio participation.
3 Pilots, Demonstrations, and Assessments
In accordance with Docket 4600-A PUC Guidance Document, this Plan includes a description of
Commercial, Industrial, and Residential pilots, demonstrations and assessments in Attachment 8. Please
refer to Attachment 8 Pilots, Demonstrations & Assessments for additional detail.
As defined in the Docket 4600-A Guidance Document, “A pilot is a small-scale, targeted program that is
limited in scope, time, and spending and is designed to test the feasibility of a future program or rate
design. It is incumbent upon the proponent of a pilot to define these limits in a proposal for PUC review.
Ideally, a pilot can provide net benefits and achieve goals, but the primary design and value of a pilot is

53
to test rather than to achieve.”27 Pilots are designed to explore technologies and approaches to energy
management not included in the core energy efficiency programs (Residential, Commercial and
Industrial, and Multifamily) and that could potentially become a new, standalone program.
Pilots enable the Company to test technologies, new energy management strategies, customer
adoption, workforce adoption, and cost effectiveness of emerging and new technologies. While pilots
are designed to test standalone programs, pilot results may conclude that a standalone program is not
recommended or that certain aspects of the pilot should be offered within existing programs. It is likely
that pilots will require a long-term commitment and broader set of stakeholder input, given the scope of
adding a new core program to the Company portfolio. Savings associated with Pilots will not contribute
to shareholder incentives. Pilots may be evaluated with either an independent or a vendor evaluation.
For actions in this Plan that do not fall under Docket 4600-A PUC Guidance Document’s definition of
pilots, the Company includes demonstrations and assessments within the programs. A demonstration
will test the feasibility of a new product or offering for inclusion in existing programs. It is generally
expected that demonstrations will be less time and resource intensive than pilots, since generally there
is greater certainty around a narrow, incremental idea added to a program rather than a totally new set
of offerings. Savings associated with demonstration projects may contribute to shareholder incentives.
Demonstrations may be evaluated with either an independent or a vendor evaluation. An assessment
will be deployed for solutions that address a particular gap or program need but have significant
uncertainty around the effectiveness or potential of the solution to realize savings. Because of the
uncertainty, assessments will not include field demonstrations or customer installations. Instead,
assessments will focus on information gathering to equip Company staff to make a more informed
decision of whether and how to proceed with the idea. It is possible that an assessment could
recommend further demonstration of the idea or determine the solution should exit the review process.
Savings associated with assessments may not contribute to shareholder incentives. Assessments may be
evaluated with an independent evaluation, vendor evaluation, or internal review.
The Company will continue to seek out opportunities to identify, test, analyze, and deliver new creative
and innovative solutions and services that are technically feasible, desirable by customers, and viable for
inclusion in the portfolio. The Company plans to explore logical program extensions like new or
substitute measures, adaptations to program or delivery approaches to drive incremental improvement,
and completely new offers. The Company will use evaluation studies, customer and market research,
the Market Potential Study, and stakeholder feedback to identify areas for potential exploration and will
prioritize efforts based on likelihood of success, speed of development, and program need. Each
customer segment and savings technology has unique barriers to adoption and will be assessed on a
situational basis.
The Company will coordinate efforts with internal and external stakeholders, such as Evaluation,
Measurement, and Verification (EM&V), Customer Energy Management (CEM), OER, and EERMC, at
various points in the development process to ensure appropriately rigorous evaluation and attention is
27 Docket 4600-A PUC Guidance Document, October 27, 2017. Section V. Pilots.

54
given to each pilot, demonstration, and assessment. Updates will be provided to OER and the EERMC
consultant team on a quarterly basis and will solicit input during the Company’s collaborative annual
planning process.
The Company will continue to systematically review opportunities to add to the portfolio through a
consistent and transparent process. Please refer to Attachment 8 for details on evaluations for pilots,
demonstrations and assessments. The Company anticipates that calendar year 2022 will be the last year
in which the gas demand response pilot is included as a pilot offering. The Company will assess the
viability of this approach to meeting capacity constraints as part of Non-Pipeline Alternative (NPA)
program development that is underway through the Company’s SRP pathway.
4 Evaluation Measurement and Verification Plan
EM&V provides independent verification of impacts to ensure that savings and benefits claimed by the
Company through its energy efficiency programs are accurate and credible. EM&V also provides insight
into market characteristics and guidance on energy efficiency program design to improve the delivery of
cost-effective programs.
To verify the impacts of programs on energy savings, the Company hires independent third-party
consulting firms to regularly conduct evaluation studies as part of its evaluation, measurement, and
verification process. These evaluations incorporate industry standard methods such as engineering
analysis, metering analysis, billing analysis, site visits, surveys, and market studies to realize the actual
energy savings of a measure. The EERMC and OER provide direct oversight of each evaluation study
conducted. Every year, the results of the studies are used to update the benefit-cost calculations during
planning. Attachment 3 EM&V Plan lists the evaluations that have occurred since 2010 that are still
being used and their influence on program planning. All completed evaluations are submitted
electronically to the PUC; final reports of evaluations completed in prior years are available in the
dockets for previous years, on the EERMC website28, or upon request.
Additionally, the EM&V Plan for 2022 is presented in Attachment 3 and includes brief descriptions of
each of the proposed studies. The areas proposed for study in 2022 were chosen based on a number of
factors: the relative amount of savings in that program or end use, the vintage of the most recent
evaluation study, the relative precision of the recent evaluation study, recommendations from
previously completed studies, and the available evaluation budget. This list may be added to as the year
progresses and different evaluation priorities are identified. In particular, the parties will consider the
value of using evaluations from other jurisdictions as well as adding Rhode Island-specific impact or
process evaluations, as appropriate, that will help inform the Company’s efforts towards achieving the
goals of least cost procurement.
28 https://rieermc.ri.gov/plans-reports/evaluation-studies/

55
The Energy Efficiency Program Evaluation Study, conducted by a third-party vendor hired by OER, was
completed in 2021. The EM&V Plan for 2022 is responsive to the recommendations of that study;
further details can be found in Attachment 3, Section 6.
5 Coordination with Other Energy Policies and Programs
Continuing to provide the best value to Rhode Island customers necessitates that the Company
coordinate with other parts of the energy system, rather than pursuing savings programs and strategies
in isolation. In 2022 the Company will continue to seek ways to implement the energy efficiency
portfolio of programs in coordination with other Company filings and activities, described below. Efforts
have also been taken to ensure the 2022 Annual Plan is aligned with relevant state policies and
objectives, with specific coordination opportunities detailed below.
5.1 System Reliability Procurement
During the 2022 program year, the Company’s energy efficiency programs will continue their
longstanding coordination with SRP plans and filings, including the development of the Non-Pipelines
Alternative (NPA) program within the SRP pathway. Energy efficiency, among other demand side
management solutions, has potential to be a component to meet a variety of situations in which NWAs
and NPAs are considered. SRP filings will continue to be made separately from the energy efficiency
filings while any charge associated with SRP will be accounted for in the energy efficiency charge. One
opportunity for 2022 will be to test location-targeted marketing in heavily loaded feeder areas.
5.2 Advanced Metering Functionality (AMF), Grid Modernization (Grid Mod), Rate
Cases, Renewables
On January 21, 2021, the Company filed its proposed Grid Modernization Plan and Updated Advanced
Metering Functionality Business Case in RI PUC Docket 511429 and 511330, respectively. As of the date of
this Plan, the RI PUC has stayed both dockets pending further consideration following the issuance of a
final Order in Division Docket No. D-21-09, Petition for Authority to Transfer Ownership of the
Narragansett Electric Company to PPL Rhode Island Holdings, LLC, Petition of PPL Corporation, PPL
Rhode Island Holdings, LLC, National Grid USA, and the Narragansett Electric Company.31 The teams
working on the energy efficiency programs, Grid Mod, and AMF will continue to work closely to ensure
the Company has a comprehensive view of the benefits and impacts of the roll out of grid modernization
and AMF.
29 In re: The Narragansett Electric Company d/b/a National Grid – Grid Modernization Plan. RI PUC Docket 5114: http://www.ripuc.ri.gov/eventsactions/docket/5114page.html
30 In re: The Narragansett Electric Company d/b/a National Grid – Updated Advanced Metering Functionality Business Case. RI PUC Docket 5113: http://www.ripuc.ri.gov/eventsactions/docket/5113page.html
31 RI PUC Docket 5113, Order 24089: http://www.ripuc.ri.gov/eventsactions/docket/5113-5114-NGrid-Ord24089%20(7-14-2021).pdf:

56
These investments will provide increased visibility into customer usage (from AMF) and insights into the
operation of the local distribution system (from grid modernization investments, including AMF). This
will allow for improved efficiency program marketing, more personalized savings offers, more targeted
measure deployment, and optimization of demand side resources. The Energy Efficiency team will
continue to coordinate with the GMP and AMF teams to ensure that the benefits estimated in the GMP
and AMF Benefit Cost Analyses (BCA) would constitute a new baseline of savings upon which future
energy efficiency goals are based and to ensure energy savings are not double counted. In addition to
the calculation of benefits, the Company will also examine any possible overlap of costs. If AMF is
launched, the Company still anticipates energy efficiency programs would continue to offer customer
incentives for in-home/in-business technologies, such as Wi-Fi programmable thermostats and smart
appliances to drive the achievement of additional incremental energy savings to meet annual energy
savings targets. The Company recognizes that the future energy efficiency plans would include the total
participant costs (i.e., ratepayer-funded rebates and customer contribution costs) associated with such
measures in its BCA methodology.
While the Energy Efficiency, GMP, and AMF teams have been coordinating closely through the filing
process, the need to bifurcate savings and costs associated with these plans would not arise until grid
modernization and AMF investments are approved, deployment begins, and data is collected and
visualized for customers in later years. Therefore, the energy efficiency team anticipates that should the
PUC approve AMF, the important overlap and distinction between GMP, AMF, and energy efficiency
would most likely not arise until after the 2022 Annual Plan is implemented. At that point the Company
anticipates undertaking a more robust discussion of evaluation methodologies and other key
considerations. In the interim, the Company will continue to work with stakeholders to ensure all are
aware of any future transition.
5.3 Act on Climate
The Act on Climate Legislation was signed into law by Governor McKee in April 2021. This legislation
accelerates the timeline of legislated GHG reductions in RI and mandates the specified reduction levels.
Specifically, 10% below 1990 levels by 2020; 45% below 1990 levels by 2030 (previously 2035); 80%
below 1990 levels by 2040 (previously 2050); and net-zero emissions by 2050 (new). Moving forward,
the Company’s energy efficiency programs will continue to set energy reduction goals that contribute to
these statewide GHG emissions reduction targets and will report GHG emissions reductions in quarterly
and annual reports, consistent with the 2021 Annual Plan.
5.3.1 Electrification, Heat Pumps, and Delivered Fuel Policy and Objectives
The Company plans to continue to offer enhanced incentives for customers installing heat pumps using
allocated RGGI funds from OER, to the degree that those funds extend into 2022. At this time the
Company does not have visibility to a direct regulatory pathway to the promotion of electrification for
delivered fuel customers by way of electric or gas system benefit charge collections.

57
5.4 Codes and Standards Program and Accounting for New Codes and Standards
With an update to the state energy code (to the 2018 International Energy Conservation Code (IECC))
projected in early 2022, savings opportunity will be reduced due to rising baselines.
6 Multi-Year Strategies
In the revised LCP Standards adopted by the PUC in Docket 5015, the PUC directed the Company to
identify investment strategies for which implementation and budget requests (or revenue collection) are
expected to span multiple years. In addition to the budgets and targets required for the rest of the
portfolio, the PUC directed that the Company may separately provide budgets and goals for multi-year
strategies. The requirement applies to both the Annual and Three-Year Energy Efficiency Plans.
6.1 Combined Heat and Power
Combined Heat and Power: The Company is currently working with a customer that is pursuing an
energy efficiency incentive for a 13.3 megawatt combined heat and power system that would provide
electricity, hot water, and CO2 to their facility. The unique design of this CHP will allow the customer to
capture the CO2 from the CHP system and use the gas for their business operation. The CO2 harvesting
will substantially reduce the environmental emissions from the CHP plant, while also reducing or
eliminating the customers' need to purchase CO2 for their horticulture operation. The incentive cost per
unit of energy is expected to be below $0.03 per lifetime kWh, making the project one of the most cost-
efficient offerings in the energy efficiency portfolio. The project is expected to be operational by late
2022, pending PUC approval. Should this project not be approved by the PUC, funds for this project
would be reallocated to other measures in the C&I portfolio, potentially at a higher cost per unit energy.
A minimum of 20% of the energy efficiency incentive payment will be held until commissioning is
complete, anticipated in 2023.32 In the event the PUC disallows the energy efficiency funding for the CHP
project, the Company will perform additional analysis to determine how the CHP funding should be
reallocated within the C&I portfolio.
Table 11. Planned CHP Project Details
CHP
Nameplate
Capacity
2022 2023
Net Annual
Savings
(MWH)
Net Lifetime
Savings
(MWH)
Incentive
Payment
Net Annual
Savings
(MWH)
Net Lifetime
Savings
(MWH)
Incentive
Payment
32 R.I.Gen.Laws §39-1-27.7(c) (6) (iii) directs the Company to support the development of combined heat and power. The law requires that the following criteria be factored into the Company’s Plan: economic development benefits in Rhode Island, energy and cost savings for customers, energy supply cost, greenhouse gas emissions standards and air quality benefits, and system reliability benefits. For CHP projects above 3 MW in size, the Company will determine the economic development benefits by running a Regional Economic Models Inc (REMI) analysis using project-specific values in accordance with the recommended methodology from the Battle Group study.

58
13.3 MW 15,578 311,562 $9,154,400 3,895 77,891 $2,288,600
CONSISTENCY WITH STANDARDS
7 Least Cost Procurement Law and Standards
This Annual Plan is submitted in accordance with the Least Cost Procurement Law, R.I. Gen. Laws § 39-1-
27.7, the basis for which is the Comprehensive Energy Conservation, Efficiency, and Affordability Act of
2006, R.I. Gen. Laws § 39-2-1.2, and the Least Cost Procurement Standards as approved and adopted
pursuant to Order No. 23890 in Docket No. 5015. The Standards guide how energy efficiency services
are delivered – in a manner that is optimally cost-effective, reliable, prudent, and environmentally
responsible. Least-Cost Procurement that is Energy Efficiency and Conservation Procurement shall also
be lower than the cost of additional energy supply.
The Company has assessed each of these requirements in developing this Plan. Details on the
Company’s approach to considering each of these elements are included in this section. In addition,
further detail on the cost-effectiveness screening of the proposed investments is in Attachment 4 RI
Benefit Cost Test, with detail on rate and bill impacts in Attachment 7.
7.1 Prudency
Over the course of its history implementing energy efficiency programs in Rhode Island, the Company
has considered, and continues to consider, several key components in the analysis of prudency. These
components can be summarized as considerations of:
• How the investment supports the goals of the electric or natural gas system and the purposes of
Least Cost Procurement and what the potential for synergy savings may be based on
alternatives that address multiple needs.
• What groups of customers can the Company reach with program offerings? How can it ensure
that all customers are served equitably and share in the cost of energy efficiency?
• What impacts to customer rates and bills will be required to deliver the efficiency goals, and
how can those impacts be mitigated through alternative funding? What risks, if any, will
customers and the Company see from the investments in energy efficiency and conservation
procurements?
• What constraints, such as available workforce and prevailing economic conditions, exist in the
marketplace that may impact the achievement of the goals as developed and proposed in the
Plan?
For the proposed investments detailed in this Plan, the Company has assessed each of these elements
and how they can be balanced to provide a comprehensive set of programs that will be achievable
within known and anticipated constraints.

59
7.1.1 General Considerations of Prudency
One of the very first considerations of Prudency within the Standards is that the Company assess how an
investment supports the goals of the electric or natural gas system and the purposes of Least Cost
Procurement. This plan secures cost effective energy efficiency resources that drive the realization of
benefits as enumerated in the Rhode Island Test including Electric Energy Benefits, Electric Generation
Capacity Benefits, Electric Transmission Capacity and Distribution Capacity Benefits, Natural Gas
Benefits, Fuel Benefits, Water and Sewer Benefits, Non-Energy impacts, Price Effects, Non-embedded
Greenhouse Gas Reduction Benefits, Economic Development Benefits, Non-embedded NOx Reduction
Benefits, and Value of Improved Reliability.
As an example of the way that the proposed investments in this plan address multiple needs, the electric
demand response program continues to grow in magnitude of savings and in offerings while utilizing
channels and technologies that drive not only energy savings but also reduced cost and deferred
infrastructure benefits that flow from reducing peak demand.
In aggregate the portfolios included in this plan submission are robustly cost effective, as the benefits
exceed the costs to acquire the efficiency resources and implement the programs. The electric portfolio
achieves a BC Ratio of 1.64 and the gas portfolio achieves a BC Ratio of 2.76. These calculations
conservatively do not include Economic Development benefits because of concerns about double
counting. Were these benefits included, the BC Ratios would be 3.51 for the electric portfolio and 3.72
for the gas portfolio. In addition, there are some qualitative benefits, such as societal public health
benefits that would likely increase benefit cost ratios were they to be calculated.
Furthermore, the cost of procuring 1,145,371 MWh lifetime electric energy efficiency savings through
the Plan is $62.1 million less than if that electric load was met by purchasing additional electric supply.
The cost of procuring 4,059,902 MMBtu lifetime natural gas energy efficiency savings through the Plan is
$18.9 million less than if that natural gas load was met by purchasing additional natural gas supply.
7.1.2 Equity
Refer to Section 2.5.1 for equity enhancements to the 2022 Plan. The Participation and Multifamily
Census Study, as well as the Nonparticipant Market Barriers Study will be completed in 2022 and will
provide valuable data to inform strategies for making the energy efficiency programs more equitable.
The Participant study relies on existing National Grid data to develop profiles for participants of National
Grid programs, including multi-family building characteristics and an indicator of whether each building
has participated in a National Grid efficiency program. The Nonparticipant Market Barriers Study is
designed to provide in-depth research to characterize customers that have not participated in the
residential or income eligible programs, assess barriers to their participation, and identify opportunities
to engage these customers. These studies, together with the recommendations offered by the Equity
Working Group launched in 2021, provide insights for equity-related enhancements in program
planning, design and implementation. National Grid has used all available information to achieve
greater equity in the programs and will continue to improve and evolve its efforts as new data and
guidance becomes available.

60
7.1.3 Parity Among Sectors
In considering the prudency of the set of proposed investments contained in this Plan, the Company has
also assessed the parity among sectors along dimensions of collections, budgets, and savings. As shown
in Figure 3, there is approximate parity between the collections by a customer class and its resulting
budget and savings in the electric portfolio. The only exception is the income-eligible sector where there
is an established agreement amongst the Parties that the residential and C&I customer classes use part
of their collections to help cover the income-eligible sector funding needs. The income-eligible budget is
higher compared to its savings due to several factors: incentives are 100% of the cost, the programs are
more expensive because they are delivered in-home (compared to at retail sites or via rebates) which
requires more labor and management, and the programs have fewer economies of scale (compared to
C&I). $26.4 million is budgeted for the delivery of the gas and electric income eligible sector programs,
26% and 14% of the total funding for each fuel portfolio respectively in 2021. Taken together, these
investments represent 16.8% of the overall electric and gas portfolio budgets. More information on the
services offered through the income eligible sector programs can be found in Attachment 1 Residential
& IES Programs.
Figure 3. 2021 Graphical representation of Attachment 5 Table E-1 and total Electric Savings by Sector, Cumulative

61
For the gas portfolio, there is also parity between the collections by a customer class and the resulting
savings. There is less parity between budgets and savings. This is due to several factors. First, the energy
efficiency program charge varies by customer segment, which changes collections. Second, C&I projects
tend to create more savings per dollar. This is due to larger economies of scale, larger projects, different
delivery channels that require less labor or management and are more cost-effective, evaluation factors
such as free-ridership and spillover, and different customer opportunities.
Figure 4. 2021 Graphical representation of Attachment 6 Table G-1 and total Gas Savings by Sector, Cumulative

62
7.1.4 Rate and Bill Impacts
In accordance with the LCP Standards, the Company has assessed the rate and bill impacts of the
proposed portfolios.
While the methods are largely aligned between the electric and natural gas portfolios, there are key
differences between the analyses, including the presence of avoided costs for transmission and
distribution in the electric models. Additional detail on the methods and results from both models are
provided in Attachment 7, Rate & Bill Impacts.
The rate and bill impacts conducted for this Plan provide one quantitative data point in determining the
merits of the investment in energy efficiency overall. The rate and bill impact estimates are considered
in conjunction with the robust benefit cost analysis conducted on measures, programs, and portfolios
included in this Plan and the analysis of the cost of alternative supply compared to the proposed energy
efficiency investments. Summary results for the rate and bill impacts are included in the tables below,
while additional detail is also available in Attachment 7 to this Plan.
Electric programs are projected to generate slight upward movement on long term rates between 0.32%
and 0.59%. For both residential and C&I participants, modeling shows a reduction in bills between 2.57%
and 8.57%.
Natural gas programs are projected to generate slight upward movement on long term rates between
0.33% and 0.77%. For the income eligible customer participants, the Small C&I participants, and Large
C&I participants, modeling shows a reduction in bills between 2.61% and 23.55%.
With respect to the residential sectors in both electric and natural gas, the Company used three distinct
model instances to evaluate rate and bill impacts. The three residential model instances explored 1) the
Home Energy Reports (HER) program in isolation, 2) all programs – including the EnergyWise, EnergyStar
HVAC, EnergyWise Multifamily, Residential New Construction – without HER, and 3) all programs
together. Notably, each division of the residential sector analysis has been developed using a separate
instance of the rate and bill impacts model. Additionally, on the electric side, income eligible has been
separated from market rate residential. Attachment 7 provides additional detail on this modeling
approach.
Relative to the other residential programs, the HER program has a short measure life (1 year), while
reaching the significant majority of residential customers. The period of time covered by the analysis,
however, is a fair amount longer than the persistence of the HER program measure life (20 years for
electric and 24 years for gas). Consequently, the model instance analyzing the HER program in isolation
provides savings over a much shorter period of time compared to the other two model instances, which
means that the three instances are not directly comparable, and the first two model instances do not
additively result in the third instance.
When the HER program is considered in isolation (Model 1), average participants see a reduction in bills
of on average 0.05% for residential electric, 0.05% for income eligible electric, and 0.01% for gas. These
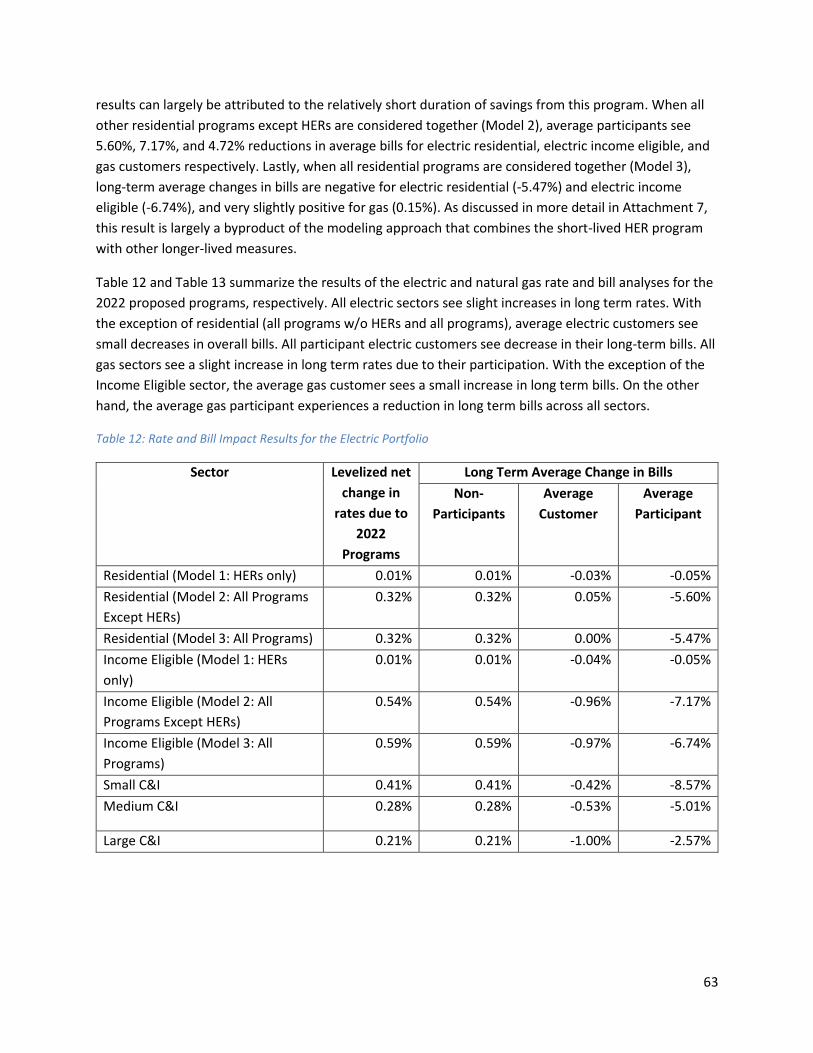
63
results can largely be attributed to the relatively short duration of savings from this program. When all
other residential programs except HERs are considered together (Model 2), average participants see
5.60%, 7.17%, and 4.72% reductions in average bills for electric residential, electric income eligible, and
gas customers respectively. Lastly, when all residential programs are considered together (Model 3),
long-term average changes in bills are negative for electric residential (-5.47%) and electric income
eligible (-6.74%), and very slightly positive for gas (0.15%). As discussed in more detail in Attachment 7,
this result is largely a byproduct of the modeling approach that combines the short-lived HER program
with other longer-lived measures.
Table 12 and Table 13 summarize the results of the electric and natural gas rate and bill analyses for the
2022 proposed programs, respectively. All electric sectors see slight increases in long term rates. With
the exception of residential (all programs w/o HERs and all programs), average electric customers see
small decreases in overall bills. All participant electric customers see decrease in their long-term bills. All
gas sectors see a slight increase in long term rates due to their participation. With the exception of the
Income Eligible sector, the average gas customer sees a small increase in long term bills. On the other
hand, the average gas participant experiences a reduction in long term bills across all sectors.
Table 12: Rate and Bill Impact Results for the Electric Portfolio
Sector Levelized net
change in
rates due to
2022
Programs
Long Term Average Change in Bills
Non-
Participants
Average
Customer
Average
Participant
Residential (Model 1: HERs only) 0.01% 0.01% -0.03% -0.05%
Residential (Model 2: All Programs
Except HERs)
0.32% 0.32% 0.05% -5.60%
Residential (Model 3: All Programs) 0.32% 0.32% 0.00% -5.47%
Income Eligible (Model 1: HERs
only)
0.01% 0.01% -0.04% -0.05%
Income Eligible (Model 2: All
Programs Except HERs)
0.54% 0.54% -0.96% -7.17%
Income Eligible (Model 3: All
Programs)
0.59% 0.59% -0.97% -6.74%
Small C&I 0.41% 0.41% -0.42% -8.57%
Medium C&I 0.28% 0.28% -0.53% -5.01%
Large C&I 0.21% 0.21% -1.00% -2.57%

64
Table 13: Rate and Bill Impact Results for the Natural Gas Portfolio
Sector Levelized net
change in
rates due to
2022
Programs
Long Term Average Change in Bills
Non-
Participants
Average
Customer
Average
Participant
Residential (Model 1: HERs only) 0.02% 0.02% 0.00% -0.01%
Residential (Model 2: All Programs
Except HERs)
0.47% 0.46% 0.26% -4.72%
Residential (Model 3: All Programs) 0.49% 0.48% 0.25% 0.15%
Income Eligible 0.77% 0.77% -0.17% -4.28%
Small C&I 0.33% 0.32% 0.19% -23.55%
Large C&I 0.48% 0.47% 0.02% -2.61%
The Company also includes an assessment of the Year-over-Year change in rates from 2021 to 2022
driven by the funding plan and budgets discussed later in this Plan. In developing the proposed level of
investment in this plan, the Company considered the PUC’s commentary and rulings at the December
22, 2020 and August 11, 2021 open meetings during which the PUC indicated support for budget
increases of up to 5 percent for years 2022 and 2023 in the Three-Year Plan. The Company has steered
based on these rulings as an indicator of prudency in development of the subsequent 2022 Annual Plan
coupled with broader impacts of the plan as a whole. While the overall budget growth proposed in this
plan is approximately a 5% increase above the budget level approved in the 2021 Annual Plan, several
factors contribute to the growth in the energy efficiency charges exceeding 5%. These factors, which
were projected in the indicative energy efficiency charges set forth in the Company’s compliance filing
dated January 29, 2021, include the budget levels, other sources of funding, fund balances, and
anticipated electric loads and natural gas sales. These elements are discussed further in Section 10 of
this Plan. Table 14 summarizes the changes in rates based on the funding plan included in this draft Plan.
Table 14. Summary of Changes in Rates between 2021 and 2022
Rate Category 2021 2022 2021 - 2022
Growth
Gas Residential SBC ($/therm) 0.0871 0.1288 48%
Gas C&I SBC ($/therm) 0.0596 0.0860 44%
Electric SBC ($/kWh) 0.01113 0.01637 47%
7.2 Reliability
The programs developed under this Annual Plan will continue the Company’s extensive history of
offering best-in-class energy efficiency programs to customers, while introducing new implementation
approaches and expanding the Company’s existing programs to serve more customers. Existing

65
programs that have significant experience and traction in the market will be extended and refined to
deploy low-risk cost-effective energy efficiency to the marketplace. The Company continues to
collaborate with a diverse set of stakeholders including the EERMC, OER, Division, and community and
advocacy organizations to continually analyze the programs and identify opportunities for improvement.
In building this Annual Plan, the Company’s Customer Energy Management team worked closely with
industry experts, vendors, and program implementation professionals to assess the current state of
existing programs, the potential for program scalability, the economic environment, and the ability to
deliver reliable energy savings as a result.
Supporting the Company’s efforts to deploy energy efficiency to Rhode Island customers is a robust and
long-standing evaluation, measurement, and verification (EM&V) apparatus. As noted in Section 4, the
Company hires independent third-party consulting firms to regularly conduct evaluation studies as part
of its EM&V process. A distinct group of personnel within National Grid that includes analysts with
specialized skills in engineering, statistics, and economics are tasked with the EM&V function and
coordinate all elements of the EM&V process internally and externally. Evaluations incorporate industry
standard methods to assess the actual energy and demand savings of measures incented by the
programs. All elements of the EM&V process are closely monitored by the EERMC, their Consultants,
and OER. The EM&V process is continual, and every year results from EM&V studies are used to update
the savings in the benefit cost calculation of the measure, programs, and portfolios. In addition, process
evaluations and market studies conducted in the EM&V process provide an independent perspective on
the performance of the programs and provide insight into the state of the market and ways that the
Company can address new opportunities with its programs.
In total, these EM&V processes provide a transparent, externally vetted approach to ensuring that
claimed savings provide an accurate picture as possible of the impact of the Company’s energy efficiency
programs, accounting for spillover, free ridership, and other industry standard adjustment factors
The EM&V process also supports the Company’s participation in the ISO-NE Forward Capacity Market
(FCM). Passive demand savings achieved via electric energy efficiency and Combined Heat and Power
projects, and verified by the EM&V process, continue to participate in the FCM as Passive On-Peak
Demand Resources. As detailed further in Section 10, the Company bids the passive demand savings
attributed to energy efficiency measures and Combined Heat and Power facilities in the FCM and
manages the associated capacity resources to maximize the resulting FCM revenue. The EM&V process
provides the necessary verification of claimed savings in order to meet the high standards for
participation in the ISO-NE FCM.
7.3 Environmentally Responsible
The energy efficiency programs and portfolios described in the Annual Plan are environmentally
responsible. As detailed in Section 5.3, the recently passed Act on Climate stipulates aggressive,
mandatory, and time-bound emissions reductions for the state. This Annual Plan seeks to continue the
progress that has been made in reducing emissions by providing customers across all sectors with ways
to reduce their energy consumption. Energy efficiency can therefore contribute directly to meeting the

66
Act on Climate’s goals. In addition to direct emissions reductions benefits, energy efficiency investments
reduce the potential environmental costs and footprint of avoided infrastructure investments, support
the ongoing growth and development of a sustainable, green job ecosystem in Rhode Island, and
contribute to the realization of other state environmental policy goals and initiatives.
7.3.1 Emissions Reductions
Both electric and natural gas efficiency portfolios will make a meaningful contribution to reduction in
emissions by driving reductions in customer energy usage in both the short and long term. The electric
and natural gas portfolios, considered together, will reduce lifetime emissions of 608,736 tons of Carbon
Dioxide. The non-embedded values of CO2 and NOx benefits generated by the 2022 annual plan over the
lifetime of the measures are $71,932,048 and $2,872,086, respectively. These monetized values of non-
embedded emissions are included as benefit streams in the RI Test benefit-cost assessment and in the
assessment of cost of supply for the portfolio.
7.3.2 Support for an Environmentally Responsible Local Jobs Infrastructure
In 2020, the Company’s Energy Efficiency programs directly supported 827.5 FTEs, as determined by an
assessment of the programs’ impact in the 2022 Annual Report. In providing for these jobs and
demonstrating the availability and attractiveness of local, green jobs to Rhode Island’s existing and
emerging workforce, the Company’s energy efficiency programs help to ensure that the local workforce
will exist to support the state’s environmental policy goals. As noted in Section 2.5.4 this Annual Plan
includes several activities designed to support upskilling of the green workforce.
7.3.3 Raised Customer Awareness of Environmental Issues and the Impacts of their Choices
Educating and engaging residential and business customers on the potential environmental impacts and
benefits of the implementation of energy efficiency measures is a foundational element of the
Company’s energy efficiency go-to-market strategy. Whether in the form of conveying potential
environmental benefits of customer recommendations through Home Energy Reports, EnergyWise
home energy assessments, or retail marketing initiatives, or by connecting SMB audits or large C&I
customer sales efforts to business customer sustainability initiatives, the Company’s energy efficiency
program presence will continue to help to support the prominence of environmental issues in
customers’ minds. Additionally, through the Community-Based Initiative, the Company partners with
municipalities and works through local energy and environmental sustainability committees to connect
individual customers’ energy efficiency decisions and actions to broader municipal sustainability goals
and messages. In doing so, the Company’s programs continue to link energy savings and efficiency to
real and visible benefits for the communities in which their residents and small business reside.
67
7.4 Cost Effectiveness
The Company has analyzed the cost-effectiveness for the proposed 2022 portfolio and programs using
the RI Test as required by Docket 460033 and the LCP Standards.34 The RI Test compares the present
value of the total lifetime benefits derived from efficiency savings to the total costs of acquiring those
savings (i.e., program and customers’ costs). According to the Standards, “any program with a quantified
benefit-cost ratio greater than 1.0 (i.e., where quantified benefits are greater than quantified costs),
should be considered cost-effective. Consistent with the PUC’s guidance issued in Docket No. 4600,
qualitative benefits and costs may be considered in determining cost-effectiveness. The portfolio must
be cost-effective and programs must be cost-effective.” The portfolio and programs proposed for 2022
satisfy these criteria for cost-effectiveness.
As provided for in the Docket 4600 RI Test Framework, benefits include primary fuel energy savings
(electricity and natural gas), the value of other resource (fuel and water) benefits, price effects, non-
embedded greenhouse gas reduction benefits, economic development benefits, non-embedded NOx
reduction benefits, the value of improved reliability, and non-energy impacts (NEIs). Costs include all
projects costs, program planning and administration, sales, technical assistance and training, evaluation,
and the performance incentive. To illustrate the detailed components of the RI Test as well as the
sources of the values, the Company has provided Attachment 4 RI Benefit Cost Test. The RI Test as
applied to the 2022 Annual Plan utilizes the recently completed regional avoided cost study, referred to
as AESC 2021, completed by Synapse Energy Economics as an update and replacement of the AESC 2018
Study that provided the monetization of most benefit categories in the 2019 – 2021 Annual Plans and
the 2021 – 2023 Three-Year Plan. The monetization of benefits also incorporates the latest EM&V
results that affect claimable savings in the programs. Attachment 4 provides additional detail on
changes in the avoided costs.
Attachment 5 Electric EE Program Tables, Table E-5 and Attachment 6 Gas EE Program Tables, Table G-5
provide the calculations of 2022 program year cost-effectiveness. Attachment 5, Table E-6 and
Attachment 6, Table G-6 show the energy savings goals based on the proposed budgets. Attachment 5,
Table E-7 and Attachment 6, Table G-7 show a comparison of the goals with the approved program goals
from 2021.
Attachment 5, Table E-5 shows that the proposed portfolio of electric programs, including active
demand response, is expected to have a benefit/cost ratio of 1.64 in the primary presentation of BCR
results, which means that approximately $1.64 in monetized lifetime benefits is expected to be created
for each $1 spent on the portfolio. Attachment 6, Table G-5 shows that the proposed portfolio of gas
33 RI PUC Docket 4600, http://www.ripuc.ri.gov/eventsactions/docket/4600page.html 34 RI PUC Docket 5015, LCP Standards http://www.ripuc.ri.gov/eventsactions/docket/5015_LCP_Standards_05_28_2020_8.21.2020%20Clean%20Copy%20FINAL.pdf

68
programs is expected to have a benefit/cost ratio of 2.74 in the primary presentation of BCR results,
which means that $2.74 in lifetime benefits is expected to be created for each $1 spent on the portfolio.
Table 15 and Table 16 below show the results of the RI Test at program, sector, and portfolio level.
Notably, these tables compare the RI Test results without economic benefits and with economic benefits
included using the multipliers as applied in the past two annual plans. The rationale for omitting
quantified economic benefits from the primary presentation of BCR results as a conservative approach
to avoiding double counting is described in additional detail in Attachment 4. While the removal of
macroeconomic benefits from the calculation of the Primary RI Test results in lower benefit-cost ratios,
all programs and portfolios still achieve benefit-cost ratios of at least 1.00. In addition, the RI Test and
the Docket 4600 Framework guidance also indicate that categories of the Framework can be considered
qualitatively in the assessment of cost effectiveness. When considering the significant economic activity
generated directly by the programs, including supporting 827 FTEs associated with the programs and
more than 1,000 companies involved, as well as non-quanified benefits, a reasonable assumption is that
the macroeconomic benefits of the programs are positive and potentially significant and were those
benefits included in the Primary RI Test screening as quantified benefits the programs would achieve
more favorable benefit-cost ratios.35
Table 15. Electric Benefit Cost Ratios at Program, Sector, and Portfolio Level
Electric Sector and Program
Primary RI Test without Quantified Economic Benefits
Secondary RI Test with Quantified Macroeconomic Benefits
Large Commercial & Industrial Programs
Commercial New Construction 1.87 3.64
Commercial Retrofit 2.20 6.59
Small Business Direct Install 1.16 2.78
Commercial ConnectedSolutions 2.42 4.61
Commercial and Industrial Subtotal 1.76 4.44
Income Eligible Programs
Income Eligible Single Family 1.94 2.80
Income Eligible Multifamily 2.37 3.56
Income Eligible Subtotal 2.03 2.96
Residential Programs
35 Refer to the 2020 Year End Report for additional details on the assessment of FTEs and companies associated
with the programs. http://www.ripuc.ri.gov/eventsactions/docket/4979-NGrid-Year-End%20Report%202020%20(PUC%205-3-21).pdf

69
Electric Sector and Program
Primary RI Test without Quantified Economic Benefits
Secondary RI Test with Quantified Macroeconomic Benefits
Residential New Construction 2.03 3.06
EnergyStar® HVAC 2.31 3.32
EnergyWise 1.02 1.92
Multifamily 1.63 2.78
Home Energy Reports 2.04 3.04
EnergyStar® Lighting36 N/A N/A
Residential Consumer Products 2.19 3.16
Residential ConnectedSolutions 1.60 2.43
Non-Income Eligible Residential Subtotal 1.57 2.51
Electric Portfolio 1.64 3.50
Table 16. Natural Gas Benefit Cost Ratios at Program, Sector, and Portfolio Level
Gas Sector and Program Primary RI Test without Quantified Economic Benefits
Secondary RI Test with Quantified Economic Benefits
Large Commercial & Industrial Programs
Large Commercial New Construction 5.52 6.84
Large Commercial Retrofit 5.20 6.78
Small Business Direct Install 3.95 5.40
Commercial & Industrial Multifamily 5.86 7.60
Commercial & Industrial Subtotal 4.56 5.87
Income Eligible Programs
Single Family - Income Eligible Services 2.04 3.03
Income Eligible Multifamily 5.98 7.53
Income Eligible Residential Subtotal 3.28 4.45
Residential Programs
Energy Star® HVAC 1.00 1.41
EnergyWise 1.13 2.06
Multifamily 3.45 4.77
Home Energy Reports 3.87 4.93
Residential New Construction 1.62 1.73
Non-Income Eligible Residential Subtotal 1.36 2.09
Portfolio 2.74 3.72
36 Program discontinued for 2022.
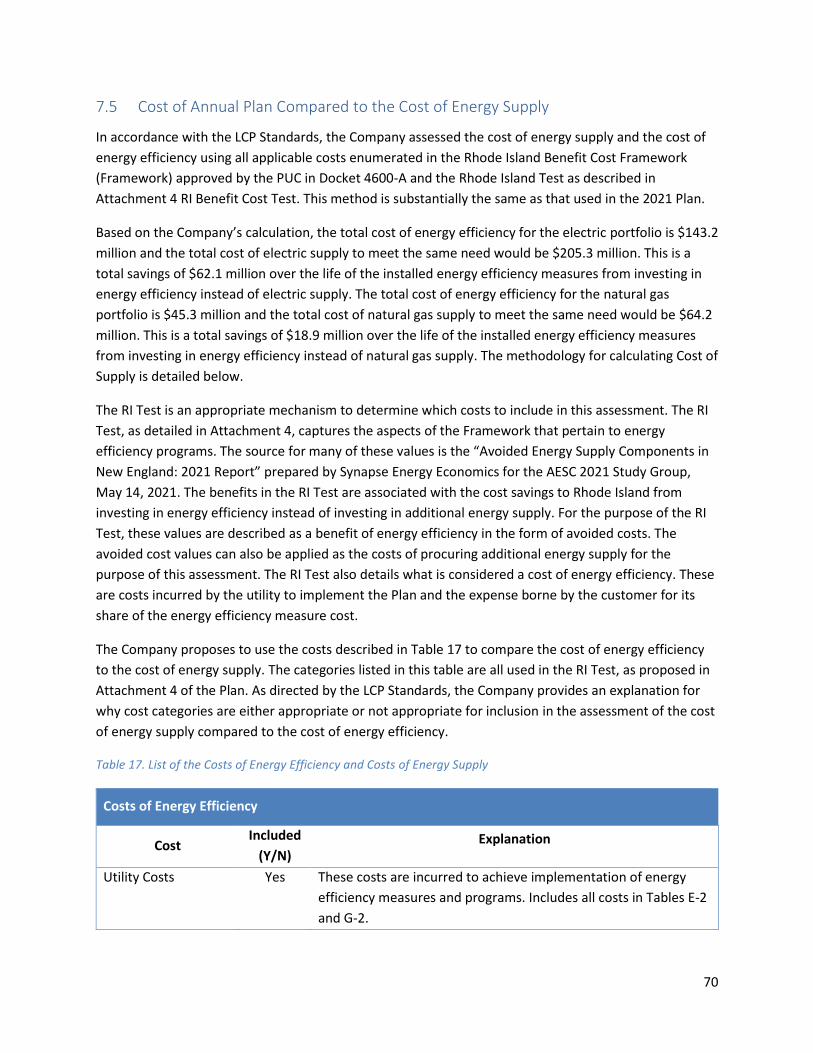
70
7.5 Cost of Annual Plan Compared to the Cost of Energy Supply
In accordance with the LCP Standards, the Company assessed the cost of energy supply and the cost of
energy efficiency using all applicable costs enumerated in the Rhode Island Benefit Cost Framework
(Framework) approved by the PUC in Docket 4600-A and the Rhode Island Test as described in
Attachment 4 RI Benefit Cost Test. This method is substantially the same as that used in the 2021 Plan.
Based on the Company’s calculation, the total cost of energy efficiency for the electric portfolio is $143.2
million and the total cost of electric supply to meet the same need would be $205.3 million. This is a
total savings of $62.1 million over the life of the installed energy efficiency measures from investing in
energy efficiency instead of electric supply. The total cost of energy efficiency for the natural gas
portfolio is $45.3 million and the total cost of natural gas supply to meet the same need would be $64.2
million. This is a total savings of $18.9 million over the life of the installed energy efficiency measures
from investing in energy efficiency instead of natural gas supply. The methodology for calculating Cost of
Supply is detailed below.
The RI Test is an appropriate mechanism to determine which costs to include in this assessment. The RI
Test, as detailed in Attachment 4, captures the aspects of the Framework that pertain to energy
efficiency programs. The source for many of these values is the “Avoided Energy Supply Components in
New England: 2021 Report” prepared by Synapse Energy Economics for the AESC 2021 Study Group,
May 14, 2021. The benefits in the RI Test are associated with the cost savings to Rhode Island from
investing in energy efficiency instead of investing in additional energy supply. For the purpose of the RI
Test, these values are described as a benefit of energy efficiency in the form of avoided costs. The
avoided cost values can also be applied as the costs of procuring additional energy supply for the
purpose of this assessment. The RI Test also details what is considered a cost of energy efficiency. These
are costs incurred by the utility to implement the Plan and the expense borne by the customer for its
share of the energy efficiency measure cost.
The Company proposes to use the costs described in Table 17 to compare the cost of energy efficiency
to the cost of energy supply. The categories listed in this table are all used in the RI Test, as proposed in
Attachment 4 of the Plan. As directed by the LCP Standards, the Company provides an explanation for
why cost categories are either appropriate or not appropriate for inclusion in the assessment of the cost
of energy supply compared to the cost of energy efficiency.
Table 17. List of the Costs of Energy Efficiency and Costs of Energy Supply
Costs of Energy Efficiency
Cost Included
(Y/N) Explanation
Utility Costs Yes These costs are incurred to achieve implementation of energy
efficiency measures and programs. Includes all costs in Tables E-2
and G-2.
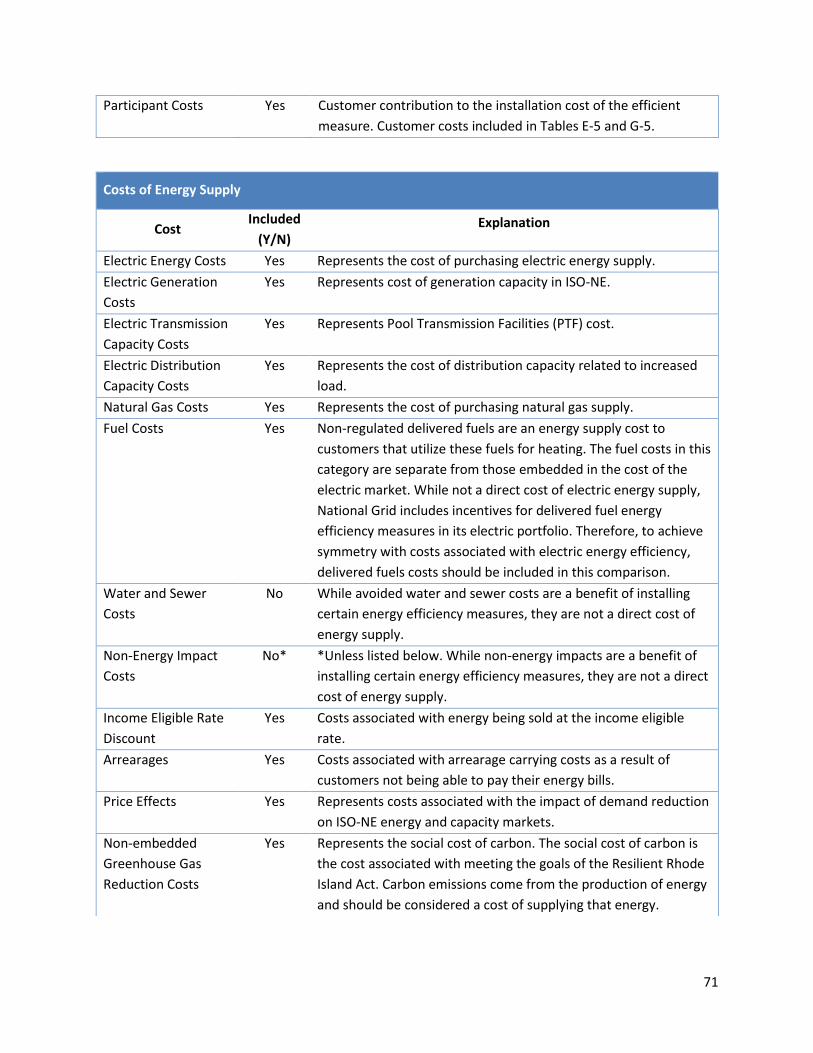
71
Participant Costs Yes Customer contribution to the installation cost of the efficient
measure. Customer costs included in Tables E-5 and G-5.
Costs of Energy Supply
Cost Included
(Y/N) Explanation
Electric Energy Costs Yes Represents the cost of purchasing electric energy supply.
Electric Generation
Costs
Yes Represents cost of generation capacity in ISO-NE.
Electric Transmission
Capacity Costs
Yes Represents Pool Transmission Facilities (PTF) cost.
Electric Distribution
Capacity Costs
Yes Represents the cost of distribution capacity related to increased
load.
Natural Gas Costs Yes Represents the cost of purchasing natural gas supply.
Fuel Costs Yes Non-regulated delivered fuels are an energy supply cost to
customers that utilize these fuels for heating. The fuel costs in this
category are separate from those embedded in the cost of the
electric market. While not a direct cost of electric energy supply,
National Grid includes incentives for delivered fuel energy
efficiency measures in its electric portfolio. Therefore, to achieve
symmetry with costs associated with electric energy efficiency,
delivered fuels costs should be included in this comparison.
Water and Sewer
Costs
No While avoided water and sewer costs are a benefit of installing
certain energy efficiency measures, they are not a direct cost of
energy supply.
Non-Energy Impact
Costs
No* *Unless listed below. While non-energy impacts are a benefit of
installing certain energy efficiency measures, they are not a direct
cost of energy supply.
Income Eligible Rate
Discount
Yes Costs associated with energy being sold at the income eligible
rate.
Arrearages Yes Costs associated with arrearage carrying costs as a result of
customers not being able to pay their energy bills.
Price Effects Yes Represents costs associated with the impact of demand reduction
on ISO-NE energy and capacity markets.
Non-embedded
Greenhouse Gas
Reduction Costs
Yes Represents the social cost of carbon. The social cost of carbon is
the cost associated with meeting the goals of the Resilient Rhode
Island Act. Carbon emissions come from the production of energy
and should be considered a cost of supplying that energy.

72
For the assessment, the Company applies the above costs of supply to the lifetime electricity, lifetime
MMBtu of delivered fuels, demand, and natural gas savings for each measure included in the Plan in
present value terms. The costs of the 2022 Plan occur only in 2022 and are therefore not discounted.
FUNDING PLAN, BUDGET AND GOALS
8 Savings Goals
In 2022, the Company will primarily measure performance based on lifetime energy savings. The electric
portfolio will measure energy savings in units of lifetime MWh and the gas portfolio will measure energy
savings in units of lifetime MMBtu. For comparability with past plans, the Company will continue to
track and report on annual energy savings as has been done for the duration of the programs. Electric
demand savings, from passive energy efficiency savings and active demand response, will continue to be
measured and reported in annual units of kW. The Company recognizes the long-term value of
developing and achieving lifetime energy savings goals because of the focus on longer term customer
savings and benefits. Lifetime energy savings units align with the energy savings Targets as set by the
EERMC, and approved by the PUC, in Docket 5023.37
8.1 Electric Portfolio Savings Goals
Continuing from 2021, the Company will also track net annual and lifetime all-fuel MMBtu (electric, gas,
oil, and propane) savings as a test metric for the electric portfolio. The electric energy efficiency
program tables included in Attachment 5 reflect this additional metric, and further detail on Test
Metrics is included in Section 12.
Tracking net annual and lifetime all-fuel savings (MMBtu) more fully captures the net effect of all-fuel
savings efforts (electric, oil, and propane). The tracking effort will provide useful information and
37 RI PUC Docket 5023, http://www.ripuc.ri.gov/eventsactions/docket/5023page.html
Economic
Development
No While economic development is a benefit of investment in energy
efficiency measures it is not a direct cost of energy supply. Note
that this benefit is treated as a secondary benefit in the RI Test.
Non-embedded
Nitrous Oxide (NOx)
Costs
Yes NOx emissions come from the production of energy and therefore
the health impacts of NOx emissions should be considered part of
the cost of supplying that energy.
Reliability Costs Yes Increased energy demand can lead to declining reserve margins
and decrease reliability so should be associated with the cost of
energy.

73
benchmarking for state efforts to support decarbonization of the thermal energy sector and better
support State and Company greenhouse gas reduction goals now and in the future.
To first convert electric energy savings from MWh to MMBtu, the Company proposes to multiply MWh
by an industry standard conversion factor of 3.412 MMBtu per MWh.38 This conversion applies only to
electric energy savings. Savings from natural gas and delivered fuel are tracked in MMBtu. In this Plan,
the electric savings converted to MMBtu are shown in Table E-6A in Attachment 5 Electric EE Program
Tables. Equation 1 shows the calculation of electric MWh savings to MMBtu.
Equation 1. Conversion of MWh to MMBtu Calculation
𝑀𝑀𝐵𝑡𝑢𝐸𝑙𝑒𝑐𝑡𝑟𝑖𝑐 = 𝑀𝑊ℎ𝐸𝑙𝑒𝑐𝑡𝑟𝑖𝑐 × 3.412 𝑀𝑀𝐵𝑡𝑢/𝑀𝑊ℎ
To calculate net all-fuel MMBtu as reported in Table E-6A in Attachment 5, the Company will sum
electric savings (converted to MMBtu), natural gas savings, and delivered fuel (oil and propane) savings.
This summation captures savings impacts for all fuels attributable to an electric measure.
Equation 2. Calculation of Net All-Fuel MMBtu Calculation for Electric Savings Measures
𝑀𝑀𝐵𝑡𝑢𝐴𝑙𝑙 𝐹𝑢𝑒𝑙 = 𝑀𝑀𝐵𝑡𝑢𝐸𝑙𝑒𝑐𝑡𝑟𝑖𝑐 + 𝑀𝑀𝐵𝑡𝑢𝑁𝑎𝑡𝑢𝑟𝑎𝑙 𝐺𝑎𝑠 + 𝑀𝑀𝐵𝑡𝑢𝐷𝑒𝑙𝑖𝑣𝑒𝑟𝑒𝑑 𝐹𝑢𝑒𝑙𝑠
8.2 Natural Gas Portfolio Savings Goals
For the natural gas portfolio, the Company proposes to primarily measure energy savings in units of net
lifetime MMBtu, while continuing to track net annual MMBtu for comparability with past plans.
9 Annual Plan Compared to the Three-Year Plan
The energy and cost savings for the 2022 program year are consistent with the objectives and
requirements of Least Cost Procurement.
Table 18. Comparison of 2022 Electric Portfolio in Three-Year Plan Compliance Filing and 2022 Annual Plan
Electric Portfolio 2022 in 3YP Compliance Filing
2022 Annual Plan % Change
Net Annual Savings (MWh) 129,302 127,561 -1.3%
Net Lifetime Savings (MWh) 1,379,789 1,145,371 -17.0%
Total Benefits (RI Test)39 $288,032,158 $234,620,105 -18.5%
38 The conversion factor of 3.412 MMBtu/MWh is a constant value. Energy Information Agency, EIA: https://www.eia.gov/totalenergy/data/monthly/pdf/sec13_7.pdf 39 2022 Total Benefits in the Three-Year Plan included monetized economic benefits. In this table total benefit have been updated to exclude monetized economic benefits. For the 2022 in 3YP Compliance Filing, this resulted in a

74
Electric Portfolio 2022 in 3YP Compliance Filing
2022 Annual Plan % Change
Total Budget $122,625,209 $122,616,460 0.0%
Benefit Cost Ratio (RI Test) 2.01 1.64 -18.1%
Cost/Lifetime kWh $ 0.100 $0.120 20.3%
EE Program Charge per kWh $ 0.01616 $0.01637 1.3%
Table 19. Comparison of 2022 Gas Portfolio in Three-Year Plan Compliance Filing and 2022 Annual Plan
Gas Portfolio 2022 in 3YP Compliance Filing
2022 Annual Plan % Change
Net Annual Savings (MMBtu) 427,504 389,430 -8.9%
Net Lifetime Savings (MMBtu) 4,278,262 4,059,902 -5.1%
Total Benefits (RI Test) $98,919,527 124,048,699 25.4%
Total Budget $36,723,443 $36,723,364 0.0%
Benefit Cost Ratio (RI Test) 2.12 2.74 29.3%
Cost/Lifetime MMBtu $10.53 $10.74 2.0%
C&I EE Program Charge per Dth $0.773 $0.860 11.3%
Residential EE Program Charge per Dth $1.109 $1.288 16.1%
The Company has proposed goals consistent with Least Cost Procurement, however there are some
notable differences between the goals proposed in the 2022 Annual Plan and the Three-Year Plan
Compliance Filing. First, the electric net lifetime energy savings goal is decreasing by 17%. This is mainly
driven by evaluation results which significantly reduced the measure lives, and claimable lifetime energy
savings, of Commercial and Industrial (C&I) lighting measures.40 C&I lighting energy savings contributed
to approximately 619,528 net lifetime MWh (45%) of the electric portfolio’s net lifetime target for 2022
in the 2021-2023 Compliance Filing. In the 2022 Annual Plan, C&I lighting energy savings contributed to
approximately 324,711 net lifetime MWh (28%) of the electric portfolio’s net lifetime goal for the 2022
Annual Plan. This decline in C&I lighting energy savings and associated benefits is the primary
contributor to the 17% decline in the lifetime MWh goal, the 20% increase in the Cost/Lifetime kWh, the
18% decline in the total electric benefits (RI Test) and the corresponding 18% decline in the B/C Ratio (RI
Test) from the 2022 3YP compliance filing to the 2022 annual plan. For more information on the removal
of economic benefits from the RI Test Calculation see Attachment 4.
reduction of total electric benefits from $564M to $288M and a reduction in the electric Benefit Cost Ratio (RI Test) from 3.93 to 2.01. This also resulted in a reduction of total natural gas benefits from $144M to $98M and a reduction in the natural gas Benefit Cost Ratio (RI Test) from 3.09 to 2.12. For the 2022 Annual Plan monetized economic benefits are quantified but omitted from the primary presentation of benefits here. The exclusion of monetized economic benefits also applies to the Benefit Cost Ratio (RI Test).
40 These results are adopted from a Massachusetts Market Characterization study, completed in March 2021. Rhode Island traditionally adopts the results of this study but is planning to do a RI-specific study for application in 2023.

75
Evaluation results impacting the EnergyStar HVAC program was the main contributor to the 5% decline
in net lifetime MMBtu from the 2022 3YP compliance filing to the 2022 annual plan. The 26% increase in
the total electric benefits (RI Test) and the corresponding 29% increase in the B/C Ratio (RI Test) was
driven by updates from the recently completed regional avoided cost study, referred to as AESC 2021,
completed by Synapse Energy Economics as an update and replacement of the AESC 2018 Study that
provided the monetization of most benefit categories in the 2019 – 2021 Annual Plans and the 2021 –
2023 Three-Year Plan. Finally, the increase in the C&I and Residential Program Charge per Dth is driven
by the negative 2021 Year End Gas Fund Balance forecast of -$5.1M. This overspend is due to an uptick
in customer interest in efficiency services combined with increased incentive amounts designed to
mitigate the impacts of COVID-19 on customer participation.
10 Funding Plan and Budgets
The 2022 Annual Plan will be submitted to the RI PUC on October 1, 2021, consistent with the revised
LCP Standards in RI PUC Docket 5015. Given this updated timeline compared to prior years, the
Company may not be able to include its updated annual electric load forecast for the October 1st filing.
When the electric forecast is available, the Company will provide an updated filing to the RI PUC,
consistent with past practice when incremental information on in-year spend is available following the
filing.
Funding, budgets, goals, and cost-effectiveness information is provided in Attachment 5 Electric EE
Program Tables for the proposed electric energy efficiency programs and in Attachment 6 Gas EE
Program Tables for the proposed natural gas energy efficiency programs.
In developing the savings goals, associated budgets, and funding plans for this 2022 Annual Plan, the
Company took into account the traditional factors (anticipated 2021 year-end fund balances and
anticipated 2022 sales volumes) that always impact the relationship between requested implementation
budgets and the required customer surcharges necessary to fund the proposed plan.
2021 Year-End Fund Balances
• Given the fixed nature of the 2021 electric and gas energy efficiency surcharges, year-end fund
balances will be a function of both remaining Company collections results as well as volumetric
sales through year-end. Consistent with recent practice, a final update to the projected year-end
fund balance to be provided to the Commission by November 17th, 2021.
• The 2021 year-end fund balance will also be a function of actual implementation expenses and
Company earned performance incentive through year-end 2021. For the October 1st submission
to the PUC, the Company has included 2021 year end fund balance forecasts (electric and gas)
on line 2 of the E-1 and G-1 tables in Attachment 5 and Attachment 6, respectively. The fund
balance forecasts include estimated implementation expenses and estimated earned
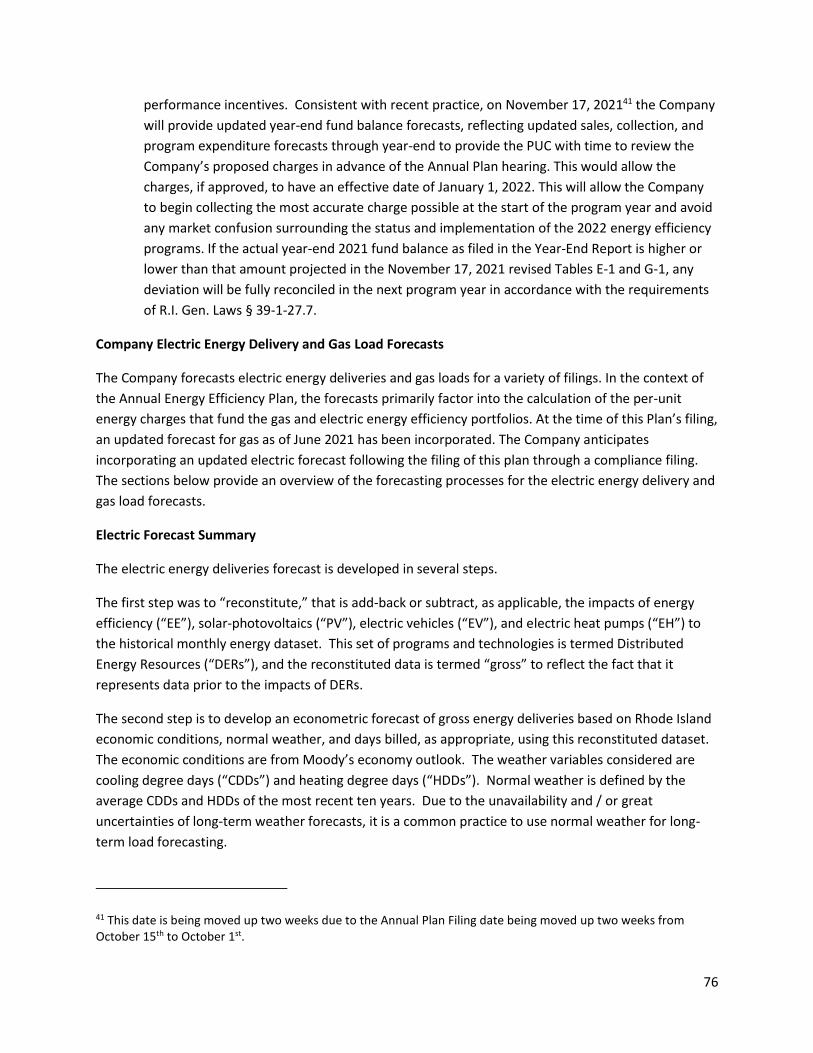
76
performance incentives. Consistent with recent practice, on November 17, 202141 the Company
will provide updated year-end fund balance forecasts, reflecting updated sales, collection, and
program expenditure forecasts through year-end to provide the PUC with time to review the
Company’s proposed charges in advance of the Annual Plan hearing. This would allow the
charges, if approved, to have an effective date of January 1, 2022. This will allow the Company
to begin collecting the most accurate charge possible at the start of the program year and avoid
any market confusion surrounding the status and implementation of the 2022 energy efficiency
programs. If the actual year-end 2021 fund balance as filed in the Year-End Report is higher or
lower than that amount projected in the November 17, 2021 revised Tables E-1 and G-1, any
deviation will be fully reconciled in the next program year in accordance with the requirements
of R.I. Gen. Laws § 39-1-27.7.
Company Electric Energy Delivery and Gas Load Forecasts
The Company forecasts electric energy deliveries and gas loads for a variety of filings. In the context of
the Annual Energy Efficiency Plan, the forecasts primarily factor into the calculation of the per-unit
energy charges that fund the gas and electric energy efficiency portfolios. At the time of this Plan’s filing,
an updated forecast for gas as of June 2021 has been incorporated. The Company anticipates
incorporating an updated electric forecast following the filing of this plan through a compliance filing.
The sections below provide an overview of the forecasting processes for the electric energy delivery and
gas load forecasts.
Electric Forecast Summary
The electric energy deliveries forecast is developed in several steps.
The first step was to “reconstitute,” that is add-back or subtract, as applicable, the impacts of energy
efficiency (“EE”), solar-photovoltaics (“PV”), electric vehicles (“EV”), and electric heat pumps (“EH”) to
the historical monthly energy dataset. This set of programs and technologies is termed Distributed
Energy Resources (“DERs”), and the reconstituted data is termed “gross” to reflect the fact that it
represents data prior to the impacts of DERs.
The second step is to develop an econometric forecast of gross energy deliveries based on Rhode Island
economic conditions, normal weather, and days billed, as appropriate, using this reconstituted dataset.
The economic conditions are from Moody’s economy outlook. The weather variables considered are
cooling degree days (“CDDs”) and heating degree days (“HDDs”). Normal weather is defined by the
average CDDs and HDDs of the most recent ten years. Due to the unavailability and / or great
uncertainties of long-term weather forecasts, it is a common practice to use normal weather for long-
term load forecasting.
41 This date is being moved up two weeks due to the Annual Plan Filing date being moved up two weeks from October 15th to October 1st.

77
The third step is to create the “net” forecast by adjusting the gross forecast by the projections for future
DERs. Impacts for EE and PV (reflecting decreased electric load on the system) are subtracted from the
gross forecast, impacts of EV (reflecting increased electric load on the system) are added to the gross
forecast, and impacts of EH are added to or subtracted from the gross forecast depending on the season
to create the net forecasts. These forecasts were first developed in terms of revenue classes –
residential, commercial, and industrial. They were then allocated to the various rate classes using the
current revenue to rate class percentages from the Company’s billing system.
Gas Forecast Summary
The Company’s gas load forecast is based on a comprehensive methodology for forecasting retail
customer load requirements using a series of econometric models to determine the changes expected
for Residential Heating, Residential Non-Heating, Commercial, and Industrial markets. To determine the
projected growth over the forecast period, the econometric models used historical economic,
demographic, and energy price data, and weather data to determine total energy demand.
The product of the Company's retail demand forecast is a forecast of meter counts, use-per-customer,
and volume by month by internal rate code under normal weather conditions. The Company’s retail
demand forecast is then converted to wholesale supply requirements at the Company’s city gates based
on the relationship between city gate volumes (including supplementals) and weather on the daily level.
The product of the Company's wholesale customer requirements forecast is a forecast of volume by day
under normal and design weather conditions.”
Annual Plan Funding Sources
The sources of funding and the amounts of the funding proposed for the 2022 energy efficiency
programs are shown in Table E-1 for electric programs and Table G-1 for natural gas programs.
The sources of funding for the 2022 electric programs are shown in Attachment 5 Electric EE Program
Tables, Table E-1. To collect these funding sources for the 2022 cost-effective programs, the Company
proposes: (1) one line on the customers’ bill labeled “Energy Efficiency Charge” at $0.01637 per kWh, as
calculated in Attachment 5, Table E-1 (composed of the existing energy efficiency program charge of
$0.01113 per kWh plus a fully reconciling funding mechanism charge of $0.00524 per kWh in
accordance with the requirements of R.I. Gen. Laws § 39-1-27.7); (2) projected Large C&I commitments
from 2022, if any; (3) projected carryover of the year-end 2021 fund balance, as applicable, including
interest at the rate in effect for customer deposits; (4) forecast revenue generated by ISO-NE’s Forward
Capacity Market (FCM); and (5) other potential outside revenue sources, including but not limited to
those generated through RGGI permit auctions. Funding sources do not include revolving loan funds.
The sources of funding for the 2022 natural gas programs are shown in Attachment 6 Gas EE Program
Tables, Table G-1. The Company proposes that the 2022 budget should be funded from the following
sources: (1) one line on the customers’ bill labeled “Energy Efficiency Charge” at $1.288 per dekatherm
for residential customers and $0.860 per dekatherm for non-residential customers as calculated in
Attachment 6, Table G-1 (composed of the existing energy efficiency program charge of $0.871 per

78
dekatherm plus a fully reconciling funding mechanism of $0.417 per dekatherm for residential
customers and the existing energy efficiency program charge of $0.596 per dekatherm plus a fully
reconciling funding mechanism of $0.264 for non-residential customers in accordance with the
requirements of R.I. Gen. Laws § 39-1-27.7); (2) projected carryovers or under-recoveries of the year-
end 2021 fund balance, including interest at the rate in effect for customer deposits. Funding sources do
not include revolving loan funds.
The 2022 budgets for cost-effective electric and natural gas efficiency investments are dependent on a
number of projections that inform the amount of funding, including projections of electricity and natural
gas sales, year-end 2021 large C&I program commitments, capacity payments received from ISO-NE
(electric only), and year-end 2020 spending. The Company estimates that the electric projected fund
balance at year-end 2021 will be negative $1.5 million, as shown in Line 3, Attachment 5, Table E-1; the
gas fund balance at year-end 2021 is estimated to be negative $5.2 million, as shown in Line 2
Attachment 6, Table G-1. Other considerations regarding funding sources are described in the
subsequent sections.
10.1 ISO-NE Capacity Market Revenue
Consistent with the LCP Standards, Annual Plan, and PUC decisions regarding annual plans since 2008,
the Company and the Parties agree that kW-demand savings achieved via the electric energy efficiency
and Combined Heat and Power programs continue to participate in the FCM as Passive On-Peak
Demand Resources. The Company will manage and direct the revenues by bidding the demand savings
attributed to energy efficiency measures and Combined Heat and Power facilities in the FCM and
managing the associated capacity resources to maximize the resulting FCM revenue. The revenues from
measures installed through this Plan, as well as all previous Plans, will continue to be reinvested in
energy savings for the life of the measure.
The Parties fully agree that the Company should recover all prudently incurred FCM expenses from ISO-
NE capacity-payment revenue generated by the demand savings from efficiency programs represented
by the Company. The Company expects that capacity payments received from the ISO-NE will exceed its
administrative and Evaluation, Measurement and Verification (EM&V) compliance costs of participation
in the FCM and will result in additional funds being made available to fund efficiency programs for
customers. If these participation costs exceed the capacity payments, the Parties agree that the
Company may recover its prudently incurred costs from the energy efficiency program fund. The Parties
reserve the right to examine the actions and expenses of the Company to ensure that only prudently
incurred expenses are deducted from ISO-NE capacity payments or the energy efficiency program fund.
In addition, as part of the FCM, all qualified auction participants are required to post Financial Assurance
to provide security that the promised resource will deliver the promised MW at the promised time. If, as

79
a result of circumstances beyond the Company’s control,42 the Company is unable to provide all or a
portion of the megawatts of capacity proposed in its qualification packages and capacity auction bids,
some or all the financial assurance monies would be forfeited.
10.2 Exceptions to the Natural Gas Energy Efficiency Program Charge
All natural gas used for distributed generation projects approved since 2014 will be subject to the
natural gas energy efficiency surcharge.43
The 2006 Act allows the PUC to exempt natural gas used for manufacturing processes from the energy
efficiency surcharge where the customer has established a self-directed program to invest in and
achieve best effective energy efficiency in accordance with a plan approved by the PUC and subject to
periodic review and approval by the PUC. Consistent with prior PUC decisions, the Company has
developed recommendations for a process under which a manufacturer may submit its self-directed
program and the required annual reports for approval. The Company recognizes that this process may
need to be reviewed and modified after the PUC has accumulated sufficient experience with these
programs. Any customer that receives this exemption from the natural gas energy efficiency program
charge will not be eligible to receive natural gas energy efficiency program services.
10.3 Budgets
After consideration, the Company proposes budgets for this plan in line with the PUC’s vote on
December 22, 2020 to approve illustrative budgets for both electric and gas of 5% annual increases for
the years 2022 and 2023, and the resulting three year plan compliance filing approved by the PUC on
August 11, 2021. 44 The Company has considered areas for potential growth but must balance this with
the prudency requirements of the Standards. More specifically, the Company must account for the
anticipated significant increase in the Systems Benefit Charge and its impact on ratepayers.
The portfolio of energy efficiency programs and services for 2022 will have an overall budget of
approximately $122.6 million for electric programs and $36.7 million for natural gas programs. The
Parties agree to segment the budget into three sectors: residential income eligible, residential non-
income eligible, and commercial and industrial. Proposed sector and program budgets are provided in
Attachment 5 Electric EE Program Tables, Table E-2 and Attachment 6 Gas EE Program Tables, Table G-2.
The derivations of the spending budget and implementation expenses are illustrated in Attachment 5,
42 Such circumstances may include legislative action to alter the EE Program Charge or discontinue the Company’s authority to implement the energy efficiency programs underlying the Qualifications Package or a PUC decision limiting the Company’s role in bidding the demand savings acquired through program efforts into the FCM. 43 Natural gas used for distributed generation (excluding natural gas used by emergency generators) for distributed generation projects approved under the energy efficiency programs in 2013 and prior years - independent of the date those facilities become commercially operable – are not subject to the energy efficiency surcharge when natural gas used for that purpose can be clearly identified through uniquely metered use and when so requested in writing by the customer. 44 http://www.ripuc.ri.gov/eventsactions/docket/5076-PUC-OM%20Motions%20&%20Votes%201-7-21.pdf

80
Table E-3 and Attachment 6, Table G-3. A comparison of these proposed budgets to the 2021 budget is
provided in Attachment 5, Table E-4 and Attachment 6, Table G-4.
The Parties agree to review the status of budgets regularly to assess whether they are likely to be fully
utilized. If not being utilized, the Parties agree to review the advisability of transferring funds to other
programs where the money could be more effectively used. Fund transfer guidelines are presented in
Section 10.4 below.
The Company will continue the practice of funding commitments established in the 2014 Plan, Docket
4451. Specifically, the Company will continue to make funding commitments for projects with a
projected incentive in excess of $3 million. For all other projects, except those with incentives greater
than $3 million, there would be no commitment budget.
10.4 Transferring Funds
Continuing from the approved notifications approved as part of the 2021 plan, the Company proposes
the following guidelines for transfers between programs. The Company and stakeholders will regularly
review the amount of funds needed and available for each program (as well as any changes to the
overall fund balance discussed above) and will transfer monies as needed. Transfers during the program
year may occur as follows:
• Transfers within a Sector. For transfers of less than 20% of the originating program’s budget, the
Company can transfer funds from one program to another program or pilot in the same sector.
For transfers of 20% or more of the originating program or pilot’s budget, the Company can
transfer funds from one program to another program in the same sector with the Division’s
prior approval. Upon seeking the Division’s approval, the Company shall simultaneously notify
the EERMC and OER. For all transfers in a sector, the Company will reflect changes in the
quarterly report(s) following the transfer and the year-end report.
• Transfers between Sectors. The Company can transfer funds from one sector to another sector
with the Division’s prior approval. Upon seeking the Division’s approval, the Company shall
simultaneously notify the EERMC and OER. If a transfer reduces the originating sector’s budget
by more than 20% in aggregate over the course of the program year, the transfer will also
require PUC approval. For all transfers between sectors, the Company will reflect changes in the
quarterly report(s) following the transfer and the year-end report.
• Transfers among residential retrofit programs. The Company can transfer among EnergyWise,
Multifamily, Income Eligible Multifamily, and C&I Multifamily (which are in different sectors)
programs in order to achieve the overall savings goals of all programs. Although these are listed
as separate lines in the program tables, they are essentially one program from an
implementation standpoint. For all transfers between residential retrofit programs, the
Company will reflect changes in the quarterly report(s) following the transfer and the year-end
report.

81
• For transfers requiring Division and/or EERMC, but not PUC approval, the Parties will inform the
PUC of the transfers, both between sectors and within sectors, in a timely fashion.
• The Company will not be permitted to adjust its goals or incentive target calculations as a result
of any transfers between sector budgets. However, after any budget transfers between sectors
are made, the sector spending budgets will be recalculated for the purposes of the performance
incentive calculation. Any changes will be communicated and reported consistent with transfers
between sectors, described above.
10.5 Budget Management
Deviations from the planned budget for 2022 are possible during the program year. The Parties
contemplate three scenarios, and have agreed to address them as follows:
• The Company’s expenditures for 2022 may exceed the total budget by up to 10% so long as
written notification is provided to the EERMC, OER, PUC, and DPUC for any deviation. The
Company will track expected expenditures relative to planned budgets and will report to
stakeholders through inclusion in the quarterly reports, or earlier, if the Company believes such
overage is likely to occur. Any such notification will occur as soon as possible, and no later than
the distribution of the Company’s Third Quarter Report in mid-November 2022 and must explain
the need for a higher budget and must justify how the expenditures are reasonably consistent
with the original annual plan and in accordance with Least Cost Procurement.
• The Company agrees that, during 2022, if the Company anticipates that continued operation of
its programs is likely to result in actual expenditures exceeding the total budget by more than
10%, the Company will seek a vote of approval from the EERMC. OER commits to making all
reasonable efforts to schedule such vote as soon as feasible following notification, but no later
than thirty days from receipt of notification. The PUC will not provide advance approval of
expenditures exceeding the total budget by more than 10%. The Company will be required to
demonstrate to the PUC that the transfer or overspend was prudent. Support from the Division,
OER, and EERMC will be considered in the PUC's review of prudency.
• During a program year, if the Company did not anticipate and notify parties identified above
that its actual expenditures would exceed the total budget by more than 10%, but actual
expenditures do exceed such threshold, such expenditures above 110% of approved budget will
be at the Company’s risk, and in order to secure cost recovery, the Company will bear the
burden of demonstrating the reasonableness of its actions to the PUC, including an explanation
of why the over-spending occurred and how the expenditures are reasonably consistent with
the original plan and in accordance with Least Cost Procurement. Such demonstration would be
required to be part of the 2022 Year-End Report, if not sooner.

82
In each of these three instances, the PUC retains its traditional ratemaking authority to review the
prudency and reasonableness of the Company’s actions.
10.6 Notification of Large Customer Incentives
The Company shall inform the PUC, DPUC, OER, and EERMC in writing of any energy efficiency incentive
annual offer in excess of $3 million per a measure. The Company shall inform the DPUC, OER, and
EERMC in writing of any CHP project with a net output of 1 MW or greater (where net is the nameplate
MW output minus CHP auxiliary kW). The process for notification of CHP projects is described in
Attachment 2 C&I Programs.
To prevent customer delays and to facilitate the Company’s ability to meet customer expectation and
annual energy savings goals, the OER, EERMC and Division agree to ask questions and provide comments
on any non-CHP energy efficiency incentive annual offer in excess of $3 million within thirty days. The
Company, through its own discretion, may proceed with an incentive offer. The incentive, and any other
related proposals will be authorized to proceed after thirty days from the date on which the Company
notified the PUC, OER, Division, and EERMC of the incentive unless the PUC suspends the filing and/or
issues an order within such 30-day period to extend the time for purposes of further review.
11 Performance Incentive Plan
The RI PUC approved a performance incentive mechanism (PIM) for 2021 – 2023 in Docket 5076 that
changed the way that the Company measures and earns a performance incentive.45 In years prior to
2021 the Company’s earning opportunity was set equal to a percentage of the eligible spending budget
upon achieving goal savings, subject to performing within budget bounds. The PIM, as approved in
Docket 5076, changes the measurement of performance to a net benefits framework based on a set of
prioritized benefit categories. Fundamentally, this change prioritizes utility system impacts over
resource benefits generated by the programs and omits the societal benefits. The “netting” calculation
incents budget controls so that the benefits are achieved in line with the portfolio budgets as proposed
in the Plan.
Equation 3. Illustrative Calculation of Net Benefits for Performance Incentive Mechanism
𝑇𝑜𝑡𝑎𝑙 𝐵𝑒𝑛𝑒𝑓𝑖𝑡𝑠 = (100% 𝑜𝑓 𝑈𝑡𝑖𝑙𝑖𝑡𝑦 𝑆𝑦𝑠𝑡𝑒𝑚 𝐵𝑒𝑛𝑒𝑓𝑖𝑡𝑠 + 50% 𝑜𝑓 𝑅𝑒𝑠𝑜𝑢𝑟𝑐𝑒 𝐵𝑒𝑛𝑒𝑓𝑖𝑡𝑠)
𝑁𝑒𝑡 𝐵𝑒𝑛𝑒𝑓𝑖𝑡𝑠 = (100% 𝑜𝑓 𝑈𝑡𝑖𝑙𝑖𝑡𝑦 𝑆𝑦𝑠𝑡𝑒𝑚 𝐵𝑒𝑛𝑒𝑓𝑖𝑡𝑠 + 50% 𝑜𝑓 𝑅𝑒𝑠𝑜𝑢𝑟𝑐𝑒 𝐵𝑒𝑛𝑒𝑓𝑖𝑡𝑠)
− (𝑃𝑟𝑜𝑔𝑟𝑎𝑚𝑚𝑎𝑡𝑖𝑐 𝐶𝑜𝑠𝑡𝑠 + 𝑅𝑒𝑔𝑢𝑙𝑎𝑡𝑜𝑟𝑦 𝐶𝑜𝑠𝑡𝑠)
45 At the time of this 2022 Annual Plan a written Order detailing the parameters of the newly approved PIM has not been released in Docket 5076. Refer to the RI PUC Docket 5076 webpage for materials related to the PIM components of the Docket proceedings, including staff guidance documents that provide illustrative examples with detailed step-by-step PIM calculations: http://www.ripuc.ri.gov/eventsactions/docket/5076page.html

83
The PIM continues to measure performance at the sector and fuel level:
• Non-Income Eligible Residential Electric
• Income Eligible Residential Electric
• Commercial and Industrial Electric
• Non-Income Eligible Residential Gas
• Income Eligible Residential Gas
• Commercial and Industrial Gas
In the non-income eligible residential and income eligible residential sectors, the calculation of net
benefits using the above prioritized calculation of benefits results in negative net benefits, so the
earning opportunities for each fuel’s portfolio are allocated to the C&I sector. The PIM also includes
Service Quality Adjustments (SQAs) in the non-income eligible residential and income eligible residential
sectors which require the Company to achieve defined levels of performance equal to the sum of
prioritized total benefits. If the defined levels of service (total benefits) are not achieved in the
residential and income eligible sectors, the SQAs apply reductions to any realized earnings in the
commercial and industrial sector. The SQAs also include a cost component that adjusts the realized
performance, and consequently any reduction of C&I earnings, based on how the realized expenditures
in the residential and income eligible sectors compare to planned budgets. The SQAs therefore provide a
similar incentive signal as the “netting” calculation in the core of the PIM and provide the Company with
signals that savings and benefits should be pursued and prioritized in each sector, rather than
exclusively the Commercial and Industrial sector where the earning opportunity resides.
In addition, the PIM calculations include a set of potential adjustments that are intended to further
incent the company to maintain budget controls in the delivery of savings, and therefore prioritized
benefits, by adjusting earnings under this mechanism based on cost relative to budget.46
Attachment 5, Table E-8A and Attachment 6, G-8A show the categories of benefits that are included in
the PIM calculations, categories omitted from the PIM, and the weighting assigned to those benefits in
the calculation. The categories of benefits are also summarized in the table below. The monetized
benefits included in the PIM are calculated from a subset of benefit categories included in the RI Test,
calculated using the same methods and inputs as the RI Test.
46 Refer to the draft PUC PIM Guidance Document in Docket 5076 for detailed descriptions of the PIM and SQA calculations and adjustment rules: http://www.ripuc.ri.gov/eventsactions/docket/5076-PUC%20PIM%20Proposal%202-18-21.pdf. As noted previously, the Company anticipates that an updated version of this Guidance will be released with a written Order in Docket 5076. That final guidance would supersede the draft version linked here and would incorporate final changes voted on by the PUC at an Open Meeting on April 29, 2021.
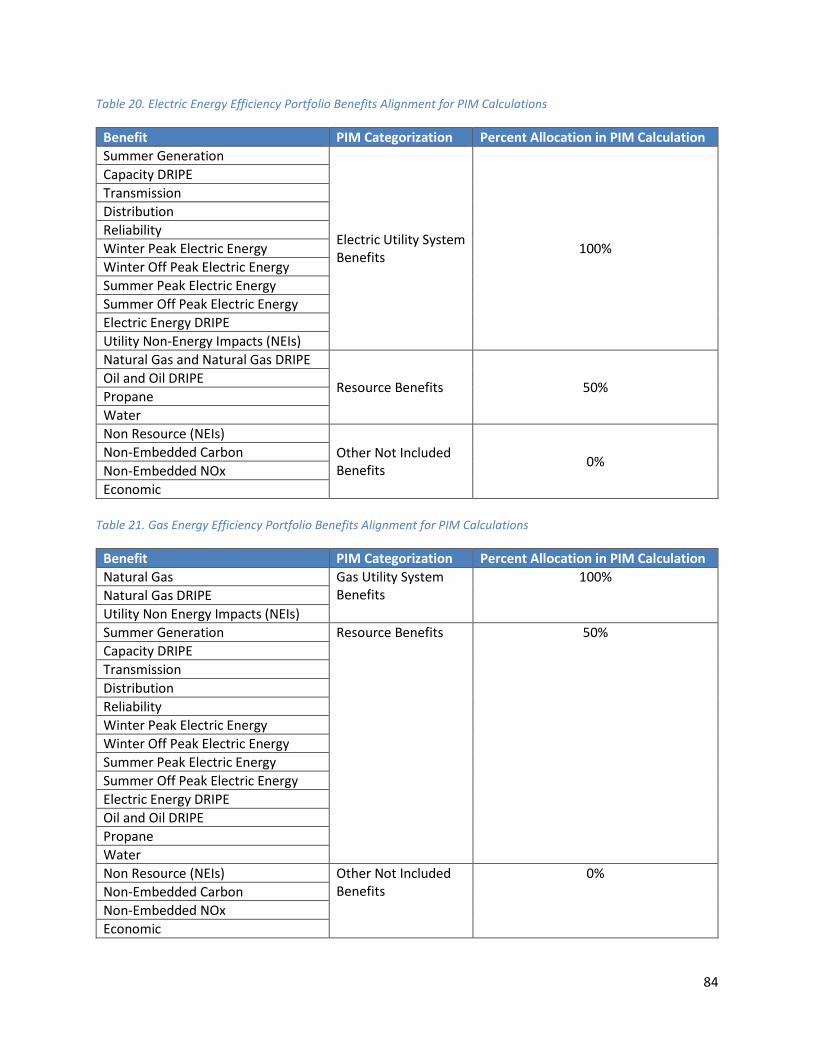
84
Table 20. Electric Energy Efficiency Portfolio Benefits Alignment for PIM Calculations
Benefit PIM Categorization Percent Allocation in PIM Calculation
Summer Generation
Electric Utility System Benefits
100%
Capacity DRIPE
Transmission
Distribution
Reliability
Winter Peak Electric Energy
Winter Off Peak Electric Energy
Summer Peak Electric Energy
Summer Off Peak Electric Energy
Electric Energy DRIPE
Utility Non-Energy Impacts (NEIs)
Natural Gas and Natural Gas DRIPE
Resource Benefits 50% Oil and Oil DRIPE
Propane
Water
Non Resource (NEIs)
Other Not Included Benefits
0% Non-Embedded Carbon
Non-Embedded NOx
Economic
Table 21. Gas Energy Efficiency Portfolio Benefits Alignment for PIM Calculations
Benefit PIM Categorization Percent Allocation in PIM Calculation
Natural Gas Gas Utility System Benefits
100%
Natural Gas DRIPE
Utility Non Energy Impacts (NEIs)
Summer Generation Resource Benefits 50%
Capacity DRIPE
Transmission
Distribution
Reliability
Winter Peak Electric Energy
Winter Off Peak Electric Energy
Summer Peak Electric Energy
Summer Off Peak Electric Energy
Electric Energy DRIPE
Oil and Oil DRIPE
Propane
Water
Non Resource (NEIs) Other Not Included Benefits
0%
Non-Embedded Carbon
Non-Embedded NOx
Economic

85
Tables E-8B and G-8B show the costs that are used in the “netting” calculations in the PIM, and that are
incorporated in the SQAs in the sectors to which they apply. The core of the costs included in the PIM
remain the “Eligible Spending Budget” derived from Attachment 5, Table E-3 and Attachment 6, Table G-
3. The Eligible Spending budget is calculated based on the total budget from Tables E-2 and G-2 with
commitments, regulatory costs, pilot costs, assessment costs, and performance incentive value
removed.47 Notably, in the new PIM the regulatory costs for collections allocated to OER, the EERMC,
and the Rhode Island Infrastructure Bank (RIIB) are added into the calculations of total costs for the net
benefits calculations and the SQAs.48 This is a change from the PIM that was in place prior to 2021.
Tables E-8C and G-8C show the final summarizations of the calculations for the PIM and SQAs, including
target earning opportunities and maximum earning opportunities. The Company is seeking electric
performance incentives of $5.5 million (all through C&I) and natural gas performance incentives of $1.6
million (also all through C&I). These levels were set by the PUC for 2021 and have been maintained at
those levels for 2022. With respect to the CHP project noted in Section 6.1, should that project not
receive PUC approval, the Company anticipates that funds currently budgeted for that project incentive
would be reallocated to budget for other C&I projects and programs. Those efforts would be consistent
with the efforts undertaken in recent years to reallocate funds following PUC rulings on the 2020 and
2021 Annual Plans. Given that these alternative projects would likely yield fewer savings and benefits
than the planned CHP project, the Company would, in this scenario, anticipate requesting a reset of
target benefits and goals used to calculate target and actual PIM performance and performance
incentive earnings.
12 Future Performance Metrics
The Company proposes to continue tracking several performance metrics initiated in past plans.
12.1 Testing Performance Metrics
In 2022, the Company proposes to continue tracking and reporting performance related to certain
metrics in order to test progress towards several key objectives.
47 The Eligible Spending Budget also omits the costs of the Company’s active demand response (Connected Solutions) programs. The peak demand reductions achieved through those programs are subject to the Amended Settlement Agreement in Docket Nos. 4770 and 4780 filed with the PUC on August 10, 2018, and the System Efficiency PIM contained therein. Spending and benefits derived from active demand reductions are therefore excluded from the EE PIM calculations. At the time of this plan Draft the Company and stakeholders are assessing the possibility of incremental PIM earning opportunities derived from active demand response. 48 Regulatory costs for 2022 include an allocation of funds to RIIB. Previously these costs were aligned in the Commercial and Industrial program budget. This change in how the RIIB-allocated funds are counted for budgetary and PIM calculation purposes was made to align with recently passed revisions to the Least Cost Procurement Law. See R.I. Pub. Laws Ch. 224 (2021): http://webserver.rilin.state.ri.us/PublicLaws/law21/law21224.htm

86
12.1.1 Carbon and Carbon Dioxide Equivalent (CO2e) Reductions
The Company proposes to continue tracking carbon reductions resulting from investments in energy
efficiency measures, as was initiated in the 2021 Plan. While the net benefits-based PIM approved for
the Three-Year Plan makes a performance incentive based on emissions reductions less likely, the
contribution of energy efficiency to the emissions reductions goals in the Act on Climate is a valuable
data point.
12.1.2 Peak Hour Gas Demand Savings
In 2020, the Company began tracking an estimate of peak-hour gas demand savings based on existing
heuristics that assume fixed, but distinct, relationships between annual and peak day and peak hour gas
consumption for heating and non-heating-based customer usage of natural gas. The Company will be
clear in all reporting that National Grid considers this to be a rough approximation of peak-hour gas
demand impacts. In 2020 and 2021 the Company engaged in several efforts to quantify peak gas
demand savings resulting from gas energy efficiency measures for application in future. The Company
joined an existing residential study in Massachusetts in 2020 and expanded the study scope to Rhode
Island homes to measure peak gas demand savings resulting from residential sector energy efficiency
measures. The Company also conducted a study of commercial and industrial peak gas demand in
2020/2021. Results of those efforts are expected to be incorporated in tracking and reporting in 2022.
12.2 Forward Looking Performance Metrics
12.2.1 Equity Metric Tracking
In 2020 the Company began an analysis of the data it possesses on participants that are renters, along
with rental units, and expanded the collection of this information across more programs, where
appropriate. The Company will continue to track and refine this data in 2022 and begin reporting on the
performance to this metric. The renter metric will serve as one input to the assessment of the programs’
equity performance. If the Company and stakeholders determine that the data is of sufficient breadth
and quality to serve as the basis for linking a portion of the Company’s performance incentive metric to
program participation by rental units, that may be considered for a future component of the
performance incentive mechanism.
As noted earlier in Section 2.5.1, as part of the equity focus of the 2022 Plan, the Company will also track
and report on minority and women owned businesses that are providing services to the EnergyWise
program as an outcome of the work of the Energy Efficiency Equity Working Group.

87
13 Advancing Docket 4600 Principles and Goals
Along with the quantitative benefits detailed in the Plan, as measured by the RI Test, the energy
efficiency investments and innovation planned for 2022 also advance the Docket 4600 principles and
goals.49
The Docket 4600-A Guidance Document directed that “the proposing party must provide accompanying
evidence that addresses how the proposal advances, detracts from, or is neutral to each of the stated
goals of the electric system.”50
To meet this directive, the Company describes how the Plan either advances, detracts, or remains
neutral on achieving the Docket 4600 goals for the electric system in Table 22Error! Reference source
not found..
Table 22. Docket 4600 Goals for the Electric System
4600 Goals for Electric System Advances/Detracts/Neutral
Provide reliable, safe, clean, and affordable
energy to Rhode Island customers over the long
term.
Advances: The Plan gives customers tools to
reduce their energy consumption. The safest,
most reliable, most affordable energy is energy
that is never used. Lowering energy consumption
avoids investments in the installation, upgrade, or
replacement of transmission and distribution
infrastructure, and reduces strain on the system.
Strengthen the Rhode Island economy, support
economic competitiveness, retain, and create
jobs by optimizing the benefits of a modern grid
and attaining appropriate rate design structures.
Advances: The Plan will create significant
economic benefits in Rhode Island. The Company
expects that investments made in energy
efficiency under this Plan will add $359 million to
Rhode Island’s Gross State Product (GSP),
equivalent to 3,221 job-years.
Address the challenge of climate change and
other forms of pollution.
Advances: The Plan will avoid 608,736 tons of
carbon over the lifetime of the installed measures
as well as reduce other pollutants associated with
the generation and combustion of electricity,
natural gas, and delivered fuels.
Prioritize and facilitate increasing customer
investment in their facilities (efficiency,
distributed generation, storage, responsive
demand, and the electrification of vehicles and
Advances: The Plan provides incentives for
customers to invest in cost-effective energy
efficiency measures in their facilities and
participate in demand response programs and
49 PUC Report and Order No. 22851 accepting the Stakeholder Report. Written Order issued July 31, 2017. 50 Approved final clean version of Guidance Document 10/27/17.
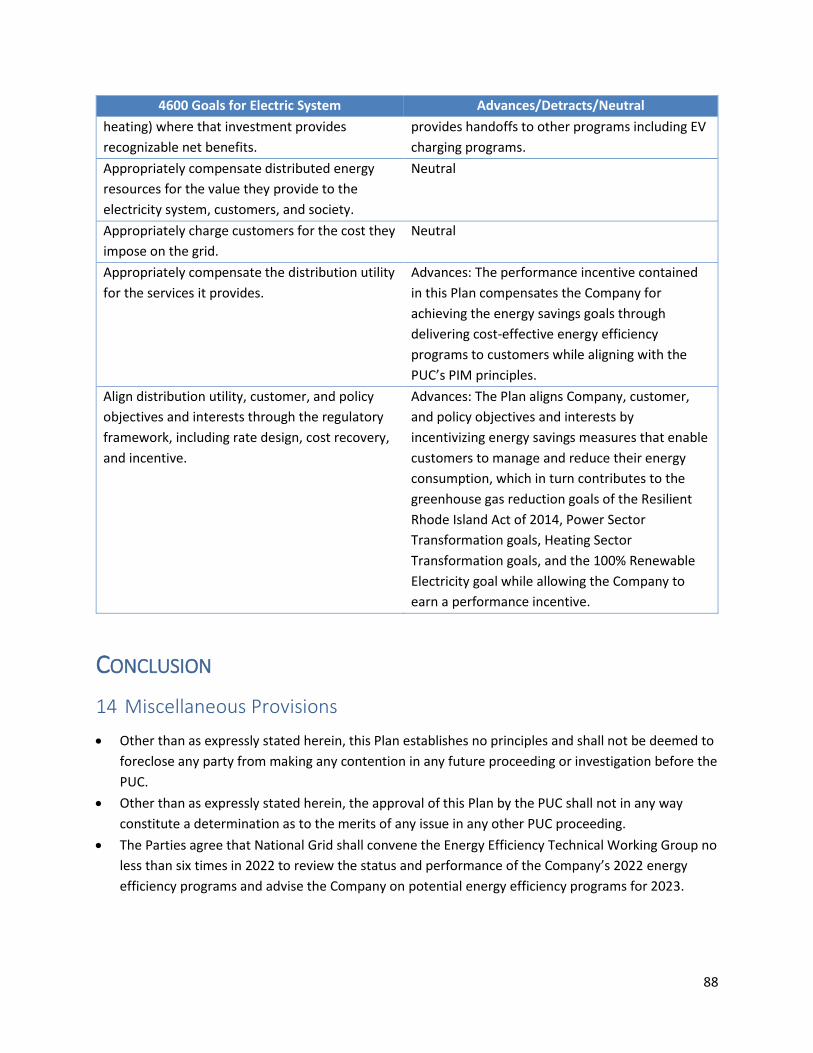
88
4600 Goals for Electric System Advances/Detracts/Neutral
heating) where that investment provides
recognizable net benefits.
provides handoffs to other programs including EV
charging programs.
Appropriately compensate distributed energy
resources for the value they provide to the
electricity system, customers, and society.
Neutral
Appropriately charge customers for the cost they
impose on the grid.
Neutral
Appropriately compensate the distribution utility
for the services it provides.
Advances: The performance incentive contained
in this Plan compensates the Company for
achieving the energy savings goals through
delivering cost-effective energy efficiency
programs to customers while aligning with the
PUC’s PIM principles.
Align distribution utility, customer, and policy
objectives and interests through the regulatory
framework, including rate design, cost recovery,
and incentive.
Advances: The Plan aligns Company, customer,
and policy objectives and interests by
incentivizing energy savings measures that enable
customers to manage and reduce their energy
consumption, which in turn contributes to the
greenhouse gas reduction goals of the Resilient
Rhode Island Act of 2014, Power Sector
Transformation goals, Heating Sector
Transformation goals, and the 100% Renewable
Electricity goal while allowing the Company to
earn a performance incentive.
CONCLUSION
14 Miscellaneous Provisions
• Other than as expressly stated herein, this Plan establishes no principles and shall not be deemed to
foreclose any party from making any contention in any future proceeding or investigation before the
PUC.
• Other than as expressly stated herein, the approval of this Plan by the PUC shall not in any way
constitute a determination as to the merits of any issue in any other PUC proceeding.
• The Parties agree that National Grid shall convene the Energy Efficiency Technical Working Group no
less than six times in 2022 to review the status and performance of the Company’s 2022 energy
efficiency programs and advise the Company on potential energy efficiency programs for 2023.

89
15 Reporting Requirements
• In 2022, the Company will provide quarterly reports to the EERMC, the Division, OER, the EE EWG,
the EE TWG, and the PUC on the most currently available program performance for both natural gas
and electric efficiency programs. These reports will include a comparison of budgets and goals by
program to actual expenses and savings on a year-to-date basis, and a status report on revolving
loan funds. The Company will work with the Rhode Island Infrastructure Bank on appropriate loan
fund reporting. The reports will also include a summary of program progress and will highlight issues
by sector for EERMC, Division, OER, and Technical Working Group attention. Within the C&I sector,
there will be separate highlighting of large and small customer program progress and issues.
Beginning in the second quarter, the quarterly reports also include a forecast of expected results.
• In the 2020 Year End Report, the Company provided detailed costs schedules that were developed
in collaboration with the Rhode Island Division of Public Utilities and Carriers. The Company
proposes to submit detailed cost schedules in the 2022 Year End Report. In addition, the Company
also proposes to submit confidential vendor schedules to the PUC, with a motion for protective
treatment. These confidential vendor schedules detail costs to individual vendors and other external
entities.
• In 2022 for months during which quarterly reports are not produced, the Company will provide to
the EERMC, the Division, OER, and the EE TWG monthly summaries of year-to-date spending and
savings and results by sector.
• The Company will provide to the Parties, the EE TWG, the EE EWG, and file with the PUC its 2022
Year-End Report no later than June 1, 2023. This report will include achieved natural gas and electric
energy savings in 2022 and earned incentives for 2022.
• The Company will provide the Parties and the EE TWG with a summary of evaluation results that
have been incorporated into the Annual Plan within the annual plan, including a description of the
impact of those results in planning the Company’s 2022 programs, in the Plan to be filed by October
1, 2021.
16 Requested Rulings
The Company respectfully requests that the PUC approve the 2022 Annual Energy Efficiency Plan as
presented in this document and the supporting attachments in its entirety. The plan has been developed
with careful consideration of the linkages between all parts. The specific components of this plan for
which the Company requests approval include:
• The savings goals, programs, measures, budgets, and associated customer collections required
to fund the energy efficiency programs in 2022.
• The pilots, demonstrations, and assessments the Company proposes for program year 2022 and
the associated budgets and customer collections required to fund those efforts.
• The performance incentive mechanism and associated earning opportunity as approved in the
three-year plan and applied in this Annual Plan.

90
ATTACHMENTS Annual Plan Attachment 1. Residential and Income Eligible Energy Efficiency Solutions and Programs Annual Plan Attachment 2. Commercial and Industrial Energy Efficiency Solutions and Programs Annual Plan Attachment 3. Evaluation, Measurement & Verification Plan Annual Plan Attachment 4. Rhode Island Benefit Cost Test Description Annual Plan Attachment 5. Electric Energy Efficiency Program Tables Annual Plan Attachment 6. Gas Energy Efficiency Program Tables Annual Plan Attachment 7. Rate and Bill Impacts Annual Plan Attachment 8. Pilots, Demonstrations & Assessments Annual Plan Attachment 9. Cross-Program Summary Annual Plan Attachment 10. Definitions Annual Plan Attachment 11. Energy Efficiency Equity Working Group Final Report