Embed Size (px)
Citation preview
2012 WATER QUALITY–TRAINING HANDOUT
KAREN L. LANCOUR
National Rules Committee Chairman – Life Science
DISCLAIMER - This presentation was prepared using draft rules. There may be some changes in the
final copy of the rules. The rules which will be in your Coaches Manual and Student Manuals will be the
official rules.
BE SURE TO CHECK THE 2012 EVENT RULES for EVENT PARAMETERS.
TRAINING MATERIALS:
Training Power Point presents an overview of material in the training handout
Training Handout presents introductory topic content information for the event
Sample Tournament has sample problems with key
Event Supervisor Guide has event preparation tips, setup needs and scoring tips
Internet Resource & Training Materials are available on the Science Olympiad website at
www.soinc.org under Event Information.
A Biology-Earth Science CD, a Water Quality CD and the Division B and Division C Test
Packets are available from SO store at www.soinc.org
THE COMPETITION:
Part 1: Water Quality Information
freshwater ecology
aquatic food chains and food webs
population dynamics
community interactions
water cycle
nutrient cycling
aquatic chemistry and its implications for life
potable water treatment
waste water treatment
watershed resource management issues
sedimentation pollution
exotic/invasive/harmful species
Part 2: Macro-flora and Fauna – Identification and indicators of water quality
Macro-invertebrates
Flora
Aquatic Nuisance Plants
Aquatic Nuisance Animals
Part 3: Water Monitoring and Analysis
Data Interpretation and Procedural analysis
salinity
pH
phosphates
turbidity
dissolved oxygen
temperature

nitrates
fecal coliform
total solids
biochemical oxygen demand
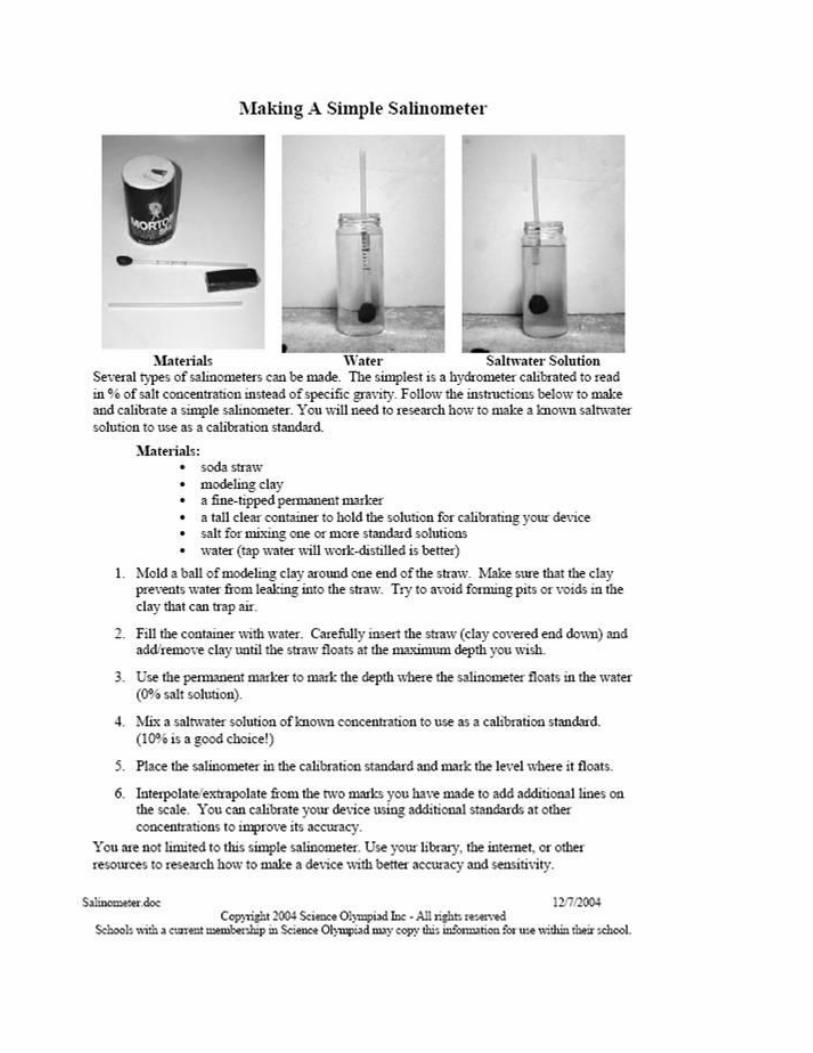
Build and calibrate a salinometer (Hydrometer) prior to the competition and use in competition
Test salt water
1-10%
Process skills:
equipment use
collecting and interpreting data
measurements
calculations
classifying
inferences
variable analysis
Part I: General Principles of Freshwater Ecology
Review of Ecology Principles: Ecology = the systematic study of how organisms interact with one another and with their
environment
Environment consists of both a living component, the biotic environment (other organisms)
and a non-living component, the abiotic environment, e.g. physical factors such as soil, rainfall,
sunlight, temperatures
Ecology is an extremely complex and very diverse subject and it includes a variety of
disciplines in addition to biology, e.g. geology, chemistry, physics, meteorology, and
mathematics
Four levels of ecological organization:
Population - group of individuals of the same species occupying a common geographical area
Community - two or more populations of different species occupying the same geographical
area Populations and communities include only biotic factors
Ecosystem - a community plus its abiotic factors, e.g. soil, rain, temperatures, etc.
Biosphere - the portion of the earth that contains living species. It includes the atmosphere,
oceans, soils and the physical and biological cycles that affect them
Aquatic Ecosystems
Lotic ecosystems – flowing water
Streams
Rivers
Lentic ecosystems – still water
Ponds
Lakes
Wetlands
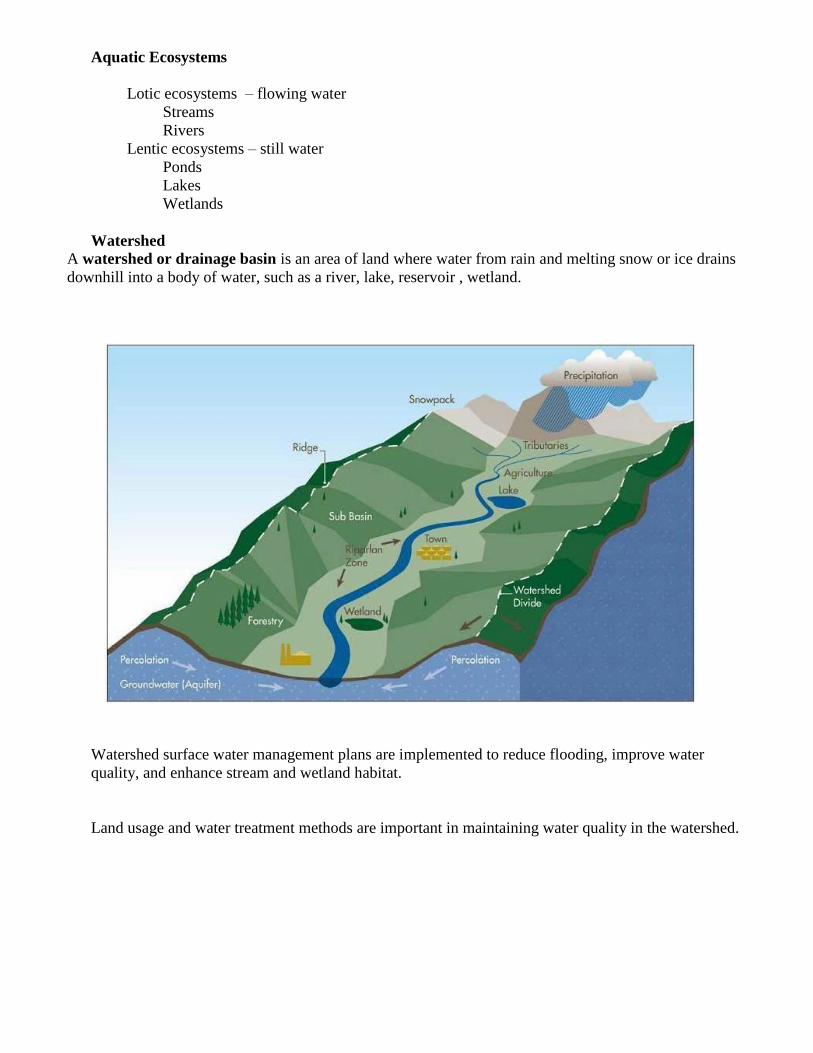
Watershed
A watershed or drainage basin is an area of land where water from rain and melting snow or ice drains
downhill into a body of water, such as a river, lake, reservoir , wetland.
Watershed surface water management plans are implemented to reduce flooding, improve water
quality, and enhance stream and wetland habitat.
Land usage and water treatment methods are important in maintaining water quality in the watershed.

Ecology of Populations Population Ecology = the study of how populations interact with their environment
Population = group of individuals of the same species occupying a common geographical area
Habitat - where a species normally lives
Characteristics of populations - Each population has certain characteristics:
Population size = number of individuals making up its gene pool
Population density = number of individuals per unit of area or volume, e.g.
persons/square mile
Population distribution = the general pattern in which the population members are dispersed
through its habitat, may be: Clumped (most common), Uniformly dispersed (rare), or Randomly
dispersed
Age structure defines the relative proportions of individuals of each age: Pre-reproductive,
Reproductive, and Post-reproductive
Population size and growth
Ecology of Communities:
Community = two or more populations of different species occupying the same geographical area
Community Ecology = the study of how different species interact within communities
Habitat = the physical place where an organism lives, e.g. a pine forest or fresh water lake
Some organisms, particularly migratory birds require more than one habitat
Niche = the functional role of an organism in a community, its job or position
Each species has a potential niche - what they could do with no competitors or resource
limitations but due to competition and/or resource limitations, most organisms occupy a realized
niche, the part of the fundamental niche that a species actually occupies in nature
Species interactions
Neutral - two species that don't interact at all
Commensalism - beneficial to one species but neutral to another, e.g. birds that nest in trees,
epiphytes (plants that grow on other plants) such as tropical orchids
Mutualism - an interaction that is beneficial to both species, e.g. plants and their pollinators,
plants and animals that disperse their seeds, certain fungi and plant roots
Parasitism - an interaction that benefits one species and is detrimental to another. Note that the
host is generally not killed.
Predation - an interaction beneficial to one species and detrimental to another. In this case the
prey is killed. Predators are those that kill and eat other animals. Although many organisms eat
plants they usually don’t kill them because they are a constant supply of food. Prey are killed and
eaten.
Competitive interactions
Competition has negative effect on both organisms competing for a resource
Because resources are limited in nature there will always be competition for them
Competition is the driving force of evolution, those that win leave more offspring
Types of competition:
Intraspecific - competition among individuals of the same species, e.g. humans compete
against other humans
Interspecific - competition between different species, e.g. humans compete against a wide
variety of species seeking to utilize our food resources
The theory of competitive exclusion maintains that species who utilize the same resources
cannot coexist indefinitely - the "one niche, one species" concept

resource partitioning - the resources are divided, permitting species with similar
requirements to use the same resources in different areas, ways and/or times
Ecology of Ecosystems :
Ecosystem = a community of organisms interacting within a particular physical environment
or an ecosystem is a community plus its abiotic factors, e.g. soil, rain, temperatures, etc. Virtually all
energy on earth comes from the sun, via photoautotrophs (primarily plants), and it is ultimately
distributed throughout ecosystems.
Primary producers are the autotrophs
All other organisms are consumers Consumers which eat plants are called herbivores
Consumers which eat animals are called carnivores Organisms such as humans, which eat both
plants and animals, are called omnivores
Decomposers, which includes fungi and bacteria, obtain their energy by breaking down the
remains or products of organisms
Detritivores are decomposers which eat detritus - organic wastes and dead organisms
Structure of ecosystems
Food Chains
algae mayflies stoneflies trout humans
Food Web – many food chains in relation to each other

Energy flows through ecosystems via food webs, intricate pathways of energy flow and material
cycling
Ecosystems are arranged by trophic (feeding) levels between various producers, the autotrophs,
and consumers, the heterotrophs:
First trophic level - contains the autotrophs which build energy containing molecules
They also absorb nitrogen, phosphorous, sulfur and other molecules necessary for life
They provide both an energy-fixation base as well as the nutrient-concentration base for
ecosystems
Two types of autotrophs: Photoautotrophs - plants and some Protista
Chemoautotrophs - bacteria
Second trophic level - contains the primary consumers which eat the primary producers
including herbivores, decomposers and detritivores, e.g. insects, grasshoppers, deer and wildebeest
Third trophic level - contains the secondary consumers, primary carnivores which eat the
herbivores, e.g. mice, spiders and many birds
Fourth trophic level - contains the tertiary consumers, secondary carnivores who eat the primary
carnivores, e.g. weasel, owl, sharks and wolves.
Linear food chains as described above are probably rare in nature because the same food source
may be part of several interwoven food chains and many organisms have several food sources
Energy flow though ecosystems
Gross primary productivity = the rate at which the primary producers capture and store energy
per unit time since the primary producers expend energy during respiration the net primary
productivity is considerably lower than the gross productivity
Productivity is usually measured as biomass (dry weight of organic matter) per unit area per a
specified time interval, e.g. kg/m2/yr
The trophic structure of an ecosystem is often represented by an ecological pyramid, with the
primary producers at the base and the other levels above
Most of the food eaten by organisms is converted to biomass, or used to maintain metabolic
functions, or lost as heat, only about 10% of the energy makes it to the next level This massive
energy loss between trophic levels explains why food chains can't contain more than a few levels
It takes billions of primary producers (plants) to support millions of primary consumers, which
support a few secondary consumers. This is why there are so few large carnivores on earth
An energy pyramid is a more useful way to depict an ecosystem's trophic structure
Each block of the pyramid is proportional to the amount of energy it contains
Pyramids may also represent biomass or numbers of individuals
The energy pyramid concept helps explain the phenomenon of biological magnification - the
tendency for toxic substances to increase in concentration at progressively higher levels of the
food chain
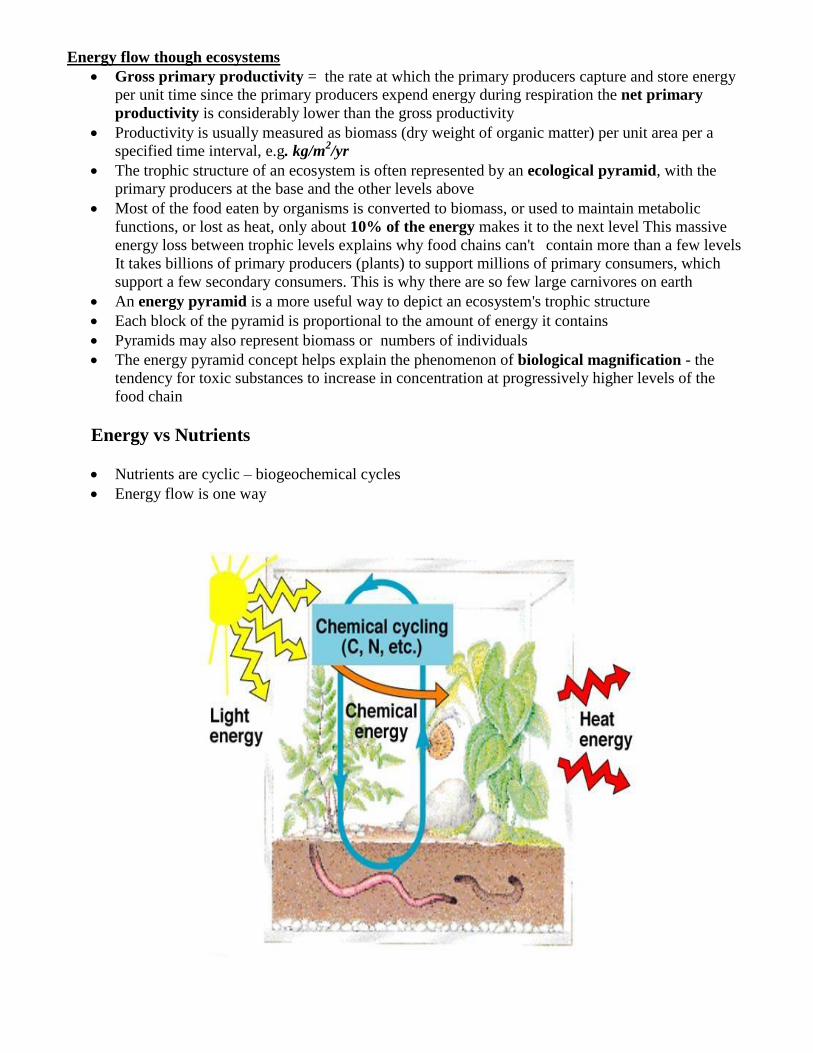
Energy vs Nutrients
Nutrients are cyclic – biogeochemical cycles
Energy flow is one way
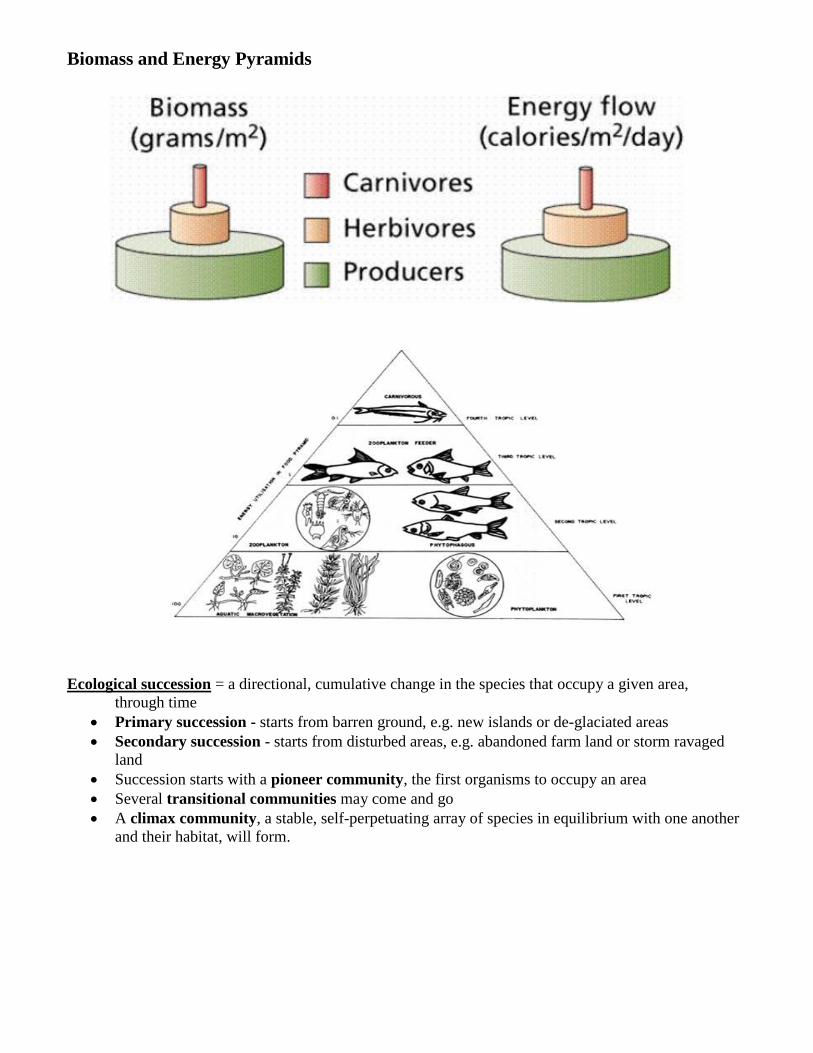
Biomass and Energy Pyramids
Ecological succession = a directional, cumulative change in the species that occupy a given area,
through time
Primary succession - starts from barren ground, e.g. new islands or de-glaciated areas
Secondary succession - starts from disturbed areas, e.g. abandoned farm land or storm ravaged
land
Succession starts with a pioneer community, the first organisms to occupy an area
Several transitional communities may come and go
A climax community, a stable, self-perpetuating array of species in equilibrium with one another
and their habitat, will form.

Nutrient Recycling – Biogeochemical Cycles
Hydrologic (Water) Cycle

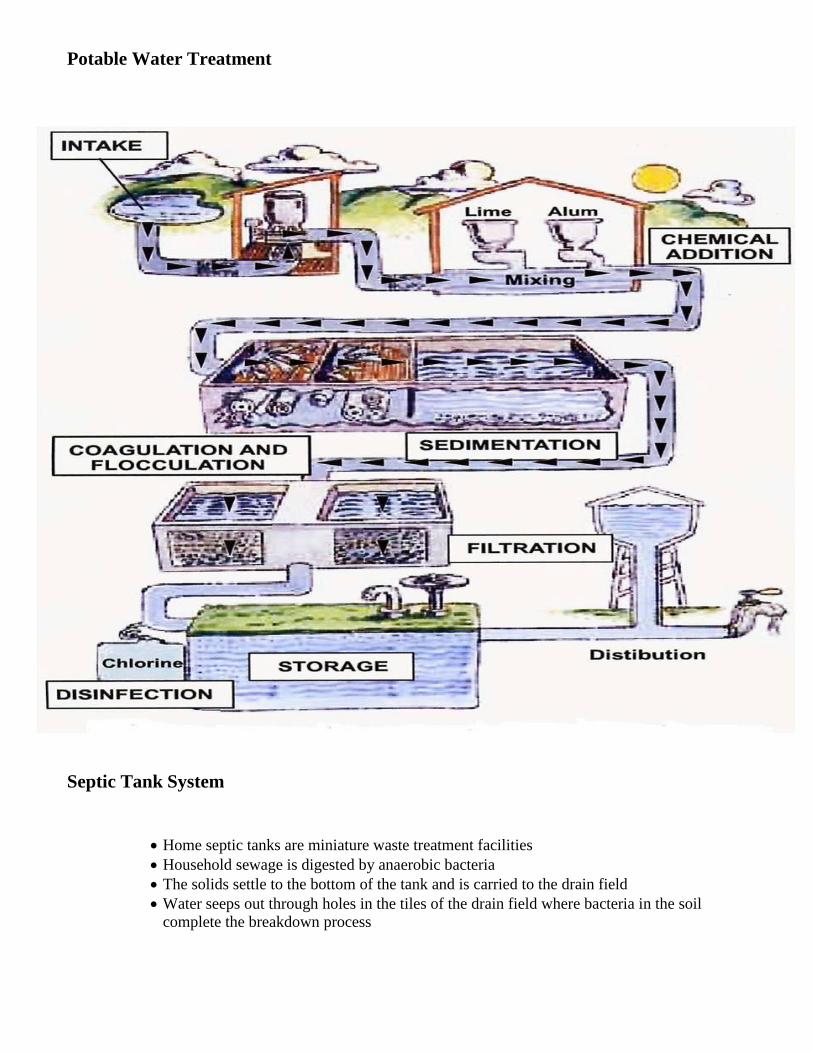
Potable Water Treatment
Septic Tank System
Home septic tanks are miniature waste treatment facilities
Household sewage is digested by anaerobic bacteria
The solids settle to the bottom of the tank and is carried to the drain field
Water seeps out through holes in the tiles of the drain field where bacteria in the soil
complete the breakdown process
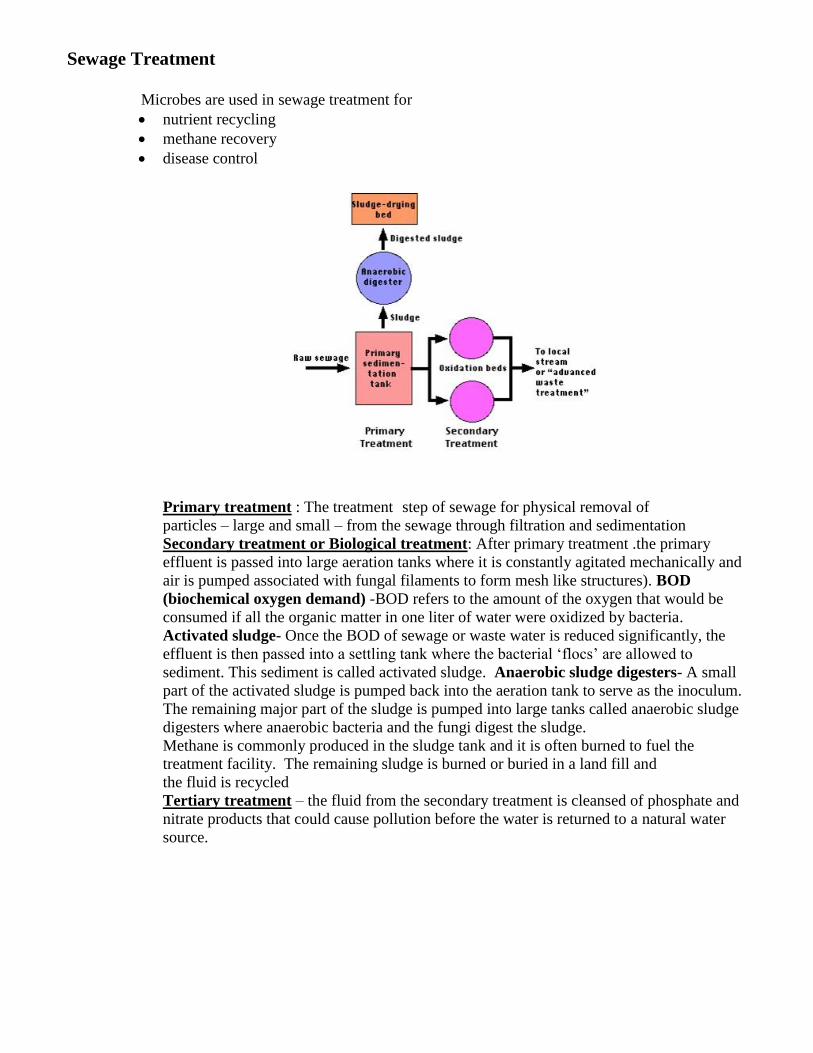
Sewage Treatment
Microbes are used in sewage treatment for
nutrient recycling
methane recovery
disease control
Primary treatment : The treatment step of sewage for physical removal of
particles – large and small – from the sewage through filtration and sedimentation
Secondary treatment or Biological treatment: After primary treatment .the primary
effluent is passed into large aeration tanks where it is constantly agitated mechanically and
air is pumped associated with fungal filaments to form mesh like structures). BOD
(biochemical oxygen demand) -BOD refers to the amount of the oxygen that would be
consumed if all the organic matter in one liter of water were oxidized by bacteria.
Activated sludge- Once the BOD of sewage or waste water is reduced significantly, the
effluent is then passed into a settling tank where the bacterial ‘flocs’ are allowed to
sediment. This sediment is called activated sludge. Anaerobic sludge digesters- A small
part of the activated sludge is pumped back into the aeration tank to serve as the inoculum.
The remaining major part of the sludge is pumped into large tanks called anaerobic sludge
digesters where anaerobic bacteria and the fungi digest the sludge.
Methane is commonly produced in the sludge tank and it is often burned to fuel the
treatment facility. The remaining sludge is burned or buried in a land fill and
the fluid is recycled
Tertiary treatment – the fluid from the secondary treatment is cleansed of phosphate and
nitrate products that could cause pollution before the water is returned to a natural water
source.
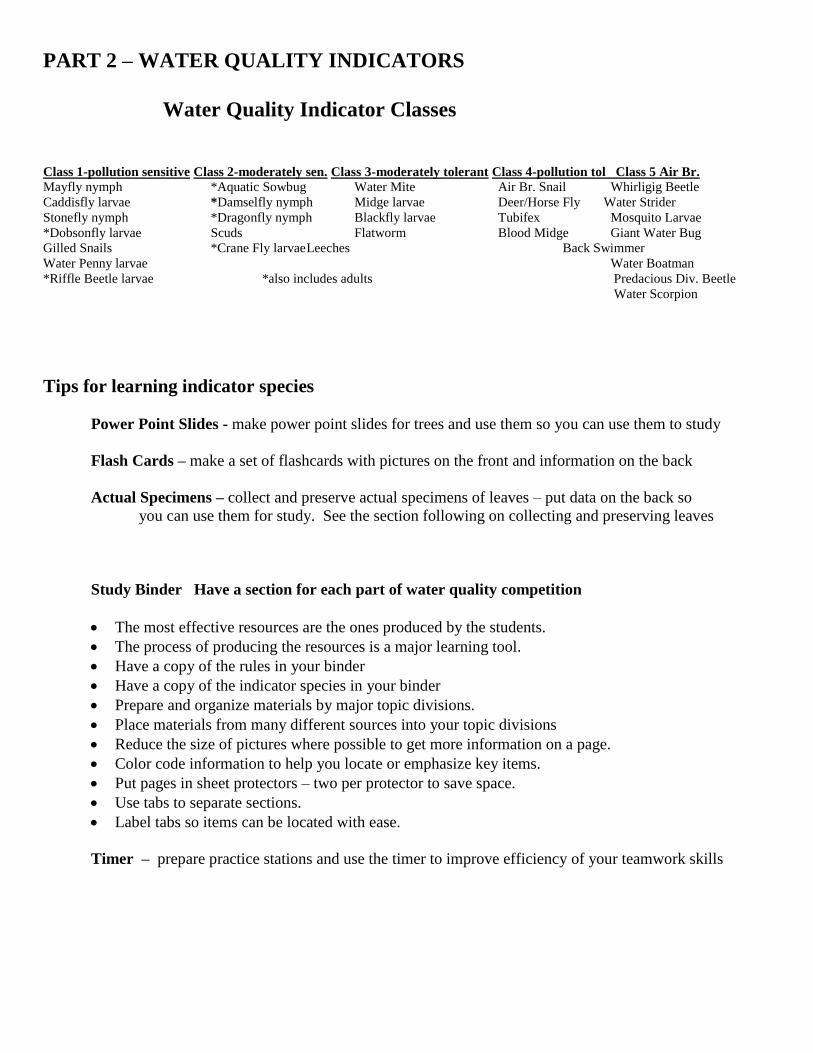
PART 2 – WATER QUALITY INDICATORS
Water Quality Indicator Classes
Class 1-pollution sensitive Class 2-moderately sen. Class 3-moderately tolerant Class 4-pollution tol Class 5 Air Br. Mayfly nymph *Aquatic Sowbug Water Mite Air Br. Snail Whirligig Beetle
Caddisfly larvae *Damselfly nymph Midge larvae Deer/Horse Fly Water Strider
Stonefly nymph *Dragonfly nymph Blackfly larvae Tubifex Mosquito Larvae
*Dobsonfly larvae Scuds Flatworm Blood Midge Giant Water Bug
Gilled Snails *Crane Fly larvae Leeches Back Swimmer
Water Penny larvae Water Boatman
*Riffle Beetle larvae *also includes adults Predacious Div. Beetle
Water Scorpion
Tips for learning indicator species
Power Point Slides - make power point slides for trees and use them so you can use them to study
Flash Cards – make a set of flashcards with pictures on the front and information on the back
Actual Specimens – collect and preserve actual specimens of leaves – put data on the back so
you can use them for study. See the section following on collecting and preserving leaves
Study Binder Have a section for each part of water quality competition
The most effective resources are the ones produced by the students.
The process of producing the resources is a major learning tool.
Have a copy of the rules in your binder
Have a copy of the indicator species in your binder
Prepare and organize materials by major topic divisions.
Place materials from many different sources into your topic divisions
Reduce the size of pictures where possible to get more information on a page.
Color code information to help you locate or emphasize key items.
Put pages in sheet protectors – two per protector to save space.
Use tabs to separate sections.
Label tabs so items can be located with ease.
Timer – prepare practice stations and use the timer to improve efficiency of your teamwork skills


PART 3 WATER MONITORING AND ANAYSIS
Chemical Analysis – Understand what the chemical is, how it is tested, and why it is important to
water quality
• Salinity - only actual testing with salinometer -
• pH – hydrogen ion concentration
• Phosphates – amount of organic and inorganic phosphate in the water
• Dissolved oxygen – (DO) – amount of oxygen dissolved in the water
• Temperature – used to detect differences in water temperature
• Nitrates – amount of nitrates in the water
• Fecal Coliform – Coliform bacteria found in human feces of humans or other warm blooded
animals
• Total solids or total residue – dissolved solids and suspended solids
• Biochemical oxygen demand (BOD) – quantity of oxygen used by aerobic microbes in aerobic
oxidation of organic matter
Their relationship to one another
Sample Case Study Problem
Using the picture below, explain all of the possible human caused problems that can occur. In
addition, what types of chemical testing would you perform to confirm your suspicions?