Embed Size (px)
Citation preview

Co.Reg.no.: 193200032W 1
Media Release
OCBC Group Full Year 2012 Net Profit After Tax
Up 73% to S$3.99 billion
Record 2012 core earnings driven by broad-based income growth
Singapore, 15 February 2013 - Oversea-Chinese Banking Corporation Limited (“OCBC Bank”)
reported a net profit after tax of S$3.99 billion for the financial year ended 31 December 2012
(“FY12”), an increase of 73% from S$2.31 billion in 2011 (“FY11”). Core net profit after tax, which
excludes gains from the divestment of non-core assets, grew 24% to a record S$2.83 billion, as
compared to S$2.28 billion a year ago. The results were driven by a combination of record net
interest income, fee income and net trading income as well as significantly higher contributions from
Great Eastern Holdings (“GEH”).
Net interest income grew to a record S$3.75 billion, a 10% increase from S$3.41 billion in 2011, driven
by strong asset growth which more than offset a reduction in net interest margin. Average balances of
non-bank customer loans grew 15% year-on-year, across various industry sectors in Singapore and
key overseas markets. Net interest margin, however, narrowed 9 basis points to 1.77%, due to the
continued low interest rate environment, limited gapping opportunities and the re-pricing of mortgage
loans in response to market competition. The ratio of current and savings deposits to total non-bank
deposits increased further to 50.6%, up from 46.4% a year ago, while our loans-to-deposits ratio was
maintained at 86.2%, a level comparable to a year ago. Non-interest income, excluding divestment
gains, was 31% higher at S$2.90 billion as compared to S$2.21 billion a year ago. Fee and
commission income reached a new high of S$1.20 billion, driven by the sustained growth of the
Group‟s wealth management franchise, including Bank of Singapore, and supported by higher loan-
related and trade-related fees. Net trading income increased to S$515 million from S$217 million in
the previous year, largely from securities and derivatives trading. Life assurance profit from Great
Eastern Holdings increased 81% to S$692 million, from S$383 million in 2011, led by continued
underwriting income growth and improved investment performance. The Group‟s divestment gains of
S$1.32 billion (S$1.17 billion post-tax) during the year were largely attributable to the sale of its stakes
in Fraser and Neave, Limited (“F&N”) and Asia Pacific Breweries Limited (“APB”) in August 2012.
Compared with total core income, which grew 18% to S$6.65 billion, operating expenses rose 11% to
S$2.70 billion, from S$2.43 billion a year ago. This generated a 24% increase in operating profit, to
S$3.95 billion for the year. Staff costs grew 14% to S$1.65 billion, from S$1.45 billion in 2011, largely
from headcount growth of 8% to support the Group‟s expansion in Singapore and overseas markets.
The increase in staff costs was also attributable to salary increments, higher incentive compensation
and sales commissions associated with stronger business volumes. The cost-to-income ratio of
40.6% improved from 43.2% in the previous year. Net allowances of S$271 million were 23% higher
as compared to S$221 million in 2011, while the non-performing loans (“NPL”) ratio improved to 0.8%,
from 0.9% a year ago.

Co.Reg.no.: 193200032W 2
Return on equity, based on core earnings, of 12.5% was higher as compared to 11.1% in 2011. Core
earnings per share rose 22% to 79.1 cents, from 64.8 cents a year ago.
The Group‟s revenue from various wealth management activities (comprising insurance, private
banking, asset management, stockbroking and sales of other wealth management products), grew to
S$1.84 billion for 2012, a 43% increase from S$1.29 billion a year ago. As a share of total revenue,
wealth management contributed 28%, compared with 23% in 2011. OCBC‟s private banking business
maintained its strong growth momentum, with assets under management increasing 35% to US$43
billion (S$52 billion) as at 31 December 2012, up from US$32 billion (S$41 billion) the previous year.
Fourth Quarter Performance
Net profit after tax for the fourth quarter of 2012 (“4Q12”) was S$663 million, 12% higher from S$594
million a year ago (“4Q11”). Net interest income of S$921 million was relatively unchanged year-on-
year. The positive impact arising from loan growth was reduced by a 15 basis point decline in net
interest margin, attributed to pricing competition and limited interbank gapping opportunities in a flat
yield curve environment. Non-interest income grew 32% to S$757 million from S$572 million in 4Q11.
Fee income of S$304 million was 18% higher year-on-year, led by strong growth in wealth
management income and loan-related fees. Net trading income declined 17% to S$136 million from
S$163 million a year ago, while profit from life assurance more than quadrupled to S$210 million,
boosted by strong underwriting profits and improved investment performance of GEH‟s Non-
Participating Fund. Operating expenses of S$724 million increased 17% as compared to S$620
million the previous year, mainly from higher staff costs and other expenses linked to higher business
volumes. Allowances of S$68 million were 14% lower than S$78 million a year ago, as decline in
specific allowances was partly offset by higher portfolio allowances.
4Q12‟s core net profit was 8% lower than the previous quarter, as lower net interest income and
higher expenses more than offset an increase in fee income and profit from life assurance.
Allowances and Asset Quality
The Group‟s asset quality and coverage ratios remained strong. As at 31 December 2012, total non-
performing assets (“NPAs”) declined 18% year-on-year and 7% quarter-on-quarter to S$1.17 billion.
The NPL ratio as at 31 December 2012 was 0.8%, an improvement from 0.9% a year ago, and stable
quarter-on-quarter.
Net allowances increased 23% to S$271 million, higher as compared to S$221 million in 2011.
Specific allowances for loans, net of recoveries and write-backs amounted to S$115 million, 46%
higher than S$79 million a year ago. Specific allowances remained at a low level of 8 basis points of
loans for the full year. Portfolio allowances grew 16% to S$148 million, from S$127 million in 2011, in
line with strong loan growth. Total cumulative allowances represented 142% of total NPAs and 333%
of unsecured NPAs, a higher coverage ratio as compared with 107% and 326% respectively of the
prior year-end, 31 December 2011.

Co.Reg.no.: 193200032W 3
Subsidiaries’ Results
GEH reported a net profit after tax for the year of S$1.19 billion, which included divestment gains of
S$422 million from the sale of its stakes in F&N and APB. Excluding the divestment gains, net profit
reached a record of S$768 million for the year, as compared to S$386 million in 2011. This was
underpinned by double-digit growth in underwriting profit, increased net investment income and higher
mark-to-market gains. GEH‟s underlying insurance business continued to register sound growth, with
new business weighted premiums increasing 5% year-on-year, driven by increased demand for
regular premium products. In particular, the Group‟s bancassurance channel reported strong growth
across our key markets, reflecting the increased collaboration efforts within the Group.
GEH‟s contribution to the Group‟s core net profit after tax, excluding divestment gains and after
deducting amortisation of intangible assets and non-controlling interests, increased 109% to S$622
million, from S$297 million the previous year, contributing 22% of the Group‟s core earnings in 2012.
OCBC Bank (Malaysia) Berhad reported a 4% increase in full year net profit to MYR811 million (S$328
million). Broad-based revenue growth was driven by a 2% rise in net interest income, healthy Islamic
Financing income growth of 34% and an increase in non-interest income of 12%. Expenses increased
14% as compared to the previous year, and net allowances fell 13%. Loans grew 12% year-on-year,
while the NPL ratio improved to 2.1%, from 2.6% a year ago.
Bank OCBC NISP‟s net profit rose 22% to IDR915 billion (S$122 million) from IDR753 billion (S$108
million) a year ago. Net interest income increased 14% from 2011, underpinned by broad-based loan
growth of 28%, and non-interest income was 28% higher year-on-year. Expenses grew 14% for the
year; while net allowances increased 17%. Asset quality remained healthy, with the NPL ratio
improving to 0.9% from 1.3% a year ago, while the coverage ratio was in excess of 200%.
Capital Position
OCBC Group continues to be strongly capitalised, with a Tier 1 capital adequacy ratio (“CAR”) of
16.6% and total CAR of 18.5% as at 31 December 2012. These ratios were well above the regulatory
minimum of 6% and 10%, respectively. The Group‟s core Tier 1 ratio, which excludes Tier 1
preference shares, was 12.8% as at 31 December 2012, compared with 11.4% in December 2011.
The ratios were higher than the previous year, largely as a result of higher earnings and retention of
the realised gains from the divestment of the Group‟s shareholdings in F&N and APB, and from the
issuance of preference shares and subordinated notes during the year. With the increase in capital,
the Group is comfortably positioned to meet MAS‟ capital requirements under Basel III.
Final Dividend
The Board has proposed a final tax-exempt dividend of 17 cents per share, bringing the FY12 total
dividend to 33 cents per share, an increase from 30 cents in FY11. The estimated total net dividend of
S$1.13 billion for 2012 represents 40% of the Group‟s core net profit after tax of S$2.83 billion.

Co.Reg.no.: 193200032W 4
CEO’s Comments
Commenting on the Group‟s performance and outlook, CEO Samuel Tsien said:
“Despite 2012 being a challenging year which saw lower GDP growth in Singapore and continued
structural weaknesses in major economies, the consistent execution of our focused strategy has
served us well. We achieved record earnings, grew our businesses across all customer sectors and
further strengthened our financial position with strong capital ratios, a high level of liquidity and sound
asset quality. Although the market outlook remains uncertain, we expect the global economy to post
low-to-moderate growth in the year ahead. We are well-positioned to continue to drive sustainable
growth in our key geographies and businesses, and are well-placed to pursue new opportunities.”

Co.Reg.no.: 193200032W 5
About OCBC Bank
OCBC Bank is the longest established Singapore bank, formed in 1932 from the merger of three local
banks, the oldest of which was founded in 1912. It is now the second largest financial services group
in Southeast Asia by assets and one of the world‟s most highly-rated banks, with an Aa1 rating from
Moody‟s. It is ranked by Bloomberg Markets as the world‟s strongest bank in 2011 and 2012.
OCBC Bank and its subsidiaries offer a broad array of specialist financial and wealth management
services, ranging from consumer, corporate, investment, private and transaction banking to treasury,
insurance, asset management and stockbroking services.
OCBC Bank‟s key markets are Singapore, Malaysia, Indonesia and Greater China. It has a network of
over 470 branches and representative offices in 15 countries and territories, including about 350
branches and offices in Indonesia that are operated by its subsidiary, Bank OCBC NISP.
OCBC Bank's insurance subsidiary, Great Eastern Holdings, is the largest insurance group in
Singapore and Malaysia by assets. Its asset management subsidiary, Lion Global Investors, is one of
the largest private sector asset management companies in Southeast Asia. Private banking services
are provided by subsidiary Bank of Singapore, which continued to gain industry recognition in 2011
including being voted the “Outstanding Private Bank in Asia Pacific” by Private Banker International.
For more information, please visit www.ocbc.com
For more information, please contact:
Koh Ching Ching
Head, Group Corporate Communications
Tel: (65) 6530 4890
Fax: (65) 6535 7477
Collins Chin
Head, Investor Relations
Tel: (65) 6530 1592
Fax: (65) 6532 6001

Co. Reg. no.: 193200032W ▌
To Our Shareholders
The Board of Directors of Oversea-Chinese Banking Corporation Limited (“OCBC”) reports the following:
Audited Financial Results for the Financial Year Ended 31 December 2012
For the financial year ended 31 December 2012, Group reported net profit after tax was S$3.99 billion.
Details of the audited financial results are in the accompanying Group Financial Report.
Ordinary Dividend
A final tax exempt dividend of 17 cents per share has been recommended for the financial year 2012.
Including the interim net dividend of 16 cents per share paid in August 2012, total dividends for financial
year 2012 would amount to 33 cents per share, an increase of 10% over the 30 cents paid for financial year
2011.
Closure of Books
The books closure date is 3 May 2013. Please refer to the separate announcement titled “Notice of Books
Closure and Payment of Final One-Tier Tax-Exempt Dividend On Ordinary Shares For The Financial Year
Ended 31 December 2012” released by the Bank today.
Scrip Dividend Scheme
The Oversea-Chinese Banking Corporation Limited Scrip Dividend Scheme, which was approved by the
Shareholders of the Bank at the Extraordinary General Meeting on 8 June 1996, will not be applicable to
the final dividend.
Preference Dividends
On 20 December 2012, the Bank paid semi-annual tax exempt dividends on its non-cumulative non-
convertible preference shares as follows: Class B Preference Shares at 5.1% (2011: 5.1%) per annum;
Class E Preference Shares at 4.5% (2011: 4.5%) per annum, Class G Preference Shares at 4.2% (2011:
4.2%) per annum and Class M Preference Shares at 4.0% per annum (2011: not applicable). Total
amount of dividends paid for the Class B, Class E, Class G and Class M Preference Shares were S$25.6
million, S$11.3 million, S$8.3 million and S$17.1 million respectively.
The S$500,000,000 4.5% Class E Preference Shares was fully redeemed on 28 January 2013, as
announced to the SGX-ST.
Peter Yeoh Secretary
Singapore, 15 February 2013
More details on the results are available on the Bank‟s website at www.ocbc.com


Oversea-Chinese Banking Corporation Limited
Financial Year 2012 Group Financial Report
Incorporated in Singapore Company Registration Number: 193200032W
2012 Financial Results ▌ 1
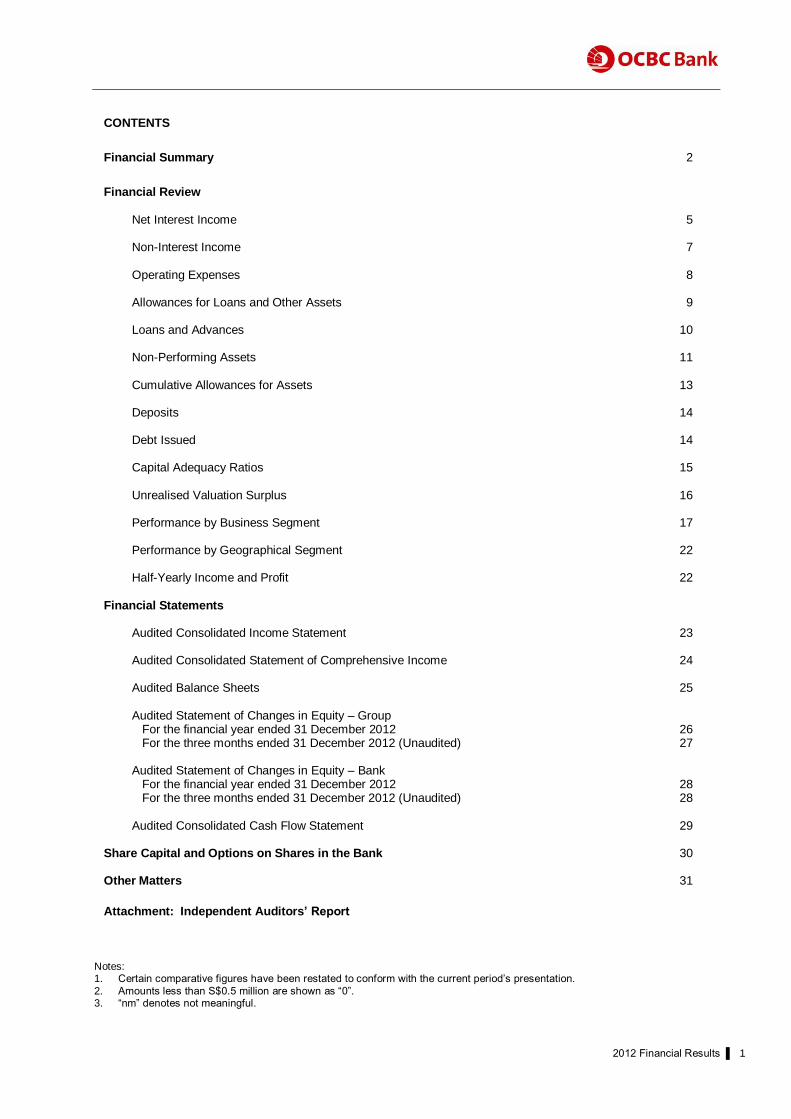
CONTENTS
Financial Summary 2
Financial Review Net Interest Income 5 Non-Interest Income 7 Operating Expenses 8 Allowances for Loans and Other Assets 9 Loans and Advances 10 Non-Performing Assets 11 Cumulative Allowances for Assets 13 Deposits 14 Debt Issued 14 Capital Adequacy Ratios 15 Unrealised Valuation Surplus 16 Performance by Business Segment 17 Performance by Geographical Segment 22 Half-Yearly Income and Profit 22 Financial Statements Audited Consolidated Income Statement 23 Audited Consolidated Statement of Comprehensive Income 24 Audited Balance Sheets 25 Audited Statement of Changes in Equity – Group
For the financial year ended 31 December 2012 26 For the three months ended 31 December 2012 (Unaudited) 27
Audited Statement of Changes in Equity – Bank
For the financial year ended 31 December 2012 28 For the three months ended 31 December 2012 (Unaudited) 28
Audited Consolidated Cash Flow Statement 29 Share Capital and Options on Shares in the Bank 30 Other Matters 31
Attachment: Independent Auditors’ Report Notes: 1. Certain comparative figures have been restated to conform with the current period‟s presentation.
2. Amounts less than S$0.5 million are shown as “0”. 3. “nm” denotes not meaningful.

2012 Financial Results ▌ 2
FINANCIAL SUMMARY
OCBC Group prepares its financial statements in accordance with the Singapore Financial Reporting
Standards (“FRS”) as required by the Singapore Companies Act, including the modification to FRS 39
Financial Instruments: Recognition and Measurement requirement on loan loss provisioning under Notice
to Banks No. 612 “Credit Files, Grading and Provisioning” issued by the Monetary Authority of Singapore.
The following revised financial reporting standards and interpretations were applied with effect from 1
January 2012:
FRS 12 (Amendments): Deferred Tax: Recovery of Underlying Assets
FRS 107 (Amendments): Disclosures: Transfers of Financial Assets
The initial application of the above standards and interpretations does not have any material impact on
the Group‟s financial statements.
Financial Results
Group net profit after tax for the financial year ended 31 December 2012 ("FY12") was S$3.99 billion, an
increase of 73% compared with S$2.31 billion a year ago ("FY11"). Excluding divestment gains, core net
profit after tax grew 24% year-on-year to S$2.83 billion, from S$2.28 billion in FY11, led by record net
interest income, fee and trading income, as well as significantly higher insurance income contributions.
Net interest income rose 10% to S$3.75 billion, from S$3.41 billion in FY11, underpinned by strong asset
growth which outpaced the decline in net interest margin. Core non-interest income, excluding divestment
gains of S$1.17 billion from the sale of non-core assets, grew 31% to S$2.90 billion, from S$2.21 billion a
year ago. Fees and commissions increased by 5% to S$1.20 billion, from S$1.14 billion in FY11, largely
attributable to higher wealth management and loan-related fee income. Net trading income increased to
S$515 million from S$217 million in the previous year, largely from securities and derivatives trading.
Profit from life assurance increased by 81% to S$692 million, compared with S$383 million a year ago.
Operating expenses increased 11% to S$2.70 billion, from S$2.43 billion in FY11, largely from higher staff
costs and expenses associated with stronger business volumes. Allowances for loans and other assets
were S$271 million, an increase of 23% compared with S$221 million in FY11. The Group‟s non-
performing loans (“NPL”) ratio was 0.8%, an improvement from 0.9% a year ago.
Return on equity, based on core earnings, was 12.5% in FY12, compared with 11.1% in FY11. Core
earnings per share for the year was 79.1 cents, an increase of 22% compared with 64.8 cents a year ago.
Group net profit after tax for the fourth quarter of 2012 (“4Q12”) was S$663 million, an increase of 12%
year-on-year from S$594 million, and 8% lower quarter-on-quarter from S$724 million. The year-on-year
increase was underpinned by strong growth in non-interest income, largely from higher wealth
management and loan-related fees.

2012 Financial Results ▌ 3
FINANCIAL SUMMARY (continued)
S$ million 2012 2011 +/(-) 4Q12 4Q11 +/(-) 3Q12 +/(-)
% % %
Selected Income Statement Items
Net interest income 3,748 3,410 10 921 925 – 944 (2)
Non-interest income 2,897 2,212 31 757 572 32 754 –
Total core income 6,645 5,622 18 1,678 1,497 12 1,698 (1)
Operating expenses (2,695) (2,430) 11 (724) (620) 17 (685) 6
Operating profit before
allowances and amortisation 3,950 3,192 24 954 877 9 1,013 (6)
Amortisation of intangible assets (60) (61) (2) (15) (16) (3) (15) –
Allowances for loans
and impairment of other assets (271) (221) 23 (68) (78) (14) (70) (3)
Operating profit after
allowances and amortisation 3,619 2,910 24 871 783 11 928 (6)
Share of results of
associates and joint ventures 27 7 271 5 (26) 116 4 7
Profit before income tax 3,646 2,917 25 876 757 16 932 (6)
Core net profit attributable to
shareholders 2,825 2,280 24 663 594 12 724 (8)
Divestment gain, net of tax 1,168 32 nm – – – 1,126 (100)
Reported net profit
attributable to shareholders 3,993 2,312 73 663 594 12 1,850 (64)
Cash basis net profit
attributable to shareholders 1/
4,053 2,373 71 678 610 11 1,865 (64)
Selected Balance Sheet Items
Ordinary equity 22,909 20,675 11 22,909 20,675 11 22,062 4
Total equity (excluding
non-controlling interests) 25,804 22,571 14 25,804 22,571 14 24,958 3
Total assets 295,943 277,758 7 295,943 277,758 7 288,314 3
Assets excluding life assurance
fund investment assets 243,672 228,670 7 243,672 228,670 7 237,029 3
Loans and bills receivable
(net of allowances) 142,376 133,557 7 142,376 133,557 7 138,140 3
Deposits of non-bank customers 165,139 154,555 7 165,139 154,555 7 157,528 5
Note:
1. Excludes amortisation of intangible assets.

2012 Financial Results ▌ 4
FINANCIAL SUMMARY (continued)
2012 2011 4Q12 4Q11 3Q12
Key Financial Ratios
- based on core earnings
Performance ratios (% p.a.)
Return on equity 1/ 2/
SFRS3/ basis
12.5 11.1 11.2 11.2 12.8
Cash basis 12.8 11.4 11.5 11.5 13.0
Return on assets 4/
SFRS3/ basis 1.19 1.09 1.10 1.05 1.21
Cash basis
1.22 1.12 1.12 1.08 1.23
Revenue mix/efficiency ratios (%)
Net interest margin (annualised) 1.77 1.86 1.70 1.85 1.75
Net interest income to total income
56.4 60.7 54.9 61.8 55.6
Non-interest income to total income
43.6 39.3 45.1 38.2 44.4
Cost to income 40.6 43.2 43.1 41.4 40.3
Loans to deposits 86.2 86.4 86.2 86.4 87.7
NPL ratio 0.8 0.9 0.8 0.9 0.8
Earnings per share 2/ (annualised - cents)
Basic earnings 79.1 64.8 73.1 66.0 80.7
Basic earnings (cash basis) 80.8 66.7 74.8 67.8 82.4
Diluted earnings 78.9 64.7 72.9 65.8 80.5
Net asset value per share (S$)
Before valuation surplus 6.68 6.02 6.68 6.02 6.43
After valuation surplus 7.95 7.04 7.95 7.04 7.63
Capital adequacy ratios (%)
Tier 1 16.6 14.4 16.6 14.4 15.9
Total 18.5 15.7 18.5 15.7 18.0
Notes: 1.
Preference equity and non-controlling interests are not included in the computation for return on equity.
2. Calculated based on core net profit less preference dividends paid and estimated to be due at the end of the financial period.
3. “SFRS” refers to Singapore Financial Reporting Standards.
4. Computation of return on assets excludes life assurance fund investment assets.

2012 Financial Results ▌ 5
NET INTEREST INCOME
Average Balance Sheet
2012 2011
Average Average Average Average S$ million Balance Interest Rate Balance Interest Rate
% % Interest earning assets
Loans and advances to non-bank customers 136,137 4,173 3.07 118,744 3,675 3.10 Placements with and loans to banks 41,890 962 2.30 34,207 850 2.48 Other interest earning assets
1/ 33,716 833 2.47 29,979 795 2.65
Total 211,743 5,968 2.82 182,930 5,320 2.91
Interest bearing liabilities Deposits of non-bank customers 158,564 1,715 1.08 136,485 1,444 1.06 Deposits and balances of banks 21,346 189 0.88 22,365 187 0.83 Other borrowings
2/ 17,134 316 1.84 11,262 279 2.48
Total 197,044 2,220 1.13 170,112 1,910 1.12
Net interest income/margin
3/ 3,748 1.77 3,410 1.86
4Q12 4Q11 3Q12
Average Average Average Average Average Average S$ million Balance Interest Rate
4/ Balance Interest Rate
4/ Balance Interest Rate
4/
% % % Interest earning assets
Loans and advances to non-bank customers 140,166 1,070 3.04 130,340 992 3.02 137,530 1,045 3.02 Placements with and loans to banks 39,223 181 1.83 36,599 263 2.85 43,309 241 2.21 Other interest earning assets
1/ 35,902 215 2.38 31,850 208 2.60 34,114 215 2.51
Total 215,291 1,466 2.71 198,789 1,463 2.92 214,953 1,501 2.78
Interest bearing liabilities Deposits of non-bank customers 161,523 422 1.04 150,724 419 1.10 159,330 428 1.07 Deposits and balances of banks 22,651 43 0.75 20,745 47 0.90 21,043 52 0.98 Other borrowings
2/ 14,968 80 2.13 13,516 72 2.13 19,151 77 1.60
Total 199,142 545 1.09 184,985 538 1.15 199,524 557 1.11
Net interest income/margin
3/ 921 1.70 925 1.85 944 1.75
Notes:
1.
Comprise corporate debt and government securities.
2. Mainly debt issued.
3. Net interest margin is net interest income as a percentage of interest earning assets.
4. Average rates are computed on an annualised basis.

2012 Financial Results ▌ 6
NET INTEREST INCOME (continued)
Net interest income increased 10% to S$3.75 billion, from S$3.41 billion in FY11, led by a 16% increase
in interest earning assets, which more than offset a decline in net interest margin of 9 basis points to
1.77%, from 1.86% a year ago. The margin compression was largely attributable to the continued low
interest rate environment, limited gapping opportunities and the re-pricing of mortgage loans in response
to market competition.
Net interest income for 4Q12 was stable year-on-year, as asset growth was offset by a 15 basis point
decline in net interest margin, primarily from pricing competition and limited interbank gapping
opportunities in a flat yield curve environment. Compared with 3Q12, net interest income declined
marginally by 2% to S$921 million, from S$944 million the previous quarter.
Volume and Rate Analysis
2012 vs 2011 4Q12 vs 4Q11 4Q12 vs 3Q12
Increase/(decrease) due to change in: S$ million Volume Rate
Net change
Volume Rate Net
change
Volume Rate Net
change
Interest income
Loans and advances
to non-bank customers 540 (52) 488 75 3 78 20 5 25
Placements with and
loans to banks 192 (82) 110 19 (101) (82) (23) (37) (60)
Other interest earning
assets 99 (64) 35 27 (20) 7 12 (12) (0)
Total 831 (198) 633 121 (118) 3 9 (44) (35)
Interest expense
Deposits of non-bank
customers 234 34 268 30 (27) 3 6 (12) (6)
Deposits and balances
of banks (8) 10 2 5 (9) (4) 4 (13) (9)
Other borrowings 146 (111) 35 8 (0) 8 (17) 20 3
Total 372 (67) 305 43 (36) 7 (7) (5) (12)
Impact on net interest income 459 (131) 328 78 (82) (4) 16 (39) (23)
Due to change
in number of days 10 – –
Net interest income 338 (4) (23)

2012 Financial Results ▌ 7
NON-INTEREST INCOME
S$ million 2012 2011 +/(-) 4Q12 4Q11 +/(-) 3Q12 +/(-)
% % %
Fees and commissions
Brokerage 60 69 (13) 14 13 8 16 (8)
Wealth management 322 252 28 89 56 61 82 9
Fund management 86 101 (15) 23 24 (3) 21 9
Credit card 51 48 6 14 13 1 13 5
Loan-related 251 216 16 70 57 23 64 9
Trade-related and remittances 213 208 2 50 49 1 55 (10)
Guarantees 18 21 (17) 5 5 (9) 5 4
Investment banking 91 95 (4) 14 12 11 21 (35)
Service charges 78 94 (17) 19 18 14 18 9
Others 28 33 (12) 6 10 (43) 8 (26)
Sub-total 1,198 1,137 5 304 257 18 303 1
Dividends 88 88 – 6 7 (15) 14 (60)
Rental income 72 76 (5) 18 19 (6) 18 (1)
Profit from life assurance 692 383 81 210 51 313 190 11
Premium income from general insurance 146 125 17 40 34 17 36 10
Other income
Net trading income 515 217 137 136 163 (17) 144 (6)
Net gain from investment securities 91 120 (25) 13 22 (42) 13 (1)
Net gain from disposal/liquidation of
subsidiaries and associates – 1 (100) – 0 (100) – –
Net gain from disposal of properties 25 4 497 6 2 214 18 (70)
Others 70 61 16 24 17 45 18 42
Sub-total 701 403 74 179 204 (12) 193 (7)
Total core non-interest income 2,897 2,212 31 757 572 32 754 –
Divestment gain 1,316 39 nm – – – 1,260 (100)
Total non-interest income 4,213 2,251 87 757 572 32 2,014 (62)
Fees and commissions/Total income 1/ 18.0% 20.2% 18.1% 17.2% 17.8%
Non-interest income/Total income 1/ 43.6% 39.3% 45.1% 38.2% 44.4%
Note:
1. Excludes gains from divestment of non-core assets.
Core non-interest income, excluding gains from the divestment of non-core assets, grew 31% to S$2.90 billion in
FY12, from S$2.21 billion a year ago. Fees and commissions rose 5% year-on-year to S$1.20 billion, from S$1.14
billion in FY11, led by higher wealth management income, loan-related and trade-related fees. Net trading income
increased to S$515 million from S$217 million in the previous year, largely from securities and derivatives trading,
while net gains from investment securities declined 25% to S$91 million, as compared with S$120 million in FY11.
Profit from life assurance was S$692 million, an increase of 81% from S$383 million in FY11, underpinned by
continued growth in underwriting profits and the strong investment performance of Great Eastern Holdings' ("GEH")
Non-Participating Fund1.
Non-interest income for 4Q12 rose 32% to S$757 million, from S$572 million in FY11. Fees and commissions grew
18% to S$304 million, compared with S$257 million a year ago, underpinned by higher wealth management income
and loan-related fees. Profit from life assurance more than quadrupled year-on-year to S$210 million, from S$51
million in 4Q11, while net trading income declined 17% to S$136 million from S$163 million. Compared to the
previous quarter, non-interest income was marginally higher at S$757 million, from S$754 million in 3Q12 largely from
higher life assurance profits.
1 The Non-Participating Fund is made up of insurance policies and riders which have fixed policyholder benefits, e.g. term insurance,
critical illness, accident, medical and disability insurance, and in which the policyholders do not participate or share in the profits of the fund.

2012 Financial Results ▌ 8
OPERATING EXPENSES
S$ million 2012 2011 +/(-) 4Q12 4Q11 +/(-) 3Q12 +/(-)
% % %
Staff costs
Salaries and other costs 1,516 1,338 13 397 340 17 399 (1)
Share-based expenses 10 10 (2) 3 2 32 2 26
Contribution to defined
contribution plans 124 100 24 34 20 76 32 8
1,650 1,448 14 434 362 20 433 –
Property and equipment
Depreciation 184 166 11 50 44 13 47 6
Maintenance and hire of
property, plant & equipment 87 75 16 24 21 10 21 15
Rental expenses 70 68 3 18 17 4 17 4
Others 150 142 6 42 38 12 37 15
491 451 9 134 120 11 122 10
Other operating expenses 554 531 4 156 138 13 130 20
Total operating expenses 2,695 2,430 11 724 620 17 685 6
Group staff strength
Period end 24,628 22,892 8 24,628 22,892 8 24,189 2
Average 23,917 22,371 7 24,514 22,849 7 24,154 1
Cost to income ratio 1/ 40.6% 43.2% 43.1% 41.4% 40.3%
Note:
1. Excludes gains from divestment of non-core assets.
Operating expenses increased 11% to S$2.70 billion, from S$2.43 billion a year ago. Staff costs rose
14% to S$1.65 billion from S$1.45 billion in FY11, reflecting the impact of an increase in headcount of 8%
to support business growth in Singapore and overseas markets, as well as higher base salaries and
incentive compensation associated with stronger business volumes. Property and equipment related
expenses were 9% higher year-on-year at S$491 million, compared with S$451 million in FY11, largely
from an increase in depreciation expenses.
Operating expenses of S$724 million in 4Q12 were 17% higher compared with S$620 million a year ago,
mainly contributed by higher staff costs and other expenses to support increased business volumes.
Compared to the previous quarter, operating expenses rose 6%.
The cost-to-income ratio was 40.6% for FY12, an improvement compared with 43.2% a year ago.

2012 Financial Results ▌ 9
ALLOWANCES FOR LOANS AND OTHER ASSETS
S$ million 2012 2011 +/(-) 4Q12 4Q11 +/(-) 3Q12 +/(-)
% % %
Specific allowances/
(write-back) for loans
Singapore 87 47 86 29 33 (15) 22 30
Malaysia 14 10 48 4 (1) 646 1 885
Others 14 22 (38) 2 16 (86) 1 84
115 79 46 35 48 (27) 24 49
Portfolio allowances for loans 148 127 16 43 21 111 31 40
Allowances and impairment
charges/(write-back)
for other assets 8 15 (43) (10) 9 (215) 15 (170)
Allowances for loans and
impairment of other assets 271 221 23 68 78 (14) 70 (3)
Allowances for loans and other assets were S$271 million in FY12, higher as compared with S$221
million.
Specific allowances for loans, net of recoveries and writebacks were S$115 million, up 46% from S$79
million a year ago, with the increase coming mainly from Singapore. Specific allowances remained low at
8 basis points of loans. Portfolio allowances for loans increased 16% year-on-year to S$148 million, from
S$127 million in FY11, in line with strong loan growth.
For 4Q12, net allowances were S$68 million, a decline of 14% from S$78 million a year ago and lower by
3% than the S$70 million in 3Q12.
2012 Financial Results ▌ 10
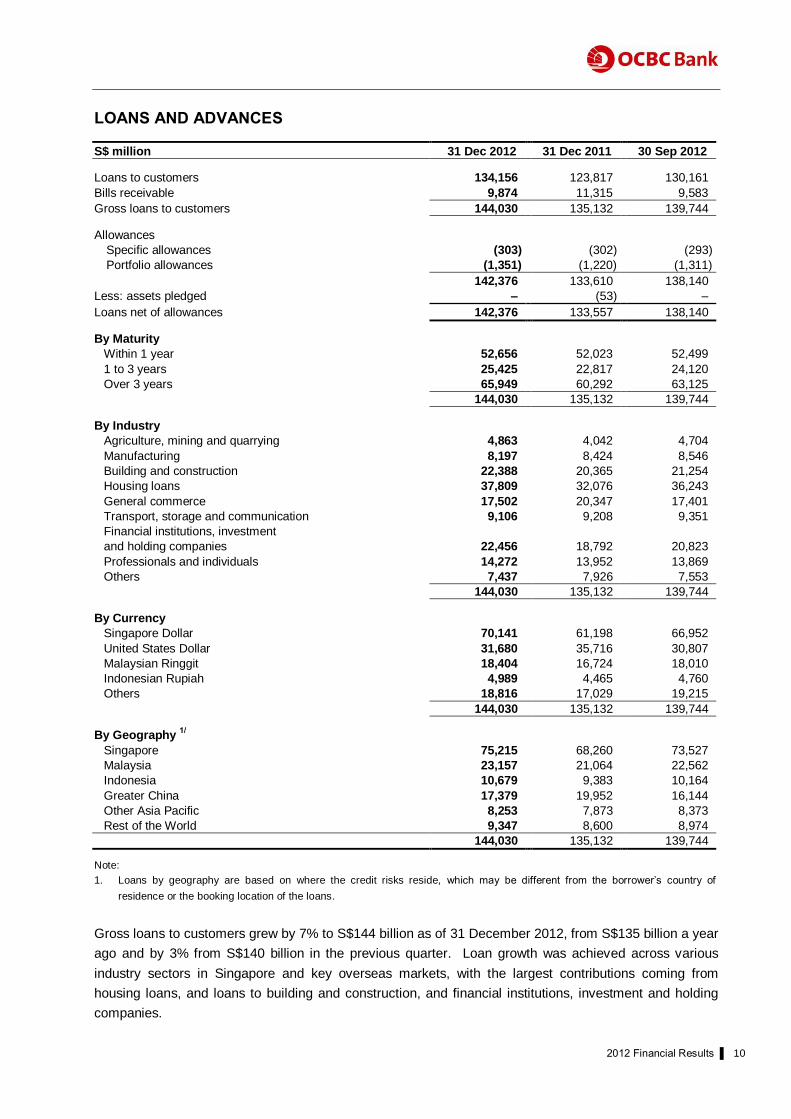
LOANS AND ADVANCES
S$ million 31 Dec 2012 31 Dec 2011 30 Sep 2012
Loans to customers 134,156 123,817 130,161
Bills receivable 9,874 11,315 9,583
Gross loans to customers 144,030 135,132 139,744 Allowances
Specific allowances (303) (302) (293)
Portfolio allowances (1,351) (1,220) (1,311)
142,376 133,610 138,140
Less: assets pledged – (53) –
Loans net of allowances 142,376 133,557 138,140
By Maturity
Within 1 year 52,656 52,023 52,499
1 to 3 years 25,425 22,817 24,120
Over 3 years 65,949 60,292 63,125
144,030 135,132 139,744 By Industry
Agriculture, mining and quarrying 4,863 4,042 4,704
Manufacturing 8,197 8,424 8,546
Building and construction 22,388 20,365 21,254
Housing loans 37,809 32,076 36,243
General commerce 17,502 20,347 17,401
Transport, storage and communication 9,106 9,208 9,351
Financial institutions, investment
and holding companies 22,456 18,792 20,823
Professionals and individuals 14,272 13,952 13,869
Others 7,437 7,926 7,553
144,030 135,132 139,744 By Currency
Singapore Dollar 70,141 61,198 66,952
United States Dollar 31,680 35,716 30,807
Malaysian Ringgit 18,404 16,724 18,010
Indonesian Rupiah 4,989 4,465 4,760
Others 18,816 17,029 19,215
144,030 135,132 139,744 By Geography
1/
Singapore 75,215 68,260 73,527
Malaysia 23,157 21,064 22,562
Indonesia 10,679 9,383 10,164
Greater China 17,379 19,952 16,144
Other Asia Pacific 8,253 7,873 8,373
Rest of the World 9,347 8,600 8,974
144,030 135,132 139,744
Note:
1. Loans by geography are based on where the credit risks reside, which may be different from the borrower‟s country of
residence or the booking location of the loans.
Gross loans to customers grew by 7% to S$144 billion as of 31 December 2012, from S$135 billion a year
ago and by 3% from S$140 billion in the previous quarter. Loan growth was achieved across various
industry sectors in Singapore and key overseas markets, with the largest contributions coming from
housing loans, and loans to building and construction, and financial institutions, investment and holding
companies.

2012 Financial Results ▌ 11
NON-PERFORMING ASSETS
S$ million
Total NPAs
1/ Substandard Doubtful Loss
Secured NPAs/ Total NPAs
NPLs 2/ NPL Ratio
2/
% %
Singapore 31 Dec 2012 258 91 119 48 55.2 258 0.3 30 Sep 2012 313 145 125 43 64.5 313 0.4 31 Dec 2011 390 205 151 34 61.7 330 0.5
Malaysia
31 Dec 2012 432 251 134 47 55.7 409 1.8 30 Sep 2012 521 373 102 46 57.9 438 1.9 31 Dec 2011 580 462 72 46 67.0 486 2.3
Indonesia
31 Dec 2012 60 6 3 51 47.8 60 0.6 30 Sep 2012 67 9 3 55 47.5 67 0.7 31 Dec 2011 77 9 10 58 50.6 77 0.8
Greater China
31 Dec 2012 33 28 0 5 87.9 33 0.2 30 Sep 2012 38 32 6 0 80.5 38 0.2 31 Dec 2011 42 39 3 – 73.1 42 0.2
Other Asia Pacific
31 Dec 2012 281 242 39 – 73.7 281 3.4 30 Sep 2012 270 229 41 – 83.2 270 3.2 31 Dec 2011 240 183 57 – 75.6 135 1.7
Rest of the World
31 Dec 2012 108 99 7 2 23.3 104 1.1 30 Sep 2012 47 38 7 2 64.9 43 0.5 31 Dec 2011 108 94 12 2 80.5 102 1.2
Group
31 Dec 2012 1,172 717 302 153 57.4 1,145 0.8 30 Sep 2012 1,256 826 284 146 65.4 1,169 0.8 31 Dec 2011 1,437 992 305 140 67.3 1,172 0.9
Notes:
1. Comprise non-bank loans, debt securities and contingent liabilities.
2. Exclude debt securities and contingent liabilities.

2012 Financial Results ▌ 12
NON-PERFORMING ASSETS (continued) The Group‟s asset quality remained healthy. Non-performing loans (“NPLs”) declined 2% to S$1.15 billion as of 31
December 2012, compared with S$1.17 billion a year ago. By geography, the decrease was mainly from Singapore
and Malaysia, partly offset by an increase in Other Asia Pacific. By industry segment, the decrease was mainly from
transport, storage and communication, financial institutions, investment and holding companies, and general
commerce.
The Group‟s NPL ratio was 0.8%, an improvement from 0.9% a year ago, and was unchanged from the previous
quarter.
Total non-performing assets (“NPAs”) as at 31 December 2012, which include classified debt securities and
contingent liabilities, were S$1.17 billion, a decline of 18% from S$1.44 billion a year ago, and 7% lower from S$1.26
billion in the previous quarter. Of the total NPAs, 61% were in the substandard category and 57% were secured by
collateral.
31 Dec 2012 31 Dec 2011 30 Sep 2012 % of
gross % of
gross % of
gross S$ million loans S$ million loans S$ million loans
NPLs by Industry
Loans and advances
Agriculture, mining and quarrying 6 0.1 6 0.1 17 0.4
Manufacturing 366 4.5 294 3.5 297 3.5
Building and construction 199 0.9 149 0.7 287 1.4
Housing loans 192 0.5 188 0.6 195 0.5
General commerce 105 0.6 133 0.7 111 0.6
Transport, storage and communication 77 0.8 128 1.4 83 0.9
Financial institutions, investment
and holding companies 88 0.4 130 0.7 64 0.3
Professionals and individuals 87 0.6 114 0.8 87 0.6
Others 25 0.3 30 0.4 28 0.4
Total NPLs 1,145 0.8 1,172 0.9 1,169 0.8
Classified debt securities 4 111 4
Classified contingent liabilities 23 154 83
Total NPAs 1,172 1,437 1,256
31 Dec 2012 31 Dec 2011 30 Sep 2012
S$ million % S$ million % S$ million %
NPAs by Period Overdue
Over 180 days 328 28 512 36 410 33
Over 90 to 180 days 81 7 85 6 88 7
30 to 90 days 160 14 204 14 166 13
Less than 30 days 10 1 25 2 13 1
Not overdue 593 50 611 42 579 46
1,172 100 1,437 100 1,256 100
31 Dec 2012 31 Dec 2011 30 Sep 2012 S$ million Loan Allowance Loan Allowance Loan Allowance
Restructured Loans Substandard 173 10 186 11 250 8 Doubtful 22 33 19 16 18 32 Loss 0 0 2 2 1 1
195 43 207 29 269 41

2012 Financial Results ▌ 13
CUMULATIVE ALLOWANCES FOR ASSETS
S$ million
Total cumulative allowances
Specific allowances
Portfolio allowances
Specific allowances as
% of total NPAs
Cumulative allowances as
% of total NPAs
% %
Singapore
31 Dec 2012 696 105 591 40.8 269.5
30 Sep 2012 667 89 578 28.8 213.5
31 Dec 2011 608 71 537 18.1 155.9
Malaysia
31 Dec 2012 450 133 317 30.8 104.4
30 Sep 2012 446 134 312 25.7 85.6
31 Dec 2011 454 165 289 28.4 78.3
Indonesia
31 Dec 2012 164 39 125 66.2 273.2
30 Sep 2012 157 43 114 63.5 233.0
31 Dec 2011 138 45 93 58.4 180.1
Greater China
31 Dec 2012 170 4 166 10.7 508.9
30 Sep 2012 164 4 160 9.4 428.1
31 Dec 2011 162 3 159 7.7 383.0
Other Asia Pacific
31 Dec 2012 112 20 92 7.1 40.0
30 Sep 2012 106 17 89 6.3 39.4
31 Dec 2011 97 15 82 6.2 40.4
Rest of the World
31 Dec 2012 70 10 60 8.8 64.0
30 Sep 2012 68 10 58 21.7 144.8
31 Dec 2011 73 13 60 12.8 67.6
Group
31 Dec 2012 1,662 311 1,351 26.6 141.8
30 Sep 2012 1,608 297 1,311 23.7 128.1
31 Dec 2011 1,532 312 1,220 21.7 106.6
As at 31 December 2012, the Group‟s total cumulative allowances for assets were S$1.66 billion,
comprising S$311 million in specific allowances and S$1.35 billion in portfolio allowances. Total
cumulative allowances were 142% of total NPAs and 333% of unsecured NPAs, up from 107% and
326%, respectively, as at 31 December 2011.

2012 Financial Results ▌ 14
DEPOSITS
S$ million 31 Dec 2012 31 Dec 2011 30 Sep 2012
Deposits of non-bank customers 165,139 154,555 157,528
Deposits and balances of banks 25,656 21,653 21,240
190,795 176,208 178,768
Loans to deposits ratio (net non-bank loans/non-bank deposits) 86.2%
86.4% 87.7%
S$ million 31 Dec 2012 31 Dec 2011 30 Sep 2012
Total Deposits By Maturity
Within 1 year 188,220 173,432 176,237
1 to 3 years 1,441 2,116 1,418
Over 3 years 1,134 660 1,113
190,795 176,208 178,768
Non-Bank Deposits By Product
Fixed deposits 67,263 70,984 70,580
Savings deposits 30,614 28,536 29,556
Current account 52,904 43,118 44,809
Others 14,358 11,917 12,583
165,139 154,555 157,528
Non-Bank Deposits By Currency
Singapore Dollar 82,095 80,236 81,765
United States Dollar 31,455 21,969 25,544
Malaysian Ringgit 20,739 19,128 21,285
Indonesian Rupiah 5,835 5,158 5,192
Others 25,015 28,064 23,742
165,139 154,555 157,528
Non-bank customer deposits grew 7% year-on-year to S$165 billion as at 31 December 2012, from S$155 billion a
year ago, and 5% quarter-on-quarter from S$158 billion as at 30 September 2012. The year-on-year increase was
driven by 23% growth in current account deposits to S$52.9 billion, from S$43.1 billion in FY11, as well as a 7% rise
in savings deposits to S$30.6 billion, from S$28.5 billion a year ago. The ratio of current and savings deposits to total
non-bank deposits was 50.6%, an improvement compared with 46.4% a year ago.
The Group's loans-to-deposits ratio was 86.2%, compared with 87.7% in the previous quarter and 86.4% a year ago.
DEBT ISSUED
S$ million 31 Dec 2012 31 Dec 2011 30 Sep 2012
Subordinated debt (unsecured) 5,127 4,080 5,474
Fixed and floating rate notes (unsecured) 3,022 659 2,994
Commercial papers (unsecured) 2,832 8,293 8,673
Structured notes (unsecured) 443 31 269
Total 11,424 13,063 17,410
Debt Issued By Maturity
Within one year 3,673 8,319 8,951
Over one year 7,751 4,744 8,459
Total 11,424 13,063 17,410

2012 Financial Results ▌ 15
CAPITAL ADEQUACY RATIOS
S$ million 31 Dec 2012 31 Dec 2011 30 Sep 2012
Tier 1 Capital
Ordinary and preference shares 9,953 9,023 9,956
Disclosed reserves/others 17,829 15,202 17,152
Goodwill/others (6,191) (5,613) (6,174)
Eligible Tier 1 Capital 21,591 18,612 20,934
Tier 2 Capital
Subordinated term notes 4,418 3,343 4,755
Revaluation surplus on available-for-sale
equity securities 236 361 167
Others (2,135) (2,130) (2,103)
Total Eligible Capital 24,110 20,186 23,753
Risk Weighted Assets 129,647 128,507 131,263
Tier 1 capital adequacy ratio 16.6% 14.4% 15.9%
Total capital adequacy ratio 18.5% 15.7% 18.0%
As at 31 December 2012, the Group‟s Tier 1 ratio and total capital adequacy ratio (“CAR”) were 16.6% and
18.5% respectively. These were well above the regulatory minimums of 6% and 10%, respectively. The
Group‟s core Tier 1 ratio, which excludes Tier 1 preference shares, was 12.8% as compared with 11.4% as
at 31 December 2011. The Group‟s Tier 1 ratios improved from their end-2011 levels, primarily
attributable to higher earnings, the retention of the realised gains from the divestment of the Group‟s
shareholdings in Fraser and Neave, Limited and Asia Pacific Breweries Limited, and from the issuance of
preference shares and subordinated notes during the year. The Group is comfortably positioned to meet
MAS‟ capital requirements under Basel III.

2012 Financial Results ▌ 16
UNREALISED VALUATION SURPLUS
S$ million 31 Dec 2012 31 Dec 2011 30 Sep 2012
Properties 1/ 3,117 2,877 2,845
Equity securities 2/ 1,245 636 1,277
Total 4,362 3,513 4,122
Notes:
1. Includes properties classified as investment properties and assets held for sale. Property values are determined mainly based
on external valuations at year-end, with internal reviews performed for other quarters.
2. Comprises mainly investments in quoted subsidiaries, which are valued based on their market prices at the end of each
quarter.
The Group‟s unrealised valuation surplus largely represents the difference between the carrying values of
its properties and investments in quoted subsidiaries and the property values and market prices of the
quoted investments at the respective periods. The carrying values of subsidiaries and associates on the
balance sheet are measured at cost plus post-acquisition reserves, while those of properties are
measured at cost less accumulated depreciation, and impairment, if any.
The valuation surplus as at 31 December 2012 was S$4.36 billion, an increase of 24% from S$3.51 billion
a year ago. The surplus for properties rose by 8% to S$3.12 billion, from S$2.88 billion in FY11 largely as
a result of higher property values in Singapore. The surplus in equity securities valuation increased 96%
year-on-year to S$1.25 billion, from S$636 million a year ago mainly attributable to the Group‟s equity
stakes in GEH and Bank OCBC NISP.

2012 Financial Results ▌ 17
PERFORMANCE BY BUSINESS SEGMENT
OCBC Group‟s businesses are presented in the following customer segments and business activities: Global
Consumer/Private Banking, Global Corporate/Investment Banking, Global Treasury and Markets, and Insurance.
Operating Profit by Business Segment
S$ million 2012 2011 +/(-) 4Q12 4Q11 +/(-) 3Q12 +/(-)
% % %
Global Consumer/Private Banking 589 489 20 149 109 37 156 (4)
Global Corporate/Investment
Banking 1,745 1,389 26 418 320 31 420 –
Global Treasury and Markets 617 479 29 127 231 (45) 178 (29)
Insurance 825 437 89 243 85 185 213 14
Others 1/ (157) 116 (236) (66) 38 (271) (39) 70
Operating profit after
allowances and amortisation 3,619 2,910 24 871 783 11 928 (6)
Note: 1. Excludes gains from divestment of non-core assets.
Global Consumer/Private Banking
Global Consumer/Private Banking provides a full range of products and services to individual customers. At Global
Consumer Banking, the products and services offered include deposit products (checking accounts, savings and fixed
deposits), consumer loans (housing loans and other personal loans), credit cards, wealth management products (unit
trusts, bancassurance products and structured deposits) and brokerage services. Private Banking caters to the
specialised banking needs of high net worth individuals, offering wealth management expertise, including investment
advice and portfolio management services, estate and trust planning, and wealth structuring.
Operating profit after allowances increased 20% to S$589 million from S$489 million in 2011, driven by higher net
interest income and fee income, which offset an increase in expenses and allowances. For 4Q12, operating profit
rose 37% year-on-year to S$149 million from S$109 million, led by broad-based revenue growth which more than
compensated for an increase in expenses.
Global Corporate/Investment Banking
Global Corporate/Investment Banking serves institutional customers ranging from large corporates and the public
sector to small and medium enterprises. The products and services offered include long-term loans such as project
financing, short-term credit such as overdrafts and trade financing, deposit accounts and fee-based services such as
cash management and custodian services. Investment Banking comprises a comprehensive range of financing
solutions, syndicated loans and advisory services, corporate finance services for initial public offerings, secondary
fund-raising, takeovers and mergers, as well as customised and structured equity-linked financing.

2012 Financial Results ▌ 18
PERFORMANCE BY BUSINESS SEGMENT (continued)
Global Corporate/Investment Banking‟s operating profit after allowances grew 26% to S$1.75 billion, from S$1.39
billion a year ago, underpinned by higher net interest income arising from robust loan growth, as well as lower net
allowances. Compared with 4Q11, operating profit after allowances in 4Q12 rose 31% to S$418 million, from S$320
million, driven by strong growth in revenue and a decline in allowances.
Global Treasury and Markets
Global Treasury and Markets is responsible for the management of the Group‟s asset and liability interest rate
positions, engages in foreign exchange activities, money market operations, fixed income and derivatives trading, and
offers structured treasury products and financial solutions to meet customers‟ investment and hedging needs. Income
from treasury products and services offered to customers of other business segments, such as Global
Consumer/Private Banking and Global Corporate/Investment Banking, is reflected in the respective business
segments.
Global Treasury‟s operating profit increased by 29% year-on-year to S$617 million, from S$479 million, largely
attributable to an increase in trading income. 4Q12 operating profit fell 45% year-on-year to S$127 million from
S$231 million, mainly from a decline in net interest income as a result of limited gapping opportunities, as well as
lower trading income.
Insurance
The Group‟s insurance business, including its fund management activities, is undertaken by 87.2%-owned subsidiary
GEH and its subsidiaries, which provide both life and general insurance products to its customers mainly in Singapore
and Malaysia.
GEH reported significant growth in operating profit in 2012 as a result of the strong investment performance in its
Non-Participating Fund and higher underwriting profits. Operating profit rose 89% year-on-year to S$825 million in
2012, from S$437 million. In 4Q12, operating profit more than doubled to S$243 million from S$85 million a year ago.
After tax and non-controlling interests, GEH‟s contribution to the Group‟s core net profit was S$622 million in 2012
and S$185 million in 4Q12, higher than the S$297 million in 2011 and S$49 million in 4Q11.
Others
Others comprise mainly property holding, investment holding and items not attributable to the business segments
described above.

2012 Financial Results ▌ 19
PERFORMANCE BY BUSINESS SEGMENT (continued) Global Global Global Consumer/ Corporate/ Treasury
Private Investment And
S$ million Banking Banking Markets Insurance Others Group
2012 Total income
1/ 1,949 2,658 842 1,063 133 6,645
Operating profit before
allowances and amortisation 1/ 697 1,813 619 872 (51) 3,950
Amortisation of intangible assets (13) – – (47) – (60)
Allowances and impairment
for loans and other assets (95) (68) (2) (0) (106) (271)
Operating profit after
allowances and amortisation 1/
589 1,745 617 825 (157) 3,619
Other information:
Capital expenditure 26 4 0 52 221 303
Depreciation 34 10 2 3 135 184
2011 Total income
1/ 1,698 2,336 693 672 223 5,622
Operating profit before
allowances and amortisation 1/ 574 1,554 484 488 92 3,192
Amortisation of intangible assets (14) – – (47) – (61)
Write-back/(allowances and impairment)
for loans and other assets (71) (165) (5) (4) 24 (221)
Operating profit after
allowances and amortisation 1/ 489 1,389 479 437 116 2,910
Other information:
Capital expenditure 23 2 0 42 184 251
Depreciation 31 9 1 3 122 166
Note: 1. Excludes gains from divestment of non-core assets.

2012 Financial Results ▌ 20
PERFORMANCE BY BUSINESS SEGMENT (continued)
Global Global Global Consumer/
r Corporate/ Treasury
Private Investment And
S$ million Banking Banking Markets Insurance Others Group
4Q12 Total income 507 676 190 299 6 1,678
Operating profit before
allowances and amortisation 164 444 128 255 (37) 954
Amortisation of intangible assets (3) – – (12) – (15)
Write-back/(allowances and impairment)
for loans and other assets (12) (26) (1) 0 (29) (68)
Operating profit after
allowances and amortisation 149 418 127 243 (66) 871
Other information:
Capital expenditure 5 2 0 19 55 81
Depreciation 9 3 1 1 36 50
4Q11 Total income 434 595 282 143 43 1,497
Operating profit before
allowances and amortisation 134 390 232 100 21 877
Amortisation of intangible assets (4) – – (12) – (16)
Write-back/(allowances and impairment)
for loans and other assets (21) (70) (1) (3) 17 (78)
Operating profit after
allowances and amortisation 109 320 231 85 38 783
Other information:
Capital expenditure 6 1 0 15 44 66
Depreciation 6 0 0 1 37 44
3Q12 Total income
1/ 494 652 233 275 44 1,698
Operating profit before
allowances and amortisation 1/ 182 439 179 225 (12) 1,013
Amortisation of intangible assets (3) – – (12) – (15)
Allowances and impairment
for loans and other assets (23) (19) (1) (0) (27) (70)
Operating profit after
allowances and amortisation 1/ 156 420 178 213 (39) 928
Other information:
Capital expenditure 7 1 0 14 63 85
Depreciation 10 3 0 0 34 47
Note: 1. Excludes gains from divestment of non-core assets.
2012 Financial Results ▌ 21
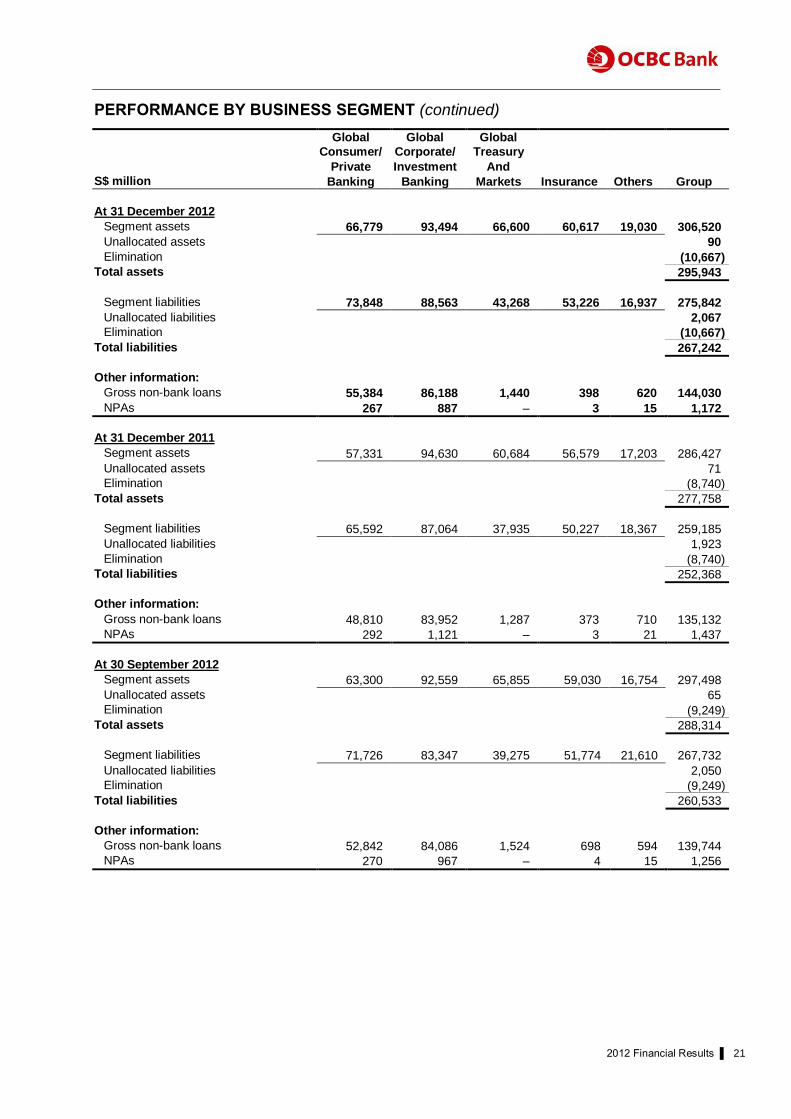
PERFORMANCE BY BUSINESS SEGMENT (continued)
Global Global Global Consumer/ Corporate/ Treasury
Private Investment And
S$ million Banking Banking Markets Insurance Others Group
At 31 December 2012
Segment assets 66,779 93,494 66,600 60,617 19,030 306,520
Unallocated assets 90
Elimination (10,667)
Total assets 295,943
Segment liabilities 73,848 88,563 43,268 53,226 16,937 275,842
Unallocated liabilities 2,067
Elimination (10,667)
Total liabilities 267,242
Other information:
Gross non-bank loans 55,384 86,188 1,440 398 620 144,030
NPAs 267 887 – 3 15 1,172
At 31 December 2011
Segment assets 57,331 94,630 60,684 56,579 17,203 286,427
Unallocated assets 71
Elimination (8,740)
Total assets 277,758
Segment liabilities 65,592 87,064 37,935 50,227 18,367 259,185
Unallocated liabilities 1,923
Elimination (8,740)
Total liabilities 252,368
Other information:
Gross non-bank loans 48,810 83,952 1,287 373 710 135,132
NPAs 292 1,121 – 3 21 1,437
At 30 September 2012
Segment assets 63,300 92,559 65,855 59,030 16,754 297,498
Unallocated assets 65
Elimination (9,249)
Total assets 288,314
Segment liabilities 71,726 83,347 39,275 51,774 21,610 267,732
Unallocated liabilities 2,050
Elimination (9,249)
Total liabilities 260,533
Other information:
Gross non-bank loans 52,842 84,086 1,524 698 594 139,744
NPAs 270 967 – 4 15 1,256

2012 Financial Results ▌ 22
PERFORMANCE BY GEOGRAPHICAL SEGMENT
2012 2011 4Q12 4Q11 3Q12
S$ million % S$ million % S$ million % S$ million % S$ million %
Total core income
Singapore 1/
4,214 63 3,405 60 1,074 64 902 60 1,096 65
Malaysia 1/ 1,305 20 1,220 22 329 20 316 21 320 19
Indonesia 466 7 417 7 122 7 115 8 116 7
Greater China 1/ 431 7 387 7 95 6 112 8 106 6
Other Asia Pacific 150 2 140 3 39 2 36 2 39 2
Rest of the World 79 1 53 1 19 1 16 1 21 1
6,645 100 5,622 100 1,678 100 1,497 100 1,698 100
Profit before income tax
Singapore 1/
2,264 62 1,710 59 547 63 474 62 589 63
Malaysia 1/ 812 22 773 26 203 23 209 28 193 21
Indonesia 159 4 125 4 43 5 29 4 43 5
Greater China 1/ 264 7 195 7 47 5 47 6 68 7
Other Asia Pacific 94 3 92 3 24 3 17 2 28 3
Rest of the World 53 2 22 1 12 1 (19) (2) 11 1
3,646 100 2,917 100 876 100 757 100 932 100
Note:
1. Gains from divestment of non-core assets of S$1.26 billion in 3Q12, S$56 million in 1Q12 and S$39 million in 1Q11 were not included in total
core income and profit before income tax.
31 Dec 2012 31 Dec 2011 30 Sep 2012
S$ million % S$ million % S$ million %
Total assets
Singapore 181,385 61 173,522 62 178,857 62
Malaysia 58,030 20 53,327 19 57,145 20
Indonesia 10,162 3 8,832 3 9,300 3
Greater China 28,083 9 28,878 10 25,864 9
Other Asia Pacific 10,426 4 8,984 4 10,531 4
Rest of the World 7,857 3 4,215 2 6,617 2
295,943 100 277,758 100 288,314 100
The geographical segment analysis is based on the location where assets or transactions are booked. For 2012,
Singapore accounted for 63% of total income and 62% of pre-tax profit, while Malaysia accounted for 20% of total
income and 22% of pre-tax profit.
Pre-tax profit for Singapore rose 32% year-on-year to S$2.26 billion, from S$1.71 billion in FY11 as higher net
interest income, insurance and net trading income more than offset an increase in expenses. Malaysia‟s pre-tax
profit was 5% higher at S$812 million in FY12, from S$773 million a year ago, as higher net interest income and
trading income was offset by an increase in operating expenses.
HALF-YEARLY INCOME AND PROFIT
S$ million 2012 2011 +/(-)
%
Total income
First half year 3,324 2,854 16
Second half year 4,637 2,807 65
7,961 5,661 41
Profit for the year
First half year 1,583 1,299 22
Second half year 2,680 1,180 127
4,263 2,479 72

2012 Financial Results ▌ 23
AUDITED CONSOLIDATED INCOME STATEMENT S$ million 2012 2011 +/(-)
@ 4Q12
@ 4Q11
@ +/(-)
@ 3Q12
@ +/(-)
@
% % %
Interest income 5,968 5,320 12 1,466 1,463 – 1,501 (2)
Interest expense (2,220) (1,910) 16 (545) (538) 1 (557) (2)
Net interest income 3,748 3,410 10 921 925 – 944 (2)
Premium income 6,254 6,106 2 1,838 1,597 15 1,578 16
Investment income 4,246 1,676 153 679 533 27 2,329 (71)
Net claims, surrenders and annuities (5,376) (4,531) 19 (1,260) (1,187) 6 (1,393) (10)
Change in life assurance fund
contract liabilities (3,066) (1,697) 81 (690) (480) 44 (1,903) (64)
Commission and others (1,366) (1,171) 17 (357) (412) (13) (421) (15)
Profit from life assurance 692 383 81 210 51 313 190 11
Premium income from general insurance 146 125 17 40 34 17 36 10
Fees and commissions (net) 1,198 1,137 5 304 257 18 303 1
Dividends 88 88 – 6 7 (15) 14 (60)
Rental income 72 76 (5) 18 19 (6) 18 (1)
Other income 2,017 442 357 179 204 (12) 1,453 (88)
Non-interest income 4,213 2,251 87 757 572 32 2,014 (62)
Total income 7,961 5,661 41 1,678 1,497 12 2,958 (43) Staff costs (1,650) (1,448) 14 (434) (362) 20 (433) –
Other operating expenses (1,045) (982) 6 (290) (258) 12 (252) 15
Total operating expenses (2,695) (2,430) 11 (724) (620) 17 (685) 6
Operating profit before
allowances and amortisation 5,266 3,231 63 954 877 9 2,273 (58)
Amortisation of intangible assets (60) (61) (2) (15) (16) (3) (15) –
Allowances for loans and
impairment of other assets (271) (221) 23 (68) (78) (14) (70) (3)
Operating profit after allowances
and amortisation 4,935 2,949 67 871 783 11 2,188 (60)
Share of results of associates
and joint ventures 27 7 271 5 (26) 116 4 7
Profit before income tax 4,962 2,956 68 876 757 16 2,192 (60) Income tax expense (699) (477) 47 (156) (126) 24 (233) (33)
Profit for the period 4,263 2,479 72 720 631 14 1,959 (63)
Profit attributable to:
Equity holders of the Bank 3,993 2,312 73 663 594 12 1,850 (64)
Non-controlling interests 270 167 62 57 37 51 109 (48)
4,263 2,479 72 720 631 14 1,959 (63)
Earnings per share
(for the period – cents)
Basic 113.1 65.8 17.5 16.0 53.9
Diluted 112.9 65.6 17.4 15.9 53.8
Note:
1. “@” represents unaudited.

2012 Financial Results ▌ 24
AUDITED CONSOLIDATED STATEMENT OF COMPREHENSIVE INCOME
S$ million 2012 2011 +/(-)@
4Q12@
4Q11@
+/(-)@
3Q12@
+/(-)@
% % %
Profit for the year/period 4,263 2,479 72 720 631 14 1,959 (63) Other comprehensive income:
Available-for-sale financial assets
Gains/(losses) for the year/period 1,012 (157) 745 323 30 989 235 38
Reclassification of (gains)/losses
to income statement
– on disposal (1,351) (120) nm (13) (22) 42 (1,273) 99
– on impairment 18 (8) 332 3 0 413 15 (82)
Tax on net movements 71 26 177 (33) (10) (226) 153 (122)
Exchange differences on
translating foreign operations (288) (3) nm (22) 6 (488) (105) 79
Actuarial (losses)/gains on defined
benefit plans (8) – – 1 – – (10) 115
Other comprehensive income
of associates and joint ventures (0) 6 (103) 3 1 210 (7) 138
Total other comprehensive
income, net of tax (546) (256) (113) 262 5 nm (992) 126 Total comprehensive income
for the period, net of tax 3,717 2,223 67 982 636 54 967 2
Total comprehensive income
attributable to:
attributable to:
Equity holders of the Bank 3,488 2,074 68 913 599 52 906 1
Non-controlling interests 229 149 54 69 37 87 61 14
3,717 2,223 67 982 636 54 967 2
Note:
1. “@” represents unaudited.

2012 Financial Results ▌ 25
AUDITED BALANCE SHEETS
GROUP BANK
S$ million 31 Dec 2012
31 Dec 2011
30 Sep 2012
@
31 Dec 2012
31 Dec 2011
30 Sep 2012
@
EQUITY
Attributable to equity holders of the Bank
Share capital 9,953 9,023 9,956 9,953 9,023 9,956
Capital reserves 376 279 329 96 90 98
Fair value reserves 895 1,125 628 321 510 224
Revenue reserves 14,580 12,144 14,045 9,214 7,722 8,923
25,804 22,571 24,958 19,584 17,345 19,201
Non-controlling interests 2,897 2,819 2,823 – – –
Total equity 28,701 25,390 27,781 19,584 17,345 19,201
LIABILITIES
Deposits of non-bank customers 165,139 154,555 157,528 115,325 109,827 109,531
Deposits and balances of banks 25,656 21,653 21,240 21,539 18,881 18,656
Due to subsidiaries – – – 8,258 5,913 7,300
Due to associates 161 178 178 149 164 165
Trading portfolio liabilities 1,083 1,655 1,078 1,083 1,655 1,078
Derivative payables 5,001 6,113 5,461 4,620 5,782 5,103
Other liabilities 4,324 4,024 4,516 1,543 1,459 1,529
Current tax 897 800 985 367 304 289
Deferred tax 1,170 1,123 1,065 65 121 52
Debt issued 11,424 13,063 17,410 11,919 13,797 17,797
214,855 203,164 209,461 164,868 157,903 161,500
Life assurance fund liabilities 52,387 49,204 51,072 – – –
Total liabilities 267,242 252,368 260,533 164,868 157,903 161,500
Total equity and liabilities 295,943 277,758 288,314 184,452 175,248 180,701
ASSETS
Cash and placements with central banks 16,397 12,897 12,312 9,382 6,986 6,442
Singapore government treasury bills and securities 13,141 13,250 13,654 11,962 12,592 12,660
Other government treasury bills and securities 9,157 7,397 10,090 6,098 3,988 6,751
Placements with and loans to banks 29,811 28,615 30,882 21,018 20,654 22,767
Loans and bills receivable 142,376 133,557 138,140 104,157 97,787 100,735
Debt and equity securities 14,932 15,081 13,751 9,348 9,721 8,822
Assets pledged 2,056 1,839 1,787 1,946 1,329 1,548
Assets held for sale 5 6 7 – – 2
Derivative receivables 5,155 5,899 5,724 4,693 5,462 5,294
Other assets 3,845 3,191 3,903 1,148 1,187 1,239
Deferred tax 43 44 21 26 4 3
Associates and joint ventures 355 361 352 191 215 190
Subsidiaries – – – 11,577 12,462 11,350
Property, plant and equipment 1,703 1,664 1,690 474 425 467
Investment property 878 922 879 565 569 564
Goodwill and intangible assets 3,818 3,947 3,837 1,867 1,867 1,867
243,672 228,670 237,029 184,452 175,248 180,701
Life assurance fund investment assets 52,271 49,088 51,285 – – –
Total assets 295,943 277,758 288,314 184,452 175,248 180,701
Net Asset Value Per Ordinary Share
@
(before valuation surplus – S$) 6.68 6.02 6.43 4.86 4.49 4.75
OFF-BALANCE SHEET ITEMS
Contingent liabilities 9,100 10,345 8,530 6,980 7,577 6,507
Commitments 67,040 64,892 64,932 42,667 44,780 42,404
Derivative financial instruments 560,734 545,502 597,885 481,216 492,372 524,189
Note: 1. “@” represents unaudited.

2012 Financial Results ▌ 26
AUDITED STATEMENT OF CHANGES IN EQUITY – GROUP For the financial year ended 31 December 2012
Attributable to equity holders of the Bank
S$ million Share capital
Capital reserves
Fair value reserves
Revenue reserves
Total
Non-controlling interests
Total equity
Balance at 1 January 2012 9,023 279 1,125 12,144 22,571 2,819 25,390 Total comprehensive income for the year – – (230) 3,718 3,488 229 3,717
Transactions with owners, recorded directly in equity
Contributions by and distributions to owners Transfers 5 87 – (92) – – – Acquisition of a subsidiary – – – – – 3 3 Distributions and dividends to non-controlling interests – – – – – (206) (206) DSP reserve from dividends on unvested shares – – – 4 4 – 4 Ordinary and preference dividends – – – (1,176) (1,176) (1,176) Preference shares issued 1,000 – – – 1,000 – 1,000 Preference shares issue expense (0) – – – (0) – (0) Share-based staff costs capitalised – 11 – – 11 – 11 Share buyback held in treasury (163) – – – (163) – (163) Shares issued to non-executive directors 1 – – – 1 – 1 Shares purchased by DSP Trust – (4) – – (4) – (4) Shares vested under DSP Scheme – 39 – – 39 – 39 Treasury shares transferred/sold 87 (36) – – 51 – 51
Total contributions by and distributions to owners 930 97 – (1,264) (237) (203) (440)
Changes in ownership interests in subsidiaries that do not result in loss of control
Changes in non-controlling interests – – – (18) (18) 52 34
Total changes in ownership interests in subsidiaries – – – (18) (18) 52 34
Balance at 31 December 2012 9,953 376 895 14,580 25,804 2,897 28,701
Included: Share of reserves of associates and joint ventures – – 6 45 51 (5) 46
Balance at 1 January 2011 8,211 613 1,374 10,592 20,790 2,855 23,645 Total comprehensive income for the year – – (249) 2,323 2,074 149 2,223
Transactions with owners, recorded directly in equity
Contributions by and distributions to owners Transfers 13 (345) – 332 – – – Distributions and dividends to non-controlling interests – – – – – (187) (187) DSP reserve from dividends on unvested shares – – – 4 4 – 4 Ordinary and preference dividends paid in cash – – – (275) (275) – (275) Share-based staff costs capitalised – 10 – – 10 – 10 Share buyback held in treasury (92) – – – (92) – (92) Shares issued in-lieu of ordinary dividends 824 – – (824) – – – Shares issued to non-executive directors 0 – – – 0 – 0 Shares purchased by DSP Trust – (4) – – (4) – (4) Shares vested under DSP Scheme – 29 – – 29 – 29 Treasury shares transferred/sold 67 (24) – – 43 – 43
Total contributions by and distributions to owners 812 (334) – (763) (285) (187) (472)
Changes in ownership interests in subsidiaries that do not result in loss of control
Changes in non-controlling interests – – – (8) (8) 2 (6)
Total changes in ownership interests in subsidiaries – – – (8) (8) 2 (6)
Balance at 31 December 2011 9,023 279 1,125 12,144 22,571 2,819 25,390
Included: Share of reserves of associates and joint ventures – – (0) 32 32 (4) 28

2012 Financial Results ▌ 27
STATEMENT OF CHANGES IN EQUITY – GROUP (UNAUDITED) For the three months ended 31 December 2012 Attributable to equity holders of the Bank
S$ million
Share capital
Capital reserves
Fair value reserves
Revenue reserves
Total
Non-controlling interests
Total equity
Balance at 1 October 2012 9,956 329 628 14,045 24,958 2,823 27,781 Total comprehensive income for the period – – 267 646 913 69 982
Transactions with owners, recorded directly in equity
Contributions by and distributions to owners Transfers 5 44 – (49) – – – Acquisition of a subsidiary – – – – – 3 3 Distributions and dividends to non-controlling interests – – – – – 0 0 DSP reserve from dividends on unvested shares – – – 2 2 – 2 Ordinary and preference dividends – – – (65) (65) – (65) Share-based staff costs capitalised – 3 – – 3 – 3 Share buyback held in treasury (14) – – – (14) – (14) Treasury shares transferred/sold 6 – – – 6 – 6
Total contributions by and distributions to owners (3) 47 – (112) (68) 3 (65)
Changes in ownership interests in a subsidiary that does not result in a loss of control
Changes in non-controlling interests – – – 1 1 2 3
Total changes in ownership interests in a subsidiary – – – 1 1 2 3
Balance at 31 December 2012 9,953 376 895 14,580 25,804 2,897 28,701
Included: Share of reserves of associates and joint ventures – – 6 45 51 (5) 46
Balance at 1 October 2011 8,603 376 1,128 11,503 21,610 2,787 24,397 Total comprehensive income for the period – – (3) 602 599 37 636
Transactions with owners, recorded directly in equity
Contributions by and distributions to owners Transfers 13 (97) – 84 – – – Dividends to non-controlling interests – – – – – (0) (0) DSP reserve from dividends on unvested shares – – – 2 2 – 2 Ordinary and preference dividends – – – (46) (46) – (46) Share-based staff costs capitalised – 2 – – 2 – 2 Share buyback held in treasury (3) – – – (3) – (3) Shares issued in-lieu of ordinary dividends 409 – – – 409 – 409 Shares purchased by DSP Trust – (2) – – (2) – (2) Treasury shares transferred/sold 1 0 – – 1 – 1
Total contributions by and distributions to owners 420 (97) – 40 363 (0) 363
Changes in ownership interests in a subsidiary that does not result in a loss of control
Changes in non-controlling interests – – – (1) (1) (5) (6)
Total changes in ownership interests in a subsidiary – – – (1) (1) (5) (6)
Balance at 31 December 2011 9,023 279 1,125 12,144 22,571 2,819 25,390
Included: Share of reserves of associates and joint ventures – – (0) 32 32 (4) 28
2012 Financial Results ▌ 28
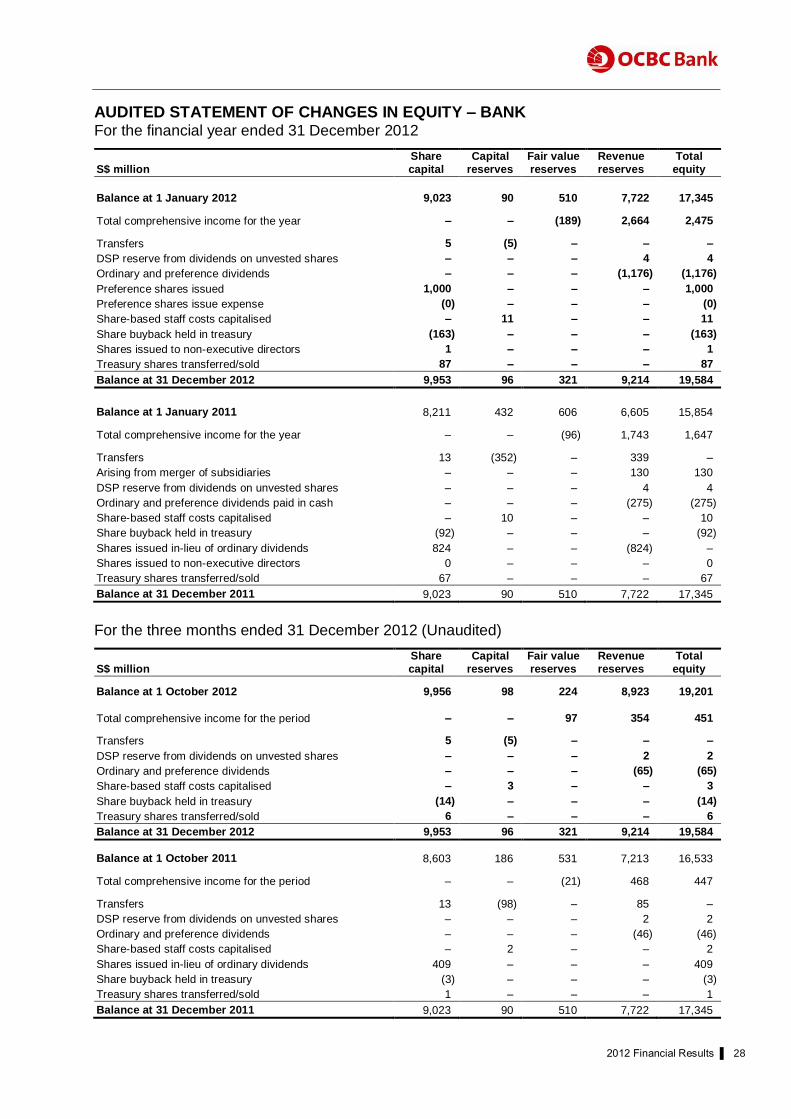
AUDITED STATEMENT OF CHANGES IN EQUITY – BANK For the financial year ended 31 December 2012
S$ million Share capital
Capital reserves
Fair value reserves
Revenue reserves
Total equity
Balance at 1 January 2012 9,023 90 510 7,722 17,345
Total comprehensive income for the year – – (189) 2,664 2,475
Transfers 5 (5) – – –
DSP reserve from dividends on unvested shares – – – 4 4
Ordinary and preference dividends – – – (1,176) (1,176)
Preference shares issued 1,000 – – – 1,000
Preference shares issue expense (0) – – – (0)
Share-based staff costs capitalised – 11 – – 11
Share buyback held in treasury (163) – – – (163)
Shares issued to non-executive directors 1 – – – 1
Treasury shares transferred/sold 87 – – – 87
Balance at 31 December 2012 9,953 96 321 9,214 19,584
Balance at 1 January 2011 8,211 432 606 6,605 15,854 Total comprehensive income for the year – – (96) 1,743 1,647
Transfers 13 (352) – 339 –
Arising from merger of subsidiaries – – – 130 130
DSP reserve from dividends on unvested shares – – – 4 4
Ordinary and preference dividends paid in cash – – – (275) (275)
Share-based staff costs capitalised – 10 – – 10
Share buyback held in treasury (92) – – – (92)
Shares issued in-lieu of ordinary dividends 824 – – (824) –
Shares issued to non-executive directors 0 – – – 0
Treasury shares transferred/sold 67 – – – 67
Balance at 31 December 2011 9,023 90 510 7,722 17,345
For the three months ended 31 December 2012 (Unaudited)
S$ million Share capital
Capital reserves
Fair value reserves
Revenue reserves
Total equity
Balance at 1 October 2012 9,956 98 224 8,923 19,201
Total comprehensive income for the period – – 97 354 451
Transfers 5 (5) – – –
DSP reserve from dividends on unvested shares – – – 2 2
Ordinary and preference dividends – – – (65) (65)
Share-based staff costs capitalised – 3 – – 3
Share buyback held in treasury (14) – – – (14)
Treasury shares transferred/sold 6 – – – 6
Balance at 31 December 2012 9,953 96 321 9,214 19,584
Balance at 1 October 2011 8,603 186 531 7,213 16,533 Total comprehensive income for the period – – (21) 468 447
Transfers 13 (98) – 85 –
DSP reserve from dividends on unvested shares – – – 2 2
Ordinary and preference dividends – – – (46) (46)
Share-based staff costs capitalised – 2 – – 2
Shares issued in-lieu of ordinary dividends 409 – – – 409
Share buyback held in treasury (3) – – – (3)
Treasury shares transferred/sold 1 – – – 1
Balance at 31 December 2011 9,023 90 510 7,722 17,345

2012 Financial Results ▌ 29
AUDITED CONSOLIDATED CASH FLOW STATEMENT For the financial year ended 31 December 2012
S$ million 2012 2011 4Q12 @
4Q11 @
Cash flows from operating activities
Profit before income tax 4,962 2,956 876 757 Adjustments for non-cash items
Amortisation of intangible assets 60 61 15 16
Allowances for loans and impairment of other assets 271 221 68 78
Change in fair value for hedging transactions and trading securities (90) 69 (42) 5
Depreciation of property, plant and equipment
and investment property 184 166 50 44
Net gain on disposal of property, plant and equipment
and investment property (81) (43) (5) (1)
Net gain on disposal of government, debt and equity securities (1,351) (120) (13) (22)
Net gain on disposal/liquidation of subsidiaries and
associates – (1) – (0)
Share-based staff costs 10 10 3 2
Share of results of associates and joint ventures (27) (7) (5) 26
Items relating to life assurance fund
Surplus before income tax 1,000 532 252 169
Surplus transferred from life assurance fund (692) (382) (210) (51)
Operating profit before change in operating assets and liabilities 4,246 3,462 989 1,023
Change in operating assets and liabilities
Deposits of non-bank customers 10,574 31,294 7,601 9,305
Deposits and balances of banks 4,002 5,145 4,415 (977)
Derivative payables and other liabilities (960) 2,158 (664) (2,695)
Trading portfolio liabilities (572) (79) 5 (68)
Government securities and treasury bills (1,587) (3,116) 1,355 (2,181)
Trading securities 34 (272) (55) 48
Placements with and loans to banks (1,811) (10,660) 695 782
Loans and bills receivable (9,030) (28,789) (4,315) (5,867)
Derivative receivables and other assets 612 (1,378) 865 1,914
Net change in investment assets and liabilities of life assurance fund (90) 59 296 (654)
Cash from/(used in) operating activities 5,418 (2,176) 11,187 630
Income tax paid (640) (409) (182) (45)
Net cash from/(used in) operating activities 4,778 (2,585) 11,005 585
Cash flows from investing activities
Dividends from associates 8 6 5 5
Decrease/(increase) in associates and joint ventures 30 (107) (4) (43)
Net cash outflow from acquisition of a subsidiary/business (12) (103) (12) (113)
Purchases of debt and equity securities (5,695) (6,371) (1,980) (1,624)
Purchases of property, plant and equipment and investment property (303) (251) (82) (66)
Proceeds from disposal of debt and equity securities 6,707 4,798 1,193 856
Proceeds from disposal of interest in a subsidiary – 82 – –
Proceeds from disposal of an associate – 2 – 0
Proceeds from disposal of property, plant and equipment
and investment property 127 49 14 3
Net cash from/(used in) investing activities 862 (1,895) (866) (982)
Cash flows from financing activities
Changes in non-controlling interests 34 (6) 3 (6)
Dividends paid to equity holders of the Bank (1,173) (275) (62) (145)
Distributions and dividends paid to non-controlling interests (206) (187) 0 (0)
Redemption of subordinated debt issued (385) (2,467) (385) (120)
Issue of subordinated debt 1,472 399 – –
Increase/(decrease) in other debt issued (2,573) 8,468 (5,588) 3,357
Net proceeds from issue of preference shares 1,000 – – –
Proceeds from treasury shares transferred/sold
under the Bank‟s employee share schemes 51 43 6 1
Share buyback held in treasury (163) (92) (14) (3)
Net cash (used in)/from financing activities (1,943) 5,883 (6,040) 3,084
Net currency translation adjustments (197) 1 (14) 11
Net change in cash and cash equivalents 3,500 1,404 4,085 2,698
Cash and cash equivalents at beginning of year/period 12,897 11,493 12,312 10,199
Cash and cash equivalents at end of year/period 16,397 12,897 16,397 12,897
Note:
1. “@” represents unaudited.

2012 Financial Results ▌ 30
SHARE CAPITAL AND OPTIONS ON SHARES IN THE BANK The following table shows movements in the issued ordinary shares of the Bank:
Financial year ended 31 Dec Three months ended 31 Dec
Number of Shares 2012 2011 2012 2011
Issued ordinary shares
Balance at beginning of year/period 3,441,043,176 3,341,044,969 3,441,099,691 3,390,371,001
Shares issued to non-executive directors 56,515 48,000 – –
Shares issued pursuant to Scrip Dividend
Scheme – 99,950,207 – 50,672,175
Balance at end of year/period 3,441,099,691 3,441,043,176 3,441,099,691 3,441,043,176
Treasury shares
Balance at beginning of year/period (3,965,793) (3,269,326) (9,733,621) (3,874,107)
Share buyback (18,242,000) (10,078,000) (1,490,000) (340,000)
Shares sold/transferred to employees
pursuant to OCBC Share Option Scheme 6,247,357 2,723,126 959,423 239,502
Shares sold/transferred to employees
pursuant to OCBC Employee
Share Purchase Plan 1,715,860 4,071,126 105,368 8,812
Shares transferred to DSP Trust pursuant to
OCBC Deferred Share Plan 4,085,746 2,587,281 – –
Balance at end of year/period (10,158,830) (3,965,793) (10,158,830) (3,965,793)
Total 3,430,940,861 3,437,077,383 3,430,940,861 3,437,077,383
Pursuant to the share purchase mandate approved at the extraordinary general meeting held on 25 April
2012, the Bank purchased a total of 1,490,000 ordinary shares in the fourth quarter ended 31 December
2012. The ordinary shares were purchased by way of open market acquisitions at prices ranging from
S$8.90 to S$9.48 per share and the total consideration paid was S$13,876,363 (including transaction
costs).
From 1 October 2012 to 31 December 2012 (both dates inclusive), the Bank utilised 959,423 treasury
shares upon the exercise of options by employees of the Group pursuant to the OCBC Share Option
Scheme 2001 (“SOS 2001”). As of 31 December 2012, the number of options outstanding under the
OCBC SOS 2001 was 30,910,785 (31 December 2011: 32,836,463).
From 1 October 2012 to 31 December 2012 (both dates inclusive), the Bank utilised 105,368 treasury
shares upon the exercise of acquisition rights by employees of the Group pursuant to OCBC Employee
Share Purchase Plan (“ESPP”). As of 31 December 2012, the number of acquisition rights outstanding
under the OCBC ESPP was 12,292,163 (31 December 2011: 10,524,336).
No new preference shares were allotted and issued by the Bank in the fourth quarter ended 31 December
2012.
2012 Financial Results ▌ 31
OTHER MATTERS 1. Pursuant to Rule 920(1) of the Listing Manual, the Bank has not obtained a general mandate from
shareholders for Interested Party Transactions.
2. Pursuant to Rule 704(13) of the Listing Manual, for the financial year ended 31 December 2012, there
was no person occupying managerial position in the Bank or in any of its principal subsidiaries who is
a relative of a director or chief executive officer or substantial shareholder of the Bank.
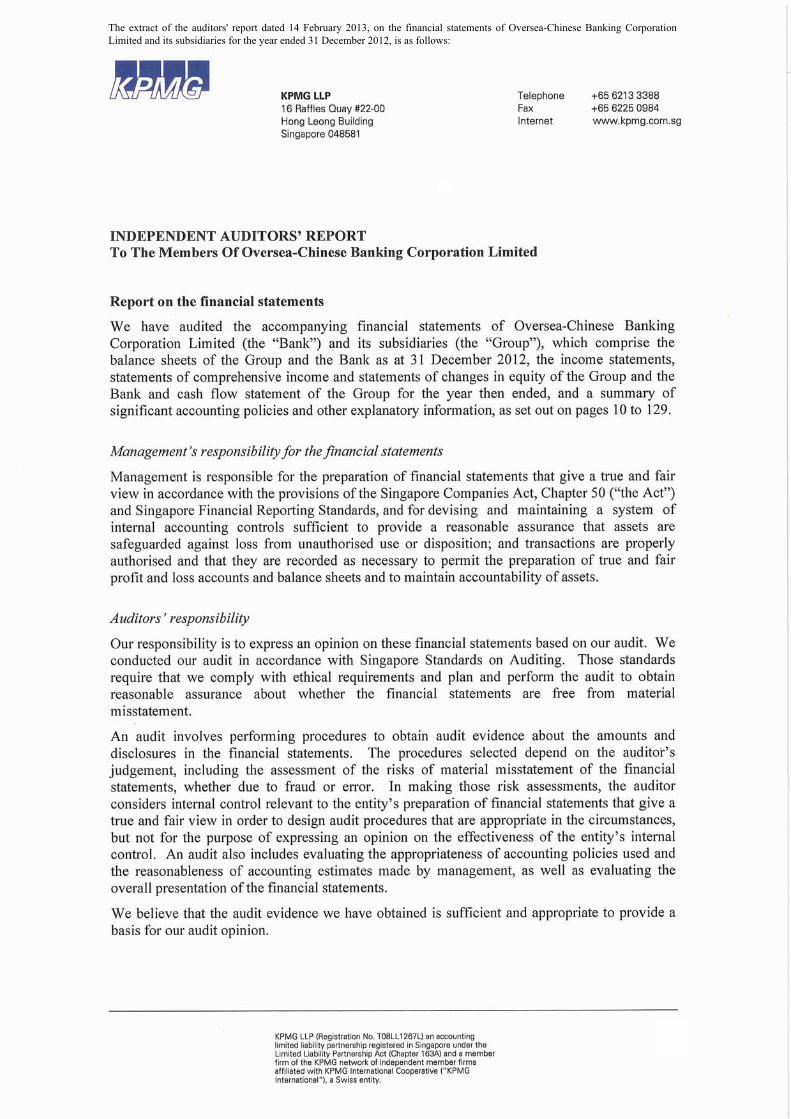
The extract of the auditors' report dated 14 February 2013, on the financial statements of Oversea-Chinese Banking CorporationLimited and its subsidiaries for the year ended 31 December 2012, is as follows: