Embed Size (px)
Citation preview

Disclaimer: This presentation should be read as an overview of OCBC’s current business activities and operating
environment which may contain statements relating to OCBC’s growth strategy and future business
aspirations. These statements involve risks and uncertainties and should not be solely relied upon
by investors or potential investors when making an investment decision. OCBC Bank accepts no
liability whatsoever with respect to the use of this document or its content.
Third Quarter 2018 Results
Presentation1 November 2018
Agenda
2
Results Overview
3Q18 & 9M18 Group Performance Trends
Appendix: Performance of Major Subsidiaries
- Great Eastern Holdings
- OCBC Wing Hang
- OCBC Malaysia
- OCBC NISP
Note: - Certain comparative figures have been restated to conform with the current period’s presentation.
- Amounts less than S$0.5m are shown as “0”;
- “nm” denotes not meaningful;
- “na” denotes not applicable;
- Figures may not sum to stated totals because of rounding.

NSFR: 108% 3/
Allowances: S$0.05b; -68%
(3Q17 : S$0.16b)
3
Net profit grew 12% YoY to a record S$1.25b; Banking operations’ profit rose 23% YoY to S$1.07b
Return on equity higher at 12.6%
3Q18 Highlights
Continuing to deliver sustainable growth
➢ Net profit from banking operations rose 23% YoY to S$1.07b
➢ Net interest income grew 9% YoY from increased loan
volumes and improvement in NIM
• NIM 6 bps higher YoY from Singapore, Malaysia and
Greater China
➢ Wealth management business contributed 29% of total
income
• Private banking AUM rose 3% QoQ and 11% YoY,
boosted by net new money inflows
• GEH’s TWNS increased 14% YoY, underpinned by growth
in Singapore and Malaysia
➢ 3Q18 CIR at 42.0%
➢ Asset quality remained stable and sound, NPL ratio at 1.4%
and credit costs at 14 bps for impaired loans
➢ Loans grew 2% QoQ and 10% YoY
➢ Strong funding and liquidity position
➢ CET1 CAR higher at 13.6%
Higher Returns
Year-on-Year
Sustained
Growth Across
Diversified
Franchise
Strong
Liquidity,
Funding and
Capital
Position
Net Interest Income: S$1.51b; +9%
(3Q17 : S$1.38b)
Non-interest Income: S$1.04b; flat
(3Q17 1/ : S$1.04b)
NPL ratio: 1.4%
(Sep 17: 1.3%)
Operating Expenses: S$1.07b; +7%
(3Q17 1/ : S$1.00b)
ROA: 1.28%
(3Q17 1/ : 1.20%)
Customer Loans: S$257b; +10%
(Sep 17 : S$232b)
Customer Deposits: S$287b; +7%
(Sep 17 : S$268b)
CET1 ratio: 13.6%
(Sep 17 : 12.0% 2/)
Leverage ratio: 7.1%
(Sep 17 : 7.6%)
All-currency LCR: 130%
(3Q17 : 147%)
Group performance
1/ Figures for 3Q17 were restated in accordance with SFRS(I) and change in accounting policy for Great Eastern Holdings (“GEH”).
2/ Based on Basel III rules which came into full effect from 1 January 2018.
3/ Net stable funding ratio is computed based on MAS Notice 652 effective 1 January 2018.
Resilient Asset
Quality
Net Profit
S$1.25b
+12%
ROE 12.6%(3Q17 : 11.9%)

3Q18 2Q18 QoQ 3Q17 YoY
S$m S$m +/(-)% S$m +/(-)%
Net interest income 1,505 1,450 4 1,382 9
Non-interest income 1,039 1,024 1 1,035 –
Total income 2,544 2,474 3 2,417 5
Operating expenses (1,069) (1,035) 3 (1,001) 7
Operating profit 1,475 1,439 3 1,416 4
Amortisation of intangibles (26) (26) 1 (26) –
Allowances (49) (21) 131 (156) (68)
Associates 134 112 20 127 6
Tax & non-controlling interests (“NCI”) (289) (295) (2) (253) 14
Net profit 1,245 1,209 3 1,108 12
OCBC Group
3Q18 Group PerformanceNet profit rose 3% QoQ and 12% YoY to S$1.25b
Group performance
4
Note: Figures for 3Q17 were restated in accordance with SFRS(I) and change in accounting
policy for GEH.

3Q18 2Q18 QoQ 3Q17 YoYS$m S$m +/(-)% S$m +/(-)%
Net interest income 1,485 1,430 4 1,360 9
Non-interest income 744 732 2 679 10
Total income 2,229 2,162 3 2,039 9
Operating expenses (1,003) (1,004) – (946) 6
Operating profit 1,226 1,158 6 1,093 12
Allowances (52) (24) 120 (149) (65)
Associates 138 115 19 131 5
Amortisation, tax & NCI (243) (238) 2 (207) 17
Net profit from banking operations 1,069 1,012 6 868 23
GEH net profit contribution 176 197 (11) 240 (27)
OCBC Group net profit 1,245 1,209 3 1,108 12
Banking Operations
3Q18 Banking Operations PerformanceNet profit before GEH contribution (“Banking Operations”) rose 6% QoQ and 23% YoY to
new high of S$1.07b
Banking Ops performance
5
Note: Figures for 3Q17 were restated in accordance with SFRS(I) and change in accounting
policy for GEH.
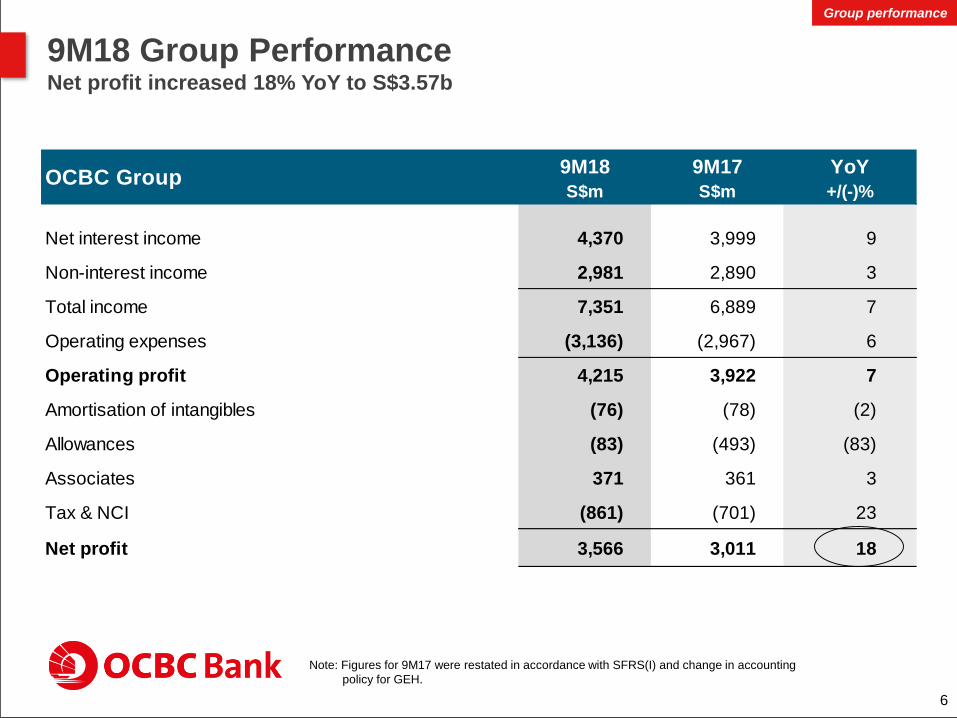
9M18 9M17 YoY
S$m S$m +/(-)%
Net interest income 4,370 3,999 9
Non-interest income 2,981 2,890 3
Total income 7,351 6,889 7
Operating expenses (3,136) (2,967) 6
Operating profit 4,215 3,922 7
Amortisation of intangibles (76) (78) (2)
Allowances (83) (493) (83)
Associates 371 361 3
Tax & NCI (861) (701) 23
Net profit 3,566 3,011 18
OCBC Group
9M18 Group PerformanceNet profit increased 18% YoY to S$3.57b
Group performance
6
Note: Figures for 9M17 were restated in accordance with SFRS(I) and change in accounting
policy for GEH.

9M18 9M17 YoYS$m S$m +/(-)%
Net interest income 4,312 3,931 10
Non-interest income 2,179 2,067 5
Total income 6,490 5,997 8
Operating expenses (2,978) (2,786) 7
Operating profit 3,512 3,211 9
Allowances (88) (479) (82)
Associates 380 371 3
Amortisation, tax & NCI (734) (592) 24
Net profit from banking operations 3,071 2,511 22
GEH net profit contribution 496 500 (1)
OCBC Group net profit 3,566 3,011 18
Banking Operations
9M18 Banking Operations PerformanceNet profit for Banking Operations grew 22% YoY to S$3.07b
Banking Ops performance
7
Note: Figures for 9M17 were restated in accordance with SFRS(I) and change in accounting
policy for GEH.
Agenda
8
Results Overview
3Q18 & 9M18 Group Performance Trends
Appendix: Performance of Major Subsidiaries
- Great Eastern Holdings
- OCBC Wing Hang
- OCBC Malaysia
- OCBC NISP

25%
10%
18%
8%
39%
Global Consumer /
Private Banking
Global Treasury
and Markets
Insurance
OCBC Wing Hang
Global Corporate / Investment
Banking
25%
9%
16%40%
10%
53%
16%
6%
21%
4%
Singapore
Malaysia
Indonesia
Greater China
Others
54%
16%
5%
5%
20%
Performance by business and geographyEarnings well-diversified across key business segments and geographies
9
Note: Figures for 9M17 were restated in accordance with SFRS(I) and change in accounting policy for GEH.
1/ Operating profit before allowances and amortisation. Excludes the Others segment, which comprises
mainly property holding, investment holding and items not attributable to the business segments.
9M18 Operating Profit
by Business1/9M18 Profit before Tax
by Geography
Earnings
9M18
9M17
9M18
9M17
Singapore
S$2,373m
YoY: +21%
Malaysia
S$700m
YoY: +18%
Indonesia
S$237m
YoY: +4%
Greater China
S$913m
YoY: +20%
Others
S$204m
YoY: +23%
3,801 3,9994,370
1,272
1,3451,382
1,424 1,4151,450
1,5055,052
5,423
4,370
FY16 FY17 9M18 1Q17 2Q17 3Q17 4Q17 1Q18 2Q18 3Q18
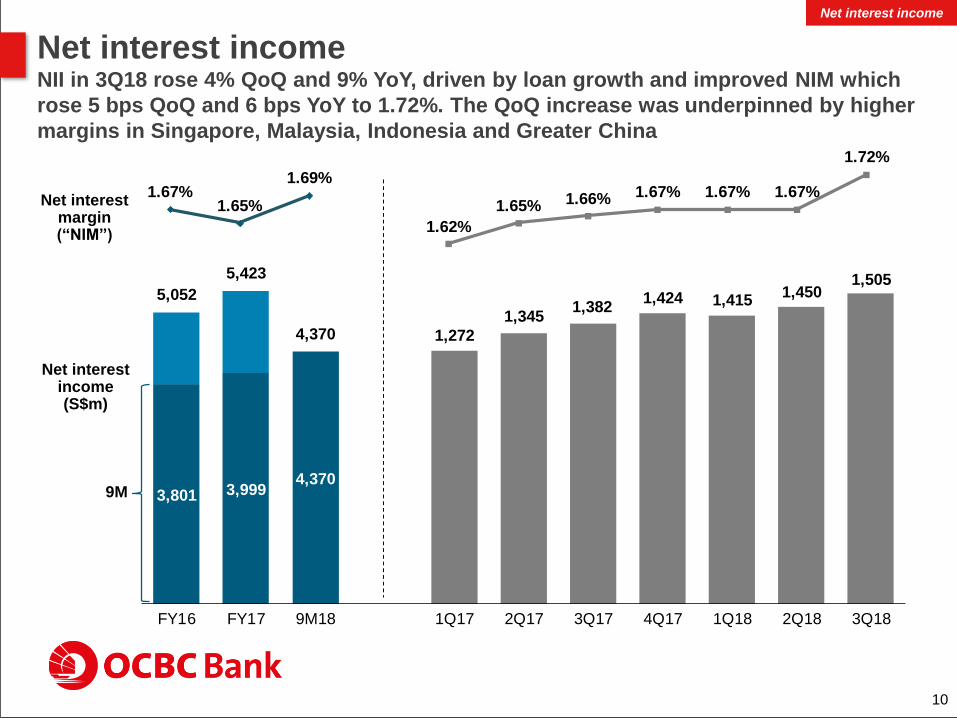
Net interest incomeNII in 3Q18 rose 4% QoQ and 9% YoY, driven by loan growth and improved NIM which
rose 5 bps QoQ and 6 bps YoY to 1.72%. The QoQ increase was underpinned by higher
margins in Singapore, Malaysia, Indonesia and Greater China
10
Net interest income (S$m)
Net interest margin(“NIM”)
Net interest income
9M
1.67%1.65%
1.69%
1.62%
1.65% 1.66% 1.67% 1.67% 1.67%
1.72%

Non-interest income (S$m)
Non-interest income /
Total income
Non-interest income3Q18 non-interest income up QoQ and YoY to S$1.04b
11
Non-interest income
Fees & commissions
Dividends & rental
income
Trading income
Net gains from
investment securities
and others
Life & General
Insurance
Note: Figures for 2017 periods were restated in accordance with SFRS(I) and change in accounting policy for
GEH. Figures for FY16 were not restated.
40.5%43.1%
40.6% 40.0%42.8% 42.8%
46.0%
39.3%41.4% 40.8%
1,638 1,953
1,557
192
159
173
529
515
499
429
561
88
649
917
664
481 492 488 491 536 518 502
36 47 45 3239 54 80
158 140 118 9994
192 21391 94
94
282
43
261984
233 290
310
206
234 225
3,437
4,105
2,981 850
1,0061,035
1,214
918
1,024 1,039
FY16 FY17 9M18 1Q17 2Q17 3Q17 4Q17 1Q18 2Q18 3Q18

Wealth Management Income1/ 2/ (S$m)
27%
33%30%
28%32% 33%
38%
31% 31% 29%
Great Eastern Embedded Value3/ (S$m)
Bank of Singapore Earning Asset Base (US$b)
Wealth Management3Q18 wealth management income at S$748m; BOS’ AUM rose 3% QoQ and 11% YoY to
US$105b from continued net new money inflows
12
1,629
2,130 2,235
597
741792
1,006
727761 748
FY16 FY17 9M18 1Q17 2Q17 3Q17 4Q17 1Q18 2Q18 3Q18
As % of Group income
AUMLoans
9,21410,436 11,001 11,694
13,389
Dec 13 Dec 14 Dec 15 Dec 16 Dec 17
1/ Wealth management income comprises the consolidated income from insurance, asset management, stockbroking and private
banking subsidiaries, plus the Group's income from the sales of unit trusts, bancassurance products, structured deposits and
other treasury products to consumer customers.
2/ Figures for 2017 periods were restated in accordance with SFRS(I) and change in accounting policy for GEH. Figures for FY16
were not restated.
3/ An actuarial embedded value is a commonly used technique to estimate the economic value of the existing business of a life
insurance company.
51 55 79
99 105 14 13
18
22 24
65 68
97
121 129
Dec 14 Dec 15 Dec 16 Dec 17 Sep 18
Wealth management
Dec 14 – Dec 17
CAGR 23%
Dec 13 – Dec 17
CAGR 10%
2,273
3,136
9M
2,235
13
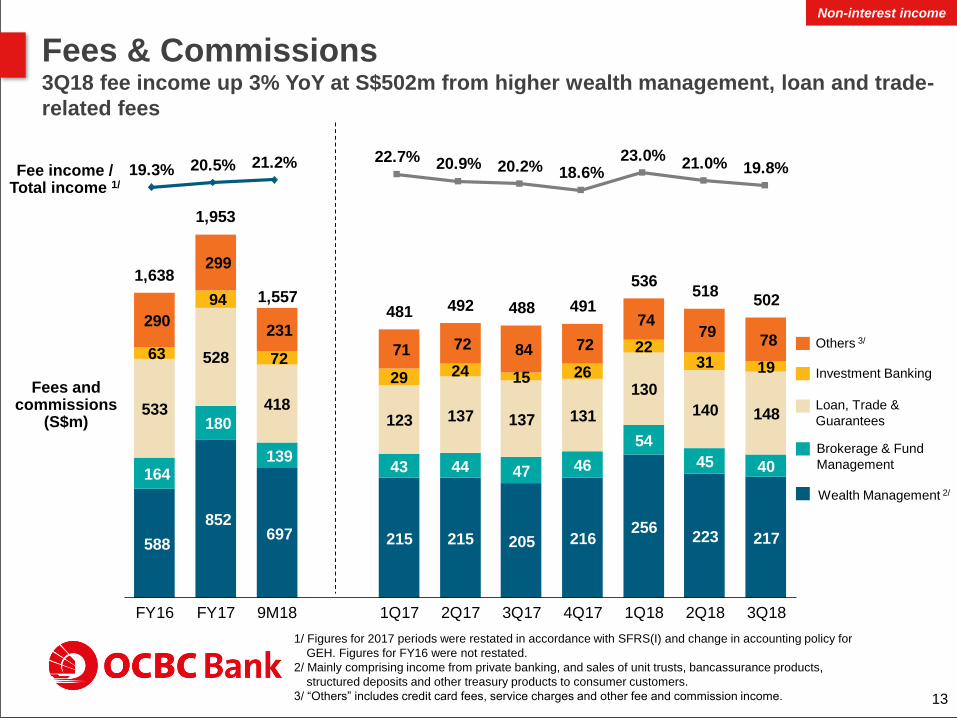
Fees and commissions
(S$m)
1/ Figures for 2017 periods were restated in accordance with SFRS(I) and change in accounting policy for
GEH. Figures for FY16 were not restated.
2/ Mainly comprising income from private banking, and sales of unit trusts, bancassurance products,
structured deposits and other treasury products to consumer customers.
3/ “Others” includes credit card fees, service charges and other fee and commission income.
Fees & Commissions3Q18 fee income up 3% YoY at S$502m from higher wealth management, loan and trade-
related fees
Fee income / Total income 1/
Non-interest income
Wealth Management 2/
Brokerage & Fund
Management
Loan, Trade &
Guarantees
Investment Banking
Others 3/
19.3% 20.5% 21.2% 22.7% 20.9% 20.2% 18.6%23.0%
21.0% 19.8%
588
852 697
164
180
139
533
528
418
63
94
72
290
299
231
215 215 205 216256
223 217
43 44 47 46
54
45 40
123 137 137 131
130
140 148
29 24 15 26
2231 19
71 72 84 72
74 79
78
1,638
1,953
1,557481 492 488 491
536518
502
FY16 FY17 9M18 1Q17 2Q17 3Q17 4Q17 1Q18 2Q18 3Q18

Operating expenses Expenses rose 3% QoQ; CIR at 42.0%
14
Operating expenses
(S$m)
Cost-to-income ratio
(“CIR”)
Operating expenses
Headcount (period end) 29,705 29,207 29,161 29,174 29,444 29,612 29,719
Staff costs
Property &
equipment
Others
Note: Figures for 2017 periods were restated in accordance with SFRS(I) and change in accounting policy
for GEH. Figures for FY16 were not restated.
44.6%42.4% 42.7%
45.9%42.2% 41.4% 40.8%
44.2%41.9% 42.0%
2,347 2,471
1,947
763793
595
678778
594
602 619 608 642 662 633 651
192 195 195210 194
202 200
179 179 198223 176 200
218
3,788
4,042
3,136
973 993 1,001
1,0751,032 1,035
1,069
FY16 FY17 9M18 1Q17 2Q17 3Q17 4Q17 1Q18 2Q18 3Q18

1,212 1,232 1,269
1,130 1,115 1,055
353 453 474
2,6952,800 2,798
Mar 18 Jun 18 Sep 18
Allowances
Total cumulative allowancesAllowances met requirements set out in SFRS(I) 9 and the revised MAS 612
1/ Credit loss allowances for assets classified under stages 1 and 2 relate to non-impaired assets.
2/ Minimum regulatory loss allowance of 1% on non-credit impaired non-bank exposures net of
eligible collaterals.
With effect from 1 January 2018,
SFRS(I) 9 requires the Group to
calculate credit loss allowances using
a forward-looking expected credit loss
(“ECL”) model. The difference
between the Stage 1 and 2 ECL1/ and
MAS 612 Minimum Regulatory Loss
Allowance (“MRLA”) 2/ is reported as
Regulatory Loss Allowance Reserve
(“RLAR”).
15
Total cumulative allowances
(S$m)
RLAR
Allowances for non-impaired assets 1/
Allowances for impaired assets
421493 168 169 156 178
12 2149
726671
83
FY16 FY17 9M18 1Q17 2Q17 3Q17 4Q17 1Q18 2Q18 3Q18
Allowances for loans and other
assets (S$m)
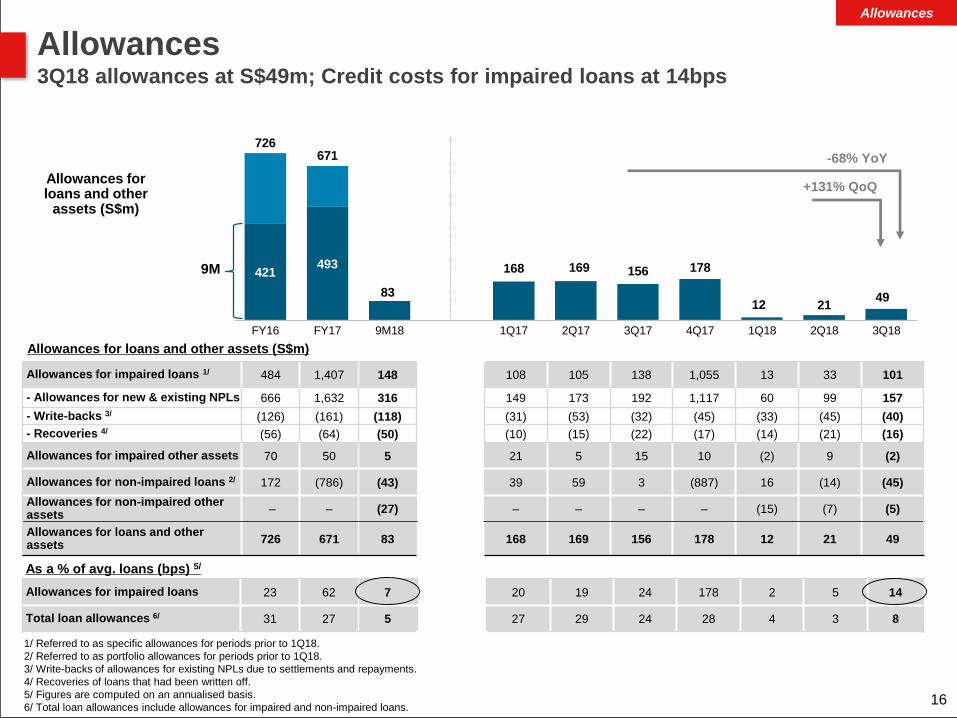
1/ Referred to as specific allowances for periods prior to 1Q18.
2/ Referred to as portfolio allowances for periods prior to 1Q18.
3/ Write-backs of allowances for existing NPLs due to settlements and repayments.
4/ Recoveries of loans that had been written off.
5/ Figures are computed on an annualised basis.
6/ Total loan allowances include allowances for impaired and non-impaired loans.
Allowances3Q18 allowances at S$49m; Credit costs for impaired loans at 14bps
Allowances for impaired loans 23 62 7 20 19 24 178 2 5 14
Total loan allowances 6/ 31 27 5 27 29 24 28 4 3 8
As a % of avg. loans (bps) 5/
Allowances
Allowances for impaired loans 1/ 484 1,407 148 108 105 138 1,055 13 33 101
- Allowances for new & existing NPLs 666 1,632 316 149 173 192 1,117 60 99 157
- Write-backs 3/ (126) (161) (118) (31) (53) (32) (45) (33) (45) (40)
- Recoveries 4/ (56) (64) (50) (10) (15) (22) (17) (14) (21) (16)
Allowances for impaired other assets 70 50 5 21 5 15 10 (2) 9 (2)
Allowances for non-impaired loans 2/ 172 (786) (43) 39 59 3 (887) 16 (14) (45)
Allowances for non-impaired other assets
– – (27) – – – – (15) (7) (5)
Allowances for loans and other assets
726 671 83 168 169 156 178 12 21 49
Allowances for loans and other assets (S$m)
-68% YoY
16
+131% QoQ
9M

Customer loansBroad-based loan growth, rising 2% QoQ and 10% YoY to S$257b
Customer Loans (S$b)
Loans
Note: Customer loans by geography are based on where the credit risks reside, which may be different from
the borrower’s country of residence or the booking location of the loans.
17
+10% YoY
+2% QoQ
In constant ccy terms
+11% YoY
+2% QoQ
96 96 98 100 104 104 106
28 28 28 28 29 30 3019 20 19 19 19 20 20
54 56 57 5963 65 66
28 29 30 3132 33 35225 229 232 237
247252 257
Mar 17 Jun 17 Sep 17 Dec 17 Mar 18 Jun 18 Sep 18
Rest of the world
QoQ: +5%
YoY: +17%
Greater China
QoQ: +1%
YoY: +15%
Indonesia
QoQ: flat
YoY: +3%
Malaysia
QoQ: +1%
YoY: +7%
Singapore
QoQ: +1%
YoY: +8%
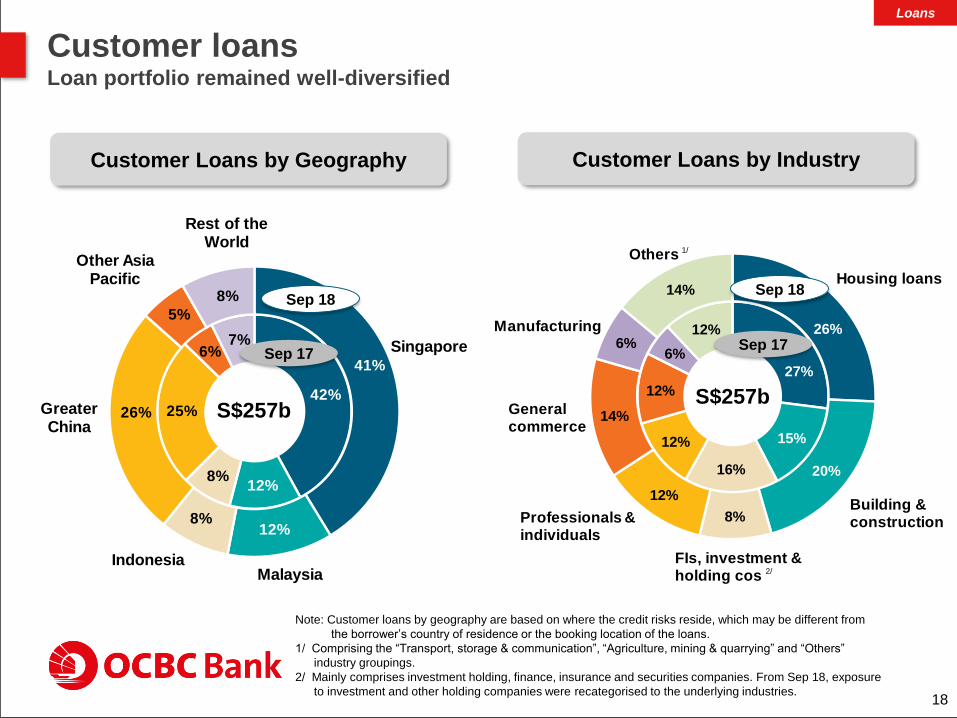
27%
15%
16%
12%
12%
6%
12% 26%
20%
8%
12%
14%
6%
14%Housing loans
FIs, investment & holding cos
Professionals & individuals
General commerce
Others
Manufacturing
Building & construction
42%
12%8%
6%7% Singapore
MalaysiaIndonesia
Greater China
Other Asia Pacific
Rest of the World
41%
12%8%
26%
5%
8%
25%
Customer loans Loan portfolio remained well-diversified
18
Customer Loans by IndustryCustomer Loans by Geography
S$257b
Sep 18
Note: Customer loans by geography are based on where the credit risks reside, which may be different from
the borrower’s country of residence or the booking location of the loans.
1/ Comprising the “Transport, storage & communication”, “Agriculture, mining & quarrying” and “Others”
industry groupings.
2/ Mainly comprises investment holding, finance, insurance and securities companies. From Sep 18, exposure
to investment and other holding companies were recategorised to the underlying industries.
Loans
Sep 17
S$257b
Sep 18
Sep 17
1/
2/

6 6 6 5 5 6 5
14 14 15 18 20 21 22
28 30 3130
3232 33
22
2 2
22 3
4 4
3 4
4 4 4
5456 57
5963
65 66
Mar 17 Jun 17 Sep 17 Dec 17 Mar 18 Jun 18 Sep 18
19
Note: Customer loans to Greater China is based on where the credit risks reside, which may be different from
the borrower’s country of residence or the booking location of the loans.
1/ Relates to loans that are booked in China, where credit risks reside.
2/ Relates to loans that are booked outside of China, but with credit risks traced to China.
China 1/
Offshore 2/
Hong Kong
Taiwan
Macao
Greater China Customer Loans Loans up 1% QoQ and 15% YoY; NPL ratio stable QoQ and declined YoY to 0.3%
Customer loans to Greater China (S$b)
NPL ratio
Loans
0.6% 0.6% 0.5% 0.4% 0.4% 0.3% 0.3%
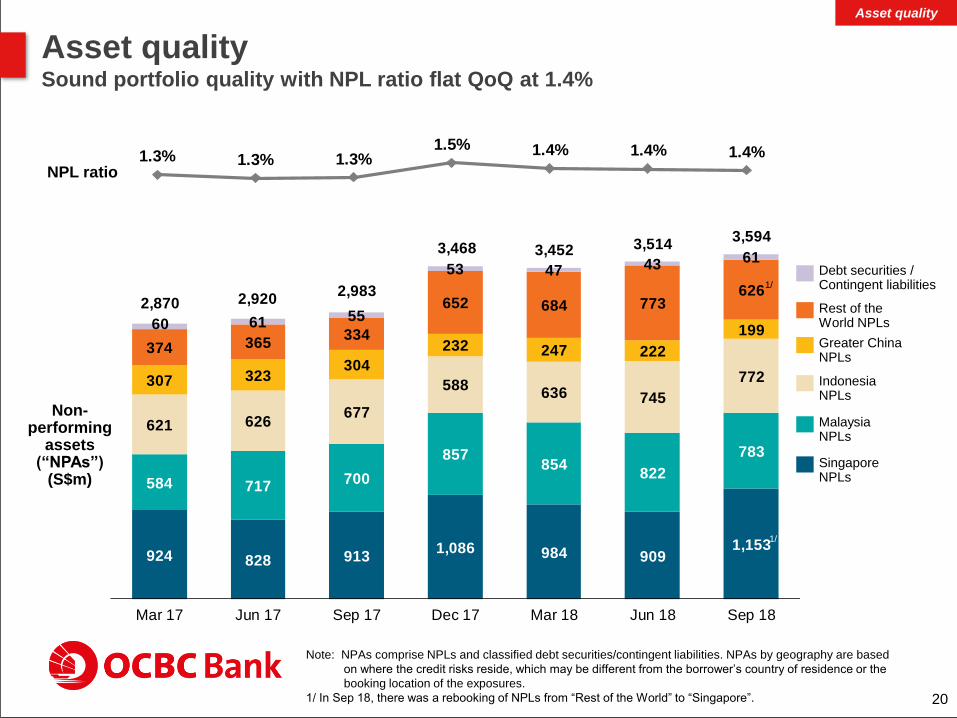
Asset qualitySound portfolio quality with NPL ratio flat QoQ at 1.4%
Note: NPAs comprise NPLs and classified debt securities/contingent liabilities. NPAs by geography are based
on where the credit risks reside, which may be different from the borrower’s country of residence or the
booking location of the exposures.
1/ In Sep 18, there was a rebooking of NPLs from “Rest of the World” to “Singapore”.
Non-performing
assets(“NPAs”)
(S$m)
NPL ratio
Singapore NPLs
Malaysia NPLs
Indonesia NPLs
Debt securities / Contingent liabilities
Greater China NPLs
Rest of the World NPLs
Asset quality
20
1.3% 1.3% 1.3%1.5% 1.4% 1.4% 1.4%
924 828 9131,086 984 909
1,153
584 717700
857854
822
783
621 626677
588636 745
772307 323304
232 247 222
199374 365
334
652 684 773626
60 61 55
53 47 43 61
2,870 2,9202,983
3,468 3,452 3,5143,594
Mar 17 Jun 17 Sep 17 Dec 17 Mar 18 Jun 18 Sep 18
1/
1/
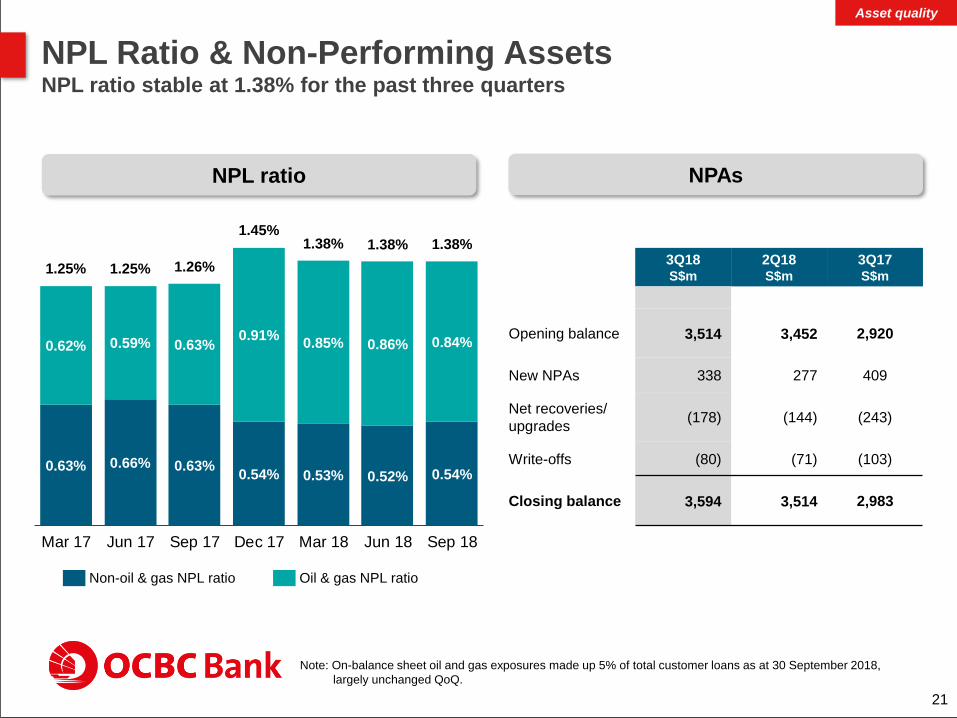
NPL Ratio & Non-Performing AssetsNPL ratio stable at 1.38% for the past three quarters
Non-oil & gas NPL ratio Oil & gas NPL ratio
21
Asset quality
3Q18S$m
2Q18S$m
3Q17S$m
Opening balance 3,514 3,452 2,920
New NPAs 338 277 409
Net recoveries/
upgrades(178) (144) (243)
Write-offs (80) (71) (103)
Closing balance 3,594 3,514 2,983
NPL ratio NPAs
Note: On-balance sheet oil and gas exposures made up 5% of total customer loans as at 30 September 2018,
largely unchanged QoQ.
0.63% 0.66% 0.63%0.54% 0.53% 0.52% 0.54%
0.62% 0.59% 0.63%0.91%
0.85% 0.86% 0.84%
1.25% 1.25% 1.26%
1.45%1.38% 1.38% 1.38%
Mar 17 Jun 17 Sep 17 Dec 17 Mar 18 Jun 18 Sep 18

82 84 84 88 83 86 84
50 51 51 52 53 53 52
115 108 108118 124 125 128
18 22 25
26 29 27 23265 264 268
284 289 290 287
Mar 17 Jun 17 Sep 17 Dec 17 Mar 18 Jun 18 Sep 18
S$132b S$135b S$135b S$140b S$136b S$138b S$136b
Customer depositsCustomer deposits of S$287b were 7% higher YoY; CASA ratio at 47.5%
22
Note: CASA ratio refers to the ratio of current account and savings deposits to total customer deposits.
Customer deposits
(S$b)
CASA ratio
Deposits
Current Account
Savings Deposits
Fixed Deposits
Others
49.9%50.9% 50.5%
49.2%47.1% 47.7% 47.5%

83 94
83 95
84 96 85
98 89 101
89 101
90 103
60
84
60
83
61
84
61
93
61
94
65
92
68
89 20
22
20
22
20
22
21
22
21
24
21
23
21
23
30
26
31
26
32
26
33
29
34
27
36
28
36
29
5
8
6
7
5
8
5
8
5
7
5
8
5
8
7
8
8
8
7
8
8
8
8
9
8
9
8
8
20
23
21
23
23
24
24
26
29
27
28
29
29
27
225
265
229
264
232
268
237
284
247
289
252
290
257
287
LoansDeposits LoansDeposits LoansDeposits LoansDeposits LoansDeposits LoansDeposits LoansDeposits
RMB 65.8% 73.2% 69.0% 61.3% 74.2% 63.9% 58.5%
USD 71.0% 72.0% 72.0% 65.8% 65.6% 70.6% 76.0%
SGD 88.2% 87.4% 87.7% 87.5% 88.2% 88.2% 87.5%
Loans-to-Deposits RatioGroup LDR higher QoQ and YoY at 88.5%
23
Customer loans and Customer deposits
(S$b)
SGD
USD
MYR
HKD
RMB
IDR
Others
1/ Group loans-to-deposits ratio (“LDR”) based on net customer loans / customer deposits; LDRs by currency based on gross customer loans / customer deposits.
Mar 17 Jun 17 Sep 17 Dec 17 Mar 18 Jun 18 Sep 18
LDRs 1/
Funding
Group
LDR 1/
83.6%85.2% 85.3%
82.5%84.4% 85.9%
88.5%

Average Liquidity Coverage Ratio & Net Stable Funding RatioCASA by Major Currencies
Funding & LiquidityCustomer deposits made up 78% of total funding; all-currency LCR and NSFR at 130% and
108% respectively, comfortably above regulatory guidelines
24
106% 108% 108%
143% 144% 147%159% 149%
138% 130%
267% 260% 269%254%
230%249%
232%
0.6
1.1
1.6
2.1
2.6
3.1
1Q17 2Q17 3Q17 4Q17 1Q18 2Q18 3Q18
SGD LCR
All-currency LCR
Funding
S$b Sep 17 Jun 18 Sep 18
SGD 67 70 69
USD 38 36 35
MYR 6 7 7
HKD 11 11 11
IDR 3 3 3
NSFR
Note: NSFR computed based on MAS Notice 652 effective 1 January 2018. Singapore dollar and all-currency LCRs and NSFR were higher as compared to the regulatory requirements effective at each reporting date.
Funding Composition as of 30 Sep 2018
Customer deposits78% Bank deposits
2%
Debt issued9%
Capital & reserves11%
Wholesale Funding by Currency as of 30 Sep 2018
Total
funding:
S$369b
By Maturity:
≤ 1 year 67%
> 1 year 33%
Total debt
issued:
S$32b
Others
6%
Current account
& savings deposits
37%
Fixed deposits
35%
USD65%
GBP10%
AUD9%
EUR10%
Others6%

25
1/ With full effect from 1 January 2018, capital ratios are computed based on Basel III rules. Capital ratios
before 1 January 2018 were computed based on Basel III transitional arrangements.
2/ Proforma CET1 CAR were computed based on Basel III rules effective from 1 January 2018.
3/ Leverage ratio of 7.1% as at 30 September 2018 was well above the 3% minimum regulatory requirement.
Capital Adequacy Ratios (“CAR”) (%)
Total CAR
Common Equity Tier 1 (“CET1”) CAR
CET1 capital (S$m) 27,688 27,800 27,807 26,907 26,206 26,641 27,377
Tier 1 capital (S$m) 29,558 29,684 29,694 28,960 28,277 28,714 28,948
RWA (S$m) 207,224 212,527 211,372 193,082 198,817 200,786 200,322
CapitalCET1 CAR rose to 13.6% from 13.2% in the previous quarter
Proforma CET1 CAR 2/
Leverage ratio 3/ (%) 7.7 7.8 7.6 7.3 7.0 7.0 7.1
Tier 1 CAR
Capital
Basel III transitional arrangements 1/ Basel III 1/
16.5 16.1 16.217.2
15.8 15.9 16.1
14.2 13.9 14.014.9
14.2 14.3 14.4
13.3 13.0 13.113.9
13.1 13.213.6
12.2 12.0 12.013.1
Mar 17 Jun 17 Sep 17 Dec 17 Mar 18 Jun 18 Sep 18
Agenda
26
Results Overview
3Q18 & 9M18 Group Performance Trends
Appendix: Performance of Major Subsidiaries
- Great Eastern Holdings
- OCBC Wing Hang
- OCBC Malaysia
- OCBC NISP

S$842mS$905mTWNS
1/ Figures for 9M17 were restated in accordance with SFRS(I) and change in accounting policy for GEH.
Note: “ppt” denotes percentage points.
OCBC Wing Hang
Subsidiaries’ PerformanceMajor subsidiaries contributed 33% to the Group’s profit
Major subsidiaries
-1%
+7%
-1%
-3.4ppt
Great Eastern
Holdings
43.3%39.9%NBEV margin
S$364mS$361mNBEV
Key Metrics YoY9M18 9M17
27
1/
OCBC NISP
OCBC Malaysia
-12%
flat
+2%
+22%
+16%
+3%
IDR1,669bIDR2,033bNet profit
IDR103tIDR120tLoans
IDR115tIDR118tDeposits
+12%
+12%
+8%
HKD1,826mHKD2,048mNet profit
HKD171bHKD192bLoans
HKD205bHKD222bDeposits
S$610mS$604mNet profit
RM707mRM625mNet profit
RM69bRM69bLoans
RM72bRM74bDeposits

28
3Q18 Great Eastern Holdings’ performanceNet profit contribution lower QoQ and YoY at S$176m
Note: Figures for 3Q17 were restated in accordance with SFRS(I) and change in accounting policy for GEH. For comparison in constant currency terms, operating profit in foreign currencies for 2018 were translated using the corresponding monthly spot rate in 2017. In applying constant currency translation, the impact to Operating Profit figures has been included in Non-Operating Profit.
1/ Operating Profit (net of tax) is defined as premiums less claims, surrenders, commissions, expenses and changes in reserves, plus investment income (dividends, coupons, etc).
2/ Non-operating profit / loss (net of tax) mainly comprises changes in the fair value of assets and liabilities, realised gains / losses on sale of investments, changes in liability discount rates and other non-recurring items.
3/ Primarily from adjustments made to amortisation for intangibles and non-controlling interests.
Great Eastern
GEH3Q18S$m
2Q18S$m
QoQ+/(-)%
3Q17S$m
YoY+/(-)%
Profit from insurance business 183 201 (9) 264 (31)
- Operating profit 1/ 141 153 (8) 158 (11)
- Non-operating profit 2/ 24 19 24 85 (72)
- Others 18 29 (37) 22 (15)
Profit from Shareholders’ Fund 66 79 (17) 59 12
Profit from operations 249 280 (11) 323 (23)
Write-back / (Allowances) 2 2 5 (7) (133)
Tax & NCI (38) (45) (15) (29) 29
Net profit 213 238 (10) 288 (26)
Group adjustments 3/ (37) (41) (7) (48) (21)
Net profit contribution to Group 176 197 (11) 240 (27)
29
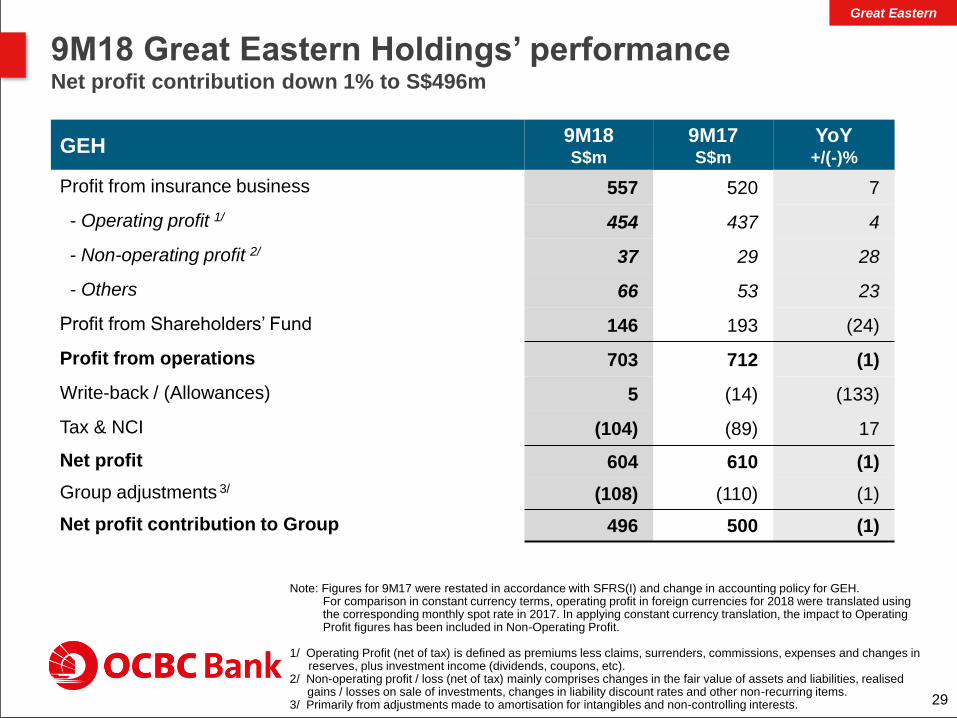
9M18 Great Eastern Holdings’ performanceNet profit contribution down 1% to S$496m
Note: Figures for 9M17 were restated in accordance with SFRS(I) and change in accounting policy for GEH. For comparison in constant currency terms, operating profit in foreign currencies for 2018 were translated using the corresponding monthly spot rate in 2017. In applying constant currency translation, the impact to Operating Profit figures has been included in Non-Operating Profit.
1/ Operating Profit (net of tax) is defined as premiums less claims, surrenders, commissions, expenses and changes in reserves, plus investment income (dividends, coupons, etc).
2/ Non-operating profit / loss (net of tax) mainly comprises changes in the fair value of assets and liabilities, realised gains / losses on sale of investments, changes in liability discount rates and other non-recurring items.
3/ Primarily from adjustments made to amortisation for intangibles and non-controlling interests.
Great Eastern
GEH9M18S$m
9M17S$m
YoY+/(-)%
Profit from insurance business 557 520 7
- Operating profit 1/ 454 437 4
- Non-operating profit 2/ 37 29 28
- Others 66 53 23
Profit from Shareholders’ Fund 146 193 (24)
Profit from operations 703 712 (1)
Write-back / (Allowances) 5 (14) (133)
Tax & NCI (104) (89) 17
Net profit 604 610 (1)
Group adjustments 3/ (108) (110) (1)
Net profit contribution to Group 496 500 (1)

Note: - Operating Profit (net of tax) is defined as premiums less claims, surrenders, commissions, expenses and
changes in reserves, plus investment income (dividends, coupons, etc). - Figures for 2017 periods were restated in accordance with SFRS(I) and change in accounting policy for GEH.
Figures for FY16 were not restated.- For comparison in constant currency terms, operating profit in foreign currencies for 2018 were translated using
the corresponding monthly spot rate in 2017. Operating profit and non-operating profit in foreign currencies for FY16 were translated using exchange rates as at 31 December 2017. In applying constant currency translation, the impact to Operating Profit figures has been included in Non-Operating Profit. 30
GEH: Operating Profit3Q18 operating profit from insurance business was 11% lower YoY at S$141m, mainly
due to the release of reserves in the prior year from the repositioning of the maturity
profile of assets and liabilities in the Singapore insurance business
Great Eastern
502
600
454121
158 158163 159
153
141
FY16 FY17 9M18 1Q17 2Q17 3Q17 4Q17 1Q18 2Q18 3Q18
Operating profit from insurance business
(S$m)
-11% YoY

GEH: Non-operating profit 3Q18 non-operating profit at S$24m mainly from the narrowing of credit spreads and
gains from equities
Note: - Non-operating profit / loss (net of tax) mainly comprises changes in the fair value of assets and liabilities,
realised gains / losses on sale of investments, changes in liability discount rates and other non-recurring items.- Figures for 2017 periods were restated in accordance with SFRS(I) and change in accounting policy for GEH.
Figures for FY16 were not restated. - For comparison in constant currency terms, operating profit in foreign currencies for 2018 were translated using
the corresponding monthly spot rate in 2017. Operating profit and non-operating profit in foreign currencies for FY16 were translated using exchange rates as at 31 December 2017. In applying constant currency translation, the impact to Operating Profit figures has been included in Non-Operating Profit.
(46)
113
37
(82)
27
85 84
(5)
19 24
FY16 FY17 9M18 1Q17 2Q17 3Q17 4Q17 1Q18 2Q18 3Q18
Non-operating profit/(loss)
from insurance business
(S$m)
Great Eastern
31

691
940
641
371
353
247
15
19
17
203167
226
344
154
230256
73
84
75
121
70
91
865
5
5
5
7
64
1,078
1,313
905
280256
306
471
231
327347
FY16 FY17 9M18 1Q17 2Q17 3Q17 4Q17 1Q18 2Q18 3Q18
TWNS (S$m)
Singapore
Emerging markets
Malaysia
GEH: Total weighted new sales 3Q18 TWNS rose 14% YoY to S$347m, driven by higher sales from agency channels in
Singapore and Malaysia
+14% YoY
Note: For comparison in constant currency terms, TWNS in foreign currencies for 2018 were translated
using the corresponding monthly spot rate in 2017.
1/ TWNS in foreign currencies for FY16 were translated using exchange rates as at 31 December 2017.
TWNS for FY16 included sales from Group’s investment in Vietnam up to June 2016.
Great Eastern
1/
32
43.6% 41.4% 39.9% 39.6%
50.3%
40.8%37.9%
43.6% 42.7%
34.8%
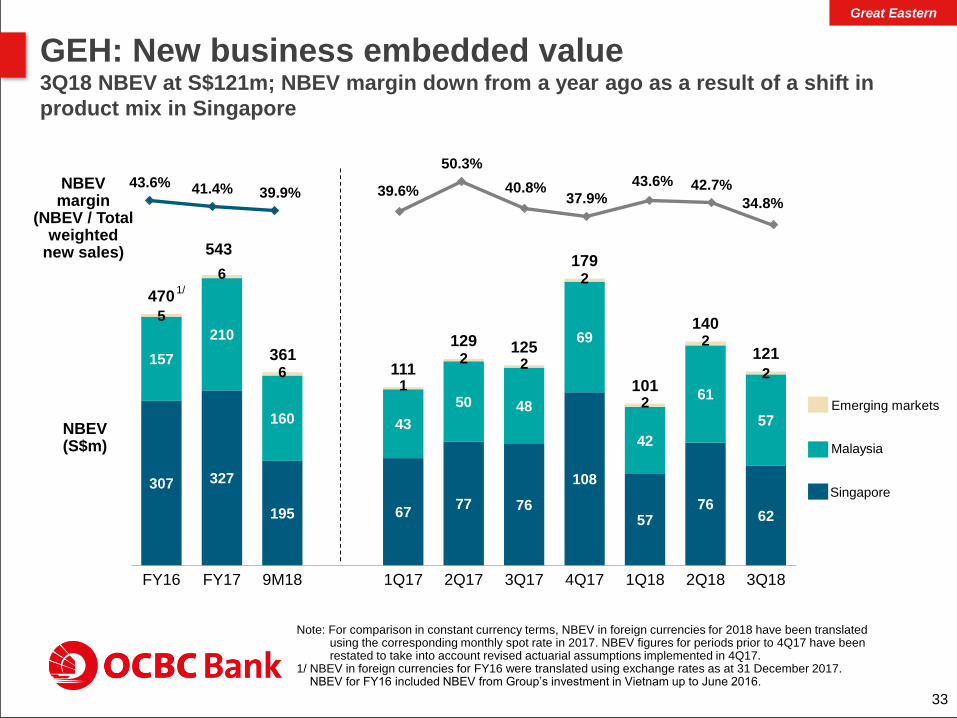
GEH: New business embedded value3Q18 NBEV at S$121m; NBEV margin down from a year ago as a result of a shift in
product mix in Singapore
NBEV (S$m)
NBEV margin
(NBEV / Total weighted
new sales)
Note: For comparison in constant currency terms, NBEV in foreign currencies for 2018 have been translated using the corresponding monthly spot rate in 2017. NBEV figures for periods prior to 4Q17 have been restated to take into account revised actuarial assumptions implemented in 4Q17.
1/ NBEV in foreign currencies for FY16 were translated using exchange rates as at 31 December 2017. NBEV for FY16 included NBEV from Group’s investment in Vietnam up to June 2016.
Great Eastern
307 327
195
157
210
160
5
6
6
6777 76
108
5776
62
43
50 48
69
42
61
57
1
2 2
2
2
2
2
470
543
361111
129 125
179
101
140
121
FY16 FY17 9M18 1Q17 2Q17 3Q17 4Q17 1Q18 2Q18 3Q18
1/
Singapore
Emerging markets
Malaysia
33

3Q18 OCBC Wing Hang’s performanceOperating profit rose 13% QoQ and 5% YoY to HKD955m
34
OCBC Wing Hang3Q18HKD m
2Q18HKD m
QoQ+/(-)%
3Q17HKD m
YoY+/(-)%
Net interest income 1,205 1,177 2 1,103 9
Non-interest income 536 463 16 566 (5)
Total income 1,741 1,640 6 1,669 4
Operating expenses (786) (795) (1) (762) 3
Operating profit 955 845 13 907 5
(Allowances)/ write-back (81) 37 319 43 286
Associates 5 24 (77) 16 (65)
Profit before tax 879 906 (3) 966 (9)
Tax (166) (198) (16) (119) 39
Net profit – local reporting 713 708 1 847 (16)
Key ratios (%)
Cost-to-income 45.2 48.5 45.7
OCBC Wing Hang
1/
1/ 3Q18 allowances mainly related to ECL Stage 1 and 2.
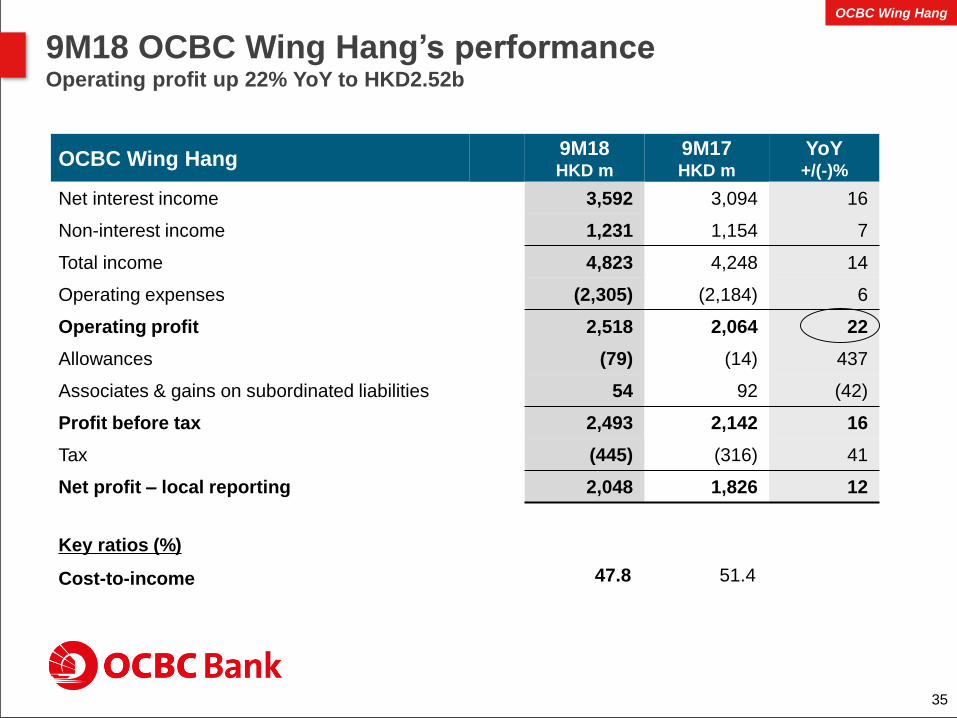
OCBC Wing Hang9M18HKD m
9M17HKD m
YoY+/(-)%
Net interest income 3,592 3,094 16
Non-interest income 1,231 1,154 7
Total income 4,823 4,248 14
Operating expenses (2,305) (2,184) 6
Operating profit 2,518 2,064 22
Allowances (79) (14) 437
Associates & gains on subordinated liabilities 54 92 (42)
Profit before tax 2,493 2,142 16
Tax (445) (316) 41
Net profit – local reporting 2,048 1,826 12
Key ratios (%)
Cost-to-income 47.8 51.4
9M18 OCBC Wing Hang’s performanceOperating profit up 22% YoY to HKD2.52b
35
OCBC Wing Hang

601
OCBC Wing Hang: Revenue3Q18 net interest income rose 2% QoQ to HKD1.21b, with NIM up 5bps QoQ at 1.61%.
Non-interest income grew 16% QoQ to HKD536m
36
OCBC Wing Hang
1/ FY17 and 3Q17 included higher net gains from sale of investment securities.
275
314
566
248 232
463
536
1,228
1,403
1,231
FY16 FY17 9M18 1Q17 2Q17 3Q17 4Q17 1Q18 2Q18 3Q18
1.67%1.57% 1.60% 1.56% 1.58% 1.54% 1.60% 1.61% 1.56% 1.61%
3,794
4,254
3,592
970 1,021
1,103 1,160
1,210 1,177 1,205
FY16 FY17 9M18 1Q17 2Q17 3Q17 4Q17 1Q18 2Q18 3Q18
Non-interest income (HKD m)
24.4% 24.8% 25.5% 22.1% 23.5%33.9%
17.6%16.1%28.2%30.8%
Net interest income (HKD m)
Net interest margin
Non-int. income/ Total income
1/
1/

194 197 205
222 219 217 222
Mar 17 Jun 17 Sep 17 Dec 17 Mar 18 Jun 18 Sep 18
0.8% 0.9% 0.8%0.5% 0.5% 0.4% 0.4%
72.3% 71.7% 71.8% 70.3%74.8% 74.8% 74.1%
NPL ratio
Gross Loans (HKD b) Deposits (HKD b)
CASA Ratio
35.9% 37.5% 36.7% 38.0% 37.4% 36.6% 37.9%
1/ LDR calculation based on Hong Kong Monetary Authority’s guidelines.
OCBC Wing Hang: Loans & DepositsLoans and deposits increased 12% and 8% YoY respectively; NPL ratio at 0.4%
164 166 171
180 189 190 192
Mar 17 Jun 17 Sep 17 Dec 17 Mar 18 Jun 18 Sep 18
37
OCBC Wing Hang
Loans / Deposits 1/
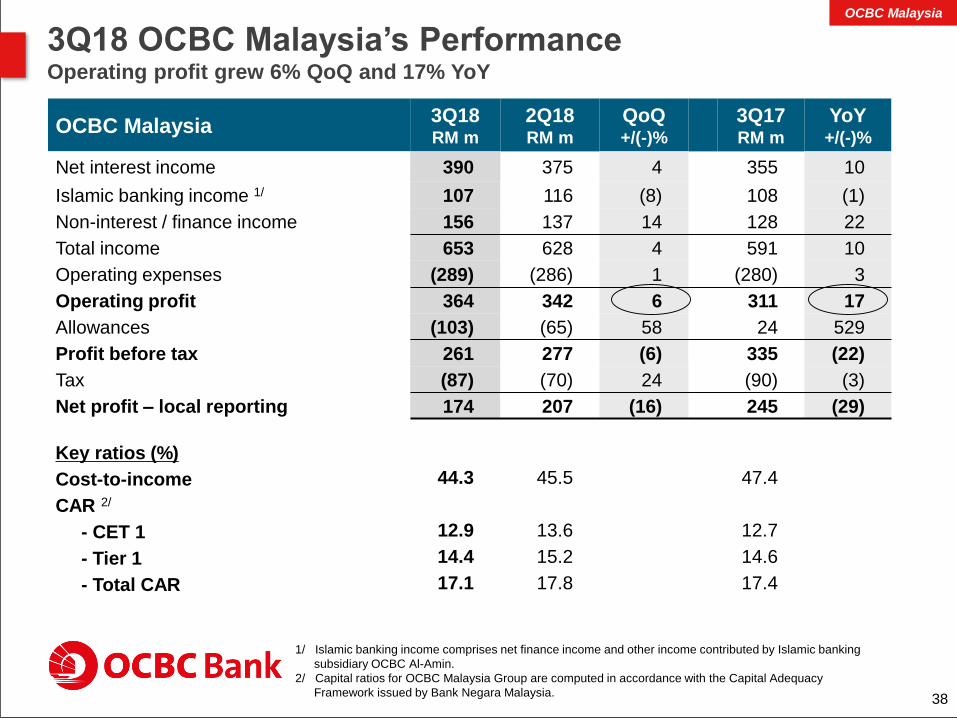
3Q18 OCBC Malaysia’s Performance Operating profit grew 6% QoQ and 17% YoY
38
OCBC Malaysia3Q18RM m
2Q18RM m
QoQ+/(-)%
3Q17RM m
YoY+/(-)%
Net interest income 390 375 4 355 10
Islamic banking income 1/ 107 116 (8) 108 (1)
Non-interest / finance income 156 137 14 128 22
Total income 653 628 4 591 10
Operating expenses (289) (286) 1 (280) 3
Operating profit 364 342 6 311 17
Allowances (103) (65) 58 24 529
Profit before tax 261 277 (6) 335 (22)
Tax (87) (70) 24 (90) (3)
Net profit – local reporting 174 207 (16) 245 (29)
Key ratios (%)
Cost-to-income 44.3 45.5 47.4
CAR 2/
- CET 1 12.9 13.6 12.7
- Tier 1 14.4 15.2 14.6
- Total CAR 17.1 17.8 17.4
1/ Islamic banking income comprises net finance income and other income contributed by Islamic banking
subsidiary OCBC Al-Amin.
2/ Capital ratios for OCBC Malaysia Group are computed in accordance with the Capital Adequacy
Framework issued by Bank Negara Malaysia.
OCBC Malaysia
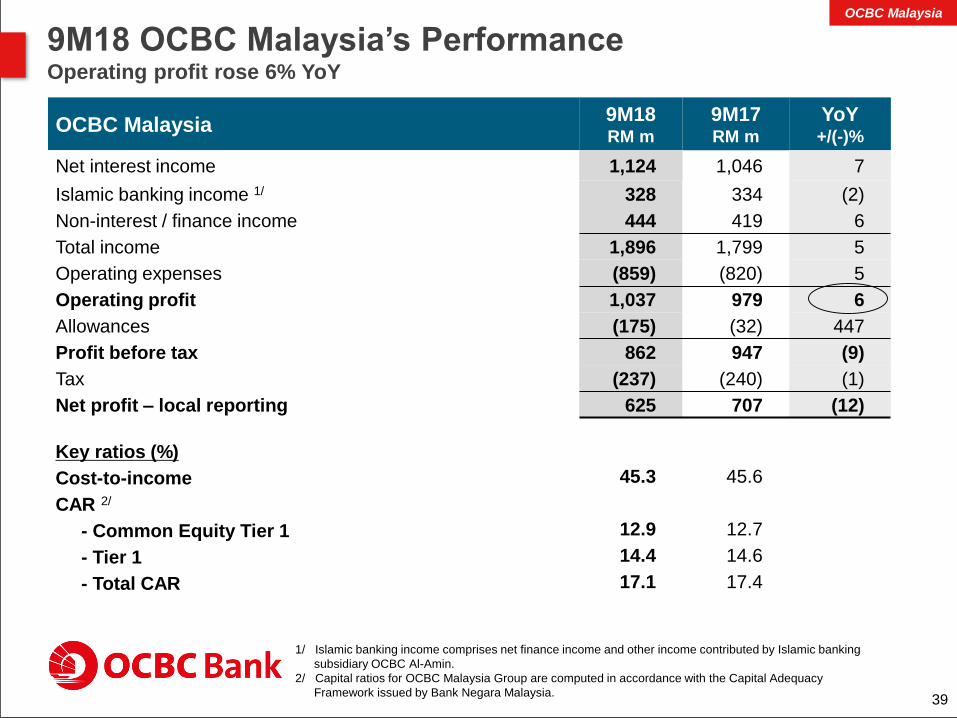
OCBC Malaysia9M18RM m
9M17RM m
YoY+/(-)%
Net interest income 1,124 1,046 7
Islamic banking income 1/ 328 334 (2)
Non-interest / finance income 444 419 6
Total income 1,896 1,799 5
Operating expenses (859) (820) 5
Operating profit 1,037 979 6
Allowances (175) (32) 447
Profit before tax 862 947 (9)
Tax (237) (240) (1)
Net profit – local reporting 625 707 (12)
Key ratios (%)
Cost-to-income 45.3 45.6
CAR 2/
- Common Equity Tier 1 12.9 12.7
- Tier 1 14.4 14.6
- Total CAR 17.1 17.4
9M18 OCBC Malaysia’s Performance Operating profit rose 6% YoY
39
1/ Islamic banking income comprises net finance income and other income contributed by Islamic banking
subsidiary OCBC Al-Amin.
2/ Capital ratios for OCBC Malaysia Group are computed in accordance with the Capital Adequacy
Framework issued by Bank Negara Malaysia.
OCBC Malaysia

25.4% 27.5% 26.1% 24.0%29.4%
23.9%32.1% 27.3% 25.3% 25.7%
346 345 355 359 359 375 390
99 96 95 90 8893
95
1,3091,405
1,124
435380
276
445 441 450 449 447468
485
1,744 1,785
1,400
FY16 FY17 9M18 1Q17 2Q17 3Q17 4Q17 1Q18 2Q18 3Q18
OCBC Malaysia: Revenue3Q18 net interest/finance income grew 4% QoQ and 8% YoY; with NIM higher at 2.11%.
Non-interest income rose 6% QoQ and 19% YoY
40
Net interest/finance income (RM m) Non-interest/finance income1/ (RM m)
IslamicConventional
1/ Non-interest/finance income comprises net fee and commission income, net trading income and other
operating income.
Non-interest/finance income/ Total income
IslamicConventional
Note: Based on Bank Negara Malaysia’s guidelines and Malaysian Financial Reporting Standards.
OCBC Malaysia
Net interest/ finance margin
1.91% 1.95% 2.08% 1.96% 1.92% 1.93% 1.98% 2.03% 2.10% 2.11%
128
164
128
187
151137
156
12
19
13
26
1722
12
560607
444
35
70
51140
183
141
213
168159
168
595
677
495
FY16 FY17 9M18 1Q17 2Q17 3Q17 4Q17 1Q18 2Q18 3Q18
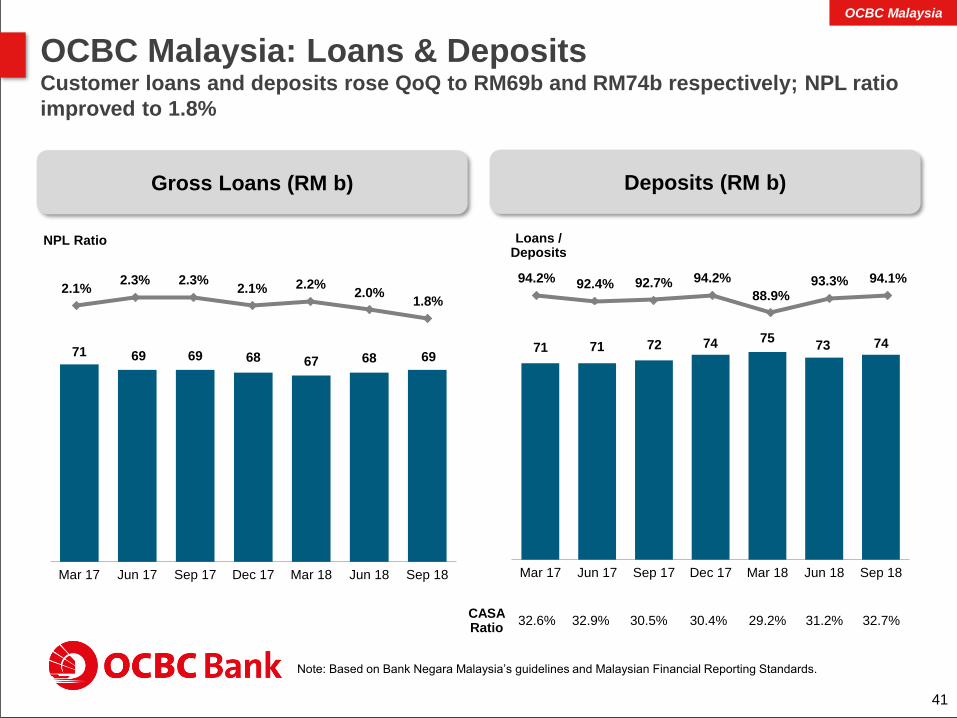
94.2% 92.4% 92.7% 94.2%
88.9%93.3% 94.1%
2.1%2.3% 2.3%
2.1% 2.2%2.0%
1.8%
41
NPL Ratio Loans / Deposits
Gross Loans (RM b) Deposits (RM b)
Note: Based on Bank Negara Malaysia’s guidelines and Malaysian Financial Reporting Standards.
71 69 69 68 67 68 69
Mar 17 Jun 17 Sep 17 Dec 17 Mar 18 Jun 18 Sep 18
OCBC Malaysia: Loans & DepositsCustomer loans and deposits rose QoQ to RM69b and RM74b respectively; NPL ratio
improved to 1.8%
71 71 72 74 7573 74
Mar 17 Jun 17 Sep 17 Dec 17 Mar 18 Jun 18 Sep 18
CASA Ratio
32.6% 32.9% 30.5% 30.4% 29.2% 31.2% 32.7%
OCBC Malaysia
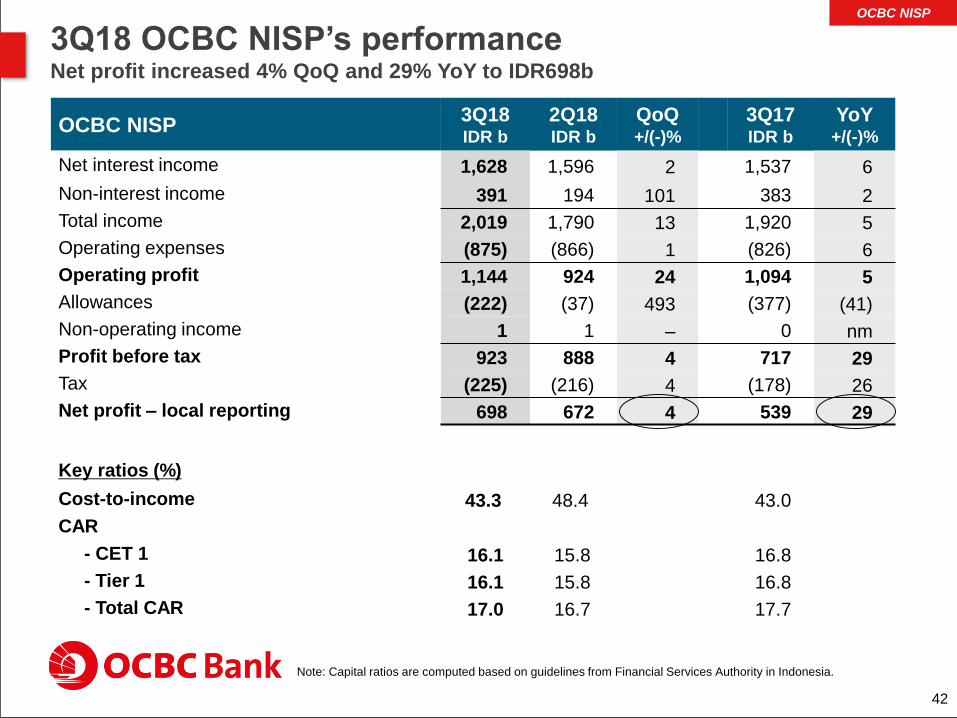
3Q18 OCBC NISP’s performanceNet profit increased 4% QoQ and 29% YoY to IDR698b
42
OCBC NISP 3Q18IDR b
2Q18IDR b
QoQ+/(-)%
3Q17IDR b
YoY+/(-)%
Net interest income 1,628 1,596 2 1,537 6
Non-interest income 391 194 101 383 2
Total income 2,019 1,790 13 1,920 5
Operating expenses (875) (866) 1 (826) 6
Operating profit 1,144 924 24 1,094 5
Allowances (222) (37) 493 (377) (41)
Non-operating income 1 1 – 0 nm
Profit before tax 923 888 4 717 29
Tax (225) (216) 4 (178) 26
Net profit – local reporting 698 672 4 539 29
Key ratios (%)
Cost-to-income 43.3 48.4 43.0
CAR
- CET 1 16.1 15.8 16.8
- Tier 1 16.1 15.8 16.8
- Total CAR 17.0 16.7 17.7
OCBC NISP
Note: Capital ratios are computed based on guidelines from Financial Services Authority in Indonesia.

OCBC NISP9M18IDR b
9M17IDR b
YoY+/(-)%
Net interest income 4,775 4,465 7
Non-interest income 971 1,146 (15)
Total income 5,746 5,611 2
Operating expenses (2,626) (2,477) 6
Operating profit 3,120 3,134 –
Allowances (434) (924) (53)
Non-operating income 2 0 nm
Profit before tax 2,688 2,210 22
Tax (655) (541) 21
Net profit – local reporting 2,033 1,669 22
Key ratios (%)
Cost-to-income 45.7 44.1
CAR
- CET 1 16.1 16.8
- Tier 1 16.1 16.8
- Total CAR 17.0 17.7
9M18 OCBC NISP’s performanceNet profit grew 22% YoY to IDR2.03t
43
OCBC NISP
Note: Capital ratios are computed based on guidelines from Financial Services Authority in Indonesia.

4.62% 4.47%4.19% 4.31%
4.67% 4.48% 4.41% 4.24% 4.08%4.26% 20.8% 20.0%16.9%
19.5%21.8%19.9%18.9%19.9%
10.9%
19.3%
OCBC NISP: Revenue3Q18 net interest income increased 2% QoQ; NIM improved 18bps QoQ to 4.26%
44
Net interest income (IDR b) Non-interest income (IDR b)
Note: NIM and Non-interest Income/Total Income ratio calculation based on guidelines from Financial Services
Authority in Indonesia.
5,393
6,039
4,775
1,413
1,515 1,537 1,574 1,551 1,596 1,628
FY16 FY17 9M18 1Q17 2Q17 3Q17 4Q17 1Q18 2Q18 3Q18
Net interest margin
Non-int. income/ Total income
1,4161,513
971
341
422
383367
386
194
391
FY16 FY17 9M18 1Q17 2Q17 3Q17 4Q17 1Q18 2Q18 3Q18
OCBC NISP
CASA Ratio
39.2% 43.5% 39.8% 38.5% 34.9% 36.6% 37.8%
1.9% 1.9% 1.9% 1.8% 1.7% 1.8% 1.8%
45
NPL Ratio Loans / Deposits
Deposits (IDR t)
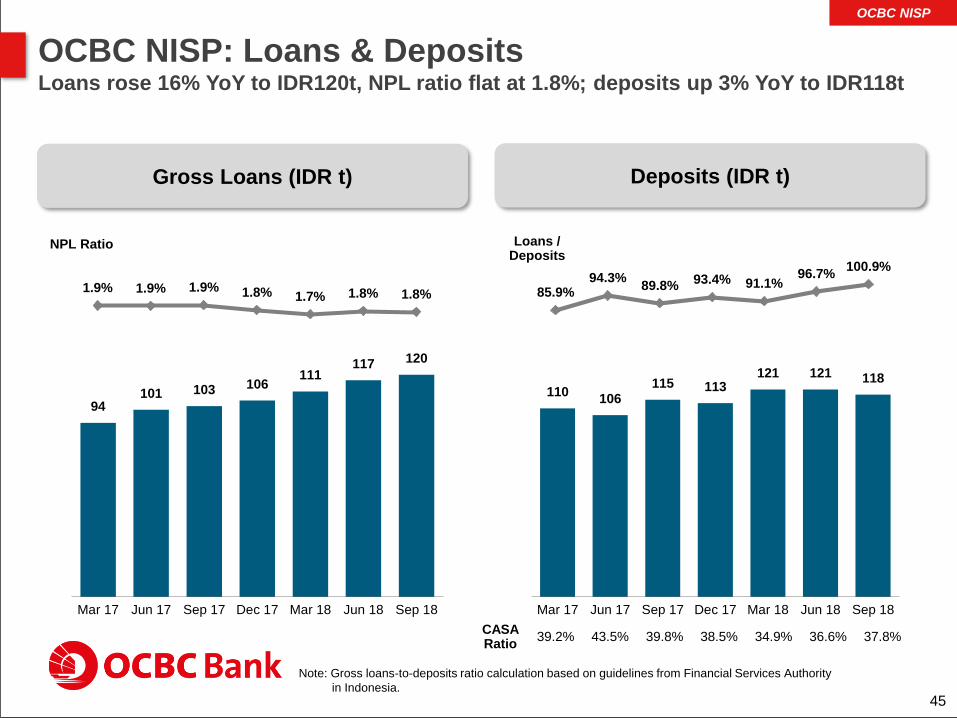
OCBC NISP: Loans & DepositsLoans rose 16% YoY to IDR120t, NPL ratio flat at 1.8%; deposits up 3% YoY to IDR118t
Note: Gross loans-to-deposits ratio calculation based on guidelines from Financial Services Authority
in Indonesia.
94101 103 106
111117 120
Mar 17 Jun 17 Sep 17 Dec 17 Mar 18 Jun 18 Sep 18
85.9%94.3%
89.8%93.4% 91.1%
96.7%100.9%
110106
115 113121 121 118
Mar 17 Jun 17 Sep 17 Dec 17 Mar 18 Jun 18 Sep 18
Gross Loans (IDR t)
OCBC NISP

Third Quarter 2018 Results
Thank You