Embed Size (px)
Citation preview
27 July 2016
1QFY17 Results Update | Sector: Automobiles
Maruti Suzuki
Jinesh Gandhi ([email protected]); +91 22 3982 5416 Venil Shah ([email protected]); +91 22 3982 5445 /Aditya Vora ([email protected]); +91 22 3078 4701
BSE SENSEX S&P CNX CMP: INR4,485 TP: INR5,510(+23%) Buy 27,977 8,591
Bloomberg MSIL IN Equity Shares (m) 302.1 M.Cap.(INRb)/(USDb) 1354.9 / 20.1
52-Week Range (INR) 4789 / 3202 1, 6, 12 Rel. Per (%) 4/-5/6 12M Avg Val (INR M) 3434 Free float (%) 43.8
Financials & Valuations (INR b) Y/E Mar 2016 2017E 2018E Net Sales 577.5 677.8 809.1 EBITDA 89.8 98.3 118.3 NP 45.7 64.7 81.5 EPS (INR) 155.5 219.5 275.5 EPS Gr. (%) 23.4 41.1 25.5 BV/Sh. (INR) 894.0 1,054.2 1,252.0 RoE (%) 16.9 20.3 21.6 RoCE (%) 24.0 27.6 28.9 Payout (%) 28.8 20.4 16.3 Div. Yield 5.0 4.3 3.6
Estimate change TP change Rating change
Operating performance in-line as mix improvement continues, higher other income, lower depreciation boosts PAT; Upgrade EPS Mix improvement continues, but Fx hurts margins: Volumes grew ~2% YoY
(-3% QoQ), restricted by fire at its vendors plant. Realizations improved 1% QoQ (+9.3% YoY) driven by better export mix, domestic mix and lower discounts. Net sales grew ~12% YoY (-2% QoQ) to ~INR149.3b (v/s est ~INR148.4b). EBITDA grew 2% YoY (-6% QoQ) to ~INR22.2b (v/s est INR21.9b). EBITDA margins declined ~140bp YoY (-60bp QoQ) to 14.8% (v/s est 14.8%), impacted by adverse Fx. However, higher other income (IndAS led) and lower depreciation (due to increase in estimate for useful life of tools & dies) drove PAT growth to ~23% YoY to ~INR14.9b (v/s est ~INR12.3b).
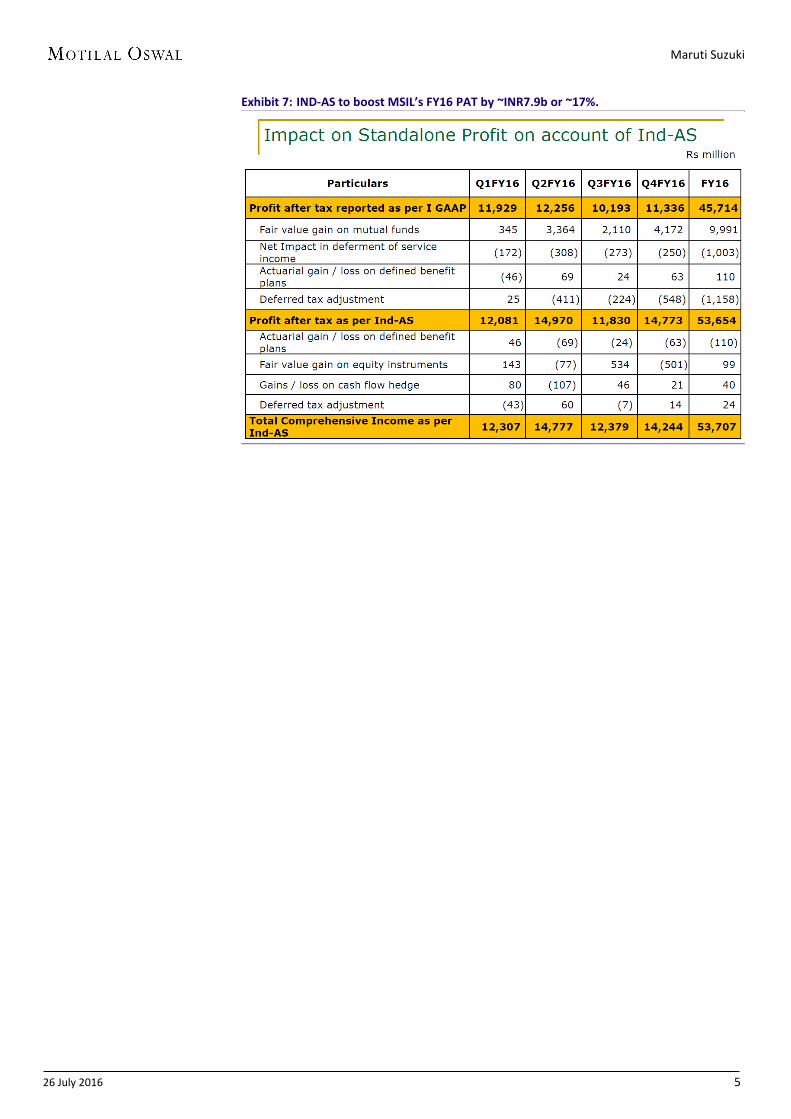
Earnings call highlights: a) MSIL’s rural sales were flat YoY in 1QFY17, b) Discounts reduced by ~INR800/unit QoQ to~INR16.8k, c) Gross margins were impacted by higher commodity prices (~50bp QoQ) and adverse JPY/INR (~60bp), d) JPY/INR rate for 1QFY17 was at ~0.63 for Direct imports, ~0.59 for vendor imports and ~0.65 for Royalty, e) Scope for operating leverage especially in SG&A, f) Working to reduce waiting period for Baleno (6-7 months) and Brezza (8-9 months), g) FY16 PAT under IndAS would be higher by ~INR7.9b or ~17%, and g) Maintains FY17 capex at ~INR45b.
Valuation and view: We upgrade our FY17/18 EPS by 15%/11.5% to factor in for a) better mix, b) lower discounts, c) higher other income, and d) lower depreciation. The stock trades at 20.4x/16.3x FY17E/18E EPS. Maintain Buy with a target price of INR5,510. We now value MSIL at 20x consol EPS (v/s 18x earlier) to factor in for a) better competitive positioning, b) sharp improvement in RoIC and c) reduced EPS volatility due to lower Fx exposure.
Investors are advised to refer through important disclosures made at the last page of the Research Report. Motilal Oswal research is available on www.motilaloswal.com/Institutional-Equities, Bloomberg, Thomson Reuters, Factset and S&P Capital.
Motilal Oswal values your support in the Asiamoney Brokers Poll 2016 for
India Research, Sales and Trading team. We request your ballot.
Quarterly Performance (INR MillionY/E March FY16E FY17E
1Q 2Q 3Q 4Q 1Q 2Q 3Q 4Q
Total Volumes (nos) 341,329 353,335 374,182 360,354 348,443 390,000 413,500 431,003 1,429,200 1,582,946 Change (%) 13.8 9.8 15.5 3.9 2.1 10.4 10.5 19.6 10.6 10.8Realizations (INR/car) 391,907 394,348 403,063 424,741 428,400 427,329 429,466 427,662 404,046 428,214 Change (%) 2.8 3.1 3.6 8.1 9.3 8.4 6.6 0.7 4.5 6.0Net operating revenues 133,769 139,337 150,819 153,057 149,273 166,658 177,584 184,324 577,463 677,839 Change (%) 17.1 13.1 19.7 12.3 11.6 19.6 17.7 20.4 15.6 17.4
RM Cost (% of sales) 67.4 66.8 68.5 66.0 67.8 68.5 68.5 68.4 67.2 68.3Staff Cost (% of sales) 3.5 3.0 3.3 3.9 3.9 3.4 3.4 3.5 3.4 3.5Other Cost (% of sales) 12.9 13.9 13.8 14.8 13.4 13.8 13.5 13.8 13.9 13.6
EBITDA 21,673 22,694 21,701 23,501 22,157 23,855 25,911 26,374 89,785 98,298EBITDA Margins (%) 16.2 16.3 14.4 15.4 14.8 14.3 14.6 14.3 15.5 14.5
Non-Operating Income 2,065 1,371 315 1,212 4,833 4,250 4,500 4,200 4,619 17,783Interest 190 178 244 203 181 205 200 214 815 800Depreciation 6,716 6,694 7,221 7,608 6,389 6,400 6,750 7,067 28,239 26,606PBT 16,832 17,193 14,551 16,902 20,420 21,500 23,461 23,294 65,350 88,675 Effective Tax Rate (%) 28.2 28.7 29.9 32.9 27.2 27.0 27.0 26.8 30.0 27.0PAT 12,081 12,256 10,193 11,337 14,862 15,695 17,127 17,049 45,714 64,733Adjusted PAT 12,081 12,256 10,193 11,337 14,862 15,695 17,127 17,049 45,714 64,733 Change (%) 58.5 42.1 23.0 -11.7 23.0 28.1 68.0 50.4 23.2 41.6E:MOSL Estimates
FY17EFY16

Maruti Suzuki
26 July 2016 2
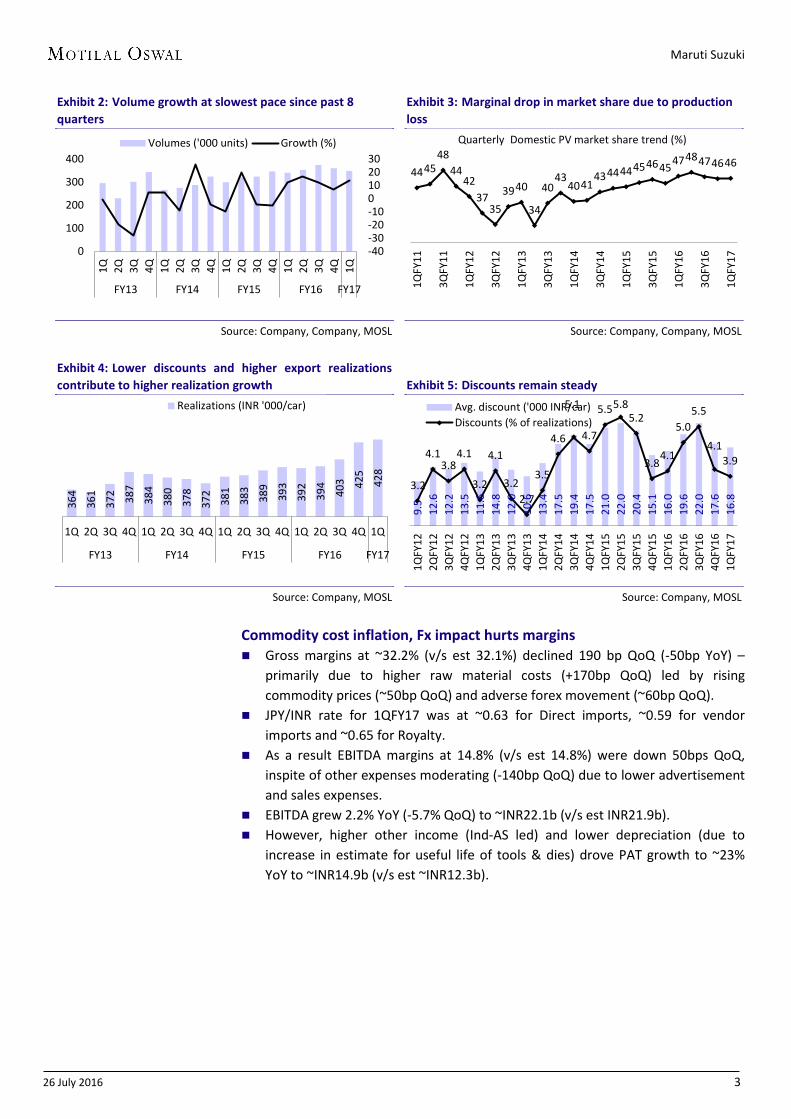
Sharp realization improvement drives revenues Volumes for 1QFY17 grew 2.1% YoY (-3.3% QoQ) to 348k units, slowest pace of
growth in the past 8 quarters. This was primarily due to production loss in June-16, led by a fire at the plant of its supplier Subros and earlier than scheduled maintenance shutdown resulting in a 14% decline for the month of Jun-16.
Exports were down for the second straight quarter (-27% YoY); while domestic volumes grew 5.4% YoY mainly due to incremental sales of newly launched products (Baleno and Vitarra Brezza).
Market share for MSIL declined in PV by 60bp YoY to 46.2% (+10bp QoQ) in 1QFY17. The marginal decline in market share was primarily due to production loss. We expect MSIL to gain market share driven by Baleno and Vitarra Brezza in the near term.
Realizations grew 9.3% YoY (+0.9% QoQ) to ~INR428k (v/s est INR426k). Improved product mix (Baleno, Scross and Vitarra Brezza), and export realisations growth of 33% YoY driven by commencement of Baleno exports drove realisation growth.
As a result, Net sales grew ~12.1% YoY (-1.8% QoQ) to ~INR146.5b (v/s est ~INR144.8b).
Exhibit 1: Marginal decline in market share due to production loss in 1QFY17 ('000 units) 1QFY17 1QFY16 YoY (%) 4QFY16 QoQ (%) FY16 FY15 YoY (%) A1 0 0 0 0 0
% of total 0 0 0 0 0 MPV 36.6 34.1 7.1 35.9 1.9 143.5 129 11.2
% of total 10.5 10 10 10 10 A2 186.9 184.2 1.5 195.5 -4.4 779 729.9 6.7
% of total 53.6 54 54.2 54.5 56.5 A3 59.5 71.8 -17.1 71.5 -16.8 288.5 243.6 18.4
% of total 17.1 21 19.8 20.2 18.8 UV 39.3 15.6 153 30.5 29 94 68 38.4
% of total 11.3 4.6 8.5 6.6 5.3 Exports 26.1 35.6 -26.7 27 -3.2 123.9 121.7 1.8
% of total 7.5 10.4 7.5 8.7 9.4 Total Sales 348.5 341.4 2.1 360.4 -3.3 1,429.20 1,292.40 10.6 Total PV (Incl Exports) MS (%) 40.9 42.9 -200bp 40.7 20bp 42.9 39.7 8 Total Dom. Car MS (%) 51.8 53.1 -130bp 52.5 -70bp 53.1 51 4.1 Total PV MS (%) 46.2 46.8 -60bp 46.1 10bp 46.8 44.1 6.1
Source: Company, MOSL
Maruti Suzuki
26 July 2016 3
Exhibit 2: Volume growth at slowest pace since past 8 quarters
Source: Company, Company, MOSL
Exhibit 3: Marginal drop in market share due to production loss
Source: Company, Company, MOSL
Exhibit 4: Lower discounts and higher export realizations contribute to higher realization growth
Source: Company, MOSL
Exhibit 5: Discounts remain steady
Source: Company, MOSL
Commodity cost inflation, Fx impact hurts margins Gross margins at ~32.2% (v/s est 32.1%) declined 190 bp QoQ (-50bp YoY) –
primarily due to higher raw material costs (+170bp QoQ) led by rising commodity prices (~50bp QoQ) and adverse forex movement (~60bp QoQ).
JPY/INR rate for 1QFY17 was at ~0.63 for Direct imports, ~0.59 for vendor imports and ~0.65 for Royalty.
As a result EBITDA margins at 14.8% (v/s est 14.8%) were down 50bps QoQ, inspite of other expenses moderating (-140bp QoQ) due to lower advertisement and sales expenses.
EBITDA grew 2.2% YoY (-5.7% QoQ) to ~INR22.1b (v/s est INR21.9b). However, higher other income (Ind-AS led) and lower depreciation (due to
increase in estimate for useful life of tools & dies) drove PAT growth to ~23% YoY to ~INR14.9b (v/s est ~INR12.3b).
-40-30-20-100102030
0
100
200
300
400
1Q 2Q 3Q 4Q 1Q 2Q 3Q 4Q 1Q 2Q 3Q 4Q 1Q 2Q 3Q 4Q 1Q
FY13 FY14 FY15 FY16 FY17
Volumes ('000 units) Growth (%)
44 45 48
44 42
37 35
39 40
34
40 43
40 41 43 44 44 45 46 45 47 48 47 46 46
1QFY
11
3QFY
11
1QFY
12
3QFY
12
1QFY
13
3QFY
13
1QFY
14
3QFY
14
1QFY
15
3QFY
15
1QFY
16
3QFY
16
1QFY
17
Quarterly Domestic PV market share trend (%)
364
361
372 387
384
380
378
372
381
383
389
393
392
394
403 42
5
428
1Q 2Q 3Q 4Q 1Q 2Q 3Q 4Q 1Q 2Q 3Q 4Q 1Q 2Q 3Q 4Q 1Q
FY13 FY14 FY15 FY16 FY17
Realizations (INR '000/car) 9
.5
12.
6
12.
2
13.
5
11.
6
14.
8
12.
0
10.
6
13.
4
17.
5
19.
4
17.
5
21.
0
22.
0
20.
4
15.
1
16.
0
19.
6
22.
0
17.
6
16.
8 3.2
4.1 3.8
4.1
3.2
4.1
3.2 2.7
3.5
4.6
5.1
4.7
5.5 5.8 5.2
3.8 4.1
5.0 5.5
4.1 3.9
1QFY
122Q
FY12
3QFY
124Q
FY12
1QFY
132Q
FY13
3QFY
134Q
FY13
1QFY
142Q
FY14
3QFY
144Q
FY14
1QFY
152Q
FY15
3QFY
154Q
FY15
1QFY
162Q
FY16
3QFY
164Q
FY16
1QFY
17
Avg. discount ('000 INR/car)Discounts (% of realizations)

Maruti Suzuki
26 July 2016 4
Exhibit 6: EBITDA margins improve QoQ; EBITDA/unit highest ever
Source: Company, MOSL
Earnings call highlights MSIL’s rural sales for 1QFY17 were flat, implying 2% YoY volume growth coming
from urban areas. Management indicated rural demand was sluggish. Petrol:Diesel Mix for the industry in 1QFY17 stood at 59:41 (1QFY16 mix of
56:44). MSIL’s share for 1QFY17 was 70% petrol and 30% diesel. Change in consumer preferences towards petrol is evident.
Export volumes declined by 27% YoY in 1QFY17 primarily due to high base to Sri Lanka and production loss in June. Baleno exports for the quarter were at 11,400 units. Management maintains Baleno exports number at 50,000 units for FY17.
Average discounts stood at INR 16,800 (lower by ~INR800/unit QoQ and higher by ~INR800 YoY.
IndAs impact: For FY16, under IndAS it would have a) deferment of service income of ~INR1b, and b) fair value of gain on mutual funds at ~INR10b. As a result, net profit for FY16 would be higher by ~INR7.9b or ~17%.
Depreciation expense for 1QFY17 was lower by INR833m due to change in amortization policy of dies and intangible assets (from 4 to 5 years)
Waiting period for Baleno was at 6-7 months, while Vitara Brezza was at 8-9 months. MSIL is trying to increase production of these 2 products to reduce the waiting period. Capacity is already enhanced to some degree.
Tax rate for FY17 is likely to be at 27%. Royalty in 1QFY17 was INR9.6b or 6.6% of net revenues (v/s 5.6% in 1QFY16).
Royalty costs have gone up by ~0.3% due to adverse currency movement. Capex: It expects INR45b of capex in FY17, with a) INR10b on maintenance
capex(Gurgaon plant and Manesar plant) b) Marketing investments: INR10-11b( Stock yards, spare parts, land procurement) c) Remaining to be expensed on product development and R&D.
Gujarat plant is expected to be operational in 4QFY17
28,7
85
17,4
64
16,8
34
23,8
25
26,5
76
22,0
75
29,5
66
58,1
69
43,7
69
47,9
50
47,0
17
38,4
01
46,2
38
47,5
97
49,9
97
62,4
25
63,4
97
64,2
27
57,9
96
65,2
14
63,5
89
9.6
5.7
5.2
7.3
7.3 6.
1
8.0
15.0
11.4
12.6
12.4
10.3
12.1
12.4
12.9
15.9
16.2
16.3
14.4
15.4
14.8
1Q 2Q 3Q 4Q 1Q 2Q 3Q 4Q 1Q 2Q 3Q 4Q 1Q 2Q 3Q 4Q 1Q 2Q 3Q 4Q 1Q
FY12 FY13 FY14 FY15 FY16 FY17
EBITDA (INR/unit) EBITDA Margins (%)
Maruti Suzuki
26 July 2016 5
Exhibit 7: IND-AS to boost MSIL’s FY16 PAT by ~INR7.9b or ~17%.

Maruti Suzuki
26 July 2016 6
Valuation and view Long term story intact, despite short term volatility
1st year of PV industry recovery & multi-year favorable product lifecycle for MSIL: MSIL would be the biggest beneficiary of impending demand recovery, considering its stronghold of worst impacted entry level segment as well as favorable product lifecycle. MSIL’s new product launches are targeted towards filling gaps in their product portfolio, and would improve product mix. We estimate MSIL to gain market share, driven by 14% CAGR in volumes over FY16-18E. This coupled with improvement in mix and reduction in discounts, would drive revenue CAGR of ~18% over FY16-18E.
EBITDA margins to remain healthy, despite moderating from recent highs: MSIL margins are estimated to decline from 15.5% in FY16 to ~14.5% in FY17 impacted by adverse Fx and recovery in commodity prices. We believe MSIL margins will remain healthy at 14-15% level, driven by a) potential to reduce discount as demand improves, b) mix improvement, c) benefit of operating leverage and d) reducing exposure to JPY due to exports to Japan and royalty in INR for new products.
Strong margins, asset light model to result in strong FCF generation and RoE improvement: Gujarat plant arrangement with the parent will make MSIL’s business asset light, freeing up management’s bandwidth to fortify its strength of marketing. We expect strong FCF generation of cumulative ~INR143b over FY17-18E. RoE are estimated to improve by 460bp to ~21.6% FY18E (over FY16), while RoIC would improve by 23pp to ~62.9% by FY18E.
Short term concerns remain: MSIL’s operating performance could be constrained by a) potential capacity constraint in FY17 at 1.6-1.63m units and FY18 at ~1.85m units, b) discounts remaining higher than expected (factor in for 90bp savings in discount in FY17), c) adverse Fx movement and d) commodity price inflation. Fx volatility is the key risk to our estimates, with ~1% JPYINR movement impacting FY17 EBITDA margins by ~15bp and EPS by ~1.1%.
Increasing EPS, Maintain Buy: We upgrade our FY17/18 EPS by 15%/11.5% to factor in for a) better mix, b) lower discounts, c) higher other income, and d) lower depreciation. The stock trades at 20.4x/16.3x FY17E/18E EPS. Short term headwinds notwithstanding, we remain positive on MSIL considering a) 1st year of recovery, b) Multi-year favorable product lifecycle, c) improvement in product mix (increasing share of premium products) aiding realizations and consequently margins, d) reducing JPY exposure and e) high FCF generation as capex intensity reduces. As a result, we now value MSIL at 20x consol EPS (v/s 18x earlier). Maintain Buy with a target price of INR5,510 (~20x FY18E EPS).

Maruti Suzuki
26 July 2016 7
Exhibit 8: Revised forecast (INR B) FY17E FY18E Rev Old Chg (%) Rev Old Chg (%) Total Volumes ('000) 1,583 1,623 -2.4 1,845 1,900 -2.9 Domestic 1,475 1,510 -2.3 1,720 1,768 -2.7 Exports 108 113 -4.2 124 132 -5.9 Net Sales 665 675 -1.5 794 809 -1.9 EBITDA 98 96 2.2 118 119 -0.5 EBITDA Margin (%) 14.5 13.9 60bp 14.6 14.4 20bp PAT 64.7 56.2 15.2 81.5 72.9 11.8 Consol EPS (INR) 219.5 191.2 14.8 275.5 247 11.5 Cash EPS (INR) 307.6 294.9 4.3 366.3 360.5 1.6 JPY/INR 0.65 0.6 8.3 0.69 0.62 11.5
Source: MOSL
Exhibit 9: MSIL 1 year forward PE (x) near LPA
Source: MOSL
Exhibit 10: MSIL 1 year forward PB (x) at premium to LPA
Source: MOSL
Exhibit 11: Comparative valuation
CMP Rating TP P/E (x) EV/EBITDA (x) RoE (%) RoCE (%) EPS CAGR (%) Auto OEM's (INR)* (INR) FY17E FY18E FY17E FY18E FY17E FY18E FY17E FY18E FY16E-18E Bajaj Auto 2,670 Buy 2,897 17.9 15.5 11.6 10.1 32.4 32.2 31.3 31.0 17.0 Hero MotoCorp 3,210 Buy 3,618 18.2 14.7 11.6 9.8 40.4 40.9 39.4 40.0 17.8 TVS Motor 291 Buy 323 23.8 18.1 14.4 11.2 27.1 28.7 28.0 30.2 33.0 M&M 1,450 Buy 1,724 19.8 15.2 15.6 12.8 15.6 17.8 13.0 15.1 22.5 Maruti Suzuki 4,485 Buy 5,509 20.4 16.3 11.7 9.7 20.3 21.6 27.6 28.9 33.5 Tata Motors 503 Buy 558 13.7 8.9 4.4 3.6 14.5 19.2 12.2 14.2 24.1 Ashok Leyland 95 Buy 118 14.6 11.2 8.1 6.5 29.8 31.0 21.9 25.2 47.2 Eicher Motors 20,122 Buy 22,646 34.7 24.9 19.9 15.5 38.7 39.8 31.4 33.6 31.2 Auto Ancillaries Bharat Forge 737 Buy 882 21.3 16.7 11.7 9.7 20.8 22.7 13.9 16.3 25.1 Exide Industries 177 Buy 205 19.8 17.2 12.5 10.8 15.3 15.5 15.8 16.2 18.6 Amara Raja Batteries 891 Buy 979 25.2 20.5 15.5 12.9 25.7 25.5 24.3 24.4 23.2 BOSCH 24,067 Buy 24,766 43.7 34.3 29.8 25.1 19.3 21.2 27.6 28.2 33.1
Source: MOSL
18.7 16.8
17.6
15.8
4
9
14
19
24
Jul-0
3
Mar
-05
Oct
-06
Jun-
08
Jan-
10
Aug-
11
Apr-1
3
Nov
-14
Jul-1
6P/E (x) 10 Yrs Avg(x)5 Yrs Avg(x) 12 Yrs Avg(x)
4.0
2.8
2.9 2.7
1.0
1.8
2.6
3.4
4.2
5.0
5.8
Jul-0
3
Mar
-05
Oct
-06
Jun-
08
Jan-
10
Aug-
11
Apr-1
3
Nov
-14
Jul-1
6
P/B (x) 10 Yrs Avg(x)
5 Yrs Avg(x) 12 Yrs Avg(x)
Maruti Suzuki
26 July 2016 8
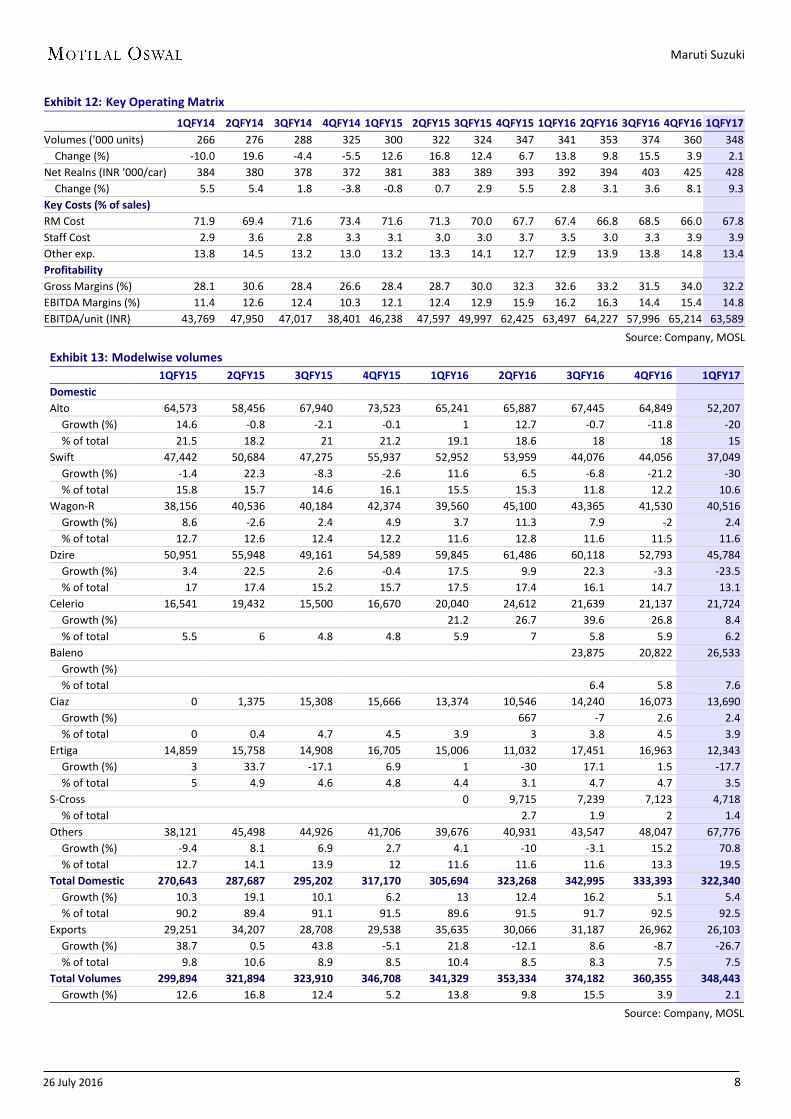
Exhibit 12: Key Operating Matrix
1QFY14 2QFY14 3QFY14 4QFY14 1QFY15 2QFY15 3QFY15 4QFY15 1QFY16 2QFY16 3QFY16 4QFY16 1QFY17 Volumes ('000 units) 266 276 288 325 300 322 324 347 341 353 374 360 348 Change (%) -10.0 19.6 -4.4 -5.5 12.6 16.8 12.4 6.7 13.8 9.8 15.5 3.9 2.1 Net Realns (INR '000/car) 384 380 378 372 381 383 389 393 392 394 403 425 428 Change (%) 5.5 5.4 1.8 -3.8 -0.8 0.7 2.9 5.5 2.8 3.1 3.6 8.1 9.3 Key Costs (% of sales) RM Cost 71.9 69.4 71.6 73.4 71.6 71.3 70.0 67.7 67.4 66.8 68.5 66.0 67.8 Staff Cost 2.9 3.6 2.8 3.3 3.1 3.0 3.0 3.7 3.5 3.0 3.3 3.9 3.9 Other exp. 13.8 14.5 13.2 13.0 13.2 13.3 14.1 12.7 12.9 13.9 13.8 14.8 13.4 Profitability Gross Margins (%) 28.1 30.6 28.4 26.6 28.4 28.7 30.0 32.3 32.6 33.2 31.5 34.0 32.2 EBITDA Margins (%) 11.4 12.6 12.4 10.3 12.1 12.4 12.9 15.9 16.2 16.3 14.4 15.4 14.8 EBITDA/unit (INR) 43,769 47,950 47,017 38,401 46,238 47,597 49,997 62,425 63,497 64,227 57,996 65,214 63,589
Source: Company, MOSL
Exhibit 13: Modelwise volumes
1QFY15 2QFY15 3QFY15 4QFY15 1QFY16 2QFY16 3QFY16 4QFY16 1QFY17 Domestic Alto 64,573 58,456 67,940 73,523 65,241 65,887 67,445 64,849 52,207
Growth (%) 14.6 -0.8 -2.1 -0.1 1 12.7 -0.7 -11.8 -20 % of total 21.5 18.2 21 21.2 19.1 18.6 18 18 15
Swift 47,442 50,684 47,275 55,937 52,952 53,959 44,076 44,056 37,049 Growth (%) -1.4 22.3 -8.3 -2.6 11.6 6.5 -6.8 -21.2 -30 % of total 15.8 15.7 14.6 16.1 15.5 15.3 11.8 12.2 10.6
Wagon-R 38,156 40,536 40,184 42,374 39,560 45,100 43,365 41,530 40,516 Growth (%) 8.6 -2.6 2.4 4.9 3.7 11.3 7.9 -2 2.4 % of total 12.7 12.6 12.4 12.2 11.6 12.8 11.6 11.5 11.6
Dzire 50,951 55,948 49,161 54,589 59,845 61,486 60,118 52,793 45,784 Growth (%) 3.4 22.5 2.6 -0.4 17.5 9.9 22.3 -3.3 -23.5 % of total 17 17.4 15.2 15.7 17.5 17.4 16.1 14.7 13.1
Celerio 16,541 19,432 15,500 16,670 20,040 24,612 21,639 21,137 21,724 Growth (%) 21.2 26.7 39.6 26.8 8.4 % of total 5.5 6 4.8 4.8 5.9 7 5.8 5.9 6.2
Baleno 23,875 20,822 26,533 Growth (%) % of total 6.4 5.8 7.6
Ciaz 0 1,375 15,308 15,666 13,374 10,546 14,240 16,073 13,690 Growth (%) 667 -7 2.6 2.4 % of total 0 0.4 4.7 4.5 3.9 3 3.8 4.5 3.9
Ertiga 14,859 15,758 14,908 16,705 15,006 11,032 17,451 16,963 12,343 Growth (%) 3 33.7 -17.1 6.9 1 -30 17.1 1.5 -17.7 % of total 5 4.9 4.6 4.8 4.4 3.1 4.7 4.7 3.5
S-Cross 0 9,715 7,239 7,123 4,718 % of total 2.7 1.9 2 1.4
Others 38,121 45,498 44,926 41,706 39,676 40,931 43,547 48,047 67,776 Growth (%) -9.4 8.1 6.9 2.7 4.1 -10 -3.1 15.2 70.8 % of total 12.7 14.1 13.9 12 11.6 11.6 11.6 13.3 19.5
Total Domestic 270,643 287,687 295,202 317,170 305,694 323,268 342,995 333,393 322,340 Growth (%) 10.3 19.1 10.1 6.2 13 12.4 16.2 5.1 5.4 % of total 90.2 89.4 91.1 91.5 89.6 91.5 91.7 92.5 92.5
Exports 29,251 34,207 28,708 29,538 35,635 30,066 31,187 26,962 26,103 Growth (%) 38.7 0.5 43.8 -5.1 21.8 -12.1 8.6 -8.7 -26.7 % of total 9.8 10.6 8.9 8.5 10.4 8.5 8.3 7.5 7.5
Total Volumes 299,894 321,894 323,910 346,708 341,329 353,334 374,182 360,355 348,443 Growth (%) 12.6 16.8 12.4 5.2 13.8 9.8 15.5 3.9 2.1
Source: Company, MOSL
Maruti Suzuki
26 July 2016 9
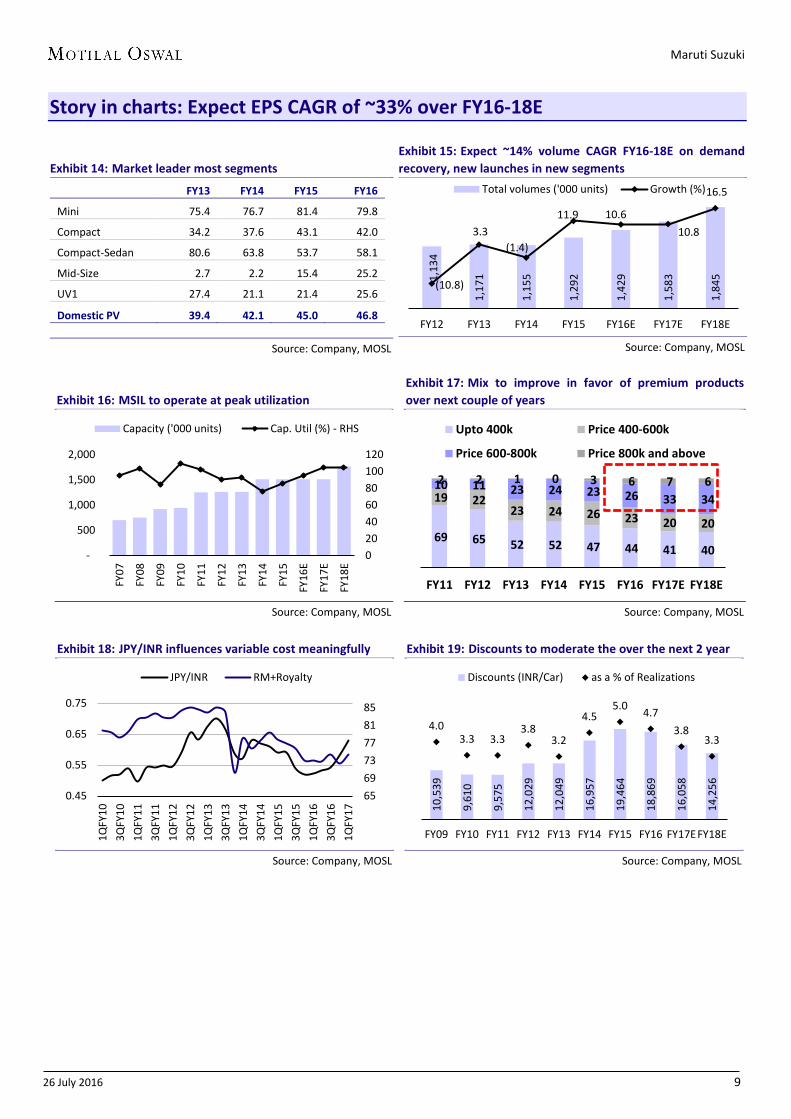
Story in charts: Expect EPS CAGR of ~33% over FY16-18E
Exhibit 14: Market leader most segments
FY13 FY14 FY15 FY16
Mini 75.4 76.7 81.4 79.8
Compact 34.2 37.6 43.1 42.0
Compact-Sedan 80.6 63.8 53.7 58.1
Mid-Size 2.7 2.2 15.4 25.2
UV1 27.4 21.1 21.4 25.6
Domestic PV 39.4 42.1 45.0 46.8
Source: Company, MOSL
Exhibit 15: Expect ~14% volume CAGR FY16-18E on demand recovery, new launches in new segments
Source: Company, MOSL
Exhibit 16: MSIL to operate at peak utilization
Source: Company, MOSL
Exhibit 17: Mix to improve in favor of premium products over next couple of years
Source: Company, MOSL
Exhibit 18: JPY/INR influences variable cost meaningfully
Source: Company, MOSL
Exhibit 19: Discounts to moderate the over the next 2 year
Source: Company, MOSL
1,13
4
1,17
1
1,15
5
1,29
2
1,42
9
1,58
3
1,84
5
(10.8)
3.3 (1.4)
11.9 10.6 10.8
16.5
FY12 FY13 FY14 FY15 FY16E FY17E FY18E
Total volumes ('000 units) Growth (%)
020406080100120
-
500
1,000
1,500
2,000
FY07
FY08
FY09
FY10
FY11
FY12
FY13
FY14
FY15
FY16
E
FY17
E
FY18
E
Capacity ('000 units) Cap. Util (%) - RHS
69 65 52 52 47 44 41 40
19 22 23 24 26 23 20 20
10 11 23 24 23 26 33 34 2 2 1 0 3 6 7 6
FY11 FY12 FY13 FY14 FY15 FY16 FY17E FY18E
Upto 400k Price 400-600k
Price 600-800k Price 800k and above
656973778185
0.45
0.55
0.65
0.75
1QFY
103Q
FY10
1QFY
113Q
FY11
1QFY
123Q
FY12
1QFY
133Q
FY13
1QFY
143Q
FY14
1QFY
153Q
FY15
1QFY
163Q
FY16
1QFY
17
JPY/INR RM+Royalty
10,5
39
9,61
0
9,57
5
12,0
29
12,0
49
16,9
57
19,4
64
18,8
69
16,0
58
14,2
56
4.0 3.3 3.3
3.8 3.2
4.5 5.0 4.7
3.8 3.3
FY09 FY10 FY11 FY12 FY13 FY14 FY15 FY16 FY17EFY18E
Discounts (INR/Car) as a % of Realizations
Maruti Suzuki
26 July 2016 10
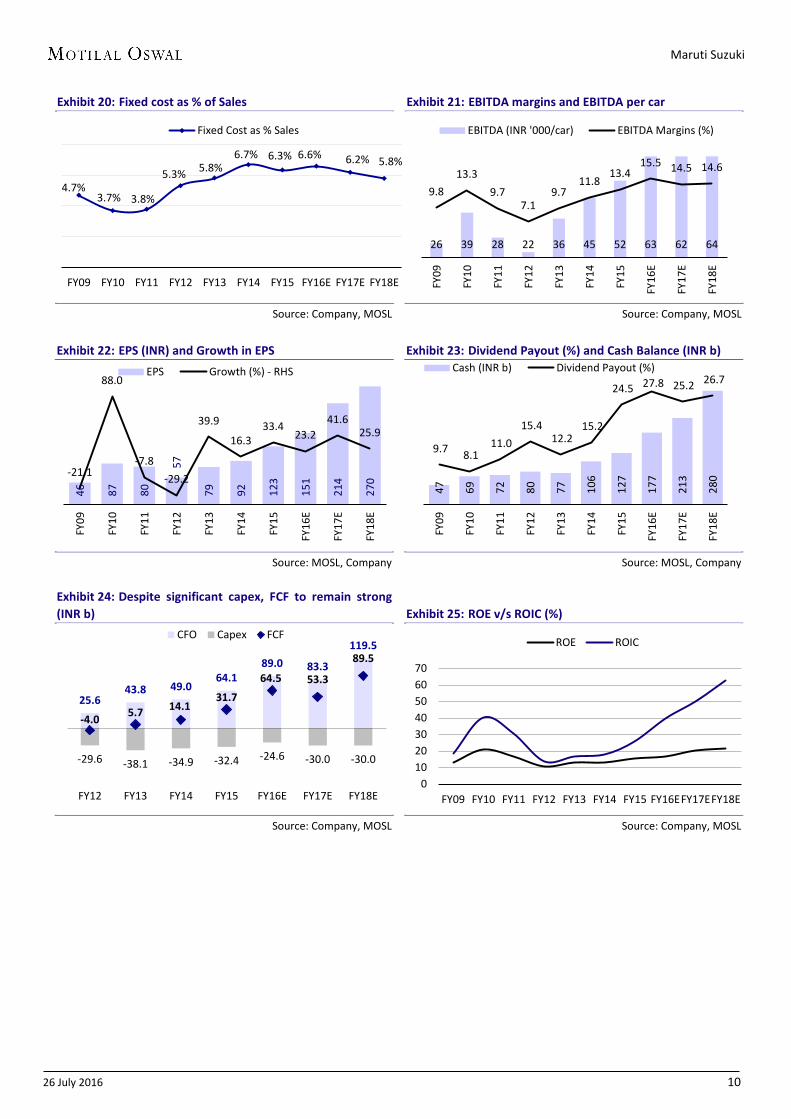
Exhibit 20: Fixed cost as % of Sales
Source: Company, MOSL
Exhibit 21: EBITDA margins and EBITDA per car
Source: Company, MOSL
Exhibit 22: EPS (INR) and Growth in EPS
Source: MOSL, Company
Exhibit 23: Dividend Payout (%) and Cash Balance (INR b)
Source: MOSL, Company
Exhibit 24: Despite significant capex, FCF to remain strong (INR b)
Source: Company, MOSL
Exhibit 25: ROE v/s ROIC (%)
Source: Company, MOSL
4.7% 3.7% 3.8%
5.3% 5.8% 6.7% 6.3% 6.6% 6.2% 5.8%
FY09 FY10 FY11 FY12 FY13 FY14 FY15 FY16E FY17E FY18E
Fixed Cost as % Sales
26 39 28 22 36 45 52 63 62 64
9.8 13.3
9.7 7.1
9.7 11.8
13.4 15.5 14.5 14.6
FY09
FY10
FY11
FY12
FY13
FY14
FY15
FY16
E
FY17
E
FY18
E
EBITDA (INR '000/car) EBITDA Margins (%)
46
87
80
57
79
92
123
151
214
270
-21.1
88.0
-7.8 -29.2
39.9
16.3 33.4
23.2 41.6
25.9
FY09
FY10
FY11
FY12
FY13
FY14
FY15
FY16
E
FY17
E
FY18
EEPS Growth (%) - RHS
47
69
72
80
77
106
127
177
213
280
9.7 8.1 11.0
15.4 12.2
15.2
24.5 27.8 25.2 26.7
FY09
FY10
FY11
FY12
FY13
FY14
FY15
FY16
E
FY17
E
FY18
E
Cash (INR b) Dividend Payout (%)
25.6 43.8 49.0
64.1 89.0 83.3
119.5
-29.6 -38.1 -34.9 -32.4 -24.6 -30.0 -30.0
-4.0 5.7 14.1 31.7
64.5 53.3
89.5
FY12 FY13 FY14 FY15 FY16E FY17E FY18E
CFO Capex FCF
010203040506070
FY09 FY10 FY11 FY12 FY13 FY14 FY15 FY16EFY17EFY18E
ROE ROIC
Maruti Suzuki
26 July 2016 11
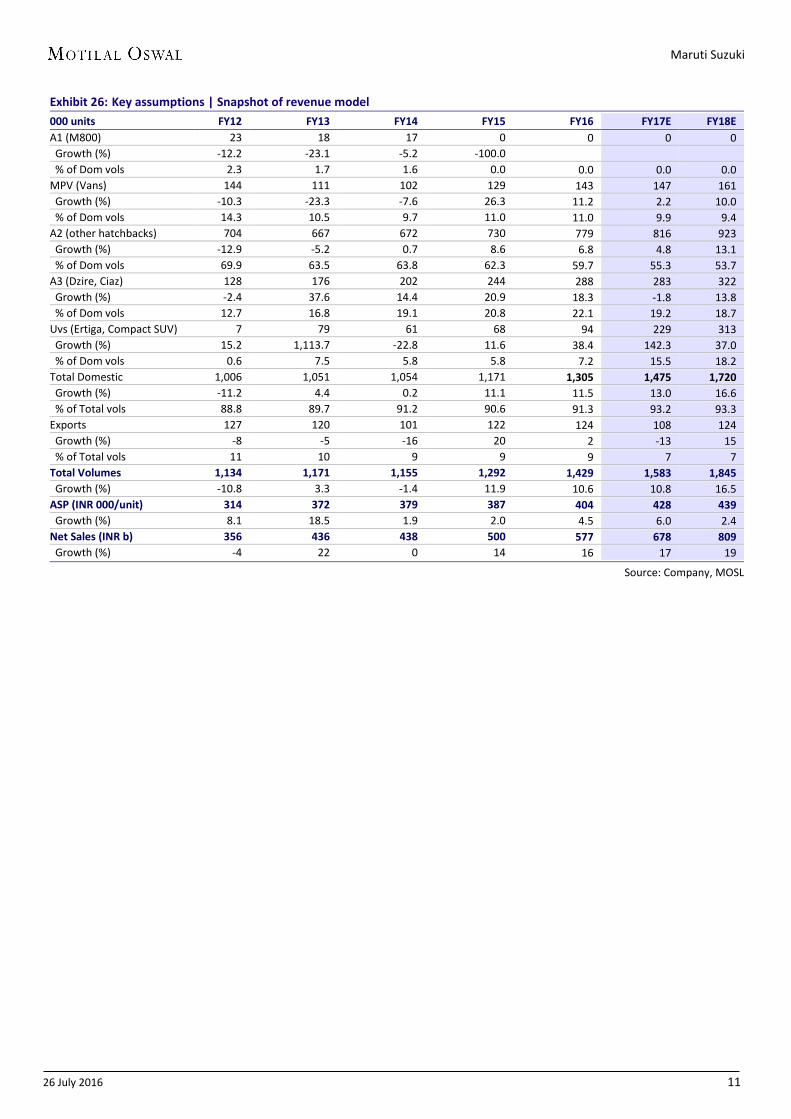
Exhibit 26: Key assumptions | Snapshot of revenue model
000 units FY12 FY13 FY14 FY15 FY16 FY17E FY18E A1 (M800) 23 18 17 0 0 0 0 Growth (%) -12.2 -23.1 -5.2 -100.0
% of Dom vols 2.3 1.7 1.6 0.0 0.0 0.0 0.0 MPV (Vans) 144 111 102 129 143 147 161 Growth (%) -10.3 -23.3 -7.6 26.3 11.2 2.2 10.0 % of Dom vols 14.3 10.5 9.7 11.0 11.0 9.9 9.4 A2 (other hatchbacks) 704 667 672 730 779 816 923 Growth (%) -12.9 -5.2 0.7 8.6 6.8 4.8 13.1 % of Dom vols 69.9 63.5 63.8 62.3 59.7 55.3 53.7 A3 (Dzire, Ciaz) 128 176 202 244 288 283 322 Growth (%) -2.4 37.6 14.4 20.9 18.3 -1.8 13.8 % of Dom vols 12.7 16.8 19.1 20.8 22.1 19.2 18.7 Uvs (Ertiga, Compact SUV) 7 79 61 68 94 229 313 Growth (%) 15.2 1,113.7 -22.8 11.6 38.4 142.3 37.0 % of Dom vols 0.6 7.5 5.8 5.8 7.2 15.5 18.2 Total Domestic 1,006 1,051 1,054 1,171 1,305 1,475 1,720 Growth (%) -11.2 4.4 0.2 11.1 11.5 13.0 16.6 % of Total vols 88.8 89.7 91.2 90.6 91.3 93.2 93.3 Exports 127 120 101 122 124 108 124 Growth (%) -8 -5 -16 20 2 -13 15 % of Total vols 11 10 9 9 9 7 7 Total Volumes 1,134 1,171 1,155 1,292 1,429 1,583 1,845 Growth (%) -10.8 3.3 -1.4 11.9 10.6 10.8 16.5 ASP (INR 000/unit) 314 372 379 387 404 428 439 Growth (%) 8.1 18.5 1.9 2.0 4.5 6.0 2.4 Net Sales (INR b) 356 436 438 500 577 678 809 Growth (%) -4 22 0 14 16 17 19
Source: Company, MOSL
Maruti Suzuki
26 July 2016 12
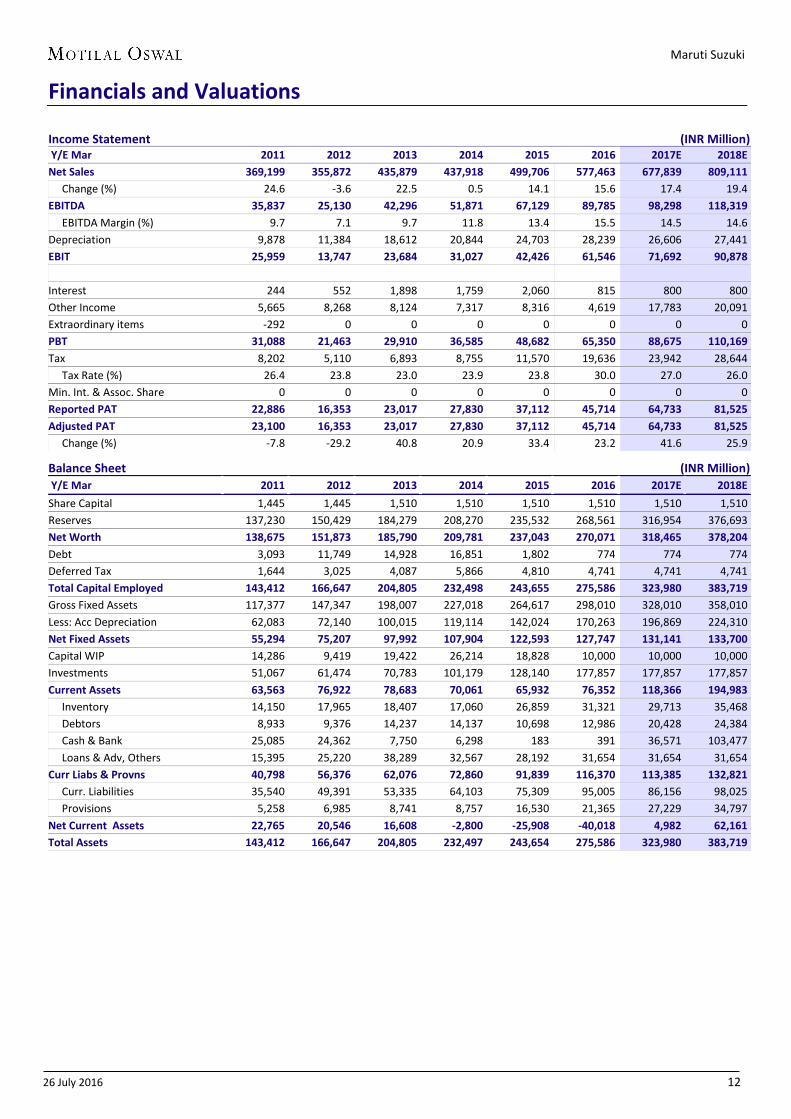
Financials and Valuations
Income Statement (INR Million) Y/E Mar 2011 2012 2013 2014 2015 2016 2017E 2018E Net Sales 369,199 355,872 435,879 437,918 499,706 577,463 677,839 809,111 Change (%) 24.6 -3.6 22.5 0.5 14.1 15.6 17.4 19.4 EBITDA 35,837 25,130 42,296 51,871 67,129 89,785 98,298 118,319 EBITDA Margin (%) 9.7 7.1 9.7 11.8 13.4 15.5 14.5 14.6 Depreciation 9,878 11,384 18,612 20,844 24,703 28,239 26,606 27,441 EBIT 25,959 13,747 23,684 31,027 42,426 61,546 71,692 90,878 Interest 244 552 1,898 1,759 2,060 815 800 800 Other Income 5,665 8,268 8,124 7,317 8,316 4,619 17,783 20,091 Extraordinary items -292 0 0 0 0 0 0 0 PBT 31,088 21,463 29,910 36,585 48,682 65,350 88,675 110,169 Tax 8,202 5,110 6,893 8,755 11,570 19,636 23,942 28,644 Tax Rate (%) 26.4 23.8 23.0 23.9 23.8 30.0 27.0 26.0 Min. Int. & Assoc. Share 0 0 0 0 0 0 0 0 Reported PAT 22,886 16,353 23,017 27,830 37,112 45,714 64,733 81,525 Adjusted PAT 23,100 16,353 23,017 27,830 37,112 45,714 64,733 81,525 Change (%) -7.8 -29.2 40.8 20.9 33.4 23.2 41.6 25.9
Balance Sheet (INR Million) Y/E Mar 2011 2012 2013 2014 2015 2016 2017E 2018E Share Capital 1,445 1,445 1,510 1,510 1,510 1,510 1,510 1,510 Reserves 137,230 150,429 184,279 208,270 235,532 268,561 316,954 376,693 Net Worth 138,675 151,873 185,790 209,781 237,043 270,071 318,465 378,204 Debt 3,093 11,749 14,928 16,851 1,802 774 774 774 Deferred Tax 1,644 3,025 4,087 5,866 4,810 4,741 4,741 4,741 Total Capital Employed 143,412 166,647 204,805 232,498 243,655 275,586 323,980 383,719 Gross Fixed Assets 117,377 147,347 198,007 227,018 264,617 298,010 328,010 358,010 Less: Acc Depreciation 62,083 72,140 100,015 119,114 142,024 170,263 196,869 224,310 Net Fixed Assets 55,294 75,207 97,992 107,904 122,593 127,747 131,141 133,700 Capital WIP 14,286 9,419 19,422 26,214 18,828 10,000 10,000 10,000 Investments 51,067 61,474 70,783 101,179 128,140 177,857 177,857 177,857 Current Assets 63,563 76,922 78,683 70,061 65,932 76,352 118,366 194,983 Inventory 14,150 17,965 18,407 17,060 26,859 31,321 29,713 35,468 Debtors 8,933 9,376 14,237 14,137 10,698 12,986 20,428 24,384 Cash & Bank 25,085 24,362 7,750 6,298 183 391 36,571 103,477 Loans & Adv, Others 15,395 25,220 38,289 32,567 28,192 31,654 31,654 31,654 Curr Liabs & Provns 40,798 56,376 62,076 72,860 91,839 116,370 113,385 132,821 Curr. Liabilities 35,540 49,391 53,335 64,103 75,309 95,005 86,156 98,025 Provisions 5,258 6,985 8,741 8,757 16,530 21,365 27,229 34,797 Net Current Assets 22,765 20,546 16,608 -2,800 -25,908 -40,018 4,982 62,161 Total Assets 143,412 166,647 204,805 232,497 243,654 275,586 323,980 383,719

Maruti Suzuki
26 July 2016 13
Financials and Valuations Ratios Y/E Mar 2011 2012 2013 2014 2015 2016 2017E 2018E Basic (INR) EPS 79.9 56.6 79.2 92.1 122.9 151.3 214.3 269.9 Consol EPS 82.4 58.2 81.7 94.4 126.0 155.5 219.5 275.5 Book Value 479.8 525.7 615.0 694.5 784.7 894.0 1054.2 1252.0 DPS 7.5 7.5 8.0 12.0 25.0 35.0 45.0 60.0 Payout (incl. Div. Tax.) 11.0 15.4 11.7 15.2 24.5 27.8 25.2 26.7 Valuation(x) Consol. P/E 54.4 77.1 54.9 47.5 35.6 28.8 20.4 16.3 Cash P/E 39.0 46.7 31.3 27.4 21.6 18.0 14.6 12.2 Price / Book Value 9.3 8.5 7.3 6.5 5.7 5.0 4.3 3.6 EV/Sales 3.4 3.5 3.0 3.0 2.5 2.1 1.7 1.4 EV/EBITDA 34.1 48.6 30.5 24.4 18.3 13.1 11.6 9.1 Dividend Yield (%) 0.2 0.2 0.2 0.3 0.6 0.8 1.0 1.3 Profitability Ratios (%) RoE 16.5 10.8 12.9 13.3 15.7 16.9 20.3 21.6 RoCE 22.1 13.2 15.5 16.5 20.8 24.0 27.6 28.9 ROIC 30.6 13.6 16.8 17.7 25.6 40.0 50.0 62.9 Turnover Ratios (%) Debtors (No. of Days) 8 9 11 11 7 7 10 10 Inventory (No. of Days) 15 20 17 16 23 23 19 19 Creditors (No. of Days) 45 64 60 75 78 89 68 65 Asset Turnover (x) 2.5 2.1 2.1 1.8 2.0 2.0 2.1 2.1
Cash Flow Statement (INR Million) Y/E Mar 2011 2012 2013 2014 2015 2016 2017E 2018E Adjusted EBITDA 35,837 25,130 42,296 51,871 67,129 89,785 98,298 118,319 Non cash opr. exp (inc) 3,555 4,232 4,990 5,048 7,230 4,619 17,783 20,091 (Inc)/Dec in Wkg. Cap. 1,503 2,265 4,229 7,562 8,356 14,319 -8,820 9,726 Tax Paid -9,888 -2,509 -5,333 -8,320 -10,407 -19,705 -23,942 -28,644 Other operating activities -2,812 -3,519 -3,171 -7,125 -8,202 0 0 0 CF from Op. Activity 28,194 25,599 43,011 49,036 64,106 89,017 83,319 119,492 (Inc)/Dec in FA & CWIP -21,427 -29,630 -37,318 -34,927 -32,386 -24,565 -30,000 -30,000 Free cash flows 6,767 -4,031 5,693 14,109 31,720 64,452 53,319 89,492 (Pur)/Sale of Invt 21,270 -7,818 -9,160 -25,893 -20,271 -49,717 0 0 Others 3,587 29,091 -3,482 10,991 2,058 0 0 0 CF from Inv. Activity 3,430 -8,358 -49,960 -49,829 -50,600 -74,282 -30,000 -30,000 Inc/(Dec) in Net Worth 0 0 0 0 0 24 0 0 Inc / (Dec) in Debt -5,123 9,109 -5,142 3,784 -13,282 -1,028 0 0 Interest Paid -314 -426 -2,003 -1,615 -2,098 -815 -800 -800 Divd Paid (incl Tax) & Others -2,084 -2,518 -2,518 -2,828 -4,241 -12,709 -16,340 -21,786 CF from Fin. Activity -7,521 6,165 -9,663 -659 -19,621 -14,528 -17,140 -22,586 Inc/(Dec) in Cash 24,103 23,407 -16,612 -1,452 -6,115 207 36,179 66,906 Add: Opening Balance 982 955 24,362 7,750 6,298 183 390 36,570 Closing Balance 25,085 24,362 7,750 6,298 183 390 36,570 103,476
Maruti Suzuki
26 July 2016 14
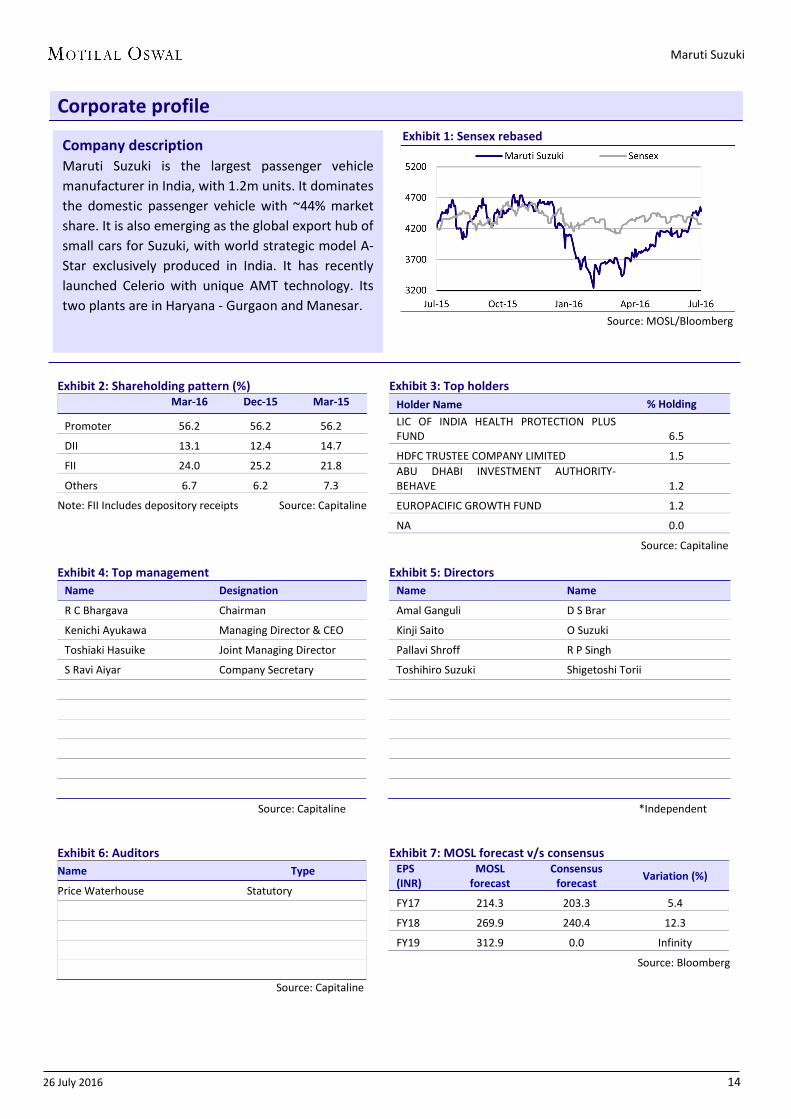
Corporate profile Exhibit 1: Sensex rebased
Source: MOSL/Bloomberg
Exhibit 2: Shareholding pattern (%)
Mar-16 Dec-15 Mar-15
Promoter 56.2 56.2 56.2
DII 13.1 12.4 14.7
FII 24.0 25.2 21.8
Others 6.7 6.2 7.3
Note: FII Includes depository receipts Source: Capitaline
Exhibit 3: Top holders Holder Name % Holding LIC OF INDIA HEALTH PROTECTION PLUS FUND 6.5
HDFC TRUSTEE COMPANY LIMITED 1.5 ABU DHABI INVESTMENT AUTHORITY-BEHAVE 1.2
EUROPACIFIC GROWTH FUND 1.2
NA 0.0
Source: Capitaline Exhibit 4: Top management
Name Designation
R C Bhargava Chairman
Kenichi Ayukawa Managing Director & CEO
Toshiaki Hasuike Joint Managing Director
S Ravi Aiyar Company Secretary
Source: Capitaline
Exhibit 5: Directors Name Name
Amal Ganguli D S Brar
Kinji Saito O Suzuki
Pallavi Shroff R P Singh
Toshihiro Suzuki Shigetoshi Torii
*Independent
Exhibit 6: Auditors Name Type
Price Waterhouse Statutory
Source: Capitaline
Exhibit 7: MOSL forecast v/s consensus EPS (INR)
MOSL forecast
Consensus forecast Variation (%)
FY17 214.3 203.3 5.4
FY18 269.9 240.4 12.3
FY19 312.9 0.0 Infinity
Source: Bloomberg
Company description Maruti Suzuki is the largest passenger vehicle manufacturer in India, with 1.2m units. It dominates the domestic passenger vehicle with ~44% market share. It is also emerging as the global export hub of small cars for Suzuki, with world strategic model A-Star exclusively produced in India. It has recently launched Celerio with unique AMT technology. Its two plants are in Haryana - Gurgaon and Manesar.
Our recent reports on Maruti Suzuki
Our recent reports on Automobiles Sector
Our recent reports on other Automobiles companies
PRODUCT GALLERY

Maruti Suzuki
26 July 2016 16
Disclosures
This document has been prepared by Motilal Oswal Securities Limited (hereinafter referred to as Most) to provide information about the company (ies) and/sector(s), if any, covered in the report and may be distributed by it and/or its affiliated company(ies). This report is for personal information of the selected recipient/s and does not construe to be any investment, legal or taxation advice to you. This research report does not constitute an offer, invitation or inducement to invest in securities or other investments and Motilal Oswal Securities Limited (hereinafter referred as MOSt) is not soliciting any action based upon it. This report is not for public distribution and has been furnished to you solely for your general information and should not be reproduced or redistributed to any other person in any form. This report does not constitute a personal recommendation or take into account the particular investment objectives, financial situations, or needs of individual clients. Before acting on any advice or recommendation in this material, investors should consider whether it is suitable for their particular circumstances and, if necessary, seek professional advice. The price and value of the investments referred to in this material and the income from them may go down as well as up, and investors may realize losses on any investments. Past performance is not a guide for future performance, future returns are not guaranteed and a loss of original capital may occur. MOSt and its affiliates are a full-service, integrated investment banking, investment management, brokerage and financing group. We and our affiliates have investment banking and other business relationships with a some companies covered by our Research Department. Our research professionals may provide input into our investment banking and other business selection processes. Investors should assume that MOSt and/or its affiliates are seeking or will seek investment banking or other business from the company or companies that are the subject of this material and that the research professionals who were involved in preparing this material may educate investors on investments in such business . The research professionals responsible for the preparation of this document may interact with trading desk personnel, sales personnel and other parties for the purpose of gathering, applying and interpreting information. Our research professionals are paid on twin parameters of performance & profitability of MOSt. MOSt generally prohibits its analysts, persons reporting to analysts, and members of their households from maintaining a financial interest in the securities or derivatives of any companies that the analysts cover. Additionally, MOSt generally prohibits its analysts and persons reporting to analysts from serving as an officer, director, or advisory board member of any companies that the analysts cover. Our salespeople, traders, and other professionals or affiliates may provide oral or written market commentary or trading strategies to our clients that reflect opinions that are contrary to the opinions expressed herein, and our proprietary trading and investing businesses may make investment decisions that are inconsistent with the recommendations expressed herein. In reviewing these materials, you should be aware that any or all of the foregoing among other things, may give rise to real or potential conflicts of interest. MOSt and its affiliated company(ies), their directors and employees and their relatives may; (a) from time to time, have a long or short position in, act as principal in, and buy or sell the securities or derivatives thereof of companies mentioned herein. (b) be engaged in any other transaction involving such securities and earn brokerage or other compensation or act as a market maker in the financial instruments of the company(ies) discussed herein or act as an advisor or lender/borrower to such company(ies) or may have any other potential conflict of interests with respect to any recommendation and other related information and opinions.; however the same shall have no bearing whatsoever on the specific recommendations made by the analyst(s), as the recommendations made by the analyst(s) are completely independent of the views of the affiliates of MOSt even though there might exist an inherent conflict of interest in some of the stocks mentioned in the research report Reports based on technical and derivative analysis center on studying charts company's price movement, outstanding positions and trading volume, as opposed to focusing on a company's fundamentals and, as such, may not match with a report on a company's fundamental analysis. In addition MOST has different business segments / Divisions with independent research separated by Chinese walls catering to different set of customers having various objectives, risk profiles, investment horizon, etc, and therefore may at times have different contrary views on stocks sectors and markets. Unauthorized disclosure, use, dissemination or copying (either whole or partial) of this information, is prohibited. The person accessing this information specifically agrees to exempt MOSt or any of its affiliates or employees from, any and all responsibility/liability arising from such misuse and agrees not to hold MOSt or any of its affiliates or employees responsible for any such misuse and further agrees to hold MOSt or any of its affiliates or employees free and harmless from all losses, costs, damages, expenses that may be suffered by the person accessing this information due to any errors and delays. The information contained herein is based on publicly available data or other sources believed to be reliable. Any statements contained in this report attributed to a third party represent MOSt’s interpretation of the data, information and/or opinions provided by that third party either publicly or through a subscription service, and such use and interpretation have not been reviewed by the third party. This Report is not intended to be a complete statement or summary of the securities, markets or developments referred to in the document. While we would endeavor to update the information herein on reasonable basis, MOSt and/or its affiliates are under no obligation to update the information. Also there may be regulatory, compliance, or other reasons that may prevent MOSt and/or its affiliates from doing so. MOSt or any of its affiliates or employees shall not be in any way responsible and liable for any loss or damage that may arise to any person from any inadvertent error in the information contained in this report. MOSt or any of its affiliates or employees do not provide, at any time, any express or implied warranty of any kind, regarding any matter pertaining to this report, including without limitation the implied warranties of merchantability, fitness for a particular purpose, and non-infringement. The recipients of this report should rely on their own investigations. This report is intended for distribution to institutional investors. Recipients who are not institutional investors should seek advice of their independent financial advisor prior to taking any investment decision based on this report or for any necessary explanation of its contents. Most and it’s associates may have managed or co-managed public offering of securities, may have received compensation for investment banking or merchant banking or brokerage services, may have received any compensation for products or services other than investment banking or merchant banking or brokerage services from the subject company in the past 12 months. Most and it’s associates have not received any compensation or other benefits from the subject company or third party in connection with the research report. Subject Company may have been a client of Most or its associates during twelve months preceding the date of distribution of the research report MOSt and/or its affiliates and/or employees may have interests/positions, financial or otherwise of over 1 % at the end of the month immediately preceding the date of publication of the research in the securities mentioned in this report. To enhance transparency, MOSt has incorporated a Disclosure of Interest Statement in this document. This should, however, not be treated as endorsement of the views expressed in the report. Motilal Oswal Securities Limited is registered as a Research Analyst under SEBI (Research Analyst) Regulations, 2014. SEBI Reg. No. INH000000412 Pending Regulatory inspections against Motilal Oswal Securities Limited: SEBI pursuant to a complaint from client Shri C.R. Mohanraj alleging unauthorized trading, issued a letter dated 29th April 2014 to MOSL notifying appointment of an Adjudicating Officer as per SEBI regulations to hold inquiry and adjudge violation of SEBI Regulations; MOSL replied to the Show Cause Notice whereby SEBI granted us an opportunity of Inspection of Documents. Since all the documents requested by us were not covered we have requested to SEBI vide our letter dated June 23, 2015 to provide pending list of documents for inspection. List of associate companies of Motilal Oswal Securities Limited -Click here to access detailed report Analyst Certification The views expressed in this research report accurately reflect the personal views of the analyst(s) about the subject securities or issues, and no part of the compensation of the research analyst(s) was, is, or will be directly or indirectly related to the specific recommendations and views expressed by research analyst(s) in this report. The research analysts, strategists, or research associates principally responsible for preparation of MOSt research receive compensation based upon various factors, including quality of research, investor client feedback, stock picking, competitive factors and firm revenues Disclosure of Interest Statement MARUTI SUZUKI INDIA Analyst ownership of the stock No Served as an officer, director or employee - No A graph of daily closing prices of securities is available at www.nseindia.com and http://economictimes.indiatimes.com/markets/stocks/stock-quotes Regional Disclosures (outside India) This report is not directed or intended for distribution to or use by any person or entity resident in a state, country or any jurisdiction, where such distribution, publication, availability or use would be contrary to law, regulation or which would subject MOSt & its group companies to registration or licensing requirements within such jurisdictions. For Hong Kong: This report is distributed in Hong Kong by Motilal Oswal capital Markets (Hong Kong) Private Limited, a licensed corporation (CE AYY-301) licensed and regulated by the Hong Kong Securities and Futures Commission (SFC) pursuant to the Securities and Futures Ordinance (Chapter 571 of the Laws of Hong Kong) “SFO”. As per SEBI (Research Analyst Regulations) 2014 Motilal Oswal Securities (SEBI Reg No. INH000000412) has an agreement with Motilal Oswal capital Markets (Hong Kong) Private Limited for distribution of research report in Kong Kong. This report is intended for distribution only to “Professional Investors” as defined in Part I of Schedule 1 to SFO. Any investment or investment activity to which this document relates is only available to professional investor and will be engaged only with professional investors.” Nothing here is an offer or solicitation of these securities, products and services in any jurisdiction where their offer or sale is not qualified or exempt from registration. The Indian Analyst(s) who compile this report is/are not located in Hong Kong & are not conducting Research Analysis in Hong Kong. For U.S. Motilal Oswal Securities Limited (MOSL) is not a registered broker - dealer under the U.S. Securities Exchange Act of 1934, as amended (the"1934 act") and under applicable state laws in the United States. In addition MOSL is not a registered investment adviser under the U.S. Investment Advisers Act of 1940, as amended (the "Advisers Act" and together with the 1934 Act, the "Acts), and under applicable state laws in the United States. Accordingly, in the absence of specific exemption under the Acts, any brokerage and investment services provided by MOSL, including the products and services described herein are not available to or intended for U.S. persons. This report is intended for distribution only to "Major Institutional Investors" as defined by Rule 15a-6(b)(4) of the Exchange Act and interpretations thereof by SEC (henceforth referred to as "major institutional investors"). This document must not be acted on or relied on by persons who are not major institutional investors. Any investment or investment activity to which this document relates is only available to major institutional investors and will be engaged in only with major institutional investors. In reliance on the exemption from registration provided by Rule 15a-6 of the U.S. Securities Exchange Act of 1934, as amended (the "Exchange Act") and interpretations thereof by the U.S. Securities and Exchange Commission ("SEC") in order to conduct business with Institutional Investors based in the U.S., MOSL has entered into a chaperoning agreement with a U.S. registered broker-dealer, Motilal Oswal Securities International Private Limited. ("MOSIPL"). Any business interaction pursuant to this report will have to be executed within the provisions of this chaperoning agreement. The Research Analysts contributing to the report may not be registered /qualified as research analyst with FINRA. Such research analyst may not be associated persons of the U.S. registered broker-dealer, MOSIPL, and therefore, may not be subject to NASD rule 2711 and NYSE Rule 472 restrictions on communication with a subject company, public appearances and trading securities held by a research analyst account. For Singapore Motilal Oswal Capital Markets Singapore Pte Limited is acting as an exempt financial advisor under section 23(1)(f) of the Financial Advisers Act(FAA) read with regulation 17(1)(d) of the Financial Advisors Regulations and is a subsidiary of Motilal Oswal Securities Limited in India. This research is distributed in Singapore by Motilal Oswal Capital Markets Singapore Pte Limited and it is only directed in Singapore to accredited investors, as defined in the Financial Advisers Regulations and the Securities and Futures Act (Chapter 289), as amended from time to time. In respect of any matter arising from or in connection with the research you could contact the following representatives of Motilal Oswal Capital Markets Singapore Pte Limited: Varun Kumar Kadambari Balachandran [email protected] [email protected] Contact : (+65) 68189232 (+65) 68189233 / 65249115 Office Address:21 (Suite 31),16 Collyer Quay,Singapore 04931
Motilal Oswal Securities Ltd
Motilal Oswal Tower, Level 9, Sayani Road, Prabhadevi, Mumbai 400 025 Phone: +91 22 3982 5500 E-mail: [email protected]