Embed Size (px)
Citation preview

CLONING AND EXPRESSION OF A BIOSIMILAR CHIMERIC MONOCLONAL ANTIBODY DIRECTED AGAINST THE HUMAN EPIDERMAL GROWTH FACTOR RECEPTOR AND ITS PRODUCTION IN CHO CELLS FOR TREATMENT OF COLO-RECTAL CANCER
A THESIS SUBMITTED TO
THE MAHARAJA SAYAJIRAO UNIVERSITY OF BARODA
FOR THE DEGREE OF
DOCTOR OF PHILOSOPHY
IN
MICROBIOLOGY
BY
HATIM MAQBULHUSEN MOTIWALA
DEPARTMENT OF MICROBIOLOGY AND BIOTECHNOLOGY CENTRE FACULTY OF SCIENCE
THE MAHARAJA SAYAJIRAO UNIVERSITY OF BARODA VADODARA-390002, GUJARAT, INDIA
MARCH 2012

Dedicated to my loving parents

TABLE OF CONTENT Acknowledgement ....................................................................................................................... I LIST OF ABBREVIATIONS ................................................................................................... III LIST OF SYMBOLS ............................................................................................................. VIII LIST OF FIGURES .................................................................................................................. IX LIST OF TABLES ................................................................................................................. XIII CHAPTER 1 ............................................................................................................................... 1 INTRODUCTION ...................................................................................................................... 1 1.1. Overview of Biosimilars .............................................................................................. 2 1.2. Biologics versus Small-molecule drugs ....................................................................... 7 1.3. Production Platforms ................................................................................................. 10 1.3.1. NS0 and SP2/0 Cell Lines ......................................................................................... 12 1.3.2. CHO Cells................................................................................................................. 16 1.3.3. Cell Lines to look in future ........................................................................................ 19 1.4. Clone Selection Approach ......................................................................................... 20 1.5. Antibody Structure and Function ............................................................................... 22 1.5.1. Structural Characteristics ........................................................................................... 22 1.5.2. Biological Function of antibody ................................................................................ 24 1.6. Therapeuic Monoclonal Antibody ............................................................................. 25 1.6.1. Structural Characteristics and Classification .............................................................. 25 1.6.2. Biological Function ................................................................................................... 31 1.7. Epidermal Growth Factor Receptor Biology .............................................................. 39 1.8. Cetuximab: An Anti-EGFR Monoclonal Antibody .................................................... 43 1.9. Objectives ................................................................................................................. 47 1.10. Work Plan ................................................................................................................. 48 CHAPTER 2 ............................................................................................................................. 49 MATERIAL AND METHODS ................................................................................................. 49 2.1. Materials ................................................................................................................... 50 2.1.1. Chemicals and Reagents ............................................................................................ 50 2.1.2. Markers and Enzymes ............................................................................................... 51 2.1.3. Antibodies ................................................................................................................. 53 2.1.4. Reference Medicinal Product ..................................................................................... 53 2.1.5. Commercial Kits ....................................................................................................... 53 2.1.6. Primers ..................................................................................................................... 54 2.1.7. Vectors, Cells and Cell Lines..................................................................................... 54 2.1.8. Media and Supplements ............................................................................................ 55 2.1.9. Consumables ............................................................................................................. 55 2.1.10. Equipments ............................................................................................................... 56 2.1.11. Softwares: ................................................................................................................. 57 2.2. Buffers and Media Preparation .................................................................................. 57 2.2.1. Competent Cell Preparation ....................................................................................... 57 2.2.2. Glycerol Bank preparation ......................................................................................... 58 2.2.3. Bacteriological Media ............................................................................................... 58 2.2.4. Cell Culture Media .................................................................................................... 58 2.2.5. Electrophoresis Buffers & Reagents .......................................................................... 59 2.2.6. Protein A Purification ................................................................................................ 66 2.2.7. Protein A HPLC ........................................................................................................ 66 2.2.8. Cation Exchange Chromatography ............................................................................ 67 2.2.9. Reverse Phase Liquid Chromatography ..................................................................... 67 2.2.10. Size Exclusion Chromatography ................................................................................ 67 2.2.11. In-vitro Bioassay ....................................................................................................... 68 2.3. Methods .................................................................................................................... 69 2.3.1. RE Digestion ............................................................................................................. 69 2.3.2. Ligation Reaction: ..................................................................................................... 69 2.3.3. Gradient PCR: ........................................................................................................... 69 2.3.4. Plasmid and Genomic DNApreparation protocols were followed based onthe kit
manual. ..................................................................................................................... 70 2.3.5. Competent cell Preparation E.coli DH5α ................................................................... 70 2.3.6. Transformation of E.coli DH5α by Heat & shock Method.......................................... 70

2.3.7. Cell Culture Methods ................................................................................................ 70 2.3.8. Serum Free Adaptation of selected clones .................................................................. 73 2.3.9. Evaluation of clones .................................................................................................. 73 2.3.10. Upstream Process Development ................................................................................ 74 2.3.11. Analytical Methods ................................................................................................... 76 CHAPTER 3 ............................................................................................................................. 91 CLONING AND EXPRESSION OF BIOSIMILAR ANTI-EGFR ANTIBODY IN ALTERNATE HOST ................................................................................................................ 91 3.1. Recombinant Vector Construction ............................................................................. 92 3.1.1. Preamble: .................................................................................................................. 92 3.1.2. Results and Discussion .............................................................................................. 93 3.1.3. Conclusion: ............................................................................................................. 106 3.2. Cell Line Development............................................................................................ 107 3.2.1. Preamble ................................................................................................................. 107 3.2.2. Results and Discussion ............................................................................................ 118 3.3. Summary: ............................................................................................................... 141 3.4. Conclusion: ............................................................................................................. 143 CHAPTER 4: .......................................................................................................................... 144 A) SELECTION OF THE LEAD CLONE BASED ON PRODUCTIVITY AND QUALITY ATTRIBUTES....................................................................................... 144 B) ESTABLISHMENT OF PLATFORM EVALUATION METHODS FOR SCREENING OF RECOMBINANT CLONES EXPRESSING ANTI-EGFR MONOCLONAL ANTIBODY ................................................................................ 144 4.1. Preamble ................................................................................................................. 145 4.2. Results and Discussion ............................................................................................ 149 4.2.1. Purification of target protein .................................................................................... 149 4.2.2. Identity of product ................................................................................................... 152 4.2.3. Purity and Quality of Expressed mAb ...................................................................... 154 4.3. Conclusion .............................................................................................................. 164 CHAPTER 5 ........................................................................................................................... 166 UPSTREAM PROCESS DEVELOPMENT FOR IMPROVING EXPRESSION OF RECOMBINANT ANTI-EGFR MONOCLONAL ANTIBODY IN SHAKE FLASK ............. 166 5.1. Preamble ................................................................................................................. 167 5.2. Results and Discussion ............................................................................................ 172 5.3. Conclusion .............................................................................................................. 180 CHAPTER 6 ........................................................................................................................... 181 CHARACTERIZATION OF THE EXPRESSED RECOMBINANT ANTI-EGFR MONOCLONAL ANTIBODY ............................................................................................... 181 6.1. Preamble ................................................................................................................. 182 6.1.1 Aggregation and Degradation of Protein .................................................................. 185 6.1.2 Heterogeneity of Monoclonal Antibodies ................................................................ 187 6.2. Results and Disussions ............................................................................................ 197 6.2.1. Determination of aggregates and degradants (clips) by Size Exclusion-HPLC .......... 197 6.2.2. Characterizing the charged forms observed on CEX-HPLC ..................................... 199 6.2.3. Determination of N-terminal amino acid sequence by Edman Degradation Method . 201 6.2.4. Analysis of expressed product by LC-MS/MS ......................................................... 202 6.3. Conclusion .............................................................................................................. 210 CHAPTER 7 ........................................................................................................................... 212 SUMMARY ........................................................................................................................... 212 CHAPTER 8 ........................................................................................................................... 216 BIBLIOGRAPHY ................................................................................................................... 216 PUBLICATIONS ................................................................................................................... 234

I
Acknowledgement I am fortunate to express my gratitude to each and every being who has helped me in achieving my most important milestone of professional life. To start with the maker of this world, Lord Almighty, the most gracious and merciful who has showered me with all the blessings, patience, motivation, devotion and everything that has facilitated my journey crossing every hurdle in life to reach at this stage and showering me with the most wonderful and precious blessing, my loving PARENTS. Without their unconditional love and support I would have been nowhere. The simplicity and never-say-die attitude inculcated in me by them made the difference and has allowed me to climb this mountain. My most sincere thanks to Dr. Urmish Chudgar, Managing Director-Intas Biopharmaceuticals Limited for providing opportunity to the employees for continuing education. Sir, without your vision, zeal for science and helping nature, this task was not possible. A huge thanks from my heart to you, Sir. I am honored to have Dr. Rustom Mody as my Guide and mentor who has helped me in executing this mammoth task. Sincere thanks for identifying my potential and providing opportunity, for which my words alone cannot do justice. The vast knowledge you possess and optimism you share under all circumstances is commendable. It was a great learning experience both professionally and personally for which you will always remain as my most cherished ‘guide and teacher’. My sincere thanks to Dr. Brajesh Varshney who has always guided, motivated and provided opportunity to me for pursuing and achieving this task. Your faith in me was encouraging for which I owe a big thanks to you ‘teacher’. The support by Dr. Dhananjay Patankar, Dr. Kashmira Pagdiwalla, Mr. Sanjay Nagrath and Dr. Subir Basak was precious. I am thankful for the support from Dr. Himanshu Gadgil, which has pushed me to reach the finishing line. I am really grateful to Dr. Archana Gayatri for taking me through this phase and critically reviewing my thesis for which I would be thankful forever. I am obliged and very thankful to Prof. Anjana Desai for keeping faith in me and providing me opportunity for Ph.D. My sincere gratitude to Prof. T. Bagchi (Head-Department of Microbiology), whose timely help allowed me to reach the finishing line. I would take this opportunity to thank all of my teachers from schooldays to post-graduation to whom I will be indebted throughout my life. The teachings has helped me gain success and true-values of life.

II
LIFE at Intas has been the most happening and cherished moments in my life and it would never have been so interesting without the fabulous support of all Intasians and especially my lab mates. A big thank you to Sudhrati Gupta for helping me professionally and personally in achieving this milestone. The support and encouragement from Dr. Harish Shandilya was unconditional, for which I would be very thankful to him. I would like to thank all my lab mates, Sanjeev Gupta, Ranjeeta Lunawat, Shailendra Gaur, Ravin Mehta, Tamanna Shah and Preeti Rastogi. A special thanks to Sona Jain and Viral Shah who has helped me in executing experiments. I am grateful to Dr. Anita Krishnan, Uttara Saptarshi, Vinod Kumar, Bhawna Sharma and their group for all the analytical support. I would also like to express my thanks to all the departments of R&D, Quality Control, Library and IPM at IBPL. Without the help of TEAM INTAS as a whole my task would not have been accomplished. Thanks are due to all staff members at the Department of Microbiology and a special mention for Shirish Bhai, Kenneth Bhai, Nair Bhai and Nishikant Bhai who have extended their help to me in all the administrative activities. I am grateful to my friends and batchmates. A special thanks to Rajesh Sudhakaran without whom it was difficult for me to settle in Ahmedabad. Acknowledgement would not be enough for this one very dear friend of mine who stood by me always since my B.Sc. days. Thanks a zillion Geoby for being my friend and providing continuous encouragement without which I would have not even completed my post-graduation. I am glad to have the love and encouragement from Jean, Austin and Annette. A special thank you to my loving sisters, Zehra and Umm-E-Farwah who are always there under all circumstances. Sincere thanks to my brothers-in-law Parvezali and Mohammadi. I am thankful to my son Yaaseen, nephews Taherali and Ayaaz, and nieces Nafeea and Faatehmah for making life fun filled. I am grateful to my in-laws for extended support and timely help. The heavenly blessings from my paternal grandparents are always with me. I am most priviledged to receive encouragement and blessings from my maternal grandparents. Thanks a lot to all my relatives. I am thankful from the bottom of my heart to my beloved wife Zinobiya for sharing life during happiness, sorrow and for our sweetheart kid Yaaseen. I appreciate your support and motivation. Thanks for being there in my life.
-Sincerely, Hatim

III
LIST OF ABBREVIATIONS
3D Three Dimensional Ab Antibody A CN Acetonitrile ADCC Antibody-dependent Cellular Cytotoxicity ADCP Antibody-dependent Cellular Phagocytosis Ala Alanine APRT Adenine Phosphoribosyl transferase APS Ammnium Per Sulfate Asn Asparagine Asp Aspartic Acid ATCC American Type Culture Collection ATP Adenosine Triphosphate B-Cells Bursa of Fabricus Cell BGH Bovine Growth Hormone BHK cells Baby Hamster Kidney cells BLA Biologics License Application Bp Base pair BSA Bovine Serum Albumin CaCl2 Calcium Chloride Cat # Catalogue Number CD Chemically defined CDC Complement-dependent Cytotoxicity CDR Complementarity Determining Regions CE Capillary Electrophoresis CEX Cation Exchange cGMP current-Good Manufacturing Practice CHO Chinese Hamster Ovary cells CMV Cytomegalo Virus
CO2 Carbon Dioxide Conc Concentration Corr Corrected CpB Carboxypeptidase B CQA Critical Quality Attribute CSI Clone Select Image Software C-terminal Carboxy Terminal End of Protein CTP Cytosine triphosphate CV column volume CZE Capillary Zone Electrophoresis Da Daltons DHFR Dihydro folate reductase

IV
DMEM Dulbecco's Modified Eagle's Media DMSO Dimethyl sulfoxide DNA Deoxyribonucleic acid DTT Dithiothretol ECACC European Collection of Cell Culture EDTA Ethylenediamine Tetra Acetic Acid
E_18 Project code given internally during cell line development work
EGF Epidermal Growth Factor EGFR Epidermal Growth Factor Receptor ELISA Enzyme Linked Immunosorbent Assay EMEA European Medicines Agency EPO Erythropoeitin ERAD Endoplasmic Reticulum Associated Degradation ESI Electron Spray Ionization Fab Fragment , antigen binding FACS Fluorescent Activated Cell Sorter FBS Fetal Bovine Serum Fc Fragment, crystalizable FcR Fc receptors FDA Food and Drug Administration Fg femtogram FITC Fluorescein Isothiocyanate Fuc Fucose Fv Fragment Variable Fv Fragment, variable G0F Glycan with no galactose but with fucose G1F Glycan with one galactose and fucose G2 Glycan with two galactose Gal Galactose GFP Green Fluorescent Protein GlcNAc N-acetylGlucoseamine Gly Glycine GS Glutamine synthetase GTP Guanosine triphosphate HAMA Human Anti-mouse antibody HAT Hypoxanthine-adenine thymidine HC / H1 Heavy Chain of anti-EGFR chain HCl Hydrochloric Acid HCP Host Cell Protein HEK cells Human Embryonic Kidney cells HER Human Epidermal Growth Factor Receptor HGPRT Hypoxanthine-guanine phosphoribosyl transferase HIV Human Immunodeficiency Virus

V
HPLC High Performance Liquid Chromatography HRP Horse Raddish Peroxidase HT Hypoxanthine Thymidine ICH International Conference on Harmonization IEF Iso-electric focusing IgG Immunoglobin G IL Interleukin IPA Iso Propyl Acohol IVCC/IVCD Integral Viable Cell Count or Density Kb Kilo base pair L Liter LB Luria-Bertanii LC / L1 Light Chain of anti-EGFR Mab
LC-MS/MS Liquid Chromatography Mass Spectromety2 LD Limiting Dilution Lys Lysine LysC Endoproteinase C mAb Monoclonal Antibody MALDI Matrix-assisted Laser Desorption/ionization Man Mannose MAPK Mitogen Activated Protein Kinase MCB Master Cell Bank MCS Multiple Cloning Site MCT Micro Centrifuge Tube MEM Minimal Essential Media (Earle's) MES 2-(N-morpholino)ethanesulfonic acid Met Methionine Mfg. Manufacturer Mg Milligram MilliQ water Deionized water generated from MilliPore system Min Minutes MOA Mechanism of Action MS Mass Spectrometry MSX Methionine Sulfoxamine MTX Methotrexate mV milli volts NA Not Applicable Na2S04 Sodium Sulfate NANA N-acetylneuramic acid NDA New Drug Application NeuAc N-acetylneuraminic acid (Sialic acid) NGNA N-glycolylneuramic Acid NK cells Natural Killer Cells

VI
NSCLC Non-small Cell Lung Cancer N-terminal Amino Terminal End of protein OD Optical Density OPD o-phenylenediamine PA Protein-A PAGE Polyacrylamide gel electrophoresis PBS Phosphate Buffered Saline PCB Primary Cell Bank Pcd picogram / cell / day PCR Polymerase chain Reaction PER C6 Human Retinal cells Pfu Pyrococcus furiosus PITC Phenyl Isothiocyanate PLA Parallel Line Assay PNGase F Peptide: N-Glycosidase F PQA Product Quality Attribute PTH Phenyl Thiohydantoin PTM Post Translational Modification PVDF Polyvinylidene fluoride QA Quality Attribute qP Specific Productivity R&D Research and Development RBC Red Blood Cell RCB Research Cell Bank RE Restriction Enzymes RMP Reference Medicinal Product RNA Ribonucleic Acid RNAi Interferring Ribonucleic Acid RP Reverse Phase RPMI Media Rosewell Park Memorial Institure Media RSD Relative Standard Deviation Rt Retention Time RT Room Temperature
S8 Project code give during cell line development and further
SEB Subsequent Entry Biologics SD Standard Deviation SDS Sodium Dodecyl Sulfate SEC Size Exclusion Chromatography SF Shake Flask siRNA small interferring Ribonucleic Acid SP2/0 Myeloma Cell Line Std Standard SV40 Simiam Vacuolating Virus 40

VII
SY Soyatone Yeast Extract TAE Tris-acetate EDTA Taq Thermus aquaticus TBS Tris Buffered Saline TBST Tris Buffered Saline with Tween 20 TC Tissue Culture TCA Trichloro Acetic Acid TCF Tissue Culture Flask TEMED N,N,N',N'-Tetramethylethylenediamine Temp Temperature TGF Transforming Growth Factor Thr Threonine TK Tyrosine Kinase TMB 3, 3',5,5'-Tetramethylbenzidine TNF Tumor Necrosis Factor Tof Time-of-flight tPA Tissue Plasminogen Activator TTP Thymidine triphosphate UPS Ubiquitine Proteosome System US-FDA United States - Food and Drug Administration UV Ultra violet VCC / VCD Viable Cell Count / Density WB Western Blot WCB Working Cell Bank WCX Weak Cation Excahnge WFI Water For Injection XGPRT Xanthine-guanine phosphoribosyl transferase

VIII
LIST OF SYMBOLS
µg Microgram
µL Micro Liter
µm Micrometer
µM Micro molar 0C Degree Celsius
Alpha
A0 Angstrom
Beta
Fg Femto gram
Gamma
G Gram
Lambda
L Liter
M Molar
mM milli Molar
Ms milli Siemens
mV milli Volts
N Normal
N number of samples / replicates
Ng Nanogram
nM nano Molar
Nm Nanometer
v/v volume by volume

IX
LIST OF FIGURES Figures Page #
CHAPTER 1 Figure 1.1: Analysis of top 10 therapy areas in 2016, market share and sales
growth (2010-16).
3
Figure 1.2: General process flow chart for production for biosimilar product
development
6
Figure 1.3: Interplay of various functional areas during biopharmaceutical
development
7
Figure 1.4: Biologics versus small molecule drug 9
Figure 1.5: Structure and nomenclature of the carbohydrate moieties
typically observed in recombinant monoclonal IgG molecules
expressed in different cell lines
13
Figure 1.6: Glutamine synthesis pathway 14
Figure 1.7: Biochemical reaction catalyzed by DHFR 17
Figure 1.8: Typical Structure of antibody molecule bound to antigen 23
Figure 1.9: Different biological functions of Antibodies 25
Figure 1.10: Nomenclature of mAbs 27
Figure 1.11: Classification of therapeutic Abs based on MOA 28
Figure 1.12: Non-immune Mediated Function of mAb 31
Figure 1.13: Immune Mediated Function of mAb 32
Figure 1.14: Schematic representation of the four erbB family members
and their ligands
40
Figure 1.15: Simplified representation of EGFR pathways 41
Figure 1.16: A typical structure of anti-EGFR mAb 45
Figure 1.17: The carbohydrate sequence attached to Asn297 of human IgG1 46
CHAPTER 3
Figure 3.1.1: Flow diagram of construction of pSRM01 vector 94
Figure 3.1.2: RE digestion of pcDNA3.1(-) and SRI-G1pMA vector with
BstBI & XmaI .
95
Figure 3.1.3: RE diagnosis of recombinant plasmids isolated from pSRM01
transformed E.coli DH5 cells
96
Figure 3.1.4: Flow Diagram of the Construction of pSRM02 97
Figure 3.1.5: Generation of pSRM02 vector 98

X
Figure 3.1.6: Schematic representation of construction of pSRM05 Vector 100
Figure 3.1.7: Screening of pSRM05 transformants of E.coli DH5 by colony
PCR
101
Figure 3.1.8: RE Diagnosis of pSRM05 Clone #1 and # 2 102
Figure 3.1.9: Schematic representation of construction of S8.1 expression
vector
102
Figure 3.1.10: Cloning of Light Chain in pSRM02 104
Figure 3.1.11: Cloning of Heavy Chain in pSRM02+L1 105
Figure 3.1.12: Schematic diagram of S8.3 expression vector 105
Figure 3.1.13: Cloning of Neomycin Gene in S8.1 Expression Vector 106
Figure 3.2.1: A typical morphology of CHO-S Adherent Cells. 109
Figure 3.2.2: A typical morphology of SP2/0 AG14 109
Figure 3.2.3: Liposome mediated transfection 110
Figure 3.2.4: Transfection through calcium phosphate precipitation method 114
Figure 3.2.5: Electroporation as a mode of DNA transfer 116
Figure 3.2.6: Amaxa® Nucleofector equipment 117
Figure 3.2.7: Flow chart of cell line development 118
Figure 3.2.8: Western blot analysis of SP2/0 transfectants 120
Figure 3.2.9: Expression analysis of S8.1 Pool ‘E’ by ELISA 121
Figure 3.2.10: Representative dot blot for screening minipools 121
Figure 3.2.11: Optimization of nucleofection conditions 123
Figure 3.2.12: Western blot analysis of SP2/0 transfectants 124
Figure 3.2.13: Western blot for expression analysis of SP2/0 and CHO
transfectants
125
Figure 3.2.14: Expression analysis of SP2/0 and CHO pools by ELISA 126
Figure 3.2.15: Expression comparison of Pool B and D of CHO transfectants
by ELISA
126
Figure 3.2.16: Plate pattern followed for seeding cells for Minipools and clonal
population generation
127
Figure 3.2.17: Comparison of expression in Pool B Minipools by ELISA 128
Figure 3.2.18: Comparison of expression in Pool D Minipools by ELISA 128
Figure 3.2.19: Comparison of expression amongst B and D Minipools by
ELISA
129

XI
Figure 3.2.20: Comparison of expression of clones generated from Minipool D
by ELISA
130
Figure 3.2.21: Comparison of D41 clones by ELISA 130
Figure 3.2.22: Clonality checking by microscopic observation 131
Figure 3.2.23: Image generated from ClonePix FL 132
Figure 3.2.24: Image generated from the CloneSelect Imager to determine
confluency (%).
132
Figure 3.2.25: Growth rate determination of top 30 shortlisted clones from
ClonePix
133
Figure 3.2.26: Productivity comparison of manually and automated selected
clones
135
Figure 3.2.27: Detection of mycoplasma by PCR method 137
Figure 3.2.28: Growth profile of 3 short listed clones of rCHO 138
Figure 3.2.29: Productivity comparison of 3 shortlisted clones of rCHO 139
Figure 3.2.30: Clone stability in presence of selection pressure (G418) of
rCHO
141
Figure 3.2.31: Clone stability in absence of selection pressure (G418) and
under shaking conditions of rCHO
142
CHAPTER 4
Figure 4.1.1: Importance and implementation of CQA in biosimilar
development
149
Figure 4.2.1: Principle of affinity chromatography 151
Figure 4.2.2: Affinity purification of harvest 153
Figure 4.2.3: Western blot analysis for identity 154
Figure 4.2.4: Isoelectic focusing (IEF) for identity and purity 155
Figure 4.2.5: SDS-PAGE for molecular weight and purity determination of
expressed mAb
158
Figure 4.2.6: Protein-A HPLC for Quantification of target mAb and
establishing identity of target mAb.
159
Figure 4.2.7: Cation exchange HPLC for determination of charge variants 162
Figure 4.2.8: RP-HPLC for establishing identity of protein 164
Figure 4.2.9: In-vitro bioassay for determining the binding potency of the
expressed mAb
166

XII
CHAPTER 5
Figure 5.2.1: Media screening to achieve higher expression yield for clone
D41E213
175
Figure 5.2.2: Feed media screening for fed-batch culture 177
Figure 5.2.3: Combination of basal media and feed for fed-batch 178
Figure 5.2.4: Comparison of different basal media in shake flask experiments 180
CHAPTER 6
Figure 6.1.1: General product quality variables of a mAb 186
Figure 6.1.2: Depiction of conserved N-linked glycosylation site at Asn297 of
Fc domain
193
Figure 6.1.3: Format for depicting glycosylation 195
Figure 6.1.4: Three subclasses of N-glycan structure observed in mammalian
cells
197
Figure 6.1.5: Various carbohydrate moieties observed in different cell lines 198
Figure 6.2.1: Size exclusion -HPLC for determination of aggregates and
degradants / clips
200
Figure 6.2.2: Cation Exchange -HPLC for determination of charge variants 202
Figure 6.2.3: CEX-HPLC profile of RMP before and after CpB digestion 203
Figure 6.2.4: General approach for MS characterization of recombinant
therapeutic proteins
205
Figure 6.2.5: Deconvulated spectra of Fc fragment after Lys-C digestion and
reduction for molecular mass estimation
206
Figure 6.2.6: Deconvulated spectra of Fab fragment after Lys-C digestion
for molecular mass estimation
207
Figure 6.2.7: CEX-HPLC profile of RMP and expressed mAb digested with
Lys-C and reduced
209
Figure 6.2.8: Deconvulated spectra of Fc fragment to determine the glycan
forms
210
Figure 6.2.9: Deconvulated spectra of Fab fragment to determine the
glycan forms
211

XIII
LIST OF TABLES Tables Page #
CHAPTER 1
Table 1.1: Comparison of Biologic, Biosimilar and Generic drugs 4
Table 1.2: Distinguishing features of small-molecule drug and Innovator’s
Biologics
8
Table 1.3: Commercialized mAbs production cell platforms 11
Table 1.4: Naming of mAb molecules 27
Table 1.5: Ranking of Fc effector function potentials for therapeutic
mAbs
29
Table 1.6: Therapeutic mAbs and antibody fragments approved by US-
FDA
34
Table 1.7: List of anti-EGFR mAbs in development 42
Table 1.8: Side-effects of different anti-EGFR mAbs 44
CHAPTER 2
Table 2.1.1: List of primers used during cell line development activity 52
Table 2.1.2: List of Basal Media 74
Table 2.1.3: List of Feed Media 75
CHAPTER 3
Table 3.1.1: Features of pcDNA3.1 vectors 93
Table 3.2.1: Comparison of clones selected by ClonePix by ELISA 113
Table 3.2.2: Comparison of top 10 clones slected by ClonePix 134
Table 3.2.3: Specific productivity of top 5 clones selected by ClonePix 134
Table 3.2.4: Summary of product characterization done using various
analytical techniques
144
CHAPTER 4
Table 4.1.1: List of attributes having impact on the functions of mAb 150
Table 4.2.1: Protein-A HPLC quantification of cell culture supernatant from
3 lead clones
160
Table 4.2.2: Percentages of peaks observed by CEX-HPLC in expressed
mAb from 3 lead clones in comparison with RMP.
163
CHAPTER 5

XIV
Table 5.1.1: Properties of basal media and feed media to be look-into and
evaluated for upstream process development
172
Table 5.1.2: List of basal media screened for optimizing expression 173
Table 5.1.3: List of feed media screened for optimizing expression 173
Table 5.2.1: Basal-media and Feed combinations used for improvement in
expression yield.
177
Table 5.2.2: Comparing and rating the basal media by taking in account cell
growth and expression yield
181
CHAPTER 6
Table 6.1.1: Modifications detected by CEX in the full-length Ab. 191
Table 6.2.1: Comparison of expressed mAb from clone # D41E213 with
RMP by SEC-HPLC
201
Table 6.2.2: N-terminal amino acid sequence comparison using Edman
Degradation method.
204
Table 6.2.3: Determined mass of Fc and Fab fragment 208
Table 6.2.4: Percentage composition of glycan present on the heavy chain
region of Fc domain
210
Table 6.2.5: Percentage composition of glycan present on the heavy chain
region of Fab domain
210

CHAPTER 1
INTRODUCTION

Page 2 of 235
1.1. Overview of Biosimilars 'Biopharmaceuticals' or ‘Biologics’ are defined as products manufactured by/from living
organisms (involving bioprocessing) for the therapeutic use. This includes proteins (e.g.
growth factors, antibodies), nucleic acids (DNA, RNA or antisense oligonucleotides) and
living organisms like virus or bacteria (e.g. vaccines) or their toxins. This does not
typically include products such as synthetic peptides or natural products chemically
extracted from dead tissues (e.g., heparin, collagen). Since the approval of Escherichia
coli-derived recombinant human insulin (Humulin) in 1982 and Chinese Hamster Ovary
(CHO)-derived tissue plasminogen activator (tPA, Activase®) in 1986, recombinant
protein therapeutics have revolutionized modern medicine (Munro, et al 2010).
Biopharmaceuticals are produced from microbial cells (recombinant E.coli, yeast cells),
mammalian cell lines (transformed stable cells), plant cell culture and moss plants in
photobioreactors of various configurations. Protein therapeutics are rapidly growing,
with more molecules getting added every year, which includes cytokines, serum proteins
and monoclonal antibodies for human clinical use (Butler 2005). The total sale of
biologics in the year 2010 has grown by 17% to US$ 107.7 billion versus US$ 91.78
billion in year 2009 (LaMerie 2010) this has potential to reach around US$ 200 billion
by 2015 considering the fact that there are more than 400 biologic drugs in late stage
clinical development (Munro, et al 2010). Together with vaccines and gene therapy
products, the biopharmaceuticals represent half of the FDA-approved therapeutics in the
pipeline. Therefore, therapeutic mAbs and derivatives have a considerable share in the
market amongst pharmaceuticals.
Therapeutic Monoclonal antibodies (mAbs) are now the second largest category of
biopharmaceutical products in development and are predominantly manufactured by
mammalian cells in culture. These are well accepted class of therapeutics especially in
the fields of oncology, immunology, and organ transplant. It has been predicted that
oncology would be the largest therapy segment by 2016 in terms of % worldwide market
share and % sales growth as depicted in Figure 1.1

Page 3 of 235
Figure 1.1 Analysis of top 10 therapy area in 2016, market share and sales growth (2010-16).
Ref.: (www.evaluatepharma.com).
The quality of life for patients has improved a lot by the use of the mAb targeted therapy
with fewer side effects than the traditional cytotoxic drugs (Chu and Chartrain 2008).
Till the end of year 2011 approximately 137 biopharmaceutical products are approved
out of which around 32 mAbs or mAb fragments were approved by US-FDA. There
were 12 full approvals for biopharmaceutical products in 2011 only. All of the
qualifying products were approved as biologics (BLAs), except for 1 drug (NDA). Only
4 of the 12 (33%) approvals were for recombinant proteins, a relatively low number and
percentage. This included 3 monoclonal antibody-based products
(http://www.biopharma.com/approvals_2011.html).
The currently registered mAbs for human use are produced at commercial scale through
mammalian cells that have been genetically engineered to over-produce the mAb of
interest. One exception is the use of the bacterium E. coli in the production of mAb
fragments. The production of mAbs at industrial scale is an integrated approach that
encompasses many technically complex and lengthy steps. Typical cycle times for these
multiple steps usually range between 16-24 months (Carroll and Al-Rubeai 2004).
“Biologics”, considered one of the fastest growing sectors of the pharmaceutical
industry, has introduced many new treatments to life-threatening and rare illness. The
first generation of biopharmaceutical products manufactured using recombinant

Page 4 of 235
technologies was launched in the 1980s, and they are now on the way to patent
expiration. As a result, research-based and generic pharmaceutical companies alike are
pursing the opportunity to develop “generic” substitutes for original biologics, herein
referred to as Biosimilars (Sekhon and Saluja 2011). “Biosimilars” or “follow-on-
biologics” are terms used in Europe and US respectively to describe officially-approved
subsequent version of “innovator biopharmaceutical product” made by a different
sponsor following patent and exclusivity expiry of the innovator’s product. Biosimilars
are also referred as Subsequent Entry Biologics (SEB) in Canada and “Biocomparables”
in Mexico and, in this thesis “biosimilars”. Reference to the innovator’s product is an
integral component of the approval process. The biologics due to the fact that it is
derived from the living cell exhibit high molecule complexity and are very sensitive to
even minor changes in the manufacturing process, which is commonly not seen in the
small-molecule drugs. Major points of differences between generic, biologic and
biosimilar drugs are tabulated in Table 1.1 Process Biologic Biosimilar Generic
Manufacturing Produced by
biological process in cell
lines
Sensitive to
production process
changes-expensive
and specialized
production facilities
Reproducibility
difficult to establish
Produced by
biological process in
host cell lines
Sensitive to
production process
changes-expensive
and specialized
production facilities
Reproducibility
difficult to establish
Produced by
using chemical
synthesis
Less sensitive to
production process
changes
Reproducibility
easy to establish
Clinical
Development Extensive clinical
studies, including
Phase I-III
Extensive clinical
studies, including
Phase I-III
Often only Phase I
studies
Regulation Needs to
demonstrate
“comparability”
Regulatory
pathway defined by
Europe (EMEA)
Currently no
automatic substitution
intended
Needs to
demonstrate
“similarity”
Regulatory
pathway defined by
Europe (EMEA)
Currently no
Automatic substitution
intended
Needs to show
bioequivalence
Abbreviated
registration
procedures in
Europe and US
Automatic
substitution allowed

Page 5 of 235
Table 1.1 Comparison of biologic, biosimilar and generic drugs.
Ref. Sekhon and Saluja 2011
Follow-on manufacturers or biosimilar developers donot have access to the Innovator's
molecule clone nor original cell bank, nor they have access to the exact fermentation and
purification process, nor to the active drug substance. They do have access to the
commercialized innovator’s drug product to be used as a reference molecule. Because no
two recombinant cell lines developed independently can be considered identical,
biopharmaceuticals are not fully copied. Structural differences, presence of impurities
and/or breakdown products in the final formulation can have serious health implications.
The European Medicinal Agency (EMEA) has recognized this fact, which has resulted in
the establishment of the term “biosimilar” in recognition that, whilst biosimilar products
are similar to the innovator product, they are not exactly the same. The changes
occurring in the molecule due to minor changes in cell processivity and environment in
which the biosimilar is been produced has created a concern and doubt for the drug
regulatory authorities whether copies of biologics could perform similar to the original
branded version of the product. Generally for any pharmaceutical product, development
guidelines are published by different drug regulatory authorities like India, Europe, US,
Japan, etc. to ensure the quality of the product going to patients. However, because of
the complexity of biologics US FDA has yet not came up with guidelines. This stems
mainly from the difficulty in providing sufficient analytics to completely define
something that is essentially ‘acceptably heterogenous’ Thus, developing guidelines to
ensure safety and efficacy while providing a simplified approval pathway has been
challenging (Munro 2010).
Biosimilar Drug Development is a multi-stage process requiring careful selection of the
best candidate clone, process, materials and methods through out the development with
the main objective of maintaining close similarity to the “Innovator’s Drug Product”.
These stages are shown in Figure 1.2 and the stages worked during this project are
explained under individual chapters of this thesis.

Page 6 of 235
Figure 1.2 General process flow chart for biosimilar product development.
The work carried during this work is highlighted.
Manufacturing processes for the production of therapeutic recombinant proteins
generally involve a complex series of steps each having a dramatic impact on
downstream protein quality and, ultimately, the safety and efficacy of the final product.
CHAPTER 3
CHAPTER 4
CHAPTER 5
CHAPTER 6
Identification & authentication of protein sequence
Chemical synthesis of cDNA sequence and codon optimization
Choice and construction of expression vector
Choice and selection of host system
Transfection and selection of stable clones.
Final clone selection and platform method development. Creation of RCB/PCB
Upstream Process Development
Downstream Process Development
Characterization of product
Consistency of Process at R&D scale
Toxicity Studies in animals
Process Scale-up for human clinical trials
MARKET LAUNCH
Human Clinical Trials

Page 7 of 235
An indepth understanding of how formulation and process factors affect product quality
and bioactivity is required to be studied and designed to yield “well-characterized
biologics” or “defined biologics” (Henry 1996). This requires advanced analytical
methodologies to unambiguously confirm protein sequence, structure, and bioactivity.
Typically the functional areas depicted in Figure 1.3 come into play during the
development of a biopharmaceutical product to achieve quality product (Srebalus Barnes
and Lim 2007).
Figure 1.3 Interplay of various functional areas during biopharmaceutical development.
The process or product quality attributes are generally addressed by each group. Attributes in overlap
regions represent product quality or process robustness concerns that are common to multiple development
groups. PTMs = post-translational modifications and HCPs = host cell proteins.
1.2. Biologics versus Small-molecule drugs The major difference between biologics and small molecule arises from the way they are
manufactured. Chemical methods are generally used to produce small-molecule drugs
whereas biological products are synthesized usually by cells or living organisms. This
difference in origin leads to difference in structure, composition, manufacturing methods
and equipment, intellectual property, formulation, handling, dosing, regulation and
marketing (Marshall, et al 2003). The differences are listed in Table 1.2 as adopted from
(Sekhon and Saluja 2011).

Page 8 of 235
Comparison
Property
Small Molecule Drugs Biologics Drugs
Product-related
differences
Produced by chemical synthesis
Low molecular weight, 100 -
1000 Da
Stable
Single entity, high chemical
purity, purity standards well
established
Administered through different
routes of administration
Rapidly enters systemic
circulation through blood
capillaries
Distribution to any combination
of organ/tissue
Often specific toxicity
Often non-antigenic
Biotechnologically produced by
host cell lines
High molecular weight, 10,000-
150,000 Da
Complex physiochemical
properties
Sensitive to heat and shear
(aggregation)
Heterogeneous mixture, broad
specifications which may change
during development, difficult to
standardize
Usually administered
parenterally
Larger molecule primarily reach
circulation via lymphatic system,
subject to proteolysis during
interstitial and lymphatic transit
Distribution usually limited to
plasma and/or extra-cellular
fluid
Mostly receptor mediated
toxicity
Usually antigenic
Manufacturing
Differences
Completely characterized by
analytical methods
Easy to purify
Contamination can be generally
avoided, is easily detectable
and removable
Not affected by slight changes
in production process and
environment
Difficult to characterize
Lengthy and complex
purification process
High possibility of
contamination, detection is
harder and removal is often
impossible
Highly susceptible to slight
changes in production process and
environment
Table 1.2 Distinguishing features of Small-molecule drug and Innovator’s Biologics

Page 9 of 235
When compared on size matter biologics are 100 to 1000 times larger possessing several
hundred amino acids (average molecular weight of 150 per amino acid). In contrast,
small-molecule drugs are far smaller, i.e., molecular weight <1000, self-contained,
generally organic or inorganic molecules, that are, usually, chemically synthesized
(Revers and Furczon 2010a). Biologics been bigger molecule, the greater number of
atoms makes up its structure and hence greater is the complexity (Figure 1.4). Biologics
attend complicated 3D structure when the primary (amino acid sequence) gets arranged
in secondary (-helix and -pleated sheet) structures, which results in tertiary structure
to be biologically active (Crommelin, et al 2003). In some biologics, stable associations
of tertiary structures of individual proteins form a quaternary structure. These
molecules, during synthesis by cells, often further modified by post-translational
modifications such as glycosylation or sialylation, which may be crucial for biological
activity (Revers and Furczon 2010b).
Figure 1.4 Biologics versus small molecule drug. For small molecule-drug, aspirin is taken as example while for biologics a low molecular weight molecule,
insulin and high molecular weight molecule, antibody is depicted.
Although there is a tremendous advancement in the development of novel techniques for
characterizing structural and physicochemical properties, the inherent complexity of
biologics means that the picture will be incomplete even if all available methods are
used. Practically to characterize biologics fully is impossible and may vary with
different manufacturing processes (Goldsmith, et al 2007). Moreover, biologics

Page 10 of 235
production methods are also more complex, involving several steps and subject to
variations affecting the biological and clinical properties of the drug substance. In
contrast, traditional small-molecule drugs have a well-defined and stable chemical
structure, which can be completely characterized by analytical methods (Crommelin, et
al 2005) in fact fewer analytical methods than used for biologics. The most critical
difference between biologics and small-molecule drug is their immunogenecity.
Antibody response is induced by almost all therapeutic proteins, irrespective of whether
these proteins are (partly) non-human or completely human homologs, because of
microheterogenity exists from different processes. At times these proteins can induce
severe side effects by neutralizing endogenous counterparts or homologs (Schellekens H,
et al 2010). The above described complexity of biologics post critical commercial
challenges compared with small-molecule drugs – the most important of which pertains
to developing a viable pricing, distribution and reimbursement model that is intrinsically
geared to the special characteristics of biologics and the expectations of a diverse
customer population. Due to the fact that, biologics now comprise about 33% of the
medicines approved, understanding whether their biological differences translate into
understanding of safety, economics and anticipated public health improvements.
Biologics overall differ from the small-molecule drugs in their innate biology,
production, and dosing regimes, leading to a major differences in product development,
regulatory approval, distribution, and commercial paths. Thus, although they have the
same medical goal – to treat disease – small-molecule and biologics therapeutics differ
substantially in ways that might affect innovation, safety, costs, clinical adoption, patient
access and pricing (Sekhon and Saluja 2011).
1.3. Production Platforms The earliest technology of microbial fermentation is used till date for the manufacturing
of many less complex, recombinant proteins, such as industrial enzymes, and few
cytokines at a fraction of the cost of mammalian cell-derived biologics. Mammalian cell
line engineering has traditionally had only modest success; however, the recent advent of
new molecular and ‘omics’ tools should change this equation by enabling the field of
rational cell engineering to mature. Highly optimized host cell lines would provide an
efficient platform for maximal low cost biosimilar production. Pharmaceutical and
biotechnology industries are eyeing on the growing demand for biologics and the end-of-

Page 11 of 235
patent protection for many existing treatments. The focus for biosimilar equivalent will
be speed and/or cost. With the emergence of the new blockbuster biologics, research is
widely spread in the areas of developing new expression and host cell technologies in
order to get higher and higher productivity so as to reduce manufacturing cost and hence
cost to the patient. These new technologies may also create an avenue for the creation
of biosuperiors (or biobetters), which represent enhanced versions of the innovator
product. However, till today the best-practice for industry during early cell line
development still relies heavily on traditional amplification systems in combination with
immortalized mammalian cell lines such as CHO, SP2/0 and NS0 cell (Wurm 2004). A
novel mammalian cell line such as human retinoblast cells (PERC6®) is now being
explored in order to achieve higher productivity and quality (Paul, et al 2001). In
addition, alternative eukaryotic hosts such as glyco-engineered yeast (Wildt and
Gerngross 2005) and insect cells (Coxx and Holister 2009), or even transgenic plants
and animals are being explored. These new expression systems will likely catalyze the
progression of the biosimilar market in future.
Although many immortalized mammalian cell lines can be potentially used, since they
were in use at the time the first mAbs were developed for clinical and commercial
applications; as of today, with the exception of the two mAbs produced by hybridoma
technology, the production of all currently commercialized therapeutic mAbs is achieved
in mammalian cells of mouse (NS0 and SP2/0 cell lines) or Chinese Hamster Ovary
(CHO) cell origin. A few selected commercialized mAbs and their respective production
platform is listed in Table 1.3:
CHO Cells NS0 SP2/0 Murine
Hybridoma
Avastin, Campath, Herceptin,
Humira, Raptiva, Rituxan, Vectibix,
Xolair, Zevalin, Campath, Prolia,
Actemra, Adcetris, Yervoy
Mylotarg, Soliris,
Synagis, Tysabri,
Zenapax, Benlysta,
Arzerra,
Erbitux, Remicade,
Reopro, Ilaris,
Simponi
Bexaar, Orthoclone
Simulect,
Table 1.3 Commercialized mAbs Production cell platforms

Page 12 of 235
1.3.1. NS0 and SP2/0 Cell Lines These cell lines originated from mouse plasmacytoma cells that have undergone several
steps of cloning and selection to yield immortalized non-IgG secreting B cells (Kohler
and Milstein 1976; and Kohler, et al 1976). NS0 and SP2/0 are manipulated using
molecular biology techniques so that they produce mAbs for human use at industrial
scale. These cells can be cultivated in serum containing or serum-free media and are
reasonably amenable to scale-up in large bioreactors (upto 20,000L scale). However,
there are some drawbacks that complicate their cultivation. Unlike most mammalian cell
lines, NS0 cells require addition of cholesterol, which is usually derived from serum
(Sato, et al 1984 and 1987). The use of NS0 cells are undesired on a technical and
regulatory front as requirement of cholesterol for growth which is of animal origin is
essential. Cholesterol is not soluble in protein-free medium as it requires the use of
carriers such as cyclodextrins to enhance cholesterol “solubility” (Gorfien, et al 2000 and
Walowitz 2003). A lot of research has gone in to develop cholesterol independent NS0
cell lines which could be used industrially (Hartman, et al 2007) but, little progress is
made to establish commercial production of mAbs using NS0 cholesterol independent
cells. These modified NS0 lineage can offer definite advantage of simplicity and use at
industrial scale in future once cholesterol independency is addressed.
One of the most discussed aspects in biologics is the glycosylation of produced molecule
because it varies from cell lines to cell lines and process to process, but reasonably it is
similar in the CHO, NS0 and SP2/0 cell lines. The point of concern is regarding
glycosylation pattern distribution ratio (G0F, G1F and G2F) of the IgGs produced by
NS0 and SP2/0 which is not similar to that of circulating human IgGs. In addition, these
cells produce small amounts of murine-like glycans such as the addition of an extra-
galactose (α-Gal) to the terminal galactose and the insertion of N-glycolyneuraminic acid
(NGNA) in place of N-AcetylNeuraminic Acid (NANA) (Raju 2003), which have the
potential to trigger an immune response. Because of these minor changes in
glycosylation (e.g. NGNA) some clinical adverse events and anaphylactic shock, have
been reported for mAbs (such as Cetuximab) produced by cultivation of SP2/0 cells
(Chung, et al 2008). However, there is consistency in the glycoforms observed in mAbs
expressed by NS0 and SP2/0 cells because of which they have been used for some
products. The difference in the glycosylation pattern is depicted in Figure 1.5 (Beck, et
al 2008).

Page 13 of 235
Figure 1.5 Structure and nomenclature of the carbohydrate moieties typically observed in
recombinant monoclonal IgG molecules expressed in different cell lines.
In pursuit of developing cell line expressing mAb trans-gene, the host cell generally is
rendered metabolically deficient or sensitive to the antibiotics are employed. The overall
philosophy is to use cells with a deficient metabolic background; while the genetic
element containing the mAb coding region carries a gene that once expressed will
complement the metabolic deficiency. Various mode of transfection are used to deliver
one or several copies of the genes carried on the plasmid which will integrate into one or
several chromosomes of the recipient cells where they will be transcribed and translated.
Post-transfection and during clone selection, a selective pressure aimed at favoring those
cells that have incorporated the gene coding for the correction of the metabolic
deficiency or resistance to the antibiotics is applied in order to favor the growth of those
cells that have integrated the foreign DNA (Chu and Chartrain 2008). Several variations
on this strategy are described below.
A popular NS0 cell lineage is the GS-NS0 commercialized by Lonza Biologics. The
Glutamine Synthetase (GS) is also used while using SP2/0 and CHO cells and is also
used in this work plan. The role of glutamine and its generation from the glutamate
available in the cell culture media is described in Figure 1.6:

Page 14 of 235
A)
B)
C)
Figure 1.6 Glutamine synthesis pathway
A) Role and entry point of glutamine in the biochemical pathway
B) Conversion of glutamate to glutamine by glutamine synthetase enzyme
C) Structure of glutamine and glutamine analogue, methionine sulfoximide (MSX)
NS0 cells have very low levels of the endogenous glutamine synthetase (GS), and
require exogenous glutamine in order to grow. It is only when transfected with a copy of
the GS gene that the cells can grow in the absence of glutamine (Barnes, et al 2000).

Page 15 of 235
A vector, designed to carry both the genes (heavy and light chains) coding for the mAb
to be expressed and for GS, once integrated into the genome will allow the expression of
mAb and GS genes and thereby enabling selection of producing clones. In order to
select the cells with integrated foreign DNA in high expressing region of chromosome
and to reject the non-expressing cells or cells without foreign gene integrated in a region
of high expression; the cells are cultivated in a medium devoid of glutamine and in the
presence of methionine sulfoximide (MSX), an inhibitor of GS. Only those clones that
produce large amount of GS will survive. Correlatively, these clones are likely to also
produce large amounts of the mAb. Interestingly this approach seems to yield high
producing clones that have integrated low copy number (less than five) of the trans gene
(Bebbington, et al 1992). This GS system is also used in SP2/0 cells for high-level
expression of mAb genes. In this study also GS was used with SP2/0 and CHO cells.
Another method of selection relies on the fact that SP2/0 and NS0 cells are deficient in
Hypoxanthine-Guanine Phosphoribosyl Transferase (HGPRT). This negative genetic
trait can be exploited by inserting a copy of a microbial gene (from E.coli) coding for the
synthesis of XGPRT, an enzyme that can substitute for HGPRT. Only the cells that have
integrated the XGPRT gene will be able to use the nucleotide synthesis salvage pathway.
When cultivating the transfectants in a selective medium containing aminopterin which
inhibits the de novo nucleotide synthesis pathway, only those cells that have incorporated
the XGPRT gene will grow. Since the gene coding the mAb of interest is co-located
with the XGPRT gene on the plasmid, the probability of co-integration is high, and
transfectants expressing high levels of IgG are likely to be selected by using this method
(Mulligan and Berg 1981).
SP2/0 cells were used for the production of therapeutic proteins like EPO where the
glycosylation is required for the in-vivo biological activity of protein. High level of
expression was observed after transfection without gene amplification procedures. In
addition, the purified recombinant hEPO showed sufficient in-vitro biological activity
but the in-vivo activity was very low which could be due to the fact of low molar
concentration of terminal sialic acid (Sugaya, et al 1997). Hence for any heavily
glycosylated protein SP2/0 may not be suitable for expression and production because of
difference in the carbohydrate composition and structure.

Page 16 of 235
1.3.2. CHO Cells Chinese Hamsters (scientific name, Cricetulus griseus) belong to a family of rodents that
are native to the deserts of northern China and Mongolia. Since 1919 they are used in
life-saving biomedical research and were first used as laboratory specimen replacing
mice for typing pneumonia cocci (Box). Chinese hamsters are known as carriers of the
deadly parasite Leishmania spp. which cause Kala-azar (also known as black fever of
leishmaniasis), because of this fact in early 1920s, they gained reputation as valuable
tools in epidemiological research. In 1948, they were literally smuggled into the U.S. by
Dr. C.H. Hu and Dr. Robert Watson (Jayapal, et al 2007). Subsequent efforts at
domestication by Dr. George Yerganian and others in the mid-20th century led to the
development of spontaneous hereditary diseases due to inbreeding, spurring research
interest in hamster genetics. Chinese hamsters were found to be useful models in study
of radiation cytogenetics, metabolic studies and tissue culture because of the low
chromosome number (2n=22) (Deaven and Petersen 1973). In 1957, Dr. Theodore T.
Puck of the Department of Medicine at the University of Colorado received Chinese
hamster from Dr. Yerganian laboratory at Boston Cancer Research Foundation for
investigating the usefulness of various cells in somatic genetics. At this time Dr. Puck
isolated an ovary from a female Chinese hamster and established the cells in culture
plates (Puck, et al 1958). The ovary cells thus, isolated was observed to be proline
auxotrophs and have been spontaneously immortalized during their successive transfers
(Kao and Puck 1967 and 1968) and functionally hemizygous for many genes primarily
due to gene inactivation (Chasin and Urlaub 1975; Simon, et al 1982). These cells are
easily grown in either monolayer or suspension culture may be synchronized by a variety
of techniques (Petersen, et al 1969; Enger and Tobey 1972). CHO cells have been
extensively in studies for mutagenesis in mammalian cells (Kao and Puck 1969), cellular
radio-sensitivity (Walters and Petersen 1968), linkage relationships in cell hybrids (Kao
and Puck 1970), metabolism of macromolecules (Gurley and Hardin 1968; Zapisek, et
al. 1969) so much so, that they have been termed as the mammalian equivalent of the
model bacterium E. coli. Lately, mutants deficient in the dihydrotetrafolate enzyme
(DHFR) and adenine phosphoribosyl transferase (APRT) were isolated (Taylor, et al
1977; Urlaub and Chasin 1980). In addition, mutants defective in transcription-RNA
Polymerase II (Chan, et al 1972), thymidine mutants (Adair and Carver 1979) translation
and machineries for certain amino acid-Asparagine (Goldfarb, et al 1977; Wayne and
Stanner 1979) was also isolated. The DHFR enzyme is widely used in the
biopharmaceutical industry for the selection of clones. This enzyme is required for the

Page 17 of 235
synthesis of reduced tetrahydrofolate, a cofactor required in the synthesis of DNA
precursors. Two lineages, DG44 and DUKX-B11 which are CHO-dhfr minus are
available and used at commercial scale. These lines were developed in Urlaub and
Chasin’s Lab at Columbia University (Urlaub and Chasin 1980; Urlaub, et al 1983;
Urlaub, et al 1986).
DHFR is a small monomeric enzyme that catalyzes the conversion of folic acid, a
common vitamin, to tetrahydrofolate (THF). The latter is a cofactor carrier for one-
carbon moieties required in various biosynthetic reactions, particularly synthesis of
glycine, purine and thymidine.
This selection strategy is similar to that of the GS system described previously except
here the inhibitor of DHFR, methotrexate (MTX) is used. Since, DHFR deficient cells
are triple auxotrophs for glycine, hypoxanthine (a purine derivative) and thymidine,
introduction of heterologous genes into cells can be accomplished by co-transfection
with a functional copy of the DHFR gene, which obviates the need for these nutrients.
The expression plasmid containing mAb trans genes along with the DHFR gene is
transfected and cells which have integrated this cassette stably will only grow and
produce mAb of interest in presence of MTX (Kaufman, et al 1985). With the increase
in concentration of MTX, the trans gene copy number increases and hence the selection
of high producing clones increases (Kaufman and Sharp 1982). The DHFR selection
strategy can be enhanced with the use of resistance to aminogalactoside antibiotics such
as neomycin and kanamycin conferred by an added resistance gene on the plasmid
(Sautter and Enekel 2005). However, using DHFR selection strategy often leads to
genetic instability of the recombinant cell line.
Figure 1.7 Biochemical reaction catalyze by DHFR.
The yellow color cartoon represents inhibition of reaction by addition of an inhibitor, MTX.

Page 18 of 235
The parental CHO-K1 cells possess low GS activity hence the system described for NS0
and SP2/0 cell line development could also be used for CHO-K1. The flow of steps
starts with transfection of cell line with plasmid bearing trans genes for mAb and GS
gene followed by cultivation of cells in absence of glutamine and in the presence of
MSX allows growth of cells with stable integration of plasmid. Since the expression of
GS is present at a very low level, this system requires the presence of MSX during the
cell expansion in order to keep a sufficient genetic pressure to prevent deletion of the
foreign DNA (Bebbington, et al 1992).
These two strategies allow rapid selection of high producing clones. Due to the fact that
CHO cells are robust in terms of growing either in adherent or suspension form, they can
rapidly adapt to serum and protein-free chemically defined medium in large scale
bioreactors. In contrast to NS0, CHO cells do not require cholesterol and tend to remain
viable for a longer period of time. This ease of genetic selection coupled with their
robust and scaleable growth at an industrial level have resulted in the CHO cell line
being used in more than half of the registered mAb production processes (Chu and
Chartrain 2008).
CHO cells being of rodent origin, the glycosylation pattern distribution ratio (G0F, G1F,
G2F) of mAbs do not completely match with the circulating human IgG1 (Figure 1.5). In
addition, CHO cells produces a small amounts of non-human like glycan patterns, such
as 2-3 linked sialic acid residues that have the potential to be immunogenic (Raju
2003). But, these forms are present in very low proportions and mAbs produced from
CHO cells have shown remarkable safe profiles in the clinic (Roshos, et al 2004).
The choice of host cells for protein expression should be judiciously done and has a
direct impact on product characteristics and maximum attainable yields. Protein folding
and post-translational modifications conferred by the hosts dictate the pharmacokinetics
and pharmacodynamic properties, and hence their solubility, stability, biological activity
and residence time in humans. Product safety is another key aspect that must be
considered in choosing host cells. The production host must not allow the propagation of
any adventitious pathogenic agents that may eventually find their way into humans.
From an industrial perspective, the ability to adapt and grow cells in suspension instead

Page 19 of 235
of adherent cultures is highly desirable as it allows volumetric scalability and use of
large stirred-tank bioreactors. Finally, the host cells must be amenable to genetic
modifications allowing easy introduction of foreign DNA and expression of large
amounts of desired protein. CHO cells are now there in industry for twenty five years
and experience with it has demonstrated that, to a large extent, they possess many of
these characteristics (Jayapal, et al 2007). CHO cells have a proven tract record for
producing number of recombinant proteins and mAbs with glycoforms that are both
compatible and bioactive in humans. One of the early concerns in recombinant protein
production was that cultured mammalian cells were presumably derived through
perturbation of oncogenes, and thus, can proliferate without the effects of senescence.
However, CHO cells have been proven safe, with the value of products being generated
considerably outweighing any associated risks.
Considerable development work has been done in downstream purification processes for
CHO cell products which resulted in purified product of interest with not more than
picogram levels of contaminating CHO DNA per dose of the product (Wurm 2005). A
study carried out by Wiebe and group, who tested 44 human pathogenic viruses, majority
of them, including HIV, influenza, polio, herpes and measles do not replicate in CHO
cells (Wiebe, et al 1989). CHO cells are quite adaptable and convenient for genetic
manipulation and can grow to very high densities in suspension cultures that are readily
scaled to >10,000L bioreactors. From a regulatory point of view, CHO cells have gone
under extensive testing and safety data accumulated to satisfy the needs. The most
recently published CHO-K1 genome sequence will make the regulatory hurdle easier
(Wang, et al 2011).
In this study GS selection system was used tried to develop recombinant CHO and SP2/0
cell line expressing anti-EGFR mAb.
1.3.3. Cell Lines to look in future
The scope of this project was to produce mAb using mammalian cell lines. Although
CHO cells are the most prevalent for producing glycoprotein therapeutics, other cell lines
such as human embryonic kidney cells (HEK) (Durocher, et al 2007), baby hamster
kidney cells (BHK) and human retinal cells (PER.C6®) (Jones, et al 2003; Wurm 2004;
Petricciani and Sheets 2008) are being developed as high producing cell lines. HEK
cells are generally used for transient expression of protein at high levels, however,

Page 20 of 235
advancement has lead to establishment of stable cell lines particularly for blood factors
and neuronal proteins. At industrial scale it is used for production of blood factors and
Activated Protein C (APC). These proteins possess post-translational modifications such
as presence of unusual amino acids, including -carboxyglutamic acid and -
hydroxyaspartic acid which are generally not processed by CHO cells (Ehrlich, et al.
1989). BHK cells are used generally for vaccine production and not very famous in the
biosimilar industry. The PerC6® cell line appears to be most advanced in its usage and
acceptance. PerC6® are human retina cells that were immortalized by the use of the
early gene E1 of Adenovirus (Cramer, et al 1998). This cell line offers the potential for
human like glycosylation pattern with the added advantage of a lack of undesired murine
glycan. This cell line is cultivated to very high densities at large scale and that they are
capable of supporting elevated recombinant protein yields of upto 10 g/L of a mAb
(Jones, et al 2003; Yallop, et al 2005). With this expression yield and glycan structure
close to humans it has gained focus in the recent time. However, as of today, no mAb
produced from PER.C6 has been licensed. Unlike well established cell lines such as
CHO, NS0 and SP2/0 that have been used for the production of several commercial
mAbs, new and previously unregistered cell lines are likely to face higher regulatory
scrutiny. This is especially true on the topic of associated viruses, and in the clearance of
residual genetic material.
1.4. Clone Selection Approach The cells after cultivation under selection pressure are rapidly subjected to cloning for
which various methods are available. Cloning of cells to get a homogeneous cell
population which will have consistent and predictable growth, in addition most
importantly it is essential for ensuring that the produced mAb molecule will have high
homogeneity. Clonality is therefore a requirement emphasized by regulatory authority.
The most widely used, simple and popular method is the use of limiting dilution where
one or less than one cell is dispensed per culture well. The cells are allowed to grow
under the desired selective conditions until confluence is observed. This is achieved by
classical dilution and estimation of cell population based on viable cell counts. This
method is labor and time intensive. Recently the use of automated cell sorting
equipments (Flow cytometer, ClonePix, etc.) are in vogue to make the single cell
isolation and selection simpler and time saving. This method is simple and predictable,
but is more expensive and less labor intensive. Several technologies have evolved with

Page 21 of 235
the aim to directly identify potential high producing cell in addition to simple sorting.
One approach has been to estimate the secretion potential of a cell by entrapping it in a
gel. After an incubation period, the secreted entrapped mAb is detected using a
fluorescent-labeled antibody. The entire gel drop, containing cells and their respective
captured secreted product, are sorted by the flow cytometer according to their surrogate
level of mAb production, thereby potentially achieving a rapid selection (Browne and
Al-Rubeai 2007; Caroll and Al-Rubeai 2004; Bohm, et al 2004). Other approach to
estimate the expression of mAb is to detect intra-cellular co-expression of DHFR
(Yosida 2001) which is linked with the mAb genes. However, this will not give the true
picture of the secretion efficiency of the cells (DeMaria, et al 2007).
The production potential of the cells could be better captured by the methods which rely
on the cultivation of the cells on a soft agar surface as in ClonePix method, which retains
the antibody secreted in the cell vicinity, and detected by using labeled antibody. The
high expressing clones then can be directly picked and cultivated for further evaluation.
The potential advantage of this technique over the FACS based methods is that it
subjects the cells to high shear stress; it offers a more cell-friendly environment and
captures antibody secretion over a longer period of time, thereby increasing accuracy of
detection (Burke and Mann 2006; Hanania, et al 2005).
Cell Clonality could be ensured by microscopic observation of each well during the
incubation period. The clonal populations were further cultivated in individual larrge
cell culture vessels to detect the potential of expressing mAb. The high producer clones
were then tested for the product quality (eg. glycan distribution, correct amino acid
sequence, etc.). The best producing clones are selected for laboratory scale cultivation
under defined conditions (Kunert, et al 2004). The high expressing clones giving desired
quality product were further re-cloned either by limiting dilution or by sorting the cells
using a flow cytometer or any other automated method.
Following second round of cloning, the best producing clones (usually 3-5) are selected
for clone stability studies. Since the mammalian cell genome is very dynamic which
tend to reject, modify or relocate integrated foreign DNA, it is important to ensure that
the clone selected will produce the mAb of interest for a period of time desired based on
the total production cycle time calculated theoretically keeping in mind the doubling

Page 22 of 235
time of the cells. Clone stability is not only measured in terms of production levels but
also on the biochemical attributes of the mAb such as sequence integrity and fidelity in
the glycosylation pattern (Berthold 1993). The clone stability is determined by
continuous cultivation of cells for extended number of generations under conditions that
mimic process conditions as closely as possible and generations beyond the targeted
number in manufacturing process. Over this growth period reduction in the amount of
mAb expressed is commonly observed as well as changes in some of the biochemical
characteristics of the molecule may be observed (Barnes, et al 2004; Strutzenberger, et al
1999; Barnes, et al 2003; Barnes, et al 2001; Barnes, et al 2006). The most important
parameter in selection of the candidate clone is maintenance of biochemical profile of the
molecule, as quality attributes are essential to the safety and potency of the mAb. Once
these steps are completed, the selected clone is preserved in a set of cell banks that upon
testing and qualification (purity, lack of adventitious agents, etc.) will be used for
commercial production of the therapeutic mAb.
These procedures are lengthy, require a highly specialized and competent workforce,
expensive equipment and therefore weigh heavily on the overall product development
cycle time, as these activities are performed on the critical path. This is where the
advantage of integrating novel technologies can be of great impact since they have a high
probability of reducing the extent and duration of the screening activities.
1.5. Antibody Structure and Function The antibody therapeutics (“Magic Bullets”) could be developed to selective target
disease was first hypothesized by Paul Erhlich in 1906. This hypothesis became
practical with the development of hybridoma technology by Kohler and Milstein (Kohler
and Milstein 1975). A short brief about the antibody structure and function is described
below before gaining understanding the therapeutic mAbs structure and function.
1.5.1. Structural Characteristics
Typically an antibody (Immunoglobulin) are heterodimeric protein molecule formed by
linking two molecules of light chain (green color in Figure 1.8) and two molecules of
heavy chain (pink color in Figure 1.8) with the help of a disulfide bond. The Y-shaped
structure of antibody is formed by inter- and intra-molecular disulfide bonds (yellow in
Figure 1.8). Antibody (Ab) is also known as immunoglobulin as it is a globular protein

Page 23 of 235
with immune function. Ab is produced by B-cells as humoral immune response to the
foreign antigen such as bacteria or viruses entering the body thereby neutralizing the
foreign antigen. The total molecular weight of Ig is ~150 kDa; light chain of ~25 kDa
and heavy chain of ~50 kDa size. The light chain comprises of around 214 amino acids
and heavy chain of 446 amino acids. The antigen binding site is formed as a pocket by
six hypervariable loops of three each from light chain and heavy chain supported by a
highly conserved -sheet framework where the antigen molecule binds.
Figure 1.8 Typical Structure of antibody molecule bound to antigen (red circle).
Antibodies are glycoprotein molecules with one or two carbohydrate moieties (light blue
in Figure 1.8) added to amino acid residue (generally Asn). In IgG there are two
disulfide bonds at the hinge region giving stability to the molecule. In addition the hinge
region gives flexibility to the entire structure when an antigen molecule binds to the
antibody. The hinge region is prone to papain digestion resulting in two halves, a Fab
(fragment, antigen binding) and a Fc (fragment, crystalization) The antibody naturally
exists in different forms depending on the number of antibody molecules linked to form
a dimer (IgA), four IgG (telofish IgM) or mammalian IgM.
Antigen

Page 24 of 235
1.5.2. Biological Function of antibody
An antibody molecule performs various functions namely virus and toxin neutralization,
neutralization of microbes (bacteria, virus and toxins), immuno-modulation in the body,
antibody dependent cellular cytotoxicity and complement dependent cytotoxicity to kill
the target cells, opsonization of antigens, generation of oxidants, and anti-inflammatory
response. A general outline on the functions performed by Ab molecule in animal body
is depicted in Figure 1.9 however; there is interplay of many more components to elicit
the immune response and clearance of antigen which are out of the scope of this work.
Each type of antibody can be produced as a circulating molecule or as a stationary
molecule on the surface of the B cells. Both the direct antigen binding portion and
constant Fc regions of antibodies contribute to their biological activity.
The direct antigen binding portions involves highly specific recognition of and binding
to the antigen, mediated through the variable domain that is a common hallmark of
antibodies. The constant domains of the Fc region associates with complements as well
as immune effector cells to mediate antibody-dependent cell mediate cytotoxicity
(ADCC), phagocytosis, release of inflammatory cytokines, and perhaps more
significantly, with Fc receptors (FcRs) present on phagocytes and other immune cells
(Figure 1.9).

Page 25 of 235
Figure 1.9 Different biological functions of antibodies.
Toxin and virus neutralization, complement activation and direct antimicrobial functions such as the
generation of oxidants are independent of other components of the host immune system, whereas antibody-
dependent cellular cytotoxicity and opsonization depend on the host cells and mediators. (adapted from
Casadevall et al 2004)
1.6. Therapeuic Monoclonal Antibody
1.6.1. Structural Characteristics and Classification The most abundant form of antibody found is IgG and as of today all immunogenec
mAbs are IgG (Chu and Chartrain 2008). The typical structure of Ig is described above.
The mAbs which are used for therapeutic purpose impose specificity to epitope on
antigen which is dictated by the amino acid sequence at Complementarity Determining
Region (CDR) present in the variable domains of both light chain and heavy chain. The
amino acid sequence at the hyper-variable region forms a loop structure which tightly
interacts with the antigen. IgG possess glycosylation at each heavy chain which adds to
the complexity of the molecule through a conserved N-linked glycosylation site

Page 26 of 235
generally at Asn297 (Jefferis 2005) except in Cetuximab (molecule in discussion) where
this site is at Asn299.
The mAb production through hybridoma technology presents some serious drawbacks
due to the fact that they are generated from non-human host. Since the coding region of
the mAb directly originates from the immunized animal without any subsequent genetic
manipulations, the mAb produced is of mouse origin in its amino acid sequence, and
upon repeated injections an immune response from the human recipient (referred to as
Human Anti-Mouse Antibody or HAMA). Further improvement and continuous
improvement by using genetic manipulations were done to replace the murine amino
acid sequences with human sequences to the effect that the HAMA response gets
minimized.
The human anti-human antibody (HAHA) response is a normal part of the human
adaptive immune system. Humanized and fully human monoclonal antibodies contain
greater or lesser numbers of effector and regulatory T-cell epitopes just as natural
antibodies do (De Groot and Martin 2009). Engineered antibodies which, by chance,
contain a relatively large number of effector epitopes and a relatively smaller number of
regulatory T-cell epitopes are likely to induce HAHA responses in human subjects. In
this case, there is no process of B cell editing, competition, or apoptosis to help
reprogram the deleterious immune response.
Based on these improvement, the recombinant therapeutic mAbs are classified as murine
(100% murine sequence), chimeric (murine 40-30% + human 60-70%), humanized
(murine 5-10% + human 95-90%) and fully human (Figure 1.10). The naming of a mAb
molecule also follows a particular format as illustrated in Table 1.4. As depicted in
Figure 1.10, the immunogenecity decreases as the molecule developed are more human
like.
In addition to the full mAb molecule, antibody fragments are also used for therapeutic
applications.

Page 27 of 235
Figure 1.10 Nomenclature of mAbs. Red are portions originating from murine while the yellow one is human origin.
Table 1.4 Naming of mAb molecule
The antibodies are also classified based on the method of action (MOA) as described in
detail by Jiang, et al 2011. On the basis of their putative MOA, most therapeutic
antibodies (including Fc fusion proteins) can generally be classified into three categories,
from which their potential for Fc functionality can be ranked (Figure 1.11).

Page 28 of 235
Figure 1.11 Classification of therapeutic antibodies based on MOA.
Class I antibodies recognize and bind to cell-bound antigens and the complex remains stable. The Fc
effector functions are generally part of the mechanism of action (MOA) for antibodies in this class.
Examples of Class I molecules include rituximab (Rituxan/Mabthera) and alemtuzumab (Campath). Class
II antibodies also recognize and bind to cell-bound antigens but their proposed MOA does not involve Fc
effector functions. Examples of Class II molecules include basiliximab (Simulect; Novartis) and cetuximab
(Erbitux). Class III antibodies bind to and neutralize soluble antigens, and their MOA often involves
blocking the soluble ligand from binding to its cognate receptor. Examples of Class III antibodies include
bevacizumab (Avastin; Genentech/Roche) and palivizumab (Synagis; MedImmune). ADCC, antibody-
dependent cell-mediated cytotoxicity; CDC, complement-dependent cytotoxicity; NK, natural killer.
Excluding Fab fragments and antibody-drug conjugates (ADCs), there are currently 29
antibodies and Fc fusion proteins approved by the US-FDA for therapeutic purposes.
Based on FDA-approved label information (available at the Drgs@FDA website) and the
guidelines described below, the proposed classficiation and effector function potential of
these molecules are summarized in Table 1.5:

Page 29 of 235
Therapeutic Ab Type
CLASS I: Cell-
bound antigen stable
upon Ab binding.
MOA involving Fc
effector function
(ADCC, CDC,
ADCP)
CLASS II: cell-
bound antigen.
MOA not involving
Fc effector function
CLASS III: soluble
antigen. MOA not
involving Fc effetor
function (blocking)
IgG1 and IgG3 High Moderate Low
IgG1 and IgG3 with Fc
mutations to enhance Fc
functionality
High Not applicable Not applicable
Afucosylated IgG1 High Not applicable Not applicable
IgG1 and IgG3 with Fc
mutations to reduce Fc
functionality, or aglycosylated
IgG1 and IgG3
Not applicable Low Low
IgG2 and IgG4; IgG2 and IgG4
with Fc mutations to reduce Fc
functionality, or aglycosuylated
IgG2 and IgG4
Not applicable Low Low
Table 1.5 Ranking of Fc Effector function potentials for therapeutic Abs
Ab, Antibody; ADCC, antibody-dependent cell mediated cytotoxicity; ADCP, antibody-dependent cellular
phagocytosis; CDC, complement-dependent cytotoxicity; MOA, mechanism of action. (Adapted from
Jiang, et al 2011)
Class I: Class I therapeutic antibodies recognize cell surface antigens and are designed
to kill target cells through Fc-mediated effector functions, including antibody- dependent
cell-mediate cytotoxicity (ADCC), complement-dependent cytotoxicity (CDC),
antibody-dependent cellular phagocytosis (ADCP) and Fc-dependent apoptosis (Figure
1.11) Class I antibodies can be of the IgG1 or IgG3 subclass, and they can either be
unmodified, or modified through the introduction of Fc amino acid mutations and / or
glycoengineering to enhance their effector functions. One common characteristic of this
class of antibodies is their reliance on Fc-mediated functionality to achieve cytotoxicity
or apoptotic responses as the main focus of their MOA (beyond simple antigen binding).
These therapeutic antibodies are designed to have a high effector function potential
(Table 1.5), e.g, Rituximab, Alemtuzumab, etc.

Page 30 of 235
Class II: Class II therapeutic antibodies also recognize cell-bound antigens; however,
they are not designed to kill antigen-expressing target cells. Thus, effector functions are
not part of their MOA (Figure 1.11). The main MOA of this class of antibodies is to
block ligand-receptor interactions, and in other cases, to act as agonists.
The Class II category may include antibodies with moderate or low effector functions
potential. Because Fc-mediated function is not part of the intended MOA of Class II
Abs. IgG2 or IgG4 isotypes (which have a lower propensity to elicit effector functions)
are often selected. However, some human polymorphisms can be an exception to these
general observations. Unmodified IgG1 or IgG3 isotype within this class are considered
to have a moderate effector function poteintial because they contain an Fc region that is
capable of binding to FcRs. However, modulation of effector function poteintial should
be considered based on the target biology, the introduction of mutations into the Fc
region, or by altering the glycoform pattern (Table 1.5), Cetuximab, etc.
Class III: Class III therapeutic Abs are designed to bind soluble antigens and their
MOA often involves blocking to its receptor. For this class of IgG1 or IgG3 Abs, it may
be helpful to investigate whether there are membrane-bound forms of the ligand on any
cell types. If this is the case, the Ab, may need to be classified as a Class II Ab with
moderate effector function potential because there may be some safety concerns
associated with binding to a cell-bound ligand. IgG2 and IgG4 Abs (or IgG1 and IgG3
Abs with modifications to minimize effector functions) are in the ‘low potential’
category (Table 1.5).
ADCs: ADCs are constructed by chemically conjugating one or more cytotoxic small-
molecule drugs or radioisotopes to an antibody that binds to the desired cell surgace
antigen target. The primary function of Abs used to prepare ADCs is to guide the highly
toxic conjugated drugs specifically to tumor cells, in order to minimize potential
systemic toxicity. In case where there is evidence that the Ab alone (before conjugation)
has effector functions, the evaluation strategy appropriate for either Class I or II
molecules should be considered.

Page 31 of 235
1.6.2. Biological Function
The Class I type of Ab whereby Fc mediates ADCC and/or CDC activity of mAb. This
is described in detail below as the mAb under discussion; Cetuximab is classified as
Class I type.
The direct antigen binding portions involves highly specific recognition of and binding
to the antigen, mediated through the variable domain that is a common hallmark of
antibodies. The constant domains of the Fc region associates with complements as well
as immune effector cells to mediate ADCC, phagocytosis, release of inflammatory
cytokines, and perhaps more significantly, with Fc receptors (FcRs) present on
phagocytes and other immune cells.
Majority of the therapeutic mAb molecules developed exert potent biological functions
through multiple mechanisms, involving both non-immune and immune-mediated
functions.
1.6.2.1. Non-immune Mediated Function
The tumor cells require certain specific growth factors for growth. The unconjugated
mAbs inhibits binding of these growth factors thereby leading to the apoptosis of tumor
cells. The receptor specific antibody (eg. Anti-EGFR) inhibit signaling cascade by
binding to receptor thereby preventing the growth factor (EGF) to bind leading to cell
apoptosis (Figure 1.12).
Figure 1.12 Non-immune Mediated Function of mAb.
Epidermal Growth Factor (EGF) and Transforming Growth Factor alpha (TGFα) are ligand for Epidermal
Growth Factor Receptor (EGFR) required for cellular function like cell growth and aniogenesis.

Page 32 of 235
1.6.2.2. Immune Mediated Function
As the majority of therapeutic MAbs, chimeric, humanized or fully human, possess an Fc
region of the IgG1 subclass, they can induce effector functions against pathogens and
tumor cells following their interactions with the complement component C1q and / or
with receptors for Fc region (FcγR).
Complement Dependent Cytotoxicity (CDC) Function:
The formation of the antibody-antigen complexes results conformation change in the Fc
region of the mAb due to torque happening at hinge region which exposes the binding
site on for the C1q protein (C1q is one of three subcomponents of complement C1). This
binding triggers a proteolytic cascade to activate complement, see Figure 1.13. This can
lead to the formation of membrane attack complex that kills the target cell by disrupting
its cell membrane. Alternatively, tumor cell bound C1q can bind to complement
receptors on effector cells (macrophages, NK cells, neutrophils) leading to cell-mediated
tumor-cell lysis or phagocytosis depending on tumor type of effector cell. Subsequent
tumor-cell killing can occur in by complement-mediated cellular lysis (cell-independent)
or complement-mediated phagocytosis (cell-dependent) manner.
A) B) Figure 1.13 Immune Mediated Function of mAb
Binding of mAb with the tumor cell triggering CDC and ADCC activity. (FigA adapted from the Merck
ADCC fact sheet and Fig B adapted from Carter P. 2001)

Page 33 of 235
Antibody Dependent Cellular Cytotoxicity (ADCC) Function:
ADCC is a well-known immune effector mechanism in which antibodies, bound to
antigens on target cells, recruit immune effector cells (eg. Natural Killer Cells) of the
innate immunity to direct the killing of the target cells (Figure 1.13) Natural ADCC is
relevant in protection against various bacterial, parasitic and viral infections and is
considered to correlate to the immune protection in HIV (Ahmad, et al 2001). ADCC
occurs in both malignant and non-malignant conditions. The ADCC process requires the
simultaneously presence of three components:
a) Tumor cells expressing target antigen on its surface
b) Therapeutic antigen-specific MAb
c) FcγR-bearing effector cells (Natural killer cell, monocytes/ macrophage
neutrophils or dendritic cells).
Antibody coated tumor/target cells can be killed by FcγR-bearing cells, such as NK cells,
in ADCC (Steplewski, et al 1983). NK cells express the activation receptor FcγRIIIa
(CD16) on their surface, which recognize and bind to the Fc domains of IgG1 and IgG3
subclasses. The binding cross-links FcγR on the effector cells (NK cells). Consequently,
the NK cells become activated and rapidly kill the tumor/target cells by the release of
cytoplasmic granules containing perforin and granzymes (Figure 1.13). FcγRIIb is an
inhibitory receptor expressed on B-cells and macrophages (but not NK cells) that co-
ligates to FcγRIII activation receptors, leading to inhibition of FcγRIII signaling (Clynes,
et al 2000) thus inhibiting effector cell activation.
The list of therapeutic mAbs have grown to around 30 and is growing at considerable
rate with new and new target been identified.
The therapeutic mAbs and Ab fragments are listed in Table 1.6

Page 34 of 233
Generic Name Brand name Originator Company
Approval date
Antibody Type Isotype Target Production
Host Indication/s
Muromonab-CD3 Orthoclone OKT3 Johnson & Johnson 1986 Murine IgG2a T cell CD3 Receptor Hybridoma Transplant rejection
Abciximab ReoPro Centocor / Lily 1994 Chimeric IgG1 inhibition of glycoprotein IIb/IIIa SP2/0 Cardiovascular disease
Daclizumab Zenapax* PDL/Roche 1997 Humanized IgG1 IL-2Rα receptor (CD25) NS0 Transplant rejection
Rituximab Rituxan, Mabthera Genentech / BiogenIdec 1997 Chimeric IgG1 CD20 CHO
Non-Hodgkin's Lymphoma, Chronic Lymphocytic Leukaemia, Rheumatoid Arthritis, Wegener's granulomatosis, Microscopic Polyangiitis
Basiliximab Simulect Novartis 1998 Chimeric IgG IL-2Rα receptor (CD25) Hybridoma Transplant rejection
Infliximab Remicade Centocor / Scherring 1998 Chimeric IgG1 inhibition of TNF-α
signaling SP2/0
Several autoimmune disorders: Crohn’s Disease, Psoriatic Arthritis, Rheumatoid Arthritis, Ankylosing Spondilytis

Page 35 of 235
Generic Name Brand name Originator Company
Approval date
Antibody Type Isotype Target Production
Host Indication/s
Palivizumab Synagis MedImmune / Astraeneca 1998 Humanized IgG1 an epitope of the RSV
F protein CHO Respiratory Syncytial Virus
Trastuzumab Herceptin Genentech 1998 Humanized IgG1 ErbB2 CHO Breast cancer
Gemtuzumab Mylotarg Wyeth 2000 Humanized IgG4 CD33 CHO Acute myelogenous leukemia (with calicheamicin)
Alemtuzumab Campath Millenium / Genzyme 2001 Humanized IgG1 CD52 Hybridoma Chronic lymphocytic leukemia
Efalizumab Raptiva* Genentech Serono 2002 Humanized IgG1 CD11a CHO Psoriasis
Adalimumab Humira Abbott 2002 Human IgG1 inhibition of TNF-α signaling CHO Several auto-immune disorders
Ibritumomab tiuxetan Zevalin BiogenIdec 2002 Chimeric IgG1 CD20 CHO Non-Hodgkin lymphoma (with
yttrium-90 or indium-111)
Tositumomab Bexxar GlaxoSmth Kline 2003 Murine IgG2a CD20 CHO Non-Hodgkin lymphoma

Page 36 of 235
Generic Name Brand name Originator Company
Approval date
Antibody Type Isotype Target Production
Host Indication/s
Cetuximab Erbitux Imclone / Merck-Serono/BMS 2004 Chimeric IgG1 epidermal growth
factor receptor SP2/0 Colorectal cancer, Head and neck cancer
Bevacizumab Avastin Genentech / Roche 2004 Humanizd IgG1 Vascular endothelial growth factor (VEGF) CHO Colorectal cancer, Age related
macular degeneration (off-label)
Omalizumab Xolair Genentech / Novartis 2004 Humanized IgG1 Immunoglobulin E
(IgE) CHO Mainly allergy-related asthma
Natalizumab Tysabri BioenIdec 2006 Humanized IgG4κ alpha-4 (α4) integrin, NS0 Multiple sclerosis and Crohn's disease
Ranibizumab Lucentis Genentech / Novartis 2006 Humanized
Fab IgG1 Vascular endothelial growth factor A (VEGF-A)
E.coli Macular degeneration
Panitumumab Vectibix Amgen 2006 Human
(transgenic mice)
IgG2 epidermal growth factor receptor CHO Colorectal cancer
Eculizumab Soliris Alexion 2007 Humanized IgG2/4 Complement system protein C5 NS0 Paroxysmal nocturnal
hemoglobinuria

Page 37 of 235
Generic Name Brand name Originator Company
Approval date
Antibody Type Isotype Target Production
Host Indication/s
Certolizumab pegol[19] Cimzia UCB 2008 Humanized
Fab IgG2a inhibition of TNF-α signaling E.coli Crohn's disease
Canakinumab Ilaris Novartis 2009 Human IgG1 IL-1β SP2/0 Cryopyrin-associated periodic syndromes (CAPS)
Ofatumumab Arzerra GlaxoSmith Kline 2009 Human IgG1 CD20 NS0 Chronic lymphocytic leukemia
Golimumab Simponi Jansen 2009 Human IgG1 TNF-alpha inihibitor SP2/0 Rheumatoid arthritis, Psoriatic arthritis, and Ankylosing spondylitis
Catumaxomab Removab Fresenius Biotech / Trion Pharma 2009 Human
trifunctional
IgG2a-Human;
and IgG2b-murine
Human-EpCAM and Human CD3 Quadroma Malignant Ascites
Denosumab Prolia , Xgeva Amgen 2010 Human IgG2 RANK Ligand inhibitor CHO Postmenopausal osteoporosis ,
Solid tumor`s bony metasteses
Tocilizumab (or Atlizumab)
Actemra and RoActemra
Hoffman-La Roche / Chugai 2010 Humanized IgG1 Anti- IL-6R CHO Rheumatoid arthritis

Page 38 of 235
Generic Name Brand name Originator Company
Approval date
Antibody Type Isotype Target Production
Host Indication/s
Belimumab Benlysta GlaxoSmith Kline 2011 Human IgG1λ Inhibition of B- cell activating factor NS0 Systemic lupus erythematosus
Brentuximab vedotin Adcetris Seattle Genetics /
Takeda 2011 Chimeric IgG1 CD30 CHO (Ab conjugate)
Anaplastic large cell lymphoma (ALCL) & Hodgkin lymphoma
Ipilimumab (MDX-101 ) Yervoy Bristol-Myers
Squibb 2011 Human IgG1 blocks CTLA-4 CHO Melanoma
Table 1.6 Therapeutic mAb and antibody fragments approved by US FDA.
* are molecules withdrawn from market.
# approved in Europe but not yet in US.

Page 39 of 233
In the present scope of work Anti-EGFR mAb was taken as a molecule to study its
expression in Chinese Hamster Ovary (CHO) cells and compare the product quality with
the product expressed in SP/0 cells by the originator company with Brand Name
Erbitux® (Cetuximab).
1.7. Epidermal Growth Factor Receptor Biology Substantial progress has been made over the last several decades in understanding
specific cellular, molecular and genetic mechanisms that contribute to cancer growth and
progression. Amongst several target to hit to control cancer progression, one most
promising anti-cancer treatment identified is inhibition of Epidermal Growth Factor
Receptor (EGFR).
The EGFR family consists of four transmembrane receptors, including EGFR
(HER1/erbB-1), HER2 (erbB2/neu), HER3 (erbB3) and HER4 (erbB4) (Yarden 2001).
EGFR is a 170 kDa transmembrane protein comprising an 1186 amino acid peptide chain
(Schlessinger 1988) and is composed of three domains, extracellular ligand-binding
domain, a trans-membrane lipophilic region and an intracellular protein tyrosine kinase
domain (Figure 1.14:). The extracellular binding domain on the cell membrane is
connected to intracellular machinery that possesses the tyrosine kinase activity via a
single hydrophobic membrane (Carpenter and Cohen 1990).
Seven genetically distinct ligands – EGF, transforming growth factor-α (TGF-α),
heparin-binding EGF, amphiregulin, betacellulin, epiregulin and neuregulin G2β – have
been shown to be capable of binding with EGFR (Wantanbe, et al 1994; Toyoda, et al
1997; Wells 1999). Binding of ligand to erbB / EGFR receptor triggers dimerization of
neighboring receptors, formation of receptor homodimers and / or heterodimers, and
internalization (Yarden 2001; Wiley 2003). This in turn activates the intrinsic receptor
tyrosine kinase domain. Protein phosphorylation and dephosphorylation, catalyzed by
protein kinases (such as tyrosine kinase) and protein phosphatases respectively, represent
fundamental biochemical events for subsequent intracellular signal transduction (Qu
2002). Autophosphorylation of tyrosine residues within the C-terminal tail of EGFR in
the cytoplasm (Cohen 2003) following EGFR tyrosine kinase activation initiates a
cascade of intracellular signaling pathways (Carpenter and Cohen 1990). The receptor

Page 40 of 235
tyrosine kinase signal can be terminated by endocytosis of the phosphorylated receptor-
ligand complex (Yarden 2001).
Figure 1.14 Schematic representation of the four erbB family member and their ligand. Numbers denote the degree (expressed as a percentage0 of homology relative to ErbB1/EGFR. With the
exception of the kinase-deficient ErbB3, there exists a high degree of homology in the tyrosine kinase
domain (Harari, et al 2003)
The EGFR downstream intracellular signal transduction pathways include components of
the Ras/mitogen activated protein kinase (MAPK), phosphatidyl inositol 3-kinase, signal
transducer and activator of transcription, downstream protein kinase C and
phospholipase D pathways (Wells 1999, Carpenter 2000, Grant, et al 2002) Some of
these pathways serve to attenuate receptor signaling (Wells A., 1999). The interaction of
EGFR system and the Ras/MAPK cascade, one of the major signaling routes (Alroy and
Yarden 1997), and its downstream effects on the cell-cycle machinery is depicted in
lucid manner in Figure 1.15. A comprehensive description of ErbB signaling pathways
was described by Yarden and Sliwkowski (2001). The integrated biological responses to
EGFR signaling are pleiotropic which include mitogeneiss, apoptosis, altered cellular
motility, protein secretion and differentiation or dedifferentiation (Wells 1999).

Page 41 of 235
Activation of the EGFR under abnormal circumstance stimulates tumor growth and
progression, including the promotion of proliferation, angiogenesis, invasion, metastasis
and inhibition of apoptosis (Salomon, et al 1995; Wells 1999; Woodburn 1999). EGFR is
widely expressed by many cell types, including those of epithelial and mesenchymal
lineages (Wells 1999). However, there is variability regarding the reported incidence of
overexpression or dysregulation of EGFR in human malignancies (Nicholson, et al 2001;
Arteaga, 2002). For example, some reports describe EGFR expression as being
dysregulated in at least 50% of human epithelial tumors (Aaronson, 1991; Earp, et al
2003; Grunwald and Hidalgo 2003), while more conservative estimates suggest that one-
third of epithelial malignancies express high-levels of EGFR (Mendelsohn 2001). This
variability may be partially attributable to a lack of standardization in quantitation
methodology, using either using simple immunohistochemistry or more sophisticated
fluorescence in situ hybridization techniques. Overall, it does appear that many of our
most common human epithelial cancers richly express the EGFR.
Figure 1.15 Simplified representation of EGFR pathways.
The potential downstream cellular and tissue effects of EGFR signaling inhibition are highlighted. The
action site for EGFR inhibitors is depicted for mAbs and TKI (Harari and Huang 2001) TKI, Tyrosine
Kinase I

Page 42 of 235
In colorectal and, head and neck cancer, the vast majority of tumors are strongly EGFR-
positive (Mendelsohn 2001). In addition to this studies have shown that EGFR
overexpression in bladder, brain, breast, cervical, uterine, colon, esophageal, glioma,
non-small cell lung cancer (NSCLC), ovarian, pancreatic and renal cell cancers
(Nicholson, et al 2001; Herbst 2002, Mendelsohn and Baselga 2003).
Various labs are involved in the development of molecules targeted to EGFR, but the
most promising work came from the M.D. Anderson Cancer Centre where Dr. John
Mendelsohn developed chimeric monoclonal antibody directed against EGFR. This
mAb was further developed by ImClone/Bristol Myer’s Squibb Institute for human use.
mAbs directed against EGFR have the following mechanisms of action: (i) extra-cellular
binding; (ii) internalization of receptor-antibody complexes; (iii) inhibition of EGFR
signaling pathways; and (iv) potential stimulation of an immunological response.
Several mAbs are in various stages of clinical development as listed in Table 1.7:
Generic / Trade Name Type Institution
Cetuximab / Erbitux
(Approved) Chimeric IgG1
ImClone/Bristol Myer’s
Squibb / Merck KGaA
Panitumumab/Vectibix
(Approved) Fully human IgG2 Abgenix / Amgen
- Humanized IgG1 EMD Pharma/Merck KGaA
HuMab-Mouse Humanized, bispecific:
EGFR/FcR1 Medarex.Merck KGaA
Nimotuzumab/ TheraCIM
(Approved) Humanized YM Biosciences / CIM
- Anti-EGFR VIII Ludwig Institute
Table 1.7 List of anti-EGFR mAbs in development
The focus of this work is on the development of anti-EGFR mAb, Cetuximab, hence its structure and
functions are described below.

Page 43 of 235
1.8. Cetuximab: An Anti-EGFR Monoclonal Antibody
The generic name of chimeric anti-EGFR mAb is Cetuximab market by Imclone / Bristol
Myers Squibb in US and European market which in other countries marketed by Merck-
Serono with a brand name Erbitux®. Cetuximab is an IgG1 human/mouse chimeric
monoclonal antibody (mAb) with kappa light chain that is specific against the epidermal
growth factor receptor (EGFR). In February 2004, the U.S. Food and Drug Association
(FDA) approved Cetuximab for use in patients with metastatic colorectal cancer
(Ciardiello, et al 2005). European-wide approval followed in June 2004. In March 2006,
FDA again approved Cetuximab for the treatment of head and neck cancer (Conley
2006). In India the approval came in 2007. Cetuximab is now approved in more than 40
countries, and thousands of patients have been treated with this drug. The efficacy and
safety of this drug have been proved to be excellent in a series of clinical trials that
included patients with not only metastatic colorectal cancer but also advanced cancers
such as head and neck cancer (Zhou, et al 2007). But, a high prevalence of
hypersensitivity reactions has been reported which is correlated with IgE antibodies
levels in the patients. The mechanism to hypersensitive reactions was found to be
associated with the presence of galactose-α1, 3-galactose processed on the terminal N-
linked glycosylation on Fab region. This is due to the fact that Cetuximab is produced in
murine SP2/0 cell line, which expresses α1, 3-galactosyltransferase (Platts-Mills, et al
2008). In a vision to get reduced hypersensitivity reaction, the Cetuximab is cloned in
CHO cells which is do not have α1,3-galactosyltransferase but, α2,3-
galactosyltransferase and it do not generate IgE hypersensitive reaction.
Target mAb Type Indications Selected Side Effects
EGFR Panitumumab Fully
Human
Monotherapy for EGFDR-
positive metastatic
colorectal carcinoma with
non-mutated (wild-type)
KRAS after failure of
conventional chemotherapy
Infusion reactions
Skin rashes in most patients
(90%)
Diarrhoea (60%), nausea
and vomiting
Hypomagnesaemia (2%)

Page 44 of 235
Cetuximab Chimeric
EGFR-positive metastatic
colorectal cancer
Squamous cell carcinoma of
head and neck
Severe infusion reactions
IgE aginst oligosaccharide
and HAMA
Urticaria and dermatological
toxicity
Bronchospasm and
pulmonary toxicity
Hypomagnesaemia
Trastuzumab Humanized ERBB2-positive breast
carcinoma
Hypersensitivity and
infusion reactions
Cardiotoxicity with
anthracyclines
Skin reactions
Pulmonary toxicity
Hypomagnesaemia
Table 1.8 Side Effects of different anti-EFGR mAbs. (Adapted from Hansel, et al 2010)
Cetuximab is produced in the SP2/0 mammalian (murine myeloma) cell line. The
molecular weight is approximately 152 kDa. It has potentially 3 N-linked glycosylation
sites at Asn43 of the light chain and at Asn88 and Asn299 of the heavy chain. This is a
unique IgG1 molecule amongst all the therapeutic IgGs available as of today in the sense
that it possesses two N-linked glycosylation sites on the heavy chain (Figure 1.16The N-
linked glycosylation in the framework-3 of the variable (Fv) region is at site Asn88-Asp-
Thr-Ala. The other site is within the CH2 domain at Asn299-X-Ser/Thr of the heavy
chain which is generally at Asn299 for IgG1. In contrast, the glycosylation site at Asn43 is
not glycosylated (Platts-Mills, et al 2008). As depicted in a schematic diagram of
Cetuximab in Figure 1.16, these oligosaccharides located at the two sites are a complex
mixture of different glycans, making them challenging for structural characterization
(Zhou, et al 2007).

Page 45 of 235
Figure 1.16 A typical structure of anti-EGFR mAb.
The shadowed red areas represents the Asn88 linked and purple area represents Asn299 N-linked
glycosylation site unique to this antibody.
A typical structure of N-linked glycan structure at Asn297/ Asn299 is represented in Figure
1.17. The number attributes only sugars that have been observed in the electron density.
The sugars in bold belong to the oligosaccharide core which is found in all naturally
occurring glycoforms, the addition of the other sugar residues is variable. The
biantennary mannose residues Man5 and Man8 that are glycosidically linked to Man4
form α (1-6) and α (1-3) arms, respectively. In case of the Asn88 of Cetuximab available
similar structure is reported except that at the end of α (1-3) arm a instead of Gal-NeuAc,
Gal-NGNA is observed. Human cells cannot synthesize a terminal Gal-α1-3Gal motif
(known as alpha-Gal) on N-glycans. As a consequence, they express antibodies against
this structure (Galili 2004). Second, unlike other mammals, humans cannot biosynthesize
the sialic acid Neu5Gc because the human gene CMAH, encoding Cytidine
monophasphate-N-acetylneuraminic acid hydroxylase (CMAH), the enzyme responsible
for producing CMP-Neu5Gc from CMP-N-acetylneuraminic acid (CMP-Neu5Ac), is
irreversibly mutated (Varki 2007 and Ghaderi, et al 2010).

Page 46 of 235
Figure 1.17 The carbohydrate sequence attached to Asn297 of human IgG1-Fc.
The detailed sugar molecule linked to core residue is represented Numbers attributes only sugars that have
been observed under electron density. The biantennary mannose residues Man5 and Man8 that are
glycosidically linked to Man4 form the (1-6) and (1-3) arms, respectively. The forms without terminal
galactose (G0F), with one galactose on each arm (G1F) and two galactose on both the arms (G2F) are
represented. Adapted from Sondermann, et al 2003
Traditionally, cytotoxic therapies are used to cure cancer however, these therapies do not
discriminate between tumor and host cells, and hence considerable interest was generated
in 1990s in developing new agents to improve the outcome of patients with solid tumors.
Furthermore, the cytotoxic agents are generally effective against rapidly dividing
neoplasms. In addition, tumor resistance may develop. The lack of specificity and limited
efficacy of traditional cytotoxic agents has led to the rational design and development of
targeted therapies that aim to differentiate between malignant and nonmalignant cells,
thereby producing a higher therapeutic index and less toxicity than conventional
therapies (Ciardiello and Tortora 2001). In order to develop target specific agents, it is
necessary to identify the aberrant biochemical and molecular pathways that distinguish
malignant cells from nonmalignant cells. The cell membrane receptors control generally
controls the intracellular signal transduction pathways regulating cell proliferation and
apoptosis, angiogenesis, adhesion, and motility which decides the growth and
progression of non-malignant as well as tumor cells (Ciardiello and Tortora 2001). One
such cell membrane receptor is the epidermal growth factor receptor (EGFR), which has
been shown to play an important role in the growth and survival of many solid tumors.
G2F G1F G0F
Page 47 of 235
Pathways involved in EGFR signal transduction have been proposed as possible
anticancer targets, and agents to specifically target the EGFR have been developed.
Cetuximab is an antineoplastic factor used for the following indications:
a. Refractory metastatic colorectal cancer
b. Squamous cell carcinoma of Head and Neck Cancer
c. Pancreatic cancer (Abbruzzese, et al 2004).
1.9. Objectives Cetuximab is produced by SP2/0 cells by the originator company. The mAb is unique
amongst the mAbs listed in Table 1.6 because of the fact that it possesses two
glycosylation site one in Fc domain and other Fab region. As described earlier, because
of α1-2 linkage of galactose in the Fab motif, it induces anti-IgE response in humans
(Platt-Mills, et al 2008). For avoiding this α1-2 linkage, the study of producing
Cetuximab in CHO cells which will process α2-3 linkage was undertaken. Hence, the
objective of study was laid down to clone and express Cetuximab in alternate host that is
CHO. The study is covered under the following chapters:
1. Cloning and expression of biosimilar anti-EGFR antibody in an alternate host (SP2/0
CHO)
a. Recombinant vector construction for expression in SP2/0 and CHO cells
b. Cell Line Development: Transfection, clone screening and clone stability studies.
2. Final Clone Selection
a. Selection of the lead clone based on productivity and quality attributes
b. Establishment of platform evaluation methods for screening of recombinant
clones expressing anti-EGFR monoclonal antibody.
3. Upstream process development for improving expression of recombinant anti-EGFR
monoclonal antibody in shake flasks.
4. Characterization of the expressed anti-EGFR mAb.

Page 48 of 235
1.10. Work Plan
Literature search and identification of authentic cDNA Sequences
Analytical Testing • PAGE • IEF, • Western, • ELISA, • HPLC, • In-vitro Bioassay • Mass Spectrometry
Product Characterization & Comparison with RMP
Classical Approach Integrated Approach
Selection of Transfection mode in SP2/0 and CHO cells
Single Cell Cloning (LD) & Serum Free Adaptation
Evaluating: • Modified Expression Vector • Gene Amplification Marker • Automated vs Manual Clone selection
Evaluation and final shortlisting of clones
Minipools Generation and Evaluation
Preliminary Upstream Process Development
Preliminary Down Stream Process Development
Research Cell Bank & characterization
Clone Stability Studies
Final Clone Selection
Using commercially available mammalian expression vectors (e.g. pcDNA3)
Manual Dilution Method Dilution Using Automated Equipment
Synthesis of cDNA Sequences
Optimization of sequence for expression in mammalian cell line

CHAPTER 2
MATERIAL AND METHODS

Page 50 of 235
2.1. Materials Standard Chemicals and Reagents used frequently are summarized below or described as
appropriate. Listing is based on the category of chemicals, reagents and materials:
2.1.1. Chemicals and Reagents 2-Mercaptoethanol, Sigma, Cat# M7154
2-propanol, Sigma, Cat# 19516
Acetic Acid, MERCK, Cat # AC9A590101
Acetone, Sisco, Cat # 129135
Acrylamide-99%, Sigma Cat# A3553
Acetone, SISCO, Cat# 129135
Acetonitrile, MERCK, Cat# 61803025001730
Agarose, Sigma, Cat# A9539
Agar Powder, Sigma, Cat# A5306
Ampicillin powder, Sigma, Cat# A0166
Ammonium per sulfate, Sigma, Cat# A9164
Bromophenol blue sodium,Sigma, Cat# B8026-25G
Brilliant Blue R250, Sigma, Cat# B7920
Bovine Serum Albumin, AMRESCO, Cat# 332
Bisacrylamind, Sigma, Cat# M7279
Butanol, MERCK, Cat# 61775805001730
Citric Acid, Sigma, Cat# C0759
Chloroform, SIGMA, Cat# C2432
Calcium chloride, Merck Cat# 10238205001046
Dextran Sulphate, AMRESCO, Cat# AM-0198
Di-methyl Sulfoxide (DMSO) – Sterile, Sigma, Cat# 673439
EDTA, Tetrasodium salt, Sigma, 03695-250G
Ethyl alcohol 99% , Changshu yanguan chemical , GB678-2002
Ethyl alcohol 99% , Jiangsu Huaxi international, 100202
Ethidium bromide, Sigma, Cat# E7637
Glutamine-(non-animal source), Sigma, Cat# G8540
Glucose, Sigma, Cat# G7021
Glycerol, Sigma , Cat# G5516-1L
Glycine, Fluka, Cat# G8898-1KG
Hydrochloric acid 35%, Merck, Cat# 61762525001730
Isopropyl alcohol, SISCO, Cat# 92956

Page 51 of 235
Magnesium chloride, Sigma, Cat # M8266-100G
MES , SIGMA, Cat # M3671
Methanol, Merck, Cat # GR 60600925001730
OPD: SIGMA, (Tablet), Cat no-P-5412, Lot no-077K-8225
PhastGel Dry IEF, GE healthcare, Cat# 17-0677-01
Ponceau stain, HIMEDIA, Cat# RM977
Protein Assay Solution, BIO-RAD, Cat# 500-0006
Skimmed Milk, DIFCO-BD, Cat# 232100
Sodium Acetate Anhydrous, SISCO, Cat# 1944117
Sodium chloride, MERCK, Cat# 60640450001730
Sodium dodecyl sulphate, SIGMA, Cat# L4390
Sodium hydroxide, SIGMA, Cat# S5881
Sodium pyruvate, SIGMA, Cat# P5280
TEMED, SIGMA, Cat# T 9281
Transfection Reagents
o Turbofect in vitro Transfection Reagent, MBI Fermentas, Cat# R0531
o Lipofectamine-2000 Transfection Reagent, Invitrogen, Cat# 11660-019.
o TransIT 2020 Transfection Reagent, Mirus Bio LLC, Cat # MR5404.
Triton X 100, Sigma Cat # T8787-250ML
Trizma base, Sigma, Cat # T6066-1KG
Tryphan blue, Sigma, Cat# T6146
TWEEN-20, Sigma, Cat# P1379
TMB, Sigma, Cat# T0440 OR Vector Inc., Cat# SK-4400
Urea, Sigma, Cat# U5378
Xylene Cyanol, Sigma, Cat# X-4126.
Pharmalyte (pH 3-10), GE, Cat # 170456.01
IEF Dry Gel, GE, Cat # 57-6781-00.
2.1.2. Markers and Enzymes DNA and Protein Ladder:
GeneRuler 1 Kb DNA Ladder, MBI-Fermentas, Cat# SM0313
λ-DNA/EcoRI + HindIII, MBI-Fermentas, Cat# SM0193
GenRuler 100 bp+ DNA Ladder, MBI-Fermentas, Cat# SM0321
Prestained SDS-PAGE Standards, BioRad, Cat# 161-0318
Precision Plus Protein Unstained Standards, BioRad, Cat# 161-0363

Page 52 of 235
Prestained SDS-PAGE Standards, low range, BioRad, Cat# 161-0305
Precision Plus Protein All Blue Standards, BioRad, Cat# 161-0373
Unstained Protein Molecular Weight Marker MBI-Fermentas, Cat# SM0431
PageRuler Unstained Protein Ladder, MBI-Fermentas,Cat# SM0661
PageRuler Prestained Protein Ladder, MBI-Fermentas,Cat#SM0671
IEF Marker, GE, Cat # RPN800E
Restriction enzymes:
Generally all the restriction enzymes used are from New England Biolabs, UK except
where stated.
BglII (Cat# R0144S) , NheI (Cat#R131S), PvuI (Cat # R0150L), XmaI (Cat# R0180L),
BstB1 (Cat# R0519S), BamHI (Cat# R0136S), KpnI (Cat# R0142S), NcoI (Cat#
R0193S), PstI (Cat# R0140S), PvuII (Cat# R0151S), XbaI (Cat# R0145S), XhoI (Cat#
R0146S), SalI (Cat# R0138S), AatII (Cat# R0117S), NdeI (Cat# R0111L), NotI (Cat#
R0189S), AflII (Cat# R0520S) HindIII (Cat# ER0505), EcoRI (Cat# ER0275),
FastDigest HindIII (Cat# FD0508), FastDigest NdeI (Cat # FD0588), FastDigest BglIII
(Cat# FD0084)
Enzymes and Other Reagents:
Taq DNA Polymerase, Banglore Genei, Cat# MME5J
Taq DNA Polymerase, recombinant, MBI-Fermentas, Cat# EP0404
Phusion Pfu polymerase, Finnzymes, Cat# F-530S
Pfu Turbo DNA Polymerase, Stratagene, Cat# 600250-52
DNA Polymerase (Klenow), NEB, Cat #M0210S
Alkaline Phosphatase (Calf Intestinal), Promega, Cat# M182A
T4 DNA Ligase, NEB, Cat# M0202S
T4 DNA Ligase, MBI-Fermentas, Cat# M0202S
dATP, MBI-Fermentas, Cat# N0440S
dTTP, MBI-Fermentas, Cat# N0443S
dGTP, MBI-Fermentas, Cat# N0442S
dCTP, MBI-Fermentas, Cat# N0441S
Papain Carica Papaya, Merck, Cat# 5125
Pepsin, Merck, Cat# 1071850100

Page 53 of 235
Endoproteinase Lys-C, Sigma, Cat# P3428
Pfu Pyroglutamate Aminop, Takara, Cat# TAK 7334
PNGase, Prozyme, Cat # GK80110
2.1.3. Antibodies Monoclonal Anti-human IgG (Fc Specific.)-M, Sigma, Cat# I6260
Polyclonal Anti-Human (Fc Specific)-R, Sigma, Cat# I9135
Antihuman Kappa Light Chain HRP Conjugate, Sigma, Cat # A7164
2.1.4. Reference Medicinal Product The anti-EGFR monoclonal antibody, Erbitux® available from Merck was used as
Reference Medicinal Product (RMP).
2.1.5. Commercial Kits LookOut Mycoplasma PCR detection Kit, Sigma, Cat# MP0035
EZ-PCR Mycoplasma Test Kit, Biological Industries, Cat# 20-700-20
Qiagen Plasmid Midi Kit , Qiagen, Cat#12145
Wizard® Plus SV Minipreps DNA Purification System, Promega, Cat # A1460
GenElute Gel Extraction Kit, Sigma, Cat# NA1111
QIAquick Gel Extraction Kit, Qiagen, Cat# 28704
PureLink™ Genomic DNA Mini Kit, invitorgen, Cat # K1820-01
GeneJET™ Plasmid Miniprep Kit, MBI-Fermentas, Cat# K0502
QIAprep Spin Miniprep Kit, QIAGEN, Cat# 27106
PureYield™ Plasmid Midiprep System, Promega Cat# A2492
RNeasy Mini Kit, Qiagen, Cat# 74104
HiTrap MabSelect, GE Healthcare, Cat# 28-4082-53
MabSelect SuRe Resin, GE Healthcars, Cat# 17-5438-01
OneStep RT-PCR Kit, Qiagen, Cat# 210212
IEF calibration kit (pI 3-10) GE healthcare, Cat#17-0471-01

Page 54 of 235
2.1.6. Primers The list of primers is given in Table 2.1.1:
S.No. Gene Location Purpose Primer Sequence
SR-171
CMV
Promoter
For Amplifying
CMV Promoter 5'-GATGCGGCCGCCCCGATCCCCTAT-3'
SR-172
CMV
Promoter
For Amplifying
CMV Promoter 5'-AGTGGATCCCAGCTTGGGTCTCC-3'
SR-173 E18 8731 For Sequencing 5’- GGGTTATTGTCTCATGAGCGGA-3'
SR-174 E18 1074 For Sequencing 5'-CCAGTGGATGTTGGTGCCGAT-3'
SR-175 E18 1192 For Sequencing 5'-TCAACTCCGTGGAATCCGAG-3'
SR-176 E18 1494 For Sequencing 5'-CAGGGAGTAGGTGCTGTCCTT-3'
SR-177 E18 1582 For Sequencing 5' -TGACCAAGTCCTTCAACCGG-3'
SR-178 E18 2789 For Sequencing 5'-CGGACACGGTACAGGTGAT-3'
SR-179 E18 3012 For Sequencing 5-CCTACTATGACTACGAGTTCGC-3'
SR-180 E18 3200 For Sequencing 5-CAGAGTTCCAGGACACGGTCA -3'
SR-181 E18 3522 For Sequencing 5'-CGAGGACCCTGAAGTGAAGTT-3'
SR-182 E18 4244 For Sequencing 5'-CCCCCAGAATAGAATGACACCT-3'
SR601
CMV
Promoter For Sequencing 5’–CGCAAATGGGCGGTAGGCGTG-3’
Table 2.1.1 List of Primers used during the cell line development activity
Note: The primers were synthesized from Sigma-Aldrich. Generally 5µM of primers
were used in PCR reactions unless stated otherwise
2.1.7. Vectors, Cells and Cell Lines pcDNA-3.1(-), Invitrogen, Cat# V795-20
GeneArt Vectors: pMAT E18_L1 (bearing Light Chain) and pGA E18_H1
(bearing Heavy chain) were chemically synthesized from GeneArt (Invitrogen),
Germany.
E.coli DH5- cells, MTCC, Cat# 1652
Chinese Hamster (Crisetulus griseus) Ovary Cells (CHO), Invitrogen, Cat#1169-
012
SP2/0 -Ag14 (myeloma) cells, ATCC, CRL- CRL-1581
A431NS, Human Epidermoid Carcinoma Cell Line, ATCC, CRL-2592

Page 55 of 235
2.1.8. Media and Supplements Bacteriological Media and Supplements
Agar (Bacteriological), Sigma, Cat# A5306
Selected Soytone, DIFCO-BD, Cat# 212488.
Yeast Extract, DIFCO-BD, Cat# 212750.
Luria-Bertanii Broth, HIMEDIA, Cat# M1245
Cell Culture Media & Supplements
The Basal Media and Feed Media used are listed later in Table 2.1.2 and 2.1.3
respectively.
L-Glutamine, SIGMA, Cat# G8540
D-Galactose, SIGMA, Cat# G5388
Pluronic F68, SIGMA, Cat# P1300
RPMI 1640, SIGMA, Cat# R8758 OR Hyclone, Cat# SH30027
Dimethyl Sulphoxide (DMSO), Sigma, Cat# D2650
HT supplement ( 100x), Gibco/Invitrogen , Cat# 11067-030
MTX ( Methatraxate), SIGMA, Cat# M8407
MSX (Methionine Sulphoxamine), SIGMA, Cat# M5379
Foetal Bovine Serum, SIGMA, Cat# F2442;
Qualified FBS, Australia, GIBCO, Cat# 10099-133
Foetal Bovine Serum, Euroclone, Cat# ECS150L.
Penicillin- Streptomycin Solution, SIGMA, Cat #P0781
Hygromycin, GIBCO/INVITROGEN, Cat# 10131-035
Recombinant Trypsin, Cascade Biologics, Cat# R-009-50
Cell Dissociation Soln (Non-enzymatic), BIOLOGICAL Ind., Cat# 03-071-1C
MEM Amino acid Non-Essential, SIGMA, Cat# M7145
Geneticin G418, SIGMA, Cat# A1720.
Dulbecco’s Modified minimal essential media, SIGMA, Cat # D5523
RPMI-1640, SIGMA, Cat # R6504.
2.1.9. Consumables Labtip Blue (200-1000ul), THERMO SCIENTIFIC, Cat# 94300220
Shake Flask 125mL, NALGENE, Cat# 4115-125
Cryovials, NUNC, Cat# 368632
Gene pulser cuvette 0.2cm, BIO-RAD, Cat# 165-2086
Shake Flask 250mL, NALGENE, Cat# 4115-125

Page 56 of 235
Shake Flask 125mL, NALGENE, Cat# 4115-250
Tissue Culture Flask 25 cm2 CORNING, Cat# CLS430639-200EA
Tissue Culture Flask 75 cm2, CORNING, Cat# CLS430641-100EA
6-WELL Tissue Culture Flask, CORNING, Cat# CLS3506-100EA
12-WELL Tissue Culture Flask, CORNING, Cat# CLS3512-100EA
96-WELL Tissue Culture Flask, CORNING, Cat# CLS3599-100EA
Serological pipette(Disposable) 5mL, BD, Cat# REF-357543
Serological pipette(Disposable) 10mL, BD, Cat# REF-357541
Serological pipette(Disposable) 25mL, BD Cat# REF-357525
Erlenmeyer Flask (Disposable) 125 mL, Corning, Cat# 431143
Erlenmeyer Flask (Disposable) 500 mL, Corning, Cat# 431145
Sterilization grade 0.2 µ filters of different sizes, Sartorius / Millipore / MDI
2.1.10. Equipments pH meter (Lab-India)
UV Visible single beam spectrophotometer (Eppendorf)
Laminar flow (Esco)
Bacteriological incubator (37 °C) (Memmet)
Autoclave (Medical)
Gel doc XR system (BioRad)
Ultra freezer (-80 °C) (New-Brunswick scientific)
Magnetic stirrer-cum hot plate (Schott)
Vortex (Sphinix)
Refrigerator (Samsung)
Gel dryer (Amersham)
Incubator shaker, refrigerated (Kuhner)
CO2 Incubator, NuAir / Thermo
CO2 incubator shaker (Kuhner) and NuAir
Bioreactor, 2L, 20L, Model Biostat B Plus, B-Braun Sartorius
Trans blot SD - Cell (Bio-Rad)
Electrophoresis Apparatus (Bio-Rad)
Electrophoresis Power Pack (Bio-Rad)
Macro Centrifuges (Thermo Scientific)
Ultra Rocking Platform Shaker (Bio-Rad)
Weighing Balance (Sartorious)
Peristaltic Pump (Pharmacia biotech)

Page 57 of 235
Vacuum Pressure Pump ( Pall-Lifesciences)
Microwave oven (LG)
Master cycler gradient PCR machine (Eppendorf)
Pipettes P2.5, P20, P200, P1000 (Eppendorf)
Dispenser (Eppendorf)
Milli-Q water purification system (MilliQ)
Water bath (Julabo)
Ice making machine (Icemate)
Phast IEF System, GE
Agilent HPLC Series 1100 / 1200
Plate Reader, BioTek Instruments, Model - Synergy HT
SYNAPT HDMD Mass Spectrometry, Waters.
Procise 492, ABI Biosystems
2.1.11. Softwares: PlasMapper
NEB RE Cutter
PLA2.0®
2.2. Buffers and Media Preparation
2.2.1. Competent Cell Preparation 1. CaCl2 (0.1 M )
2.940 g of CaCl2 (Mol. Wt. - 147.02) was dissolved in 150 mL of MilliQ / WFI.
The final volume was made up to 200 mL.
General usage: For competent cells preparation
Sterilization: Autoclaved at 121 psi for 15’
Storage: 4 °C
2. 0.1 M CaCl2 + 15% Glycerol
15 mL of 100 % glycerol was added in 85 mL of 0.1 M CaCl2 solution (prepared
above).
General usage: For washing cell pellet for competent cells preparation.
Sterilization: Autoclaved at 121 psi for 15 min
Storage: 4 °C

Page 58 of 235
2.2.2. Glycerol Bank preparation 1. Glycerol (50%):
50 mL of glycerol was added in 50 mL 0f autoclaved MilliQ / WFI and final
volume was made up to 100 mL.
General usage: As a cryoprotectant for competent cells
Sterilization: Autoclaved at 121 psi for 15’
Storage: 4 °C
2.2.3. Bacteriological Media 1. SY - Media
This media contains 1.6% selected Soytone, 1.0% Yeast extract.
4.0 g of Soytone and 2.5 g yeast extract was dissolved in ~200 mL of WFI /
MilliQ. The final volume was made up to 250 mL with WFI / MilliQ.
The media was sterilized by autoclaving at 15psi at 121 0C for 15 min.
For preparing agar plates, 3.75 g of agar (1.5% agar) in 250 mL SY broth was
added before sterilization.
The media can be warmed if necessary to dissolve the completely.
2.2.4. Cell Culture Media Note: All the cell culture media and supplements were filter sterilized using 0.2µ
filter before using.
1. Growth Media for CHO-S cells:
DMEM powder (13.4 g) was dissolved in 800 mL of WFI / MilliQ after which
3.7 g/L sodium bicarobonate was dissolved. The pH was adjusted to 7.2 by
addition of 5N HCl. The total volume was made up to 1000 mL with WFI /
MilliQ. Subsequently, 10% Foetal Bovine Serum, 1x HT supplements (from
100x), 1x MEM Non-essential amino acid mix (from 100x), 4 mM glutamine
(from 200 mM stock) and 1x Penicillin -Streptomycin solution (from 100x) was
added and filter sterilized.
This media was used for growing cells before and during transfection. The cells
were later adapted to chemically defined media as follows:
In 1000 mL of CD-CHO (liquid), 4mM Glutamine, 1x HT supplements, 1x MEM
Non-essential amino acid mix, 10 µg /mL Dextran Sulfate, 1x Penicillin -
Streptomycin solution was added.
Similarly, the media used during the upstream process development at shake
flask were prepared with HT supplements, MEM Non-Essential amino acid,
Dextran sulfate and Penicillin- Streptomycin solution.

Page 59 of 235
2. Growth Media for SP2/0 cells:
RPMI-1640 + 10% Foetal Bovine Serum + 1 mM Sodium Pyruvate + 0.4 g/L
glucose.
3. Cryopreservation Media:
The cell line specific cryopreservation media was prepared by addition of DMSO
at rate of 10% in the respective growth media.
4. Feed Media :
All the liquid form feed media listed in Chapter 5 were prepared as per the
supplier’s instruction and then addition of Penicillin-Streptomycin solution was
done.
2.2.5. Electrophoresis Buffers & Reagents 1. SDS 20 %
Procedure: In ~ 75 mL of warm WFI / MilliQ, 20 g of SDS (Mol wt:-288.38) was
dissolved. The final volume was made upto 100 mL.
General usage: 100 mL (for SDS-PAGE GEL Preparation)
Sterilization: NA
Storage: RT
2. Ammonium Persulphate (10 %)
Procedure: 1 g of Ammonium Persulphate (Mol wt.:-228.2) was dissolved in 10
mL MilliQ.
General usage: 10 mL (for SDS-PAGE Native and Reducing Gels).
Sterilization: NA
Storage: 4 °C for not more than 24 hrs.
3. Acrylamide: Bis acrylamide ( 29:1 )
Procedure: 29 g of Acrylamide (Mol wt.:-71.08) and 1 g of Bis-acrylamide (Mol
wt.:- 154.17) was dissolved in 50 mL of WFI / MilliQ in a 250 mL beaker
wrapped with aluminium foil. The final volume was made up to 100 mL and
filtered through Whatman filter paper.
General usage: SDS-PAGE and Native gels
Sterilization: NA
Storage: 4 °C

Page 60 of 235
Precaution: Neurotoxic. Wear gloves and facemask while handling.
4. Tris –Cl pH 8.8 (1.5 M)
Procedure: 182.1 g of Trizma base (Mol. Wt. - 121.14) was dissolved in 500 mL
of WFI / MilliQ. The pH was adjusted to ~8.8 with conc. HCl. The final volume
was made up to 1 L. Autoclaved and stored at RT.
General usage: For Resolving PAGE
Sterilization: Filtered through 0.45 µm filter.
Storage: RT
5. Tris –Cl pH 6.8 (1 M )
Procedure: 121.14 g of Trizma base (Mol. Wt. - 121.14) was dissolved in 500 mL
of MilliQ. The pH was adjusted to ~6.8 usin conc. HCl. The final volume was
made up to 1 L. Autoclaved and stored at RT.
General usage: For stacking gel of PAGE.
Sterilization: Filter through 0.45 µm filter.
Storage: RT
6. Saturated Butanol (50%).
Procedure: The butanol was diluted 1:1 (50 ml + 50 mL) in WFI/MilliQ and
stirred for 30 min on magnetic stirrer. When the distinct layers appears, the upper
layer was transferred to other bottle. This was used to overlay on polyacrylamide
gels.
General usage: Overlay on the resolving PAGE to make surface even
Sterilization: NA
Storage: RT
7. 10 X SDS-Tris Glycine Buffer:
Procedure: 30.3 g of Trizma base (Mol. Wt.-121.14), 144 g of glycine (Mol .Wt -
75.07) and 10 g of SDS was dissolved in 850 mL of warm MilliQ. The final
volume was made up to 1 L.
General usage: Running of SDS-PAGE
Sterilization: NA
Storage: RT

Page 61 of 235
8. Coomassie Blue Staining
Fixing Solution:
COMPONENT VOLUME
Methanol 500 mL
Glacial acetic acid 100 mL
WFI 400 mL
Total 1000 mL
Storage: RT
General usage: Fixing protein on PAGE / IEF for staining.
Staining Solution:
COMPONENT VOLUME
Methanol 50 mL
Glacial acetic acid 10 mL
WFI 40 mL
Coomasie Blue R 250 0.1 g
Total Volume 100 mL
*100 mL of fixing solution could be taken to prepare staining solution.-(100
mL fixing solution + 0.1 g Coomasie blue).
Storage: RT
General usage: Staining Proteins on PAGE / IEF gels.
Sterilization: NA
Destaining Solution:
COMPONENT VOLUME
Methanol 400 mL
Glacial acetic acid 100 mL
WFI 500 mL
Total 1 L
Storage: 4 °C
General usage: Removal of excess stain from PAGE
Sterilization: NA

Page 62 of 235
9. Protein Sample loading buffer: 4X Reducing.
10. Silver staining solution
Preparation for 100 mL solution.
Solution A (Methanol –50%, Acetic acid-10%)
Methanol 50 mL
Acetic acid 10 mL
Water 40 mL
Storage: RT. Solution could be reused 5 times.
General usage: Fixing proteins on PAGE after gel run
Sterilization: NA
Solution B (Methanol – 5%)
Methanol 5 mL
Water 95 mL
Storage: RT.
The solution was prepared fresh every time.
Solution C (Sodium thiosulphate:-0.02 %)
0.02 g of Sodium thiosulfate (Mol wt: - 248.18) was dissolved in ~50 mL WFI /
MilliQ in a clean plastic bottle. The final volume was made up to 100mL with
WFI / MilliQ.
General usage:
Storage: The solution was prepared fresh every time.
Sterilization: NA
Final Conc.
(1x) STOCK 5 ML
Tris HCl (pH 6.8) 50 mM 1M 1.0 SDS 2 % Solid 0.4 g Β-Mrcaptoethanol 1 % 14.7 M (100 %) 0.2 mL Glycerol 10 % 100% 2 mL EDTA, pH8.0 12.5 mM 0.5 M 0.5 mL Bromophenol blue 0.2% Solid 4 mg H2O Make up --- ~1.5 mL

Page 63 of 235
Solution D (Silver nitrate: - 0.2 %)
0.2 g of Silver Nitrate (Mol wt: - 169.88) was dissolved in ~50 mL of WFI in a
clean plastic bottle The final volume was made up to 100mL with WFI.
General usage: Reagent for Staining Protein on PAGE or IEF gels
Storage: The solution was prepared fresh every time.
Sterilization: NA
Solution E (Developing Solution-Sodium carbonate:-3 %)
3 g of Sodium carbonate (Mol wt.:- 105.99) was dissolved in ~50 mL WFI. The
final volume was made up to 100mL with WFI. The solution was prepared fresh
every time.
To this solution 50 µL Formaldehyde and 2 mL (from 0.02%) Sodium
Thiosulphate solution (Mol wt.:-248.18) was added just before its use during
staining procedure for developing gel.
General usage: Reagent for developing silver stain PAGE / IEF Gels
Storage: the solution was prepared fresh solution every time.
Sterilization: NA
Solution F (EDTA Na2 Salt:- 1.4 %)
14 g of Sodium-EDTA (Mol wt.:-372.24) was added in ~70 mL WFI. It was
dissolved by continuos mixing and dropwise addition of conc. HCl till EDTA
dissolves completely. The final volume was made up to 1 L.
General usage: Stop Reagent for silver stain PAGE / IEF Gels
Storage: RT.
Sterilization: NA
Solution G
790 mg of Ammonium bicarbonate dissolved in WFI and the volume was made
upto 100 mL with WFI.
General usage: Destaining of silver stain PAGE Gels
Storage: RT.
Sterilization: NA

Page 64 of 235
Solution H
1.6 g of Sodium thiosulphate added in ~80 mL WFI and volume was made upt to
100 mL with WFI.
General usage: Destaining of silver stain PAGE Gels
Storage: RT.
Sterilization: NA
Solution I
1.0 g of Potassium ferricyanide in ~80 mL WFI and final volume was made upt
to 100 mL with WFI.
General usage: Destaining of silver stain PAGE Gels
Storage: RT.
Sterilization: NA
11. TAE running buffer for agarose gel 50 X
121 g of Trizma base (Mol. Wt. - 121.14 ) was dissolved in 150 mL of MilliQ.
Subsequently, 50 mL of 0.5 M EDTA (pH 8.0) was added, and then 28.55 mLof
glacial acetic acid was added slowly. The pH was adjusted to ~8.3 and final
volume made upto 500 mL.
General usage: 500 mL
Storeage : RT.
Sterilization: NA
12. Phosphate Buffered Saline (PBS):
8 g NaCl (Mol .Wt. -58.44), 0.2 g of KCl (Mol .Wt.) 1.44 g Na2HPO4 (Mol. Wt.:-
141.96) and 0.24 g of KH2PO4 was dissolved in 400 mL of WFI / MilliQ. The
pH was adjusted to 7.4 with conc. HCl. The final volume was made up to 1 L.
[Final Conc. of components: 137 mM of NaCl ,2.7 mM of KCl ,10 mM of
Na2PO4 and 2 mM of KH2PO4.]
General usage volume: 1 L.
Sterilization: Autoclave
Storage: RT

Page 65 of 235
13. 1M Tris-Cl stock
121.14 g of Trizma base (Mol. Wt. - 121.14) dissolved in 500 mL of MilliQ. The
pH was adjusted as per the requirement (eg 7.5, 6.8, 8.8, etc.) with conc- HCl.
The final volume was made up to 1 L.
General usage volume: 1 L.
Sterilization: Autoclaved at 118 0C for 15 min.
Storage: RT
14. Tris Buffered Saline (TBS) 50 mM - for Western Blotting
Storage: 4 °C
General usage volume: 1 L
Sterilization: NA
15. Wash Buffer (TBST)
In the above TBS buffer, Tween-20 at 0.1% was added. This solution was
prepared fresh every time.
16. Transfer Buffer for Western Blotting
3.075 g of Trizma base (Mol wt:-121.14) and 14.4 g of glycine (Mol wt :-75.07)
was dissolved in 500 mL of WFI / MilliQ. Subsequenly, 150 ml of methanol was
added and final volume was made up to 1 L.
General usage volume: 1 L.
Sterilization: NA
Storage: 4 °C
17. Blocking Buffer For Western Blot:
5 g of Skimmed milk added in 50 mL of TBST. The skimmed milk was
dissolved by vortexing and store at 4 °C.
General usage volume: 50 mL (for Blocking and Antibody preparation)
Ingredients Final Conc. From
Stock Total Vol. (mL)
Tris HCl (pH 7.5) 50 mM 1M 50
NaCl 150 mM 4 M 3.75
Milli Q -- -- Make up to 1000 mL

Page 66 of 235
Sterilization: NA
Storage: 4 °C
18. TAE running buffer for agarose gel 50 X
121 g of Trizma base (Mol. Wt.- 121.14 ) dissolved in 150 mL of MilliQ. To this
50 mL of 0.5 M EDTA was added (pH 8.0) and then 28.55 mL of glacial acetic
acid was added slowly. The pH was kept ~8.3 and finally volume was made upto
500 mL.
General usage volume: 500 mL
Sterilization: NA
Storage: RT
2.2.6. Protein A Purification 1. Preparation of Load Buffer ( 20 mM Phosphate Buffer pH 7.0):
0.3 g NaH2PO4 and 0.49 g Na2HPO4 was dissolved in 230 mL of Milli Q, and
then 2.9 g NaCl was dissolved in it. The pH was adjusted to 7.00. The final
volume was made up to 250 mL. Filtered with 0.45 µm filter before using for
purification.
2. Preparation of Elution Buffer (75mM Glycine, 0.5 M NaCl buffer pH 3.0):
1.4 g Glycine and 7.3 g NaCl was dissolved in 230 mL of Milli Q. The pH was
adjusted to pH 3 by addition of conc HCl. The final volume was made up to 250
mL. Filtered with 0.45 µ filter.
2.2.7. Protein A HPLC 1. Preparation of Mobile Phase A
8.2 g of Sodium Acetate anhydrous and 29.22 g of Sodium chloride was
dissolved in 800 mL of WFI or MilliQ. The pH was adjusted to 7.0 with 1:5
times diluted Acetic Acid (5 -6 mL was generally required required). The final
volume was made up to 1 L with WFI or MilliQ.
2. Preparation of Mobile Phase B
8.2 g of Sodium Acetate anhydrous and 29.22 g of Sodium chloride was
dissolved in 500 mL of WFI or MilliQ and add approximately 350 mL of
concentrated acetic acid was added. The pH was adjusted to 2.5 with
Page 67 of 235
concentrated Acetic Acid. The final volume was made upto 1L with WFI or
MilliQ.
2.2.8. Cation Exchange Chromatography 1. Preparation of Mobile Phase A (20mM MES (pH 6.75):
3.9 g of MES was dissolved in ~800 mL of WFI / MilliQ. The pH was set at 6.5
with 1N NaOH. The final volume was made upto 1L with WFI or MilliQ or
WFI. Filtered through 0.2µm filter. This buffer can be stored at 2 0C to 8 0C for
48 hrs.
2. Preparation of Mobile Phase B:
3.9 g of MES and 29.22 g Sodium Chloride was dissolved in ~800 mL WFI or
MilliQ. The pH was adjusted to 6.75 with 1N NaOH solution. The final volume
was made upto 1L with WFI or MilliQ. Filtered through 0.2µm filter.
2.2.9. Reverse Phase Liquid Chromatography 1. Mobile phase A:
70 % Acetonitrile (700 mL ACN + 300 mL WFI / MilliQ)
2. Mobile phase B:
100 mM Na2SO4, pH 2.5 + 0.1.
14.2 g Na2SO4 dissolved in 950 mL of WFI / MilliQ water, the pH was adjusted
to 2.5 with concentrated H2SO4. The final volume was made upto 1L with WFI or
MilliQ. Filtered through 0.2 µm filter.
2.2.10. Size Exclusion Chromatography 1. Preparation of Mobile Phase (Phosphate Buffer, pH 6.5):
7.1 g of Di-sodium hydrogen phosphate anhydrous was dissolved in ~800 mL of
WFI / MilliQ. The pH was adjusted to 6.5 with concentrated ortho-phosphoric
acid. The final volume was made upto 1L with WFI or MilliQ. Filtered through
0.2µm filter.

Page 68 of 235
2.2.11. In-vitro Bioassay 1. Growth Media for A431NS Cell line
Sr. # Basal Media / Supplements Quantity
1 Dulbecco’s Modified Minimal
Essential Media (DMEM) 870 mL
2 Glutamine (4mM) 20 mL of 200 mM
3 Fetal Bovine Serum 100 mL
4 Sodium Bicarbonate 3.7 g
5 Penicillin-streptomycin solution 10 L
All the above components were mixed aseptically in a sterile reagent bottle and
vacuum filtered through 0.2 m sterile filter. The media was stored at 2 °C to 8 °C.
The sterility of media was checked by inoculation 1 mL of media in LB broth and
Sabouraud’s Dextrose broth for checking bacterial and/or fungal contamination. The
sterility tubes were incubated for 14 days at 37 0C or RT respectively. The media was
used within one month from the date of preparation.
2. Cell Fixing Solution
The Formaldehyde solution (37%) available was diluted 1:10 in PBS to get 3.7%
which is used for fixing cells.
3. Blocking solution
3 g of BSA dissolved in TBS (pH 7.5). To be freshly prepared
4. Antibody solution
The secondary antibody (Anti-IgG kappa specific HRP conjugate) was diluted
1:10000 in blocking solution.
5. Substrate solution
TMB readymade solution used

Page 69 of 235
2.3. Methods
2.3.1. RE Digestion
The reaction in general was set up as follows:
The reaction mix was incubated at at 37 0C for 3-4 hrs. or overnight.
2.3.2. Ligation Reaction: The reaction in general was set up as follows:
The ligaion mix was incubated for ≥ 16 hrs at 22 0C.
2.3.3. Gradient PCR: The gradient PCR was set to find the optimal annealing temperature for further
amplification of desired DNA fragment in bulk quantity. Typical reaction is as
follows: Component Amount
10X Taq DNA Buffer 1x
Taq DNA Polymerase 2 -3 units
10mM dNTP mix 0.5 mM
5 µM Forward Primer 0.25 µM
5 µM Reverse Primer 0.25 µM
Template DNA Min 100 ng
Milli Q Water Make up volume to 20 µL
Component Amount
10X RE specific Buffer 1X
100X BSA (If needed)) 1x
Restriction Enzyme (RE) 1– 3 units per µg DNA
DNA 1 -2 µg per reaction
Milli Q Water Make up volume to 15- 20 µL
Component Amount
Double digested, purified Vector DNA 1 mole Double digested, purified Insert DNA 3 moles 10 x Ligation buffer 1.5-20 µl T4 DNA ligase 1 µl Milli Q Water Make up volume to 15- 20 µl

Page 70 of 235
Note: In case of PCR for the genes to be clones, Phusion Pfu polymerase or Pfu
Turbo was used.
2.3.4. Plasmid and Genomic DNApreparation protocols were followed based onthe
kit manual.
2.3.5. Competent cell Preparation E.coli DH5α
Inoculated E. coli cells from glycerol bank in 10 mL of SY media and incubated at 37 0C
/200 rpm for 16-18 hrs in incubator shaker. The OD600 was measured of overnight grown
culture following which the culture was splited at OD600 0.2 in 100 mL of SY in a 500 mL
conical flask. The flask was incubated futher under similar conditions until OD reaches to
0.8 to 1.0 (good log phase). The culture was dispensed in centrifuge tubes and cooled on
ice for 30 minutes. The cells were pelleted by at 4000 rpm for 10 min at 4 0C. The cells
were washed twice with 10 mL (1/10th volume of initial culture) of ice cold 0.1 M CaCl2
and spin at 4000 rpm at 4 0C for 10 min. Following this the cells were resuspended in 1
mL (1/100th volume of initial culture) of 0.1M CaCl2 and 15% glycerol solution. This
resuspended cells were aliquoted in sterile micro-centrifuge tubes (50 µL each) and stored
at 80 0C for future use.
2.3.6. Transformation of E.coli DH5α by Heat & shock Method
An aliquote of 50 µL aliquot of competent cells was thaw on ice for 1-2 minutes, to which
950 µL of cold 0.1M CaCl2 was added and mix gently. This was resuspended in fresh
microcentrifuge tubes, 200 µL each. To this competent cells 5-20 µL of the ligation mix
(or 0.5 µL of supercoiled DNA for positive control) was added. After gentle mixing the
cells and ligation mix was incubated on ice for 30 minutes. The cells were given a heat
shock at 42 0C for 60 seconds and incubated on ice for 3 minutes. The SY media was added
to make the final volume to 1 mL and then cells were incubated at 37 0C in a shaker at 200
rpm for 45-60 minutes. The transformed cells were plated at two different concentrations
(10 % and 50%) on to the agar plates containing selection antibiotics. Incubated at 37 0C in
biological incubator for 16–18 hrs (overnight) when the visible colonies appeared.
2.3.7. Cell Culture Methods
1. Maintenance of Cell Lines
The seeding density of CHO-suspension cells and SP2/0 cells were kept @ 0.5 x 10⁶
to 0.75 x 10⁶ cells / mL. When the cell density reaches 2-2.5 x 10⁶ cells/ mL the cells
were subcultured and reseeded at the same seeding density.

Page 71 of 235
2. Transfection of CHO-S by Lipofection
The following steps for transfection were followed:
On Day 0: The cells were seeded in 6 well TC plates @ ~0.5 x 10⁶ cells / well. The
cells were observed for the confluency (generally ~60-70% confluency required for
the Transfection). The media was changed completely before 3-4 hrs of transfection.
For each well, DNA was diluted with medium without serum (e.g.OPTI-MEM
medium) in sterile tubes / cryovials in the following way:
o Added transfection reagent in different ratios of DNA:Transfection Reagent
(1:4 and 1:6); ie., 1 µg DNA + 4 µL Transfection reagent in OptiMEM media.
o Tube A: The Lipofectamine reagent with Opti-MEM media was added (4 µL
Transfection Reagent to196 µL Opti-MEM media) and incubated at RT for 5
min.
o Tube B: Linearized vector (~1.0 µg DNA) in a total volume of 100 µL Opti-
MEM.
o Tube 1: TEST=100 µL of Tube A + 100 µL of Tube B Linearized Expression
vector
o Tube 2: Negative Control = 100 µL of Tube A + 100 µL of OptiMEM.
The tubes were incubated at RT for 20 min to allow DNA- transfection reagent
complex formation. This mixture (200 µL) was added drop-wise in respective wells
of cells by intermittent gentle shaking. One well of cells were kept as control well
without DNA. Plates were incubated at 370C at 5 %CO2 in a humidified incubator.
After 48 hrs of transfection a complete medium change was done with complete 1.0
mL DMEM medium. The cells were passaged / subcultured when the confluency
reaches to around 80-90% (generally after 24 hrs). The cells were subcultured at a
ratio of 1:4 and maintained in 6 well plates. The supernatant was collected after 24 &
48 hrs of transfection were checked for transient expression analysis. The selection
pressure was added after 48 hrs starting with lowest concentration 200 µg / mL
Geneticin G418 and then increasing concentration to 750 µg / mL Geneticin G418. A
cell bank of 1 vial each in complete medium + 5% DMSO was prepared as back-up
and stored at LN2 for future use. This is done at every critical stage of cell line
development.

Page 72 of 235
3. Transfection of CHO-S by Electroporation
The cells were trypsinized, centrifuged at 210 xg for 5 min at room temperature in
swing-out bucket. The cells were resuspended in Hank’s Balanced Salt Solution to get
0.75 x 10⁶ cells/mL/cuvette/well. The cells were mixed with 1 µg linearized plasmid
DNA. The cuvettes were cooled on ice for few minutes. The cells were the
electroporated using following two programs:
o Program 1 – Exponential-130v, 600 µF, 4mm cuvette. Resulting in 15.7 mS,
129v.
o Program 2 – Time Constant, 200v, 20 mS, 4 mm cuvette. Resulting in 19.9
mS, 198v, 650 µF,
Folllowing electroporatiuon the cuvettes were kept at room temperature for 10 min.
The cells from the cuvettes were then added in respective wells in 6 well TC plate
with 1 mL growth media. The plates were incubated at 370C at 5 % CO2 in a humified
incubator. The supernatant was collected after 24 & 48 hrs of transfection were
checked for transient expression analysis. The selection pressure was added after 48
hrs starting with lowest concentration 200 µg / mL Geneticin G418 and then
increasing concentration to 750 µg / mL Geneticin G418.
4. Generation of Minipools
The lead transfectant pool based on growth and productivity data were proceeded for
minipools generation. Minipools are generated by plating 50-100 cells / well in 96
well TC plate. The minipools were labeled based on the position in plate that is the
first letter is the alphabet of the row and second the sequencial number of the well of
96 well TC plate. The top minipools were selected based on cell growth and
expression yield for single cell limiting dilution
5. Single Cell Limiting Dilution Cloning
The top two minipools were selected for limiting dilution to achieve single clonal
population. The cells were seeded at 1-5 cells / well in 5 x 96 well plates. Following
seeding, the wells were observed and marked for receiving single cell per clone using
microscope. The growth and expression yield of the single clones were analyzed and
final 6-8 clones were selected for further analysis.

Page 73 of 235
2.3.8. Serum Free Adaptation of selected clones
The 8 clones shortlisted after single cell limiting dilution were gradually adapted to serum
free culture. Individual clones were reseeded in T25 cm2 TC flask at 0.5-0.6 x 10⁶ cell/mL
in reduced serum containing media 2%. The cells were subcultured for 2 passages in this
media. Individual clones were reseeded in T25 cm2 TC flask at 0.5-0.6 x 10⁶ cell/mL in
further reduced serum containing media 1% and 50:50 DMEM:CD-CHO media. The cells
were subcultured for 3 passages where only the cells floating in suspension were collected
and the adherent cells were discarded. Individual clones were then reseeded in T25 cm2 TC
flask at 0.5-0.6 x 10⁶ cell/mL without serum containing CD-CHO media. The growth was
monitored for 3 passages and following this the cells were adapted to suspension culture by
seeding in 125 mL shake flaks containing 40 mL of CD-CHO media and seeding count of
0.75-0.9 x 10⁶ cell /mL. The cells were grown for 3 passages and each passage the growth
and productivity profile need to be measured.
2.3.9. Evaluation of clones
The clone were screened and evaluated at smaller scale, 6 well plate or T25 cm2 TC flask.
At this stage, the cells were seeded at 0.2-0.3 x 10⁶ cell/mL and allowed to grow in
incubator maintained at 37 0C and 5% CO2. After three or four days the cell supernatant
were collected and analyzed for product expression by ELISA or Protein-A HPLC as
stated. The shortlisting of top 3 producer clones were done in 125 mL shake flask under
suspension culture and agitation. Clone evaluation was carried out in 125 mL shake flask
with 40 mL growth media (CD-CHO with 4 mM Glutamine). The cells were seeded at 0.5
- 0.75 x 10⁶ cell/mL followed by incubation in humidified CO2 incubator maintained at 37 0C temperature and 5% CO2, the shaker speed maintained was 130-150 rpm. After
achieving cell density of ~ 3-4 x 10⁶ cells / mL and viability of >90% at Day 3/4, the
temperature was reduced to 32 0C and cells were maintained till viability drops below 80%
(generally 16 days). The cells were maintained by addition of Feed cocktail (Efficient
Feed A + Efficient Feed B in ratio of 1:1) at 10% v/v on every alternate day starting from
the day of temperature shift. Samples were collected on alternate days after temperature
shift for cell count and productivity analysis (after Day 6). This is a preliminary process to
start for the study of expression of protein and evaluation of clones. The Integral viable
cell density (IVCD) was calculated using following formula:
Where VCD(t) is the viable cell density at time t.

Page 74 of 235
The protein expression in supernatant was measured either by ELISA or Protein- A HPLC.
The specific productivity (qP) of clone was calculated as:
qP = Expression Yield / IVCD
2.3.10. Upstream Process Development
The scope of upstream process development was to identify the most suitable basal
media and feed supplement supporting growth and expression yield of the lead clone
(D41E213).
1. Screening Basal Media
The clone D41E213 was seeded in the basal media listed in below table:
ID Media Name Mfg Cat# Form
A Is-MAB-CD Irvin Scientific, USA 91104 Liquid / powder
B IS-CHO-CD-XP Irvin Scientific, USA 91121 Liquid / powder
C IS-CHO-CD-XP Irvin Scientific, USA 91120 Liquid / powder
D IS-CHO-CD-K-XP Irvin Scientific, USA 91125 Liquid / powder
E HyQCDM4CHO Hyclone, USA ARF26505 Liquid / powder
F CDM4PerMab Hyclone, USA AWB94001 Liquid / powder
G Serum FreeCHO HiMedia, India SFM002 Liquid
H PowerCHO2CD Lonza BE12-771Q Liquid
I PF-CHO Media 1 OF 2
Hyclone, USA SH303334.01
Powder PF CHO BASAL 2 OF 2 SH303335.01
J Excell 302 SAFC 24324C Liquid / Powder
K MAM-PF7 Animed, Israel 10-02575-I Liquid
L Mam-PF2 Animed, Israel 10-02F24-I Liquid
M CDM4Mab Hyclone, USA AVK80331 Liquid / Powder
N CD-OptiCHO Invitrogen, USA 12681 Liquid
O Excell CD-CHO SAFC 14360C Liquid / Powder
P Pro CHO4 Lonza BE12-029Q Liquid / Powder
Q Pro CHO5 Lonza BE12-766Q Liquid / Powder
Z CD-CHO Invitrogen, USA 10743 Liquid
Table 2.1.2 List of Basal Media

Page 75 of 235
The cells were first adapted in respective media by seeding at 0.2 - 0.3 x 10⁶ cell/mL
in 6-well TC plate for 2 passages. Following this the cells were reseeded at 0.2 - 0.3 x
106 cell/mL and allowed to grow at 37 0C and 5% CO2. The cell supernatant was
withdrawn on Day 3 and Day 5 and expression was measured by ELISA.
2. Screening Feed Media
The clone D41E213 was seeding in the shortlisted basal media from above list and
expression of product from the clone was studies when the culture was run in a fed-
batch mode using below listed feed media:
Table 2.1.2:
Table 2.1.3 List of Feed Media
The D41E213 cells growing in suspension culture were seeded at 0.2 - 0.3 x 10⁶
cell/mL in 6-well TC plate in the shortlisted basal media from the media screening
experiments. The plates were incubated at 37 0C and 5% CO2 for four days on which
Sr.
No. FEED NAME MFG. CAT # FORM
1 Efficient Feed A (10%) Invitrogen A10234 Liquid
2 Efficient Feed B (10%) Invitrogen A10240 Liquid
3 Gln (4mM) + Glu (2g/L) NA NA Powder
4 Efficient Feed C (10%) Invitrogen A13275 Liquid
5 Extreme Feed (Excellgene) Lonza NA Liquid
6 Cell Boost 2 (10%) Hyclone RR12927.01 Powder
7 Cell Boost 3 (10%) Hyclone RR12635.01 Powder
8 Cell Boost 4 (10%) Hyclone RR12800.01 Powder
9 Cell Boost 5 (10%) Hyclone RR12929.01 Powder
10 Cell Boost 6 (10%) Hyclone RRE114619 Powder
11 Lonza Feed (10%) Lonza NA Liquid
12 Feed Power CHO2 (10%) Lonza BE12-771Q Liquid
13 Is-CHO-Feed-CD-XP (10%) Irvine 91122 Liquid /
Powder 14 GS-Max (10%) Hyclone SH30586.01 Liquid
15 Efficient Feed A + B (5%) Invitrogen A10234 +
A102340
Liquid
16 Efficient Feed A + B (7.5%) Invitrogen Liquid
17 Efficient Feed A + B (10%) Invitrogen Liquid
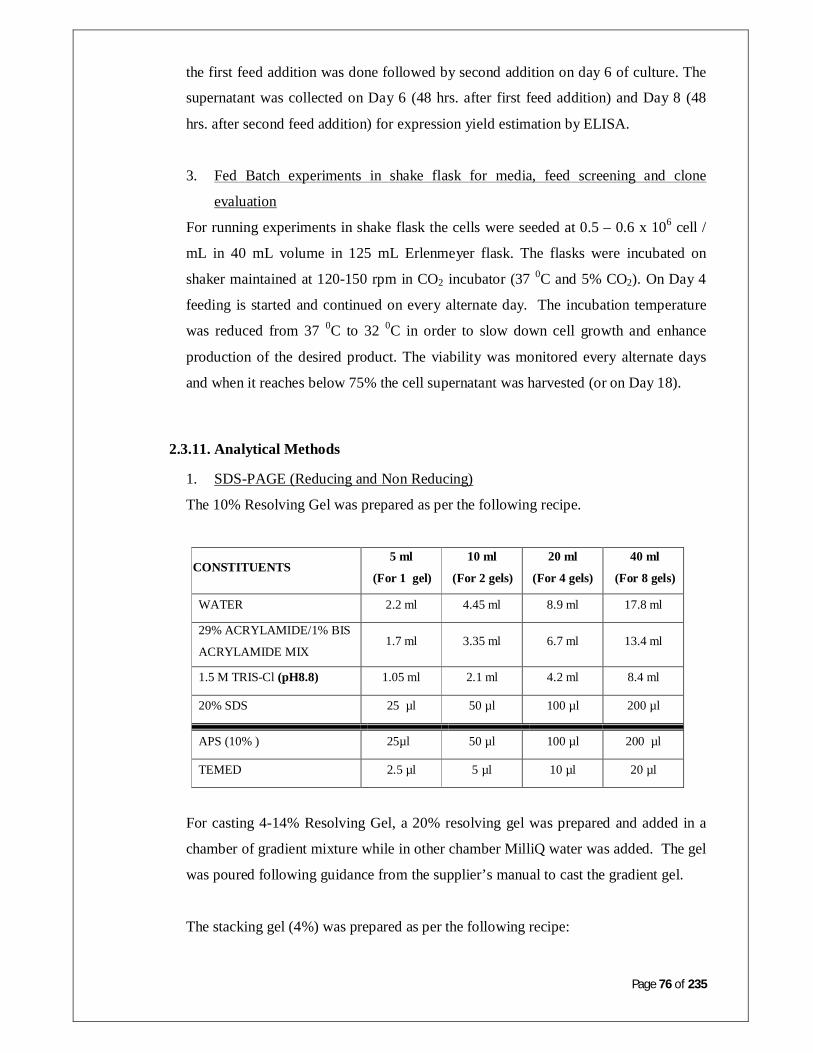
Page 76 of 235
the first feed addition was done followed by second addition on day 6 of culture. The
supernatant was collected on Day 6 (48 hrs. after first feed addition) and Day 8 (48
hrs. after second feed addition) for expression yield estimation by ELISA.
3. Fed Batch experiments in shake flask for media, feed screening and clone
evaluation
For running experiments in shake flask the cells were seeded at 0.5 – 0.6 x 10⁶ cell /
mL in 40 mL volume in 125 mL Erlenmeyer flask. The flasks were incubated on
shaker maintained at 120-150 rpm in CO2 incubator (37 0C and 5% CO2). On Day 4
feeding is started and continued on every alternate day. The incubation temperature
was reduced from 37 0C to 32 0C in order to slow down cell growth and enhance
production of the desired product. The viability was monitored every alternate days
and when it reaches below 75% the cell supernatant was harvested (or on Day 18).
2.3.11. Analytical Methods
1. SDS-PAGE (Reducing and Non Reducing)
The 10% Resolving Gel was prepared as per the following recipe.
For casting 4-14% Resolving Gel, a 20% resolving gel was prepared and added in a
chamber of gradient mixture while in other chamber MilliQ water was added. The gel
was poured following guidance from the supplier’s manual to cast the gradient gel.
The stacking gel (4%) was prepared as per the following recipe:
CONSTITUENTS 5 ml
(For 1 gel)
10 ml
(For 2 gels)
20 ml
(For 4 gels)
40 ml
(For 8 gels)
WATER 2.2 ml 4.45 ml 8.9 ml 17.8 ml
29% ACRYLAMIDE/1% BIS
ACRYLAMIDE MIX 1.7 ml 3.35 ml 6.7 ml 13.4 ml
1.5 M TRIS-Cl (pH8.8) 1.05 ml 2.1 ml 4.2 ml 8.4 ml
20% SDS 25 µl 50 µl 100 µl 200 µl
APS (10% ) 25µl 50 µl 100 µl 200 µl
TEMED 2.5 µl 5 µl 10 µl 20 µl

Page 77 of 235
Running Gel
The gel apparatus was set as per the instructions in suppliers manual. 1x running buffer
was poured in the upper as well as lower chambers of the running unit as recommended
The samples and protein standard marker was loaded as per the lane pattern.
The gel running parameters for a minigel on the Power pack was set as:
Constant Voltage: 100 V in stacking gel and 125V in resolving gel
Max Current: 200 mA
Run until dye front reaches the bottom of gel. (Usually about 1½ hrs).
Staining of the Gel:
Depending on the sensitivity required, either Silver or Coomassie Brilliant Blue
staining was used.
Silver Staining of PAGE:
CONSTITUENTS 2.5 ml
(For 1 gel)
5.0 ml
(For 2 gels)
7.5 ml
(For 3 gels)
10.0 ml (For 4
gels)
MILLIQ / WFI 1.5 ml 3ml 4.5 ml 6 ml
29% ACRYLAMIDE/1%
BIS ACRYLAMIDE MIX 0.35 ml 0.7 ml 1 ml 1.35ml
0.5 M TRIS-Cl (pH 6.8) 0.625 ml 1.25 ml 1.88 ml 2.5 ml
20% SDS 12.5 µl 25µl 37.5 µl 50 µl
APS (10% ) 12.5 µl 25.0 µl 37.5 µl 50 µl
TEMED 2.5 µl 5.0 µl 7.5 µl 10 µl
Step
No. Solution Operation Time
1 Sol A Fixing 30 Min
2 Sol B Incubation 15 Min
3 Wash 3 times with WFI 3 x 5 Min
4 Sol C Incubation 2 min
5 Wash 3 times WFI 3 x 30 sec.
6 Sol D Incubation 25 Min
7 Wash 2 times WFI 2x60 sec
8 Sol E Developing 10 Min Max
9 Sol F Stop developing 10 Min.
10 --- Wash with water ----

Page 78 of 235
Coomassie Staining of PAGE:
The gel were removed from the gel plates carefully and transferred to box containing
~20-30 ml Coomassie Brilliant Blue stain. The staining was done at RT on rocking
platform for at least 30 min at RT. The staining solution was removed and gel was
rinsed with Milli Q. The gel was destained by destaining solution. The destaining was
done till the clear bands without background observed. The image was captured using
documentation system.
2. Western Blot:
This is an identity test to detect the expressed antibody using conjugated antibody.
The SDS-PAGE was run under non-reducing conditions as per the procedure in
described in above section. The bands were transferred from the gel onto the PVDF
membrane using semi-dry western blot apparatus. The membrane was checked
quickly by staining with Ponceau-S stain. The blot was then blocked with 5%
skimmed milk for 30 min at RT under rocking conditions. The blot was washed twice
with TBST buffer following which it was probed with secondary antibody (anti-IgG
HRP conjugate). The blot was incubated at RT for 60 min under rocking conditions.
The blot was washed thrice with TBST buffer and then detected developed by
addition of TMB substrate.
3. Isoelectric Focussing
RMP and Sample Preparation
The RMP and Protein-A purified samples were concentrated and desalted using 35
kDa centricon. The concentrated sample was reconstituted in 25 µL of WFI / MilliQ
water.
Focusing IEF Gel
The cassette was wiped with 70% IPA and then with MilliQ. The gel was placed on
the cassette and clamped so that there should not be any air bubble trapped beneath
the gel. The gel was soaked in Pharmalyte mixture (40% pH 5-8 + 60% pH 8 – 10.5 +
7 M Urea). The wells were checked for any leakage. 2 mL of pharmalyte was added.
The gel was pre-focussed at 70 AVH. After pre-focussing samples and RMP was
applied using sample applicator (to the assigned well) and then the gel was focused till
the current reaches 512 AVH. Remove the gel and strip the pharmalytes by treating
the gel with 10% TCA for overnight and then with 1% TCA for 1 hr. The gel was
stained using silver staining protocol as described in the Phast System program.

Page 79 of 235
4. Sandwich Indirect ELISA
Coating Antibody:
Mouse monoclonal anti human IgG (Fc specific) Stock: (1 mg / µL).
Working Coating Concentration: 200 ng / 100 µL / well.
The antibodies were added in each well, 100 µL. The plate was incubated for O/N
at 2 – 8 °C or at 37 0C for 3 hrs. The plate was washed 3-times with TBST buffer.
Blocking: 3% BSA in Wash Buffer.
The blocking was done by addition of 300 µL blocking solution to each well. Plate
was incubated for 60 min at 37 °C. The plate was washed 3-times with 300 µL of
TBST buffer.
Standard and Sample dilution:
The RMP was available at a stock concentration of 5 mg/mL. It was diluted in PBS
to get working concentration of 125 ng /mL.
All the samples & standard dilutions were diluted in TBST buffer. Following this
the working standard was serially diluted (250 µL + 250 µL) till 1.83 ng /mL. The
standard dilutions were added in duplicates. The 100 µL of each dilution (standard
and samples) were added in the pre-coated plate. The plate was incubated for 60
min at 37 °C and then washed 3-times with 300 µL of TBST buffer. Note: The
samples should be added as per the plate layout shown below.
Detection antibody & Plate Reading:
Detection Antibody: Anti-mouse IgG kappa specific polyclonal antibody-HRP
conjugated. Stock: (1mg/ml).
Working Concentration: 1:5000 in 1% blocking solution
This antibody was added at 100 µL / well and incubated for 60 min at 37°C. The
plate was washed 3-times with 300 µL of TBST buffer.
Substrate addition:
100 µL substrate (TMB/OPD) was added into each well. The plate was incubated
for 15-20 min under dark. When the sufficient color development was observed in
standard wells, the reaction was stopped by addition of 50µl of the stop solution
(1N HCl) to each well. Plate was read using plate reader after a brief shaking.
(TMB: 450nm or OPD: 492nm).

Page 80 of 235
Schematic Representation of Plate Layout:
1 2 3 4 5 6 7 8 9 10 11 12
A Std 125
ng / mL
Std 125
ng / mL Sample Sample Sample Sample Sample Sample Sample Sample Sample Sample
B Std 62.5
ng / mL
Std 62.5
ng / mL Sample Sample Sample Sample Sample Sample Sample Sample Sample Sample
C
Std
31.25
ng / mL
Std
31.25
ng / mL
Sample Sample Sample Sample Sample Sample Sample Sample Sample Sample
D Std 15.6
ng / mL
Std 15.6
ng / mL Sample Sample Sample Sample Sample Sample Sample Sample Sample Sample
E Std 7.8
ng / mL
Std 7.8
ng / mL Sample Sample Sample Sample Sample Sample Sample Sample Sample Sample
F Std 3.9
ng / mL
Std 3.9
ng / mL Sample Sample Sample Sample Sample Sample Sample Sample Sample Sample
G Std 1.83
ng / mL
Std 1.83
ng / mL Sample Sample Sample Sample Sample Sample Sample Sample Sample Blank
H Std 0
ng / mL
Std 0
ng / mL Sample Sample Sample Sample Sample Sample Sample Sample Sample Blank

Page 81 of 235
5. Protein A purification
Approximately 8 mL of harvest diluted in Load buffer (total 15 mL) was loaded onto
the GE MabSelectSure resin at a pH of 7, conductivity of 24 ms/cm and 1ml/min flow
rate. Washed with the load buffer at 1 ml/min for 10-20 CV.The protein was eluted
using 75mM Glycine, 0.5 M Sodium chloride buffer, pH 3.0.
Load volume: 8ml Conc : 0.3mg/ml diluted to 15 ml with equilibration buffer pH7;
conductivity: 24ms/cm.
6. Protein –A HPLC
Preparation of standards for calibration curve
Stock solution: - The RMP available is 5 mg/ mL. To create a standard curve the
following dilutions were prepared and injected. The RMP was diluted to 1.25 mg/mL
following which the further dilution was done as per the below mentioned dilution
scheme:
Sr.
No.
Conc.
Ref.
Standard
(mg/ mL)
Volume
of Stock 1
(µl)
Volume
of Mobile
Phase A
(µl)
Total
volume
(µl)
Injection
amt. (µg)
Injection
volume
(µl)
No. of
injections
1 15 15 485 500 15
100
3
2 10 10 480 500 10
3 5 5 495 500 5
4 3 3 497 500 3
Calibration Curve Preparation:
100 µl of each dilution was injected in triplicates. The run was programmed as: Time (min) Mobile phase(B) Flow-rate
0.0 0%
2.0 mL /min
3.0 0% 4.0 100% 6.0 100% 6.5 0%
11.0 0% Detection wavelength 280 nm
Sample manager temperature 2 C to 8 C Column temperature 25 C
Pressure Min: 0 bar, Max: 250 bar Run time 11 min
Injection Volume 100

Page 82 of 235
The Mean, Standard deviation (SD) and % RSD of area were calculated, (by applying
the formula of % RSD as mentioned below). A graph of mean area vs known
concentration was plotted and perform linear regression analysis. Calculate Slope of
regression line and the squared correlation coefficient (R2 value). The back calculated
concentration and back calculated % recovery was calculated by applying the
formulas give below:
Note: Formulas used for calculation:
100Area Average
Deviaition Standard %RSD
curven calibratio theof Slopeintercept-solution standard theof area Average Con. calculatedBack
100(mg/ml)ion Concentrat Actual
mg/mlion Concentrat calculatedBack Recovery % calculatedBack
Acceptance criteria for Calibration Curve followed were:
1. The % RSD of the area between the triplicate injections in the calibration curve
of reference standard should be ≤ 2 %.
2. The R2 value of regression should be 0.99 for the calibration curve.
3. Back calculated % recovery should be between 90 to110 % percent.
Preparation of Test Solution
This method was used for two types of samples: (a) Cell culture supernatant and
Harvest samples (b) Partially purified samples after Protein-A purification.
The samples to be analyzed was injected as such (100 µL).
Sample Analysis
The samples were prepared as discussed above. The column was equilibrated using
obile phase B and with the above conditions for around 40 min (or till a stable base-
line is obtained). The system suitability was analyzed following which the samples
were analyzed. The samples were injected in singlet. The injection pattern is as
follows:

Page 83 of 235
Injection
No.
Sample/ analyte
Injection volume
(µL)
Number of
injections
1 Blank - 3 2 Standard solution (5 µg) 100 1 3 Test sample 100 1
Note: The blank which is just before the run of the samples should be taken for blank
subtraction.
Equipment and Equipment Parameters
Instrument: - Agilent 1100/1200 series
Column
Brand Name Applied Biosystems
Catalog Number 1-5022-26
Type of Column POROS-A/20
Specification of Column Diameter: 4.6 mm, Length: 100 mm
Particle size: 20 Micron Guard Column
Brand Name and specifications Supelco, 0.5 µm
Catalog Number: 55214-U
7. RP-HPLC
Preparation of Standard (5g / 100 L)
The RMP stock available is 5 mg/mL, this was diluted 1:100 in Mobile Phase A.
The volume injected was 100 L, resulting in injection of 5 g protein.
Preparation of Test Sample:
100 L of cell culture supernatant was injected directly. The sample loading pattern
is shown below:
Injection
No.
Sample/ analyte
Injection volume
(µl)
Number of
injections
1 Blank - 3 2 Standard solution (5 µg) 100 1 3 Test sample 100 1

Page 84 of 235
Equipment and Equipment Parameters
Instrument: - Agilent 1100/1200 series
Column:
Brand Name Grace Vydac
Catalog Number 214TP54
Type of Column Reverse phase C4 column
Specification of Column
Diameter: 4.6mm, Length: 250 mm
Porosity: 300•A, Particle size: 5
Micron
Guard column
Brand Name Zorbex 300 SB-C3 (Agilent)
Catalog Number 820950-921
Type of Column Reverse phase Zorbax 300 SB-C3
Specification of Column Diameter: 4.6mm, Length: 12.5 mm
Porosity: 300•A, Particle size: 5 µ
Chromatography Parameters Method Parameter: Buffer A: 70% ACN
Buffer B: 100 mM Na2S04
Time %Buffer A %Buffer B Flow rate Max. Press.
0 75 25
0.3
mL/min 250
2 75 25 5 50 50
10 20 80 15 20 80 17 75 25
Absorbance 214 nm Column Temp. 75 0C
Max. Press. 250 Bar Run time 25 min.
Injection Vol. 100 µL
8. Cation-Exchange HPLC
Preparation of Standard Solution
The RMP was diluted to a concentration of 1.0 mg/mL using mobile phase-A as
mentioned in the point 2.2.8
Stock solution 5 mg / mL 30 µL added in 120 µL of Mobile Phase A 1 mg / mL

Page 85 of 235
Preparation of test solution
The Protein-A purified test sample was diluted in Mobile phase A to get a
concentration of 1.2 mg/ml (by OD280 nm)
The standard and samples were loaded in following pattern:
Injection
No.
Sample
Injection volume
(µl)
Number of
injections
1 Blank - 3 2 Standard solution (5 µg) 100 1 3 Test sample 100 1
Acceptance Criteria for System Suitability
Retention time (Rt) of Major peak 1 of reference solution match with test solution
(± 0.2 min)
Resolution between Major peak 1 (which is K0: No lysine at C terminal) and Major
peak 2 (which is K1:1 lysine at C-terminal) of the test solution should be more than
1.5 min.
Chromatography Parameter
Time (min) % Mobile Phase A % Mobile phase B Flow-
rate 0.0 91% 9 %
0.8 ml
/min
2.0 91% 9 % 23.0 70% 30 % 24.0 70% 30 % 26.5 0 100 % 28.0 0 100 % 28.5 91% 9 % 50.0 91% 9 %
Detection wavelength 220 nm Sample manager 2 C to 8 C
Column temperature 30 C Pressure Max: 200 bar Run time 50 min
Equipment and Equipment Parameters
Instrument: - Agilent 1100/1200 series
Column
Brand Name Tosho Hass
Catalogue Number 21966
Type of Column TSK CM STAT

Page 86 of 235
Specification of Column Diameter: 4.6 mm, Length: 100 mm, Particle
size: 7µ
Pre-column filter
Brand Name and specifications Supelco, 0.5 µm
Catalog Number: 55214-U
9. Size Exclusion - HPLC
Preparation of RMP
The RMP wa diluted to a concentration of 0.2 mg/mL using Mobile Phase (Point
2.2.10). For this the 30 µL of stock solution (5 mg / mL) was added in 120 µL of
Mobile Phase A, resulting in 1 mg / mL. This was further diluted by adding 30 µL of
1 mg/mL in 120 µL of Mobile Phase A to achieve final concentration of 0.2 mg / mL.
Preparation of test solution
The protein concentration of the Protein-A purified samples were measured by
OD280 nm. The test samples were diluted in mobile phase to get final concentration
of 0.2 mg/ml.
The sample loading pattern is shown below:
Sr. # Sample/Solution No. of
injections
Conc.
(mg/ml)
Injection
Vol. (µL)
Amt.
injected
(µg)
1 Blank (Mobile phase) 1 ---- 100 ----
2 Reference solution 2 0.2 100 20
3 Test solution/s 1 0.5 30 15
The Retention time (Rt) and total area of the peaks obtained for reference solution
was analyzed. The percentage recovery of reference solution using the calculation
mentioned below was calculated
Average area of peak of Reference solution 2 = ‘X’
Total Area of peaks of the Reference solution 1= ‘Y’
The % recovery of Reference solution 2 = X*100/Y
Acceptance Criteria for System Suitability
Retention time (Rt) of Major peak 1 of reference solution match with test solution (±
0.2 min)

Page 87 of 235
Chromatography Parameter Time (min) Mobile phase Flow rate
0 100 % 0.5 ml/min
35 100 %
Detection wavelength 214 nm
Auto sampler temperature 2 C to 8 C
Column temperature 25 C
Pressure Min: 0 bar, Max: 100 bar
Run time 35 min
The column was equilibrated with the above conditions for about 60 min to 70 min.
The RMP and sample was diluted as above.
Equipment and Equipment Parameters
Instrument: - Agilent 1100/1200 series
Column
Brand Name TOSHO HAAS
Catalog Number 08541
Type of Column TSK3000SWXL, Size exclusion column
Specification of Column Diameter: 7.8 mm, Length: 300 mm
Porosity: 250 , Particle size: 5µ
Pre-column filter
Brand Name and specifications Supelco, 0.5 µm
Catalog Number: 55214-U
10. In-vitro Bioassay
Cell Line : A431NS
Growth Media – DMEM with 5% FBS and Pen-Strep solution
Antibody – Anti-Human IgG kappa-specific HRP conjugate
Blocking Buffer – 3% BSA
Substrate – TMB
The A431NS cell line expresses EGFR on the cell membrane and caveolar space.
The binding on RMP and test sample to the receptor was measured by secondary
detection with HRP labeled antibody

Page 88 of 235
Day 0:
The cells growing in TC flask were trypsinized using Trypsin-EDTA solution and a
single cell suspension was prepared. The cells were counted using automated cell
counter. The cell suspension was diluted in growth media to achieve final cell
concentration 2 x 10⁵ cells /mL. 100 µL of diluted cell suspension was added in each
well of 96-well TC plate leaving the side columns. In the outer wells 100 µL of PBS
was added to avoid edge effect. The plates were incubated in incubator maintained at
37 0C and 5% CO2 for 24 hrs.
Day 1:
Growthe media from the 96-well plate was discarded. The cells were gently washed
by addition of 200 µL PBS. The cells were fixed to the plate surface by addition of
200 µL of 3.7% Formaldehyde and incubated for 15 min at RT. The monolayer was
washed with 200 µL PBS twice. The surface of plate was blocked by addition of 200
µL / well 3% BSA solution incubated the plate at 37 0C for 1 hr. The plate was
washed with 200 µL/ well PBS, twice. The diluted reference and test samples were
added in following pattern:
After addition the plate was incubated for 1 hrs at 37 0C. The cells were washed by
addition of 200 µL/ well PBS, twice. The receptor-antibody complex was probed by
addition of 100 µL/well 1: 5000 diluted anti-human IgG kappa specific HRP
conjugate antibody (0.2 µg / mL). The plate of incubated for 1 hrs at 37 0C. The
unbound secondary antibody was washed off by addition of 200 µL/well PBS, four
times. 100 µL/well of substrate, TMB was added. The color development was done
at RT for 15-20 min under dark conditions following which the over-development
was stopped by addition of 50 µL/well of 5N HCl solution. The plate was read in
plate reader at 450 nm. The relative activity of the samples in comparison with RMP
was determined by calculating PLA software.

Page 89 of 235
11. N-terminal Sequencing
The Protein-A purified samples were run on SDS-PAGE (10%) under reducing
condition to separate heavy chain and light chain (Section 2.3.11 (2)). The bands
were transferred from PAGE to nitrocellulose membrane using semi-blot apparatus
(Section 2.3.11 (3)). The bands were visualized using by Ponceau-S stain and
corresponding blots were cut and analyzed for N-terminal sequencing. The N-
terminal sequencing was done by Edman degradation procedure using Procise 492
equipment from ABI Biosystems.
12. Glycan Analysis by MS
Equipment – SYNAPT, Waters
The Protein-A purified sample and RMP were limited Lys-C digested to release Fab
and Fc fragment. The mAb concentration: Lys-C was standardized as 1:400, pH 8.0
at 37 0C for 10mins to achieve a single nick at the hinge region of heavy chain to
produce two fragments of Fab and a single fragment of Fc to study the Fc and Fab
glycans individually. The Lys-c digested sample was reduced by treating with 15
mM DTT at 37 0C for 25 min to get simpler profile and reduce complexity of the
spectrum in LC-MS since both heavy chains are glycosylated. This digested and
reduced sample was resolved on C8 Zorbax column with 70% Iso Propyl Alcohol
(IPA) + 20% Acetonitrile (ACN) with a linear gradient of 25% to 40% in 30 min and
the eluting species were detected with ESI-TOF. The raw spectrum was deconvoluted
with standard parameters
Procedural flow of the steps followed to analyze sample by MS is as follows:

Page 90 of 235
Step 3: Reduction of digest The Lys-c digest was reduced with 15mM DTT at 37 0C for 25 min for simplifying the complexity of the spectrum in LC-MS since both heavy chains are glycosylated. The digested was separated using RP-HPLC and then the peak were passed to LC-MS
Step 5: LC-MS The eluting species were detected with ESI-TOF. The raw spectrum was deconvoluted with standard parameters.
Step 1: Protein-A purification (Described in Sec 5) Expressed mAb was captured from Cell culture supernatant by MabSelect Sure column. Equilibration buffer: 100mM Phosphate buffer, 100mM NaCl pH 7.0 Elution buffer: 50mM Citrate pH 3.0
Step 2: Limited Lys-C digestion Digestion was carried out of the purified mAb and RMP with Lysine-C at a ratio of 1:400 at pH 8.0 at 37 0C for 10 min. to achieve a single nick at the hinge region of Heavy Chain to produce two fragments of Fab and a single fragment of Fc to study the Fc and Fab glycans individually
Step 4: RP-HPLC The reduced Lys-C digest was resolved by RP-HPLC on C8 Zorbax with 70% IPA+ 20% ACN with a linear gradient of 25% to 40% in 30mins.

CHAPTER 3
CLONING AND EXPRESSION OF BIOSIMILAR ANTI-EGFR ANTIBODY IN ALTERNATE HOST

Page 92 of 235
3.1. Recombinant Vector Construction
3.1.1. Preamble: A number of expression systems have been developed where transgene expression can
be regulated. They all have specific characteristics making them more suitable for certain
applications than for others. Since some applications require the regulation of several
genes, there is a need for a variety of independent yet compatible systems (Mullick, et al
2006). The designing of expression vector is the most critical aspect of cell line
development. The selection of vector should be based on the available literature, past
experience with other proteins and genetic stability.
In pursuit of establishing a stable high expressing cell line for anti-EGFR monoclonal
antibody various vector constructs were designed with dual promoter system and
evaluated. The dual promoter system facilitates expression of light chain and heavy chain
of antibody (IgG) at similar molar concentration. Also, the integration of light chain and
heavy chain sequence happen at the same region in the genome thereby making it
convenient to establish and monitor the genetic stability and localization. The vector
backbone used was pcDNA3.1(-) which is commercially available from Invitrogen, USA
and is not covered under any patent terms. pcDNA3.1 (-) was selected based on
features referred in Table 3.1.1 Feature Benefit
Human cytomegalorvirus immediate-early
(CMV) enhancer / promoter
Permits efficient, high-level expression of recombinant
proteins (Gorman, et al 1989; and Graham, et al 1997.)
T7 promoter / priming site Allows for in-vitro transcription in the sense orientation and
sequencing through the insert
Multiple cloning site Allows insertion of gene of interest and facilitates cloning.
Bovine growth hormone (BGH)
polyadenylation signal
Efficient transcription / termination and polyadenylation of
mRNA (Goodwin and Rottman 1992)
f1 origin Allows rescue of single stranded DNA
SV40 early promoter and origin Allows efficient, high-level expression of the selection
marker like Neomycin or GS gene and episomal replication in
cells expressing SV40 large T antigen
Neomycin Resistance gene Selection of stable transfectant in mammalian cells (Southern
and Berg 1982)
SV40 early polyadenylation signal Efficient transcription / termination and polyadenylation of
mRNA
pUC origin High-copy number replication and growth in E. coli
Ampicillin resistance gene ( - lactamase) Allows selection of transformants in E. coli

Page 93 of 235
Table 3.1.1 Features of pCDNA3.1 vectors (ref. Invitrogen pcDNA vector manual)
The following expression cassettes were designed for expression of recombinant IgG
molecules. The recombinant vectors thus obtained would serve as a ‘plug and play’
system for any monoclonal antibody expression or hetero-multimeric proteins. The
details of each constructs are described in the following text. The pSRM series of vectors
denotes the specific modifications carried out in the pcDNA3.1(-) vector backbone.
ppSSRRMM0011 == ppccDDNNAA33..11((--)) ++ GGlluuttaammiinnee SSyynntthheettaassee ggeennee
ppSSRRMM0022 == ppSSRRMM0011 ++ CCMMVV--22 pprroommootteerr
ppSSRRMM0055 == ppccDDNNAA33..11((--)) ++ CCMMVV--22 pprroommootteerr
3.1.2. Results and Discussion 3.1.2.1. Construction of pSRM01:
The schematic representation of construction is depicted in Figure 3.1.1:
Digestion with BstBI and XmaI
Ligation & transformation in
E.coli
BstBI
XmaI

Page 94 of 235
Figure 3.1.1 Flow diagram of construction of pSRM01 vector by modification of pcDNA3.1
vector so that neomycin trasferase gene was replaced with Glutamine synthetase
gene (SRI-G1)
The Glutamine Synthetase (GS) gene sequence was taken from European Patent No.
EP0333033which is expired in Sep 2009.
The gene was chemically synthesized from GeneArt, Germany and optimized for
expression in CHO cells. The SRI-G1 pMA vector supplied by GeneArt possess GS
gene. The restriction enzyme (RE) digestion of pcDNA3.1(-) and pMA vector with
BstB1 and XmaI resulted in a release of ~0.9 kb Neomycin gene and ~1.2 kb GS gene,
respectively. The pcDNA3.1(-) backbone left was about ~4.5 kb as depicted in Figure
3.1.2.
Figure 3.1.2 RE digestion of pcDNA3.1(-) and SRI-G1 pMA vector with BstBI & XmaI. Checked on 1% agarose gel
1kb
3kb
6kb
0.9 kb
1.2 kb
2.2 kb
4.5 kb

Page 95 of 235
Further to this, the ~1.2 kb GS and ~4.5 kb pcDNA3.1 (-) fragments were gel purified
using GelEluate kit (Sigma). These fragments were ligated using T4 DNA Ligase (NEB
or Fermentas). E. coli DH5α cells were transformed by the ligation mix and about 500
colonies were obtained on ampicillin containing agar plates. Five colonies were selected
for plasmid isolation and RE diagnosis. The RE diagnosis was carried out using BstB1
and XmaI enzymes. A fragment release of ~1.2 kb was observed (Figure 3.1.3) in all 5
colonies which corresponds to the GS gene.
Figure 3.1.3 RE diagnosis of recombinant plasmids isolated from pSRM01 transformed E.coli
DH5 cells.
M is the 1kb DNA ladder in first lane while the respective clones are labeled in the following lanes.
Checked on 1% agarose gel
Clone # 2 & #3 were short-listed and sent for DNA sequencing. The DNA sequence of
both these clones matched with the published GS sequence, hence were used for cloning.
This vector was labeled as pSRM01.
In addition to the key feature of pcDNA3.1(-) mentioned in Table 3.1.1, the pSRM01
possesses GS gene in place of neomycin gene for selection and amplification of gene
simultaneously.
3.1.2.2. Construction of pSRM02:
The pSRM01 vector constructed as above was modified to possess another CMV
promoter for expression of two independent genes (eg. Light chain and heavy chain
sequence). The schematic representation of construction of pSRM02 is depicted in
Figure 3.1.4:
1kb
6kb
3kb
1.2kb
4.5kb

Page 96 of 235
Figure 3.1.4 Flow Diagram of the Construction of pSRM02. The dashed line represents the CMV promoters. The thin dotted line for CMV-1 while dark dotted line for
CMV-2 promoter
Digested by NotI & BamHI
Ligation & Transformation
BglII
Amplified CMV (889bp) from BglII to NheI and incorporating NotI (5’) and BamHI (3’), named CMV-2
PCR amplification

Page 97 of 235
The CMV promoter from position 13 (BglII site) to 896 (NheI site) was PCR amplified
using specific primers as follows:
Forward primer - SR171 (5’-GATGCGGCCGCCCCGATCCCCTAT-3’) and
Reverse primer - SR172 (5’-AGTGGATCCCAGCTTGGGTCTCC-3’), and incorporating
NotI and BamHI site at 5’ and 3’ location, respectively. A gradient PCR was run to
amplify this fragment which was named as CMV-2 promoter with size of ~908 bp (Ref.
Figure 3.1.5A). The amplified CMV-2 and pSRM01 vector was digested sequentially
using NotI and BamHI enzymes (Ref. Figure 3.1.5:B). The ~0.9 kb fragment
corresponding to CMV-2 and ~6.0 kb fragment of double digested pSRM01 was gel
purified, ligated using T4 DNA ligase and transformed in E.coli DH5 cells. The
transformation efficiency achieved was 2.73 x 10³. Plasmid Miniprep from 10 colonies
were used for RE diagnostics and screening for positive clones. When the plasmids from
selected clones were digested with NdeI, two fragments of ~1 kb (corresponding to the
size of CMV-2 insert) and ~6 kb (corresponding to pSRM01 vector) was observed. This
was seen in all clones except clone #4 which was negative for ligation while clone # 10
showed unusual behavior (Ref. Figure 3.1.5:C). Clone #2 & #8 was selected for further
experimentation while all other clones were discarded. pSRM02 Clone # 2 & #8 were
further RE diagnosed using NdeI & SacI enzyme whereby two fragments as expected
were observed (Figure 3.1.5:D).
(A) (B)
3 kb
1 kb

Page 98 of 235
(C) (D)
(E)
Figure 3.1.5 Generation of pSRM02 vector. (A) Gradient PCR to amplify CMV promoter sequence from pcDNA3.1(-), (B) Sequential digestion of
pSRM01 and CMV-2 with NotI and BamHI, (C) RE diagnostics for the positive clones of pSRM02. (D)
RE diagnostics for pSRM02 clone # 2 & #8, (E) RE analysis to distinguish pSRM01 and pSRM02 (clone
#2 & #4). All the DNA samples were checked on 1% agarose gel.
The distinguishable RE analysis of pSRM01 and pSRM02 (Figure 3.1.5:E) was done
using NdeI enzyme. NdeI is present in CMV promoter site and hence when a second
CMV-2 promoter was inserted there will be introduction of one more NdeI site; hence on
digestion it releases two fragments of ~1 kb and ~5 kb size while pSRM01 and pSRM02
Clone #4 gave a linearized band. This indicates clone #2 & #8 possess CMV-2
introduced in pSRM01 resulting in pSRM02 vector while clone #4 is a negative clone
lacking CMV-2.
3 kb
1 kb
6 kb
1 kb
3 kb
6 kb

Page 99 of 235
3.1.2.3. Construction of pSRM05
This vector is a dual promoter vector with Neomycin transferase gene as a selection
marker. The pSRM02 as explained above and pcDNA3.1(-) was digested using BamHI
(5’) & NotI (3’) to get release GS gene from pSRM02 and linearized pcDNA3.1(-).
Figure 3.1.6 depicts the schematic representation of the construction of pSRM05.
Figure 3.1.6 Schematic representation of construction of pSRM05 vector. This vector contains
two CMV promoters and neomycine transferease as selection marker
BamHI
NotI
Digestion with BamHI & NotI. Ligation to release CMV-2 from pSRM02 & linearize pcDNA3.1(-)

Page 100 of 235
The CMV-2 was ligated to pcDNA3.1 (-) using T4 DNA ligase to yield pSRM05 vector.
E. coli DH5 cells were transformed with the ligation mix. Ten colonies from the
transformation plates were screened by colony PCR using primers :
Reverse Primer SR167 (5`-TAGAAGGCACAGTCGAGG -3`) and
Forward Primer SR601 (5’–CGCAAATGGGCGGTAGGCGTG-3’). The positive clones
gave an amplicon of ~1.1 kb while the negative clones gave an amplicon of ~200 bp. As
shown in Figure 3.1.7:, all the 10 selected transformants gave ~1.1 kb amplicon
indicating ligation of CMV-2 in pcDNA3.1(-).
Figure 3.1.7 Screening of pSRM05 transformants of Ecoli HD5α by colony PCR. Checked on 1% agarose gel.
Clone # 1 and #2 were selected for RE analysis. The plasmids isolated from these
transformants were digested with BglII and EcoRI. The pSRM02 plasmid was expected
to give two fragments of ~3.5 kb and ~3 kb size while the pSRM05 was expected to
yield a single fragment of ~6.5 kb size. Based on RE analysis (Figure 3.1.8:) clone #1
and #2 were positive clones and used for construction of the final recombinant vector
for antibody gene expression.
1kb
1 2 3 4 5 6 7 8 9 10 11 12
Lane 1 :1kbp DNA ladder Lanes 2-11 :pSRM05 Clone #1-10 Lane 12 :pSRM02(+ve ctrl)

Page 101 of 235
Figure 3.1.8 RE Diagnosis of pSRM05 Clone #1 and # 2. The plasmid from Clone #1 andd #2 was
isolated and digested to check for the presence of two CMV promoters and neomycin
transferease gene
3.1.2.4. Construction of Antibody Genes Expression vector (S8.1):
The Expression vector with GS as selection marker was named as S8.1 Expression
Vector (pSRM02+L1+H1). As described in above section pSRM02 bears two CMV
promoter and GS gene for selection and gene amplification. The genes of interest i.e.,
light chain (L1) and heavy chain (H1) genes of anti-EGFR monoclonal antibody
(Cetuximab) were cloned sequentially. The light chain and heavy chain sequences were
taken from the patent WO/2007/147001. Also the sequence was confirmed by 2D LC-
MS/MS analysis of RMP (Data not shown). The light chain and heavy chain sequences
were chemically synthesized from GeneArt, Germany.
For construction of the expression vector, the light chain and heavy chain sequences
were cloned in the multiple cloning site (MCS) downstream of each promoter (CMV-1
and CMV-2). Below is the schematic diagram for construction of S8.1 expression
vector:
RE Digestion with XbaI & NheI and
Ligation
Lane 1= 1kb DNA ladder Lane 2 = pcDNA3.1(-) – BglII + EcoRI Lane 3 = pSRM02 – BglII + EcoRI Lane 4 = pSRM05 Cl# 1 – BglII + EcoRI Lane 5 = pSRM05 Cl# 1 – BglII + EcoRI
3.5kb
1 2 3 4 5
1 kb
6.5kb

Page 102 of 235
Figure 3.1.9 Schematic representation of construction of S8.1 expression vector.
The light chain & heavy chain sequence were chemically synthesized. E18-L1-Synthetic pMA-T vector
bears light chain &E18_H1 synthetic pMA-T bears heavy chain
RE Digestion with BamHI & AflII. Ligation

Page 103 of 235
The E18-L1-Synthetic pMA-T vector recevived from GeneArt was digested with NheI
and XbaI to release light chain sequence of 852 bp (this includes Kozak Sequence, CDS,
and Bovine Growth Hormone PolyA). Similarly pSRM02 was also double digested with
the same enzymes (Figure 3.1.10A). The fragment of interest and the digested pSRM02
were gel purified using GelElute kit and ligated using T4 DNA ligase. The ligation mix
was used to transform E.coli DH5 and plated on SY media containing Ampicillin. Ten
colonies were selected and tested for presence of recombinant plasmid by colony PCR.
All clones gave an amplicon of ~300 bp as expected however, the signal in clone # B, G,
H, I, and J was strong (Figure 3.1.10B). Clones # B & H were analyzed and used for
further experimentation.
A) B)
Figure 3.1.10 Cloning of Light Chain in pSRM02. A) RE digestion of pSRM02 Clone # 8 and E18_L1-Synthetic pMA-T Vector (GeneArt),
B) Colony PCR for screening pSRM02 +L1 clones. Checked on 1% agarose.
pSRM02+ L1 clone # H was selected for cloning heavy chain sequence in it. As
depicted in Figure 3.1.11A, E18-H1-Synthetic pMA-T Vector received from GeneArt
and pSRM02+L1 Clone #H were RE digested with BamHI and AflII to get linearized
pSRM02+L1 and fragment of ~1.4 kb (corresponding to heavy chain sequence) from
GeneArt vector. These were then gel purified and ligated using T4 DNA ligase. The
ligation mix was used to transform E. coli DH5 cells. A total of 13 colonies were
screened by colony PCR using following primers:
Forward Primer - SR-177 (5'-TGACCAAGTCCTTCAACCGG- 3'),
3 kb
6.5 kb
0.9 kb

Page 104 of 235
Reverse Primer - SR-178 (5'-CGGACACGGTACAGGTGAT-3') primers. As shown in
Figure 3.1.11B, an amplicon of ~1.2 kb size was observed in all the clones.
A)
(B)
(C)
Figure 3.1.11 Cloning of Heavy Chain in pSRM02+L1. A) RE digestion of pSRM02+L1 Clone # H and E18_H1 (GeneArt) Vector,
B) Colony PCR, (C) RE diagnosis of the final expression vector (pSRM02 + L1 + H1)
Clo
ne #
1
Clo
ne #
2
Clo
ne #
3
Clo
ne #
4
Clo
ne #
5
Clo
ne #
6
Clo
ne #
7
Clo
ne #
8
Clo
ne #
9
Clo
ne #
10
Clo
ne #
11
Clo
ne #
12
Clo
ne #
13
1 kb
MW 1 2
1 kb
Lane 1: 1kb DNA Lane 2: pMAT-H1 digested with BamHI & AflII Lane 3: pSRM02 digested with BamHI & AflII

Page 105 of 235
The SP2/0 cell line generated by transfection of this vector was designated as S8.1
and in CHO cell line as S8.2.
3.1.2.5. Construction of Expression vector (S8.3):
The expression vector S8.3 was designed to have Neomycin Transferase as selection
marker and possessing two CMV promoters (pSRM05+L1+H1). It was generated from
S8.1 expression vector by replacing GS gene with Neomycin transferase gene.
Figure 3.1.12 Schematic diagram of S8.3 expression vector
The S8.1 expression vector and pcDNA3.1 (-) were digested with BstB1 and XmaI to
release fragment of ~1.2 kb (corresponding to GS gene) from S8.1 expression vector and
~0.9 kb (corresponds to Neomycin Transferase gene) from pcDNA3.1 (-) (Figure
3.1.13A). The ~0.9 kb fragment corresponding to Neomycin transferase obtained from
pcDNA3.1 (-) was ligated in S8.1 vector from where ~1.2 kb fragment corresponding to
GS gene was removed.

Page 106 of 235
(A) (B)
Figure 3.1.13 Cloning of Neomycin Gene in S8.1 Expression Vector. (A) Gel elution (0.8% agarose) of neomycine transferase gene from S8.1 and RE digested pcDNA3.1(-)
(B) RE diagnosis of S8.3 recombinant plasmids isolated from transformants. Checked on 1% agarose.
The ligation mix was used to transform E. coli DH5 and 4 colonies were used for
plasmid preparation and RE diagnosis. The plasmids thus prepared and named as S8.3
expression vector. S8.1 expression vector, pcDNA3.1(-) vector and isolated S8.3
plasmids were digested with NcoI. NcoI is an additional site present in Neomycin gene
and not in GS gene. This resulted in an additional fragment of ~750 bp in S8.3
expression vector (Figure 3.1.13). After digestion clone number 5, 6, 7 and 8 gave 5
fragments as expected while S8.1 and pcDNA3.1(-) gave 4 bands. Clone #7 was used to
transfect SP2/0 cells and the recombinant cell line designated as S8.3 and CHO cells
designated as S8.4.
3.1.3. Conclusion:
The pcDNA3.1(-) was used as a back bone vector to generate various dual promoter
vectors and different selection markers. In the present study, the expression vectors
constructed possess CMV as the promoters to express anti-EGFR antibody. These
vectors could be used for any future projects for cloning of two different genes under the
control of same, CMV promoter.
The S8.1 expression vector constructed to bear GS as selection marker and S8.3
expression vector possess neomycin transferase gene as selection marker which will be
used to generate stable cell line to be used at commercial scale.
1.2 kb
7.5 kb
0.75 kb

Page 107 of 235
3.2. Cell Line Development
3.2.1. Preamble
3.2.1.1 HOST SYSTEM:
CHO (Chinese Hamster Ovary, Cricetulus griseus) Cells:
Until the later part of the 20th century, isolation and characterization of mammalian cell
mutants for cytogenetic studies was a challenging exercise, fraught with failures because,
unlike microbes, mammalian cells are generally diploid. The establishment of CHO
cells by Dr. Theodore T. Puck of the Department of Medicine at the University of
Colorado in 1957 enabled researchers to overcome this difficulty because these cells
were functionally hemizygous for many genes, primarily due to gene inactivation. It was
also noticed that CHO cells have low chromosome number of (2n=22) which made them
particularly useful models in radiation cytogenetics and tissue culture studies (Jayapal, et
al. 2007). CHO cells have, thereafter, been used in numerous biomedical studies ranging
from analysis of intermediary metabolisms, cell cycle to toxicity studies, and
commercially for manufacturing of therapeutic proteins, so much so, that they have been
termed as the mammalian equivalent of the model bacterium, E. coli (Puck 1985).
CHO-K1 was derived from the original CHO cell line. It contains slightly lower DNA
content than the original CHO. In this research work CHO-S cell line was used which is
a stable aneuploid cell line distinguished as a separate sub-clone from the common CHO-
K1 cell line and its history and stability is described in literature (Puck 1985; Deaven &
Peterson 1973; and D’Anna 1996).
The CHO and CHO-K1 cell lines can be obtained from a number of biological resource
centers such as the European Collection of Cell Cultures (ECACC) and American Type
Culture collection (ATCC). The CHO-S used in this project was procured from
Invitrogen (Cat # 11619-012).
CHO-S typically is a suspension adapted cell line but when grown in presence of serum
and under static condition grows as adherent culture like CHO-K1 (Figure 3.2.1).

Page 108 of 235
A) B)
Figure 3.2.1 A typical Morphology of CHO-S adherent Cells.
A) Adherent cell morphology and B) suspension cell morphology. Observed under a magnification of 10x
in inverted phase contrast microscope.
SP2/0 AG14 (ATCC No. : CRL-1581) Cells:
The line was formed by fusing Balb/c spleen cells (from mouse immunized with sheep
RBCs) with the P3X63Ag8 myeloma cell line. The cells do not secrete immunoglobulin,
are resistant to 8-azaguanine at 20 µg/mL and are HAT sensitive (Shulman, et al 1978).
SP2/0-Ag14 cells can be used as fusion partners for B cells in the production of
hybridomas. It grows in suspension culture as shown in Figure 3.2.2.
A) B)
Figure 3.2.2 A typical morphology of SP2/0 AG14. A) Cell grown at lower density (e.g. day 1 of seeding) and B) cell grown at higher density (e.g. day 3 of
seeding). Observed under a magnification of 10x in inverted phase contrast microscope.
This cell line is also used for the expression and manufacturing of therapeutic
monoclonal antibodies. However, it is not as widely used as CHO cells, and till date
only four mAb molecules are commercially available including the one in discussion. In

Page 109 of 235
the following studies the expression vectors (S8.1 and S8.3) constructed were transfected
in both CHO-S and SP2/0 cells for evaluating expression of protein of interest.
3.2.1.2 TRANSFECTION:
Transfection of animal cells typically involves opening transient pores or "holes" in the
cell membrane, to allow the uptake of DNA material. Transfection can be carried out
using calcium phosphate, by electroporation, or by mixing a cationic lipid with the DNA
material to produce liposomes, which fuse with the cell membrane and deposit their
cargo inside. The principle of transfection techniques employed are discussed below:
Lipofection
Lipofection or liposome mediated transfection is a technique used to inject genetic
material into a cell by means of liposome, which are vesicles that can easily merge with
the cell membrane since they are both made of a phospholipid bilayer. Lipofection
generally uses a positively charged (cationic) lipid to form an aggregate with the
negatively charged (anionic) genetic material. A net positive charge on this aggregate
has been assumed to increase the effectiveness of transfection through the negatively
charged phospholipid bilayer. In addition, this method is suitable for all transfection
applications (transient, stable, co-transfection, reverse, sequential or multiple
transfections). High throughput screening assay has also shown good efficiency in some
in-vivo models. This method is the most preferred due to its low toxicity to the cell.
Figure 3.2.3 represents the liposome mediated transfection.
Figure 3.2.3 Liposome-mediated transfection.
Red rounds are the lipid DNA complexes. (Turbofect is a trade name for transfection reagent from MBI-
Fermentas)

Page 110 of 235
The expansion of biotherapeutics, most notably monoclonal antibodies and recombinant
proteins, has created the need for rapid methods to produce protein, display correct co-
and post-translational modifications, and create enough protein yields to facilitate further
assay development validation, and high expressing cell line making commercial process
economical. One of the most commonly used cell line is CHO cells because they are
easily adapted to serum-free conditions in suspension cultures, generate high-level
protein production and widely used in biopharmaceutical industry. Often researchers
start with transient transfection methods during the optimization stage while stable
clones are being screened for large-scale manufacturing. Optimization of transient
transfection involves cell selection, media compatibility and reagent to DNA ratio, with
the goal of having high yield at reasonable cost. With the time and development in the
process many pharmaceutical companies are utilizing strains or variants that have
enhanced secretion capabilities or suppressed apoptotic liability. Targeted proteins or
variants may exhibit differential protein expression profiles requiring reagent to nucleic
acid optimization and selection of ideal media growth conditions. The selection of
reagent and cell culture media can greatly impact transfection performance and overall
protein yield. For optimization, a range of reagent to plasmid ratios at selected culture
densities is suggested, with choice of reagent impacted by media compatibility and
protein yield. Another consideration is cost versus yield. Often though, higher yields are
desired in which case lipid-based reagents may be preferred (Hayes 2010).
A wide range of transfection reagents are commercially available which are of various
types and compatibility resulting in different transfection efficiency. The most widely
use of following reagents are reported and hence these were tried to transfect SP2/0 and
CHO cell lines. The reagents used are:
(a). Lipofectamine™2000
This is a proprietary formulation from Invitrogen, USA for transfection of nucleic acid
(DNA and RNA) into Eukaryotic cells and provide following advantages:
Highest transfection efficiency in many cell types and formats (e.g. 96well).
DNA-Lipofectamine™ 2000 complexes can be added directly to cells in culture
medium, in the presence or absence of serum.

Page 111 of 235
Lipofectamine™ 2000 may be used in the following applications:
Transient and stable transfection of adherent and suspension cells
High throughput transfections
Delivery of Stealth RNAi and siRNA into cells.
The cell lines reported to be successfully transfected using Lipofectamine™ 2000 are
(www.invitrogen.com):
HEK293F HEK293H HEK293
BE(2)C (w/o serum)
CHO-K1 CHO-S (adherent) CHO-S (suspension)
COS-1 (w/o serum) COS7-L(w/o serum) Primary Human
Fibroblasts
HT-29 (w/o serum) HT-1080 MDCK
MRC-5 (w/o serum) PC12 SK-BR3
Vero CHO CHO-DG44
MCF7 MDA-MB-361 HCT 116
H1299 RKO Hep3B, HepG2
HeLa Rzneo HOS
C3H/10T1/2 NIH3T3 Jurkat
K562 HUVECS LoVo
A549
(b). TransIT® 2020
This is a proprietory Broad Spectrum DNA Delivery reagent available from Mirus Bio,
USA. It achieves high expression in many cell types, including hard to transfect cell
lines and primary cells. TransIT®-2020 demonstrated higher protein yield when
compared to other competitor reagents like FuGENE® HD, Lipofectamine™ 2000, and
Lipofectamine™ 2000 CD. It is also compatible and superior for obtaining higher
expression than other insect cell transfection reagents. It is an animal origin-free
components providing high performance with maximum compatibility. In addition to
the cell lines listed below, this reagent is known to successfully transfect following cell
lines:

Page 112 of 235
2B4.11 C6 CD-18Co
Colon 38 Daoy DB-TRG-05MG
DI-TNC1 HL-1 INS-1
J774A.1 K-562 KYSE 410
LS180 MCF-7 MDA-MB-231
Monc-1 NCCIT NCI-H522
NE-1 Neuro-2a NRK-52E
PC-12 Phoenix™ Eco RAW 264.7
RGC-5 Saos-2 SH-EP1
SH-SY5Y SK-N-BE(2) T-98G
TE-8 U2OS
(c). TurboFect™:
TurboFect™ in-vitro Transfection Reagent available from MBI fermentas, USA is a
sterile solution of a proprietary cationic polymer in water. The polymer forms compact,
stable, positively charged complexes with DNA. These complexes protect DNA from
degradation and facilitate gene delivery into eukaryotic cells. TurboFect™ is ideal for
transfection of a variety of cells, including primary and secondary cell lines, adherent
and suspension cell lines, differentiated and undifferentiated cell lines, and for stable and
transient transfection. Transfection can be performed in presence or absence of serum.
TurboFect™ demonstrates superior transfection efficiency and minimal toxicity when
compared to lipid-based or other polymer-based transfection reagents.
This reagent is reported applications for:
Plasmid DNA and oligonucleotide transfection.
mRNA transfection.
Co-transfection.
Transfection of primary and secondary cell lines.
Stable and transient transfection.
This reagent in addition to the entire above cell lines listed is used for following cell
lines:
B50 BAEC BHK-21
Calu1 COLO HEL299
L929 MEF MPC5
NTEPA2 RAW264 RBL-2H3
Sp2/Ag14 WEHI

Page 113 of 235
Calcium-Phosphate:
As depicted in Figure 3.2.4, DNA-calcium phosphate precipitates are formed by mixing
DNA with calcium chloride and gently bubbling in the saline/phosphate solution
followed by incubation at RT. These precipitates were added onto the cells which adhere
to surface of cells. The precipitates are taken up presumably by endocytosis. This co-
precipitation method is widely used because the components are easily available at a
reasonable price. The large precipitates thus formed upon incubation sometimes lead to
cellular toxicity and reduced transfection efficiency.
Figure 3.2.4 Calcium Phosphate Precipitation Method for transfection
Electroporation
Electroporation or electro-permeabilization is a significant increase in the electrical
conductivity and permeability of the cell plasma membrane caused by an externally
applied electrical field. It is usually used in molecular biology as a way of introducing
some substance into a cell, such as loading it with a molecular probe, a drug that can
change the cell's function, or a piece of coding DNA.
In molecular biology, the process of electroporation is often used for the transformation
of bacteria, yeast, eukaryotic cells and plant protoplasts. The cells and plasmids are
mixed together before applying several hundred volts across a distance of several
millimeters are typically used in this process for transfer of DNA into the cells. This
process is reported to be around ten times as effective as chemical transformation.
Electroporation allows cellular introduction of large highly charged molecules such as
DNA which would never passively diffuse across the hydrophobic bilayer core. This
phenomenon indicates that the mechanism is the creation of nm-scale water-filled holes
in the membrane. During electroporation the lipid molecules are not chemically altered

Page 114 of 235
but simply shift position, opening up a pore which acts as the conductive pathway
through the bilayer as it is filled with water.
Electroporation is a multi-step process with several distinct phases as shown in Figure
3.2.5 (Weaver and Chizmadzhev 1996). First, a short electrical pulse must be applied,
typical parameters would be 300-400 mV for < 1 ms across the membrane (note- the
voltages used in cell experiments are typically much larger because they are being
applied across large distances to the bulk solution so the resulting field across the actual
membrane is only a small fraction of the applied bias). Upon application of this potential
the membrane charges like a capacitor through the migration of ions from the
surrounding solution. Once the critical field is achieved there is a rapid localized
rearrangement in lipid morphology. The resulting structure is believed to be a “pre-pore”
since it is not electrically conductive but leads rapidly to the creation of a conductive
pore. Evidence for the existence of such pre-pores comes mostly from the “flickering” of
pores, which suggests a transition between conductive and insulating states. It has been
suggested that these pre-pores are small (~3 Å) hydrophobic defects. If this theory is
correct, then the transition to a conductive state could be explained by a rearrangement at
the pore edge, in which the lipid heads fold over to create a hydrophilic interface.
Finally, these conductive pores can either heal, resealing the bilayer or expand,
eventually rupturing it. The resultant fate depends on whether the critical defect size was
exceeded which in turn depends on the applied field, local mechanical stress and bilayer
edge energy.
This method needs a very fine standardization to suit the cells otherwise it can lead to
high toxicity.

Page 115 of 235
Figure 3.2.5 Electroporation as a mode of DNA transfer
Nucleofection®
Nucleofection technology called Amaxa Nucleofector® Technology available from
Lonza Bioscience is reported to yield higher transfection efficiency when compared with
lipofection or any chemical based transfection. It is reported that Nucleofection®
achieves 10-30 times higher expression rates in CHO cells compared to cells transfected
with lipofection. A similar ratio has been determined for both the specific and the
volumetric productivities (www.lonza.com). The picture of Amaxa Nucleofector®
equipment is shown in Figure 3.2.6:
DNA mixed with Cells in Buffer
Application of Electric Field and movement of ions based
on charge
Pathways formed which allows DNA to enter cells
Healing of cells when the electric field is deactivated

Page 116 of 235
Figure 3.2.6 Amaxa Nucleofector® Equipment
The equipment comes with preset programs specific for most of the cell lines used for
transfection in research and industry. The Nucleofection kit comes with the specialized
cuvettes in which the cells were added after resuspension in the nucleofection reagent
followed by exposure to the electric shock. In the present study lipofection,
electroporation and nucleofection were used for transfection from which lipofetion was
used for generating the recombinant CHO cell line mainly because of its easy availability
and economic advantage. The same methods of transfection were also used to generate
the SP2/0 cell line.
3.2.1.3 GENERATION OF POOLS AND MINIPOOLS
The cells after transfection with either method listed above were allowed to continue to
grow for 48 hrs to recover from the shock given during the transfection. The cells were
then exposed to the selection pressure (eg. Geneticin G418). The cells were subcultured
if the cells overgrow, and the cells were named “Pool” labeled alphabetically.
Following identification of top high expressing Pool, the cell population was diluted
further to narrow down the heterogenity in the population by plating few cells per well
called “Minipool”. The minipools were evaluated based on cell growth and expression
yield following which the top expressing minipool was diluted to clonality for achieving
single cell population.
3.2.1.4 SELECTION OF HIGH-PRODUCING CLONES
The screening procedure for high-producing cell lines is extremely time- and labor
intensive and costly, and is at present guided by an empirical approach based on
individual experience. The main problem is that such high-producing subclones are rare
and spend much of their energy on production, and thus have reduced growth rates. This

Page 117 of 235
leads to overgrowth of non- or low-producing cells. The obvious solution would be to
clone single cells by limited dilution methods. This is not always possible, however, due
to the poor cloning efficiency of mammalian cells. As a compromise, the number of
cells in each well can be increased to obtain a reasonable number of clones, which will
be heterogeneous in nature (Minipool). Inevitably, cells with higher growth rates are
more likely to comprise the main population in the microwell plate. The result is that
many wells need to be screened and tested to finally find a clone with an increased
production rate (Broth, et al 2001). The minipools were diluted either using manual
limited dilution method or automated ClonePix FL® instrument to select the best clone.
3.2.1.5 TYPICAL FLOW OF CELL LINE DEVELOPMENT
Western Blot & ELISA
Protein expression analysis by ELISA/WB
Dilution cloning -1: 2-3 x 96 well plates Plating @ ~100 cells / well
Expression analysis & short listing of ~3-5 minipools
Dilution Cloning -2: 2-5 x 96 well plates of best producer MP from Dil. Cloning – 1 &
Plating @ 1-5 cells / well.
Screening of ~ 200 Clones from each pool by WB
Vector Construction & Gene Cloning
Transfection (1-2 ug DNA) – in 6 well TC plate
Selection of Pools upon G418 application
Gene amplification using MSX (if applicable)
Alternatively, outsourced for automated selection using ClonePix
Clone Selection, 5-10 from each selection procedure based on cell growth and productivity

Page 118 of 235
Figure 3.2.7 Flow Chart of Cell Line Development
Note: The above shown flowchart is a typical of the activity performed in-house except
the automated selection of clone using ClonePix (light blue box). In case where
automated system was used to select single clone Limiting Dilution 2 is not required
3.2.2. Results and Discussion
3.2.2.1. Evaluation of Different Transfection Reagents & Methods:
The transfection reagents listed above were used to transfect the expression vector in
SP2/0 and / or CHO cells for generating SP2/0 AG-14 & CHO cell lines using S8.1
expression vector.
As per the conclusion drawn from section 3.1.2.6, S8.1 expression vector has GS as
selection and amplification marker. After transfection, the cells were selected and gene
amplification done with exposure of cells with increasing concentration of Methionine
Sulphoximine (MSX).
Transfection of SP2/0:
The SP2/0 cells were seeded at 0.4 x 10⁶ cells/well (at 0.2 x 10⁶ cells/mL) concentration
a day prior to transfection. The transfection was carried out using different transfection
reagents as listed above section 3.2.1 with different DNA : transfection reagent ratio. The
S8.1 expression plasmid and pcDNA3.1(-) were co-transfected so that the initial
Serum Free Adaptation of top producers (~5 clones)
Identification of 3 Research Cell Bank Candidates
Identification of Lead Clone based on productivity and product quality
Clone Stability studies in presence and absence of selection pressure (~5 clones)
Final Clone SeleCtion

Page 119 of 235
selection can be carried by antibiotic Geneticin G418 selection. The cell supernatant was
analyzed for expression of antibody using western blot and ELISA after Protein-A
affinity purification step. After 48 hrs of transfection ~1 mL of cell supernatant was
collected, purified and concentrated using Protein-A column. The eluate was checked
for the expression of antibody using anti-IgG kappa HRP conjugated antibody (Figure
3.2.8). The cell line generated was labeled as S8.1
Figure 3.2.8 Western Blot Analysis of SP2/0 transfectants
The cell supernatant analyzed from S8.1 Cell Line generated by various transfection agents
A distinct band of ~200kDa in Non-reducing gel and ~25 kDa in reducing gel was
observed in Pool A (ie. Transfection done using Lipofectamine 2000). A very faint band
of similar size was observed in Pool E also (not visible in the above scan image but was
seen at the time dot blot development), the case where transfection was done using
TurboFect® reagent.
These two transfection pools were subjected for antibiotic selection and MSX
amplification in 12-well TC plates. Each pool was split into two wells, in one well the
cells were exposed to 500 µg/mL Geneticin G418 and in other well 500 µg/mL Geneticin
+ 50 µM MSX was added. The MSX concentration was increased gradually upto 200
µM. The cell supernatants from both Pool A and Pool E were collected and antibody
concentration in them was estimated using ELISA. As shown in Figure 3.2.9, the
expression of protein increased with increase in concentration of MSX reaching ~6
mg/mL at 100 µM MSX . In Pool E however, after 100 µM the expression was observed
to be decreasing probably due to the inhibitory effect of high concentration of MSX.
There was no absorbance observed in Pool A indicating that there could be loss of gene
or shut down of expression due to reasons unknown.
10% PAGE A= Lipofectamine 2000 C = Control D = TansIT2020 E = Turbofect Ref = Reference Std. M= Mol. Wt. Marker
M
Whole IgG
LC

Page 120 of 235
Figure 3.2.9 Expression Analysis of S8.1 Pool ‘E’ by ELISA
At early passages, the expression observed was low (~6 mg/L). Limiting dilution of Pool
E was done to generate minipools. The cells were seeded at 100 cells/well of 96-well TC
plate. The cells were incubated till sufficient cell density was achieved, generally 4-5
days after which the dot blot analysis of all these minipools was done using Bio-rad
manifold system on a nitrocellulose membrane. Labeling was done using anti-IgG kappa
specific HRP antibody and detection was done by adding TMB substrate. A typical Dot-
blot scan is shown in Figure 3.2.10, and all the blots are not shown due to poor scanning
quality. The top 5 minipools selected for further use were E1, E69, E70, E82 and E83.
Figure 3.2.10 Representative Dot Blot for screening minipools
-MSX 50 µM MSX
100 µM MSX
200 µM MSX

Page 121 of 235
These five minipools were expanded in larger cell culture vessel from 96 well to 24 well
to T25 flask (data not reported). It was observed that the expression was continuously
decreasing and reduced to negligible. Hence, these S8.1 recombinant SP2/0 cell line
and minipools generated using different transfection reagents were discontinued.
Stable recombinant SP2/0 cell line could not be generated when different transfection
reagents were tried. The expression of protein of interest almost disappears after about 5
passages. This led to exploration of a nucleofector technology from Amaxa (Lonza)
which facilitated transfer of nucleic acid into the cell. This technology is similar to
electroporation whereby an electric pulse is generated using electrodes but the pulsing
regime is different and specific reagents are used which could result in the enhanced
transfection efficiency. The equipment comes with preset nucleofection procedures for
different cell lines. For SP2/0 cell line the supplier has recommended programs X001,
X005, B033, A033, and T020 which are already fed in the equipment. Out of these 5
programs one best program need to be identified to be used for generating recombinant
cell line. The exponentially growing cells (~1.5 x 10⁶ cells) were nucleofected with 2 µg
reference plasmid (pMAX) expressing green fluorescent protein (GFP). The transfected
pools (using different programs) were analyzed for the expression of GFP by measuring
fluorescent by FACS after 24 hrs of transfection, refer Figure 3.2.11. The GFP
expression of individual cell and as pools was analyzed. The cells localized in the left
quadrant are GFP non-expressing cells, typically as in Mock cells. Based on the
expression of GFP the cell localization shifts to the right hand side quadrant. The more
cell localization in right hand side quadrant indicates more transfection efficiency. Also,
based on the intensity of expression, the cells could be sorted at the first stage itself. The
maximum transfection efficiency of 71% was observed in Program X001 hence this
program was used for transfection of SP2/0 cells with S8.1 expression plasmid.

Page 122 of 235
Figure 3.2.11 Optimization of Nucleofection Conditions
The SP2/0 cells grown for not more than 48 hrs were harvested, washed with PBS and
finally resuspended in 0.1 mL of reagent supplied in the kit with effective cell
concentration of ~1.5 x 10⁶ cell / 0.1 mL. The cells were transferred to the cuvette and
mixed with ~3 µg S8.1 expression vector. The cells were exposed to Nucleofection
Program X001. After the exposure, the cells were seeded in 6 well plates for transient
productivity analysis. A negative control that is without DNA was also kept which was
labeled as Pool ‘C’. The transfected pool was labeled Pool ‘H’. After 48 hrs, the cells
were put in selection pressure 50 µM MSX. Cell toxicity was observed after about 7
days and the cell number were also less. At this stage the cells were transferred to 12
well plates. Following further incubation, the cell density increased and hence were
transferred to T25 flasks. The expression was checked from 12 well and T25 flask.
Approximately 1 mL cell supernatant was purified and concentrated to 100 µL using
Protein A resin, and was checked on 7% SDS-PAGE under non-reducing conditions and
then probed with labeled antibody to be detected in western blot (Figure 3.2.12).
TEST - Program X001
%Transfectants=
TEST – Program X005
%Transfectants= %Transfectants = 52
TEST – Program B033
%Transfectants = 38
TEST – Program A033
%Transfectants = 52
TEST – Program T020 Mock Cells-Program T020

Page 123 of 235
Figure 3.2.12 Western Blot analysis of SP2/0 transfectants
However, these cells also exhibited a loss of expression when grown further. It was also
observed that the expression of protein of interest was low when different lipid based
transfection reagents were used. Nucleofection was used in order to increase the
transfection efficiency but to maintain stable expression was not possible and hence
could not qualify to go ahead for further development at industrial scale. Also in
comparison with CHO the expression is very less and not stable in SP2/0 (discussed later
in following section).
3.2.2.2. Generation of SP2/0 & CHO cell lines using S8.3 expression vector:
An alternative strategy of generating stable transfectant was tried with S8.3 expression
vector. As mentioned in section 3.1.2 point no. 7, this vector possess only Neomycin
transferase gene as selection marker and the GS gene is removed.
The expression of protein of interest from different cell pools after transfection using
different transfection reagents as shown in Figure 3.2.13. The SP2/0 transfected cells
were labeled as S8.3/SP2 and CHO-S transfected cells as labeled S8.4/CHO. After 48
hours of transfection, cell supernatant was collected, purified using protein A and
checked on western blot, Figure 3.2.13.

Page 124 of 235
8
Figure 3.2.13 Western Blot for Expression Analysis of SP2/0 and CHO transfectants (S8.3 & S8.4
respy.)
As shown in above figure, a good detectable expression of mAb of interest was observed
when SP2/0 were transfected using TransIT reagent (Pool J) compared to
Lipofectamine2000 (Pool I). The TurboFect transfected cell pool of SP2/0 didn’t show
detectable protein expression (Pool F). Expression of protein was observed in all
transfection sets of CHO-S but more in case where transfection was done using
TurboFect (Pool D). In SP2/0 Pools ‘I’ & ‘J’, and CHO pools ‘B’ & ‘D’ antibiotic
Geneticin G418 was added starting from 200 µg/mL and reaching 500 µg/mL. These
pools were further expanded in different cell culture vessels (6 well plate, T25 and T75
flask) to study stable protein expression and selection of lead pool as assessed by
Sandwich ELISA.
6
199
116
86
50
37
kDa
1 2 3 4 5 7 6
Lane 1 & 10=Rainbow Mol. Wt. Marker Lane 2 , 3 & 9 = RMP, Lane 4= SP2/0 Pool F (TurboFect), Lane 5 = SP2/0 Pool D (TransIT), Lane 6 = SP2/0 Pool E (Lipofectamine2000) Lane 7 = CHO Pool A (TurboFect), Lane 8 = SP2/0 control cells, Lane 11 = CHO Pool B (Lipofectamine 2000), Lane 12 = CHO Pool D (TransIT), Lane 13= CHO control cells, Lane 14 = SP2/0 Pool I (lipofectamine 2000), Lane 15 = SP2/0 Pool J (TransIT).
9 10 11 12 13 14 8 15

Page 125 of 235
Figure 3.2.14 Expression Analysis of SP2/0 & CHO Pools by ELISA.
The samples were analyzed at different time intervals and different concentrations of G418.
A) Productivity trend in recombinant CHO-S cell pools,
B) Productivity trend in recombinant SP2/0 cell pools.
The expression in SP2/0 disappeared after about 72 hrs of addition of G418 which
indicates that no integration of expression plasmid happened in the genome and the
plasmid was lost during the subculturing procedure. On the other hand, the expression of
protein in CHO pools B and D was increasing with increase in subculture time and
concentration of G418. Both pools of CHO were giving similar expression of protein
(Figure 3.2.14). It was also observed that the expression did not increase when more
than 200 µg/mL G418 was added; in fact it appears to decrease at higher concentrations
(Figure 3.2.15). When expression of Pool ‘B’ and ‘D’ was measured at passage #5, the
Pool D excels in protein expression in case of recombinant CHO cells.
Figure 3.2.15 Expression comparison of in Pool B & D of CHO transfectants by ELISA

Page 126 of 235
3.2.2.3. Generation and Evaluation of Lead Research Cell Bank Clones
The B & D pools of CHO-S transfectants were the high expressing pools at initial
screening. These pools were taken further for generating minipools for which the cells
were diluted in growth media (DMEM with 5% FBS) such that each well of 96 well TC
plate received ~100 cell/well. A total of 2 x 96 well TC plates were seeded in a pattern
as referred in Figure 3.2.16. A total of 120 Minipools were generated from each pool,
i.e., 120 each from Pool B and Pool D.
Figure 3.2.16 Plate Pattern followed for seeding cells for Minipool and Clonal population
generation. Outer grey colored wells are not used and only PBS was added
The plates were incubated for a week’s time or when the confluency reached ~70-80%
before analyzing for expression using ELISA. About 100 µL cell supernatant was
directly put in the ELISA plate pre-coated with Human IgG Fc-Specific monoclonal
antibody. From the 120 minipools generated from Pool B, Minipool # B25, B80 & B96
gave highest expression and were shortlisted for further experimentation (Figure 3.2.17),
B #1 and B #66 were not selected as it was observed that the growth of these cells are
very sluggish. Similarly, from Pool D, Minipool #D7, 41 & 51 were selected (Figure
3.2.18) while D #1, D #37 and D #48 were not selected because of sluggish growth.

Page 127 of 235
Figure 3.2.17 Comparison of Expression in Pool B Minipools by ELISA
'D' MiniPool Screening (96 well)
0.00
5.00
10.00
15.00
20.00
25.00
30.00
35.00
MiniPool ID
Pro
duct
ivity
(ng/
mL)
Figure 3.2.18 Comparison of Expression in Pool D Minipools by ELISA
The percentage confluency in Minipool D41 was less compared to other minipools,
though it gave higher absorbance / higher expression yield, hence is considered as
potential lead minipool.
The minipools thus generated were propagated in different culture vessels depending on
the cell density achieved. The minipools generated from B & D pools were compared at
6 well plate and 12 well plates scale.
The minipools of D were leading when the expression was compared to B minipools
(Figure 3.2.19); hence D minipools were considered for further clonal selection
procedure.
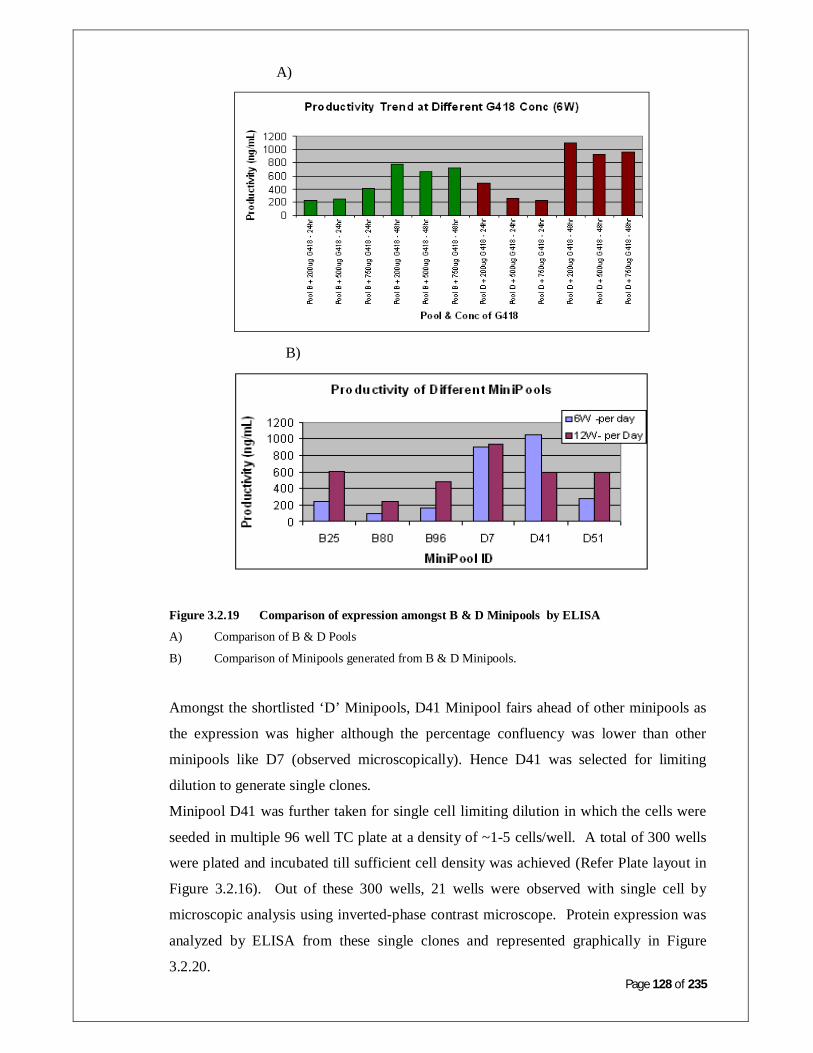
Page 128 of 235
A)
B)
Figure 3.2.19 Comparison of expression amongst B & D Minipools by ELISA
A) Comparison of B & D Pools
B) Comparison of Minipools generated from B & D Minipools.
Amongst the shortlisted ‘D’ Minipools, D41 Minipool fairs ahead of other minipools as
the expression was higher although the percentage confluency was lower than other
minipools like D7 (observed microscopically). Hence D41 was selected for limiting
dilution to generate single clones.
Minipool D41 was further taken for single cell limiting dilution in which the cells were
seeded in multiple 96 well TC plate at a density of ~1-5 cells/well. A total of 300 wells
were plated and incubated till sufficient cell density was achieved (Refer Plate layout in
Figure 3.2.16). Out of these 300 wells, 21 wells were observed with single cell by
microscopic analysis using inverted-phase contrast microscope. Protein expression was
analyzed by ELISA from these single clones and represented graphically in Figure
3.2.20.

Page 129 of 235
Screening of D41 Clones
0100200300400500600700800900
D41
D23
D41
E34
D41
G51
D41
G58
D41
C79
D41
F107
D41
F109
D41
G11
2
D41
D11
6
D41
B12
5
D41
C14
0
D41
D16
0
D41
D15
6
D41
B18
9
D41
B19
0
D41
E21
3
D41
F229
D41
B24
3
D41
B24
8
D41
G27
7
D41
F284
D41
G29
1
Clone ID
Cor
r. Pr
od (n
g/m
L)
Figure 3.2.20 Comparison of expression of clones generated from Minipool D by ELISA
Corrected productivity was plotted which was calculated by dividing productiovity
with viable cell count X10^6 cells.
The clone #D41F109, D41G112, D41D116, D41C140, D41E213, AND D41F284
(purple colored bars) are higher expressing and are potential top expressing clones which
are selected for further analysis. The selected clones were propagated in the larger
volume culture vessel (T25 cm2 flask) and the expression was compared amongst the
shortlisted clones (Figure 3.2.21). The cells were grown in static conditions for 72 hrs
before the cell culture supernatant was analyzed for expression by ELISA.
Figure 3.2.21 Comparison of D41 clones by ELISA
Corrected productivity was plotted which was calculated by dividing productiovity with viable cell
count X10^6 cells. The data plotted are from two independent experiments.
It was observed that clone # D41D116, D41C140 and D41E213 gave higher expression
than other clones. Clone # D41G277 gave higher expression in one experiment (this
could be an outlier) and hence the error bar is too spread-out, while clone # D41G291
was observed to be very fast growing but have low expression level. Hence D41G277
Corr
. Pro
d.
(ng/
10^6
cel
ls)
Corr
. Pro
d.
(ng/
10^6
cel
ls)
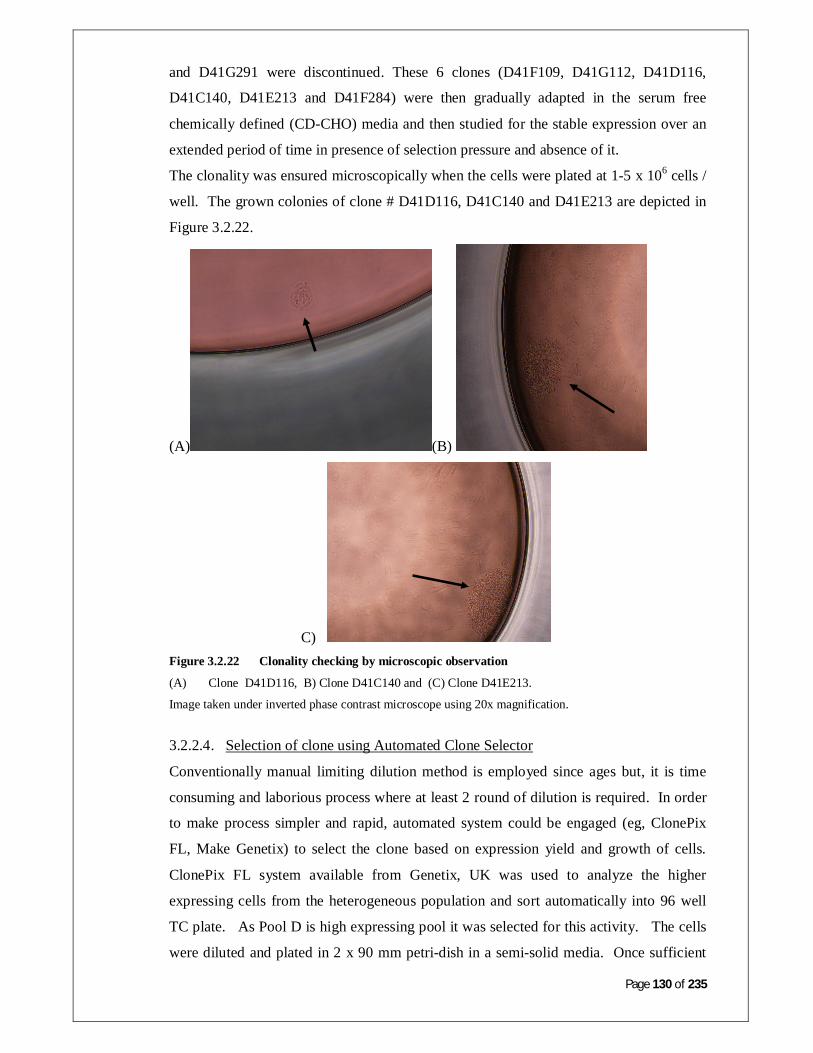
Page 130 of 235
and D41G291 were discontinued. These 6 clones (D41F109, D41G112, D41D116,
D41C140, D41E213 and D41F284) were then gradually adapted in the serum free
chemically defined (CD-CHO) media and then studied for the stable expression over an
extended period of time in presence of selection pressure and absence of it.
The clonality was ensured microscopically when the cells were plated at 1-5 x 10⁶ cells /
well. The grown colonies of clone # D41D116, D41C140 and D41E213 are depicted in
Figure 3.2.22.
(A) (B)
C) Figure 3.2.22 Clonality checking by microscopic observation
(A) Clone D41D116, B) Clone D41C140 and (C) Clone D41E213.
Image taken under inverted phase contrast microscope using 20x magnification.
3.2.2.4. Selection of clone using Automated Clone Selector
Conventionally manual limiting dilution method is employed since ages but, it is time
consuming and laborious process where at least 2 round of dilution is required. In order
to make process simpler and rapid, automated system could be engaged (eg, ClonePix
FL, Make Genetix) to select the clone based on expression yield and growth of cells.
ClonePix FL system available from Genetix, UK was used to analyze the higher
expressing cells from the heterogeneous population and sort automatically into 96 well
TC plate. As Pool D is high expressing pool it was selected for this activity. The cells
were diluted and plated in 2 x 90 mm petri-dish in a semi-solid media. Once sufficient

Page 131 of 235
sized colonies appeared, the cells were labeled with Recombinant anti-human IgG FITC
(Cat # K8295 Lot # CDU1010A, Make Genetix). The fluorescence intensity depends on
level of expression of antibody by the transfected cells (Figure 3.2.23)
Figure 3.2.23 Image generated from ClonePix FL.
(A) Observation of colonies under white light
(B) Observation of colonies under Fluorescent mode
From both the plates ~1000 colonies were selected based on fluorescence and transferred
with the help of automated arm in the 96 well plates for further growth and expression
analysis. The outgrowing of cells and colony proximity was monitored by CSI
(CloneSelect Manager Software) as shown in Figure 3.2.24.
Figure 3.2.24 Image generated from the CloneSelect Imager to determine confluency (%)
The software gives information about the growth of the individual colony and the
expression of the clone. The fluorescent, expression analysis and proximity number was

Page 132 of 235
measured on Day 6 and analyzed by Clone Select Image software. Based on these
analysis 30 clones were shortlisted for further analysis. The quantitative expression of
recombinant mAb was done using Sandwich ELISA (Table 3.2.1)
Table 3.2.1 Comparison of Clones Selected for analysis from ClonePix by ELISA
The ratio was calculated by using concentration (µg/mL; expression yield determined by
ELISA) and %Confluency derived from CSI data of individual clones. The growth rates
of the listed clones were monitored as shown in Figure 3.2.25.

Page 133 of 235
Figure 3.2.25 Growth Rate determination of top 30 shortlisted clones from ClonePix
Shortlisting of top 10 clones out of 30, the cell growth, expression and proximity values
were considered and rated as tabulated in Table 3.2.2
Table 3.2.2 Comparison of top 10 clones selected by ClonePix.
The selection was done based on expression yield, proximity and %confluency
Table 3.2.3 Specific productivity of the top 5 clones selected by ClonePix
The 5 clones highlighted in Table 3.2.2 were shortlisted for specific productivity
determination and calculation (Table 3.2.3) based on which clone # 1A7, 2F5 and 2H5
was selected for further use.
3.2.2.5. Adaptation to Serum Free Media and Suspension Culture
All the cloning work and selection were done in DMEM media containing 5% Foetal
Bovine Serum (FBS). FBS is a very complex animal derived product, having lot to lot
variation and has regulatory concerns. Hence, it is not preferred at the industrial scale.
Therefore, it was decided to remove FBS and grow the recombinant cell lines in
chemically defined media (CD-CHO). CHO cells inheritably are adherent cells and this
makes their large scale cultivation cumbersome apart from controlling its product
quality. For industrial applications, the suspension culture-based manufacturing process
has become the method of choice for therapeutically important proteins from rCHO cells

Page 134 of 235
(Lee, et al 1999). The top 6 clones selected from manual limiting dilution and top 3
clones selected from ClonePix were gradually adapted to chemically defined media (CD-
CHO, Invitrogen). The clones after adaptation in serum free media were adapted in
suspension culture. All the 9 clones got adapted in serum free and suspension conditions
except 2H5 (ClonePix) clone which didn’t give good growth profile after adaptation.
These clones were evaluated for productivity and quality assessment for expressed
product.
3.2.2.6. Comparison of manually selected clones and ClonePix selected clones
The clones were grown in CD-CHO media in 6well and T25 cm2 flask under static
condition and in 125mL shake flask under shaking conditions. The expression yield was
estimated on Day 4 by ELISA. Based on the cell growth and productivity data clone #
D41D116, D41C140 and D41E213 (manual selection) and Clone # 1A7, 2F5 and 2H5
(ClonePix Selected) were shortlisted. These clones were compared across different scale
of culturing for productivity analysis (Figure 3.2.26).
Figure 3.2.26 Productivity comparison of manually and automated selected clones.
The comparison was done across different scales starting from 6-well TC plate to T25 cm2 TC flask to
shake flask
The productivity in suspension culture (shake flask) is similar or more than the static
cultures except for clone D41D116 where the productivity reduced in shake flask
indicating some changes could have happened during adaptation phase.

Page 135 of 235
An interesting observation was that the expression yield of clones selected using
ClonePix were significantly less than the clones selected by manual limiting dilution.
This observation was in contrast to the fact that selecting more number of clones and that
too using automated system which possess all possible tools should give the best clones.
Based on this observation clones D41D116, D41C140 and D41E213 were selected for
further experimentation.
3.2.2.7. Preparation of Cell Banks
The cells generated at every stage starting from the transfection was preserved and stored
in liquid nitrogen storage tank in vapor phase. When the growing cells reaches
exponential growth phase, the cells were centrifuged and pellet resuspended in the
cryoprotectant media containing DMSO as cryoprotectant. The number of cells
preserved depends on the cell availability at different stages. At early stages the vials
were prepared at cell density of ~2 x 10⁶ cells/vial while for the primary cell bank the
cell density preserved was ~10 x 107 cells/vial. The Primary Cell bank was prepared of
clone #D41D116, D41C140 and D41E213 was revived from the earlier cell bank
prepared and cells were propagated in shake flask till sufficient cell density was
achieved to cryo-preserve ~10 vials at ~10 x 107 cells/vial.
3.2.2.8. Characterization of Primary Cell Bank
Contamination Check
After preservation the cells were revived and tested for presence of any bacterial or
fungal contamination by inoculating cell culture supernatant in LB-broth and
Sabouraud’s Dextrose broth, respectively. The LB-broth tubes were incubated at 37 0C
while Sabouraud’s Dextrose broth tubes after inoculation were incubated at RT for 14
days to monitor any microbial growth. No contaminant growth was observed in either
tubes indicating the cell bank is free of any microbial or fungal contamination. Another
important contaminant to be monitored is Mycoplasma which impact the cell line’s
growth and performance. As the growth and prevalence of mycoplasma could be at a
low level hence a more sensitive and rapid method based on PCR principle was used
(LookOut Mycoplasma detection Kit, Sigma Cat# MP0035). The LookOut®
Mycoplasma PCR Detection Kit utilizes the polymerase chain reaction (PCR), which is
established as the method of choice for highest sensitivity in the detection of
Mycoplasma, Acholeplasma, and Ureaplasma contamination in cell cultures and other

Page 136 of 235
cell culture derived biologicals. Detection requires less than 5 mycoplasma genomes per
microliter of sample (~ 5 fg DNA).
The primer set is specific to the highly conserved 16s ribosomal RNA coding region in
the mycoplasma genome. The PCR amplified product was run on agarose gel for
detection of amplicon from mycoplasma, if any. This method can detect about 18 species
of commonly found mycoplasma.
Figure 3.2.27 Detection of Mycoplasma by PCR based method. The PCR amplified product was checked on 1% agarose gel.
The case where the mycoplasma contamination is present a band of ~250 bp should be
observed as shown in positive control. In all the clones tested no amplified product of
~250 bp observed indicating that all the clones tested were found to be mycoplasma-free
(Figure 3.2.27).
Cell growth profile and productivity
To monitor any changes happening during the freeze-thaw cycle of the cells, the cell
growth and productivity profile was monitored for all the three clones. The frozen vial
from the primary cell bank was revived in 125mL shake flask containing 40 mL of CD-
CHO supplemented with 4mM Glutamine, 25 µg/mL Dextran Sulphate and Pencillin-
Streptomycin solution. The seeding density maintained was ~0.25 x 10⁶ cell/mL. The
cells were grown for at least three passages before using it for the initiation of fed-batch
culture for checking expression of target mAb. For initiating fed-batch the cells were
seeded in shake flask at 0.5 x 10⁶ cell/mL in a total volume of 40 mL. For the first three
days cells were grown at 37 0C temperature after which the temperature was brought

Page 137 of 235
down to 32 0C . The CO2 and shaking speed was maintained at 5% and 120 rpm
throughout the fed-batch. At every alternate day starting from Day 3, 10% v/v Feed
cocktail {Efficient Feed A / Efficient Feed B (1:1, v/v)} was added. The fed-batch was
terminated when the viability dropped below 80%.
A)
Growth Profile of Three Top Clones in Shake Flask
10.00
20.00
30.00
40.00
50.00
60.00
70.00
80.00
90.00
100.00
0.0 50.0 100.0 150.0 200.0 250.0 300.0 350.0 400.0
Cell Age (Hrs.)
% V
iabi
lity
0.00
1.00
2.00
3.00
4.00
5.00
6.00
7.00
8.00
9.00
10.00
Viab
le C
ell C
ount
(x10
E6)c
ells
/mL
D41D116
D41C140
D41E213
D41D116
D41C140
D41E213
B)
IVCC Profile in Shake Flask
0
10
20
30
40
50
60
70
80
0.0 50.0 100.0 150.0 200.0 250.0 300.0 350.0 400.0
Age (Hrs.)
IVC
C (x
10E
6 ce
lls. d
ay /
mL)
D41D116D41C140D41E213
Figure 3.2.28 Growth Profile of three shortlisted clones of rCHO
(A) Viable cells and Viability Profile; arrow represents the time of addition of feed
(B) Integral Viable Cell Count (IVCC) profile. Arrows indicate the time when the feeding was done

Page 138 of 235
As shown in Figure 3.2.28, all the cell growth profiles were comparable amongst the
clones except clone D41D116 where the IVCC reached more than 6.0 x 10⁷ cell/mL
while in other two clones it was not more than 5.0 x 10⁷ cell/mL.
Productivty Profiles in Shake Flask
0
5
10
15
20
25
30
35
40
45
50
55
60
65
0 10 20 30 40 50 60 70 80
IVCC (x10E6 cells.days/mL
Prod
uctiv
ity (m
g/L)
D41D116D41C140D41E213
Comparison of Productivity in Shake Flask
0
10
20
30
40
50
60
70
0 2 4 6 8 10 12 14 16
Days
Prod
uctiv
ity (m
g/L)
D41D116D41C140D41E213
A)
B)

Page 139 of 235
Comparison of Specific Productivity in Shake Flask
0.00
0.20
0.40
0.60
0.80
1.00
1.20
1.40
0 10 20 30 40 50 60 70 80
IVCC (x10E6) cells/mL
Qp
D41D116D41C140D41E213
Figure 3.2.29 Productivity Comparison of top 3 clones of rCHO
(A) Productivity Profile – IVCC vs. Productivity; (B) Comparing productivity over a period of time in fed-
batch culture; (C) Comparing specific productivity that is capacity of clone for production.
As shown in Figure 3.2.29: A & B, the expression yield increases with time and IVCC.
The maximum expression yields observed are ~58, 52 and 34 mg/L in clone ##D41E213,
D41C140 and #D41D116 respectively. Similarly, the specific productivity of clone
#D41E213 was higher reaching to ~1.2 with increase in IVCC. The expression yield
profile and cell growth profiles were similar to the earlier bank from which the primary
cell bank was prepared.
3.2.2.9. Clone stability studies
The clone stability is an important parameter to be monitored for the recombinant cell
lines. Generally, the industrial production of recombinant therapeutic monoclonal
antibodies are operated at >500L in order to meet patient’s dose and market demand.
The recombinant cell line generated for expressing mAbs should be genetically stable for
sustained expression for at least 50 generations. This is because of the fact that in each
passage about 3-4 generations are passed (starting from master cell bank preparation to
the end of cycle of final production stage). Hence, for master cell bank (MCB)
preparation of ~200 vials, about 10 generations will be utilized. When one of these vials
are scale up for production, starting from 40 mL 200 mL 1L 5L 20L
150L 500 L, about 18-20 generations would be required. Finally, the cells would be
grown in fed-batch mode for about 20 days (~8-10 generations). Thus, the cells should
be stable for > 45 generations. Considering this, the clone stability of top 6 clones
D41F109, D41G112, D41D116, D41C140, D41E213 and D41F284 was monitored by
C)

Page 140 of 235
in-vitro cell age for 76 days in a T25cm2 TC flask in presence of selection pressure of
antibiotic (Geneticin G418). The stability was determined by estimating recombinant
protein production (Figure 3.2.30).
Figure 3.2.30 Clone stability in presence of selection pressure (G418) of rCHO
A drop in expression yield on Day 39 could be an outlier because following Day 39 expression profile came
in trend. Corrected productivity was plotted which was calculated by dividing productiovity with
viable cell count X10^6 cells.
At the end of 76 days culturing in presence of Geneticin-G418, a loss of expression to
the extent of ~34%, 35% and 16% was observed in clones D41D116, D41C140 and
D41E213, respectively. This loss is not significant compared to other three clones where
the loss was ~ 91%, 96%, and 74% in D41F109, D41G112 and D41F284, respectively.
The loss of expression in latter 3 clones is in presence of selection pressure hence in
absence of selection pressure these would practically not produce anything when
cultured for long time.
D41D116 and D41E213 clones showed a reduced expression on Day 39, however, in the
next time point (Day 58) the productivity was more hence data of Day 39 is considered
as an outlier.
The recombinant proteins are produced in bioreactor where agitation mode is used.
Agitation is a physical parameter which could change the cell behavior hence there is
need to prove the clone stability under shaking condition which mimics the bioreactor
conditions. Therefore Clones D41D116, D41C140 and D41E213 were tested for clone
stability in absence of selection pressure under shaking conditions. The cells at different
Corr
. Pro
d.
(ng/
10^6
cel
ls)

Page 141 of 235
time points were subjected to fed-batch cultivation and the productivity at the end of
batch was monitored. As shown in Figure 3.2.31, the productivity of clone D41E213 was
maximum and the loss of productivity was only 5% when grown in absence of selection
pressure for 48 days under shaking conditions. In clones D41D116 and D41C140 the
loss of expression observed was ~11% & 9%, respectively which is also not significant.
Hence, clone D41E213 was found to be a high producer with minimal loss in
productivity in absence of antibiotic.
Clone Stability - Shake Flask -Without G418
0
50
100
150
200
250
D41D116 D41C140 D41E213
Clone ID
Prod
uctiv
ity (m
g/L)
Day 0Day 51Day 58
Figure 3.2.31 Clone stability in absence of selection pressure (G418) and under shaking
Conditions of rCHO
3.3. Summary: Chinese Hamster Ovary (CHO) cell line being most robust and widely used cell line for
manufacturing recombinant therapeutic proteins was used as an alternate host to develop
the cell line expressing anti-EGFR monoclonal antibody at higher levels which could not
be achieved with the SP2/0 cell line (originally used for the expression of anti-EGFR
mAb). Both these cell lines were evaluated for the expression of anti-EGFR antibody.
Different transfection reagents/protocols were tried and SP2/0 was found to loose
expression after a few passages as well the expression is at low level. Moreover, the
expression of anti-EGFR antibody in SP2/0 declined with the passage and was short-
lived. Hence we have evaluated alternate host system (CHO cell line) for expression of
anti-EGFR antibody. Various transfection reagents were tried to get high efficiency and
eventually high expression of protein of interest. Based on expression comparison
TransIT reagent (supplied by Mirus Bio) and Turbofect (supplied by Fermentas) worked
better and gave high level of anti-EGFR antibody expression when compared with

Page 142 of 235
Lipofectamine2000 (supplied by Invitrogen) and electroporation technique. After
transfection two methods were evaluated for obtaining clonal populations – the manual
limit dilution method and the automated ClonePix method. The lead clones generated
from both the methods were compared in terms of growth profile and productivity. It
was observed that the clones generated through manual limit dilution gave higher
expression levels than the clones selected using ClonePix.
Since cell line stability is also important along with growth profile and productivity, the
lead clones were monitored over a period of time in presence and absence of selection
pressure (Geneticin G418) for more than 50 generations under shaking conditions.
Clone D41D116, D41C140 and D41E213 were stable in absence and presence of
Geneticin G418 and also under shaking conditions. These clones were then evaluated as
fed-batch cultures where D41E213 gave higher productivity than the other two clones.
The evaluation of product quality is critical for proving the biosimilarity of the expressed
product, especially in the case where the expression host is changed. For this a number
of analytical methods were developed and used for expression yield optimization. These
methods give information above the structural as described in Chapter 3 at the early
stage of clone screening. Following this high-end analytical technique of LC-MS/MS
was used to assess the quality of product expressed by the lead clone in comparison with
RMP. As shown in below Table 3.2.4, the quality of product expressed by the lead 3
clones were determined for checking identity, purity, quality and potency of the product.
The detailed data are discussed in Chapter 6.

Page 143 of 235
Parameters Test Clone
D41D116
Clone
D41C140
Clone
D41E213
RMP
(SP2/0)
Identity
Western
Blot
Show positive band and size of band comparable
with RMP ~150 kDa
Protein A
HPLC Main peak in HPLC matches with main peak in RMP
Main peak
at Rt
N-terminal
Sequencin
g
First five amino acid of Light chain and Heavy chain
are identical to that of RMP
LC=
DILLT
HC =
QVQLKQ
Purity
CEX-
HPLC
The three major peaks overlaps with the RMP peaks.
However, the basic peaks present in RMP are of
lysine variants (as expressed in SP2/0) while it is not
present in the protein expressed by CHO cells.
A total of 7
distinct
peaks
observed
IEF
Shows
anomaly in the
band pattern
A total of 7 band matches with
RMP
A total of 7
distinct
bands
observed
Quality LC-
MS/MS Not Done Not Done
The required
forms of glycan
are present
except for the
G2 in Fab
which anyways
is not desirable
as it may casue
immunogenic
reaction
(Chung C.H., et
al 2008)
Potency In-vitro
Bioassay 44% $3% 55%
Table 3.2.4 Summary of product characterization done using various analytical techniques.
3.4. Conclusion: Based on the cell growth and productivity analysis, clone # D41E213 was observed and
identified as lead clone for further experimentation.

CHAPTER 4:
A) SELECTION OF THE LEAD CLONE BASED ON PRODUCTIVITY AND QUALITY ATTRIBUTES
B) ESTABLISHMENT OF PLATFORM EVALUATION METHODS FOR SCREENING OF RECOMBINANT CLONES EXPRESSING ANTI-EGFR MONOCLONAL ANTIBODY
Page 145 of 235
4.1. Preamble
Therapeutic monoclonal antibodies (mAbs), unlike other therapeutic proteins, are
enormously complex drugs typically produced in mammalian tissue culture cells through
recombinant DNA technology. As a result of naturally-occurring molecular
heterogeneity, imperfect cellular processing, chemical and enzymatic changes during
manufacturing and additional changes upon storage, antibody drugs display a wide
variety of minor chemical changes, collectively termed heterogeneity or
microheterogeneity. Common examples include glycan structural differences,
deamidation, oxidation and glycation. This microheterogeneity is not due to variation in
the primary protein sequence expressed by a single clone or pool of clones but arises due
to cellular processes (Liu, et al 2007a).
Variants may result from either known or novel types of in-vivo (post-translational)
modifications or from spontaneous (non-enzymatic) protein degradation, such as
methionine oxidation piperazine formation, apsartate isomerization and deamidation of
asparagines residues, or succinimide formation (Harris 1995).
Glycosylation is one of the most common modifications of proteins, and more than 50%
of proteins are glycosylated. Carbohydrate moieties of such proteins are involved in
expression of cellular functions including recognition, cell-to-cell signaling, protein
folding, canceration, immune response, fertilization and differentiation (Kamoda, et al
2006). Control of microheterogeneity within predefined analytical specifications has
been used in assessing the quality of the recombinant product expressed in
biopharmaceuticals to guarantee consistent product quality during cGMP manufacturing
(Flynn, et al 2010). Immunoglobulin G (IgG) is typically glycosylated in Fc regions and
at times in Fab region, with a heterogeneous ensemble of structures (glycoforms) that are
both highly reproducible (i.e. nonrandom) and site specific. In normal IgG, the two
highly conserved oligosaccharides of the Fc region are found buried between the CH2
domains, forming specific protein-saccharide interactions with the Fc protein surface
(Dwek, et al 1995). IgG antibodies possess a conserved N-glycosylation site, typically at
Asn297, in the CH2 domain of the Fc portion. The variable (Fv) domain is glycosylated
in approximately 20% of human IgGs. Glycosylation plays a critical role in the biology
and physicochemical properties of an antibody. The biological functions influenced by
glycosylation include resistance to proteases, binding to monocyte Fc receptors,

Page 146 of 235
complement-dependent cytotoxicity (CDC), antibody-dependent cellular cytotoxicity
(ADCC), and circulatory half-life in vivo (Zhou, et al 2007). One of the functions
attributed to the Fc oligosaccharides of normal IgG is to maintain the conformational
arrangements of the Fc domains as well as the hinge regions. These structural features
are necessary for Fc effector functions such as C1q and monocyte binding (Dwek, et al
1995).
Prior to designing a cell culture and purification process for mAb manufacturing, a
quality target product profile provides a list of quality attributes (QA) and what levels are
critical and hence need to be monitored and controlled. Since antibodies are a
homologous class of molecules, knowledge gained through prior experience or from
published studies may greatly aid in defining QAs. The definition for quality attribute is
fairly broad and can potentially include raw materials in addition to features of the drug
molecule itself (Flynn, et al 2010).
Critical Quality Attributes (CQA) is a physical, chemical, biological, or microbiological
property or characteristic that should be within an appropriate limit, range, or distribution
to ensure the desired product quality. CQAs are generally associated with the drug
substance, excipients, intermediates (in-process materials) and drug product [Ref: ICH
Q8(R2)]. There are assigned Product Quality Attributes (PQA) which is product specific
and most of the times dependent on the clone. The PQA like glycosylation and charge
variants are cell line derived and changes from cell line to cell line due to variation in the
metabolism from cell to cell. Hence, the PQA need to be determined at early stage of
clone selection in order to identify the right clone so that there would not be surprises at
the later stage of development thus, saving on the development time. Measuring and
monitoring PQA will guide through determination of CQAs at the final process stage
(Mire-Sluise, et al 2009).
The most recent regulatory document covering characterization of monoclonal antibodies
was published by the European Medicines Agency (EMA) in July 2009 (Ref.
EMEA/CHMP/BWP/1576532/2007). This EMA guideline entitled “Development,
Production, Characterization and Specifications for Monoclonal Antibodies and Related
Products” states that the monoclonal antibody should be characterized thoroughly before
going for human use. This characterization should include the determination of
physicochemical properties, purity, impurities and quantity of the monoclonal antibody,

Page 147 of 235
in line with ICH-Q6B. As shown in Figure 4.1.1, the PQA assessment is done at
different stages of the product life cycle employing similar or different analytical
techniques at each stage.
CQA Strategy for Biosimilar DevelopmentCri
tica
lity
Ass
essm
ent
10
1
5
AggregationGlycosylation
Q cyclization
CQA assessment
Levels in RMP
Compendialspecs
Define Clone selection
Thresholds
Develop a control strategy
Process Development
Process Validation
Formulation development
Drug Product Development
Comprehensive RMP characterization
(can be outsourced)
LC-MS
LC-MS/MS
Peptide map
CZE
SEC
Glycan map
CE-SDS
Glycation
Lysine variants
1
Figure 4.1.1 Importance and implementation of CQA in biosimilar development.
A typical strategy for the assessment and monitoring of CQA in a biosimilar drug development to assure
the consistency in the product quality. As shown in the arrow diagram, the Lys variants are not as critical
as the aggregation and glycosylation. Also, at the clone selection level, PQA assessment in comparison
with the RMP is suggested in order to ensure biosimilarity at the later stages of development.
In this study the PQAs measured are highlighted in light yellow color in Table 4.1.1, to
ensure the capacity of clone to process and produce the right molecule to go for the
further development work. A typical PQA list is shown in Table 4.1.1 mentioning its
impact on the biological function, however there could be little modifications to this
depending on molecule and the function of it.

Page 148 of 235
Product Quality Attributes -To be compared with RMP Attribute Impact on Function Afucosylation Fucose content inversely proportional to ADCC Galactose Content Degalactosylation lead to three fold reduced CDC
High Mannose High mannose forms lead to faster clearance from body due to their interaction with mannose receptors
Sialic Acid Sialylated Glycans may lead to higher immunogeneity
Methionine Oxidation Oxidation of Met252 reduces FcRn binding and also impact serum half life
Clips / Truncation
Hinge region fragmentation releasing one Fab+Fc and one Fab+CDR clips lead to conformational changes which will increase immunogenecity and reduces bioactivity
Aggregation Covalent and non-covalent aggregation could lead to drop in potency
Biological Activity Measure the potency of the product Other PQA that have no significant impact on function but on purity of
product C-terminal Lys Variant Has no direct impact on biological activity
N-term pE Spontaneous physicochemical conversion and has no functional significance
HCP Indicator of consistency of process. Directly impacts product quality. HCP and resProteinA are immunogenic resDNA
resProtein-A
Table 4.1.1 List of attributes having impact on the function of mAb.
[N-term pE (N-terminal pyroglutamate). HCP (Host Cell Protein) and DNA is the residual DNA to
be measured in the final purified solution]
Conventionally, after transfection till MCB candidate identification, the clones are
selected based on productivity and a few quality parameters. The selection of lead clone
is critical as the process development and validation, which are time, labor and cost-
intensive, would be carried out using the same clone as also the commercial production.
Thus, the selected clone should satisfy all the quality parameters so that a need to change
the clone in later stages does not arise.
In Chapter 3, the procedure of short listing the top three clones obtained either from
manual selection (clones D41D116, D41C140 and D41E213) or from automated
selection (clones 1A7, 2F5 and 2H5) has been described based on cell growth and
expression yield. In this section, the lead clone (MCB candidate) was identified based
on further analyses utilizing various analytical tools. Emphasis has been laid upon
analytical tools used to assess the product quantity and quality as well as methods used to

Page 149 of 235
establish biosimilarity with the commercially available RMP. The methods used to
evaluate the lead MCB candidate are, SDS-PAGE, Western Blot, Iso-electric Focusing,
Protein-A HPLC Weak-Cation Exchange Chromatography, RP-HPLC, and in-vitro
bioassay.
4.2. Results and Discussion
4.2.1. Purification of target protein
The mAb molecule was effectively purified from the cell culture supernatant by affinity
chromatography using Protein-A resin. This resin is also used for the analytical purpose
for quantification of expressed mAb from the crude harvest as well as purified solution.
Affinity chromatography separates proteins on the basis of a reversible interaction
between a protein (and / or group of proteins) and a specific ligand coupled to a
chromatographic matrix (Figure 4.2.1). The technique offers high selectivity, hence high
resolution, and usually high capacity for the protein(s) of interest. Purification can be in
the order of several thousand-fold and recoveries of active material are generally very
high.
Figure 4.2.1 Principle of Affinity chromatography
Affinity chromatography is unique in purification technology since it is the only
technique that enables the purification of a biomolecule on the basis of its biological
function or individual chemical structure. Purification that would otherwise be time-
consuming, difficult or even impossible using other techniques can often be easily
achieved with affinity chromatography. The technique can be used to separate active
biomolecules from denatured or functionally different forms, to isolate pure substances
present at low concentration in large volumes of crude sample and also to remove
specific contaminants. The basis for purification of IgG, IgG fragments and subclasses is
Matrix
Ligand
Protein of Interest
Non-specific molecules

Page 150 of 235
the high affinity of protein A and protein G for the Fc region of polyclonal and
monoclonal IgG-type antibodies.
Protein A and protein G are natural bacterial proteins of Staphylococcus aureus and
Streptococcus spp., respectively which, when coupled to Sepharose, create extremely
useful, easy to use media for affinity capture of antibodies. Examples include the
purification of monoclonal IgG-type antibodies, purification of polyclonal IgG
subclasses, and the adsorption and purification of immune complexes involving IgG. IgG
subclasses can be isolated from ascites fluid, cell culture supernatants and serum. (Ref.
GE handbook). In the present study Protein A was used which is derived from S. aureus
and contains five regions that binds to the Fc region of IgG.
The cell culture supernatants from the clones # D41D116, D41C140 and D41E213 were
clarified by centrifuging the harvest at 1500 rpm for 10 min using swing out bucket rotor
followed by filtration through 0.45 µ filter. On 5 mL Protein A (MabSelect SURE) resin
column loaded with 15 mL (~3 mg target protein) of clarified harvest at 0.2 mL/min of
flow rate followed by washing with phosphate buffer saline (pH 7.5) with 2 column
volumes (15 mL) at 1.0 mL/min flow rate. The target protein was eluted with Glycine
Buffer (pH 3.0) at a flow rate of 1.0 mL/min. The elution volume was ~2.0 mL. The
chromatogram generated during the purification of harvest from clone #D41E213 is
represented in Figure 4.2.2A.
The fractions generated during the purification process were checked on SDS-PAGE as
depicted in Figure 4.2.2B.

Page 151 of 235
A)
B) C)
Figure 4.2.2 Affinity purification of Harvest.
A) Chromatograph with all process parameters. The detection is done at two absorbance
frequency of 280 nm and 254 nm. For 280 nm: blue solid line is absorbance, aqua solid line-
conductivity of solution and grey solid line for pH of solution. For 254 nm: red solid for
absorbance, brown solid line for conductivity. Pink solid line is absorbance at 215 nm which
give absorbance for peptide bonds, blue dotted line is for temperature and red dotted line is
for fraction mark.
B) 7% Non-reducing PAGE profile of the purification run. Lane 1: 5 µL molecular weight
marker, Lane 2: Clarified Harvest (10 µL), Lane 3: Flow Through (30 µL) Lane 4: Wash (30
µL), Lane 5: Eluate (5 µL); Lane 6 & & = Empty; Lane 8 = RMP (1µL = 5 µg)
C) 10% Reducing PAGE profile. The lane designation is same as Fig B except that the RMP
was not added
WASH Eluate
kDa 170 130 95 72 55 43
kDa 170
95 72 55 43
34
26
17 10 10%
Reducing Gel 7% Non-Reducing Gel
Equilibration LOAD WASH Eluate

Page 152 of 235
The percentage recovery after purification was >90% as observed on the SDS-PAGE gel.
4.2.2. Identity of product The demonstration of the identity is usually performed by comparing the expressed
protein with RMP. For evaluating the identity of the target mAb expressed by the three
lead clones the methods employed are Western Blot, Reverse Phase HPLC (RP-HPLC)
and Iso-electric focusing (IEF).
4.2.3.1 Western Blot
Western blot is one of the simple techniques to establish the identity of expressed target
protein by using detection of protein of interest with an anti-antibody. The Protein-A
eluate supposedly containing target mAb from the three shortlisted clones were run on
10% SDS-PAGE under reducing conditions following which the separated proteins were
transferred to nitrocellulose membrane. The nitrocellulose membrane was probed with
Mouse Anti-human IgG (whole) HRP conjugated polyclonal antibodies following which
bands were detected when the enzyme substrate TMB was added.
Figure 4.2.3 Western Blot Analysis for identity
M - Rainbow Molecular weight market (5µL); Lane 1 – RMP (2µg); Lane 2 – Clone # D41D16 (2µg) ;
Lane 3 – D41C140 (2µg) ; Lane 4 – D41E213 (2µg)
As represented in Figure 4.2.3, immune-positive signal of size ~50 kDa and ~25 kDa
corresponding to heavy chain and light chain, respectively was observed which is
comparable with the RMP. The expressed protein in all the clones shows immuno-
positive bands at similar sizes to that of RMP, thereby establishing the identity of protein
to be an IgG molecule.
HC
LC
52 kDa
31 kDa

Page 153 of 235
4.2.3.2 IEF:
IEF is an iso-protein analytical method and, therefore, very useful in demonstrating the
antibody identity and charge heterogeneities. The charged isoform in the expressed
product was analyzed in comparison with the RMP. IEF requires small sample amount
either unpurified or purified; however to get better picture for comparison with RMP,
partially purified sample was used. To obtain the isoform profile of the target protein,
Protein-A purified samples were focused on the precast Dry-IEF gel (pH 3-10) available
from GE Healthcare.
Figure 4.2.4 Isoelectric Focussing (IEF) for identity and purity
Precast Phast Gel with ampholyte range of pH3 to pH10 was used and focusing was done in the PHASTGel
System from GE.
The theoretical pI of the target mAb without modifications calculated to be 8.6
(www.expasy.org). In the RMP mainly 5 bands are seen around pI 8.5 followed by 3
bands on the acidic side. A lower amount of sialic acid residues or modifications like
deamidation or oxidation can lead to an increase in pI of the sample and thus a shift of
the bands to a more basic region of the gel. The band pattern in clone # D41C140 and
D41E213 are similar to the
1: RMP – 1.6 µg
2: D41E213 – 2 µg
3: D41C140 – 2 µg
4: D41D116 – 2 µg
5: pI marker – 1.5 µL
6: RMP – 1.6 µg

Page 154 of 235
banding pattern in RMP however; a couple of basic bands are not present in the
expressed protein. This may be because of the absence of lysine variants in the
recombinant expressed protein (as explained by CEX in the following section). The
protein expressed by clone # D41D116 possess one or two bands less on both acidic and
basic side therefore less comparable to the RMP banding pattern than the other two
clones. Based on IEF results clone # D41C140 and D41E213 are expressing product
similar to the RMP. These results were verified by CEX-HPLC in the section (Figure
4.2.7:).
4.2.3. Purity and Quality of Expressed mAb
There are various measures to ensure the purity of the product depending on the sensitive
of the method used. Method starting from a simple SDS-PAGE to high-end HPLC
methods was employed to ensure the purity and quality of the product.
4.2.3.1 SDS-PAGE (Reducing and Non-reducing)
SDS-PAGE is one of the most common methods to determine the purity (homogeneity of
the protein sample) and stability of recombinant proteins in comparison with RMP.
Commonly, the bands of IgG molecules appear at lower molecular weight on non-
reducing SDS-PAGE due to the missing single light chain or single heavy chain (Liu, et
al 2007a). The theoretical mass of anti-EGFR monoclonal IgG in discussion is 145.5kDa
composed of two light chains and two heavy chains and possess glycan at Fab and Fc
sites. The theoretical molecular weights of light chain and heavy chains of anti-EGFR
mAb are 23.4 kDa and 49.37 kDa, respectively (www.web.expasy.org). Each light chain
is connected to a heavy chain by one inter-chain disulfide bond, while each heavy chain
is connected to the other heavy chain by two intra-chain disulfide bonds at hinge region
of antibody molecule which is characteristic of IgG1 subtype. Each light chain possesses
two intra-chain disulfide bonds while each heavy chain possesses four intra-chain
disulfide bonds.
In theory, when analyzing an antibody on SDS-PAGE under non-reducing condition,
there should be only one band: namely that of the intact antibody. Structurally, IgG is a
homodimer of a heterodimer and due to improper assembly of the chains bands with both
higher and lower molecular weights than intact IgG molecules are reported (Angal, et al

Page 155 of 235
1993; Brody 1997; Hunt and Nashabeh 1999; Schauenstein, et al 1996; Schuuram, et al
2001; Taylor, et al 2006; Zhang and Czupryn 2002).
IgG1 and IgG2 hinge sequences are more optimal for inter heavy chain disulfide bonds
(Angal, et al 1993; Schuurman, et al 2001). However, fragments of IgG1 and IgG2 have
also been reported (Zhang and Czupryn 2002). The banding pattern of the fragments is
very similar to the banding pattern of IgG after partial reduction (Virella and Parkhouse
1973), which suggests that similar to IgG4 half-antibody, fragments are likely formed
related to the integrity of disulfide bonds. Low percentage of free sulfahydryl in IgG1
and IgG2 implies the existence of incomplete disulfide bonds (Zhang and Czupryn
2002), which can contribute to the presence of antibody fragments directly. Incomplete
disulfide bonds can also contribute to the fragments directly by triggering disulfide bond
scrambling.
SDS-PAGE was carried out on 4-14% gradient. The affinity purified product from the
top 3 clones was checked and compared with the RMP under reducing and non-reducing
conditions on SDS-PAGE. The gel was stained with Coomassie Brilliant Blue R250
followed by destaining and finally capturing the image using Gel Documentation system
for visualization (Figure 4.2.5).
The band size of ~52 kDa and ~25 kDa under reducing conditions was observed
corresponding to heavy chain and light chain of RMP. In case of non-reducing gel
multiple bands are observed in all samples including RMP. As marked in the Figure
4.2.5, the intact IgG band appears around 200 kDa on non-reducing gel matching with
the RMP. The band below the 200 kDa, at around 150 kDa could be the molecule with 1
heavy chain less, i.e., two light chains and one heavy chain linked to form theoretically
~100 kDa protein. Similarly other forms are available which are marked in Figure 4.2.5.
The band pattern of expressed target protein may be because an alternate host (CHO) is
used (Note: RMP is expressed in SP2/0 cells).

Page 156 of 235
Figure 4.2.5 SDS-PAGE for molecular weight and purity determination of expressed mAb.
Gel Electrophoresis with RMP. Lane 1 to 5 are Non-reducing condition where Lane 1= Rainbow
Marker (6µL), Lane 2 = RMP (2µg), Lane 3 = Clone D41D116 (2µg), Lane 4 = Clone D41C140,
Lane 5 = Clone D41E213 (2µg). The same loading pattern was followed for the reducing condition
from Lanes 6-10.
4.2.3.2 HPLC Methods
Separation by HPLC is a robust method used for getting information on antibody
identity, concentration, purity, molecular weight and structure. Based on the PQAs of
mAb, Cation Exchange (CEX) HPLC was used for determination of charge variants
(Kaltenbrunner, et al 1993, Hamilton, et al 1987), whereas Size Exclusion (SEC) HPLC
was used for determination of molecular weight, aggregation and degradants (discussed
in Chapter 6). The HPLC profile or peak pattern obtained by analyzing Protein-A
purified target mAb expressed from 3 lead clones was compared with the profiles
generated from RMP.
PROTEIN-A HPLC
Protein-A affinity resin was used in analytical columns for quick estimation of target
mAb in cell culture harvest as well as the purified sample. POROS column packed with
Protein-A resin was used in Agilent 1100/1200 HPLC. A standard 4 point curve was
HC
LC
Intact IgG
2LC+1HC IgG
1LC+2HC

Page 157 of 235
first established by injecting different concentrations of RMP and plotting peak area Vs
concentration to establish the standard curve to be used for quantification. This method
in addition to quantification was also used for determining the identity of mAb in
comparison with RMP.
A)
Minutes4 6 8 10 12 14 16 18 20 22 24
Volts
0.000
0.005
0.010
0.015
0.020
0.025
0.030
0.035
0.040
0.045
0.050
0.055
Volts
0.000
0.005
0.010
0.015
0.020
0.025
0.030
0.035
0.040
0.045
0.050
0.055
Detector A - 2 (280nm)3 mcg Erbitux 3001113 mcg Erbitux 300111
Detector A - 2 (280nm)5 mcg Erbitux 3001115 mcg Erbitux 300111
Detector A - 2 (280nm)10 mcg Erbitux 30011110 mcg Erbitux 300111
Detector A - 2 (280nm)15 mcg Erbitux 30011115 mcg Erbitux 300111
B)
C)
15 µg 10 µg 5 µg 3 µg

Page 158 of 235
Figure 4.2.6 Protein-A HPLC for quantification of target mAb & establishing identity of target
mAb.
A) Chromatogram of RMP obtained after injecting different concentration of RMP,
B) Calibration curve and table showing recovery of protein at different calibration point,
C) Overlay of chromatograph of three shortlisted clones with RMP.
The overlay of the product in cell culture supernatant obtained from two different fed-
batch experiments were overlaid and represented in Figure 4.2.6. The mAb estimation in
the cell culture supernatant is tabulated in Table 4.2.1
Table 4.2.1 Protein-A HPLC quantification of cell culture supernatant from 3 lead clones.
Highlighted clone was observed to be highest expressing in shake flask condition at basal levels
The expression of target mAb is highest in clone #D41E213 (highlighted). The main
peak of mAb at Rt 12 min was observed in all three clones (D41D116, D41C140 &
D41E213) which matches with the peak of RMP (red color peak). The peak at Rt 22
could be some excipient peak of buffer.
CEX PROFILE:
During the development and production of a therapeutic protein, characterization of
structural variants is a critical challenge. In theory, characterization of recombinant
proteins is a straightforward matter, as the requisite genetic engineering provides an
expected amino acid sequences, with potential sites of post-translational modification
identified on the basis of the known consensus sequences (Harris, 1995). In practice,
however, a number of variations from the expected structure can be found. Variants may
result from either known or novel types of in-vivo (post-translational) modifications
(Wold, 1981) or from spontaneous (non-enzymatic) protein degradation, such as
methionine oxidation, diketopiperazine formation (Battersby, et al 1994), aspartate

Page 159 of 235
isomerization and deamidation of asparagines residues (Clarke and Greiger 1987), or
succinimide formation (Kwong and Harris 1994).
The effect of various modifications on the elution of antibodies from ion exchange
columns can be classified into three categories including direct contribution to charge
difference, positional effect and conformational effect. Firstly, modifications can affect
the elution of antibodies from ion exchange chromatography column by contribution to
charge directly, e.g., a Lys residue introduces a positive charge. Therefore, on Cation
Exchange columns, antibodies with no C-terminal Lys will elute first followed by
antibodies with one C-terminal Lys followed by antibodies with two C-terminal Lys.
Treatment with enzyme Carboxypeptidase B (CPB), which removes C-terminal Lys,
changes the profile of the three peaks with different Lys residues into a single peak with
no C-terminal Lys residues (Liu, et al 2007b). This indicates that the presence of C-
terminal Lys affects the elution profile of antibodies from Ion Exchange columns by
direct alteration of charge. The effect of sialic acid on elution is also based on net charge
differences. Sialic acid introduces a negative charge and antibodies with
oligosaccharides containing sialic acid groups will elute earlier on cation exchange
column. Secondly, the same modification located at different positions of the antibody
can have an effect on the retention time. For example, antibodies with the same number
of pyroglutamate residues elute at different retention times depending on the position of
the pyroglutamate (Moorhouse, et al 1997). These modifications in different
permutation and combination could give multiple peaks at different retention time which
at times would be difficult to characterize.
Determination of the charge variants present in the expressed target mAb from
shortlisted clones after Protein-purification was carried out using Cation Exchange
(CEX) HPLC as described by Gaza-Bulseco, et al 2008. In brief, TSK CM STAT (4.6
mm X 100 mm) column was used in an Agilent HPLC 1200 system for resolution of
charge variant using MES buffer. This column has matrix of hydrophilic polymer with
functional group of carboxymethyl cellulose. The column is packed with 7 or 10 µM
mono-disperse non-porous resin particles of which the surface consists of an open access
network of multi-layered cation exchange group.
The overlays of CEX-HPLC peak profiles generated from 3 lead clones were overlaid,
compared with the profile of RMP (Figure 4.2.7) and the percentage distribution of each

Page 160 of 235
peak was calculated and tabulated in Table 4.2.2. Peak #1 to 6 were observed in the
expressed mAb from all the three clones which matched with the RMP however, the
percentage was varying which could be due to the fact that the upstream process is not
fully optimized and the RMP is produced using SP2/0 cells. Peak #8 to 11 are observed
as distinct peaks in RMP while these are absent in the clones while peak #7 is very less
in the clones. The peaks 8, 10 and 11 present in RMP are determined to be C-term Lys
variants as confirmed by CpB digestion which clip-off the C-term Lys (This data is
included in chapter 6 section 6.2.2 on Product Comparability). Peak #6 is the major peak
corresponding to K0 form which accounts for ~31% in RMP and ~28% in clone
D41E213 hence the best match. Peak number 1 to 3 are acidic variants mostly
contributed by sialic acid present in all clones but are minimal in RMP. The comparison
of clones with RMP peak by peak is tabulated in Table 4.2.2. Although, the C-term Lys
variants are not significant in terms of immunogenecity, but contributes to the
heterogeneity and purity of the product. In principle, the major charge variant form in
RMP are K0 and peak 4 & 5 which is best compared with target mAb expressed by clone
D41E213. The C-terminal Lys variant forms (Peak #1 to 3) need to be monitored and
dealt with during the cell culture process fine-tuning at bioreactor scale to reduce these
forms and come close to the pattern of RMP.
Figure 4.2.7 Cation Exchange HPLC for determination of charge variants.
The Protein-A purified cell culture supernatant from each clone was analyzed by CEX chromatography by
injecting approximately 5 µg of partially purified mAb. The inset picture depicts a typical charge variant
profile obtained for a mAb molecule.
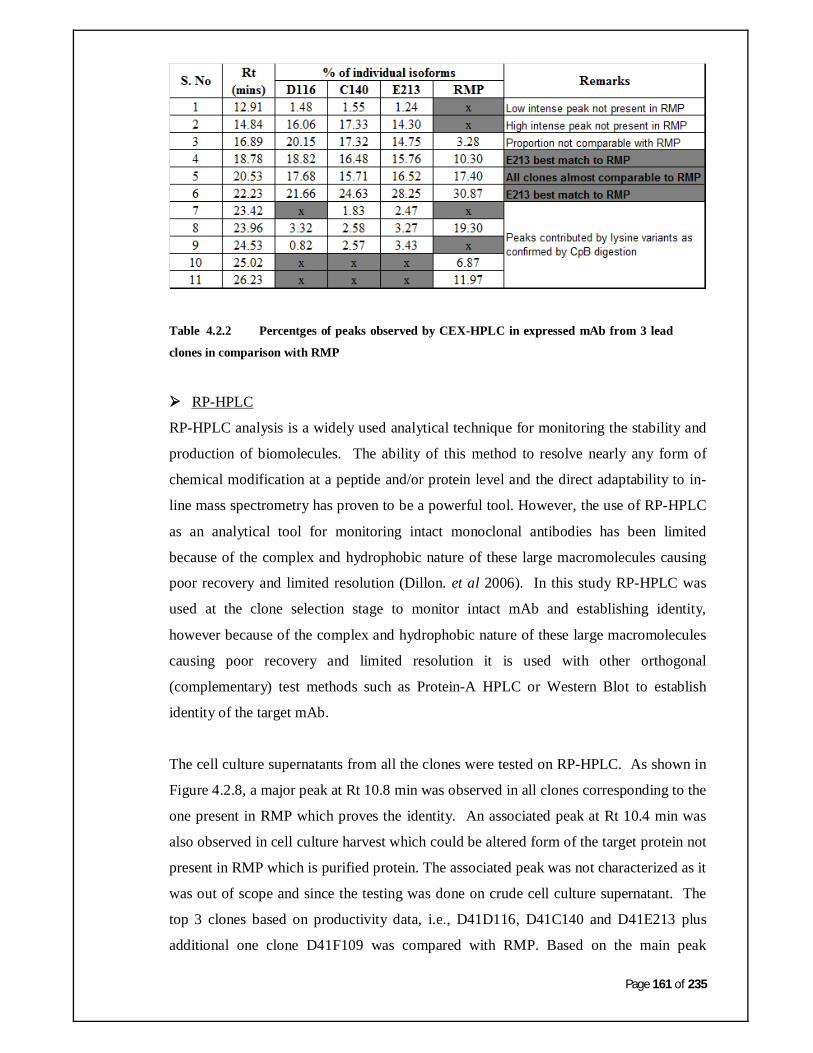
Page 161 of 235
Table 4.2.2 Percentges of peaks observed by CEX-HPLC in expressed mAb from 3 lead
clones in comparison with RMP
RP-HPLC
RP-HPLC analysis is a widely used analytical technique for monitoring the stability and
production of biomolecules. The ability of this method to resolve nearly any form of
chemical modification at a peptide and/or protein level and the direct adaptability to in-
line mass spectrometry has proven to be a powerful tool. However, the use of RP-HPLC
as an analytical tool for monitoring intact monoclonal antibodies has been limited
because of the complex and hydrophobic nature of these large macromolecules causing
poor recovery and limited resolution (Dillon. et al 2006). In this study RP-HPLC was
used at the clone selection stage to monitor intact mAb and establishing identity,
however because of the complex and hydrophobic nature of these large macromolecules
causing poor recovery and limited resolution it is used with other orthogonal
(complementary) test methods such as Protein-A HPLC or Western Blot to establish
identity of the target mAb.
The cell culture supernatants from all the clones were tested on RP-HPLC. As shown in
Figure 4.2.8, a major peak at Rt 10.8 min was observed in all clones corresponding to the
one present in RMP which proves the identity. An associated peak at Rt 10.4 min was
also observed in cell culture harvest which could be altered form of the target protein not
present in RMP which is purified protein. The associated peak was not characterized as it
was out of scope and since the testing was done on crude cell culture supernatant. The
top 3 clones based on productivity data, i.e., D41D116, D41C140 and D41E213 plus
additional one clone D41F109 was compared with RMP. Based on the main peak

Page 162 of 235
comparison, the identity of mAb expressed was established by comparison to RMP in all
the clones tested. There is no significant difference amongst the clones expressing target
mAb observed. This method is also used for separation of the Fc and Fab fragments
after digestion with enzyme Endopeptidase Lys-C (Lys-C) and to be further used for
Mass spectrometry (Discussed in Chapter 6 section 6.2.4).
Figure 4.2.8 RP-HPLC for establishing identity of protein.
The protein expressed by the three lead clones and a next in line clone are represented.
4.2.3.3 In-vitro Bioassay
The epidermal growth factor receptor (EGFR) is a ubiquitously expressed trans-
membrane tyrosine kinase receptor that binds six structurally related ligands and, in
doing so, stimulates the proliferation of a wide variety of animal cell types. A tumor cell
line A431 (ATCC, CRL# 2592) over-expresses EGFR and the majority of EGFR appears
to be present in the caveolar fraction (Carpenter 2000). The cell binding of the target
anti-EGFR mAb expressed by 3 lead clones was determined in-vitro by incubating A431
cells with target anti-EGFR mAb. The A431NS cells were grown in 96 well plates to
~70-80% confluency following which the cells were fixed using formalin solution to
expose the EGFR receptor from the caveolar compartment. The RMP and expressed

Page 163 of 235
anti-EGFR mAb was added to the fixed cells in different dilutions in replicates. The
binding of anti-EGFR mAb with receptor was detected with the use of secondary
antibody labeled with HRP. The enzymatic reaction after addition of substrate TMB
results in yellow color which was measured using a spectrophotometer. The experiment
was repeated on two different days and average with error bars are presented in Figure
4.2.9. The signal increased with the increase in the concentration of the protein till
equilibrium between anti-EGFR concentration and number of EGFR was reached. The
absorbance at 490 nm Vs. log concentration of anti-EGFR mAb was plotted for
comparison with the RMP. The relative binding of the expressed mAb in comparison
with RMP was calculated using PLA software. The percentage in-vitro binding potency
of mAb expressed by clone #D41E213 was highest (~55% of RMP). For clone
D41D116 and D41C140, the observed binding potency was ~44% and ~43%,
respectively. The potency of expressed mAb from different clones was lower because of
the fact that the upstream and purification process is not fully optimized. The mAb
expressed is from the shake flask experiments which are not controlled and hence there
could be variants/impurities, media or buffer components which could interfere with the
binding of anti-EGFR mAb with the receptor. This trend was also observed in other
mAb projects in which the in-vitro potency was less at early stage and later during the
upstream process development improved considerably and came close to the RMP.
Hence, there is a very good potential that the potency could improve once the upstream
and purification process is fully optimized at the bioreactor scale because that would be
the final scale for commercial manufacturing. The main highlight is the expressed anti-
EGFR mAb follows similar binding kinetics as that of the RMP and clone D41E213
shows better binding activity.

Page 164 of 235
Figure 4.2.9 In-vitro bioassay for determining the binding potency of the expressed mAb
4.3. Conclusion
Commonly used techniques such as Western blot, Iso-electric focusing and HPLC are
used to establish the identity and to some extent purity of mAb. There are, however,
differences in the number of tests required for the various stages of drug development
starting from R&D to commercial stage manufacturing. In the present study, an attempt
was made to establish a battery of tests to be used during early stage development
starting from the clone selection of the anti-EGFR mAb. Implementing tests like SDS-
PAGE, Protein-A HPLC, RP-HPLC, CEX-HPLC, IEF and Western Blot will give
information on the identity and purity of the molecule expressed by the clone.
Determining the in-vitro biological activity of molecule at clone selection stage is
important to ascertain complexity of the mAb molecule so that disappointments at later
stages of product development could be avoided. Recombinant antibody production is
generally shifting from murine hybridoma cells as production system to recombinant
Chinese Hamster Ovary (CHO) cells to human cells (Per C.6). Irrespective of the host
cell line employed, basically the regulations demand that the biopharmaceutical product
manufactured are safe and are well characterized in accordance with the Product Quality
Page 165 of 235
Attributes (PQA). These methods give considerable information at an early stage and are
considered as platform methods to be used at clone selection stage for all mAb products
in general.
Based on the analytical tests employed in final clone selection clone #D41E213 is the
lead MCB candidate followed by D41C140 and D41D116. Therefore, clone D41E213
will be used for further experimentation such as upstream process development,
purification process and product characterization.
CHAPTER 5
UPSTREAM PROCESS DEVELOPMENT FOR IMPROVING EXPRESSION OF RECOMBINANT ANTI-EGFR MONOCLONAL ANTIBODY IN SHAKE FLASK

Page 167 of 235
5.1. Preamble For a media to be qualified as ‘ideal’ for mammalian cell growth, a detailed investigation
is needed to evaluate whether a particular media meets certain basic requirements. All
microorganism or cell lines require water, sources of energy, carbon, nitrogen, mineral
elements, trace elements, vitamins, lipids, etc. for survival. Optimal cell growth is
routinely achieved using a defined basal medium supplemented with relatively high
levels of serum or proteins. To manufacture highly purified biopharmaceuticals with
consistent quality, a well-defined production process is required. Moreover, regulatory
requirements dictate the elimination of serum or other animal-derived components from
the culture media.
The development of serum-free media was initiated by Ham (1965), who reduced the
amount of serum in media and optimized other medium components. Sato’s group
(Barnes and Sato 1980) investigated a range of components to promote cell growth and
differentiation. Chemically defined, serum-free or protein free animal cell culture media
offer lot-to-lot consistency and reduced production cost apart from eliminating the risk of
potentially grave contaminants or microorganisms thus facilitating downstream
purification processing, regulatory approval and biosafety.
Apart from the general media components which acts as source of carbon, nitrogen,
phosphorous and sulfur, requirement of trace elements such as Fe, Zn, Cu, Se, Mn, Mo
and V are significant for mammalian cells (Ham and McKeehan 1975). The chemically
defined media contain contamination-free ultra-pure inorganic and organic constituents,
and may contain pure protein additives, like insulin, epidermal growth factor, etc. that
have been produced in bacteria or yeast by genetic engineering with the addition of
vitamins, cholesterol, fatty acids and specific amino acids. The CHO cell lines are widely
used for being highly stable expression systems for heterologous genes, and for its
relatively simple adaptation to adherence-independent growth in serum and protein free
media. In contrast, protein free media do not contain any protein; they only contain non-
protein constituents necessary for culture of the cells. The formulations such as Minimal
Essential Media, Dulbecco’s Minimal Essential, RPMI-1640, etc. are protein free where
required protein supplementation is provided. Compared with serum supplemented
media, use of protein-free media promotes superior cell growth and protein expression.
The protein-free, chemically defined formulation allows the growth of many cell lines
but at times makes the cell lipid-dependent, for example, NSO myeloma cells do not
Page 168 of 235
grow in protein-free, chemically defined medium without further lipid supplementation.
Through the use of cyclodextrin-based additives to medium, it is possible to solubilize
significant quantities of sterols and other lipids and to maintain a protein-free, chemically
defined cultivation environment for NS0 cells. The culture system can be kept entirely
free of animal derived components if the supplement is made with plant-derived or
synthetic lipids. A systematic approach was described to arrive at a chemically-defined
protein-free medium called FMX-Turbodoma for the production of monoclonal IgA
antibodies by hybridoma cells for IgA production (Stoll, et al 1996). The price of the
protein-free medium is about 20% of the serum containing medium. This makes such a
protein-free medium very convenient for laboratory and large scale production.
It is often observed that cells initially grown under serum-containing conditions and
when adapted to serum- or protein-free conditions undergo a reduction in expression of
the recombinant product. This is the consequence of reduced growth of the recombinant
cells due to changed culture conditions. Cells which have been adapted to grow in
serum- and protein-free medium for at least 40 generations and which expresses a
recombinant product to desired levels can be considered stable. Thus, designing of fully
defined media for mammalian cells is a daunting task and require in depth investigation.
Therefore, media supplier companies market these media without disclosing the exact
composition. This calls for evaluation of various media available from different sources
based on availability, cost, convenience to use at large scale, regulatory approval, etc.
These media should support the increasing demand for biopharmaceuticals produced
using mammalian cell culture, coupled with capacity limitations and the requirement for
improving productivity and robustness of the manufacturing processes. For larger scale
of operations, the nutrient media should meet as many possible criteria as follows:
Produce the maximum yield of product or biomass per gram of substrate used
Produce the maximum concentration of product or biomass
Permit the maximum rate of product formation
Minimum yield of undesired products.
Consistent quality and be readily available throughout the year
Convenient during media preparation and sterilization.
Cause minimal problems in other aspects of the production process particularly
aeration and agitation, extraction, purification and waste treatment.
Should be cost effective so that the product finally manufactured could be
competitive.

Page 169 of 235
Media optimization is an essential step when implementing a large scale process.
Different combinations and sequence of process conditions need to be investigated to
determine the optimal growth conditions that will produce biomass with the
physiological state best constituted for product formation.
Media optimization by the classical method of changing one independent variable
(nutrient, pH, temperature, etc.) while fixing all the others at a certain level can be
extremely time consuming and expensive for a large number of variables. To make a
full factorial search which would examine each possible combination of independent
variable at appropriate level requires a large number of experiments, xn, where x is the
number of levels and n is the number of variables. This may be quite appropriate for
three nutrients at two concentrations (23 trials) but not for the six nutrients at three
concentrations. In this case 36 (729) trials would be needed. The commercial media
formulations available are designed by the manufacturers keeping these trials in
consideration and would have tried most of these combinations before they come up with
the media to be used for a particular cell line and at times for a particular class of
product. Screening these readymade available media will reduce the number of
experiments at industrial level to optimize the conditions and achieve the expected cell
growth and expression yield (Stanbury, et al 1997).
A fed-batch process requires a basal medium to support cell growth and productivity and
a feed medium to prevent nutrient depletion, extend culture longevity, and maintain high
volumetric productivity. A typical basal media constitutes about 50-70 components,
while feed media contains fewer components but at a higher concentration. The basal
media and feed media in synergy should be evaluated in the following three classes (Li,
et al 2010):

Page 170 of 235
Robustness Preparation Test Cell Lines
Support consistent cell
line stability at different
cell age
Support consistent
product quality
Suitable for early cell
line development
Filtration
Stability during storage
Scalability
Manufacturability
Chinese Hamster Ovary cells
as host
Selection system
Transfection method
Promoters
Development stage (Ph1,
Ph3, commercial)
Growth properties
Specific productivity
Metabolism profile
Titer
Table 5.1.1 Properties of Basal Media and Feed Media to be look-into and evaluated for upstream
process development
The basal media and feed media should qualify to fulfill the listed criteria in Table 5.1.1
and based on which the judicious selection of these should be done to take it further for
optimization for the process conditions and parameters.
Continuous advances in media, feed supplements, culture vessels, and manipulation of
temperature shifts, pH and numerous other methods make upstream process development
to potentially be a never ending process for improving expression yield. The fact that
optimal culture conditions are unique to each individual cell line, and that detailed
upstream process development takes much time and resources, it becomes imperative
that the MCB candidate cell line has maximum genetic potential for producing the
desired quality of the target protein of interest before starting upstream process
development (Bleck 2010). The media and feed combinations are important to achieve
the higher expression levels. As mentioned earlier, in practice the number of
experiments required to achieve the highest expression yield is numerous and never
ending task. Hence, in the present study, the upstream process development was carried
out in two rounds to achieve an enhanced expression level than the basal level. In the
first round the basal media listed in Table 5.1.2 available from different manufacturers
and based on some past experience were tried to screen the lead media which supports
good cell growth as well as expression of mAb. The different media are denoted in
alphabetic order and the control (CD-CHO Media) is labeled as “Z” in which the cells
are already adapted and growing. The media used are available either in liquid or

Page 171 of 235
powder forms or in both forms. The preference for powder form over liquid form is
obvious because of the cheaper rates, shipping convenience, logistics and extended
stability benefits.
ID Media Name Mfg Cat# Form
A Is-MAB-CD Irvin Scientific, USA 91104 Liquid / powder
B IS-CHO-CD-XP Irvin Scientific, USA 91121 Liquid / powder
C IS-CHO-CD-XP Irvin Scientific, USA 91120 Liquid / powder
D IS-CHO-CD-K-XP Irvin Scientific, USA 91125 Liquid / powder
E HyQCDM4CHO Hyclone, USA ARF26505 Liquid / powder
F CDM4PerMab Hyclone, USA AWB94001 Liquid / powder
G Serum FreeCHO HiMedia, India SFM002 Liquid
H PowerCHO2CD Lonza BE12-771Q Liquid
I PF-CHO Media 1 OF 2
Hyclone, USA SH303334.01 Powder
PF CHO BASAL 2 OF 2 SH303335.01 Powder
J Excell 302 SAFC 24324C Liquid / Powder
K MAM-PF7 Animed, Israel 10-02575-I Liquid
L Mam-PF2 Animed, Israel 10-02F24-I Liquid
M CDM4Mab Hyclone, USA AVK80331 Liquid / Powder
N CD-OptiCHO Invitrogen, USA 12681 Liquid
O Excell CD-CHO SAFC 14360C Liquid / Powder
P Pro CHO4 Lonza BE12-029Q Liquid / Powder
Q Pro CHO5 Lonza BE12-766Q Liquid / Powder
Z CD-CHO Invitrogen, USA 10743 Liquid
Table 5.1.2 List of Basal Media screened for optimizing expression
In the second round feed media listed in Table 5.1.3: was tried to screen the feed media
which support sustained growth of the cells and increase in cumulative productivity.
ID FEED NAME MFG. CAT # Form
1 Efficient Feed A (10%) Invitrogen A10234 Liquid
2 Efficient Feed B (10%) Invitrogen A10240 Liquid
3 Gln (4mM) + Glu (2g/L) Powder
4 Efficient Feed C (10%) Invitrogen A13275 Liquid
5 Extreme Feed (Excellgene) Lonza NA Liquid
6 Cell Boost 2 (10%) Hyclone RR12927.01 Powder
7 Cell Boost 3 (10%) Hyclone RR12635.01 Powder

Page 172 of 235
Table 5.1.3 List of Feed Media screened for optimizing expression
The scope of this study was to develop upstream process by screening basal media and
feed supplements for the lead clone D41E213 at shake flask.
5.2. Results and Discussion
The clone #D41E213, already growing in CD-CHO media, was seeded at 0.2x10⁶
cells/mL in 6-well TC plate as control. The cells growing in CD-CHO media were
adapted for growth in respective media for two passages before starting the experiments.
After adaptation, the cells were reseeded in respective media and incubated at 37 0C and
5% CO2. Samples (supernatant) were collected on Day 3 and 5 for expression analysis
by ELISA.
As shown in Figure 5.2.1:A, the expression of target mAb increases with time resulting
in a maximum yield in media PF-CHO (I) and Excell CD-CHO (O) on Day 5, followed
by media CDM4PerMab (F), CDM4Mab (M), IS-CHO-CD-XP (B) and IS-CHO-CD-K-
XP (D). The observed increase in expression yield was ~3 fold in PF-CHO and Excell
CD-CHO media, ~2.5 fold in CDM4PerMab Media, ~2 fold in Media CDM4Mab and
~1.5 fold in Media IS-CHO-CD-XP and IS-CHO-CD-K-XP.
8 Cell Boost 4 (10%) Hyclone RR12800.01 Powder
9 Cell Boost 5 (10%) Hyclone RR12929.01 Powder
10 Cell Boost 6 (10%) Hyclone RRE114619 Powder
11 Lonza Feed (10%) Lonza NA Liquid
12 Feed Power CHO2 (10%) Lonza BE12-771Q Liquid
13 Is-CHO-Feed-CD-XP (10%) Irvine
91122 Liquid /
Powder
14 GS-Max (10%) Hyclone SH30586.01 Liquid
15 Efficient Feed A + B (5%) Invitrogen A10234 +
A102340
Liquid
16 Efficient Feed A + B (7.5%) Invitrogen Liquid
17 Efficient Feed A + B (10%) Invitrogen Liquid

Page 173 of 235
A)
B)
Figure 5.2.1 Media Screening to achieve higher expression yield for clone D41E213
(A) Showing the trend of productivity over time in an individual experiment. Arrows indicate media
selected for further experimentation. The brown arrows represent top three media followed by next best
(pink arrows) and the control flask (red arrow)
(B) Displays the trend of contribution of each value generated from two independent experiments over
time. The experiments were done in duplicates in 6 well TC plates
From the above trend contribution graphs (Figure 5.2.1), Media PF-CHO, CDM4PerMab
and Excell CD-CHO were the top media supporting higher expression of mAb.
However, there is need to enhance the expression by implementing fed-batch process to
achieve higher cumulative productivity. The error bars on Day 5 are extended probably
due to the fact that the cells are undergoing apoptosis as they are growing in the same
media without addition of any nutrients till five days. This nutrient limitation could also

Page 174 of 235
affect the expression level heterogeneity within the same cell population. This was seen
in feed optimization experiments as represented in Figure 5.2.3, where the error bars on
later days were not spread out because of periodic addition of feed media. The variation
is not significant in Day 3 samples as the cells are growing well and the nutrient
requirements are sufficient to support the growth and expression of recombinant
proteins. In addition to the above listed top 3 media (PF-CHO, CDM4PerMab and Excell
CD-CHO, second best media IS-CHO-CD-XP and IS-CHO-CD-K-XP, IS-CHO-CD-K-
XP and CDM4Mab were also selected as basal media to be tried with different feed
media for further optimization experiments as listed in Table 5.2.1.
ID No. Basal Media Feed Media
F1
CDM4PerMab
Efficient Feed A (10%)
F2 Efficient Feed B (10%)
F3 Gln (4mM) + Glu (2g/L)
F4 Efficient Feed C (10%)
F5 Extreme Feed
F6 Cell Boost 2 (10%)
F7 Cell Boost 3 (10%)
F8 Cell Boost 4 (10%)
F9 Cell Boost 5 (10%)
F10 Cell Boost 6 (10%)
F11 Lonza Feed (16-07-11) (10%)
F12 Feed Power CHO2 (10%)
F13 Is-CHO-Feed-CD-XP (10%)
F14 GS-Max (10%)
F15 Efficient Feed A + B (5%)
F16 Efficient Feed A + B (7.5%)
F17 Efficient Feed A + B (10%)
B1 IS-CHO-CD-XP
Efficient Feed A + Efficient Feed B (50:50)
added 10% v/v
D1 IS-CHO-CD-K-XP
F1 CDM4PerMAB
I1 PF-CHO
M1 CDM4MAB
O1 EXCELL CD-CHO
Z1 CD-CHO

Page 175 of 235
B2 IS-CHO-CD-XP
Cell Boost 5 added 10% v/v
D2 IS-CHO-CD-K-XP
F2 CDM4PerMAB
I2 PF-CHO
M2 CDM4MAB
O2 EXCELL CD-CHO
Z2 CD-CHO
Table 5.2.1 Basal Media and Feed combinations used for improvement in expression yield.
Each combination is given an ID No. for ease of representation in graphical form and in text writing.
In the second round of optimization, basal media in combination with various feed media
as listed in Table 5.2.1 were tried.
Figure 5.2.2 Feed Media Screening for fed-batch culture optimization CDM4PerMab was used as the basal media to increase the expression yield. The expression of target
antibody was measured using Sandwich ELISA. The experiments were done in duplicate in 6 well TC
plates.
As mentioned earlier, the cells were seeded at 0.2 x 10⁶ cells / mL in a total volume of 2
mL in 6-well TC plate in the CD-CHO media after adapting the cells for 2 passages. The
media and feed media used were listed in Table 5.2.1. The respective feed media was
added at 10% v/v on Day 4 and Day 6. The samples before addition of feed media were
collected on day 6 and day 8 of total cell age and analyzed for expression yield by
Sandwich ELISA. The cell count was also measured at the end of culture (Day 8) which
is plotted as line curve in Figure 5.2.2.

Page 176 of 235
An increase in expression yield was observed in feed combinations F1, F4, F6, F10, F12
and F13 used when CDM4PerMab was used as basal media but, was not significant in
terms of fold increase.
The six basal media shortlisted above were tried in combination with two feed media
(Efficient Feed A+ Efficient Feed B and Cell Boost 5). Although there are potential feeds
identified but those didn’t show significant improvement in terms of fold increase in
expression yield, hence Efficient Feed A+ Efficient Feed B and Cell Boost 5 was
shortlisted for further experimentation. Both these feeds were tried in combination with
the shortlisted basal media. On Day 4 of cell growth, 10% v/v of each feed was added
and cells were incubated further under similar conditions. The samples were collected on
Day 6 (Day 2 after feeding) and Day 8 (Day 4 after feeding) for expression analysis by
ELISA.
A)
B)

Page 177 of 235
Figure 5.2.3 Combination of basal media and feed for fed-batch optimization A) Showing the trend of expression yield over time in an individual experiment. Arrows indicate
media selected for further experimentation. The green panel is where feed media Cell Boost 5 was
added as feed and purple color is where Efficient Feed A +Efficient Feed B was added.
B) Displays the trend of contribution of each value generated from two independent experiments over
time. The experiments were done in duplicate in 6 well TC plates.
From the trend contribution graphs depicted in Figure 5.2.3:B, both the feed media along
with PF-CHO and CDM4PerMab basal media gave ~2 fold increase in expression yield
while Excell CD-CHO basal media gave ~1.5 fold when compared to the control CD-
CHO media. Hence, based on these observations, ease of use amongst the tried feed
media and prior experience with these feeds, the CDM4PerMab as a basal media in
combination with Efficient Feed A + Efficient Feed B was selected for further analysis
at the shake flask level. In addition to these lead combinations the second in line
combination using media IS-CHO-CD-XP, IS-CHO-CD-K-XP and CDM4Mab were
also experimented. The cells were seeded in 125mL shake flask at 0.5 x 10⁶ cells / mL
and grown for 4 days at 37 0C and 5%CO2 following which the shake flasks were shifted
to a fed-batch mode where 10% v/v Efficient Feed A + Efficient Feed B (A+B) was
added on every alternate day starting from Day 4. The cell growth was monitored by
taking cell count at every alternate day and expression yield was estimated by Sandwich
ELISA starting from Day 8 of culture. The fed-batch was terminated when the viability
dropped below 80%. As shown in Figure 5.2.4:A, Excell CD-CHO and IS-CHO-CD-
XP showed viability drop below 80% in early stages compared to CD-CHO (Z), PF-
CHO (I) and CDM4PerMab (F) where the viability of more than 80% was maintained
even after 20 days.

Page 178 of 235
A)
B)
Expression Yield Comparison in Different Basal Media (Clone #D41E213)

Page 179 of 235
C)
Figure 5.2.4 Comparison of Different Basal Media in Shake Flask Experiment
(A) Graph depicting the IVCC and %viability of cells to measure the cell growth. The cell count taken
using automated cell counter Countess™,
(B) The expression yield was measured using Protein A HPLC every alternate day starting from Day 8
of culture
(C) Consolidated graph to evaluate performance of cells in terms of growth and productivity in various
chemically defined media
The IVCC of clone D41E213 achieved at the end of fed-batch in different basal media
are tabulated and rated in Table 5.2.2. The viability of cells in PF-CHO, CDM4PerMab
and CD-CHO was around 90%, whereas it dropped steeply in IS-CD-CHO-Xp and
Excell CD-CHO Media as shown in Figure 5.2.4:A and B.
Basal Media Approximate IVCC
and Days Viability
Expression Yield
(mg/L) Rating
CDM4PerMab 80 x 106 cells (Day
16) 88% 311 *****
PF-CHO 80 x 106 cells (Day
20) 90% 370 ****
Excell CD-
CHO
20 x 106 cells (Day
10) 40% 28 *
IS-CHO-CD-
XP
70 x 106 cells (Day
14) 55% 125 **
CD-CHO 80 x 106 cells (Day
20) 93% 132 ***
Performance Evaluation of Different Chemically Defined Media

Page 180 of 235
Table 5.2.2 Comparing and rating the basal media by taking in account the cell growth and
expression yield. ***** represents the best and * poor combination
The consolidated effect of IVCC and expression yield concluded that CDM4PerMab and
PF-CHO Media supported higher growth and higher expression yield (Figure 5.2.4C).
However, CDM4PerMab is the top media as the comparable IVCC was achieved on Day
16 which is 4 days less than that achieved in PF-CHO Media. This is a huge advantage in
terms of operation and cost when the process is scale-up to larger volumes. Because of
these obvious merits of CDM4PerMab Media in combination with Efficient Feed A+
Efficient Feed B these were selected as final basal media for further upstream process
development at higher scale.
5.3. Conclusion
The most commonly used media for expression of recombinant proteins in CHO cells
were screened of which two lead basal media (CDM4PerMab and PF-CHO) were
identified. Out of these two media, CDM4PerMab was identified as the preferred media
due to the fact that it is cheaper than PF-CHO media and is less complicated in
preparation. With the CDM4perMab as a basal media various feed media based on the
availability and experience were tried, out of which Efficient Feed A + Efficient Feed B
was shortlisted as it gave good sustained cell growth and increase in expression yield.
These media components (CDM4PerMab and Efficient Feed A + Efficient Feed B) are
routinely used in other project and there is ease of using these due to availability in bulk
resulting in establishment of platform media at competitive cost. The process was thus
optimized for the expression of target protein at shake flask level using CDM4PerMab
media with addition of Efficient Feed A + Efficient Feed B (50:50) at 10% v/v for
further experiments.

CHAPTER 6
CHARACTERIZATION OF THE EXPRESSED RECOMBINANT ANTI-EGFR MONOCLONAL ANTIBODY

Page 182 of 235
6.1. Preamble
Product characterization and comparability with the Reference Medicinal Product (RMP)
are two important aspects for companies working on biosimilar molecules. Being
biological in nature they have associated complexity. The expressed protein is host and
process dependent. Therefore, the evaluations of critical quality attributes are of prime
importance. The demonstration of comparability does not necessarily mean that the
expressed product is identical to RMP however; it should be same in terms of primary
sequence and, close in terms of quality, safety and potency. Characterization and
determination of comparability at the early stages of development can be based on a
combination of a few crucial analytical tests and in-vitro biological assay which gives
preliminary confidence that the candidate clone selected will deliver a biosimilar product
which shall meet all the PQAs.
Prior to designing a cell culture and purification process for mAb manufacturing, a
quality target product profile provides a list of quality attributes (QA) and what levels are
critical and hence need to be monitored and controlled. Since antibodies are a
homologous class of molecules, knowledge gained through prior experience or from
published studies may greatly aid in defining QAs. The definition for quality attribute is
fairly broad and can potentially include raw materials in addition to features of the drug
molecule itself (Flynn, et al 2010).
Critical Quality Attributes (CQA) is a physical, chemical, biological, or microbiological
property or characteristic that should be within an appropriate limit, range, or distribution
to ensure the desired product quality. CQAs are generally associated with the drug
substance, excipients, intermediates (in-process materials) and drug product [Ref: ICH
Q8(R2)]. There are assigned Product Quality Attributes (PQA) which is product specific
and most of the times dependent on the clone. The PQA like glycosylation and charge
variants are cell line derived and changes from cell line to cell line due to variation in the
metabolism from cell to cell. Hence, the PQA need to be determined at early stage of
clone selection in order to identify the right clone so that there would not be surprises at
the later stage of development thus, saving on the development time. Measuring and
monitoring PQA will guide through determination of CQAs at the final process stage
(Mire-Sluise, et al 2009).

Page 183 of 235
The most recent regulatory document covering characterization of monoclonal antibodies
was published by the European Medicines Agency (EMA) in July 2009 (Ref.
EMEA/CHMP/BWP/1576532/2007). This EMA guideline entitled “Development,
Production, Characterization and Specifications for Monoclonal Antibodies and Related
Products” states that the monoclonal antibody should be characterized thoroughly before
going for human use. This characterization should include the determination of
physicochemical properties, purity, impurities and quantity of the monoclonal antibody,
in line with ICH-Q6B. As shown in Figure 4.1.1 of Chapter 4, the PQA assessment is
done at different stages of the product life cycle employing similar or different analytical
techniques at each stage. The list of PQAs which with the impact on product is referred
in Table 4.1.1:, and the PQAs studied for the mAb of interest are highlighted in yellow
color which ensures the capacity of clone to process and produce the right molecule to go
for the further development work. However, there could be some minor modifications to
this depending on molecule and the function of it.
To identify the impact of a product characteristic change or manufacturing process
change, careful evaluations of all foreseeable consequences for the product is performed
by Innovator / Originator Company and are usually available in the form of published
reports or literature.
For example, as depicted in Figure 6.1.1, there are a number of modifications possible in
a mAb molecule. It shows the modifications of mAb molecule with one glycosylation
site, and if we consider the mAb in discussion (anti-EGFR mAb, Cetuximab) where there
is an additional glycosylation site then the possible number of variants could be much
more than 108 (theoretically 108 + 108 = 2 x 10⁸). Hence, this is a very complex
molecule to deal with and product characterization is critical at an early stage so that the
right clone is selected.

Page 184 of 235
Figure 6.1.1 General product quality variables for mAbs.
(Figure taken from presentation by Steven Kozlowski, M.D., Director Office of Biotechnology Products
OPS/CDER (6/21/06). There are possibilities of 2 pyroglutamate formation (Pyro-E), 6 deamidation (D)
prone sites, 4 oxidation (O) prone sites, 4 glycation sites (G), 5 sialylation ( )and 2 C-terminal lysine (K)
sites. These all results in ~9600 variants of IgG molecule.
These modifications could be cell line or process driven and assigned as PQAs based on
their impact on overall product quality and bioactivity. The list of PQAs and their
importance is described in Chapter 4 section 4.1. As shown in Table 4.1.1, the most
important PQA for mAbs is aggregate content while Q-cyclization is the least. The other
kinds of modifications have criticality falling between these two extremes. Hence, these
attributes should be carefully studied before finalizing on the lead clone for the
manufacture of biosimilar therapeutic monoclonal antibody. In the mAb of interest, the
preliminary analytical testing is already covered in Chapter 4 (Final Clone selection),
however, high end analytical testing like Mass Spectrometry, Size Exclusion
Chromatography and characterization of peaks observed in CEX-HPLC was carried out
to further characterize the product expressed in an alternate host, CHO cells. The
following quality attributes were studied:

Page 185 of 235
6.1.1 Aggregation and Degradation of Protein
Protein aggregation is a common issue encountered during manufacturing of
biotherapeutics. It is possible to influence the amount of aggregate produced during the
cell culture and the purification process by carefully controlling the environment (e.g.
media components) and implementing appropriate strategies to minimize the extent of
aggregation. Steps to remove aggregates have been successfully used at a manufacturing
scale. Care should be taken when developing a process to monitor the compatibility of
the equipment and process with the protein to ensure that potential aggregation is
minimized (Cromwell, et al 2006).
Aggregation is a general term that encompasses several types of interactions or
characteristics. Protein aggregates are defined very broadly as high molecular weight
proteins composed of multimers of natively conformed or denatured monomers.
Aggregates of proteins may arise from several mechanisms and may be classified in
numerous ways, including soluble/insoluble, covalent/noncovalent, reversible
/irreversible, and native/ denatured. For protein therapeutics, the presence of aggregates
of any type is typically considered to be undesirable because of the concern that the
aggregates may lead to an immunogenic reaction (small aggregates) or may cause
adverse immunological events on administration (particulates) (Rosenberg 2008). There
is no consistent definition of what is meant by a “soluble” aggregate, so working
definitions are often employed. For the purpose of this discussion, soluble aggregates
refer to those that are not visible as discrete particles and that may not be removed by a
filter with a pore size of 0.22 µm. Conversely, insoluble aggregates may be removed by
filtration and are often visible to the unaided eye. Both types of aggregates are
undesirable for the development of a therapeutic protein. Covalent aggregates arise from
the formation of a chemical bond between 2 or more monomers. Disulfide bond
formation resulting from previously unpaired free thiols is a common mechanism for
covalent aggregation (Andya, et al 2003). Oxidation of tyrosines may also result in
covalent aggregation through the formation of bityrosine (Giulivi and Davies 1994). For
some proteins, a covalent interaction between monomers is required to form a stable
protein structure that is to form a homo- or hetero-dimeric protein (eg. Follicle
Stimulating Hormone, Antibodies).
Just as there are many types of interactions (hydrogen bond, disulfide linkage, covalent
linkage) that can lead to protein aggregation, there are many environmental factors that

Page 186 of 235
can lead to aggregation (Chi, et al 2003). Solution conditions such as temperature,
protein concentration, pH, and the buffer ionic strength may affect the amount of
aggregate observed. The presence of certain ligands, including specific ions, may
enhance aggregation. Stresses to the protein such as freezing, exposure to air, or
interactions with metal surfaces may result in surface denaturation, which then leads to
the formation of aggregates. Finally, mechanical stress may also lead to aggregation.
Each of these environmental factors is typically encountered during bioprocessing
starting from the cell line to cell culture, purification, formulation, filling and storage
processes (Cromwell, et al 2006).
There are several opportunities for protein aggregation to occur during cell culture
process. During expression, accumulation of high amounts of protein may lead to
intracellular aggregation owing to either the interactions of unfolded protein molecules
or to inefficient recognition of the nascent peptide chain by molecular chaperons
responsible for proper folding (Zhang, et al 2004). During a typical production of a
monoclonal antibody from a mammalian cell culture, the protein is secreted from the cell
into the cell culture medium. The medium usually contains cells, ions, nutrients for the
cells, host cell proteins (including proteases), dissolved oxygen, and other species. This
cellular suspension at near neutral pH is held at temperature above 30 0C for several days
for getting the accumulated expressed protein. These conditions which could be
unfavorable to proteins may lead to aggregation. Judicious selection of expression
system and culture condition is important to minimize the aggregation (Cromwell, et al
2006). Hence the measurement of aggregation using rapid and simple method is
essential at an early stage to monitor the cell line behavior.
It has been reported that mAbs expressed in a CHO cell line sometimes contain unpaired
thiols (Zhang and Czupryn 2002) which leads to aggregate formation during cell culture
process. The presence of a free thiol may affect long-term stability of the protein.
Noncovalent aggregates have also been observed to be formed during cell culture
(Cromwell, et al 2006). Protein aggregation poses risk in terms of generation of immune
responses to the therapeutic protein product. Of principal concern are those immune
responses associated with adverse clinical effects: neutralizing antibody that inhibits the
efficacy of the product or, worse, cross reactively neutralize an endogenous protein
counterpart; and severe immediate hypersensitivity responses such as anaphylaxis.
Among the qualitative factors critical in inducing antibody responses are molecular

Page 187 of 235
weight and solubility. While low MW aggregates such as dimers and trimers appear
inefficient in inducing immune responses, large multimers whose MW exceeds 100 kDa
are efficient inducers of immune responses. Moreover, it has been long known that
particulate (insoluble) antigens are very rapidly endocytosed by antigen-presenting cells,
which initiate immune response (Rosenberg 2006).
Proteolytic degradation of recombinant proteins represents a major problem related to
production of gene products in heterologous hosts (Murby, et al 1996). Protein can
undergo several degradation mechanisms. These can be both chemical (i.e. reactions that
involve specific residues which results in a change in the primary structure of the
proteins) and physical (i.e. partial unfolding, conformational changes, adsorption,
dissociation and aggregation). Oxidation and deamidation are the most common
chemical degradation reactions. Cells have both intracellular and extracellular pathways
for degrading proteins. The major extracellular pathway is the system of digestive
proteases, which break down proteins to polypeptides. These include endoproteases such
as trypsin and chymotrypsin; exopeptidases such as aminopeptidase, carboxypeptidase
and peptidase, contributed by lysed producer cell or a contaminant.
Protein turnover within the cell is a normal process that is highly regulated.
Degradation- destined proteins are degraded via distinct pathways. For example, a newly
synthesized protein, yet misfolded protein is degraded via the Ubiquitin Proteosome
System (UPS) or Endoplasmic Reticulum Associated Degradation (ERAD) pathways in
an ubiquitin dependent manner. In contrast, protein aggregates or oxidative modified
proteins are predominantly degraded via autophagy. Degraded proteins could generate
immune response hence the levels need to be estimated (Hermiling, et al 2004).
6.1.2 Heterogeneity of Monoclonal Antibodies
Monoclonal antibodies, like other proteins, are subject to many posttranslational
modifications, including modifications of the termini, glycosylation, deamidation,
isomerization, oxidation, fragmentation, aggregation, etc. Almost all of these changes
can alter surface charge properties of the antibody either directly by changing the number
of charged groups or indirectly by introducing structural alterations. Even a small
perturbation of the structure may change the local distribution of charged residues or

Page 188 of 235
modify their pKa, thus changing the overall surface-charge distribution of the antibody
(Vlasak and Ionescu 2008).
Molecular alterations can take place at every stage of manufacturing: cell culture,
purification, formulation, and storage. Since chemical modifications can affect the
biological activity of a protein, detection and identification of molecular changes are
important analytical issues in biopharmaceutical development. Antibody modifications
can occur enzymatically or non-enzymatically, e.g. through unfavorable storage
conditions which may cause charge or size heterogeneity. Common modifications of the
primary sequence include N-glycosylation, methionine oxidation, proteolytic
fragmentation, and deamidation (Jefferies, et al 1990, Jefferis and Lund 1997, Manning,
et al 1989, Volkin, et al 1981).
In general the heterogeneity in mAbs is caused by chemical modifications which in turn
lead to non-covalent interactions, conformational diversity and aggregation.
The chemical modifications cover the following but not limited to post-translational
modifications happening either in-vivo or ex-vivo:
Disulfide bonds includes free sulfhydryl and reactive cysteine residues,
incomplete disulfide bond formation between inter-chain and intra-chains,
disulfide bond breakage due to -elimination and disulfide bond scrambling.
Variation in the oligosaccharide structure due to culture conditions and media
composition.
Formation of N-terminal pyroglutamate from glutamate and glutamine.
C-terminal Lysine processing of the heavy chain.
Deamidation of asparagines through formation of succinimide intermediate.
Isomerization of asparatate residue in the sequence Asp-Gly through formation
of succinimide intermediate,
Oxidation of methionine
Glycation resulting from the non-enzymatic reaction between reducing sugars
and the N-terminal primary amine or the amine group of lysine side chains,
Peptide bond cleavage especially at the hinge region which is most susceptible
in mAb structure,
Cross-linking of light chain and heavy chain by non-reducible covalent bonds,
Mutation, Insertion and truncation,

Page 189 of 235
Other chemical modifications like modification of the N-termini of either light
chain or heavy chain by maleuric acid, C-terminal lysine residue or amidation
of a newly exposed C-terminal proline after removal of both C-terminal lysine
and glycine residues. The non-covalent interaction with riboflavin and metal
ions like copper could change the charge property of mAb.
Conformational heterogeneity of protein exists as an ensemble of different
conformations in equilibrium instead of a single rigid structure (Liu, et al 2007b).
Since most human IgGs have a basic isoelectric point, cation-exchange HPLC (CEX) is
typically used. Variants that elute earlier than the main peak are referred to as acidic
because they are less positively charged and therefore bind less tightly to the column.
Variants that elute later than the main peak are referred to as basic. In CEX, the net
surface-charge, its distribution, and the overall geometry of the protein play a role in the
separation. For instance, deamidation events in different parts of the molecule can be
resolved by CEX. Table 6.1.1 summarizes different modifications that were detected
in antibodies by CEX. As described in Table 6.1.1, ProPac WCX-10 column (Dionex
Corp.), based on the polymeric tentacle resin has become the gold standard for antibody
analysis (Weitzhandler, et al 1998). However, newer version of gel based resins such as
TSKgel CM-STAT (Tosoh Bioscience) gives better resolution of peaks in shorter run
time.
Modifications Column Used Elution Explanation
Lack of abnormal
glycosylation
ProPac WCX-10 Basic Conformational
Sialylation of glycans ProPac WCX-10 Acidic New COOH
C-terminal lysine cleavage ProPac WCX-10
PL-SCX (Polymer Labs)
Mono S HR5/5(Pharmacia)
Acidic Loss of NH2
C-terminal amidation ProPac WCX-10 Basic Loss of COOH
N-terminal glutamine
cyclization
PL-SCX (Polymer Lab)
ProPac WCX-10
Acidic Loss of NH2
Maleuric acid adduct ProPac WCX-10 Acidic Loss of NH2
Thiosulfate adduct BakerBond WP Carboxy
sulfone (J.T. Baker)
Acidic New acidic group
Citrate or succinate adduct Not specified Acidic New COOH
Oxidation, HC M252 &
M428
ProPac WCX-10 Basic Conformational

Page 190 of 235
Cysteinylation, HC, C104 ProPac WCX-10 Acidic Conformational
Disulfide related ProPac WCX-10 Basic Conformational
Deamidation, HC N55 ProPac WCX-10 Acidic New COOH
Deamidation, HC N55, N384,
N389
ProPac WCX-10 Acidic New COOH
Deamidation, LC N30, HC
N55
BakerBond CSX Acidic New COOH
Deamidation, LC N161, HC
N141
Mono S HR5/5 (Pharmacia) Acidic New COOH
Succinimide LC D30 ProPac WCX-10 Basic Loss of COOH
Succinimide, HC D102 BakerBond CSX Basic Loss of COOH
Isomerization, HC D102 BakerBond CSX (J.T. Baker) Basic Conformational
Table 6.1.1 Modifications Detected by CEX in the Full-Length Ab.
LC – light chain, HC – heavy chain. The ProPac WCX-10 is manufactured by Dionex Corp. – The elution
is indicated relative to the unmodified antibody, for some variants, like those related to C-terminal lysine
cleavage or to pyroglutamate formation the main population may carry the modification. - Formation of an
amide bond between the carboxyl of maleuric acid and the N-terminal primary amine (Vlasak and Ionescu
2008). Bold represent the modifications studied during this work
Monoclonal antibodies intended for therapeutic use require a comprehensive
characterization of their structural integrity, purity, and stability. Charge heterogeneity is
a common phenomenon in Abs and mAbs. Manufacturers of pharmaceutical proteins are
expected to define and characterize the pattern of heterogeneity and assure batch-to-
batch consistency for approval by regulatory authorities (Points to Consider, FDA, USA,
1997).
In this study we have monitored two major modifications, C-terminal lysine and
glycosylation
6.2.4.1. Heterogeneity due to C-terminal Lysine cleavage.
All human IgGs contain a lysine residue at the C- terminus of the heavy chain. Lysine
and arginine residues at the C-terminus of proteins are usually removed by cellular
enzymes called carboxypeptidases. Typically, the removal is incomplete, resulting in
two, so called lysine variants, with lysine on either one or both heavy chains. In some
antibodies the main population could still contain lysine on both heavy chains, because
of a lower level of carboxypeptidases in the producing cell line (Vlasak and Ionescu
2008). Lysine variants can not be identified by method like RP-HPLC but other methods,
including CEX (Weitzhandler, et al 1998 and Gadgil, et al 2006) and IEF where

Page 191 of 235
antibodies with the C-terminal lysines elute as basic peaks due to the presence of the
lysine. Removal of C- terminal lysines with carboxypeptidase B (CPB) can be used as a
quick method to determine the amount of lysine variants and to identify their peaks in the
chromatogram (Vlasak and Ionescu 2008). The presence of lysine variants complicates
analytical characterization because every species is accompanied by its own lysine
variants. Consequently, the number of peaks increases three fold and can lead to peak
overlaps. Treatment with CPB prior to analysis can significantly simplify the
chromatograms (Perkins, et al 2000).
Lysine variants are not expected to affect efficacy or safety. In fact, similar processing
occurs in natural human antibodies (Vlasak and Ionescu 2008). In addition, lysine
removal was found to have no effect on CDC (Antes, et al 2007). Lysine variants,
however, need to be monitored to ensure consistency of the manufacturing process and
can serve as a surrogate marker of product quality (Vlasak and Ionescu 2008).
6.2.4.2. Heterogeneity due to Glycosylation
Glycosylation is an important aspect to monitor to ensure the bioactivity of molecule and
heterogeneity in the product, although there is no unifying function for oligosaccharides
(Dwek, et al 1995). Recombinant IgG antibodies are typically glycosylated at a
consensus sequence Asn-Xxx-Ser/Thr which is conserved site at Asn297 in the CH2
domain of the Fc portion. The antibody in discussion, anti-EGFR monoclonal antibody
(Cetuximab), is a unique monoclonal antibody possessing three N-linked glycosylation
sites; one in the CH2 domain which is conserved amongst all antibodies, second and
third site within the framework 3 of the variable portion of the heavy chain.
Figure 6.1.2 Depiction of conserved N-linked glycosylation site at Asn297 of Fc domain

Page 192 of 235
In the case of Cetuximab, the typical characteristic is that the N-linked glycosylation site
in Fc portion is at Asn299 and not Asn297. The second site of glycosylation in Cetuximab
is in variable domain at Asn88 while the third side is not glycosylated. The
oligosaccharides located at the two sites are a complex mixture of different glycans,
making them challenging for structural characterization (Qian, et al 2007). In general,
glycosylation at Asn297/299 is known to influence the biological, pharmacological and
physico-chemical properties of IgGs (Kamoda, et al 2006). The biological functions
influenced by glycosylation include resistance to proteases, binding to monocyte Fc
receptor, complement-dependent cytotoxicity (CDC), antibody-dependent cellular
cytotoxicity (ADCC), and circulatory half-life in-vivo (Qian, et al 2007). Glycans
represent only a small fraction of an antibody structure (2-3%) but add complexity and
heterogeneity which plays a unique role in effector functions (Beck, et al 2008). N-
linked oligosaccharides produced in different cell lines (CHO, SP2/0 or NS0) are usually
fucosylated, complex bi-antennary structure with different degrees of galactosylation: no
terminal galactose (G0F), one terminal galactose (G1F) and two terminal galactose
(G2F).
A standard format for the depiction of glycosylation is represented in Figure 6.1.3
adapted from Harvey, et al 2009.

Page 193 of 235
A)
B)

Page 194 of 235
Figure 6.1.3 Format for depicting of glycosylation.
A) Different forms typically present in the glycosylated proteins. B) Abbreviations and symbols for
different forms. C) Type of Linkages observed. D) Carbon atoms where the bond formation is
possible, E) Representation of glycosylation structure.
A)
D) F)
C) E)

Page 195 of 235
B)
C)
Figure 6.1.4 Three subclasses of N-glycan structure observed in mammalian cells.
A) High mannose structure in which there are mannose structures at the terminal positions, no fucosylation
in core GlcNAc structure, represents early stage in the biosynthesis of glycans and typically found in yeast,
B) Complex structure which exists in bi-, tri-, and tetra antennary forms, lactosamine units can be found in
repeats, sialic acid present at the terminal galactose molecule, represents a late stage in the biosynthesis of
O-linked oligosaccharides, C) Hybrid structure: The N-linked glycan of complex type is of pharmaceutical
interest. Dashed box represents the core
Oligosaccharides in recombinant monoclonal antibody are generally composed of a
heterogenous mixture of the G0F, G1F, and G2F structures (Figure 6.1.4). The relative
ratios of the G0F, G1F, and G2F structures are dependent on cell line type, clone and cell
culture process. The change in carbohydrates is observed in the terminal residues after
the addition of mannose (green block). The glycan structure and carbohydrate linkages
are similar in human and CHO cells except for the terminal N-AcetylNeuraminic acid
(NANA). There are two possibility of bond formation in human α2,3 or α2,6 while in
CHO only α2,3 is observed. In case of murine cell line like NS0 or SP2/0 terminal

Page 196 of 235
galactose is linked with N-GlycolylNeuraminic acid (NGNA) with the help of α1,3 bond
(Figure 6.1.5).
Figure 6.1.5 Various carbohydrate moieties observed in different cell lines.
The carbohydrate moieties shown are typically observed in recombinant monoclonal IgG molecules
expressed in different cell lines. Typical glycosylation observed (A) Human, (B) CHO and (C) NS0 cells
or SP2/0.
Glycosylation possess critical function for the proteins especially for therapeutic use.
There are many cell functions of proteins which are affected by the characteristics of
glycosylation such as protein folding, intracellular trafficking, biological activity, protein
solubility, modulation of antigenic determinants, circulatory life-time, protein
heterogeneity and protease protection and cell-to-cell recognition (Varki 1993). In
addition to these functions, changes in the antibody glycosylation profiles can have a
significant impact on antibody effector function. Therefore, glycosylation is considered
as ‘Product Quality Attribute (PQA)’ which is important to be controlled for biosimilar
mAbs and the glycosylation profiles should be similar to the RMP and consistent from
lot-to-lot indicating that the cell culture process is well controlled and reproducible. In
addition, mAb expression in CHO and murine myeloma cell lines may give rise to
atypical glycosylated structures under some conditions which could have adverse effects
on in-vivo efficacy, immunogenicity, or clearance (Jefferis 2005).
Furthermore, specific changes in oligosaccharide structure affect biological function.
Various enzymatic and non-enzymatic modifications of oligosaccharide structure are

Page 197 of 235
introduced during protein synthesis and assembly, cell culture process, purification,
formulation, storage and incubation under various accelerated conditions often convert
homogeneous population into a heterogeneous one. Thus, the oligosaccharides of mAb
have micro-heterogeneity and their profile is often altered even under a defined set of
culture and purification protocol. Apart from this the inherent property of the clone to
make a particular glycan with a specific ratio of G0, G1, G2 forms are critical and
required to establish biosimilarity of mAbs. The careful selection of single cell clones
and optimization of cell culture conditions have been shown to impact the relative
abundance of various antibody glycan structures. The enzymatic modification varies
from cell to cell, hence determinination of the oligosaccharide / glycan structure is
crucial and necessary for the identification of a Master Cell Bank (MCB) candidate
clone.
6.2. Results and Disussions From the results described in Chapter 5, Clone # D41E213 is the lead clone hence the
mAb produced by this clone is characterized further using high-end analytical tool.
6.2.1. Determination of aggregates and degradants (clips) by Size Exclusion-HPLC
SE-HPLC is a method which separates molecules based on their size and hydrodynamic
volume. Molecules pass through the column and depending on their sizes, elute through
a stationary phase at different rate. Smaller molecules travel through the pores of the
stationary phase while larger molecules are unable to enter all the pores and hence a
separation is obtained where larger molecules elute first and the smaller molecules later.
As the method described can resolve related forms based on their molecular size of mAb,
it is used for quantitation of high molecular weight and low molecular weight related
forms for purity analysis. There are numerous studies dealing with aggregation and
dissociation processes, unfolding and refolding experiments available. The estimation of
molecular mass in combination with size exclusions, crystallization studies and the
biophysical characterization of the influence of salt concentration, pH and concentration
of protein behavior in solution is important (Jangbauer, et al 2003).
High-performance size exclusion chromatography (SEC) is a simple method for
molecular mass estimation, detection and quantification of aggregates formed and
degradants generated during the process of culturing. This method suffers from a few
restrictions that prevent correct molecular mass determination. Retention difference in
SEC is caused by different diffusivities of the proteins into pores. In addition

Page 198 of 235
electrostatic interaction and hydrophobic interaction with the matrix may give rise to
aberrant retention. Aggregation of protein is a major problem in biopharmaceutical
industry because of a possible loss of potency and visual appearance of the product.
Although large aggregates are present in extremely low concentration, they may have a
big impact on the quality of the product. SEC has been widely used to characterize
protein aggregates present in human IgG (Jangbauer, et al 2003). Monitoring of
aggregates at very early stage is important as clones differ in the levels of aggregates and
therefore it is important to pick a clone which has low levels of aggregates. SEC also
helps in monitoring the low molecular weight degradants or clips which could again be
clone specific and/or process specific.
The Protein-A purified product from clone #D41E213 was tested for SEC-HPLC.
TSK3000SWXL (Cat# 08541, Tosho) was used for the estimation of aggregates and
degradants / clips. As represented in Figure 6.2.1, a main peak of mAb heterodimer
contributing approximately 99% of total peak area was observed at Rt of ~15 min in
RMP as well as test sample. A minor pre-peak observed before the main peak,
contributing to 0.25% and 0.48% in RMP and test samples, respectively is indicative of
aggregates present. The percentage degradants / clips are similar in RMP as well as test
sample which appears as a hump associated with the main peak plus a small peak at Rt of
~18 min (Refer inset picture in Figure 6.2.1). The percentage of aggregates and clips are
represented in Table 6.2.1.
A)

Page 199 of 235
B)
Figure 6.2.1 Comparison of expressed mAb from clone #D41E213 with RMP by SEC-HPLC. A) Profile of RMP with inset picture zoomed to visualize pre and post peaks of main peak. B) Profile of partially purified sample from clone #D41E213 with inset picture zoomed to visualize pre
and post peaks of main peak.
Table 6.2.1 Comparison of RMP with expressed mAb from clone #D41E213 with RMP by SEC-
HPLC
Although the percentage of aggregates is more in test samples than in RMP, it is not
significantly higher and could be removed by incorporating another purification step
during the final downstream process development while the total percentage of clips /
degradants was almost similar (Table 6.2.1). The overall purity of Protein-A eluate of
clone #D41E213 was ~98%. Hence the most important PQA of the mAb molecule is
met.
6.2.2. Characterizing the charged forms observed on CEX-HPLC
The CEX-HPLC profile obtained for the Protein-A purified mAb from different clones
are already explained in Chapter 4 (Final Clone Selection). The profile is depicted below
for ease of understanding the further steps.

Page 200 of 235
Figure 6.2.2 Cation Exchange HPLC for determination of charge variants (Same as Figure 4.2.7:
The Protein-A purified harvest from each clone was analyzed for CEX profile by injecting approximately
5µg of protein. The peak labeling is done by assigning the K0 peak as 0.
About 15 µg RMP was digested with 0.8 µg carboxypeptidase to remove the C-terminal
Lysine. The digested sample was then checked on CEX-HPLC. The basic peaks (+1, +2
and +3) shown in Figure 6.2.2 disappeared indicating that these peaks are indeed
contributed by the C-terminal Lysine. These peaks are present in very small quantities in
the expressed mAb as compared to that in the RMP hence there is less heterogeneity in
the expressed mAb which in turn is advantageous in achieving batch to batch consistency
during the final process and scale-up studies.
D41C140 Day 16-SF D41D116-Day 16-SF D41E213-Day 16-SF RMP – 10 mcg
0
-1 -2 -3
-4
-5
Acidic Variants
+1 +2
+3
Basic Variants

Page 201 of 235
Figure 6.2.3 CEX-HPLC profile of RMP before and after CpB digestion.
The blue profile is charge heterogeneity observed in the product available in the market while the pink
profile is after CpB treatment whereby the C-terminal Lysine is digested thereby reducing the heterogenity
in the product.
6.2.3. Determination of N-terminal amino acid sequence by Edman Degradation Method
N-Terminal Sequencing uses a chemical process based on the technique developed by
Pehr Edman (Edman 1950) and then automatized by Hugh Niall (Niall 1975) where by:
The N-terminal amino acid reacts with phenylisothiocyanate (PITC).
The derivatizing process results in a phenylthiohydantoin (PTH) – amino
acid.
This amino acid is then sequentially removed while the rest of the peptide
chain remains intact.
Each derivatization process is a cycle.
Each cycle removes a new amino acid.
The amino acids are sequentially analyzed to give the sequence of the protein
or peptide.
Routinely used for the analysis of membrane bound gel electrophoresis
separated proteins, HPLC separated tryptic digest fragments, etc.
Compatible with proteins and peptides prepared from a variety of sources,
such as HPLC separation, PVDF blotting following electrophoresis, and
peptide synthesis.

Page 202 of 235
The RMP and protein A purified sample from clone #D41E213 was run on 10% SDS-
PAGE reducing conditions and then transferred to PVDF membrane from where it was
taken for N-terminal sequencing using Procise 492 (ABI) instrument.
In the heavy chain, the first amino acid is Glutamine which is present in the form of
pyroglutamate. The sequencing reaction is blocked by this residue hence the first amino
acid was chopped using Glutamyl aminopeptidase enzyme isolated from Pyrococcus
furiousus (Werner, et al 2005).
The first five amino acid of light chain and heavy chain matched with that of the RMP as
represented in Table 6.2.2
N-terminal Amino Acid 1 2 3 4 5 6
Light Chain – RMP D I L L T -
Light Chain – Test D I L L T -
Heavy Chain – RMP Q V Q L K Q
Heavy Chain – Test Q V Q L K Q
Table 6.2.2 N-terminal amino acid sequence comparison using Edman Degradation Method
The start of light chain and heavy chain protein sequence is same as that of the RMP
thereby establishing the authenticity of the primary sequence.
6.2.4. Analysis of expressed product by LC-MS/MS
Mass spectrometry strategies for the identification of recombinant protein modifications
and degradation products vary somewhat depending on the modification of interest and
the type of MS instrumentation available. Despite these variations, most approaches
involve the analysis of either intact proteins (“top down” approach) or peptides generated
from enzymatic digestion (“bottom up” approach or “peptide mapping” approach). In
either scenario, LC-MS is generally used for the analysis of process intermediates or
final protein products when the presence of salts or other matrix components are not MS

Page 203 of 235
compatible. The analysis of cell culture supernatant may require an additional “capture”
step (eg. Affinity chromatography) to isolate the protein of interest from the spent cell
culture media which contains a variety of feed components, host cell proteins, and cell
debris (Battersby, et al 2001).
A general overview of an MS method for the analysis of intact and enzymatically
digested recombinant proteins is depicted in Figure 6.2.4. This basic approach is widely
used in proteomics application and biotechnology development and can provide
verification of amino acid sequence, identification of post-translational modifications
(PTMs), and degradation products, elucidation of glycoprotein oligosaccharide profiles
and mapping of disulphide linkages for recombinant proteins of varying size (Nemeth-
Cawley, et al 2003).
Figure 6.2.4 General approach for MS characterization of recombinant therapeutic proteins.
6.2.4.1. Analysis of Intact Proteins (“Top-Down” Approach)
The advantage afforded by MS analysis of intact proteins include: complete sequence
coverage, assessment of overall protein heterogeneity, identification of labile post
translational modifications (PTMs), and confirmation of N- and C-terminal sequences
(e.g., N-terminal signal peptides). The approach also involves limited sample handling
which may result in protein modifications that may not be related to the manufacturing
process (e.g., Asn deamidation, carbomylation, Met/Try oxidation) [Barnes and Lim
2007].
Protein Intact Mass
Denaturation, Reduction, Alkylation
Enzymatic Digestion
MALDI MS LC - MS
MALDI MS/MS LC - MS/MS
Top-down
Approac
Bottom-up
Approac

Page 204 of 235
Anti-EGFR mAb, Cetuximab has two consensus glycosylation sites at Asn299 and Asn88
on the Heavy chain. To interpret the complicated glycosylation pattern at the intact mass
level would be an arduous task since two completely different glycans may have
overlapping masses. We therefore attempted to reduce the mass of the antibody (IgG1)
by cleaving the molecule with enzymes that can cleave the solvent exposed hinge region
resulting in Fab and Fc fragments. This reduction in complexity would aid the individual
analysis of the glycosylation sites. These fragments can be generated by papain, pepsin
or a limited digestion with LysC. All of them have characteristic cleavage sites in the
hinge region whose activity yields Fab (fragment antigen binding) and Fc (Fragment
crystallizable) fragments. Papain makes a nick above the hinge region disulphides which
is the case with LysC too. This reaction produces two individual Fab fragments
composed of the light and the VH and CH1 domains of the heavy that are linked by a
single disulphide. The other complementary fragment that is produced is the single Fc
fragment which is composed of the heavy chains below the hinge region linked by 2
disulphides (CH2 and CH3 domains) with their respective glycans. The hinge region
contains either two (IgG1 and IgG4) or four (IgG2) disulfide linkages between closely
spaced Cys residues on the antibody heavy chains which are essential for formation of
the antibody heterodimer (Burton 1985). This fragmentation enables the study of the
modifications that pertain to the Fc and Fab areas individually without actually opting for
the more endearing peptide mapping.
Figure 6.2.5 Deconvoluted spectra of Fc fragment after LysC digestion and reduction for
molecular mass estimation.
RMP
Test

Page 205 of 235
The comparative profile is depicted for RMPand expressed mAb. The upper panel is for the RMP while
the lower panel is for Test sample.
As shown in Figure 6.2.5, the main peak/species present is of MW 26654.07 daltons
present in both RMP and test sample which corresponds to Fc fragment. The difference
of 1.19 Da is due to the system variation. The other minor peaks may be due to various
possible modifications as listed previously (e.g. deamidation, oxidation, etc.).
Similarly, the main peaks present in the Fab fragments obtained after Lys-C digestion
and reduction are shown in the deconvulated spectra in Figure 6.2.6:.
Figure 6.2.6 Deconvoluted spectra of Fab fragment after LysC digestion for molecular mass
estimation.
The comparative profile of RMP and expressed mAb is shown. The upper panel is for the RMP while the
lower panel is for the Test sample.
The expressed mAb (Cetuximab) was characterized by using the top down approach by
LC-MS wherein sample integrity is preserved, avoiding chemical modifications intrinsic
to proteolytic digestion. This high throughput method would indicate the intact mass of
the RMP and expressed mAb sample for comparability and would indicate the impurities
present. Intact mass analysis by LC-MS was performed on Waters SYNAPT mass
spectrometer configured with the standard ESI source and in the positive ion mode.
RMP
Test

Page 206 of 235
Intact mass analysis of the recombinant and RMP LC and HC after reduction revealed
the following masses (in Daltons):
Table 6.2.3 Determined mass of Fc and Fab fragment.
By employing the top-down approach the mass of Fc and Fab was confirmed and
matched with the RMP to establish the identity of the expressed mAb.
6.2.4.3.Analysis of Glycan (“Bottom-up” Approach)
Analysis of the component peptides from enzymatic digestion of recombinant proteins
can be used to locate PTMs, amino acid degradation product, glycosylation sites, and
disulfide linkages within specific regions of the protein sequence. This approach is used
commonly in biotechnology development as a fingerprint for identity testing, for process
monitoring, and to demonstrate product comparability following manufacturing changes
(Barnes and Lim, 2007).
The ‘bottom-up” or peptide mapping approach is outlined in Figure 6.2.4 and generally
involves denaturation, reduction, and alkylation of Cys residues prior to enzymatic
digestion of the protein. The most common enzymes used for digestion are trypsin and
endoproteinases Lys-C, Asp-N, and Glu-C. The resulting peptide mixture is then
analyzed using MALDI MS or ESI MS with online liquid chromatographic separation of
the digested peptides (LC-MS). To study the Fc and Fab glycosylation, the RMP and
the expressed mAb, after Protein-purification, were partially digested with
endoproteinase Lys-C to achieve a nick at the hinge region to generate two fragments
Fab and Fc. The Lys-C digested fragments were reduced with DTT to simplify the
complexity of the spectrum in LC-MS since both the heavy chains are glycosylated and
there are two sites of glycosylation per heavy chain. The reduced Lys-C product was
resolved to get Fab and Fc fragment on the CEX C8 Zorbax column (Figure 6.2.7) and
Observed Molecular Mass (Da)
Fragment RMPs Expressed mAb Difference (Da)
Fc 26652.14 26653.33 1.19
Fab
49503.43 49506.82 3.39
49551.84 49556.86 5.02

Page 207 of 235
the eluting species were detected with ESI-tof. The raw spectrum was deconvoluted by
standard parameters.
Figure 6.2.7 CEX-HPLC profile of RMP and expressed mAb digested with Lys-C and reduced
The pink profile is of the intact RMP while red is intact expressed mAb. The Lys-C reduced profile for
RMP and expressed mAb is represented as green and blue, respectively.
The Fab and Fc reduced was then analyzed by ESI-tof LC-MS/MS.
Fab
Fc
RMP-Intact RMP –LysC digested Sample – Intact Sample – Lys-C

Page 208 of 235
Figure 6.2.8 Deconvoluted spectra of Fc fragment to determine the Glycan forms.
A) Profile of RMP and B) Expressed mAb (clone #D41E213). The peak labels refer to the various
glycoforms identified based on the deconvoluted mass. For deconvolution, m/z range from 26000 to
28000 Da was used.
As shown in Figure 6.2.8:, the G0F, G0F/K1 and G1F forms are present in both RMP
and expressed mAb. The percentage of each forms are depicted in Table 6.2.4:
Glycan % RMP Clone # D41E213
Man5 12.70 0.00
G0F-GlcNac 3.18 12.81
G0F 53.77 80.07
G1F 26.83 7.12
G2F 3.52 0.00
Table 6.2.4 Percentage composition of glycan present on the heavy chain region of Fc domain.
A
B

Page 209 of 235
The percentage of G0 and G0F are important and indicative of the glycosylation property
of the host system. The other forms are not matching with the RMP because of the fact
that the expression is in different host systems (CHO) and not in SP2/0. The G1 and G2
forms which are less than RMP can be improved during the fine tuning upstream process
development at the bioreactor level. In this study the objective was to get the expressed
mAb with as many forms as possible especially G0 and G1. .
Figure 6.2.9 Deconvoluted spectra of Fab fragment to determine the Glycan forms.
A) Profile of RMP and B) Expressed mAb (clone #D41E213). The peak labels refer to the various
glycoforms identified based on the deconvoluted mass. For deconvolution, m/z range from 47000 to
51000 Da was used.
As shown in 0, the G0F, G0F-GlcNac forms are present in both RMP and expressed
mAb. The forms such as G1F, G2F, G2F+Gal, G2F+2Gal, and G3F+NGNA are not
present in the expressed mAb. These forms are not preferred forms as they induces
anaphylactic reactions and IgE- specific for Galactose -1,3-galactose response in
humans (Platts-Mills, et al 2008).

Page 210 of 235
The percentage content of each forms are depicted in Table
Glycan % RMP Clone
#D41E213
G0F-GlcNac 0.00 42.17
G0F 0.00 57.83
G1F 4.36 0.00
G2F 7.23 0.00
G2F+Gal 6.54 0.00
G2F+2Gal 56.34 0.00
G3F+NGNA 25.53 0.00
Table 6.2.5 Percentage composition of glycan present on the heavy chain region of Fab domain.
6.3. Conclusion
The recombinant mAb expressed (Cetuximab) by the lead clone #D41E213 was
characterized to a greater extent using SEC-HPLC, N-terminal sequencing, CEX for
charge variants and Mass Spectrometry for the final mass determination and glycan
composition. The selected clone does not generate high levels of aggregates and
clips/degradants which are not desirable to develop a simplified protein purification
process. The heterogeneity in the expressed product is less compared to the RMP which
will ensure better batch-to-batch consistency when the process is scaled-up to larger
volumes. The detailed analysis of protein mass and glycans was done using ESI LC-
MS/MS which revealed that the non-preferred forms of glycans (e.g. G2F, G3F,
G3+NGNA, etc.) in Fab region are not present in the recombinant biosimilar mAb
expressed in an alternate host (CHO), thereby indicating that the resulting biosimilar
product from Clone #D41E213 would be less immunogenic. Also, the required forms in
the Fc region are present (e.g. G0 and G1) which dictates the effector function of the
mAb in-vivo, the levels of which can be tweaked around to make it comparable to RMP
through upstream process development at bioreactor level.
Hence the recombinant CHO cell line expressing recombinant biosimilar anti-EGFR
mAb (Cetuximab) do not produce any unwanted isoforms or glycan structures. Detailed
comparison need to be established once the process is scaled-up in large bioreactors for
the manufacture of the commercial product.

Page 211 of 235
The quality of the product matches with the RMP to a considerable extent, not similar.
This is understandable given that the biosimilar is expressed in an alternate host (SP2/0
CHO) using different upstream process. However, the desirable forms (which
determine the Product Quality Attributes) are all present while the undesirable forms
(such as K1, K2 [CEX profile], G2, G2F-Gal, G2-Gal and G2-NGNA) are not found (or
in very little proportion) in the CHO expressed product than the RMP. This makes CHO
a better platform for production of recombinant biosimilar anti-EGFR mAb (Cetuximab).
The functional significance of Fab glycosylation has not been fully evaluated but, it
could have a neutral, positive or negative influence on antigen binding (Jefferis 2009).
This molecule could be approved as biosimilar as the Fab glycosylation seen in molecule
expressed in CHO do not have NGNA forms thereby have possibility of reduced anti-IgE
response.

CHAPTER 7
SUMMARY

Page 213 of 235
For the marketed version of anti-EGFR antibody, Cetuximab (Erbitux®), the production
platform used by the originator company is myeloma cells, SP2/0. Typically a
monoclonal antibody (mAb) molecule possess N-linked glycosylation site at Asn287 (Fc
region) but Cetuximab possess a site Asn299 (Fc site) and also at Asn88 (Fab site). The
complexity of this mAb is evident by the presence of 21 different glycoforms with
around 30% capped by at least one -1, 3-galactose residues, 12% capped by a NGNA
residues and traces of oligomannose. It was reported by Platt-Mills et al in 2008, that the
NGNA form in the Fc glycosylation site induces anaphylaxis and elicit IgE response in
the humans. Hence the scope of this work was to clone, express and produce
recombinant biosimilar Cetuximab in alternate host system, CHO cells which are known
as not to produce NGNA forms. The regulatory perspective on manufacturing of
biosimilar molecules is that changing a host system is allowed provided that the Product
Quality Attributes especially the post-translation modifications, which are crucial for
optimal biological activity, remains comparable with the Reference Medicinal Product
(RMP) and should be safe for human use.
In pursuit of establishing a stable high expressing cell line for anti-EGFR antibody
various vector constructs were designed with dual promoter system and selection marker
were evaluated. The dual promoter system facilitated expression of light chain and heavy
chain of antibody (IgG) at similar molar concentration. The vector backbone used was of
pcDNA3.1 which is commercially available from Invitrogen, USA.
Various modes of transfections like lipofection, electroporation and nucleofection were
evaluated to generate high expressing cell line. The expression of target mAb in SP2/0
cells was observed to be unstable and it weathered after few days post transfection. On
the other hand, when the transfection was done in CHO cells the expression post
transfection observed was high and stable during the in-vitro culture. Due to instability
of SP2/0 cells and the advantages of using CHO cells for expression of recombinant
mAb, the rCHO was selected for the further experimentation.
After transfection the clonal population was generated using manual limiting dilution and
automated clone selection method (ClonePix FL®). Three top clones based on the
productivity and cell growth analysis scored highest amongst hundreds of clones and two
methods of selection were selected further as D41E213, D41C140 and D41D116. The
clone stability, expression analysis and determination of Product Quality Attributes

Page 214 of 235
conferred that clone D41E213 was the lead clone. The analytical techniques such as
Western Blot, Iso Electric Focusing, SDS-PAGE, Protein-A HPLC, Cation Exchange
Chromatography, RP-HPLC and in-vitro bioassay were used for determining the PQAs
and identifying the lead clone. These methods gave considerable information at an early
stage and are considered as platform methods to be used at clone selection stage for all
mAb products in general.
The selection of cell cultivation media was important for the sustained and higher growth
of the cells and to support the expression of recombinant protein. Upstream process
development for screening basal media and feed supplements were carried out, whereby
18 different basal media and 18 different feed supplements (commercially available)
were tried to increase the titer. A significant increase of 2.5 fold in product titer (~390
mg/L) was observed when basal media CDM4PerMab (Hyclone) and CHO Efficient
Feed A: CHO Efficient Feed B = 50:50 (Invitrogen) mixture was used.
The recombinant mAb expressed (Cetuximab) by the lead clone # D41E213 was further
characterized to a greater extent using SEC-HPLC, N-terminal sequencing, CEX for
charge variants and Mass Spectrometry for the final mass determination and glycan
composition. The selected clone did not generate high levels of aggregates and
clips/degradants which were not desirable to develop a simplified protein purification
process. The heterogeneity in the expressed product was less compared to the RMP
which ensured better batch-to-batch consistency when the process was scaled-up to
larger volumes. The detailed analysis of protein mass and glycans was done using ESI
LC-MS/MS which revealed that the non-preferred forms of glycans (e.g. G2F, G3F,
G3+NGNA, etc.) in Fab region were not present in the recombinant biosimilar mAb
expressed in an alternate host (CHO), thereby indicating that the resulting biosimilar
product from Clone #D41E213 was less immunogenic. Also, the required forms in the
Fc region are present (e.g. G0 and G1) which dictates the effector function of the mAb
in-vivo, the levels of which can be tweaked around to make it comparable to RMP
through upstream process development at bioreactor level.
Hence the recombinant CHO cell line expressing recombinant biosimilar anti-EGFR
mAb (Cetuximab) did not produce any unwanted isoforms or glycan structures. Detailed
comparison should be established once the process is scaled-up in large bioreactors for
the manufacturing of the commercial product.

Page 215 of 235
The quality of the product matched with the RMP to a considerable extent, not similar.
This is understandable given that the product was expressed in an alternate host (SP2/0
CHO) using different upstream process. However, the desirable forms (which
determine the Product Quality Attributes) were all present while the undesirable forms
(such as K1, K2 [CEX profile], G2, G2F-Gal, G2-Gal and G2-NGNA) were not found
(or in very little proportion) in the CHO expressed product than the RMP. This makes
CHO a better platform for production of recombinant biosimilar anti-EGFR mAb
(Cetuximab). The functional significance of Fab glycosylation has not been fully
evaluated but, it could have a neutral, positive or negative influence on antigen binding
(Jefferis 2009). This molecule could be approved as biosimilar as the Fab glycosylation
seen in molecule expressed in CHO do not have NGNA forms thereby have possibility
of reduced anti-IgE response.

CHAPTER 8
BIBLIOGRAPHY

Page 217 of 235
1. Aaronson S.A. (1991), Growth factors and cancer. Science 254:1146–1153.
2. Abbruzzese J.L., Xiong H. Q., Rosenberg A., LoBuglio A., Schmidt W., Wolff
R.A., Deutsch J., NeedleM. (2004), Cetuximab, A monoclonal antibody targeting
the epidermal growth factor receptor, in Combination with gemcitabine for
advanced pancreatic cancer: A multicenter phase II trial. J Clin Oncology 22(13):
2610-2616.
3. Adair G.M., Carver J.H. (1979), Unstable, non-mutational expression of resistance
to the thymidine analogue, trifluoirothymidine in CHO cells. Mutat Res 60(2); 207-
213.
4. Ahmad R., Sindhu S.T., Toma E., Morisset R., Vincelette J., Menezes J., Ahmad
A. (2001), Evidence for a correlation between antibody dependent cellular
cytotoxicity-mediating anti-HIV-1 antibodies and prognostic predictors of HIV
infection. J Clin Immunol 21(3):227-33.
5. Alroy J., Yarden Y. (1997), The ErbB signaling network in embryoigensis and
oncegenesis: signaling diversification through combinatorial ligand-receptor
interactions. FEBS Letters 410: 83-86.
6. Angal S., King D.J., Bodmer M.W., Turner A., Lawson A.D., Rober G., Pedley B.,
Adair J.R. (1993), A single amino acid substitution abolishes the heterogeneity of
chimeric mouse/human (IgG4) antibody. Mol Immunol 30:105-108.
7. Andya J.D., Hsu C.C., Shire S.J. (2003), Mechanism of aggregate formation and
carbohydrate excipient stabilization of lyophilized humanized monoclonal antibody
formulation. AAPS PharmSci 5(2): E10:1-11
8. Antes B., AmonS., Rizzi A, Wiederkum S., Kainer M., Szolar O., Fido M.,
Kircheis R., Nechansky A. (2007), Analysis of lysine clipping of a humanized
Lewis-Y specific IgG antibody and its relation to Fc-mediated effector function. J
Chromatography B 852(1-2) :250-256.
9. Arteaga C.L. (2002), Epidermal growth factor receptor dependence in human
tumors: more than just expression? Oncologist 7 (Suppl. 4): 31–39.
10. Barnes D., Sato G. (1980), Methods for growth of cultured cells in serum-free
medium. Anal Biochem 102:255-270.
11. Barnes L., Bentley C., Dickson A. (2000), Advances in animal cell recombinant
protein production: GS-NS0 expression system. Cytotechnology 32: 43-46.
12. Barnes L., Bentley C., Dixon A. (2001), Characterization of the stability of
recombinant protein production in the GS-NS0 expression system. Biotechnol
Bioeng 73(4): 26-270.

Page 218 of 235
13. Barnes L., Bentley C., Dixon A. (2003), Stability of protein production from
recombinant mammalian cells. Biotechnol Bioeng 81; 631-639.
14. Barnes L., Bentley C., Dixon A. (2004), Molecular definition of predictive
indicators of sable protein expression in recombinant MS0 myeloma cells.
Biotechnol Bioeng 85(2); 115-121.
15. Barnes L., Bentley C., Dixon A. (2006), Phenotypic variations during cloning
procedures: analysis of the growth behavior of clonal lines. Biotechnol Bioeng
94(3): 530-57.
16. Battersby J.E., Hancock W.S., Canova-Davis E., Oeswein J., O’onnor B. (1994),
Diketopiperazine formation and N-terminal degradation in recombinant human
growth hormone. Intl J Peptide and Protein Res 44(3): 215-222.
17. Battersby J.E., Snedecor B., Christina C., Champion K.M., Riddle L., Vanderlaan
M. (2001), Affinity reverse phase liquid chromatography assay to quantitate
recombinant antibodies and antibody fragment in fermentation broth. J
Chromatography A 927:61-76.
18. Bebbington C., Renner G., Thomson S., King D., Abrams D., Yarranton G.
(1992), High-level expression of a recombinant antibody from myeloma cells using
a glutamine synthase gene as an amplifiable selectable marker. Biotechnology 10:
169-175.
19. Beck A., Rousset E. W., Bussat M. C., Lokteff M., Hamour C. K., Haeuw J. F.,
Goetsch L., Wurch T., Dorsselaer A. V., Corvaia N. (2008), Trends in
glycosylation, glycoanalysis and glycoengineering of therapeutic antibodies and
Fc-fusion proteins Curr Pharma Biotechnol 9: 482-501.
20. Berthold W. (1993), Gene stability in mammalian cell and protein consistency.
Biologicals 21: 95-100.
21. Bleck G.T. (2010), GPEx® A flexible method for the rapid generation of stable,
high expressing, antibody producing mammalian cell lines. In Current trends in
Monoclonal antibody development and manufacturing, eds., Shire S.J., Gombotz
W., Peters K.B., Andya J, Springer –Americal Association of Pharmaceuticals
Scientists: 60.
22. Bohm E., Voglauer R., Steinfellner W., Kuner R., Broth N., Katinger H. (2004),
Screening for improved cell performance; selection of subclones with altered
production kinetics or improved stability by cell sorting. Biotechnol Bioeng 88(6):
699-705.

Page 219 of 235
23. Brody T. (1997), Multistep denaturation and hierarchy of disulphide bonds on
nascent immunoglobulin polypeptides. Anal Biochem 247:247-256.
24. Borth N., Zeyda M., Katinger H. (2001), Efficient selection of high-producing
subclones during gene amplification of recombinant Chinese hamster ovary cells
by Flow Cytometry and cell sorting. Biotechnology and Bioengineering 71(4): 266-
273.
25. Browne S., Al-Rubeai M. (2007), Selection methods for high-producing
mammalian cell lines. Trends in Biotechnol 25(9): 425-432.
26. Burke J., Mann C. (2006), Rapid isolation of monoclonal antibody producing cell
lines. BioProcess Intl. 48-51.
27. Burton D.R. (1985), Immunoglobulin G: Functional sites. Mol Immunol 22: 161 -
206.
28. Butler M. (2005), Animal Cell cultures: recent achievements and perspectives in
the production of biopharmaceuticals. App Microbiol Biotechnol 68: 283-291.
29. Caroll S., Al-Rubeai M. (2004), The selection of high-producing cell lines using
flow cytometry and cell sorting. Expert Opin Biol Ther 4(11): 1821-1896.
30. Carpenter G. (2000), The EGF receptor: a nexus for trafficking and signaling.
BioEssays 22: 697-707.
31. Carpenter G., Cohen S. (1990), Epidermal Growth Factor. J Biol Chem 25: 7709-
7712.
32. Carter P. (2001), Imrpoving efficacy of antibody-based cancer therapies. Nature
Rev Cancer 1: 118-129.
33. Casadevall A., Dadachova E., Pirofski L-A. (2004), Passive antibody therapy for
infectious disease. Nat Rev Microbiol 2: 695-703.
34. Chan V.L., Whitemore G.F., Siminovitch L. (1972), Mammalian cells with altered
forms of RNA polymerase II. Proc Nat Acad Sci 69(11): 3119-3123.
35. Chi E.Y., Krishnan S., Randolph T.W., Carpenter J.F. (2003) Physical stability of
proteins in aqueous solution: mechanism and driving forces in non-native protein
aggregation. Pharm Res 20:1325-1336.
36. Chasin L.A., Urlaub G. (1975), Chromosome-wide event accompanies the
expression of recessive mutations in tetraploid cells. Science 187(4181): 1091-
1093.
37. Chu L., Chartrain M. (2008), Development and production of commercial
therapeutic monoclonal antibodies in mammalian cell expression systems: An
overview of the current upstream technologies. Curr Pharm Biotechnol 9: 447-467.

Page 220 of 235
38. Ciardiello F., Tortora G. (2001), A novel approach in the treatment of cancer:
targeting the epidermal growth factor receptor. Clin Cancer Res 7:2958-2970.
39. Ciardiello F., DeVita F., Orditura M., Comunale D., Galizia G. (2005), Cetuximab
in the treatment of colorectal cancer. Future Oncol 1: 173-181.
40. Clarke S., Grieger T. (1987), Deamidation, isomerization and racemization at
asparaginyl and aspartyl residues in peptides. J Biol Chem 262(2): 785-794.
41. Clynes R.A., Towers T.L., Presta L.G., Ravetch J.V. (2000), Inhibitory Fc
receptors modulate in vivo cytoxicity against tumor targets. Nature Medicine 6(4):
443-446.
42. Cohen R.B. (2003), Epidermal growth factor receptor as a therapeutic target in
colorectal cancer. Clinical Colorectal Cancer 2: 246-251.
43. Conley B. (2006), Treatment of advanced head and neck cancer: What lessons
have we learned? J Clin Oncol 24: 1023-1025.
44. Coxx M.M., Hollister J.R. (2009), Flublok, a next generation influenza vaccine
manufactured in insect cells. Biologics 37: 182-189.
45. Crammer S., van Ormondt J., van der Eb H., Valerio J., Hoeben D. (1998), New
helper cells and matched early region 1-deleted adenovirus vectors prevent
generation of replication competent adenoviruses. Hum Gene Ther 19: 163-168.
46. Crommelin D.J.A., Storm G., Verrijk R., Leede L., Jiskoot W., Hennik W.E.
(2003), Shifting paradigms: biopharmaceuticals versus low molecular weight
drugs. Intl J Pharmaceut 266: 3-16.
47. Crommelin D.J.A., Bermejo T., Bissig M., Daminaas J., Kromer I., Rambourg P.,
Scorccaro G., Strukelj B., Tredree R. (2005), Pharmaceutical evaluation of
biosimilars: important differences from generic low-molecular-weight
pharmaceutics. Eur J Hosp Pharm Sci 11: 11-17.
48. Cromwell M.E., Hilario E., Jacobson F. (2006), Protein Aggregation and
Bioprocessing. AAPS Journal 8(3): E572-E579.
49. D'Anna, J.A., H.A. Crissman, J.G. Valdez, L.R. Gurley, and R.A. Tobey. (1996),
Synchronization of Mammalian Cells in S Phase by Sequential Use of Isoleucine-
Deprivation G1-or Serum-Withdrawal G0-Arrest and Aphidicolin Block. Methods
in Cell Science 18:115-125.
50. Deaven L.L., Petersen D.F. (1973), The chromosomes of CHO, an aneuploid
Chinese hamster cell line: G-band, C-band, and autoradiographic analysis.
Chromosoma (Berl.) 41: 129-144.

Page 221 of 235
51. De Groot A.S., Martin W. (2009), Reducing risk, improving outcomes:
Bioengineering less immunogenic protein therapeutics. Clinical Immunology
131(2): 189-201.
52. DeMaria C., Cairns V., Schwartz C., Zhang J., Guering M., Zuena E., Estes S.,
Karey K. (2007), Accelerated clone selection for recombinant CHO cells using
FACS-based high-throughput screen. Biotechnol Prog 23: 465-472
53. Dillon T.M., Bondarenko P.V., Rehder D.S., Pipes G.D., Kleemann G.R., Ricci
M.S. (2006), Optimization of a reversed-phase high performance liquid
chromatography/mass spectrometry method for characterizing recombinant
antibody heterogeneity and stability. J Chromatography A 1120:112-120.
54. Durocher Y., Pham P.L., St-Laurent G., Jacob D., Cass B., Chahal P., Lau C.J.,
Nalbantoglu J., Kamen A. (2007), Scalable serum-free production of recombinant
adeno-associated virus type 2 by transfection of 293 suspension cells. J Virological
Methods 144: 32–40.
55. Dwek R.A., Lellouch A. C. Wormald M. R. (1995), Glycobiology: ‘The function
of sugar in the IgG molecule. J Anat 187: 279-292.
56. Earp H.S. III, Calvo B.F., Sartor C.I. (2003), The EGF receptor family – multiple
roles in proliferation, differentiation, and neoplasia with an emphasis on HER4.
Transactions of the American Clinical and Climatological Association 114: 315–
333.
57. Edman P. (1950), Method for determination of the amino acid sequence in
peptides. Acta Chemica Scandinavica 4: 283-293.
58. Ehrlich H.J., Jaskunas S.R., Grinnell B.W., Yan S.B., Bang N.U. (1989), Direct
expression of recombinant activated protein C, a serine protease. J Biol Chem
264(24): 14298-14304.
59. Enger M.D., Tobey R.A. (1972), Effects of isoleucine deficiency on nucleic acid
and protein metabolism in cultured Chinese hamster cells. Continued ribonucleic
acid and protein synthesis in the absence of deoxyribonucleic acid synthesis.
Biochemistry 11: 269-277.
60. Flynn G.C., Goetze A.M., Schenauer M.R. (2010), Assessing monoclonal antibody
product quality attributes criticality through clinical studies. mAbs 2(5): 500-507.
61. Gadgil H.S., Bondarenko P.V., Pipes G.D., Dillon T.M., Banks D., Abel J.,
Kleemann G.R., Treuheit M.J. (2006), Identification of cysteinylation of a free
cysteine in the Fab region of a recombinant monoclonal IgG1 antibody using Lys-C
limited proteolysis coupled with LC/MS analysis. Anal Biochem 355(2): 165-174.

Page 222 of 235
62. Galili U. (2004), Immune response, accommodation, and tolerance to
transplantation carbohydrate antigens. Transplantation 78: 1093–1098.
63. Gaza-Bulseco G., Bulseco A., Chumsae C., Liu H. (2008), Characterization of the
glycosylation state of a recombinant monoclonal antibody using weak cation
exchange chromatography and mass spectrometry. J Chromatography B 862(1-2):
155-160.
64. Ghaderi D., Taylor R.E., Padler-Karavani V., Diaz S., Varki A. (2010),
Implications of presence of N-glycolylneuraminic acid in recombinant therapeutic
glycoproteins. Nature Biotechnology 28(8): 863-867
65. Giulivi C., Davies K.J.A. (1994), Dityrosine: a marker for oxidatively modified
proteins and selective proteolysis. In Methods in Enzymology Eds., Packer L.. New
York, NY: Academic Press Vol 233:363-371.
66. Goldfarb P.S., Carritt B., Hooper M.L., Slack C. (1977), The isolation and
characterization of asparagine-requiring mutants of Chinese hamster cells. Exp Cell
Res 104(2): 357-67.
67. Goldsmith D., Kuhlmann M., Covic A. (2007), Through the looking glass: the
protein science of biosimilars. Clin Exp Nephrol 11: 191-195.
68. Goodwin E.C., Rotman, F.M. (1992), The 3’-flanking sequence of the bovine
growth hormone gene contains novel elements required for efficient and accurate
polyadenylation. J Biol Chem 267:16330-16334.
69. Gorfien S., Paul B., Walowitz J., Keem R., Biddle W., James D. (2000), Growth of
NS0 cells in protein free, chemically defined medium. Biotechnol Prog 16: 682-
687.
70. Gorman C.M., Gies C., McCray C., Huang M. (1989), The human major cytom -
egalorvirus major immediate early promoter can be trans-activated by adenovirus
early proteins. Virology 171(2): 377-385.
71. Graham F.L., Addison C.L., Hitt M., Kunsken D. (1997), Comparison of human
versus murine cytomegalorvirus immediate early gene promoters for transgene
expression by adenoviral vectors. J Gen Virology 78: 1653-1661.
72. Grant S., Qiao L., Dent P. (2002), Roles of ERBB family receptor tyrosine
kinases, and downstream signaling pathways, in the control of cell growth and
survival. Frontiers in Biosceince 7: d376-d389.
73. Grunwald V., Hidalgo M. (2003), Developing inhibitors of the epidermal growth
factor receptor for cancer treatment. J National Cancer Institute 95: 851–867.

Page 223 of 235
74. Gurley L.R., Hardin J.M. (1968), The metabolism of histone fractions: Synthesis
of histone fractions during the lifecycle of mammalian cells. Arc Biochem Biophys
28: 285-292.
75. Ham R.G., McKeehan W. (1975), Media and growth requirements. In Methods in
Enzymology, Eds. Jakoby, W.B. and Pastan I.H., Academic Press, New York Vol.
58: 44-93.
76. Hamilton R.G., Roebber M., Reimer C.B., Rodkey L.S. (1987), Quality control of
murine monoclonal antibodies using isoelectric focusing affinity immunoblot
analysis, Hybridoma 6: 206.
77. Hanania E., Fieck A., Stevens J., Bodzin L., Palsson B., Koller M. (2005),
Automated in-situ measurement of rapid cloning of high-secreting producers.
Biotechnol Bioeng 91(7): 872-876.
78. Hansel T.T., Kropshofer H., Singer T., Mitchell J.A., George A.J.T. (2010), The
safety and side effects of monoclonal antibodies. Nat Rev Drug Discovery 9: 325-
338
79. Harari P.M., Huang S-M. (2001), Radiation response modification following
molecular inhibition of epidermal growth factor receptor signaling. Seminars in
Radiation Oncology 11(4): 281-289.
80. Harari P.M., Huang S-M., Herbst R., Quon H. (2003), Molecular targeting of the
epidermal growth factor receptor in head and neck cancer. In Head and Neck
cancer: a multidisciplinary Approach, Eds. Harrison E.B., Sessions R.B., Hong
W.K. Philadephia PA, USA. Lippincott, Williams and Wilkins: 1001-1016.
81. Harris R.J. (1995), Processing of C-terminal lysine and arginine residues of
proteins isolated from mammalian cell culture. J Chromatography A 705:129-134.
82. Hartman T., Sar N., Genereux K., Barrit D., He Y., Burky J., Wesson M., Yun-
Tso J., Tsurushita N., Xhou W., Sauer P. (2007), Derivation and characterization of
cholesterol-independent non-GS NS0 cell lines for production of recombinant
antibodies. Biotechnol Bioeng 96(2): 294-306.
83. Harvey D.J., Merry A.H., Royle L., Campbell M.P., Dwek R.A., Rudd P.M.
(2009), Proposal for a standard system for drawing structural diagrams of N- and
O-linked carbohydrates and related compounds. Proteomics 9(15): 3796–3801.
84. Hayes S. (2010), Optimising transfection performance. Innovations in
Pharmaceutical Technology 34, 74-76.
85. Henry C. (1996), FDA reform, and the well-characterized biologic. Anal Chem 68:
674A-677A.

Page 224 of 235
86. Herbst R.S. (2002), Targeted therapy in non-small-cell lung cancer. Oncology 16:
19–24.
87. Hermeling S., Crommelin D.J., Schellekens H., Jiskoot W. (2004), Structure-
immunogenicity relationships of therapeutic proteins. Pharm Res 21(6):897-903.
88. Hunt G., Nashabeh W. (1999), Capillary electrophoresis sodium dodecyl sulfate
nongel sieving analysis of a therapeutic recombinant monoclonal antibody: a
biotechnology perspective. Anal Chem 71:2390-2397.
89. Jayapal K.P., Wlaschin K.F., Yap M.G.S., Hu W.S. (2007), Recombinant protein
therapeutics from CHO cells — 20 years and counting. Chem Eng Prog 103 (10):
40–47.
90. Jangbauer A., Josic D., Iberer G., Buchacher A., Ahrer A. (2003), Analysis of
aggregates of human immunoglobin G using size exclusion chromatography, static
and dynamic light scattering. J Chromat A 1009:89-96.
91. Jefferies R., Lund J., Mizutani H., Nakagawa H., Kawazoe Y., Arata Y.,
Takahashi N. (1990), A comparative study of the N-linked oligosaccharide
structures of human IgG subclass proteins. Biochem J 268:529–537.
92. Jefferis R., Lund J. (1997), Glycosylation of antibody molecules: Structural and
functional significance. Chem Immunol 65:111– 128.
93. Jeffereis R. (2005), Glycosylation of recombinant antibody therapeutics.
Biotechnol Prog 21: 11-16.
94. Jefferis R. (2009), Antibody glycosylation. In Post translational modifications of
protein biopharmaceuticals. Ed Gary Walsh, Wiley-Blackwell, Weinheim; 79-100.
95. Jian X-R., Song A., Bergelson S., Arroll T., Parekh B., Kimberly M., Chung S.,
Strouse R., Mire-Sluis A., Schenerman M. (2011), Advances in the assessment and
control of the effector functions of therapeutic antibodies. Nat Rev Drug Discovery
10(2): 101-110.
96. Jones D., Kroos N., Anema R., van Montford B., Vooys A., can der Kraats S., van
der Helm E., Smiths S., Schouten J., Brouwer K., Lagerwerf F., van Berkel O.,
Opstelten D-J., Logtenberg T., Bout A. (2003), High-level expression of
recombinant IgG in the human cell line PER C6. Biotechnol Prog 19: 163-168.
97. Kaltenbrunner O., Tauer C., Brunner J., Jungbauer A. (1993), Isoprotein analysis
by ion exchange chromatography using a linear pH gradient combined with a salt
gradient. J Chromatrography A 639: 41-49.
98. Kamoda S., Ishikawa R., Kakehi K. (2006), Capillary electrophoresis with laser-
induced fluorescence detection for detailed studies on N-linked oligosaccharide

Page 225 of 235
profile of therapeutic recombinant monoclonal antibodies. J of Chromatography A
1133: 332-339.
99. Kao F., Puck T. (1967), Genetics of somatic mammalian cells. IV. Properties of
Chinese hamster cell mutants with respect to the requirement for proline. Genetics
55: 513-524.
100. Kao F., Puck T. (1968), Genetics of somatic mammalian cells, VII. Induction and
isolation of nutritional mutants in Chinese hamster cells. Proc Natl Acad Sci USA
60: 1275-1281.
101. Kao F., Puck T. (1969), Genetics of somatic mammalian cells. IX. Quantitation of
mutagenesis by physical and chemical agents. J Cell Physiol 74: 245-257.
102. Kao F., Puck T. (1970), Genetics of somatic mammalian cells: Linkage studies
with human-Chinese hamster cell hybrids. Nature (Lond.) 228: 329-332.
103. Kaufman R., Wasley L., Spiliotes A., Gossels S., Latt S., Larsen G., Kay R.
(1985), Co-amplification and co-expression of human tissue-type plasminogen
activator and murine dihydrofolate reductase sequences in Chinese hamster ovary
cells. Mol Cell Biol 5(7): 1750-1759.
104. Kaufman R., Sharp P. (1982), Amplification and expression of sequences
cotransfected with a modular dihydrofolate reductase complementary DNA gene. J
Mol Biol 159:601-621.
105. Kohler G., Milstein C. (1975), Continuous culture of fused cells secreting antibody
of predefined specificity. Nature 256: 495-497.
106. Kohler G., Milstein C. (1976), Derivation of specific antibody producing tissue
culture and tumor cell lines by cell fusion. Eur J Immunol 6: 511-519.
107. Kohler G., Howe S., Milstein C. (1976), Fusion between immunoglobin-secreting
and non-secreting myeloma cell lines. Eur J Immunol 6: 292-295.
108. Kamoda S., Ishikawa R., Kakehi K. (2006), Capillary electrophoresis with laser-
induced fluorescence detection for detailed studies on N-linked oligosaccharide
profile of therapeutic recombinant monoclonal antibodies. J Chromatography A
1133: 332-339.
109. Kunert R., Wolbank S., Chang M., Volgauer R., Broth N., Katinger H. (2004),
Control of key parameters in developing mammalian production clones. Bioprocess
Intl: 54-59.
110. Kwong H., Harris R.J. (1994), Identification of succinimide sites in proteins by N-
terminal sequence analysis after alkaline hydroxylamine cleavage. Protein Sci 3(1):
147-149.

Page 226 of 235
111. Lee G.M., Kin E.J., Kin N.S., Yoon S.K., Ahn Y.H., Song J.Y. (1999),
Development of serum-free medium for the production of erythropoietin by
suspension culture of recombinant Chinese hamster ovary cells using a statistical
design. J Biotechnology 69: 85-93.
112. Li F., Pacis E., Vijaysankaran N., Li J., Gawlitzek M., Amanullah A. (2010),
Systematic approach to develop chemically defined cell culture feed media.
Biopharm Intl 23(11) (Online published)
113. Liu H., Gaza-Bulseco G., Chumsae C., Kew A. N. (2007a), Characterization of
lower molecular weight artifact bands of recombinant monoclonal IgG1 antibodies
on non-reducing SDS-PAGE. Biotechnol Lett 29: 1611-1622.
114. Liu H., Gaza-Bulseco G., Fladu D., Chumsae C., Sun J. (2007b), Heterogeneity of
monoclonal antibodies. J Pharma Sci 97(7):2426-2447.
115. Manning M., Patel K., Borchardt R. (1989), Stability of protein pharmaceuticals.
Pharm Res 6:903–918.
116. Marshall S.A., Lazar G.A., Chirino A.J., Desjarlais J.R. (2003), Rational design
and engineering of therapeutic proteins. Drug Discov Today 8: 212-221.
117. Mendelsohn J. (2001), The epidermal growth factor receptor as a target for cancer
therapy. Endocrine-Related Cancer 8: 3–9.
118. Mendelsohn J., Baselga J. (2003), Status of epidermal growth factor receptor
antagonists in the biology and treatment of cancer. J Clinical Oncology 21: 2787–
2799.
119. Mire-Sluis A., Schenerman M., Mhatre R., Advant S., Dougherty J., Kozlowski S.,
Nashabeh W., McLeod L.D. (2009), Quality by Design: The next phase. Potential
regulatory implications and filing of QbD data. Bioprocess technical in Bioprocess
Intl: 34-42.
120. Moorhouse K.G., Nashabeh W., Deveney J., Bjork N.S., Mulkerrin M.G.,
Ryskamp T. (1997), Validation of an HPLC method for the analysis of the charge
heterogeneity of the recombinant monoclonal antibody IDEC-C2B8 after papain
digestion. J Pharm Biomed Anal 16(4): 593-603.
121. Mullick A., Xu Y., Warren R., Koutroumanis M., Guilbault C., Broussau S.,
Malenfant F., Bourget L., Lamoureux L., Lo R., Caron A.W., Pilotte A., Massie B.
(2006), The cumate gene-switch: a system for regulated expression in mammalian
cells. BMC Biotechnol 6: 43-60 (online publication).

Page 227 of 235
122. Mulligan R., Berg P. (1981), Selection for animal cells that express the
Escherichia coli gene coding for xanthine-guanine phosphoribosyltransferase. Pro
Natl Acad Sci 78(4): 2072-2076.
123. Munro T.P., Cheng Hou J.J., Codamo J., Pilbrough W., Hughes B., Gray P.P.
(2010), New frontiers in cell line development: challenges for biosimilar. J Chem
Technol Biotechnol 86: 895-904.
124. Murby M., Uhlen M., Stahl S. (1996), Upstream strategies to minimize proteolytic
degradation upon recombinant production in Escherichia coli. Protein Expr Puri 7:
129-136.
125. Nemeth-Cawley J.F., Tangarone B.S., Rouse J.C. (2003), “Top-down”
characterization is a complementary technique to peptide sequencing for
identifying proteins species in complex mixture. J Proteome Res 2:495-505.
126. Niall H.D. (1975), Automated Edman Degradation: The protein sequenator.
Methods in Enzymology 27: 942-1010.
127. Nicholson R.I., Gee J.M., Harper M.E. (2001), EGFR and cancer prognosis.
European J Cancer 37 (Suppl 4): S9–S15.
128. Paul M.G., Ophorst C., Koldijk M.H., Schoutten G., Mehtali M., Uytdehaag F.
(2001), The human cell line PER.C6 provides a new manufacturing system for the
production of influenza vaccines. . 19: 2716-2721.
129. Perkins M., Theiler R., Lunte R., Lunte S., Jeschke M. (2000), Determination of
the Origin of Charge Heterogeneity in a Murine Monoclonal Antibody. Pharma Res
17(9): 1110-1117.
130. Petersen D.F., Tobey R.A., Anderson E.C. (1969), Synchronously dividing
mammalian cells. Fed Proc 28: 1771-1779.
131. Petricciani J., Sheets R. (2008), An overview of animal cell substrates for
biological products. Biologicals 36: 359–362.
132. Platt-Mills A.E., Chung C.H., Mirakhur B., Chan E., Le Q., Berlin J., Morse M.,
Murphy B.A., Satinover S.M., Hosen J., Mauro D., Slebos R.J., Zhou Q., Gold D.,
Hatley T., Hicklin D.J. (2008), Cetuximab-Induced Anaphylaxis and IgE Specific
for Galactose -1,3-Galactose. N Engl J Med 358(11): 1109–1117.
133. Puck T.T., Cieciura S.J., Robinson A. (1958), Genetics of somatic mammalian
cells. III. Long term cultivation of euploid cells from human and animal subjects. J
Exp Med. 108: 945-956.
134. Puck T.T. (1985), Development of Chinese Hamster Ovary (CHO) cells. In
Molecular Genetics, Ed. Gottesman M.M. John Wiley & Sons, New York: 37-64.

Page 228 of 235
135. Qian J., Liu T., Yang L., Daus A., Crowley R. and Zhou Q. (2007), Structural
characterization of N-linked oligosaccharides on monoclonal antibody Cetuximab
by the combination of orthogonal matrix-assisted laser desorption/ionization hybrid
qualdrupole-quadrupole time-of-flight tandem mass spectrometry and sequential
enzymatic digestion. Analytical Biochem 364: 8-18.
136. Qu C.K. (2002), Role of the SHP-2 tyrosine phosphatase in cytokine-induced
signaling and cellular response. Biochimica et Biophysica Acta 1592: 297-301.
137. Raju S. (2003), Glycosylation variations with expression systems. BioProcess Intl
44-53.
138. Revers L., Furczon E. (2010a). An introduction to biologics and biosimilars. Part
II: subsequent entry biologics: biosame or biodifferent? Can Pharmacists J
(CPJ/RPC) 143: 184-191.
139. Revers L., Furczon E. (2010b), An introduction to biologics and biosimilars. Part
I: biologics: what are they and where do they come from? Can Pharmacists J
(CPJ/RPC). 143: 134-139.
140. Rosenberg A.S. (2006), Effects of protein aggregates: an immunologic
perspective. AAPS Journal 8(3):E501-E507.
141. Roskos L., Davis C., Schwab G. (2004), The clinical pharmacology of therapeutic
monoclonal antibodies. Drug Dev Res 61: 108-120.
142. Salomon D.S., Brandt R., Ciardiello F., Normanno N. (1995), Epidermal growth
factor-related peptides and their receptors in human malignancies. Critical Reviews
in Oncology/ Hematology 19: 183–232.
143. Sato J., Kawamoto T., Okamoto T. (1987), Cholesterol requirement of P3-X63-
Ag8.653 mouse myeloma cells for growth in-vitro. J Exp Med 165: 1761-1766
144. Sato J., Kawamoto T., McClure D.B., Sato G.H. (1984), Cholesterol requirement
of NS-1 mouse myeloma cells for growth in serum free medium. Mol Biol Med
2(2): 121-134.
145. Sautter K., Enenkel.B. (2005), Selection of high-producing CHO cells using NPT
selection marker with reduced enzyme activity. Biotechnol Bioengg 89(5): 530-
538.
146. Schauenstein E., Schauenstein K., Dachs F., Reiter M., Leitsberger A., Weblacher
M., Maninger K., Horejsi H., Steinschifter W., Hirschmann C., Felsner P. (1996)
Reactive disulfide bonds in immunoglobulin G. A uniques feature in serum
proteins of different species. Biochem Mol Biol Int 40:433-446.

Page 229 of 235
147. Schelessinger J. (1988), The epidermal growth factor receptor as a multifunctional
allosteric protein. Biochemistry 27: 3119-3123.
148. Schellekens H., Klinger E., Nuhlebach S., Brin J.F., Storm G., Crommelin D.J.
(2010), The therapeutic equivalence of complex drugs. Regul Toxicol Pharmacol
59: 176-183.
149. Schuuram J., Perdok G.J., Gorter A.D., Aalbnerse R.C. (2001), The inter-heavy
chain disulfide bonds of IgG4 are in equilibrium with intra-chain disulfide bonds.
Mol Immunol 38:1-8.
150. Shekhon B. Saluja V. (2011), Biosimilars: an overview. Biosimilar 1: 1-11.
151. Shulman M., Wilde C.D., Kohler G. (1978), A better cell line for making
hybridomas secreting specific antibodies. Nature 276: 269-270.
152. Simon A.E., Taylor M.W., Edward W., Bradley C., Thompson L.H. (1982), Model
involving gene inactivation in the generation of autosomal recessive mutants in
mammalian cells in culture. Mol Cell Biol 2(9): 1126-1133.
153. Sondermann P., Krapp S., Mimura Y., Jefferis R., Huber R. (2003), Structural
analysis of human IgG-Fc glycoforms reveals a correlation between glycosylation
and structural intergrity. J Mol Biol 325: 979-989.
154. Southern N.P., Berg P. (1982), Transformation of mammalian cells to antibiotic
resistance with a bacterial gene under the control of the SV40 early region
promoter. J Molecular and Applied Genetics 1,327-341.
155. Srebalus Barnes C.A., Lim A. (2007,) Applications of Mass Spectrometry for the
structural characterization of recombinant protein pharmaceuticals. Mass
Spectrometry Reviews 26: 370-388.
156. Stanbury P.F., Whitaker A., Hall S.J. (1997), Media for industrial fermentation. In
Principles of fermentation technology. Eds. Butterworth-Heinemann Ltd., Oxford,
UK.
157. Steplewski Z., Lubeck M.D., Koprowski H. (1983), Human macrophages armed
with murine immunoglobulin G2a antibodies to tumors destroys human cancer
cells. Science 221: 865-7.
158. Stoll T.S., Muhlethaler U., Stockar V., Marison I.W. (1996), Systematic
improvement of a chemically defined protein-free media for hybridoma growth and
monoclonal antibody production. J Biotechnol 45(12):111-123.
159. Strutzenberger K., Broth N., Kunert R., Steinfellner W., Katinger H. (1999),
Changes during sub-clone development and ageing of human antibody-producing
recombinant CHO cells. J Biotechnol 69: 215-226.

Page 230 of 235
160. Sugaya S., Ohashi H., Shinozawa T. (1997), Expression and purification of a
recombinant human glycoprotein in mouse hybridoma SP2/0-AG12 cells.
Biotechnology Letters 19(2): 185-188.
161. Taylor F.R., Prentice H.L. Garber E.A., Fajardo H.A., Vasilyeva E., Blake P.R.
(2006), Suppression of sodium dodecyl sulfate-polyacrylamide gel electrophoresis
sample preparation artifacts for analysis of IgG4 half-antibody. Anal Biochem
353(2):204-208.
162. Taylor M.W., Pipkorn J.H., Tokito M.K., Pozzatti R.O. Jr. (1977), Purine mutants
of mammalian cell lines: III. Control of purine biosynthesis in adenine
phosphoribosyl transferase mutants of CHO cells. Somatic Cell Genet 3(2): 195-
206.
163. Toyoda H., Komurasaki T., Uchida D., Morimoto S. (1997), Distribution of
mRNA for human epiregulin, a differentially expressed member of the epidermal
growth factor family. Biochemical Journal 326: 69-75.
164. Urlaub G., Chasin L. (1980), Isolation of Chinese hamster cell mutants deficient in
dihydrofolate reductase activity. Proc Natl Acad Sci USA 77(7): 4216-4220.
165. Urlaub G., Kas E., Caropthers A., Chasin L. (1983), Deletion of the diploid
dihydrofolate reductase locus from cultured mammalian cells. Cell 33(2): 405-412.
166. Urlaub G., Mitchell P., Kas E., Chasin L. Funanage V., Myoda E., Hamlin J.
(1986), Effect of gamma rays at the dihydrofolate reductase locus: deletion and
inversions. Somat Cell Mol Genet 12(6): 555-566.
167. Varki A. (1993), Biological roles of oligosaccharides: all of the theories are
correct. Glycobiology 3(2): 97-130.
168. Varki, A. (2007), Glycan-based interactions involving vertebrate sialic acid-
recognizing proteins. Nature 446: 1023–1029.
169. Virella G., Parkhouse R.M. (1973), Sensitivity to reduction of human
immunoglobulin G of different heavy chain subclasses. Immunocytometry 10:213-
217.
170. Volkin D.B., Mach H., Middaugh C.R. (1994), Degradative covalent reactions
important to protein stability. Mol Biotechnol 8:105–22.
171. Vlasak J., Ionescu R. (2008), Heterogeneity of monoclonal antibodies revealed by
charge-sensitive methods. Current Pharmaceutical Biotechnology 9: 468-481.
172. Walowitz J., Fike R., Jaymi D. (2003), Efficient lipid delivery to hybridoma
culture by use of cyclodextrin in a novel granulated dry-form medium technology.
Biotechnol Prog 19(1): 64-8.

Page 231 of 235
173. Walters R.A., Petersen D.F. (1968), Radiosensitivity of mammalian cells. II.
Radiation effects on macromolecular synthesis. Biophys J 8: 1487-1504.
174. Wang J. et al. (2011), The genomic sequence of the Chinese Hamster Ovary
(CHO)-K1 cell line. Nat Biotechnol 29: 735-741.
175. Wantabe T., Shintani A., Nakata M., Shing Y., Folkman J., Igarashi K., Sasada R.
(1994), Recombinant human betacellulin. Molecular structure, biological
activities, and receptor interaction. J Biol Chem 269: 9966-9973.
176. Wayne M.W., Stanner C.P. (1979), Isolation and characterization of CHO cell
mutants with altered asparagines synthetase. Somatic Cell Genet 5(5): 625-639.
177. Weaver J.C., Chizmadzhev Y.A.(1996), Theory of electroporation: A review.
Biochemistry and Bioenergetics 41:135-160.
178. Weitzhandler M., Farnan D., Horvath J., Rohrer J.S., Slingsby R.W., Avdalovic
N., Pohl C. (1998,) Protein variant separations by cation-exchange chromatography
on tentacle-type polymeric stationary phases. J Chromatography A 828(1-2):365-
372.
179. Wells A. (1999), EGF receptor. Intl J Biochem Cell Biol 31: 637-643.
180. Werner W., Wu S., Mulkerrin M. (2005), The removal of pyroglutamic acid from
monocloonal antibodies without denaturation of protein chains. Anal Biochem
342(1): 120-125.
181. Wiebe M. E., Becker F., Lazar R., May L., Casto B., Semense M., Fautz C.,
Garnick R., Miller C., Masover G., Bergmann D., Lubiniecki A.S. (1989),
A multifaceted approach to assure that recombinant tPA is free of adventitious
virus. In Advances in animal cell biology and technology, Betterworth-Heinemann
London: 68-71.
182. Wiley H.S. (2003), Trafficking of the ErbB receptors and its influence on
signaling. Experimental Cell Res 284: 78-88.
183. Wildt S., Gerngross T.U. (2005), The humanization of N-glycosylation pathways
in yeast Nat Rev Microbiol 3: 119-128.
184. Wold F. (1981), In-vivo chemical modification of proteins (Post-translational
Modifications). Ann Rev Biochem 50:783-814.
185. Woodburn J.R. (1999), The epidermal growth factor receptor and its inhibition in
cancer therapy. Pharmacology and Therapeutics 82: 241–250.
186. Wurm F.M. (2004), Production of recombinant protein therapeutics in cultivated
mammalian cells. Nat Biotechnol 22: 1393-1398.

Page 232 of 235
187. Wurm F.M. (2005), The industry’s workhorse-Mammalian expression systems. In
Modern Biopharmaceuticals, Wiley-VCH, Weiheim, 3: 723-759.
188. Yallop C., Maamsman M. Zuijderwijk M., van Noordenburg Y., Vooys A.,
Keehmen R., van Montfort B., Jansen M., Lagetrwerf F., Dijkstra R., Birrento M.,
de Vocht M., Renger S., Bout A., Opstelten D. (2005), High level production of
recombinant IgG in the human cell line PER.C6, In Animal cell technology meets
genomics, Eds. Godia F. and Fussenegger M., Springer, Amsterdam: 533-536.
189. Yarden Y. (2001), The EGFR family and its ligands in human cancer: signally
mechanisms and therapeutic opportunities. Eur J Cancer 37 (suppl 4): S3-S8.
190. Yarden Y., Sliwkowski M.X. (2001), Untangling the ErbB signaling network.
Nature Rev Mol Cell Biol 2: 127-137.
191. Yosida T. (2001), Flow cytometry: an improved method for the selection of highly
productive gene-amplified CHO cells using flow cytometry. Biotechnol Bioeng
74: 435-442.
192. Zapisek W.F., Saponara A.G., Enger M.D. (1969), Low molecular weight
methylated ribonucleic acid species from Chinese hamster ovary cells. I. Isolation
and characterization. Biochemistry 8: 1170-1181.
193. Zhang Y.B., Howitt J. McCorkel S., Lawrence P., Springer K., Freimuth P. (2004),
Protein aggregation during overexpression limited by peptide extensions with large
net negative charge. Protein Expr Purif 36:207-216.
194. Zhang W., Czupryn M.J. (2002), Free sulfahydrl in recombinant monoclonal
antibodies. Biotechnol Prog 18: 509-513.
195. Zhou Q., Qian J., Liu T., Yang L., Daus A., Crowley R. (2007), Structural
characterization of N-linked oligosaccharides on monoclonal antibody cetuximab
by the combination of orthogonal matrix-assisted laser desorption/ionization hybrid
quadrupole-quadrupole time-of-flight tandem mass spectrometry and sequential
enzymatic digestion. Anal biochem 364: 8-18.
Guidelines
196. Points to Consider in the Manufacture and Testing of Monoclo- nal Antibody
Products for Human Use. US Department of Health and Human Services, Food and
Drug Administration, Center for Biologics Evaluation and Research, February 28,
1997.
197. Guideline on development, production, characterization and specifications for
monoclonal antibodies and related products (EMEA/CHMP/BWP/1576532/2007).

Page 233 of 235
198. International Conference on Harmonization guidelines ICH Q8(R2),
Pharmaceutical Development.
199. ICH Q6B :Test Procedures and Acceptance Criteria For Biotechnological /
Biological Products” (CPM/ICH/365/96.
Handbooks and Reports
200. Affinity Chromatography: Principles and methods, GE handbook No. 18-1022-29.
201. LaMerie Business intelligence Report, March 2010 (www.pipelinereview.com).
Websites
202. www.accessdata.fda.gov/scripts/cder/drugsatfda
203. www.biopharma.com/approvals_2011.html
204. www.evaluatepharma.com
205. www.fermentas.com
206. www.ich.org
207. www.invitrogen.com
208. www.lonzabio.com
209. www.mirusbio.com
210. www.sigmaaldrich.com
211. www.wikipedia.org/wiki/Electroporation

Page 234 of 235
PUBLICATIONS

Page 235 of 235
PUBLICATIONS 1. Hatim Motiwala, Archana Gattupalli, Brajesh Varshney, Rustom Mody (2012),
Developing an alternate host for production of biosimilar anti-EGFR monoclonal antibody. Intl Jl of Pharmacy Biol Sci, 2(4): 90-100.
Journal ISSN- 2230-7605; Impact value from Index Copernicus – 4.72, Science Central.com score of 33.1q9
2. Hatim Motiwala, Sona Jain, Archana Gattupalli, Brajesh Varshney, Rustom Mody
(2013), A comparative study of manual and automated clone selectilon methods for recombinant CHO cells.. Bioprocessing Journal, USA (Accepted)
CONFERENCES 1. March 2011: Biopharma-Academic Interaction, Vellor Institure of Technology,
Vellore, INDIA. (http://www.vit.ac.in/events2011/cbst/ProgrammeSchedule.pdf) 2. March 2012: Monoclonal Antibodies: Exploring innovation in therapeutic antibody
development and production, London, UK (www.ibis-spr.nl/downloads/monoclonal_antibodies_2012___-9.pdf)
3. April 2012: Bioprocess International Conference, Prague, Czech Republic. (www.ibclifesciences.com/BPI)
4. September 2012: International conference and exhibition on biowavers and biosimilars, San Antonio, USA. Abstract published in Journal of Bioequivalence Available, Volume 4(7):103. ISSN: 0975-0851
5. April 2013: Bioprocess International Conference, Dusseldorf, Germany. (www.ibclifesciences.com/BPI)