Embed Size (px)
Citation preview
8/3/2019 13 Paper 30121111 IJCSIS Camera Ready Paper Pp. 74-79
http://slidepdf.com/reader/full/13-paper-30121111-ijcsis-camera-ready-paper-pp-74-79 1/6
(IJCSIS) International Journal of Computer Science and Information Security,
Vol. 10, No. 1, 2012
Image Retrieval Using Histogram Based Bins of
Pixel Counts and Average of Intensities
H. B. Kekre
Sr. Professor
Department of Computer Engineering,
NMIMS University,
Mumbai, Vileparle, India
Kavita Sonawane
Ph. D. Research Scholar,
Department of Computer Engineering
NMIMS University,
Mumbai, Vileparle, India
Abstract—This In this paper we are introducing a novel
technique to extract the feature vectors using color contents of
the image. These features are nothing but the grouping of similar
intensity levels in to bins into three forms. One of its form
includes count of number of pixels, and other two are based on
bins average intensity levels and the average of average
intensities of R,G and B planes of image having some similarity
amongst them. These Bins formation is based on the histograms
of the R, G and B planes of the image. In this work each image
separated into R, G and B planes. Obtain the histogram for each
plane which is partitioned into two, three and four parts such
that each part will have equal pixel intensity levels. As the 3
histograms are partitioned into 2, 3and 4 parts we could form 8,
27 and 64 bins out of it. We have considered three ways to
represent the features of the image. First thing we taken into
consideration is the count of the number of pixels in the
particular bin. Second thing considered is calculate the average
of the R, G and B intensities of the pixels in the particular bin
and third form is based on average distribution of the total
number of pixels with the average R, G, B intensities in all bins.
Further some variations are made while selecting these bins in
the process where query and database images will be compared.To compare these bins Euclidean distance and Absolute distance
are used as similarity measures. First set of 100 images having
less distances between their respective bins which are sorted into
ascending order will be selected in the final retrieval set.
Performance of the system is evaluated using the plots obtained
in the form of cross over points of precision and recall
parameters in terms of percentage retrieval for only out of first
100 images retrieved based on the minimum distance.
Experimental results are obtained for augmented Wang database
of 1000 bmp images from 10 different categories which includes
Flowers, Sunset, Mountain, Building, Bus, Dinosaur, Elephant,
Barbie, Mickey and Horse images. We have taken 10 randomly
selected sample query images from each of the 10 classes. Results
obtained for 100 queries are used in the discussion.
Keywords-component; Histogram, Bins approach, Image retrieval,
CBIR, Euclidean distance, Absolute distance.
I. Introduction (Heading 1)
This paper describes the new technique for Content Based
Image Retrieval based on the spatial domain data of the image.
CBIR systems are based on the use of spatial domain or
frequency domain information. Many CBIR approaches uses
local and global information such as color, texture, shape,
edges, histograms, histogram bins etc to represent the feature
vectors of the images [1], [2], [3], [4], [5]. Color is the most
widely used visual feature which is independent of the image
size and orientation. Many researchers have used color
histograms as the color feature representation of the image for
image retrieval. Most of these techniques are using global or
local histograms of images, some are using equalized
histogram bins, some are using local bins formation methodusing histograms of multiple image blocks [6], [7], [8], [9].
Main idea used in this paper is instead of changing the
intensity distribution of the original image by taking the
equalized histogram [10], [11]; we are using the original
histograms of the image as it is. We are separating the image
into R, G and B planes; obtain the histogram for each plane
separately which is partitioned into two parts having equal
pixel intensities. By taking R, G and B value of each pixel
intensity of an image we are checking in which of the two
parts of R, G, B histograms it falls respectively and then the
bin for that pixel will be finalized where it will be counted
[12]. Second thing we are taking into account is the intensities
of the pixels in each of the 8 bins and new set of 8 bins isobtained in which each bin has the count of average of R, G, B
intensity values of each pixel in that bin. A little variation is
made in second types of bins is that we are taking average of
average R, G, B values of all pixels in the respective bin count
and a third set of bins holding average of average is formed.
After analyzing the results of 8 bins, we have increased the no
of bins from 8 to 27 and 64 by dividing the histogram of each
plane into 3 and 4 parts respectively. Once the bins formation
is done comparison process is performed to obtain the results
and evaluate the system performance. Comparison of query
and database images requires similarity measure. It is
significant factor which quantifies the resemblance in database
image and query image [13],[14]. Depending on the type of features, the formulation of the similarity measure varies
greatly The different types of distances which are used by
many typical CBIR systems are Mahalanobis distance [15],
intersection distance [16], the Earth mover’s distance (EMD),
Euclidian distance [15], [17], and Absolute distance [19]. In
this paper we are focusing on Euclidean distance and absolute
distance as similarity measures, using this we are calculating
the distance between the query and 1000 database image
feature vectors. These distances are then sorted in ascending
74 http://sites.google.com/site/ijcsis/ISSN 1947-5500
8/3/2019 13 Paper 30121111 IJCSIS Camera Ready Paper Pp. 74-79
http://slidepdf.com/reader/full/13-paper-30121111-ijcsis-camera-ready-paper-pp-74-79 2/6
(IJCSIS) International Journal of Computer Science and Information Security,
Vol. 10, No. 1, 2012
order from minimum to maximum Out of these 1000 sorted
distances images with respect to create these components, first
100 distances in ascending order are selected as images retrieved
as there are 100 images of each class in the database [18].
Number of relevant images in these 100 images gives us the
precision and recall cross over point (PRCP), which is the
performance evaluation parameter of the system.
This paper is organized as follows: Section 2 will discuss
the algorithmic view of the CBIR system based on 8, 27 and64 bins using histogram plots. Section 3 describes the Role of
the similarity measures in the CBIR system. Section
4.highlights the experimental results obtained along with the
analysis. Finally section 5 summarizes the work done along
with their comparative study.
II. ALGORITHMIC VIEW OF BINS FORMATION
A. Feature Extraction and Formation of Feature Databases
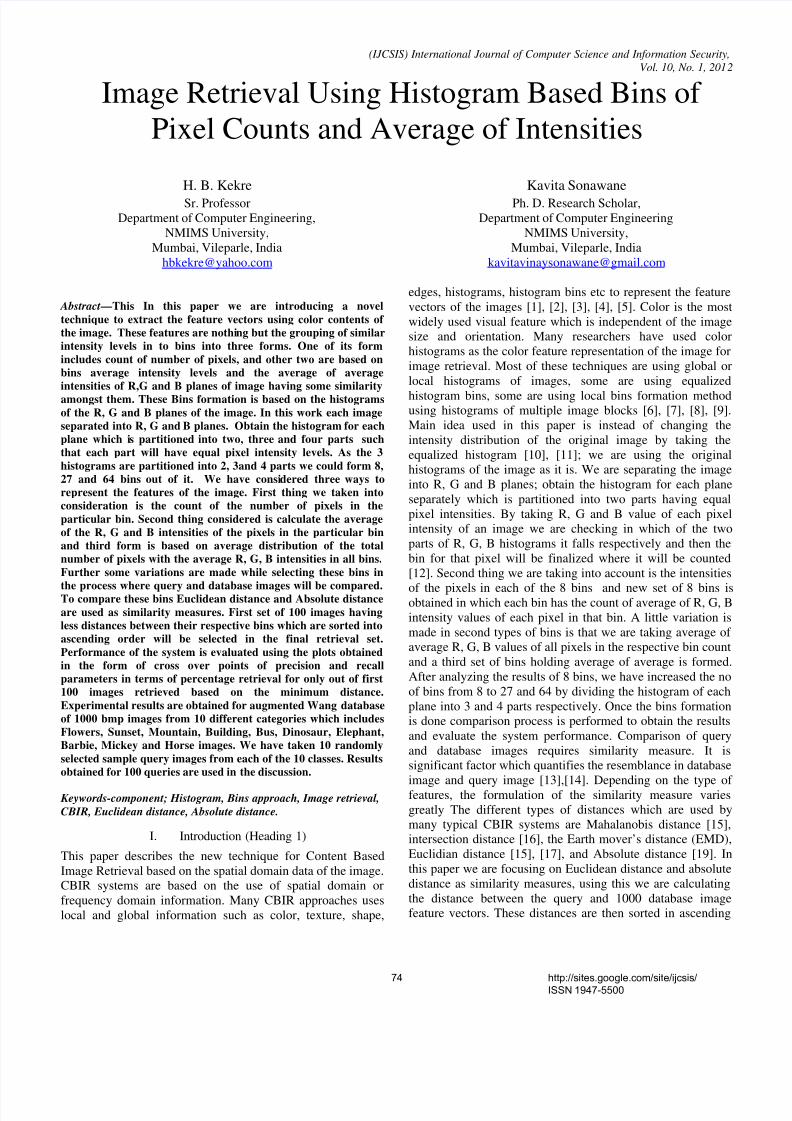
Figure 1. Feature vector Database Formation
Bins Formation Process: 8 Bins
Step1. Spilt the image into R, G and B planes.
Step2. Obtain the histogram for each plane.
Step3. Divide each histogram into 2 parts and assign a unique
flag to each part.
Step4. To extract the color feature of the image, pick up the
original image pixel and check its R, G and B values find out
in the histogram that in which range these values exactly falls,
based on it assign the unique flags to the r, g and b values of
that pixel with respect to the partition of the histogram it
belongs.
Step5. Count of pixels in the bin: Based on the flags assignedto each pixel with respect to the R, G B values and 2 partitions
(e. g. 0 and 1) of the histogram we can have 8 combinations
from 000 to 111 which are the total 8 bins”.
B. Formation of Extended Bins 27 and Bins 64
Formation of 27 and 64 bins feature vector database is
extended version of the 8 bins feature extraction process. Here
for 27 bins only difference is in step3 of the above algorithm,
here to get 27 and 64 bins we are partitioning the histograms
into 3 and 4 parts respectively which are named as 0, 1, 2 for
27 bins and 0, 1, 2, 3 for 64 bins approach. As explained in
step 4 to 5 here also same process is applied and 3 bit flags are
assigned to each pixel of the image for which the feature
vector is being extracted. For 3 partitions the 3 flag bits (either
of 0, 1 and 2) can have 27 combinations and for 4 partitions
the 3 flag bits (either of 0, 1, 2 and 3) can have 64
combinations, these are the addresses of the 27 and 64 bins
respectively. Based on this process two feature databases of feature vector size 27 and 64 holding the count of no of pixels
according to the r, g, and b intensity values are obtained as
Bins27_database and Bins64_database respectively.
C. Variations to Obtain Multiple Feature Databases
As shown in Figure.1 Three different databases for 8, 27 and
64 bins can further have 2 different sets of feature vectors
named “Count of no of pixels”, “Average of R, G and B
values for all pixels in a Bin” which are simply obtained by
modifying the process of extracting the feature vectors ;
instead of just taking the count of pixels we have considered
the significance of actual intensity levels of each pixel in each
of the 8, 27 or 64 bins and taken the average values of them.
III. APPLICATION OF SIMILARITY MEASURE
Many similarity measures used in different CBIR systems arestudied [21], [22], [23], [24], [25]. We have used Euclideandistance given in equation (1) and absolute distance inequation (2) as similarity measures in our work to produce theretrieval results. Once the query image is accepted by thesystem it will calculate the Euclidean distance as well asAbsolute distance between the query image feature vector anddatabase image feature vectors. In our system database size is1000 images, so we obtained two sets of results one based oneach similarity measure. When query image will be compared
with 1000 database images which generate 1000 Euclideandistances and 1000 Absolute distances. These are then sortedin ascending order to select the images having minimumdistance for the final retrieval.
Euclidean Distance :
( )2
1
∑=
−=
n
i
iiQI FI FQ D
(1)
Absolute Distance :
)(
1
I
n
I QI FI FQ D −=∑
(2)
Bins Formation
8 Bins 27 64
Count of:
Number of Pixels
Average of R, G
and B values for the
no of pixels
75 http://sites.google.com/site/ijcsis/
ISSN 1947-5500
8/3/2019 13 Paper 30121111 IJCSIS Camera Ready Paper Pp. 74-79
http://slidepdf.com/reader/full/13-paper-30121111-ijcsis-camera-ready-paper-pp-74-79 3/6
(IJCSIS) International Journal of Computer Science and Information Security,
Vol. 10, No. 1, 2012
Final Retrieval Process
Images having less distance are to be selected in the final set.
For this we kept one simple criterion that we are taking first
minimum 100 distances from the sorted list and corresponding
images of those distances only taken into the final retrieval set.
Same process is applied for all the features databases using
both similarity measures
IV. EXPERIMENTAL RESULTS AND DISCUSSIONS
A. Database and Query Images
Experimental set up for this work uses 1000 BMP images
includes 10 different classes where each class has 100 images
within it. The classes we have used are Flower, Sunset,
Mountain, Building, Bus, Dinosaur, Elephant, Barbie, Mickey
and Horse images. Feature vectors for all these images are
calculated in advance using different methods described above
in section 2 and multiple feature databases are obtained.
Query is given as example image to this system. Once the
query enters into the system feature vectors using all different
ways will be extracted and will be compared with the
respective feature vector databases by calculating the Euclidean
distance and Absolute distance between them. Selection of
query images is from the database itself; it includes 10 images
from each class means total 100 images are selected to be given
as query to the system for all the approaches based on
variations in bins formation to test and evaluate their
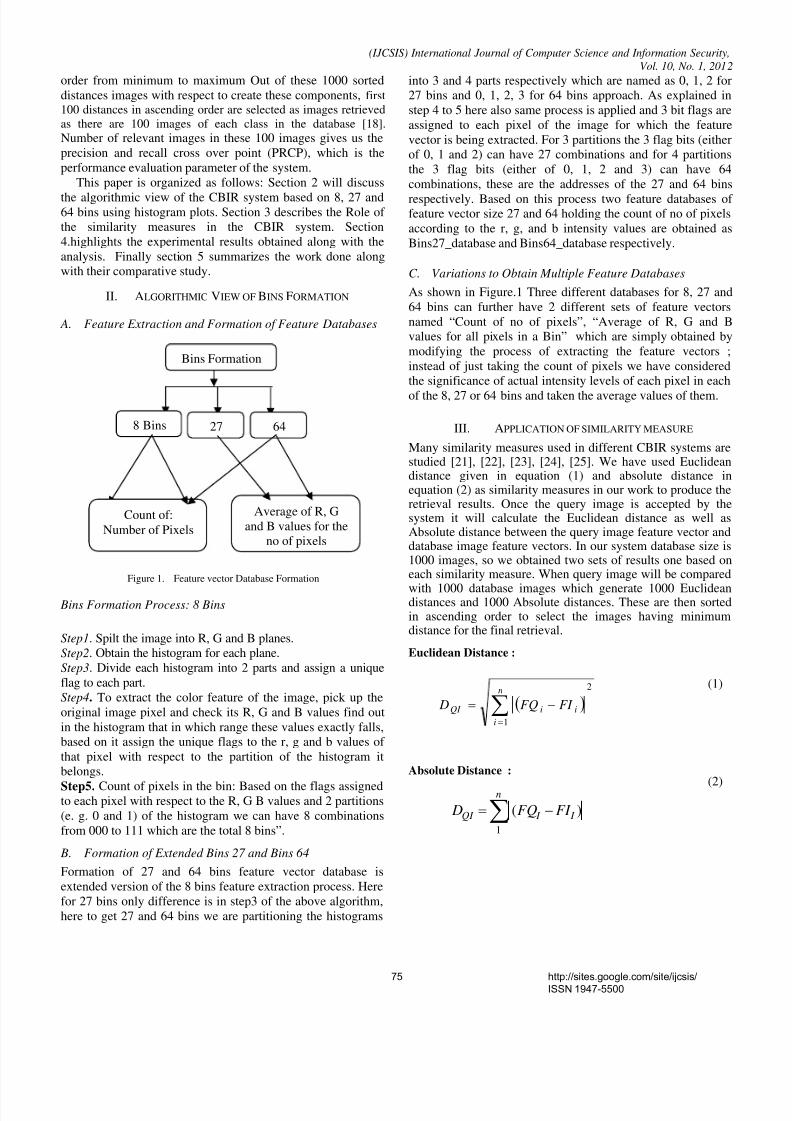
performance. Sample Images from the database is shown in
Figure 2.
Figure 2. Sample Database Images from 10 Different Classes
(Database is of Total 1000 bmp images from above 10 classes, includes 100from each class
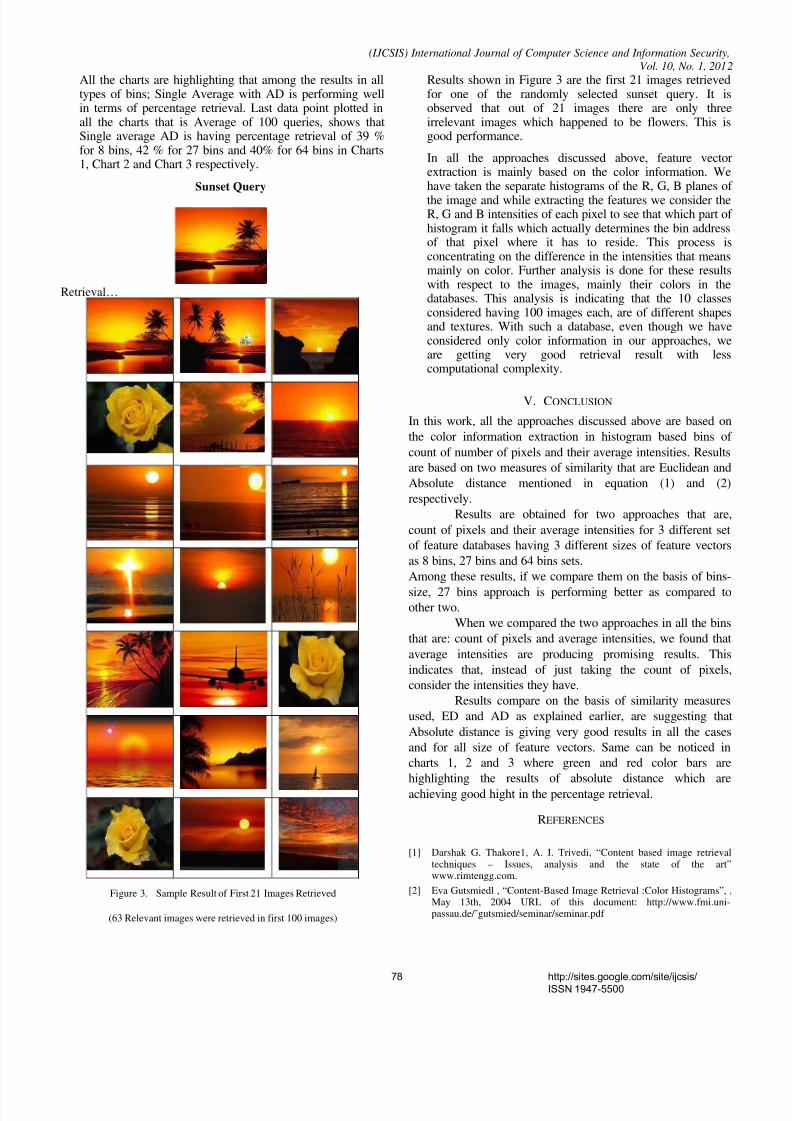
B. Results, Observations and Comparison
Results using 100 queries are obtained for 3 approaches based
on formation of bins, that are 8 bins, 27 bins and 64 bins where
each approach includes the 2 variations while extracting the
pixel’s color information to form the feature vector which are
classified as ‘Count of Number of pixels’ and ‘Single average’
that is average intensities of the number of pixels in each bin.
Results obtained are segregated in three tables as 8 bins, 27
bins, and 64 bins. First column of each table is indicating the
query image classes used for the experimentation. Remaining
two columns are showing the total retrieval results obtained for
Count of pixels and Single average approaches with respect to
both the similarity measures that are Euclidean distance (ED)
and Absolute distance (AD). Percentage retrieval is shown in
Chart 1, 2 and 3 for 8, 27 and 64 bins respectively. Since there
are 100 images of each class in the database percentage
retrieval will be a cross over point of precision and recall [26].
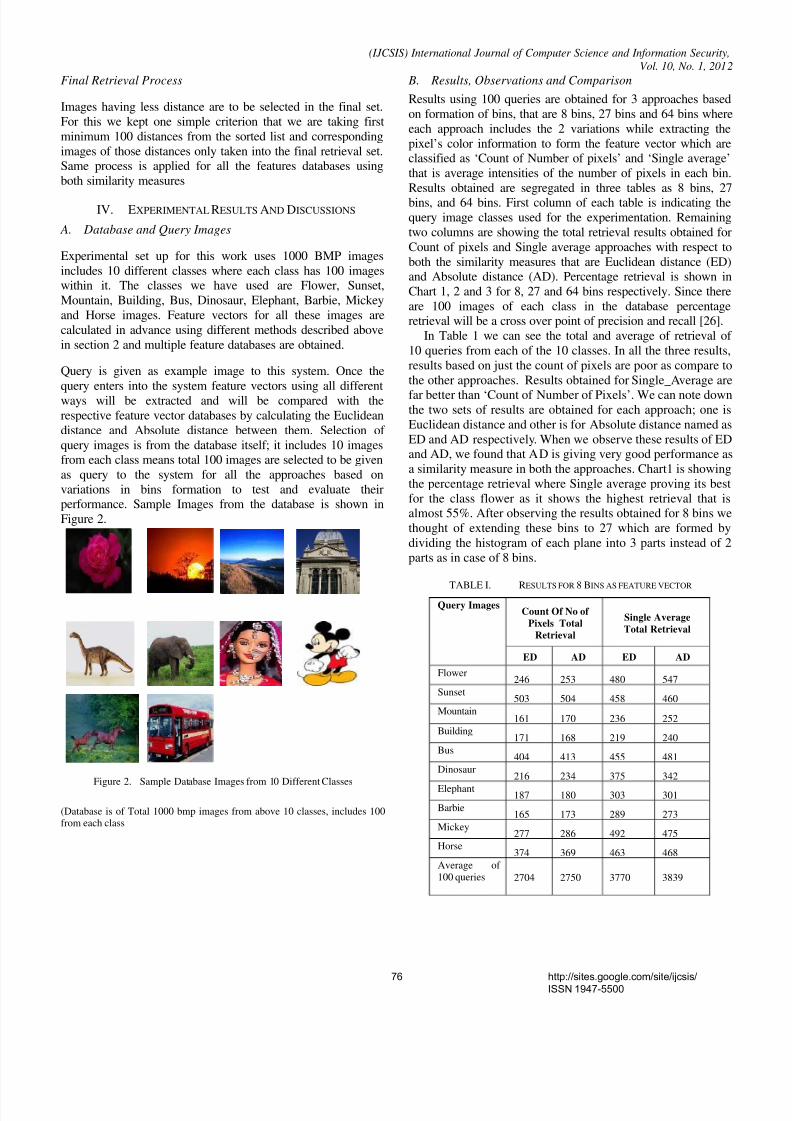
In Table 1 we can see the total and average of retrieval of
10 queries from each of the 10 classes. In all the three results,
results based on just the count of pixels are poor as compare to
the other approaches. Results obtained for Single_Average are
far better than ‘Count of Number of Pixels’. We can note downthe two sets of results are obtained for each approach; one is
Euclidean distance and other is for Absolute distance named as
ED and AD respectively. When we observe these results of ED
and AD, we found that AD is giving very good performance as
a similarity measure in both the approaches. Chart1 is showing
the percentage retrieval where Single average proving its best
for the class flower as it shows the highest retrieval that is
almost 55%. After observing the results obtained for 8 bins we
thought of extending these bins to 27 which are formed by
dividing the histogram of each plane into 3 parts instead of 2
parts as in case of 8 bins.
TABLE I. RESULTS FOR 8 BINS AS FEATURE VECTOR
Query ImagesCount Of No of
Pixels Total
Retrieval
Single Average
Total Retrieval
ED AD ED AD
Flower246 253 480 547
Sunset503 504 458 460
Mountain161 170 236 252
Building171 168 219 240
Bus404 413 455 481
Dinosaur216 234 375 342
Elephant187 180 303 301
Barbie165 173 289 273
Mickey277 286 492 475
Horse374 369 463 468
Average of
100 queries 2704 2750 3770 3839
76 http://sites.google.com/site/ijcsis/
ISSN 1947-5500
8/3/2019 13 Paper 30121111 IJCSIS Camera Ready Paper Pp. 74-79
http://slidepdf.com/reader/full/13-paper-30121111-ijcsis-camera-ready-paper-pp-74-79 4/6
(IJCSIS) International Journal of Computer Science and Information Security,
Vol. 10, No. 1, 2012
Chart 1. Results for 8 Bins as feature vector
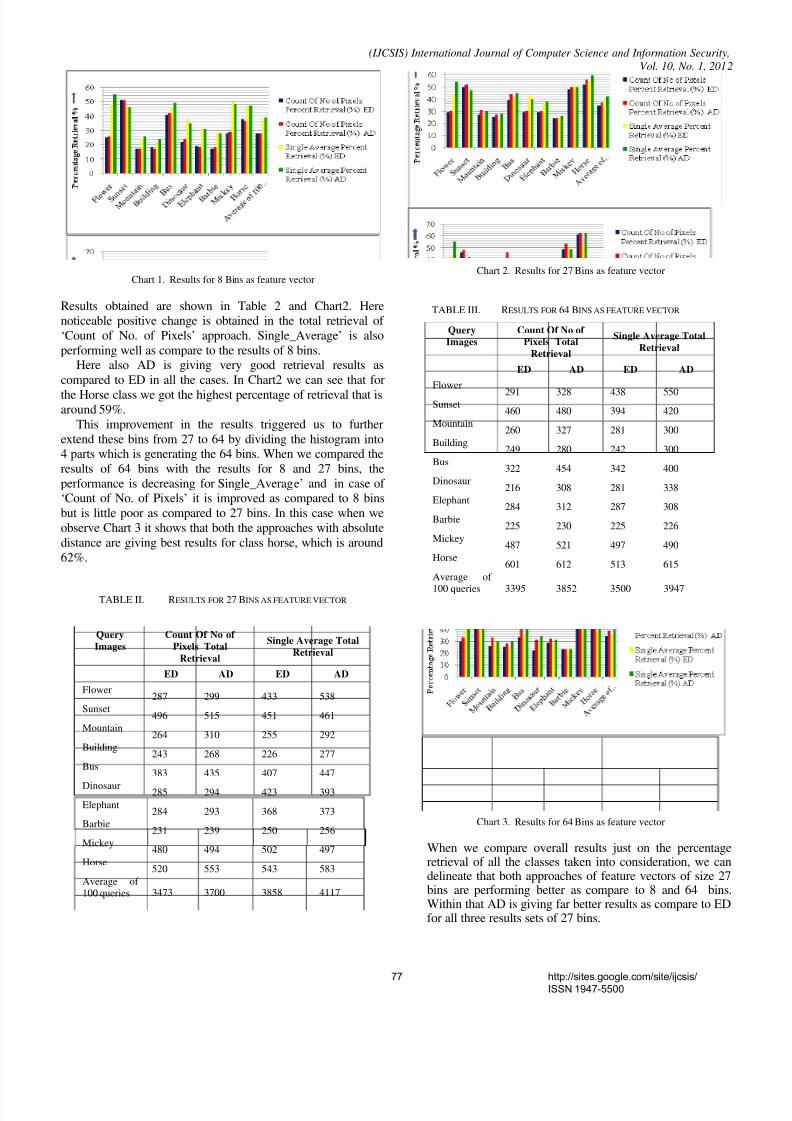
Results obtained are shown in Table 2 and Chart2. Here
noticeable positive change is obtained in the total retrieval of
‘Count of No. of Pixels’ approach. Single_Average’ is also
performing well as compare to the results of 8 bins.
Here also AD is giving very good retrieval results as
compared to ED in all the cases. In Chart2 we can see that for
the Horse class we got the highest percentage of retrieval that isaround 59%.
This improvement in the results triggered us to further
extend these bins from 27 to 64 by dividing the histogram into
4 parts which is generating the 64 bins. When we compared the
results of 64 bins with the results for 8 and 27 bins, the
performance is decreasing for Single_Average’ and in case of
‘Count of No. of Pixels’ it is improved as compared to 8 bins
but is little poor as compared to 27 bins. In this case when we
observe Chart 3 it shows that both the approaches with absolute
distance are giving best results for class horse, which is around
62%.
TABLE II. RESULTS FOR 27 BINS AS FEATURE VECTOR
Query
Images
Count Of No of
Pixels Total
Retrieval
Single Average Total
Retrieval
ED AD ED AD
Flower287 299 433 538
Sunset496 515 451 461
Mountain264 310 255 292
Building243 268 226 277
Bus383 435 407 447
Dinosaur 285 294 423 393
Elephant284 293 368 373
Barbie231 239 250 256
Mickey480 494 502 497
Horse520 553 543 583
Average of 100 queries 3473 3700 3858 4117
Chart 2. Results for 27 Bins as feature vector
TABLE III. RESULTS FOR 64 BINS AS FEATURE VECTOR
Query
Images
Count Of No of
Pixels Total
Retrieval
Single Average Total
Retrieval
ED AD ED AD
Flower291 328 438 550
Sunset460 480 394 420
Mountain260 327 281 300
Building249 280 242 300
Bus322 454 342 400
Dinosaur216 308 281 338
Elephant284 312 287 308
Barbie225 230 225 226
Mickey487 521 497 490
Horse601 612 513 615
Average of
100 queries 3395 3852 3500 3947
Chart 3. Results for 64 Bins as feature vector
When we compare overall results just on the percentageretrieval of all the classes taken into consideration, we candelineate that both approaches of feature vectors of size 27bins are performing better as compare to 8 and 64 bins.Within that AD is giving far better results as compare to EDfor all three results sets of 27 bins.
77 http://sites.google.com/site/ijcsis/
ISSN 1947-5500
8/3/2019 13 Paper 30121111 IJCSIS Camera Ready Paper Pp. 74-79
http://slidepdf.com/reader/full/13-paper-30121111-ijcsis-camera-ready-paper-pp-74-79 5/6
8/3/2019 13 Paper 30121111 IJCSIS Camera Ready Paper Pp. 74-79
http://slidepdf.com/reader/full/13-paper-30121111-ijcsis-camera-ready-paper-pp-74-79 6/6
(IJCSIS) International Journal of Computer Science and Information Security,
Vol. 10, No. 1, 2012 [3] Y. Rui, T. S. Huang and S. Chang, “Image Retrieval: Current
Techniques, Promising Directions and Open Issues ”, Journal of VisualCommunication and Image Representation, vol. 10, pp. 39 ]62, March1999.
[4] J. R. Smith and S.F. Chang, “Automated image retrieval using color andtexture", Technical Report CU/CTR 40814, Columbia University, July1995.
[5] J. Han and K. Ma, “Fuzzy Color Histogram and Its Use in Color ImageRetrieval”,IEEE Trans. On Image, Processing, vol. 11, zpp. 944 – 952,Aug. 2002.
[6] N.K.Kamila, ,Pradeep Kumar Mallick, Sasmita Parida B.Das, “ImageRetrieval using Equalized Histogram Image Bins Moments” December2010.
[7] Shengjiu Wang, A Robust CBIR Approach Using Local ColorHistograms, Technical Report TR 01-03, Departement of computingscience, University of Alberta, Canada. October 2001.
[8] A Vadivel , A K Majumdar, Shamik Sural , “Perceptually SmoothHistogram Generation from the HSV Color Space for Content BasedImage Retrieval”
[9] M. J. Swain and D.H. Ballard. “Color indexing”. In International Journalof Computer Vision, Vol. 7(1), pp 11-32, 199.
[10] Jeff Berens., “Image Indexing using Compressed Colour Histograms”,Thesis submitted for the Degree of Doctor of Philosophy in the Schoolof information Systems, University of East Anglia, Norwich.
[11] Greg Pass and Ramin Zabih. “Comparing Images Using Joint
Histograms”. ACM Journal of multimedia Systems, Vol. 7(3), pp. 234-240, May 1999.
[12] Guoping Qiu “Color Image Indexing Using BTC” IEEE TransactionsOn Image Processing, Vol. 12, No. 1, January 2003.
[13] C. Schmid and r. Mohr, “local grayvalue invariants for image retrieval,”IEEE trans. Pattern anal. Mach. Intell., vol. 19, no. 5, pp. 530–535, may1997.
[14] S. Santini and r. Jain, “similarity measures,” IEEE trans. Patternanal.mach. Intell., vol. 21, no. 9, pp. 871–883, sep. 1999.
[15] Y. Rubner, l. J. Guibas, and c. Tomasi, “The Earth mover’s distance,multi-dimensional scaling, and color-based image retrieval,” Inproc.darpa image understanding workshop, may 1997, pp. 661–668.
[16] J. Hafner, h. S. Sawhney, w. Equitz, m. Flickner, and w. Niblack,“efficient color histogram indexing for quadratic form distancefunctions,” IEEE trans. Pattern anal. Mach. Intell., vol. 17, no. 7, pp.729–736, jul. 1995.
[17] Qasim Iqbal And J. K. Aggarwal, “Cires: A System For Content-BasedRetrieval In Digital Image Libraries” Seventh International ConferenceOn Control, Automation, Robotics And Vision (Icarcv’02), Dec 2002,Singapore.
[18] H. B. Kekre , Kavita Sonawane, “Query Based Image Retrieval Usingkekre’s, DCT and Hybrid wavelet Transform Over 1st and 2ndMoment” International Journal of Computer Applications (0975 – 8887),Volume 32– No.4, October 2011
[19] H.B.Kekre ,Dhirendra Mishra, “Sectorization of DCT-DST Plane forColumn wise Transformed Color Images in CBIR” ICTSM-11, atMPSTME 25-27 February, 2011. Uploaded on Springer Link
[20] H. B. Kekre , Kavita Sonawane “Feature Extraction in Bins UsingGlobal and Local thresholding of Images for CBIR” InternationalJournal Of Computer Applications In Applications In Engineering,Technology And Sciences, ISSN: 0974-3596 | October ’09 – March
’10 | Volume 2 : Issue 2.
[21] Young-jun Song, Won-bae Park, Dong-woo Kim, and Jae-hyeong Ahn,“Content-based image retrieval using new color histogram”, Intelligent
Signal Processing and Communication Systems, Proceedings of 2004International Symposium on 18-19 Nov. 2004, pp. 609-611.
[22] J. Huang, S. R. Kumar, M. Mitra, W. J. Zhu and R. Zabih, “ImageIndexing Using Color” Proc.IEEE Conf. on Computer Vision andPattern Recognition.
[23] Remco C. Veltkamp, mirela tanase department of computing science,utrecht university, “content-based image retrieval systems:a survey”Revised and extended version of technical report uu-cs- 2000-34,october october 28, 2002.
[24]
H. B. Kekre, Kavita Sonawane “Standard Deviation of Mean andVariance of Rows and Columns of Images for CBIR” WASETInternational Journal of Computer, Information and System Science andEngineering (IJCISSE), Volume 3, Number 1, pp.8-11, 2009
[25] Yixin chen, member IEEE, james z. Wang, member IEEE, and robertkrovetz clue: “Cluster-Based Retrieval Of Images By UnsupervisedLearning” IEEE Transactions On Image Processing, Vol.14, No. 8,August 2005.
[26] Dr. H. B. Kekre, Sudeep D. Thepade, Varun K. Banura, “PerformanceComparison of Gradient Mask Texture Based Image RetrievalTechniques using Walsh, Haar and Kekre Transforms with Image Maps”International Journal of Computer Applications (IJCA), Special IssueJuly 2011. Selected as Editors Choice(Best Paper)
AUTHORS PROFILE
Dr. H. B. Kekre has received B.E. (Hons.) in
Telecomm. Engg. from Jabalpur University in
1958,M.Tech (Industrial Electronics) from IIT
Bombay in 1960, M.S. Engg. (Electrical Engg.)from University of Ottawa in 1965 and Ph.D.
(System Identification) from IIT Bombay in
1970. He has worked Over 35 years as Faculty of
Electrical Engineering and then HOD Computer Science and Engg. at IIT
Bombay. For last 13 years worked as a Professor in Department of ComputerEngg. at Thadomal Shahani Engineering College, Mumbai. He is currently
Senior Professor working with Mukesh Patel School of Technology
Management and Engineering, SVKM’s NMIMS University, Vile Parle(w),
Mumbai, INDIA. He has guided 17 Ph.D.s, 150 M.E./M.Tech Projects andseveral B.E./B.Tech Projects. His areas of interest are Digital Signal
processing, Image Processing and Computer Networks. He has more than 350
papers in National / International Conferences / Journals to his credit.
Recently twelve students working under his guidance have received best paperawards. Five of his students have been awarded Ph. D. of NMIMS University.
Currently he is guiding eight Ph.D. students. He is member of ISTE and IETE.
Ms. Kavita V. Sonawane has received M.E
(Computer Engineering) degree from MumbaiUniversity in 2008, currently Pursuing Ph.D. from
Mukesh Patel School of Technology, Management
and Engg, SVKM’s NMIMS University, Vile-Parle
(w), Mumbai, INDIA. She has more than 8 years of experience in teaching. Currently working as a Assistant professor in
Department of Computer Engineering at St. Francis Institute of Technology
Mumbai. Her area of interest is Image Processing, Data structures and
Computer Architecture. She has 7 papers in National/ International
conferences / Journals to her credit.She is member of ISTE.
79 http://sites.google.com/site/ijcsis/
ISSN 1947-5500


![[XLS] · Web view79 0 79 79000 79 79332 79 79085 79 79005 79 10051 79 79328 79 79148 79 10061 79 79476 79 79971 79 79045 79 79772 79 79301 79 79333 79 79154 79 10018 79 79101 79 79335](https://img.dokumen.tips/doc/110x75/5adf13517f8b9a6e5c8bad58/xls-view79-0-79-79000-79-79332-79-79085-79-79005-79-10051-79-79328-79-79148-79.jpg)