Embed Size (px)
Citation preview

>.,m* .T.. .. -,. - ..S, .. .+ . . .. . , : :L+?.-
..... . , .. e .
. . ,. . ' . --Ls.. , . , - - ...-l*., ..*, (. : . ' . . :. ,$:.;@, 3
. .
. , .. ". -. . .. --- . - . . ".
. .
xasional Paper No. 79 . .
B ) Bureau of Agricultural Economics, Canberra
Occasional Paper No. 79
A Review of Issues in the Marketing of Small Classed Lines of Wool in the Auction System
Project 2251
J.G.I.Passmore, W. R.Curran and D.G.Shaw
Australian Government Publishing Service Canberra 1983

@Commonwealth of Australia 1983
ISBN 0 644 02644 8
Printed by C. J. THOMPSON, Commonwealth Government Printer, Canberra

FOREWORD
There has been long-standing concern i n t h e wool indus t ry t h a t smal l c l assed l i n e s account fo r a d i sp ropor t iona te share of handling c o s t s i n the auct ion system. Despite these high c o s t s , m a l l l i n e s c o n s t i t u t e an important p a r t of the Austra l ian c l i p , and many e f f o r t s have been made t o develop lower c o s t methods of handling.
Methods of handling small l i n e s a r e moving i n d i f f e r e n t d i r e c t i o n s . C o m e r c i a l brokers a r e inc reas ing ly s h i f t i n g t o i n t e r l o t t i n g small l i n e s . Hawever, the Aus t ra l i an Wool Corporation, v i a the Limited Offer t o Purchase Scheme and subsequently t h e Wool Marketing Serv ice , has moved t o s e l l i n g 3-bale l i n e s a s individual t e s t e d l o t s .
The research on which t h i s paper is based was d i r e c t e d t o reviewing the e f f e c t on r e t u r n s to growers of a l t e r n a t i v e methods of handling small c l assed l i n e s . The research demonstrates t h a t t h e a l t e r n a t i v e methods can inf luence the p r i c e s growers receive f o r wool a s w e l l a s a f f e c t handling cos t s . Fur the r , these p r i c e e f f e c t s may f a r outweigh any c o s t saving.
Although f u r t h e r research is required t o r e l a t e these r e s u l t s t o the s p e c i f i c circumstances of an ind iv idua l grower, t h i s paper represen t s an important s t e p i n developing improved methods of handling small c l assed l i n e s .
ANDY STOECKEL Director
Bureau of Agr icu l tu ra l ~conomics Canberra A.C.T.
May 1983

Foreword
Page
iii
1
1. Introduct ion
2. Methods of Offer ing Wool f o r Sa le a t Auction
3. Ef fec t s of Di f fe ren t Methods of Offer ing on Net Returns t o Growers
3.1 Marketing charges 3.2 Lot s i z e premiums 3.3 Discounts fo r untested wool 3.4 Discounts f o r i n t e r l o t t e d wool 3.5 E f f e c t of q u a l i t y averaging on growers1 r e t u r n s
from i n t e r l o t t i n g 3.6 An equ i ty problem
4. Analysis of Returns to a Grower from D i f f e r e n t Methods of Offering
4.1 The 1980-81 season 4.2 The 1979-80 season 4.3 E f f e c t of broker po l i cy on grower re tu rns
5. Weight of Wool a s a Measure of Line S ize
5.1 D i s t r i b u t i o n of ba le weight. 5.2 Impl icat ions of a weight measure
6 . Conclusions
Appendix: Dis t r ibu t ion of Bale Weights by the Number of Bales i n a Line
Glossary
Ref e r ences
Tables
1 Percentage of wool sold a s grower's brand l o t s , bulk-classed l o t s and i n t e r l o t s a t auct ion
2 Marketing charges for s e l l i n g a l i n e a s an untested l o t and the a d d i t i o n a l charges f o r s e l l i n g a l i n e a s p a r t of an i n t e r l o t or a s a t e s t e d l o t

Tables page
T a b l e
3 Differences in a grower 'S net return from sale of wool in an in ter lo t or as a tested grower's brand l o t as opposed to sa le as an untested grower's brand lot: 1980-81
4 Differences in a grower's net return from sale of wool in an in ter lo t or as a tested grower's brand l o t as opposed to sale as an untested grower's brand lo t : 1979-80
5 Bale weight distributions among l ines of up t o s ix bales for manual and power presses
Appendix Tables
T a b l e
A . l Range of weights in l ines of various sizes A.2 Number of sale l o t s and growers' lines: by the
number of bales in the lot/line: 1979-80
Figures
F i g u r e
1 Price reductions arising from interlott ing l ines of wool with different average f ibre diameter
2 Differences in prices arising from sell ing a l ine of wool as a grower's brand l o t as opposed to se l l ing as a part of an in ter lo t
3 Net extra grower returns from sell ing wool as a tested grower's brand l o t or part of an interlot as compared to sell ing as an untested grower's brand lo t : 1980-81
4 Net extra grower returns from sell ing wool as a tested grower's brand l o t or part of an in ter lo t as compared to sell ing as an untested grower ' S brand lo t : 1979-80

A REVIEW OF ISSUES I N THE MARKETING OF SMALL CLASSED LINES OF WOOL I N THE AUCTION SYSTEM
. About o n e - f i f t h o f the A u s t r a l i a n wool c l i p c o n s i s t s o f smal l c l a s s e d lines o f wool o f less t h a n f o u r b a l e s . The marke t i ng and hand l ing o f these small lines has l ong been a problem f o r the A u s t r a l i a n wool i n d u s t r y , l a r g e l y because o f the g r e a t e r marke t i ng c o s t per b a l e . In this paper, grower r e t u r n s f rom a1 t e r n a t i v e methods o f o f f e r i n g smal l c l a s s e d l i n e s o f wool f o r s a l e i n the a u c t i o n s y s t e m are rev iewed. These lines are either o f f e r e d s e p a r a t e l y in t e s t e d o r u n t e s t e d form o r a s p a r t s o f i n t e r l o t s . Fac tor s a f f e c t i n g r e t u r n s i n c l u d e d i f f e r e n c e s in b r o k e r s r charges , i n charges f o r t e s t i n g woo l , and i n marke t p r i c e s r e c e i v e d .
. A f u r t h e r f a c t o r a f f e c t i n g grower r e t u r n s from i n t e r l o t t i n g i s the e f f e c t t h a t combining lines o f d i f f e r e n t q u a l i t i e s (average f i b r e d i a m e t e r s ) h a s on the average p r i c e o f the combined lines. I t i s argued t h a t the combinat ion o f d i f f e r e n t q u a l i t y wool which o c c u r s i n i n t e r l o t t i n g w i l l r e s u l t , on average , i n lower p r i c e s t h a n i f the d i f f e r e n t lines were so ld s e p a r a t e l y . T h i s e f f e c t on the average p r i c e o f wool i n i n t e r l o t s h a s been termed a ' qua l i t y -averag ing l o s s ' .
. E s t i m a t e s were made o f the d i f f e r e n c e s i n marke t ing charges f o r the v a r i o u s methods o f o f f e r i n g and o f the qua l i t y -averag ing l o s s e s a r i s i n g f rom i n t e r l o t t i n g good top-making mer ino f l e e c e wool i n the 22-24 m ic ron range. These e s t i m a t e s were used i n c o n j u n c t i o n w i t h e s t i m a t e s o f marke t p r i c e d i f f e r e n c e s a s s o c i a t e d w i t h d i f f e r e n c e s i n l o t s i z e s and o f d i s c o u n t s f o r u n t e s t e d l o t s t o compare r e t u r n s from a l t e r n a t i v e methods o f o f f e r i n g c l a s s e d lines f o r s a l e . The a n a l y s i s was conducted f o r the 1979-80 and 1980-81 s e l l i n g seasons .
. At p r e s e n t , major b roker s have a p o l i c y o f i n t e r l o t t i n g a l l lines o f less t h a n f our b a l e s . T h i s p o l i c y was e s t i m a t e d t o have g i v e n c l o s e t o maximum r e t u r n s t o growers i n d i v i d u a l l y i n 1980-81 f o r broader s t y l e m e r i m f l e e c e wool. For 1979-80, however, i n d i v i d u a l growers o f this wool could have increased their net r e t u r n s b y up t o 5.2c/kg c l e a n i f t h e y had so ld their 3-bale lines a s s e p a r a t e l o t s r a t h e r t h a n a s p a r t s o f i n t e r l o t s .
. The most impor tant f a c t o r i n this d i f f e r e n c e be tween s easons was a change i n the level o f qua l i t y -averag ing l o s s e s . Other p r i c e d i f f e r e n c e s a s s o c i a t e d w i t h the method o f o f f e r i n g - such a s l o t s i z e premiums - a l s o change o v e r t i m e . While these l a t t e r changes were n o t cons idered i n the a n a l y s i s , t h e y could a l s o s u b s t a n t i a l l y i n f l u e n c e which method o f o f f e r i n g g i v e s a grower the h i g h e s t n e t r e t u r n a t any p a r t i c u l a r t i m e .
. Because the magni tudes o f these d i f f e r e n c e s change over t i m e and may d i f f e r among wool t y p e s , it may n o t be f e a s i b l e f o r b roker s t o change the s y s t e m o f wool hand l ing t o t a k e them f u l l y i n t o account . F u r t h e r , i f b r o k e r s d i d change the method o f o f f e r i n g these c l a s s e d lines f o r s a l e , their charges f o r the v a r i o u s services may change, a s may the magnitude

of the price differences considered i n this paper. As a consequence, the results presented may not be appropriate if widespread changes occur i n the methods of offering.
. Nevertheless, i n view of the e f fec t which the method of offering can have on net returns to growers, some steps to investigate ways to al low for these price differences would seem to be warranted. For example, development of a method of obtaining estimates of current average differences i n prices could be of assistance to growers and brokers i n sel ecti~lg the appropriate method of offering . . The possible e f fec t s of changing the measure of l ine size used by brokers from one based on the number of bales to one based on the weight of wool i n a l ine are also considered i n this paper. Although some increases i n grower returns could result, these were estimated to be small .

1. Introduction
Wool is genera l ly c lassed i n t o l i n e s with uniform c h a r a c t e r i s t i c s a t t h e time of shear ing. Typical ly , most wool is placed i n one or two main l i n e s , while t h e remainder forms a number of much smaller l i n e s . For mall f locks, breeding f locks or f locks of mixed breeds, a s u b s t a n t i a l proportion of the c l i p s may c o n s t i t u t e l i n e s of only a few bales . An i s sue which has long e x i s t e d i n t h e wool marketing system is how b e s t t o o f f e r these small l i n e s of wool for s a l e .
Because some marketing c o s t s a r e t h e same regardless of s a l e l o t s i z e (e.g. documentation, s a l e c o s t s , var ious s t o r e handling c o s t s and, t o a l a r g e ex ten t , t e s t i n g ) , brokers ' marketing c o s t s per ba le a re higher f o r smaller s a l e l o t s . S imi la r ly , some buyers' c o s t s a re t h e same f o r small l o t s a s f o r l a rger l o t s . For example, t h e c o s t of combining small l o t s post-sale fo r m i l l consignments would be g rea te r than f o r l a r g e r l o t s s ince more m a l l l o t s would be involved. To the ex ten t t h a t the brokers ' and buyers' c o s t s a re r e f l e c t e d i n charges and p r i c e s , ne t r e t u r n s t o growers may be increased i f t h e i r l i n e s can be combined be£ ore s a l e t o form la rger l o t s .
Various pre-sale lot -bui lding techniques have been developed whereby t h e smaller l i n e s from d i f f e r e n t growers a r e combined to form l a r g e r s a l e l o t s . Ef fec t ive ly , the re is a minimum s a l e l o t s i z e of four ba les fo r wool sold a t auction, with most s n a l l e r l i n e s automatically s u b j e c t t o lot-building. This minimum l o t s i z e has remained s u b s t a n t i a l l y unchanged s ince 1970 desp i te some changes i n lot -bui lding techniques (such a s t h e use of grab samples a s a bas i s fo r i n t e r l o t t i n g ) and an increase i n ba le e i g h t s . With these and other changes, it may be t h a t the cur ren t minimum l o t s i z e does not maximise grower re tu rns .
While growers' small l i n e s a re of t en t h e res idua l por t ion of c l i p s , they c o n s t i t u t e an important p a r t of t o t a l wool production. In 1980-81, s o m e 23 per cent of t h e wool sold a t auct ion was sub jec t to lot-bui lding while another 5 per cent was sold s e p a r a t e l y a s small l o t s . Consequently, s e l e c t i n g t h e method of o f f e r i n g which maximises re tu rns from t h e s a l e of t h i s wool could have an important bearing on the l e v e l of income of many growers.
The p u r p s e of t h i s paper is to examine a l t e r n a t i v e methods of o f f e r i n g small c lassed l i n e s f o r s a l e i n the auct ion system. Fac tors which a f f e c t r e t u r n s to growers from each of the methods a re discussed, and some p o s s i b i l i t i e s f o r increasing net re tu rns a re considered.
Section 2 o f the paper contains a review of p a s t and cur ren t methods of o f fe r ing classed l i n e s f o r s a l e . Addi t ional ly , changes i n technologies which may have a f fec ted comparative grower r e t u r n s from a l t e r n a t i v e techniques a re i d e n t i f i e d . The t h i r d s e c t i o n provides a review of t h e f a c t o r s inf luencing r e t u r n s to growers from the d i f f e r e n t marketing methods. Based on t h i s review, grower re tu rns £ran each method a r e compared fo r 1979-80 and 1980-81 i n sec t ion 4. Also considered a r e ga ins to growers which might a r i s e from changes i n cur ren t wool broker p o l i c i e s . F ina l ly , t h e e f f e c t of a l t e r i n g the measure of l i n e s i z e t o t h e weight of wool i n a l i n e is considered.
2. Methods of Offering W o o l for Sa le a t Auction
Wool received i n t h e auction system may be o f f e r e d f o r s a l e i n one of four ways. Evenly c lassed l i n e s may be sold a s individual growers' brand l o t s (with or without t e s t c e r t i f i c a t e s ) . Al te rna t ive ly , they may be combined with l i n e s of s imi la r wool from o ther growers to form an i n t e r l o t . With i n t e r l o t t i n g , t h e wool is sold i n its o r i g i n a l packs and the grower is paid according to the quan t i ty of h i s wool i n the i n t e r l o t . Unevenly c lassed l i n e s and l i n e s of less than one ba le may be bulk c lassed, whereby wool is removed from the bale, c lassed and repacked. The bulk-classing a1 t e r n a t i v e is not reviewed i n t h i s paper.
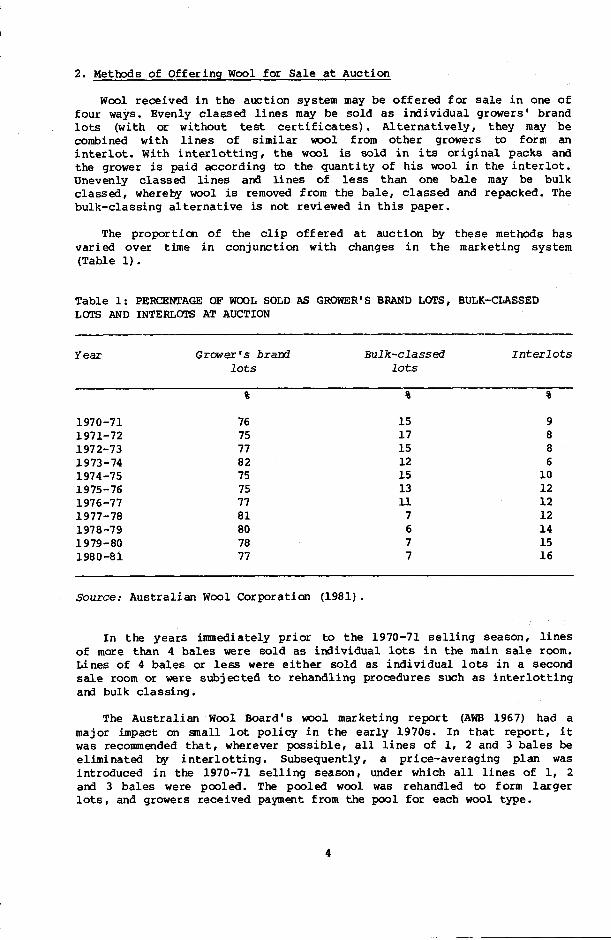
The proportion of the c l i p o f fe red a t auct ion by these methods has varied over time i n conjunction with changes i n t h e marketing system (Table 1).
Table 1: PERCENTAGE OF WOOL SOLD AS GROWER'S BRAND LOTS, BULK-CLASSED LOTS AND INTERLOTS AT AUCTION
Year Grower's brand Bulk-classed I n t e r 1 o t s l o t s l o t s
Source: Austra l ian Wool Corporation (1981) .
In the years immediately p r i o r t o t h e 1970-71 s e l l i n g season, l i n e s of more than 4 ba les were sold a s individual l o t s i n the main s a l e room. Lines of 4 ba les or less were e i t h e r sold a s ind iv idua l l o t s i n a second s a l e room or were subjected t o rehandling procedures such a s i n t e r l o t t i n g and bulk c lass ing .
The Austra l ian Wool Board's wool marketing repor t (AWE 1967) had a major impact on m a l l l o t pol icy i n t h e ea r ly 1970s. In t h a t repor t , it was recommended t h a t , wherever poss ib le , a l l l i n e s of 1, 2 and 3 ba les be eliminated by i n t e r l o t t i n g . Subsequently, a price-averaging plan was introduced i n the 1970-71 s e l l i n g season, under which a l l l i n e s of 1, 2 and 3 ba les were pooled. The pooled wool was rehandled t o form l a r g e r l o t s , and growers received payment from the pool f o r each wool type.
Four-bale l i n e s were sold a s individual l o t s i n the main s a l e room along with l a r g e r l o t s .
When the price-averaging plan was discontinued i n t h e 1973-74 season, 4-bale l i n e s continued to be sold a s ind iv idua l lots. The system of handl ing l i n e s of 1, 2 and 3 bales genera l ly rever ted t o t h a t which e x i s t e d p r i o r t o 1970-71, although s a l e l o t s of a l l s i z e s were sold i n the one room, with merino wool and crossbred wool sold i n separa te rooms. This change was associated with an increase from 77 per cen t t o 82 per cen t i n the percentage of wool o f fe red a s grower's brand l o t s , a s shown i n Table 1. In t h e following year , brokers i n some cen t res es tab l i shed
I j o i n t rehandling f a c i l i t i e s to reduce c o s t s , and the percentage of wool
o f fe red a s grower's brand l o t s f e l l back to 75 per cent.
The introduct ion of pre-sale t e s t i n g of wool i n 1972-73 permitted a major change i n marketing methods. Under s a l e by sample and ob jec t ive measurement, a core sample (of a t l e a s t 0.8 kg) and a g rab sample (4-5 kg) a r e taken from each s a l e l o t . Objective t e s t s on f i b r e diameter, y i e l d and vegetable matter a r e conducted on t h e core samples, and t h e r e s u l t s are displayed with the grab sample f o r buyer appra i sa l . Previously, whole bales were displayed, which e n t a i l e d moving these ba les onto t h e show f loor before s a l e , then of f t h e show f l o o r i n t o s to rage a f t e r sa le . Sa le by sample and ob jec t ive measurement a l s o enabled brokers to i n t e r l o t on the b a s i s of a sample from each bale , reducing t h e i r handling cos t s . The proportion of wool i n t e r l o t t e d has increased markedly s ince t h i s system was introduced i n 1975-76. A f u r t h e r inc rease i n t h e proportion i n t e r l o t t e d occurred with the establishment of co-operative rehandling f a c i l i t i e s i n severa l c e n t r e s , which f a c i l i t a t e d matching of l i n e s fo r i n t e r l o t t i n g .
I n 1977, t h e Limited Offer t o Purchase Scheme was introduced by t h e Aus t ra l i an Wool Corporation with t h e aim of demonstrating areas of c o s t saving i n wool handling. Under t h e Limited Offer t o Purchase Scheme, t h e minimum s i z e of l o t s sold by sample and ob jec t ive measurement was progressively reduced from 6 t o 3 bales . The scheme ceased opera t ing i n 1980 and was succeeded by t h e Wool Marketing Service. The Wool Marketing Scheme adopted a pol icy of s e l l i n g 3-bale l i n e s as t e s t e d grower's brand l o t s , with only l-bale and 2-bale l i n e s i n t e r l o t t e d or bulk c lassed.
Commercial brokers c u r r e n t l y o f f e r m a s t farm l i n e s of g rea te r than 3 ba les a s t es ted grower's brand l o t s , although a small proport ion cont inues to be s o l d untested. Uniformly c lassed l i n e s of t h r e e ba les or less a r e i n t e r l o t t e d where possible ; these l i n e s a r e sold separa te ly only i f the wool is d i f f i c u l t t o match, is a s p e c i a l t y type, o r by grower request. Brokers have indicated, however, t h a t decis ions on method of marketing a r e usual ly l e f t to the broker.
3. E f f e c t s of Di f fe ren t Methods of Offering on Net Returns t o Growers
A number of f a c t o r s may lead t o a grower's net r e t u r n d i f f e r i n g with t h e method of o f fe r ing . For example, brokers ' charges d i f f e r according t o t h e method of o f fe r ing , and a grower whose wool is sold a s a t e s t e d l o t must pay the charges of t h e Austra l ian Wool Test ing Authority. There may a l s o be d i f fe rences i n market p r i c e s associated with t h e method of o f fe r ing . This sec t ion contains a review of t h e f a c t o r s which may lead t o

differences in grower returns from sell ing a l ine of wool as a separate l o t , either tested or untested, or as a part of an in ter lo t .
3.1 Marketing Charges
The system and level of wool marketing charges di f fer among brokers. There are, however, general similari t ies in the system of charging among the major brokers. For example, major brokers se t both a rate per bale ard a percentage commission charge for a l l wool, with the rate per bale ltmer for larger sale lo ts .
Brokers use a different system of charging for tested lo t s than for untested lo t s . Per bale charges are generally lower for tested than untested lo t s , but brokers effectively charge for disposing of grab samples by retaining a proportion of the value of each sample. The Australian Wool Testing Authority also charges for its services with a se t charge per l o t tested. There is effectively a further charge to growers in that they receive no return for the value of the wool in the core sample.
Brokers also make a separate charge for in ter lo t t ing wool. This charge varies considerably even among major brokers, but a broker making a lawer charge than average would usually retain a higher proportion of the value of the grab sample taken f ram an in ter lo t .
A summary of the additional marketing charges for se l l ing a l ine as a tested grower's brand l o t or as an in ter lo t over and above the charges for se l l ing as an untested l o t is presented in Table 2 for the 1979-80 and 1980-81 seasons. The brokers1 charges used are based on those of a major Sydney woolbroker and are considered to be representative of charges a t that centre.
The charges for se l l ing l ines as untested lo t s were much lower than the charges for the other two options. In addition, the to ta l charge for marketing a l ine as a tested grower's brand l o t is greater than i f the line had been interlotted for l ines of up to 4 bales in both years.
The differences i n charges among the various methods of offering in Table 2 are l ikely to be representative of the differences in charges i n other major centres. However, i n smaller centres the to ta l charge for interlott ing is likely to be higher - due in part to the smaller size of in ter lo ts , resulting i n higher sample disposal charges. For example, in one smaller centre the to ta l of interlott ing charges was some lc/kg clean higher than shown in Table 2. On the basis of th is example, it seems that in ter lo t t ing is l ikely to result in relatively lower returns to growers i n smaller centres.
Further, the levels of charges w i l l differ among wool types. The charges presented i n Table 2 were calculated for 23 micron wool with a yield of 62 per cent. Because sample disposal costs are higher for wool which has a higher price or yield, the additional charges for in ter lo ts or tested grower 'S btand lo t s w i l l be higher for wool of these types. For example, the sample disposal costs for a 20 micron merino fleece wool of good topmaking quality would have been over 40 per cent higher in 1979-80 than the figures shown i n Table 2. Sample disposal costs for a 30
micron f l eece wool would, however, have been some 12 per cen t l e s s than i n Table 2.
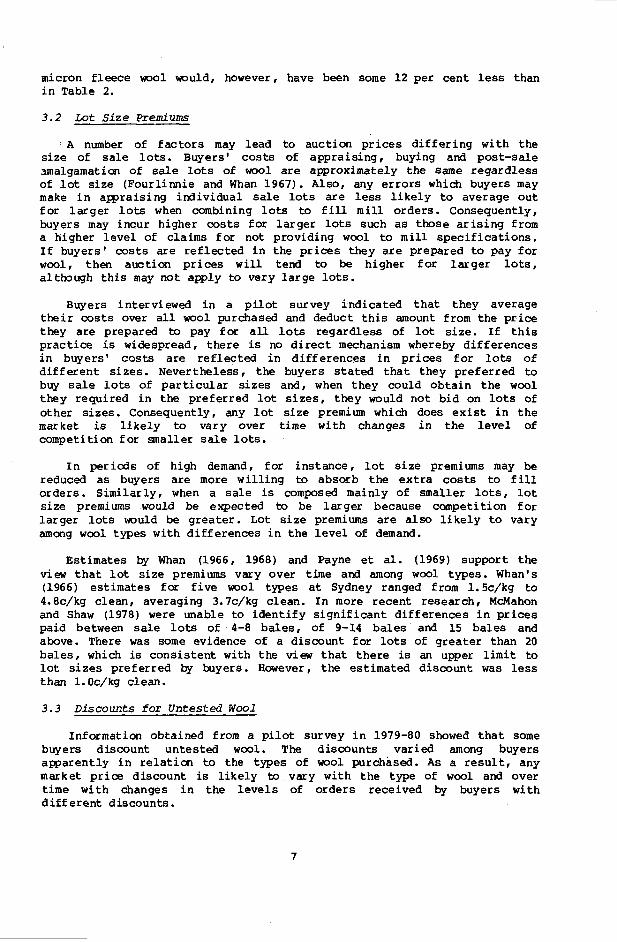
3.2 Lot S i z e Premiums
A number of f a c t o r s may lead t o auct ion p r i c e s d i f f e r i n g with the s i z e of s a l e l o t s . Buyers' c o s t s of apprais ing, buying and post-sale amalgamation of s a l e l o t s of wool a r e approximately t h e same regard less of l o t s i z e (Fourl innie and Whan 1967). Also, any e r r o r s which buyers may make i n apprais ing individual s a l e l o t s a r e less l i k e l y t o average o u t f o r l a r g e r l o t s when combining l o t s t o f i l l m i l l orders. Consequently, buyers may incur higher c o s t s f o r l a rger l o t s such a s those a r i s i n g from a higher l e v e l of claims f o r not providing wool t o m i l l s p e c i f i c a t i o n s . I f buyers' c o s t s a re re f lec ted i n the p r i c e s they a r e prepared t o pay f o r wool, then auction p r i c e s w i l l tend t o be higher f o r l a r g e r l o t s , although t h i s may not apply t o very l a r g e l o t s .
Buyers interviewed i n a p i l o t survey ind ica ted t h a t they average t h e i r c o s t s over a l l wool purchased and deduct t h i s amount from t h e p r i c e they a re prepared to pay f o r a l l l o t s regardless of l o t s i ze . I f t h i s p rac t i ce is widespread, the re is no d i r e c t mechanism whereby d i f f e r e n c e s i n buyers' c o s t s a r e re f lec ted i n d i f fe rences i n p r i c e s f o r l o t s of d i f f e r e n t s i z e s . Nevertheless, the buyers s t a t e d t h a t they pre fe r red t o buy s a l e l o t s of p a r t i c u l a r s i z e s and, when they could ob ta in t h e wool they required i n the preferred l o t s i z e s , they would not bid on l o t s of other s izes . Consequently, any l o t s i z e premium which does e x i s t i n t h e market is l i k e l y t o vary over t i m e with changes i n t h e l e v e l of competition f o r smaller s a l e l o t s .
I n per iods of high demand, f o r ins tance , l o t s i z e premiums may be reduced a s buyers a r e more wi l l ing to absorb t h e e x t r a c o s t s t o f i l l orders . Similar ly , when a s a l e is composed mainly of smaller l o t s , l o t s i z e premiums would be expected t o be l a r g e r because competit ion f o r l a rger l o t s would be g rea te r . Lot s i z e premiums a r e a l s o l i k e l y t o vary among wool types with d i f fe rences i n t h e l e v e l of demand.
Estimates by Whan (1966, 1968) and Payne et a l . (1969) support the view t h a t l o t s i z e premiums vary over time and among wool types. Whan's (1966) es t imates for f i v e wool types a t Sydney ranged from 1.5c/kg t o 4.8c/kg clean, averaging 3.7c/kg clean. I n more recent research, McMahon and Shaw (1978) were unable t o i d e n t i f y s i g n i f i c a n t d i f fe rences i n p r i c e s paid between s a l e l o t s of 4-8 ba les , of 9-14 ba les and 15 ba les and above. There was some evidence of a discount f o r l o t s of g rea te r than 20 ba les , which is cons i s ten t with the view t h a t t h e r e is an upper l i m i t t o l o t s i z e s preferred by buyers. However, the estimated discount was l e s s than l.Oc/kg clean.
3.3 Discounts f o r Untested Wool
Information obtained from a p i l o t survey i n 1979-80 showed t h a t some buyers discount untested wool. The discounts var ied among buyers apparent ly i n r e l a t i o n t o the types of wool purchased. A s a r e s u l t , any market p r i c e discount is l i k e l y to vary with t h e type of wool and over t ime with changes i n the l e v e l s of orders received by buyers with d i f f e r e n t discounts.

Table 2: MAIARKETING CHARGES FOR SELLING A LINE AS AN UNTESTED LOT AND THE ADDITIONAL CHARGES FOR SELLING A LINE AS PART OF AN INTERLOT OR AS A TESTED LOT(a)
Addi t ional charges Addi t ional charges f o r L i rae Untested f o r i n t e r l o t t i & a t e s t e d l o t s i z e l ot(b) I n t e r - Sample Test ing Sample
l o t t i n g d i sposa l To ta l (e) d i sposa l To ta l ( c ) (a) (f)
clean c lean c lean c lean c lean c lean c lean
1979-80 1 b a l e 14.81 3.34 1.43 4.78 16.67 3.81 20.48 2 b a l e s 14.81 3.34 1.43 4.78 7.80 1.90 9.70 3 b a l e s 14.81 3.34 1.43 4.78 4.84 1.30 6.15 4 b a l e s 14.81 3.34 1.43 4.78 3.36 .95 4.32 5 b a l e s 14.81 3.34 1.43 4.78 2.48 .76 3.24
1980-81(g) 1 b a l e 15.24 3.31 1.57 4.88 14.33 4.10 18.43 2 b a l e s 15.24 3.31 1.57 4.88 6.87 2.05 8.92 3 ba les 15.24 3.31 1.57 4.88 4.38 1.37 5.75 4 b a l e s 15.24 3.31 1.57 4.88 3.11 1.03 4.14 5 ba les 15.24 3.31 1.57 4.88 2.34 0.82 3.16
(a ) The charges used were t h o s e f o r a major Sydney broker. Charges per b a l e were converted to charges per kg (greasy) using t h e na t iona l average b a l e weights of 159.31 kg i n 1979-80 and 161.19 kg i n 1980-81 (Nat ional Council of Wool S e l l i n g Brokers 1981). These were then converted t o charges per kg (c lean) us ing a y i e l d of 62 per cent . (Because of t h e s e conversions, t o t a l s may not add due t o rounding). (b) Basic charges include warehousing, commission and insurance. P r i c e s used f o r c a l c u l a t i n g commission and insurance charges were t h e average c lean p r i c e f o r 23 micron merino f l e e c e wool f o r each season. These a r e 4OOc/kg (1979-80) and 436c/kg (1980-81). (c) The i n t e r l o t t i n g charge of $4.50/bale ( inc lud ing t e s t i n g charge) n e t of t h e d i f f e r e n c e i n warehousing charges f o r t e s t e d l o t s . (Warehousing charges f o r t e s t e d l o t s a r e $1.20 per b a l e l e s s than fo r untes ted l o t s ) . (d) Based on a core sample of 80 g/bale and a g r a b sample of 500 g/bale which a r e valued a t the average c lean p r i c e f o r 23 micron merino f l e e c e wool f o r each season (giving a t o t a l core sample of 800 g and a t o t a l grab sample of 5 kg f o r a 10-bale i n t e r l o t ) . ( e ) Aus t ra l i an Wool Tes t ing Author i ty t e s t charges n e t of t h e d i f f e r e n c e i n warehousing charges f o r t e s t e d l o t s ($1.20/bale). ( f ) Based on a core sample of 800 g / lo t and a g rab sample of 4.5 kg/lot . Brokers charge growers 25 per cent of t h e value of t h e g r a b sample f o r the cost of d i s p o s a l of the sample. This charge a l s o covers t h e wool tax (5 per c e n t ) , t h e promotion and research levy (3 per c e n t ) and commission (some 1.1 per cen t ) which would o the rwise be pa id by t h e grower, leaving a n e t charge of 15.9 per cen t of t h e value of t h e sample. (g) Brokers ' charges f o r 1980-81 were not r e a d i l y a v a i l a b l e a t t h e time of t h e a n a l y s i s and charges f o r 1979-80 were used ins tead. I n any event , t h e r e was l i t t l e change i n charges f o r the 1980-81 season.
An average discount for untested wool of lO.lc/kg (c lean) was found during a Bureau t r i a l undertaken i n t h e 1977-78 season. This discount var ied with the type of wool. For example, a discount of 10.4c/kg (c lean) was found f o r merino f l eece l i n e s , while t h e discount f o r crossbred f l e e c e l i n e s was found t o be 1.8c/kg ( c l e a n ) . ( l ) These es t imates a r e genera l ly cons i s ten t with the discounts reported by the buyers i n t h e p i l o t survey.
3.4 Discounts f o r I n t e r l o t t e d Wool
I n t e r l o t s con ta in wool from a number of growers and, a s a r e s u l t , a r e l i k e l y to have wool with a g r e a t e r d i v e r s i t y of c h a r a c t e r i s t i c s than wool so ld under a s i n g l e grower 'S brand. A g rea te r d i v e r s i t y may have a minor adverse e f f e c t on the processing performance of t h e wool (AWB 1972). Perhaps a more important fac to r aff e c t i n g p r i c e s , however, i s t h a t buyers may be less a b l e to accurate ly appra i se t h e wool, and have l e s s confidence i n the homogeneity of wool i n the i n t e r l o t a s represented by the d i sp lay sample. Both of these f a c t o r s may lead t o lower p r i c e s f o r i n t e r l o t s than for grower 'S brand l o t s .
The ex ten t of d i v e r s i t y of wool i n i n t e r l o t s is l i k e l y to vary according t o an i n t e r l o t t e r ' s consistency i n making appra i sa l s . I n add i t ion , i n t e r l o t t e r s sometimes combine l i n e s which a r e s l i g h t l y d i f f e r e n t but which make commercially acceptable i n t e r l o t s . This is more l i k e l y to occur with minor wool types. Discounts f o r i n t e r l o t t e d wool a r e the re fore l i k e l y t o vary between brokers and between wool types. Discounts are a l s o l i k e l y to vary over time. For example, i f competit ion is more intense, t h e discount may be reduced.
A s p a r t of t h e i r study of handling small c lassed l i n e s , McMahon and Shaw (1978) inves t iga ted the nature of p r i c e re la t ionsh ips between grower's brand l o t s and i n t e r l o t s . Using data from t h e f i r s t t en s a l e s of the 1976-77 season i n Sydney and Melbourne, they estimated t h a t t h e discount f o r pieces and b e l l i e s which were i n t e r l o t t e d was 7-8c/kg greasy (some 12c/kg clean) on average, while f o r f l e e c e types and carding wool no s i g n i f i c a n t p r i c e d i f fe rences were evident between i n t e r l o t t e d and grower's brand wool. There was, however, considerable v a r i a t i o n i n t h e observed discounts , and t h e authors were not a b l e t o s t a t e with c e r t a i n t y what the average discounts were for most of the wool type ca tegor ies . The 95 per cent confidence i n t e r v a l s were -22c/kg t o -2c/kg f o r pieces , -2Oc/kg to -lc/kg for b e l l i e s , -4c/kg t o 4c/kg f o r f l e e c e s and Oc/kg t o lOc/kg f a r cardings.
3.5 E f f e c t o f Qual i ty Averaging on Growers' Returns from I n t e r l o t t i n g
When i n t e r l o t t i n g , brokers genera l ly combine wool of s imi la r v i sua l appearance. However, v i sua l a p p r a i s a l of wool is of ten not a g o d guide t o the ob jec t ive measurements used by buyers t o value wool (AWB 1972). Consequently, it is l i k e l y t h a t wool i n i n t e r l o t s w i l l include l i n e s which, i f sold a s separate l o t s , would have brougrlt s u b s t a n t i a l l y
(1) This es t imate of the discount for untested wool may include some l o s s e s ar gains due to e r r o r s i n buyers' a p p r a i s a l s of wool. Termed quality-averaging l o s s e s and gains , these a r e explained i n more d e t a i l with re£ erence to i n t e r l o t t i n g a p p r a i s a l s i n s e c t i o n 3.5.
d i f f e r e n t p r ices . A major source of these p r i c e d i f fe rences is l i k e l y t o be f i b r e diameter, a s t h i s is t h e most important value-determining c h a r a c t e r i s t i c (Simmons 1980).
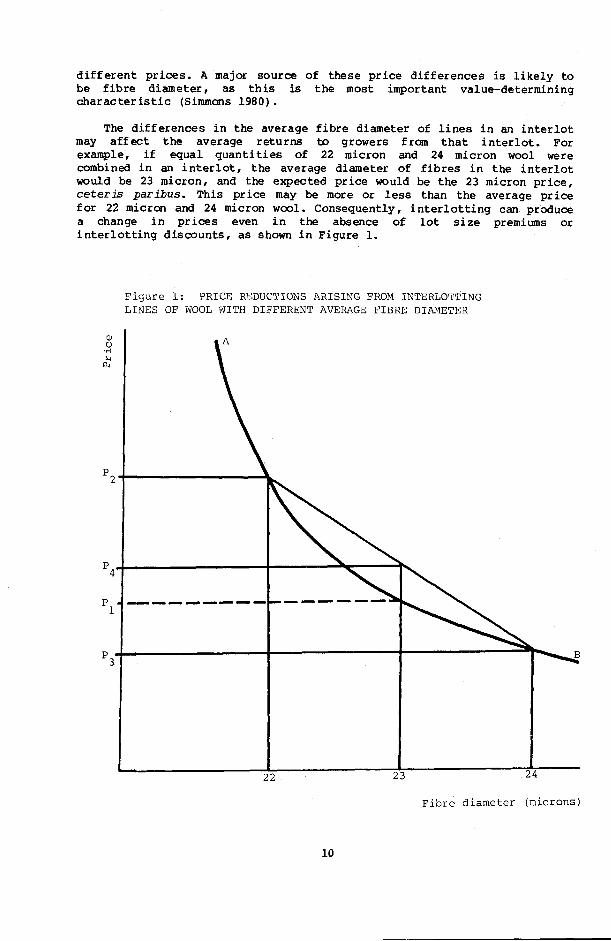
The d i f fe rences i n the average f i b r e diameter of l i n e s i n an i n t e r l o t may a f f e c t t h e average re tu rns to growers from t h a t i n t e r l o t . For example, i f equal q u a n t i t i e s of 22 micron and 24 micron wool were combined i n an i n t e r l o t , t h e average diameter of f i b r e s i n the i n t e r l o t would be 23 micron, and the expected p r ice would be t h e 23 micron p r i c e , ceteris paribus. This p r ice may be more o r l e s s than t h e average p r ice f o r 22 micron and 24 micron wool. Consequently, i n t e r l o t t i n g can produce a change i n p r i c e s even i n the absence of l o t s i z e premiums or i n t e r l o t t i n g discounts , a s shown i n Figure 1.
F i g u r e 1: PRICE REDUCTIONS ARISING FROM INTERLOTTING LINES OF WOOL WITH DIFFERENT AVERAGE FIBRE DIAMETER
F i b r e d i a m e t e r ( m i c r o n s )

I n t h i s f i g u r e , curve AB represen t s the r e l a t i o n s h i p between the p r i c e and t h e f i b r e diameter of wool. I f 22 micron and 24 micron wool were s o l d i n separa te s a l e l o t s , they would f e t c h p r i c e s P2 and P3, r espec t ive ly , o r an average of P4 = (P2+P3)/2. The same wool s o l d i n an i n t e r l o t would s e l l a t the p r i c e of t h e average f i b r e diameter ( i .e . 23 micron) or p r i c e P1 ( i n the absence of any l o t s i z e premium o r discount for i n t e r l o t t e d wool). A p r i c e reduct ion equivalent t o P4-P1 occurs , which can be termed a 'quali ty-averaging ' l o s s from i n t e r l o t t i n g . Simi la r ly , quality-averaging gains may occur i f the oppos i t e s i t u a t i o n e x i s t s , i . e . i f t h e 23 micron p r i c e were higher than t h e average of 22 micron and 24 micron p r i c e s .
l Quality-averaging ga ins a r e un l ike ly t o occur s i n c e buyers can, t o some e x t e n t , include wool of d i f f e r e n t f i b r e diameter i n a m i l l order , and t h i s m u l d tend t o l i m i t p r i c e s t o average or below. A s an extreme example, i f ind iv idua l l o t s of 22 micron wool could be purchased f o r , say 220c, and 24 micron w o l could be purchased f o r 200c, then buyers would genera l ly not pay more than 210c f o r 23 micron wool.
Var ia t ions among l i n e s i n an i n t e r l o t may be a t t r i b u t e d t o a p p r a i s a l e r r o r , commercial judgment i n combining l i n e s , and t h e type of wool. For ins tance, wi th some wool, v i s u a l appearance is no t a good i n d i c a t i o n of f i b r e diameter, and t h e r e f o r e wool which looks t h e same may t e s t d i f f e r e n t l y . Research by Hopkins and Whitely (1973) incorpora t ing comparisons between s u b j e c t i v e a p p r a i s a l s of s i x buyers i n four wool-sell ing c e n t r e s and ob jec t ive t e s t r e s u l t s f o r the same wool showed t h a t t h e mean d i f fe rence between s u b j e c t i v e and o b j e c t i v e es t imates was zero, wi th a s tandard dev ia t ion of 1.12 micron. Assuming a normal d i s t r i b u t i o n of the d i f f e r e n c e s , t h i s implies a mean abso lu te d i f f e r e n c e of 0.76 micron.
The magnitudes of quality-averaging l o s s e s were estimated f o r an i n t e r l o t of good topmaking merino f l e e c e comprising 1 b a l e of 22 micron wool, 2 b a l e s of 23 micron wool, and 1 b a l e of 24 micron wool. These a r e shown i n Figure 2. I n 1979-80, t h e l o s s e s ranged from 2.5c/kg c lean (January 1980) t o 11.5c/kg c lean (October 1979). The corresponding range f o r t h e 1980-81 season ( t o 30 Apr i l 1981) was -1.75c/kg c lean (March 1981) t o 4.75c/kg c lean (September 1980) . The mean l o s s e s were 6.60c/kg and 1.84c/kg c lean f o r t h e respec t ive seasons.
These quality-averaging l o s s e s appear t o vary ac ross wool types; i n p a r t i c u l a r , t h e l o s s e s a r e genera l ly smaller f o r f i n e r merino wool and coarser crossbred wool. While no d a t a were a v a i l a b l e f o r carding wool, any l o s s e s a re not expected be s i g n i f i c a n t , a s l eng th is of considerably more importance than f i b r e diameter i n determining processing per£ ormance f o r these types of wool.
3.6 An E q u i t y Problem
An equ i ty problem may a r i s e when the components of an i n t e r l o t a r e not of equal value per kilogram. Growers a re paid according t o the p r i c e received f o r the i n t e r l o t and the weight of wool i n t h e i r l i n e s which were combined t o form the i n t e r l o t . Consequently, growers whose l i n e s of wool a r e of a l e s s e r value per kilogram than the average w i l l be subsidised by those growers whose wool is of g r e a t e r value than t h e average. Since a r e l a t i v e l y smaller por t ion of a l a r g e c l i p w i l l be

F i g u r e 2 : DIFFERENCES IN PRICES ARISING FROM SELLING A LINE OF WOOL AS A GROWER'S BRAND LOT AS OPPOSED TO SELLING AS PART OF AN INTERLOT ( i n t e r l o t c o m p r i s i n g 1 p a r t 2 2 m i c r o n , 2 p a r t s 23 micron
and 1 p a r t 24 micron o f good top-making mer ino f l e e c e ) 0 12- \ h 9 0 11- P
PJ 1 0 , 3
9 - 8 -
I
7 - 6 -
5 - 4 -
3 - 2 - 1 -
\ 0
i- \V 1.hA,y d/p I 1
-1 - 1979-80 1980-81

s u b j e c t t o i n t e r l o t t i n g , t h i s equ i ty problem w i l l be more important f o r smaller growers.
The magnitude of the equ i ty problem can be i l l u s t r a t e d using Figure 1. I n t h e absence of any l o t s i z e premium, t h e d i s t r i b u t i o n of gains and l o s s e s to the respect ive owners of the 22 micron and 24 micron components is a s follows:
(a) the owner of 22 micron wool receives P1 ra ther than P2, a reduction i n p r i c e of P2-Pl;
(b) the awner of 24 micron wool receives P1 ra ther than P3, a p r i c e ga in of PI-P3.
Although i n t h i s case the re is an o v e r a l l l o s s i n producer revenue, the d i s t r i b u t i o n is such t h a t one grower makes a gain a t t h e expense of another. Fibre diameter has been used i n t h i s example t o represent q u a l i t y d i f fe rences , but c lean y ie ld may be of more importance i n t h e e q u i t y problem. For ins tance, t h e grower of high-yielding wool would be expected to l o s e , a s t h e buyer is paying a lower c lean equivalent p r i c e than he may have i f the wool had been sold separa te ly .
4. Analysis of Returns to a Grower from Di f fe ren t Methods of Offering
A s discussed i n the previous sec t ion , r e t u r n s to a grower from the var ious methods of o f f e r i n g classed l i n e s f o r s a l e a r e l i k e l y t o be d i f f e r e n t fo r d i f f e r e n t wool types and l i n e s i z e s . Fur ther , t h e d i f fe rences i n re tu rns may vary among cen t res and among brokers i n a cen t re . The fol lawing a n a l y s i s focuses on determining represen ta t ive d i f fe rences i n re tu rns among t h e various methods f o r each s i z e of l i n e . Only broader s t y l e good topmaking merino f l e e c e wool is considered i n d e t a i l , although same d i f fe rences f o r other wool types are b r i e f l y discussed.
The d i f fe rences i n r e t u r n s a re ca lcu la ted on the bas i s of charges made by one major broker i n Sydney (Table 2) but a re considered t o be broadly represen ta t ive of the d i f fe rences i n r e t u r n s i n other major centres .
Representative values f o r l o t s i z e premiums a r e d i f f i c u l t t o determine, a s t h e e f f e c t s vary according t o market conditions. I n t h e absence of any cur ren t es t imates , a range of h i s t o r i c a l es t imates has been used i n t h e analysis . The ana lys i s was performed both i n t h e absence of any l o t s i z e premiums and using a p r i c e premium f o r l o t s of more than four bales based on es t imates f o r f i v e d i f f e r e n t types of wool f o r t h e 1963-64 season. (2) The p r i c e d i f fe rences used ranged from 1.5c/kg t o
(2) Since 1963-64, the re have been l a r g e movements i n c o s t s , p a r t i c u l a r l y labour costs . However, because of a concurrent reduction i n labour inpu ts a s a r e s u l t of mechanisation and s a l e by sample and ob jec t ive measurement, it was decided t h a t indexing t h e p r i c e d i f fe rences forward t o 1980-81 would be inappropria te .
4. &/kg (clean), with a mean value of 3.7c/kg (clean) (Whan 1966) . These differences were used for both tested and untested grower's brand l o t s and inter lo ts .
The discount for untested wool estimated from the Bureau t r i a l of 10.4c/kg (clean) for merino fleece l ines was used. Because the buyers interviewed in the pi lo t survey during 1979-80 indicated that they did not differentiate between in ter lo ts and tested grower's brand l o t s in the discounts applied, th i s discount was considered to be representative for both in ter lo ts and tested lo ts .
No allowance was made for any price difference for interlotted wool since it was shown in the study by McMahon and Shaw (1978) that any difference for fleece wool was l ikely to be small. The quality-averaging losses reported in section 3.5 were used i n the analysis.
The differences in grower returns for the 1980-81 season are presented i n i t i a l l y as representative of current differences. The differences for the 1979-80 season are then presented to i l lus t ra te how changes i n market conditions can affect the possible net gains to growers from modifying broker policy on marketing classed lines. The potential for such modifications to be beneficial to the industry are then considered.
4.1 The 1980-81 Season
Table 3 contains deta i ls of the additional returns a grower may expect f ran sell ing wool either in an in ter lo t or separately as a tested grower's brand l o t rather than as an untested grower's brand l o t i n the 1980-81 season. The comparison is made for growers' lines of 1-5 bales.
According to Table 3, in ter lo t t ing is the most profitable alternative for l ines of 1 or 2 bales when m premiums for large l o t s occur. For l ines of 3 bales or more, higher returns would be expected i f l ines were sold separately in tested lo ts . If a l o t size premium of 3.7c/kg (clean) existed, however, returns would be greatest from interlott ing l ines of 1-4 bales.
These findings do not apply generally to a l l wool types. For instance, the discounts for untested wool are lower for other types of wool, as reported in section 3.3. Quality-averaging losses from interlott ing could also vary according to wool type.
Quality averaging depends on the appraiser's abi l i ty to match sublots accurately for interlott ing; l e ss variation i n wool quality i n an in ter lo t means that losses w i l l be less. Consequently, the returns from inter lo t t ing may vary among brokers. Further, the losses reported refer only to the 'average' or expected loss and do not apply equally to a l l growers (see section 3.6) .
Temporal variations in charges, price premiums and quality-averaging losses are likely to affect the results. The importance of these changes is demonstrated by repeating the analysis for the 1979-80 season.

Table 3: DIFFERENCES M A GROWER'S NET RETURN FROM SALE OF WOOL M AN INTERLOT OR AS A TESTED GROWER'S BRAND LOT AS OPPOSED TO SALE AS AN UNTESTED GROWER'S BRAND LOT: 1980-81
Di f fe rence i n S u b t r a c t Sub t rac t grower 's ne t r e t u r n
S a l e S i z e Premium a d d i t i o n a l qua l i ty - w i t h l o t s i z e met hod o f far t e s t e d marketing averaging premiums o f ( c )
l i n e wool charges(a) l o s s ( b ) Oc/kg 3.7c/kg
no. of c/ kg c/ kg c/kg c/kg c/ kg b a l e s c l ean c lean c lean c lean c lean
I n t e r l o t 1 10.40 4.88 1.84 3.68 7.38 Tested l o t 1 10.40 18.43 -8.03
I n t e r l o t 2 10.40 4.88 1.84 3.68 7.38 Tested l o t 2 10.40 8.92 1.48
I n t e r l o t 3 10.40 4.88 1.84 3.68 7.38 Tested l o t 3 10.40 5.75 4.65
I n t e r l o t 4 10.40 4.88 1.84 3.68 7.38 Tested lot 4 10.40 4.14 6.26
I n t e r l o t 5 10.40 4.88 1.84 3.68 3.68 Tested Lot 5 10.40 3.16 7.24
(a ) Analysis is based on Aus t ra l i an Wool Tes t ing Author i ty t e s t charges and t h e wool broker charges a s repor ted i n Table 2. (b) Quali ty-averaging loejses fo r an i n t e r l o t of 1 p a r t 22 micron, 2 p a r t s 23 micron and 1 p a r t 24 micron of good top-making merino f l eece . (c) Note t h a t l o t s i z e premiums do not apply t o t e s t e d l o t s or untes ted l o t s of 4 b a l e s and less. Lot s i z e premiums occur only where l i n e s of 4 b a l e s or l e s s a r e i n t e r l o t t e d t o form l a r g e r l o t s . A 5-bale l i n e was es t imated t o a t t r a c t a l o t s i z e premium regard less of t h e method of o f f e r i n g , so no l o t s i z e g a i n was imputed from i n t e r l o t t i n g these l i n e s .
4.2 The 1979-80 Season
A s shown i n Table 4, a grower 's ne t r e t u r n would have been higher i f no l i n e s were i n t e r l o t t e d i n t h e 1979-80 season, assuming t h a t l o t s i z e premiums were not paid. This outcome is due t o much higher l o s s e s t o i n t e r l o t t i n g f ran qual i ty-averaging e f f e c t s . Returns would have been maximised by s e l l i n g s ingle-bale l i n e s a s untes ted l o t s and l a r g e r l i n e s a s t e s t e d l o t s . If a l o t s i z e premium of 3.7c/kg (c lean) had e x i s t e d , i n t e r l o t t i n g would have been p r o f i t a b l e f o r l -bale and 2-bale l i n e s , whi le l a r g e r l i n e s would have been more p r o f i t a b l y so ld a s t e s t e d l o t s .
Again, t h e s e f i n d i n g s a r e v a r i a b l e over t ime and a c r o s s wool types. I n p a r t i c u l a r , qual i ty-averaging l o s s e s vary frcan week t o week, a s i l l u s t r a t e d i n Figure 2.

Table 4: DIFFERENCES I N A GROWER'S NET RETURN FROM SALE OF WOOL I N AN INmRLOT OR AS A TESTED GROWER'S BRAND LOT AS OPPOSED TO SALE AS AN UNTESTED GROWER'S BRAND LOT: 1979-80
Difference i n a Sub t rac t Sub t rac t grower Is ne t r e t u r n
S i z e Premium a d d i t i o n a l qua l i ty - wi th l o t s i z e S a l e o f for t e s t e d marketing averaging premiums o f m e t hod l i n e wool c o s t s l o s s
Oc/kg 3.7c/kg
no. of C/ kg c/kg c/ kg c/ kg C/ kg b a l e s c lean c lean c lean c lean c lean
I n t e r l o t a 10.40 4.78 6.60 -0.98 2.72 Tested l o t 1 10.40 20.48 -10.08 I n t e r l o t 2 10.40 4.78 6.60 -0.98 2.72 Tested l o t 2 10.40 9.70 0.70 I n t e r l o t 3 10.40 4.78 6.60 -0.98 2.72 Tested l o t 3 10.40 6 . l5 4.25
(a) The ana lys i s ou t l ined i n Table 3 is repeated f o r 1979-80 f o r l i n e s of 1, 2 and 3 bales .
4 - 3 E f f e c t o f Broker Policy on Grower Returns
Brokers c u r r e n t l y i n t e r l o t a l l l i n e s of 3 b a l e s or l e s s where poss ib le , unless growers request t h a t they be so ld a s ind iv idua l l o t s under t h e i r own brands. This po l i cy e f f e c t i v e l y imposes a minimum s a l e l o t s i z e of 4 bales . Where these m a l l l i n e s a r e not i n t e r l o t t e d , they a r e s o l d a s untested l o t s . This i n t e r l o t t i n g pol icy has been followed t o varying degrees s ince 1972-73 when the price-averaging plan ceased operat ion.
Any depar ture from t h i s pol icy f o r an ind iv idua l grower may r e s u l t i n d i f f e r e n c e s i n net r e t u r n s f o r t h a t grower, a s can be seen from Tables 3 and 4. I t is poss ib le t h a t any s u b s t a n t i a l change i n t h e method of o f f e r i n g wool f o r s a l e would lead to a change i n brokers ' charges and/or a change i n p r ice premiums/discounts for the var ious methods of off e r ing. I n t h e absence of any information on t h e l ike l ihood of such changes, v a r i a t i o n s i n re tu rns f o r one grower have been assumed t o be app l icab le t o a l l growers.
A s can be seen from Table 3, i n 1980-81 the pol icy of i n t e r l o t t i n g l i n e s of 1, 2 and 3 b a l e s is l i k e l y to have benef i ted growers of broader s t y l e good top-making merino f l eece . Some inc rease i n grower r e t u r n s may have been poss ib le i f 3-bale l i n e s were t e s t e d , given no l o t s i z e premiums. Hawever, i n 1979-80 (Table 4) g r e a t e r gains would have r e s u l t e d from a change i n i n t e r l o t t i n g pol icy. I n t h e absence of l o t s i z e premiums, growers would have received an a d d i t i o n a l 5.2c/kg c lean and 1.7c/kg c lean , r espec t ive ly , i f 3-bale and 2-bale l i n e s had been so ld a s t e s t e d l o t s r a the r than a s i n t e r l o t s . Also, a ga in of about l.Oc/kg would
have resu l ted from s e l l i n g s ingle-bale l i n e s untested r a t h e r than i n t e r l o t t i n g them.
The change i n grower re tu rns produced by a change i n broker pol icy on method of o f f e r i n g l i n e s of d i f f e r e n t s i z e s depends on which a l t e r n a t i v e marketing methods a r e being considered, a s w e l l a s on market conditions. F i r s t , t h e d i f fe rence i n grower re turns between s e l l i n g a s t e s t e d or untested grower's brand l o t s depends upon the p r i c e discount f o r untested wool and t h e charges f o r t e s t i n g wool. Since t e s t charges a r e made per s a l e l o t , growers' c o s t s per ba le of t e s t i n g inc rease with decreasing l o t
I s i ze . Consequently, t h e r e may be some s i z e of l o t below which grower re tu rns would be higher i f sold untested. Judging from Tables 3 and 4, t h i s s i z e appears to be two bales .
A s the proporticm of the c l i p so ld a s t e s t e d wool is now a t high and s t a b l e l e v e l s and charges f o r t e s t i n g wool seem to change l i t t l e over time, a broker pol icy of always t e s t i n g s a l e l o t s over a given s i z e would seem l i k e l y to come c lose t o maximising grower re turns . However, t h e ana lys i s i n sec t ion 3 i n d i c a t e s t h a t the p r i c e discounts f o r untested wool vary among wool types . Consequently, considerat ion could use fu l ly be given t o varying the s i z e of l o t s to be t e s t e d across wool types.
Second, d i f fe rences i n grower re tu rns between i n t e r l o t t i n g or s e l l i n g a s a t e s t e d grower 'S brand l o t w i l l vary with the s i z e of l i n e . The d i f fe rences w i l l depend on t h e i n t e r l o t t i n g pol icy. With t h e cur ren t pol icy of i n t e r l o t t i n g l i n e s up t o 3 ba les , an average ga in of l.Oc/kg clean would have been poss ib le i n t h e absence of any l o t s i z e premium i f 3-bale l i n e s had been so ld a s t es ted l o t s i n 1980-81. I f a l o t s i z e premium had e x i s t e d , it is l i k e l y t h a t gains would have occurred from i n t e r l o t t i n g 3-bale and even 4-bale l i n e s . Fur ther , quality-averaging l o s s e s a r e l i k e l y to d i f f e r f o r other wool types , and f o r many wool types i n t e r l o t t i n g may give the highest re tu rns fo r even l a r g e r l i n e s .
To maximise net re tu rns to growers, broker po l icy on i n t e r l o t t i n g would have t o vary over t i m e . For ins tance, on average, i n t e r l o t t i n g gave lower re tu rns to growers than i f l i n e s had been of fe red a s ind iv idua l l o t s i n 1979-80, whi le i n 1980-81, i n t e r l o t t i n g of l-bale and 2-bale l i n e s gave t h e highest re turns . However, a broader pol icy on i n t e r l o t t i n g which is sub jec t t o change over t ime could be d i f f i c u l t and expensive t o operate . In add i t ion , it would be necessary to develop a way of fo recas t ing changes i n quality-averaging l o s s e s i n order f o r such a f l e x i b l e pol icy to be e f f e c t i v e .
5. Weight of Wool a s a Measure of Line S ize
The maximum l i n e s i z e to be i n t e r l o t t e d is cur ren t ly determined by most brokers to be 3 bales . However, auct ion regu la t ions permit the weight of wool i n a ba le to range from 102 kg t o 204 kg, so t h a t a 3-bale l i n e may contain more wool than some 4-bale o r even 5-bale l i n e s . With the value to buyers of i n t e r l o t t i n g dependent upon t h e quan t i ty of wool ra ther than the number of bales i n each l i n e , t h e r e would seem to be some advantages i n using t h e weight of wool a s t h e measure of t h e maximum s i z e of l i n e to be i n t e r l o t t e d . This has been suggested within the indus t ry a t various times.
While many b e n e f i t s of i n t e r l o t t i n g a r e r e l a t e d t o the weight of wool, many of t h e charges f o r i n t e r l o t t i n g a re made on a per ba le bas i s . The p o t e n t i a l fo r the indus t ry t o b e n e f i t from a change t o a weight measure depends upon whether t h e ne t b e n e f i t s from i n t e r l o t t i n g a re more c l o s e l y r e l a t e d to the number of b a l e s or t o the weight of wool i n a l i n e . The e x t e n t of any such b e n e f i t s would depend on t h e d i s t r i b u t i o n of b a l e weights i n the c l i p .
5 .l D i s t r i b u t i o n of Bale We igh t s
L i t t l e information is a v a i l a b l e on t h e d i s t r i b u t i o n of ba le weights i n t h e c l i p . Some data have been co l l ec ted by researchers i n t h e Divis ion of T e x t i l e Physics , CSIRO, bu t these were inadequate f o r the purposes of t h i s ana lys i s . Ins tead, a d i s t r i b u t i o n of ba le weights was developed based on information obtained from the indus t ry on the l i m i t s t o the range of ba le weights which can be pressed on t h e farm.
Under the regu la t ions of the J o i n t Wool S e l l i n g Organisation, the weight of ba les sold a t auct ion must be g r e a t e r than 102 kg but l e s s than 204 kg. Within t h i s range, growers can reduce t h e i r c o s t s by packing t h e i r wml i n t o fewer ba les , thereby saving on woolpacks, t r anspor t charges , and brokers ' warehousing charges. The weight of wool which g ravers p r e s s i n t o ba les is r e l a t e d t o t h e type and y i e l d of wool and t h e type of p ress . The maximum weight of wool can be r e a d i l y achieved using modern hydraul ic power presses . High b a l e weights can a l s o be achieved f o r a l l wool types using manual p resses , p a r t i c u l a r l y f o r lower y ie ld ing wools. However, p r a c t i c a l cons ide ra t ions , such a s t h e time taken t o p r e s s wool, limit the ba le weights pressed t o some 190 kg of wool with a hydraul ic power p r e s s and some 150 kg on average with a manual p ress .
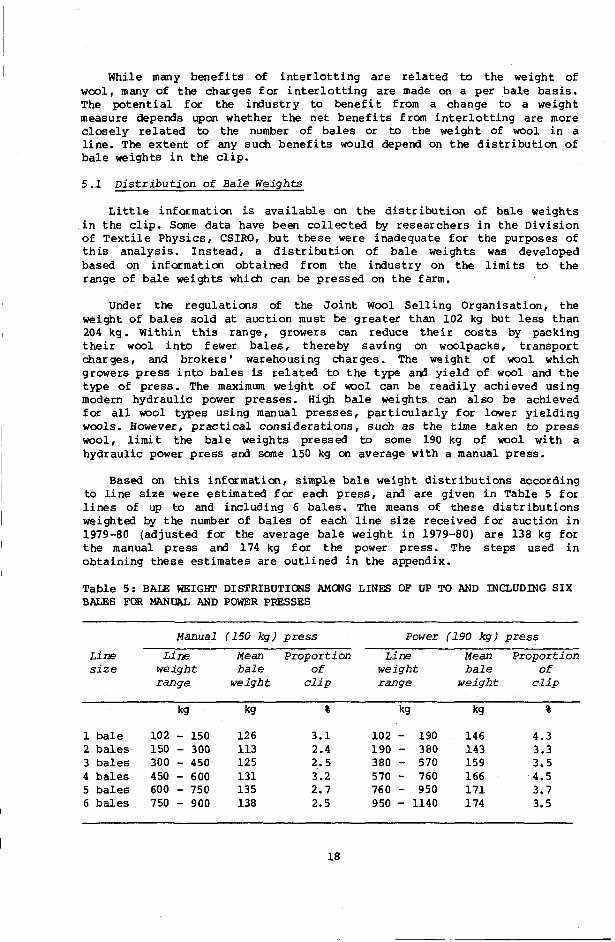
Based on t h i s information, simple b a l e weight d i s t r i b u t i o n s according t o l i n e s i z e were estimated f o r each p ress , and a re given i n Table 5 f o r l i n e s of up t o and including 6 bales . The means of these d i s t r i b u t i o n s weighted by t h e number of ba les of each l i n e s i z e received f o r auct ion i n 1979-80 (adjusted for the average b a l e weight i n 1979-80) a r e 138 kg f o r t h e manual p r e s s and 174 kg f o r the power press . The s t e p s used i n ob ta in ing these es t imates a r e ou t l ined i n the appendix.
Table 5 : BALE WEIGHT DISTRIBUTIONS AMONG LINES OF UP TO AND INCLUDING SIX BALES FOR MANUAL AND POWER PRESSES
Manual (150 kg) p r e s s Power (190 k g ) p r e s s
L i ne L ine Mean Propor t ion L ine Mean Propor t ion s i z e we igh t b a l e o f we igh t b a l e o f
range we igh t c l i p range w e i g h t c l i p
l b a l e 1 0 2 - 1 5 0 126 3.1 102 - 190 146 4.3 2 b a l e s 150 - 300 113 2.4 190 - 380 143 3.3 3 ba les 300 - 450 125 2,. 5 380 - 570 159 3.5 4 b a l e s 450 - 600 131 3.2 5 7 0 - 760 166 4.5 5 ba les 600 - 750 135 2.7 760 - 950 171 3.7 6 ba les 750 - 900 138 2.5 950 - 1140 174 3.5

These means conform well with the CSIRO d a t a , which i n d i c a t e t h a t , on average, t h e weight of ba les i n m a l l l i n e s is l e s s than i n l a r g e l i n e s , and the re a r e two d i s t r i b u t i o n s of b a l e weights - one with a mean of 140 kg and t h e other with a mean of 180 kg. The es t imated mean weight of ba les from the manual p ress is a l s o s imi la r t o the mean weight of ba les sold a t auct ion i n the e a r l y 1 9 7 0 ~ ~ when power p resses were l i t t l e used.
5.2 Implications of a Weight Measure
A graphical ana lys i s based on the d a t a used i n Table 3 and ba le weight d i s t r i b u t i o n s i n Table 5 is presented i n Figure 3. In cons t ruc t ing Figure 3, t h e weight ranges for each l i n e s i z e have been used r a t h e r than the average weight, a s i n Table 3. Thus, a single-bale l o t can weigh from 102 kg t o 204 kg, averaging 138 kg i n 1980-81, a s opposed t o the 161 kg average over a l l l i n e s used i n Table 3. The a d d i t i o n a l r e t u r n s from e i t h e r i n t e r l o t t i n g or s e l l i n g a s a t e s t e d grower's brand l o t over s e l l i n g a s an untested grower's brand l o t have been p lo t t ed .
The a d d i t i o n a l r e t u r n s from s e l l i n g a s a t e s t e d grower's brand l o t inc rease a t a decreasing r a t e with t h e weight of wool i n t h e l i n e (curve AB) . The r e t u r n s from i n t e r l o t t i n g i n c r e a s e wi th the weight of wool i n each l i n e , and a re represented i n Figure 3 a s a s e r i e s of over lapping curves. Each curve reaches a common maximum of about 4.5c/kg c lean .
The ana lys i s of Table 3 ind ica ted t h a t i n 1980-81, with no l o t s i z e premiums, grower r e t u r n s would have been h ighes t i f l i n e s of 3 b a l e s and more had a l l been sold a s t e s ted grower's brand l o t s . I n Figure 3, t h e i n t e r l o t curves fo r 3-bale l i n e s and l a r g e r a r e above the base l i n e f o r untested l o t s but below the t e s ted grower's brand l o t curve. This r e f l e c t s the higher r e t u r n t h a t growers would have received had l i n e s of 3 bales and more been sold a s t e s t e d grower's brand l o t s i n t h a t year .
A s imi la r ana lys i s can be appl ied t o the 1979-80 case . The r e s u l t s of the ana lys i s i n Table 4 were t h a t , i n 1979-80, l -bale l i n e s would have yie lded higher r e t u r n s to growers i f they had a l l been s o l d a s untes ted grower's brand l o t s , while re tu rns f o r l i n e s of 2 or more b a l e s would have been higher i f so ld a s t e s ted grower's brand l o t s . However, i t can be suggested from Figure 4 t h a t , on average, l i n e s weighing up t o 300 kg should be s o l d untes ted. The use of a weight measure of l i n e s i z e would the re fo re involve a gain represented a s t h e shaded area. An es t imate of these p o t e n t i a l gains t o growers was made by consider ing the q u a n t i t y of wool a f fec ted and t h e average c o s t saving. The c o s t saving was found t o average 2.87c/kg c lean fo r the 9.91 k t i n the l -bale and 2-bale l i n e s concerned, or some $285 000 i n t o t a l .
The magnitude of the gains from use of a weight measure of l i n e s i z e w i l l vary according to a number of f a c t o r s . For ins tance, gains would have occurred i n 1980-81 i f the re had been even a small l o t s i z e premium. The maximum poss ib le gain would have occurred i f t h e curve f o r i n t e r l o t t e d 3-bale lines had i n t e r s e c t e d the t e s t e d grower's brand l i n e a t a t o t a l weight of 433 kg, or 144 kg per ba le . This maximum gain would have occurred i f the re had been a l o t s i z e premium of some 0.7c/kg c lean . The inc rease i n grower re tu rns would have equal led 0.24c/kg c lean over 7.75 k t c l ean , or a t o t a l of $18 000.
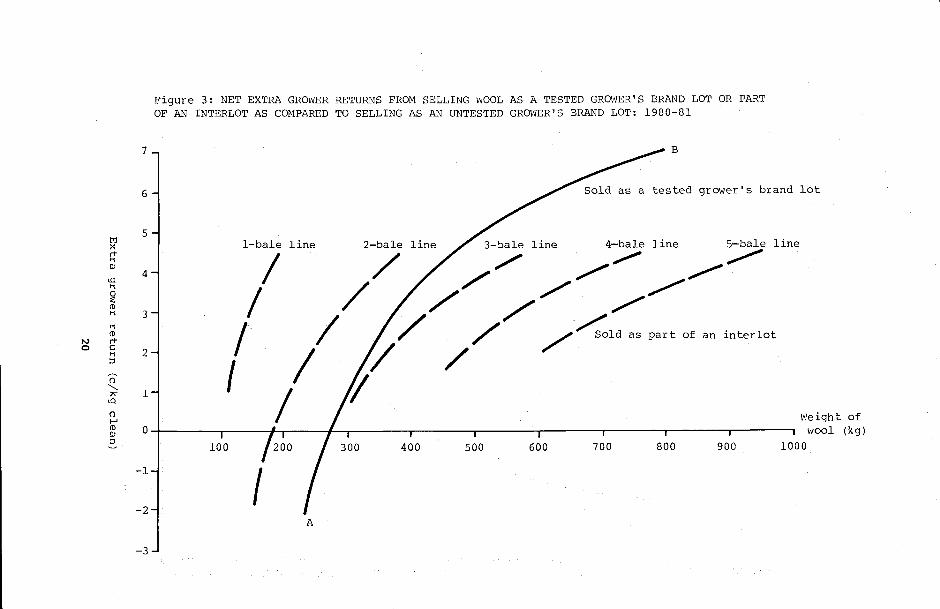
F i g u r e 3 : NET EXTRA GROWER RETURNS FROM S E L L I N G WOOL A S A TESTED GROWER'S BRAND LOT OR PART OF AN INTERLOT A S COMPARED T O S E L L I N G A S AN UNTESTED GROWER'S BRAND LOT: 1 9 8 0 - 8 1
7 -
6 -
l-bale l i n e 2 - b a l e l i n e 3-bale l i n e
3 - ri (D
N rr Sold a s p a r t of an i n t e r l o t 0 C
ri 2 - 3
cl
C1 W W e i g h t
-1 -
-2 - A
-3

Figure 4 : NET EXTRA GROWER RETURNS FROM SELLING WOOL AS A TESTED GROWER'S BRAND LOT OR PART OF AN INTERLOT AS COMPARED TO SELLING AS AN UNTESTED GROWER'S BRAND LOT : 1979-80
We igb wool
I Additional grower return from use of 1 weight of wool as a measure of line size -12
A
While grower r e t u r n s may be increased by using a weight measure of l i n e s i z e , the a d d i t i o n a l brokers ' c o s t s may be excessive. For example, brokers would have t o weigh the l i n e s a s they a r e received, which is cur ren t ly not a normal p r a c t i c e f o r a l l s t o r e s . The assoc ia ted c o s t s may exceed p o t e n t i a l ga ins p a r t i c u l a r l y f o r l i n e s of 3 ba les and more.
A f u r t h e r f a c t o r is t h e v a r i a t i o n i n average b a l e weights i n d i f f e r e n t l i n e s i z e s . For example, a s can be seen from the appendix, t h e average b a l e weights f o r 2-bale and 3-bale l i n e s a re estimated a s 130 kg and 144 kg, r espec t ive ly . These weights a r e s u b s t a n t i a l l y l e s s than t h e c l i p average weights used i n the c a l c u l a t i o n s reported i n Tables 3 and 4. Had these ba le weights been used, the conclusions to be drawn from Table 4 would have been d i f f e r e n t , with grower re tu rns maximised i f 2-bale l i n e s were s o l d a s untes ted grower's brand l o t s r a the r than a s t e s t e d grower's brand l o t s .
6. Conclusions
The cur ren t pol icy of wool brokers is t o e f f e c t i v e l y impose a minimum s a l e l o t s i z e by i n t e r l o t t i n g a l l c l assed l i n e s of 3 ba les and l e s s where possible . Where t h e s e l i n e s cannot be i n t e r l o t t e d , they a r e so ld a s untested grower's brand l o t s . This po l i cy resu l t ed i n growers receiving c l o s e t o the maximum re tu rns f o r broader s t y l e good topmaking merino f l e e c e i n 1980-81. Some minor inc reases i n r e t u r n s may have occurred had 3-bale l i n e s been s o l d a s t e s t e d l o t s .
However, i n 1979-80, grower re tu rns would have increased i f no wool of t h i s type had been i n t e r l o t t e d . On the bas i s of r e s u l t s obta ined, single-bale l i n e s should have been sold a s untes ted grower's brand l o t s and 2-bale and 3-bale lines a s t e s t e d grower 's brand l o t s . These conclusions a r e l i k e l y to be d i f f e r e n t f o r o ther wool types , p a r t i c u l a r l y i f buyers paid a premium f a r l a r g e r l o t s .
It is impract ical a t t h i s s t age to recommend any change t o t h e minimum l o t s i z e or the adoption of a v a r i a b l e one. However, it is c l e a r t h a t a uniform minimum l o t s i z e across a l l wool types and over time is un l ike ly t o maximise grower r e t u r n s . Brokers should assess the advantages of i n t e r l o t t i n g over s e l l i n g wool a s t e s t e d or untested l o t s i n t h e i r own s p e c i f i c circumstances.
While d i f fe rences i n average b a l e weights should be considered, i t is f a i r l y c l e a r t h a t a revised measure of l o t s i z e based on t h e weight of wool i n each l i n e would not be b e n e f i c i a l t o the industry . While some inc rease i n grower re tu rns would be poss ib le , these would be m a l l and a re l i k e l y t o be more than o f f s e t by the a d d i t i o n a l opera t ing c o s t s of brokers.
l Appendix
l DISTRIBUTION OF BALE WEIGHTS BY THE NUMBER OF BALES I N A LINE
1 A Introduct ion
Data co l l ec ted by the CSIRO Division of T e x t i l e Physics on the weight of wool per ba le i n t h e auct ion system a re c o n s i s t e n t with t h e r e being two d i s t r i b u t i o n s of ba les by weight, one with a mean of around 140 kg and t h e other with a mean of sane 180 kg. Fur the r , l i n e s with few ba les were found t o c o n s i s t of l i g h t e r ba les than l i n e s wi th more ba les .
The purpose of t h i s appendix is to es t imate the d i s t r i b u t i o n of b a l e weights by the number of ba les i n a l i n e , assuming t h a t growers w i l l pack a s much wool i n t o a ba le a s poss ib le .
A.2 Range of Weight by Number of Bales i n a Line
The regulat ions of t h e J o i n t Wool S e l l i n g Organisation permit growers t o pack ba les i n the range 102-204 kg. Although the maximum can be reached with any type of p ress , c o n t r a c t p r e s s e r s have ind ica ted t h a t p r a c t i c a l considerat ions l i m i t the weight of ba les to around 150 kg f o r manual p resses and around 190 kg f o r power p resses .
With t h e s e l i m i t a t i o n s i n mind, a range of l i n e weights has been ca lcu la ted f a r each s i z e of p ress and presented i n Table A . l . The a c t u a l q u a n t i t y of wool packed i n a l i n e of a given number of ba les w i l l depend on the q u a n t i t y of wool ava i l ab le . For example, a grower can pack 104-150 kg of wool i n a l -bale l i n e using a manual press . For q u a n t i t i e s above t h i s amount, a t l e a s t 2 ba les w i l l be required. Thus, t h e weight of a 2-bale l i n e may range from 150 kg t o 300 kg.
For, say, a 160 kg l i n e , the grower w i l l r equ i re 2 bales . I f equal q u a n t i t i e s a re placed i n each, then each w i l l weigh only 80 kg, f a r l e s s than t h e minimum s e t by t h e J o i n t Wool S e l l i n g Organisation. The d a t a c o l l e c t e d by CSIRO show t h a t the re a r e many underweight ba les , p a r t i c u l a r l y among small l i n e s . Consequently, t h e e x i s t e n c e of underweight bales has been accepted i n t h i s ana lys i s .
An ind iv idua l grower packing wool i n t o one b a l e with a manual p r e s s may have any q u a n t i t y i n the range 104-150 kg. I n t h e absence of information on these q u a n t i t i e s , each q u a n t i t y is considered equa l ly l i k e l y . On t h i s b a s i s , the average weight of ba les i n each l i n e s i z e is the mid-point of t h e range of weights. That is, f o r a l -bale l i n e t h e average is the mid-point of 102 kg and 150 kg, o r 126 kg. These averages a re a l s o included i n Table A.1.
A.3 Number of Lines by S ize of Line
Accepting the b a l e weights ca lcu la ted above, information is required on t h e number of l i n e s packed by each type of press . The Aus t ra l i an Wool Tes t ing Author i ty has c o l l a t e d information on a l l s a l e lots recorded by t h e Aus t ra l i an Wool Corporation. This information has been t abu la ted according to the number of ba les per l i n e and is presented i n Table A.2.

T a b l e A.l: RANGE OF WEIGHTS IN LINES OF VARIOUS SIZES
Size of Manual press Power press l ine Range of weight Average weight Range of weight Average weight
per bale per bale
1 b a l e 2 b a l e s 3 b a l e s 4 b a l e s 5 b a l e s 6 b a l e s 7 b a l e s 8 b a l e s 9 b a l e s 10 b a l e s
T a b l e A.2: NUMBER OF SAW LOTS AND GROWERS' LINES : BY THE NUMBER OF BALES I N THE LOT/LINE: 1979-80
Size of Number of sale l o t s Growers l ines l o t / l i n e Grower 's Bulk Interlot Number of Percentage
brand classed bales of total c l i p
1 b a l e 38 771 3 620 459 227 295 7.4 2 b a l e s 1 8 722 1 801 425 176 636 5.7 3 b a l e s 1 9 607 1 184 2 488 184 988 6.0 4 b a l e s 58 941 3 692 2 910 235 764 7.7 5 b a l e s 39 442 3 314 2 492 1 9 7 210 6.4 6 b a l e s 30 566 2 802 2 601 1 8 3 396 6.0 7 b a l e s 23 516 2 1 7 5 2 308 164 612 5.4 8 bales 1 8 326 1 717 1 868 146 608 4.8 9 b a l e s 14 506 1 334 2 332 130 554 4.2 1 0 b a l e s 11 979 1 492 2 223 1 1 9 790 3.9 11 b a l e s 9 704 1 061 1 670 106 744 3.5 1 2 b a l e s 8 084 759 1 389 97 008 3.1 13 b a l e s 6 803 680 1 237 88 517 2.9 1 4 b a l e s 5 784 52 9 1 077 80 976 2.6 1 5 b a l e s 4 865 528 918 72 975 2.4 1 6 b a l e s 4 218 407 784 67 488 2.2 1 7 b a l e s 3 719 3 30 7 50 63 223 2.1 1 8 b a l e s 3 1 5 1 272 757 56 718 1.8 1 9 b a l e s 2 804 212 967 53 276 1.7 20 b a l e s 2 632 188 944 52 640 1.7 21 b a l e s and over 20 225 1 174 5 460 568 508 18.5
This s a l e l o t information inc ludes d a t a on t h e number of i n t e r l o t s . Information on t h e composition of i n t e r l o t s which was obta ined by t h e Bureau dur ing an i n t e r l o t t i n g t r i a l i n Adelaide was used t o a l l o c a t e t h e b a l e s i n i n t e r l o t s i n t o growers' l i n e s of va r ious s i z e s . These growers' l i n e s were then added t o t h e growers' brand s a l e l o t s t o g i v e an es t ima te of t h e d i s t r i b u t i o n of growers ' l i n e s which is presented i n Table A.2.
l A.4 Propor t ions of Lines Packed on Manual and Power Presses
The p ropor t ion of l i n e s packed on each type of p r e s s was assumed t o be the same f o r a l l l i n e s i z e s . Using t h e average ba le weights i n Table A . l and t h e d i s t r i b u t i o n of growers' l i n e s i n Table A.2, t h e average b a l e weights were estimated t o be 138 kg f o r manual p r e s s e s and 174 kg f o r power p resses .
These average b a l e weights were used t o e s t ima te t h e propor t ion of wool packed on each p r e s s type t o be c o n s i s t e n t wi th t h e o v e r a l l average b a l e weights of 159 kg i n 1979-80 and 161 kg i n 1980-81. Including bulk-classed b a l e s a t t h e maximum weight of 190 kg g ives 53 per cen t of b a l e s packed on power p r e s s e s i n 1979-80 and 58 pe r c e n t packed on power p r e s s e s i n 1980-81.
GLOSSARY
Bulk classing:
Classed line:
Core smple:
Grab sample:
Grower's brand lot:
Interlotting:
The subjective amalgamation of a large number of small parcels of wool belonging to different growers into uniform l o t s of 4 bales or more, which are then sold under the brand of the classing house.
A parcel of wool of similar quality range prepared on farm according to c l i p preparation standards.
A small sample of wool which i s drawn by coring methods from a l o t or consignment of wool. This sample is used in making objective measurements.
A sample of wool (around 4-5 kg) drawn from baled wool by a grab sampling machine. This sample is subsequently displayed for wool buyer appraisal.
A parcel of wool from a single grower which is sold under that grower's brand name.
Subjectively matching classed l ines of wool from two or more growers for sa le as a single unit with the wool remaining i n the original bales.
Sale b y sample and Sale on the basis of a grab sample accompanied objective measurement: by objective measurements of yield, average
fibre diameter and the degree of vegetable faul t .
Small classed lines: Classed l ines of less than 4 bales.

REFERENCES
AWB (Austra l ian Wool Board) (19671, Report and Recommendations on Wool Marketing, Melbourne.
- (1972), Object ive Measurement of Wool i n A u s t r a l i a , Melbourne.
Aus t ra l i an Wool Corporation (1981), Aus t ra l i an Wool S a l e S t a t i s t i c s , Melbourne (and previous i s sues ) .
Fourl innie , J.P. and Whan, R.B. (1967), 'The in f luence of the s i z e of s a l e l o t s of wool on wool-buyers' c o s t s ' , Quar te r ly Review of Agr icu l tu ra l Economics 20 (3) , 154-9.
Hopkins, H.W. and Whitely, K.T. (1973), 'Subject ive and o b j e c t i v e es t imates of greasy wool. P a r t I: f i b r e diameter ' , Sect ion 11 i n Objective Measurement of Wool i n A u s t r a l i a , t e c h n i c a l r epor t by Aus t ra l i an Wool Corporat ion 's Object ive Measurement Pol icy Committee, Canberra.
McMahon, P.J. and Shaw, D.G. (1978), 'An a n a l y s i s of marketing small c l assed l i n e s of wool', Q u a r t e r l y Review of A g r i c u l t u r a l Economics 31 (1) , 51-60.
Naticmal Council of Wool S e l l i n g Brokers (1981), Wool Review, Sydney.
Payne, R.A., Rao, V.Y. and Whan, R.B. (1969), A Study of E f f e c t s of Lot S ize and Time of S e l l i n g on the Pr ice Paid f o r Type 62A wool so ld i n Sydney between 1964-65 and 1966-67, Research B u l l e t i n , Univers i ty of New England, Armi dale .
Simmcms, P. (1980), 'Determination of grade p r i c e s f o r wool', Review of Marketing and A g r i c u l t u r a l Economics 48 (l), 37-45.
Whan, R.B. (1966), 'Differences i n p r i c e s paid a t auct ion f o r big and s t a r l o t s of wool sold i n Sydney', Q u a r t e r l y Review of Agr icu l tu ra l Economics 19 ( 4 ) , 186-92.
- (1968), 'Factors inf luencing the p r i c e discount on s t a r l o t s of wool', Quar ter ly Review of A g r i c u l t u r a l Economics 21(3) , 158-66.

R8211 566 Cat. No. 83 0922 7