Embed Size (px)
Citation preview

Water Quality and Health Status in Kollam Municipality
M. K. P. Roy
Discussion Paper No. 56
Kerala Research Programme on Local Level DevelopmentCentre for Development Studies
Thiruvananthapuram

2
Water quality and health status inKollam Municipality
M. K. P. Roy
EnglishDiscussion Paper
Rights reservedFirst published 2004Editorial Board: Prof. P. R. Gopinathan Nair, H. ShajiPrinted at:Kerala Research Programme on Local Level DevelopmentPublished by:Dr K. N. Nair, Programme Co-ordinator,Kerala Research Programme on Local Level Development,Centre for Development StudiesPrasanth Nagar, UlloorThiruvananthapuramCover Design: Defacto Creations
ISBN No: 81-87621-59-5
Price: Rs 40US$ 5
KRPLLD 2004 0500 ENG

3
Contents
1 Introduction 5
2 Socio-economic status of households 8
3 Quality of drinking water: Physio-chemical andbacteriological characteristics 20
4 Health and sanitary status of households 38
5 Socio-economic and health status 44
6 Conclusion 53
References 55

4

5
Water Quality and Health Status in Kollam Municipality
M. K. P. Roy
1. Introduction
Several studies have indicated that household environment and quality of potable water playa significant role in the health status of the people of Kerala. Well water in several parts ofKerala is reported to be highly contaminated. Doubts have been cast even on the purity ofpiped water. Out-breaks of a series of water-borne diseases were reported from thicklypopulated areas of Kollam district in recent years, especially during rainy seasons. It is in thiscontext that the present investigation is made into the environmental conditions, quality ofpotable water and socio-economic conditions and health status of the population in the KollamMunicipality.
Objectives
The major objectives of the present study are the following:
(i) investigation into the factors related to the poor quality of drinking water in KollamMunicipality area; and
(ii) assessment of the impact of poor water quality on the health status of the localpopulation and the incidence of water-borne contagious diseases in the area.
Review of studies
The Report of Fifth Five-Year Plan (1974-’79) of Government of Kerala (GOK, 1974) revealedthat 99 percent of the panchayats in Kerala faced drinking water scarcity of varying durationand intensity. Soman (1981) observed that one-half to two-thirds of the households in Keralahad no protected water supply and sanitary latrines. Panikar and Soman (1984) studied thehealth status of Kerala and observed that diseases of gastro-intestinal system contribute tothe largest proportion of diseases.
Another study conducted by KSSP (1987) in Kuttanad, Kerala revealed that diseases like
ACKNOWLEDGEMENTS: I profusely thank Dr V. R. Prakasam, Reader, Department of EnvironmentalSciences, University of Kerala, Karyavattom for his valuable contribution and guidance as the Director ofthis project throughout the period of investigation. I express my gratitude to Ms V. Sulahha, Project Assistantand Research Fellow of Fatima Mata National College, Kollam for her sincere work on helping wateranalysis and data collection. I extend my gratitude to Achutha Menon Centre for Public Health Studies ofSCTIMST, Thiruvananthapuram and Centre for Development Studies, Thiruvananthapuram for their guidancein designing the household survey questionnaire. I owe a great deal to Dr K. N. Nair, Programme Co-ordinator of KRPLLD for his valuable guidance, kind encouragement, and criticism at every stages of thiswork.
M. K. P. Roy is Selection Grade Lecturer at Department of Zoology, St. Gregorios College, Kottarakara.

6
diarrhoea, dysentery, typhoid, worm infestations, and infectious hepatitis (jaundice) accountedfor 50 percent of illnesses. It was further observed that in half the area of Kuttanad, whichhad piped water supply, cases of water-borne diseases were significantly lower.
Aravindan (1989) documented that in Kerala, in spite of its high literacy andwidespread health services, the diarrhoeal mortality rate was high and pointed outthat Kollam district was one among the four districts with the highest rates of diarrhoealmortality in the state. Abhayambika, et al, (1989) who investigated the epidemiologicalfactors of diarrhoeal diseases in rural Kerala, observed that poor housing, lack ofprotected water supply and inadequate toilet facilities were the major risk factors inthe three southern districts of Kerala.
A study on the bacterial quality of water in selected wells in Kerala jointly conducted byKerala Water Authority and Kerala Pollution Control Board (KWA, 1991) showed that waterin none of the open wells investigated was safe for drinking. This was a startling observationbecause more than 50 percent of the population of Kerala used dug-well water for drinking.The study also indicated the need for a detailed investigation for finding out the factorsrelated to the deterioration of water quality in the state.
Kannan et al (1991) conducted a study in all the fourteen districts of Kerala on the healthstatus of rural households and reported that acute morbidity declines as the social and economicstatus of households rises due to fall in the incidence of infectious diseases. The studyfurther pointed out that the incidence of diarrhoea cases was more among persons usingpublic wells and public taps.
A study carried out by Soman et al (1991) in two localities of Thiruvananthapuram cityshowed that there was up to six times greater risk for many disease groups in the moreenvironmentally deprived area. It was also observed that only 3.5 percent of the householdshad safe drinking water in the environmentally deprived area compared to 53 percent for therest of the study area, the corresponding figures for toilet facilities being 25.9 percent and62.2 percent respectively.
Jalasandesh (1994) reported that Kerala is identified as the only place in the world with suchlarge numbers of open dug-wells. Further, it revealed that the density of dug-wells in coastalareas of Kerala is about 250 km2, 150 km2 in the midlands and 25 km2 in the highlands andthat there are totally three million wells in Kerala. Owing to poor environmental conditionsand unhygienic behavioural practices the wells get frequently contaminated; the incidence ofwater-borne diseases gets thereby aggravated.
Studies by Radhakrishnan et al (1996) on the bacteriological quality of water in the coastalvillage of Pulluvila (Kerala) showed that all the samples of dug-well water in the area werecoliform positive. The MPN values ranged from 41 to 1200/100ml. It was further recordedthat 20 wells out of 35 were located within a distance of 10 m from septic tank and 90percent of the people in the area defecated in open places.
A study conducted by Panicker et al (2000) in Kottayam municipality on the bacteriological

7
quality of various drinking water sources, indicated that almost all dug-well water sampleshad faecal coliform count much above the WHO standard. But chlorinated tap water samplesfrom Kottayam municipal area showed total absence of coliform organisms.
Komath et al (2000) observed the impact of solid waste disposal on ground-water quality inKozhikode, Kerala. Results of the study confirmed that open dumping of solid waste led tocontamination of ground water sources within the vicinity of dumping sites.
Pillai and Ouseph (2000) observed that more than half the Kerala population utilises dug-wells as the sole source of drinking water. They also stated that outbreaks of water-bornediseases were due to consumption of contaminated water from poorly protected wells.Temperature and rain were found to have a decisive role in the pathogen count. Further itwas seen that 0.2 –0.3 ppm free chlorine was found to be the optimum for disinfection ofthe open dug-wells for 3 to 4 days.
Calvert and Andersson (2000) observed that sanitation is very poor in the fishing villagesalong the cost of Kerala. Over 80 percent of the households have no latrines and at least 50percent obtained water from communal wells. Open-air defecation, which is the norm in thearea combined with poor hygiene and proximity of communal wells to pit-latrines, resultedin the contamination of most wells with coliform bacteria. The authors pointed out “peopledid not know that virtually all the wells in the villages were seriously contaminated withfaecal coliforms”.
The present study was carried out in two phases. The first phase consists of a detailedanalysis of physico-chemical and bacteriological characteristics of various water sources inthe area including domestic dug-wells, public dug-wells, tube-wells (KWA), municipal pipedwater supply (KWA), small public and private tap-water supplies and pond-water. The secondphase of the study comprises the investigation into the reasons for the poor water quality andits possible impact upon the health status of the people in the area through a householdsurvey.
The results of the study would help understand the actual position of fresh water sources,the nature and quality of water made available, the causes and implications of water qualityupon the health profile of the population in the study area. On the basis of the findings, a fewsuggestions are also made to improve the quality of water used for drinking and domesticpurposes in the study area.

8
2. Socio-economic Status of Households
Survey area
The survey was conducted in Kollam municipality of the State of Kerala, which has an areaof 18.48 sq.km and 36 wards. The total population of the Municipality according to the 1991Census was 139,717. Out of these, 19 wards were selected for household survey (Fig.1)based mainly on geographical and environmental characteristics. Geographically the studyarea is divisible into three zones: a marine zone, a brackish water zone and a fresh waterzone. The Lakshadweep sea bordered the north-western region of Kollam municipality (marinezone), the Ashtamudi kayal bordered the eastern part (brackish water zone) and the southernregion of the study area constituted the fresh water zone.
The municipal wards selected for the household survey were those in which the 18 watersampling stations were located. The main objective of the household survey was to analysethe impact of socio-economic and sanitary conditions on the quality of water used for drinkingand domestic purposes and to find out the relationship between the water quality and thehealth status of the people in the area, particularly water-borne morbidity.
Methodology
A household survey questionnaire was prepared after discussions with experts from theAchutha Menon the Centre for Public Health Studies of SCTIMST, Thiruvananthapuramand the Centre for Development Studies (CDS), Thiruvananthapuram. The random samplingmethod was adopted for the selection of households (National Family Health Survey-India,1992-1993 and Demographic Health Survey (DHS)-Macro International, 1997). A total of800 households from 19 wards of Kollam municipal area were randomly selected for the survey.
Data collection
The data were collected by trained interviewers. The help of epidemiological and environmentalexperts was sought in giving comprehensive training to interviewers for collecting accurateand reliable data. The data entry was carried out in Dbase III + and the data analysis wasdone in FoxPro programme.
Survey design
The survey was designed on a status-based approach, which consisted of collection of dataon socio-economic status, sanitary status, and health status of the residents of the area. Inaddition, the questionnaire was designed to obtain data on various drinking water sourcesalong with their accessibility, availability and potability.
Social status
The data collected on the social characteristics of the sample population comprised size andcomposition of the family, education and employment, age group and sex.

9
Economic status
The indicators for economic status of the area consisted of monthly expenditure, expenditureon housing quality reckoned in terms of roof, wall, and floor and floor area, occupation ofthe head of the household and assets and consumer durables. Since it was difficult to obtainthe actual monthly income of each household, data on monthly expenditure were consideredfor status identification. Most of the households, irrespective of rich and poor had less than10 cents of land. So the floor area of each household was considered more relevant than thetotal land area in terms of economic status. Occupation of the head of the household andpossession of household items such as water purifier, refrigerator, cooking range, washingmachine, water cooler/air cooler, water heater, water storage tank, air conditioner, telephone,computer, and vehicles (two wheelers, three wheelers and four wheelers) were also consideredfor socio-economic classification.
Thus based on these indicators, the people living in the municipal area were classified intofive socio-economic groups: very poor, somewhat poor, middle class, above middle classand rich. The first two groups fell in the category “Below Poverty line” (BPL). For socio-economic classification of households, the weights assigned were 0.35 for monthly expenditure,0.25 for education, 0.15 for housing (roof 0.05, floor 0.05 and wall 0.05), 0.10 for floorarea, 0.05 for occupation, 0.05 for household items and 0.05 for movable assets and consumerdurables. Weights for monthly expenditure, education and housing conditions were thoseadopted by earlier studies (KSSP, 1991). For the remaining indicators such as occupation,household items and moving properties, weights were assigned after discussions with groupsof 30 persons, and according to the weights assigned to the various characteristics as indicatedearlier.
Results and Discussion
Social status
Household/family particulars
Male population
It was observed that 25 percent of the male population belonged to the age group <14 years;60% belonged to the working age group 15-59 years and the rest 15 percent belonged to theage group above 60 years.
Female population
The age-wise distribution of females was almost entirely similar to that of males. It was seenthat 24 percent of female population belonged to <14 years group; 60 percent to the agegroup 15-59 whereas 16 percent belonged to above 60 years. It indicated that the populationsof both the sexes were equally represented.

10
Education
Educational qualification of the head of the family
The heads of the sample households were relatively well-educated, illiterates among thembeing less than one-eighth. Among the literates (88 percent), 18 percent had primary educationand 27 percent had secondary education. SSLC holders were 24 percent and those whocompleted pre-degree course were 6 percent. However, seven percent of the family headshad degrees and three percent had post-graduate qualification. Diploma holders were onepercent whereas MBBS/Engineering degree holders were two percent.
Educational qualification of the spouse
Illiterates constituted only 9 percent among the spouses of the heads of households; amongthem those with primary education came to 8 percent; those with secondary education were31 percent whereas SSLC holders were 27 percent. Further, 9 percent of spouses hadeducation up to the pre-degree level and 4 percent had degree qualification. Only 1 percent ofspouses were postgraduates or persons with professional qualification like MBBS/Engineeringdegree. In the matter of education, not much difference is observed between the spouses.
Educational qualification of children
All children in the age group 0-14, except those below the school-going age of 5 yearsattended school.
Job of the head of the family
It was found that 12 percent of the heads were government employees while 6 percent wereworking as doctors/engineers; 16 percent were found to be engaged in business; 37 percentas skilled labourers; 17 percent as manual workers; 9 percent without job as retired employees;2 percent working in private firms and 1 percent as politicians.
Job of spouses
It was noticed that 21 percent of the spouses were working as government employeeswhile 9 percent as doctors/engineers. The business group comprised 18 percent andthe skilled labour group 17 percent. The percentage of manual labour was recordedas 19 percent whereas that of retired employees as 10 percent. Further it was noticedthat 6 percent of spouses were working in private firms.
Job of children
Nine percent of children belonged to the group of Government employees; 5 percent belongedto those of professionals like doctors, engineers and the like; 13 percent to business groupsand 50 percent to skilled labourers. Further, 18 percent of children in the study area belongedto the manual labourer group and 5 percent to the group of workers in private firms.

11
Figure 2.1 Male population - Kollam Municipal area
Figure 2.2 Female population - Kollam Municipal area
Figure 2.3 Head of the family - Educational qualification

12
Figure 2.4 Spouse - Qualification
Figure 2.5 Children - Education
Figure 2.6 Head of the family - Job

13
Figure 2.7 Spouse - Job
Figure 2.8 Children - Job
Figure 2.9 Land holding

14
Economic status
Land holding
Eighty-six percent of households (686 out of 800 households) possessed land area up to 10cents each while only 2 percent of households were recorded as landless; 11 percent possessed11-50 cents, whereas only 1 percent was noticed with land area of 51-250 cents. Only 3households possessed more than 251 cents.
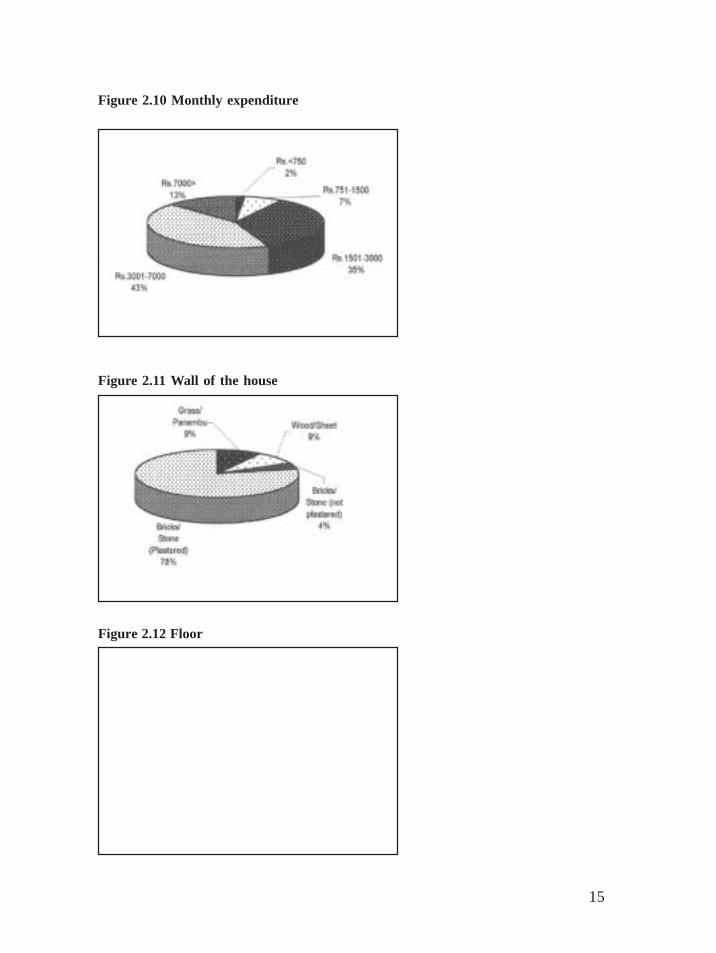
Monthly expenditure
Since it was difficult to collect data on the actual income of families, the expenditureof the households was taken into account as an index of their economic status.People with a monthly expenditure Rs <750 were estimated to be 2 percent. In Rs751-1500 category, there were 7 percent. The next group, which consisted of 35percent, spent Rs 1501-3000. In Rs 3001-7000 group, recorded with the highestpercentage of 43 percent. Thirteen per cent of households registered with the monthlyexpenditure of Rs 7000>. The five groups based on their monthly expenditure werecalled very poor, somewhat poor, middle class, above middle class and rich. Basedon monthly expenditure, most of the people in the study area were under eithermiddle class or above middle class.
House details
Roof of the house
It was recorded that 8 percent of houses were with grass/thatch roof; 17 percent with sheet;40 percent with tiles; 7 percent with a combination of tiles and concrete whereas 28 percentwith concrete roof. It was significant to notice that roofs of the majority of the householdswere made up of tiles of traditional Kerala style.
Wall of the house
It was observed that 9 percent of the walls of the sample households were with grass/panambu; 9 percent with wood or sheet; 4 percent with non-plastered wall of bricks andstone and 78 percent with plastered wall of bricks and stone.
Floor of the house
Only 2 percent of floors were with mud or cow dung whereas cement floor was recordedwith 81 percent; a combination of cement and mosaic was found with 4 percent; mosaicfloor alone with 11 percent and with marble and granite floor with 2 percent. It was significantto notice that although 8-9 percent of the houses were with grass/thatch roofs and wallswith grass/panambu, only 2 percent were with cow dung floors. It showed that evenpoor people of the area preferred cement flooring.
15
Figure 2.10 Monthly expenditure
Figure 2.11 Wall of the house
Figure 2.12 Floor

16
Figure 2.13 Number of floors
Figure 2.14 Floor area (sq.ft)
Figure 2.15 Moving properties

17
Figure 2.16 Household items
Figure 2.17 Socio-economic classification of households of Kollam municipality
Figure 2.18 Type of piped water supply

18
Number of floors
It may be seen that 91 percent of households had only one floor; 9 percent had two floors.
Floor area
Forty percent of houses were with less than 200 sq.ft. floor area while 17 percent had floorarea of 201-500 sq.ft.; in 13 percent of the households, it was in the range of 501-1000sq.ft. and another 13 percent had 1001-1500 sq.ft. Further it was estimated that 17 percentof houses were with floor area of > 1500 sq.ft.
Household belongings
Moving properties
It was recorded that 62 percent of the households possessed bicycle/pull cart/countrycanoe(nadan vallom) while 24 percent possessed motor cycle/scooter; 3 percent had autorickshaw/motor vallom; 1 percent had mini lorry/car/jeep/mini bus used as taxi and 10 percentwith private car/jeep and other heavy vehicles.
Household items
It was noticed that 2 percent of households possessed water purifiers; 16 percent refrigerator;4 percent washing machine and water heater; and 34 percent television. Telephone was usedby 13 percent and computer by 1 percent of the population. Further, 15 percent possessedwater storage tank and 11 percent owned flush toilet.

19
Soc
io-
econ
omic
st
atus
(S
ES
)
Exp
end
itu
re
NH
H
%
Ed
uca
tion
N
HH
%
Jo
b
NH
H
%
Hou
seh
old
item
s N
HH
%
S
ES
1
S
ES
2
S
ES
3
S
ES
4
S
ES
5
1.
6%
7.0%
35.4
% 43
.0%
10
4
13.0
%
11.8
%
17.5
%
27.8
%
29.5
%
10
8
13.5
%
22.1
% 13
.4%
37.8
% 9.
6%
13
7
17.1
%
23.4
% 7.
9% 6.
8% 7.
6%
142
17
.8%
T
otal
80
0
100
%
80
0
100
%
80
0
100
%
50
7
63.4
%
Tab
le1
2.1
Soc
io-e
cono
mic
sta
tus
of h
ouse
hold
s of
Kol
lam
mun
icip
alit
y, b
ased
on
indi
cato
rs f
or w
hich
wei
ghts
wer
e
assi
gned
(SE
S =
Soci
o-ec
onom
ic s
tatu
s; N
HH
= N
o. o
f ho
useh
olds
)
Soci
o-ec
onom
ic s
tatu
sN
umbe
r of
Per
cent
age
ofof
hou
seho
lds
hou
seh
old
s e
ach
grou
pS
ES
1
( V
ery
poor
)81
10.1
%S
ES
2
( S
omew
hat
poor
)27
334
.1%
SE
S 3
(M
iddl
e cl
ass)
210
26.3
%S
ES
4 (
Abo
ve m
iddl
e cl
ass)
135
16.9
%S
ES
5
( R
ich)
101
12.6
% T
otal
800
100%
Tab
le 2
.2
Soc
io-e
cono
mic
sta
tus
of h
ouse
hold
s of
Kol
lam
mun
icip
alit
y: N
umbe
r an
d pe
rcen
tage
of
hous
ehol
ds

20
3. Quality of Drinking Water: Physio-chemical and bacteriological characteristics
Method of analysis
The quality of drinking water was analysed in terms of colour, hydrogen ion concentration,turbidity, total alkinity, total dissolved solids, chloride, total hardness, fluoride, iron, coliformsand residual chlorine.
(i) Colour: Colour of water sample was determined by Platinum-cobalt method (APHA,1985) in which visual comparison with known colour standards was made. Colour standardsand reagents were prepared as per details mentioned in APHA (1985). It was based on thecalculation that one colour unit of the standard is equivalent to the colour produced by 1mg/l of platinum.
(ii) Hydrogen ion concentration (pH) : pH is the measure of the relative acidity oralkalinity and it represents the negative logarithm of the concentration of free hydrogen ionsin a solution. Scale of pH ranges from 0 to 14 with 7 as neutral; below and above this range;it is acidic or alkaline respectively.
In this method, pH of water was measured by electrometric method (APHA, 1985).
(iii) Turbidity: Turbidity of water is an expression of optical property in which the lightis scattered by the particles present in the water. It includes clay, silt, organic and inorganicmatter, soluble coloured organic compounds, phytoplankton and other microscopic organisms.The scattering of the light is proportional to the turbidity. Turbidity was determined byNephelometric method. The turbidity suspension was prepared as per standard procedure(APHA, 1985)
(iv) Total Alkalinity: Alkalinity of water is a measure of its capacity to neutraliseacids. It is due to the salts of carbonate, bicarbonate, borate, silicate and phosphatetogether with the hydroxyl ions in free state. In natural waters, the major portion ofthe alkalinity is caused by hydroxide, carbonate and bicarbonate that may be rankedin order of their association with high pH values. Titrimetric method was used forthe determination of total alkalinity.
(v) Total Dissolved Solids (TDS): Total dissolved solids (TDS) in water are the residuesleft after evaporation of the filtered sample. It was determined by the evaporation method offiltered sample followed by gravimetric analysis.
(vi) Chloride: Chloride was estimated by Mohr’s titration method. In this method,chloride is titrated with silver nitrate in the presence of potassium chromate to form a veryslightly soluble white precipitate of AgCl. The brick-red silver chromate was formed at theend point owing to the reaction of a slight excess of silver nitrate with potassium chromate.Reagents were prepared as per Adoni (1985).

21
(vii) Total hardness: Hardness of water is mainly due to the calcium and magnesiumions present in it. It is imparted by the calcium and magnesium ions, which are in combinationwith bicarbonates and carbonates apart from sulphates, chlorides and nitrates. Total hardnesswas estimated by EDTA Titrimetric method (APHA, 1985).
Reagents were prepared as per APHA (1985)
(viii) Fluoride : Excess fluoride ions in water supplies are known to damage teeth, skeletonand other organs of the human body. High concentration of fluoride causes dental fluorosis.BIS mentions the permissible upper limit as 1mg/l. Fluoride was determined by SPADNSmethod (APHA, 1985)
(ix) Iron : Phenonthroline method was used to determine the concentration of iron (APHA,1985). Iron occurs in natural waters both in oxidised (ferric) and reduced (ferrous) states.All the iron is converted into ferrous state by boiling with hydrochloric acid and hydroxylamine.The reduced iron chelates with 1,10-phenonthroline at pH 3.2 to 3.3 to form a complex oforange-red colour. Intensity of this colour is proportional to the concentration of iron.
(x) Coliforms
Multiple-tube fermentation technique: Multiple tube fermentation technique is widelyin use due to its applicability to almost all kinds of waters. The technique involves inoculatingthe sample in a suitable liquid medium. After the expiry of the incubation period, the tubes areexamined for gas production by the coliform organisms. This presumptive test is followedby confirmatory test for the positive tubes. (APHA, 1985).
(xi) Residual chlorine: The chlorination of water supplies serves primarily to destroy ordeactivate disease-producing micro-organisms. Presence of excess chlorine intensifies thetaste and odour of water. Though chlorine is widely used as water disinfectant, it can alsoproduce chlorinated organic by-products in water. Orthotolidine test was used to estimatethe residual chlorine in water (PHED, 1984).
Sampling stations
The list of selected sampling stations is given in Table 1.
a. Domestic dug-wells
(i) Well No. 1 (Ward No.8 – Pattathanam West): This well is located in a thicklypopulated (railway colony) area. More than 10 families of this area used this well for drinkingand domestic purposes. It is provided with a platform and protective wall. Soil type of thewell is sandy. Waterlogging is found all around the well. The well is located in the fresh-water zone.
(ii) Well No.2 (Ward No. 7 – Asramam South): On this well in the Kollam municipalarea several families and commercial establishments of that area depend for drinking water

22
purposes. The well is built with a platform along with a protective wall. A latrine is locatedwithin 2 m from the well. This domestic dug-well is located in the fresh water zone.
Table 1 List of Selected Sampling Stations
(iii) Well No.3 (Ward No.23-Kottakkakom): This well is located about 50 metersaway from the Kollam thodu (T-S canal). Though it is a privately-owned well severalfamilies in the locality and shops and establishments use its water for drinking and domesticpurposes. The water level was almost that of the canal. The well is built with protective walloutside and rings inside. The well is located in the brackish water zone.
(iv) Well No.4 (Ward No. 12-Mundakkal Middle):This privately-owned well issurrounded by visible pollution sources such as latrine, domestic animal waste and othersolid wastes. There is no protective wall for the well. More than five families use this watersource for drinking and other domestic purposes. This well is located in the fresh water zoneof Kollam municipal area.
Well I Domestic Dug-wellsNo.1 Pattathanam West (Ward No.8)2 Asramam South (Ward No.7)3 Kottakkom (Ward No.23)4 Mundakkal Middle (Ward No.12)5 Pattathanam East (Ward No.9)6 Palace Ward (Ward No.24)
II Public Dug-wells1 Pallithottam Church Well (Ward No.19)2 Thangassery Library Well (Ward No.30)
III Tube Wells1 Vadakkumbhagom - District Hospital) (Ward No.16)2 Thevally – NCC Office (Ward No.25)
IV Municipal Tap-water Supply (KWA)1 Pallithottam (Ward No.20)2 Vady (Ward No.21)3 Kottakkakom, Iron Bridge (Ward No.23)4 Vadakkumbhagom (Ward No.16)
V Small Water Supplies1 Cantonment North, Kollam Central Rly Station (Ward No.15)2 Pattathanam West, FMN College (Ward No.8)
V Ponds1 Kottarakkulam, Cutchery Ward (Ward No.26)2 Cherukulam, Punthole South (Ward No.31)

23
Figure 3.1 Kollam municipal area

24
(v) Well No.5 (Ward No. 9-Pattathanam East): This is a privately-owned well; it isprovided with all protective measures like elevated platform, protective wall (speciallyconstructed aprons), rings within the well and net covering with net. The well is located ina residential area and the households in the vicinity around belonged to the upper socio-economic stratum. The well is located in the fresh water zone.
(vi) Well No. 6 (Ward No.24- Palace Ward): The well is located in the brackish waterzone. It is provided with protective wall and net covering. It is owned by a householdbelonging to the middle-income group.
b. Public dug-wells
(i) Well No. 1 (Ward No.19-Church well, Pallithottam): This well belonging to theLatin Catholic Church and located in the coastal area of Pallithottam (in the marine zone) isused by the local fishermen community. This well is provided with platform and a protective wall.About 50 local fishermen families use this well for drinking, bathing and other domestic purposes.Since piped municipal water is available only during mornings and evenings, this well is the only suresource of water for drinking and other domestic purposes throughout the day.
(ii) Well No. 2 (Ward No. 30-Library well, Thangassery): This public dug-well islocated in the coastal village of Thangassery on the side of the Arabian Sea (marine zone).The well is popularly known as the library well of Bonovista. It is very large and is coveredwith an iron net. More than 50 families, mostly belonging to low-income groups, use waterof this well for drinking and other domestic purposes.
c. Tube-wells
(i) Well No. 1 (Ward No. 16- Vadakkumbhagam, District hospital, Kollam):Kollamdistrict hospital obtains water from this tube-well. A large open storage tank is built in thehospital compound for storing the water from this tube-well for distribution. This tube-wellis one of the eight tube wells in the municipal area managed by Kerala Water Authority(KWA). This tube-well is located in the fresh water zone.
(ii) Well No.2 (Ward No. 25- Thevally, NCC Office, Kollam): This well is located on thebanks of the Ashtamudi kayal (brackish water zone) and managed by Kerala Water Authority(KWA). This is the only source of piped water supply in this region. Consumers of thissource of supply are mainly people working in Government offices like the NCC Office andthe SP Office, Kollam.
d. Municipal tap-water supply (KWA)
(i) Public tap No.1 (Ward No. 20- Beach East, Pallithottam): This public tap is locatedin the coastal area of Pallithottam where there is a dense population of the fishermencommunity. Long queues for collection of drinking water is a common sight at this pointduring mornings and evenings because water in the dug-wells in this area is mostly brackishdue to nearness to the Arabian Sea.

25
(ii) Municipal public tap No.2 (Ward No. 21- Beach South, Vady): This tap located inVady, a coastal village of Kollam. Hundreds of people from the fishermen community dependon this water point since it is the only source of water for drinking in this area.
(iii) Municipal public tap No.3 (Ward No. 23- Kottakkakom, Iron Bridge) : Thistap is located on the bank of Kollam thodu (T-S canal) in the brackish water zone. The areais thickly populated and most of the people are associated with the coir industry.
(iv) Municipal public tap No.4 (Ward No.16- Vadakkumbhagam, KSRTC-Bus stand): This water point is located in the Canteen of the Kollam Transport Bus Stand(KSRTC). Hundreds of passengers use this water for drinking.
e. Small tap-water supplies
(i) Small tap-water supply No.1 (Ward No. 15, Cantonment North, Kollam CentralRailway Station): This sampling station is the drinking water point of Kollam CentralRailway Station. Everyday hundreds of passengers make use this water for drinking. Waterfor this Station is obtained from a large dug-well located nearby the Railway Station and thewell is poorly protected of this well is poor. There is no protective wall and the surroundingareas are not clean. This well is located in the fresh water zone of Kollam municipality.
(ii) Small tap-water supply No.2 (Ward No. 8, Pattathanam West, Fatima Mata NationalCollege, Kollam): The water in this tap is obtained from the municipal water supply(KWA) and a nearby well. College students use this water for drinking, especially after takinglunch. The college is located in the fresh water zone.
f. Ponds
(i) Pond No.1 (Ward No. 26, Cutchery Ward, Kottarakkulam): It is a pondlocated at the heart of the town since ancient times. Scenic beauty of this pond has beenrenowned. It remains in a deteriorating condition. There was hue and cry from all walks oflife to protect this perennial water body. This pond is located in the fresh water zone.
(ii) Pond No.2 (Ward No.31, Punnathala South, Cherukulam): Cherukulam is amedium-sized pond with an area of more than 5 acres. The municipality has built a retainingwall to prevent soil erosion and protect this water-body. The people of this area use thiswater-body mainly for bathing.
Results and Discussion
Colour (Hazen Units)
Colour of water from domestic dug-wells
In well No.(i) (Pattathanam West) the colour of water ranged from 05 to 20 HU whereas inwell No.(ii) (Asramam South) it varied from 05 to 20 HU. 10 HU was the lowest value and

26
55 HU was the highest value of colour recorded in well No.(iii) (Kottakkakom). In wellNo.(iv) (Mundakkal Middle) the maximum was noticed in July 1997 (40 HU) and the minimumin June 1997 (05 HU). In well No. (v) (Pattathanam East) the colour of water varied from 25to 35 HU. The above results of colour were compared with the standards prescribed byBureau of Indian Standards (BIS) and WHO. BIS (1991) has prescribed a value of 5 HazenUnits as the desirable limit of colour for drinking water. Thus we find that water from these6 domestic dug wells was highly unsuitable for drinking.
Colour of water from public dug-wells
In dug-well No. (i) (Church well, Pallithottam) the maximum value (90 HU) for colour wasobserved in February 1998 and the minimum (15 HU) in June 1997. The colour from publicdug well No. (ii) (Library well, Thangassery) varied between 15 and 70 HU. From the resultsit was noticed that water of public dug wells was highly unsuitable for drinking purpose asper standards prescribed by BIS and WHO.
Colour of water from tube wells
In tube well No.(i) (District Hospital, Kollam) the maximum value of colour (25 HU) wasobserved in September 1997 and minimum in July 1997 (05 HU). In tube well No. (ii) (NCCOffice, Kollam) the highest value was recorded in September 1997 (25 HU) and lowest inJune 1997 (05 HU). The data also revealed that the water from Tube Wells was objectionablefor drinking as per the guidelines prescribed by Bureau of Indian Standards (BIS).
Colour of water from municipal tap-water supply (KWA)
For Station (i) (Pallithottam) the maximum and minimum colour obtained was 25 and 10 HUrespectively. The colour of water varied between 10 and 30 HU in station (ii) (Vady). Instation (iii) (Iron Bridge) the colour of water varied from 10 to 25 HU. A range from 10 to 25HU was observed for station (ii) (KSRTC-Bus Stand). As per specification (BIS) it wasobserved that drinking water of the municipal water supply (KWA) of Kollam was not suitablefor drinking.
Colour of tap-water from small water supplies (public and private)
In Station (i) (drinking water supply, Kollam Railway Station) the peak colour was recordedin August 1997 (30 HU) and the lowest value (05 HU) during July 1997 and February 1998.Kollam Railway drinking water supply is an important one since the consumers are mainlythe Railway passengers. As per the standards prescribed by BIS and WHO, it was objectionablefor drinking purpose. In Station (ii) (FMN College, Kollam) the range of colour obtainedduring the period of investigation was from 20 to 25 HU.
Colour of pond water
In Pond No. (i) (Kottarakulam) the colour of water ranged between 80 and 100 HU whereasin pond No. (ii) (Cherukulam) it ranged from 80 to 100 HU. The mean monthly value of

27
colour varied from 82.5±3.54 to 100.0±0.0 HU. It may be noted that water from both pondswas highly unsuitable for drinking and other domestic purposes as per standard normsprescribed by BIS and WHO.
2. pH
pH of domestic dug-well water
In well No. (i) (Railway colony) pH ranged from 6.2 to 7.0 whereas in well No. (ii) (Asramamsouth) the range of pH was from 6.5 to 6.9. A range of 6.5 to 7.6 was observed in well No.(iii) (Kottakkom). In well No. (iv) (Mundakkal Middle) the range was between 5.5 and 7.0while in well No. (v) (Pattathanam East) the minimum value was 6.5 and the maximum 7.0.Among the domestic dug-wells, the highest fluctuation in pH was noticed in well No. (vi)(Palace Ward) where the lowest value was 6.5 and the highest 7.7. As per Bureau of IndianStandards (BIS), pH of water of the selected wells was within the permissible limit (6.5-8.5)and therefore, safe for drinking.
pH of public dug-well water
In dug-well No. (I) (Church well, Pallithottam) pH varied between 6.6 and 7.5. The highestfluctuation of pH was noticed in public dug well No. (ii) (Library well, Thangassery), wherethe lowest value was 5.5 and the highest value 8.2. As per BIS, it was found that the rangeof pH was within the safe limit for drinking.
pH of tube well water
In tube well No. (i) (District Hospital, Kollam), the pH range was from 6.8 to 7.7. A range of7.3 to 7.7 was observed in tube well No. (ii) (NCC Office, Kollam). The results revealed thatthe pH of water from both tube wells recorded safe for drinking as per standards prescribedby (BIS).
pH of tap-water from Kollam municipal water supply (KWA)
In station (i) (Pallithottam) the pH value was between 6.5 and 7.7. In station (ii) (Vady) thelowest value of 6.5 and the peak value of 7.9 were observed. In station (iii) (Iron Bridge)pH range was from 6.5 to 7.9 whereas in station (iv) (KSRTC-Bus Stand, Kollam) aminimum value of 6.5 and maximum level of pH 7.6 were recorded. It was noticed that pHvalues of tap water from Kollam municipal water supply were safe for drinking as perBIS.
pH of tap-water from small water supplies
In station No. (i) (Kollam Central Railway Station) the range was between 6.0 and 6.9. Instation (ii) (FMN College, Kollam) the pH varied from 6.5 to 7.0. The monthly mean valueranged from 6.25±0.35 to 6.9±0.14. The study revealed that the pH of water from the 2small tap water supplies was within the safety limit for drinking as per (BIS).

28
pH of pond water
In pond No. (i) (Kottarakulam) the range of pH was from 7.4 to 11.0. In pond No. (ii)(Cherukulam) the pH range was between 7.6 and 11.0. As per the standards prescribed byBIS, water from both ponds was highly alkaline and objectionable for both drinking anddomestic purposes.
Turbidity (NTU)
Turbidity of domestic dug-well water
In dug-well No.1 (Pattathanam West) the range of turbidity was from 0 to 0.8 NTUwhereas in well No.2 (Asramam South) the turbidity variation was between 0 and 2.4NTU. In dug well No.3 (Kottakkakom) the lowest value obtained was 0.4 and highest 14.4NTU. The lowest value was 0 while the highest value 3.6 NTU in dug well No. (iv)(Mundakkal Middle). The range of turbidity in well No. (v) (Pattathanam West) was between0 and 1.6 NTU. The highest fluctuation in turbidity was noted in well No.6 (Olayil) wherethe range was from 2.4 to 29.6 NTU. The Bureau of Indian Standards (BIS) prescribed avalue of 5 NTU as desirable limit for drinking water. In well No.3 (Iron Bridge) and wellNo. (vi) (Palace Ward), the turbidity values were exceedingly high as per the standards.Therefore, water from these two wells was not safe for drinking purpose in respect ofturbidity.
Turbidity of public dug-well water
In well No. (i) (Church well, Pallithottam) the range of turbidity was from 0.8 to 40 NTUwhile in well No. (ii) (Library well, Thangassery) it ranged between 0 and 27.2 NTU duringthe period of study. The study revealed that the turbidity values of both public dug wells hadexceeded the desirable limit during non-rainy season as per BIS.
Turbidity of tube well water
In tube well No. (i) (District Hospital, Kollam), the turbidity value ranged from 0.4 to 4.4NTU whereas in tube well No. (ii) (NCC Office, Kollam) it varied between 0.4 and 5.6 NTU.The results revealed that the turbidity of water from both tube wells was within desirablelimit as per standards and therefore, safe for drinking.
Turbidity of tap-water from municipal water supply (KWA)
Turbidity varied from 0.8 to 4.4 NTU in station (i) (Pallithottam) while in station (ii)(Vaddy) the range was from 1.6 to 4.2 NTU. In station (iii) (Iron Bridge) the turbidityvalue varied from 0.8 to 3.6 NTU whereas in station (iv) (KSRTC-Bus Stand, Kollam) thelowest value was recorded as 1.2 and the highest as 3.2 NTU. Results of turbidity fromKollam municipal water supply revealed that the water was safe for drinking with respectto turbidity.

29
Turbidity of tap-water from small water supplies
In station (ii) (FMN College, Kollam) the turbidity range was from 0.8 to 2.8 NTU. In station(i) (drinking water supply of Kollam Central Railway Station), turbidity ranged between 0and 3.2 NTU during the period of observation. As per the standards prescribed by BIS, itwas noticed that the range of turbidity in both Stations was within limit and so safe fordrinking.
Turbidity of pond water
In pond No. (i) (Kottarakulam) the turbidity range was from 16.4 to 39.2 NTU whereas inpond No. (ii) (Cherukulam) the range was from 10.4 to 27.6 NTU. Based on standards(BIS), it was noted that water from both ponds was highly turbid and not safe for drinkingor domestic purpose.
Total alkalinity (mg/l)
Total alkalinity of Domestic Dug-Well Water
In dug-well No. (i) (Pattathanam West) the total alkalinity ranged from 85.0 to 115.0 mg/lwhereas in well No. (ii) (Asramam South) it ranged from 35.0 to 100.0 mg/l. Total alkalinityfluctuated from 115.0 to 245.0 mg/l in well No. (iii) (Kottakkam). A variation of alkalinityfrom 40.0 to 145.0 mg/l was recorded in well No. (iv) (Mundakkal Middle). In well No. (iv)(Pattathanam East) the lowest alkalinity value was 100.0 mg/l whereas the highest was170.0 mg/l. The fluctuation of alkalinity in well No. (vi) (Olayil) was from 90.0 to 225 mg/l. Alkalinity of domestic dug-well No.3 (Iron bridge) and well No.6 (Olayil) observed abovethe desirable limit as prescribed by BIS.
Total alkalinity of public dug-well water
In public dug-well No. (i) (Church well, Pallithottam) the range was from 120 to 175 mg/lwhereas in well No. (ii) (Library well, Thangasserry) the Total alkalinity ranged between 110and 215 mg/l. Alkalinity values of public dug-well No.2 (Library well, Thangassery) wererecorded as high and exceeded the desirable limit of 200 mg/l (BIS)
Total alkalinity of tube well water
In tube well No. (i) (District Hospital, Kollam) the range was from 85.0 to 170.0 mg/lwhereas 180.0 to 215.0 mg/l was the range in tube well No. (ii) (NCC Office, Kollam). Intube well No. (ii) (NCC Office, Thevally, Kollam), the values of total alkalinity observedabove the desirable limit as per standards (BIS).
Total alkalinity of tap-water from municipal water supply (KWA)
The range was between 15.0 to 30.0 mg/l in station (i) (Pallithottam) while that of Station (ii)(Vady) was from 15.0 mg/ to 25.0 mg/l. In station (iii) (Iron Bridge) the range of alkalinity

30
was from 15.0 to 20.0 mg/l whereas in station (iv) (KSRTC Bus Stand, Kollam) the lowestvalue was 15.0 mg/l and the highest was 35.0 mg/l. The data indicated that alkalinity valuesof different sampling stations of Kollam municipal tap water supply were within the desirablelimit of standards, as per BIS.
Total alkalinity of tap-water from small water supplies (public and private)
A range of 50.0 to 75.0 mg/l of total alkalinity was documented in station (i) (drinking watersupply of Kollam Central Railway Station). In station (ii) (FMN College, Kollam) the totalalkalinity ranged from 25.0 to 40.0 mg/l during the period of observation. Alkalinity of bothstations recorded within the desirable limit of BIS.
Total alkalinity of pond water
In pond No. (i) (Kottarakulam) the total alkalinity ranged from 65.0 to 115.o mg/l while inpond No. (ii) (Cherukulam) the range was between 45.0 and 145.0 mg/l.
Alkalinity values were recorded within the limit as per BIS.
Total Dissolved Solids (TDS-mg/l)
Total Dissolved Solids of domestic dug-well Water
In dug-well No. (i) (Pattathanam West) a range of 120 to 560 mg/l was observed duringthe period of investigation. TDS varied from 80 to 680 mg/l in dug-well No. (ii) (AsramamSouth) whereas in well No. (iii) (Kottakkakom) the fluctuation was from 40 to 1880 mg/l. The lowest and highest values of TDS were found to be 120 mg/l and 1080 mg/lrespectively in well No. (iv) (Mundakkal Middle). In well No. (v) (Pattathanam East) TDSvaried from 360 to 800 mg/l during the course of observation. It was also noted that 160to 720 mg/l was the range of TDS in well No. (vi) (Palace Ward). The results revealed thatTDS of drinking water from domestic dug-wells exceeded the acceptable limit as prescribedby BIS.
Total Dissolved Solids of public dug-well water
In well No. (i) (Church well, Pallithottam) TDS ranged from 280 to 1440 mg/l whereas inwell No. (ii) (Library well, Thangassery) the range of TDS was from 320 to 680 mg/l. Asper the standards prescribed by BIS, it was noticed that drinking water from both public dugwells was not safe for drinking purpose.
Total Dissolved Solids of tube well water
In tube well No. (i) (District Hospital, Kollam) the range of TDS varied from 200 to 360 mg/l while in tube well No. (ii) (NCC Office, Kollam) the values varied between 80 and 720 mg/l. It revealed that in tube well No.2 (NCC Office, Kollam) the TDS range exceeded thepermissible limit for drinking water as per BIS.

31
Total Dissolved Solids of tap water from municipal water supply (KWA)
In station (i) (Pallithottam) the range of TDS was between 80 and 240 mg/l. However, 40 to400 mg/l was the range of TDS in station (ii) (Vady). In station (iii) (Iron Bridge) the TDSvaried from 40 to 200 mg/l while in station (iv) (KSRTC Bus Stand, Kollam) the range wasfrom 40 to 240 mg/l. It was found that TDS of all sampling Stations of Municipal WaterSupply (KWA) were within the limit as per BIS.
Total Dissolved Solids of tap water from small water supplies
In station (i) (drinking water supply of Kollam Railway Station) and in station (ii) (FMNCollege, Kollam) the TDS ranged from 80 to 480 mg/l. As per standards, TDS of water fromboth stations was within permissible limit.
Total Dissolved Solids of pond water
In pond No. (i) (Kottarakulam) the TDS ranged from 120 to 480 mg/l while in pond No. (ii)(Cherukulam) the range was between 80 and 480 mg/l. The study revealed that TDS of pondwater was within prescribed limits (BIS). during the period of study
Chloride (mg/l)
Chloride of domestic dug-well water
Chloride values ranged from 21.3 to 48.1 mg/l in well No. (i), whereas in well No. (ii)the fluctuation was noticed between 15.6 and 76.7 mg/l. In well No. (iii) the lowestvalue was observed as 28.4 mg/l while the highest as 243mg/l. Chloride varied from12.3 to 66.5 mg/l in well No. (iv) and from12.7 to 59.6 mg/l in well No. (v). A range of9.9 to 123 mg/l of chloride was observed in well No. (vi) during the period of investigation.The Bureau of Indian Standards (BIS) prescribed 250 mg/l of chloride as desirable limitfor drinking water supplies. Limit beyond this affected the taste, corrosion and palatabilityof drinking water. It was noticed that chloride in all 6 domestic dug-wells was withinthis limit.
Chloride of public dug-well water
Range of chloride in public well No. (i) was recorded from 34.1 to 117 mg/l and in well No.(ii), from 35.5 to 64.9 mg/l. It was observed that chloride of both wells recorded within thelimit as per BIS.
Chloride of tube well water
In tube well No.(i) the lowest value was observed as 8.5 mg/l whereas the highest as26.5 mg/l. The range of chloride in tube well (ii) was from 7.1 to 52.1 mg/l. As perthe guideline of BIS it was noticed that chloride in both tube wells was within thelimits.

32
Chloride of tap-water from municipal water supply (KWA)
The range of chloride in station (i) varied from 5.6 to 21.3 mg/l. The fluctuation of chloridecontent in station (ii) was from 4.8 to 21.3 mg/l. In station (iii), chloride values ranged from4.8 to 24.2 mg/l while in station (iv) the lowest value was documented as 5.6 mg/l and thehighest as 21.3 mg/l. From the results, it was observed that the mean value during non-rainyseason was a little higher than rainy season. This was in contrast to the values obtained fromdug wells. The value of chloride in treated water like municipal water supply was comparativelyless than other sources of drinking water.
Chloride of tap water from small water supplies
While in station (i) chloride fluctuated from 29.8 to 44.0 mg/l. In station (i), it was varyingform 16.8 to 55.4 mg/l. Chloride values of both stations recorded within the desirable limit ofBIS.
Chloride of pond water
In pond No. (i) the range was from 16.0 to 41.2 mg/l whereas the range in pond No. (ii) wasfrom 16.8 to 44.0 mg/l. It was significant to note that the pond water contained morechloride during non-rainy season than rainy season unlike the case of dug wells and tubewells.
Total hardness
Total hardness of domestic dug-wells
The range of hardness varied from 122 to 154 mg/l in well No. (i) while in well No. (ii) thefluctuation was from 42 to 210 mg/l. The highest range of fluctuation was recorded in well No.(iii), where it was from 182 to 722 mg/l. In well No. (iv) the lowest value was documented as 74mg/l whereas the highest as 370 mg/l. The range of total hardness in well No. (v) varied between132 and 166 mg/l. It was notable that in well No. (iii) and (iv), the range of total hardness wasabove the desirable limit of 300 mg/l as per the BIS and hence not safe for drinking.
Total hardness of public dug-well water
In well No. (I) range was from 146 to 290 mg/l whereas in well No. (ii) the fluctuation wasfrom 126 to 198 mg/l. It was noticed that the total hardness of water from both public dugwells was within the limit as per standards (BIS).
Total hardness of tube well water
In tube well No. (i) the range of hardness was from 62.0 to 112.0 mg/l while in tube well No.(ii) the fluctuation was between 144.0 and 160.0 mg/l. From the results, it was noticed thatthe total hardness of water from both tube wells was within the desirable limit as per thestandards prescribed by BIS.

33
Total hardness of tap-water from municipal water supply (KWA)
A range from 14 to 22 mg/l was recorded in Station (i) and the variation was between 14 and22 mg/l in Station (ii). In station (iii), the range was between 16 and 26 mg/l while in station(iv) the fluctuation was from 16 to 36mg/l. It was noticeable that the total hardness was lessin municipal tap water supply (KWA) than other water sources.
Total hardness of tap-water from small water supplies
In station (i) (Kollam Railway Station) the lowest value was recorded as 82.0 mg/l and thehighest as 126.0 mg/l. whereas in station (ii) the range was from 36.0 to 76.0 mg/l As per thestandards prescribed by BIS, it was noticed that values of total hardness of 2 small watersupplies were within the limit.
Total hardness of pond water
In pond No.(i) the range of hardness varied from 42 to 80 mg/l whereas in pond No.(ii) thefluctuation was from 50 to 82 mg/l. As per the guidelines prescribed by BIS, it was noticedthat total hardness of both ponds was within the desirable limit.
Fluoride (mg/l)
Fluoride of domestic dug-well water
In well No. (i) the range of fluoride in drinking water varied between 0.22 and .75 mg/lwhereas in well No. (ii) it varied from 0.22 to 0.81 mg/l. The lowest value of fluoride in wellNo. (iii) was observed as 0.51 mg/l while the highest as 0.90 mg/l. A range of 0.20 to0.73mg/l was recorded in well No. (iv). The highest fluctuation of fluoride of 0.23 to 0.91mg/l was found in well No. (v). In well No. (vi) the lowest value of fluoride was found to be0.22 mg/l and the highest to be 0.75 mg/l. As per Standards (BIS), it was found that valuesof fluoride in all domestic dug-wells were below the permissible limit.
Fluoride of public dug-well water
The fluoride in well No. (i) was varying from 0.34 to 0.86 mg/l whereas in well No. (ii) thefluctuation was between 0.15 and 0.77 mg/l during the period of study. The fluorideconcentration of both dug-wells was below the desirable limit as per BIS.
Fluoride of tube well water
In tube well No. (i) the range was between 0.52 and 0.90 mg/l whereas in well No. (ii) itvaried from 0.51 to 1.30 mg/l. Fluoride content of both tube wells was found to be below thedesirable limit as per standards (BIS).
Fluoride of tap-water from municipal water supply (KWA)
In station (i) the minimum value was recorded as 0.22 mg/l and the maximum as 0.65 mg/l.

34
The range of fluoride in station (ii) was from 0.21 to 0.67 mg/l. The fluctuation of fluoridein station (iii) was from 0.20 to 0.67 mg/l while in station (iv) the variation was between 0.20and 0.65 mg/l. As per standards (BIS) it was observed that fluoride in municipal watersupply was below the desirable limit for drinking
Fluoride of tap-water from small water supplies
While in station (i) the range was between 0.22 and 0.77 mg/l. In station (ii) the fluoride wasvarying from 0.22 to 0.73 mg/l. The study revealed that the fluoride content in (iii) smallwater supplies (public and private) was below the desirable limit as per standards (BIS).
Fluoride of pond water
In pond No.1 the fluoride varied from 0.10 to 0.53 mg/l while in pond No. (ii) the fluctuationwas between 0.12 and 0.61 mg/l. It was also found that the pond water contained lowestamount of fluoride when compared to tap water or dug Well water.It was significant thatfluoride concentration from all sources of potable water of Kollam municipal area was belowthe desirable limit as per standards (BIS). As per Indian Standards (BIS) all drinking watersources should maintain 1 mg/l of fluoride. Below this level of fluoride in drinking water maycause dental caries.
Iron (mg/l)
Iron of domestic dug-well water
A range of 0.04 to 0.81 mg/l of iron was recorded from well No. (i) while in well No. (ii) thefluctuation was between 0.05 and 0.25 mg/l. The lowest and highest values in well No. (iii)were found to be 0.05 and 0.44 respectively during the period of study. In well No. (iv) theiron concentration varied from 0.07 to 0.25 mg/l whereas 0.11 to 0.25 was the range of ironin well No. (v) Fluctuation of iron in well No. (vi) was from 0.11 to 0.35 mg/l. BIS prescribedan upper limit of 0.3 mg/l of iron for drinking water. It was noticeable that iron content of thewater from domestic dug-well No. (i), (iii) and (vi) was beyond this upper limit and thus notsuitable for drinking purpose.
Iron of public dug-well water
In well No. (i) the fluctuation of iron was from 0.11 to 0.38 mg/l whereas in well No. (ii) itwas between 0.09 and 0.52 mg/l. As per standards, water from both public dug-wells wasnot suitable for drinking purpose due to high concentration of iron.
Iron of tube well water
The highest fluctuation of iron was recorded in tube well No. (i) (District Hospital, Kollam)which ranged from 0.09 to 0.73 mg/l. In tube well No. (ii) (NCC Office, Kollam) the rangewas between 0.10 and 0.34 mg/l. As per standards (BIS) the iron concentration of both tubewells exceeded the upper safe limit and found to be not for drinking.

35
Iron of tap-water from municipal water supply (KWA)
The lowest value of iron in station (i) was recorded as 0.12 mg/l and the highest as 0.34 mg/l during the period of study. In station (ii) the amount of iron varied from 0.11 to 0.35 mg/l.In station (iii) the concentration ranged from 0.13 to 0.52 mg/l whereas in station (v) thevariation was between 0.12 and 0.38 mg/l. From the results it was noticed that water fromall sampling stations of Kollam municipal water supply (Kerala Water Authority) was notsuitable for drinking purpose as per standards prescribed for iron (BIS).
Iron of tap-water from small water supplies
While in station (i) (Kollam Central Railway Station) the fluctuation of iron was between 0and 0.30 mg/l. In station (ii) (FMN College, Kollam) the range of iron was from 0.16 to 0.35mg/l Based on standards (BIS) it was noticed that iron content of water from station 1 (FMNCollege, Kollam) was not safe for drinking.
Iron of pond water
In pond (i) (Kottarakulam) the range of iron was from 0.37 to 0.74 mg/l whereas in pond(ii) (Cherukulam) the fluctuation was between 0.20 and 0.69 mg/l. It was obvious thatwater from both ponds contaminated with iron and not suitable for drinking or domesticpurposes. From the results it was observed that almost all water sources includingdomestic dug-wells (well No. (i), (iii) and (vi)), public dug wells, tube wells, municipal tapwater supply, small tap water supply (FMN College) and pond water recorded highconcentrations of iron and not safe for drinking and other domestic purposes as perstandards (BIS).
Coliforms
Coliforms of Domestic Dug-Well Water
In well No. (i) the number of total coliforms varied from 350 to 10420 coliforms/100 ml ofwater while the faecal coliforms ranged between 50 and 5200 coliforms/100 ml of water.The variation of total coliforms in well No. (ii) was from 160 to 5000 coliforms/100 ml ofwater whereas that of faecal coliforms was from 35 to 720 coliforms/100 ml. In well No.(iii) the lowest value of total coliforms was 620 and the highest 5000 coliforms/100 mlduring the period of study while the faecal coliforms varied from 50 to 250 coliforms/100. The greatest fluctuation of total coliforms was recorded as 950 to 16800 coliforms/100 ml from well No. (iv). The faecal coliform range in well No. (iv) was 190 to 4200coliforms/100 ml of water. The range of total coliforms in well No. (v) was 1200 to8600 coliforms/100 ml of water while that of faecal coliforms was from 130 to 360coliforms/100 ml. In well No. (vi) the fluctuation of total coliforms ranged from 720 to8500 coliforms/100 ml whereas the faecal coliforms it was from 90 to 340 coliforms/100 ml. Based on BIS, it was evident that drinking water from all domestic dug-wells ofKollam municipal was highly contaminated with total and faecal coliforms and not suitablefor drinking purpose.

36
Coliforms of public dug-well water
In well No. (i) the total coliform count ranged from 1700 to 9200 coliforms/100 ml of waterwhereas the faecal count varied from 180 to 2500 coliforms/100 ml of water. In well No. (ii)the total coliform organisms varied from 1800 to 12500 coliforms/100 ml of water while thefaecal count ranged from 180 to 720 coliforms/100 ml. It was obvious that water from boththe public dug-wells was highly contaminated with total and faecal coliform organisms andthus not safe for drinking purpose as per standards (BIS).
Coliforms of tube well water
In tube well No. (i) (District Hospital, Kollam) the total coliform count varied from 90 to12500 coliforms/100 ml of water whereas the faecal coliform range was from 12 to 250coliforms/100 ml. In tube well No. (ii) the total count ranged from 90 to 720 coliforms/100ml and that of faecal count from 20 to 90 coliforms/100 ml. It revealed that both tube wellswere highly contaminated with coliform organisms.
Coliforms of tap-water from municipal water supply (KWA)
In station (i) the range of total coliforms was between 0 and 320 while that of faecal coliformsranged from 0 to 90 coliforms/100 ml of water. In station (ii) the fluctuation of totalcoliform count ranged from 0 to 1650 and that of faecal coliform varied from 0 to 120 per100 ml. In station (iii) the total coliform count ranged from 0 to 360 per 100 ml of waterwhereas the faecal coliforms varied from 0 to 90 per 100 ml. In station (iv) the total countwas from 0 to 1200 coliforms/100 ml and that of faecal coliform was from 0 to 180 per100 ml. It was noticeable that water from all tap water sampling Stations of Kollam municipalwater supply was highly contaminated with total and faecal coliform organisms as perstandards (BIS).
Coliforms of small tap-water supplies
In station (i) the fluctuation was between 75 and 5000 coliforms/100 ml. whereas that offaecal coliform was from 20 to 720 per 100 ml of water. In station (ii) the number of totalcoliforms varied from 950 to 8200 per 100 ml of water while the faecal coliform rangedfrom 150 to 3500 per 100 ml. From the results it was observed that water from the 2 smallwater supplies was not safe for drinking purpose.
Coliforms of pond water
In Pond No. (i) the range of total coliform was from 2500 to 16800 per100 ml ofwater while 240 to 5200 was found to be the range of faecal coliforms. In pond No.(ii) the variation of total coliform count was from 5000 to 36000 coliforms/100 ml ofwater whereas the faecal coliforms ranged between 2500 and 19000 coliforms/100 mlof water. The results showed that all sources of drinking water including dug-wells,tube wells, municipal tap water, pond water were highly contaminated with total andfaecal coliforms.

37
Residual Chlorine
Residual chlorine of municipal tap-water supply (KWA)
In Pallithottam Station (i) the variation was from 0 to 4.0 mg/l while in Station (ii) (Vady) itwas from 0 to 3.5 mg/l. Whereas in Station (iii) (Iron Bridge), the amount of residual chlorinewas between 0 and 3.0 mg/l. In Station (iv) ( KSRTC-Bus stand) it was from 0 to 3.0 mg/l.The mean of rainy season was found to be 2.22±0.68 mg/l and that of non-rainy season was0.67±0.67 mg/l. The annual mean value of all stations was recorded to be 1.45±0.55 mg/l.As per standards (BIS), the desirable limit of residual free chlorine in drinking water suppliesshould be 0.2 mg/l and if there is viral infestation there should be a booster dose of 0.5 mg/l. Besides that 3.0mg/l or more of residual chlorine in drinking water is toxic to human body.From the results, it was noted that application of chlorine in the municipal water supply(KWA) of Kollam was irregular and unscientific. This led to a situation of municipal drinkingwater contamination due to the presence of coliform organisms, particularly during non-rainy season when residual chlorine was totally absent in certain stations. Further it wasfound that municipal water supply (KWA) was the only source of drinking water in themunicipality with the application of chlorine as a disinfectant.

38
4. Health and Sanitary Status of Households
Sanitary status
Indicators of sanitary status included facility for defecation, type of latrines, medium usedfor anal cleaning, altitude of latrine and water sources, distance between latrine and watersource, present condition of latrine, leakage of latrine during rainy season, frequency ofcleaning and information on agencies helping latrine construction. Detailed information wascollected on all these items as well as on water logging, mosquito menace, possible source ofdrinking water contamination, protection of water sources, provision of drainage systemand means of domestic solid waste disposal, distance between animal waste and watersources, and disposal of child faeces.
Health status
Information on the health status of the people in the study area was collected through questionson consumer’s opinions on the safety of their drinking water. Whether drinking water wasused after boiling or not was looked into. Various methods adopted by the people for purificationof drinking water were documented. It was also ascertained whether water quality wastested before drinking. Consumers’ suggestions on the improvement of water supply in theregion were also recorded. Water-borne and water-related diseases that occurred duringweeks prior to the date of the survey were recorded .
It was assumed that episodes of water-borne diseases like diarrhoea may not be rememberedby the respondents, if the incidence of disease had occurred more than two weeks prior tothe date of the survey. Diseases were classified into two main groups as water-borne andwater- related based on international classification. Systems of treatment resorted by thehouseholds, such as Allopathy and Homeopathy were recorded. Institutions of treatment,which the households approached such as Government hospital and Private hospital, werenoted down. Immunisation steps taken as a preventive measure against various kinds ofdiseases including water borne diseases were also recorded.
Water sources and uses
Amount of water consumption for drinking and cooking
It was estimated that 8 percent of the households used 25 litres/day whereas 34 percentconsumed 26-50 litres/day; 29 percent consumed 51-75 litres/day; 20 percent used 76-100litres/day; and 9 percent consumed 101to 250 litres/day.
Amount of water consumption for washing and bathing
It was noted that one percent of households consumed up to 100 litres/day whereas 33percent of households consumed 101 to 500 litres/day; 58 percent 501 to 1000 litres/day; 7percent consumed 1001 to 1500 litres/day; and 1 percent consumed 1501 to 2000 litres/day

39
for washing and bathing. Therefore, it was estimated that the average consumption of waterfor drinking and domestic purposes of Kollam municipal area was 192 litres/capita/person.
Continuous/Intermittent type of municipal water supply
It was observed that 89 percent responded that municipal water supply was intermittent;only 11 percent responded that water supply was continuous. Frequent breaks in watersupply may cause serious effects on the health of people because of the negative pressurethey produce on the distribution system. In certain areas of Kollam municipality it was notedthat both the drainage canal and the drinking water pipeline run parallel. Therefore, there arechances for contamination of drinking water through leakages, if there is negative pressure.Further people may resort to other water sources that may not be safe during the period ofnon-availability of municipal water supply.
Municipal drinking water with worms and other organisms
The report of occurrence of worms, larvae and other organisms in municipal water supplyof Kollam (KWA) showed that 48 percent households found various types of organismsincluding worms larvae in their drinking water while 52 percent of households had no suchexperiences. This was a significant observation from the health point of view.
Scarcity of drinking water in the municipal area
It was observed that 37 percent of households experienced scarcity of drinking water whileothers did not. It was noted earlier that 30 percent of households experienced dry up of dug-wells during summer.
Sanitary status
Defecation (excretion) practice and type of latrine used
It was found that 66 percent of households used sanitary latrine; 25 percent used non-sanitary latrine; and 9 percent defecated in open-air. Open air defecation and non-sanitarylatrines appeared to be the main sources of contamination of drinking water, particularly indug-wells.
Altitude of latrine and dug-well
It may be observed that 45 percent of latrines are situated higher in altitudes than those dug-wells. Latrines located at higher altitudes may pave the way for leaching into the nearbywells leading to faecal contamination
Distance between water source and latrine
Twenty-four percentage of latrines were situated at a distance of less than 10 ft.from water sources; 38 percent of latrines were located at a distance of 11 to 20 ft.;23 percent at a distance of 21 to 30 ft.; and 15 percent at a distance of 31 ft >. Thismight cause contamination of dug-wells.

40
Present state of latrine
It was found that 35 percent latrines in the study area were in good condition whereas 41percent were moderately good and 24 percent poor.
Leakage of the latrines during rainy season
It was recorded that 24 percent of latrines in the study area became leaky during rainyseason. This could lead to contamination of the surroundings of people.
Frequency of cleaning of latrines
It was understood that 6 percent of latrines were cleaned daily; 57 percent of latrines werecleaned weekly; 36 percent were cleaned monthly and 1 percent was not cleaned regularly.This overall unhygienic nature in the municipality might be accentuating the situation of highwater-borne morbidity.
Latrines built with the help of aid agencies
It was recorded that 13 percent of latrines in the municipal area were built with the help ofmunicipal and private agencies while the rest were constructed by the parties concernedthemselves. Among aid agencies, 67 percent of the latrines were constructed by the Kollammunicipality whereas the rest by non- governmental voluntary organisations such as FCDP(Fishermen Community Development Programme) (29 percent); QSSS (Quilon Social ServiceSociety) and LCC (Latin Catholic Church) (2 percent).
Water logging around houses
Forty-eight percentage of households succumbed to water-logging during rainy season while52 percent of households faced no such problems. Water-logging may pave the way forinfestation by water-borne and water-related diseases.
Mosquito menace
More than 99 percent of households complained of mosquito menace while 0.1 percent ofhouseholds reported no mosquito menace. Mosquito menace indicated water stagnation andconsequences thereof.
Protection of dug-wells
Nearly 13 percent of wells were found to be protected with proper covering; 25 percentwere provided with protective platforms; 32 percent were provided with net-cover and 30percent were unprotected.
Provision of drainage system
It was observed that 29 percent of households enjoyed the provision of municipaldrainage facilities while the rest were deprived of that provision. Lack of sufficient

41
drainage facilities might produce water contamination and associated water-borneand water-related diseases.
Disposal of domestic solid waste
It was found that 14 percent of households dumped domestic solid wastes in collectiontanks/areas of the municipality; 15 percent resorted to burning; 71 percent responded thatthey had no facility for the disposal of their domestic solid wastes. Accumulation of solidwastes in their surroundings might lead to water pollution.
Disposal of child faeces
It was observed that 56 percent of households simply threw away child faeces while the restdeposited faeces safely in septic tanks. Such careless discard of faeces might lead tocontamination of drinking water.
Possession of domestic animals
Out of 800 households, only 96 households owned domestic animals. Among domesticanimals, 23 percent were cattle; 76 percent pet animals and 1 percent others.
Distance between cattle waste dumping site and water source
Data on distance between cattle-waste dumping site and water-source revealed that 24 percentwere in the 10 ft. category; 24 percent in the 15 ft. category; 28 percent in 20 ft. category;6 percent in 25 ft. category and 18 percent in 50 ft. category.
Health status
Use of boiled drinking water
Twenty-nine percentage of households used boiled water for drinking whereas 71 % usedraw water for drinking. This was a significant observation in view of the reported recurrenceof diarrhoea and other contagious diseases in the municipal area.
Methods adopted by people for disinfecting the drinking water
Twenty-nine percentage of households used bleaching powder, potassium permanganate,cloth filtration (or water filtration) equipment for purification whereas the rest consumedwater without purification. Further it was noticed that out of those households using varioustypes of disinfection methods, 52 percent used bleaching powder; 27 percent used potassiumpermanganate; 18 percent adopted filtration with cloth and 3 percent used Water filters(equipment).
Do people test their drinking water
It was noticed that 99 percent of households in Kollam municipal area never tested thepotability of their drinkingwater. The people of Kollam municipality seem be either little

42
bothered of the safety of drinking water or have little accessibility to testing its quality.
Consumers’ suggestions on the improvement of drinking water supplies
The consumers put forward various suggestions on the improvement of drinking watersupplies during the interview. It may be noted that 39 percent suggested that proper treatmentof drinking water would help to improve the piped water supplies; 21 percent of respondentssuggested that replacement of the old pipe line could improve the present drinking watersupply systems in the municipal area; 12 percent suggested proper drainage system andclean environment; 9 percent recommended construction of more bore-wells; 8 percentsuggested regular monitoring of water quality and scientific application of chlorine in watersupplies; 6 percent pointed out that an awareness programme on well-water disinfectionwould help improve the quality of drinking water and 5 percent suggested additional pipelineas a solution.
Occurrence of water-borne diseases
Of the various diseases, 33 percent of water-borne diseases in the area were diarrhoea; 30percent gastroenteritis; 16 percent ascariasis; 8 percent typhoid; 7 percent enterobiasis; 2percent cholera; 2 percent polio and 1percent amoebic dysentery. Further it was noted thatdiarrhoeal disease was predominant in the municipal area particularly among the lower socio-economic status groups; this may be due to the high level of bacterial contamination of allsources of water available in the area (vide previous section: bacteriological quality of water).
Occurrence of water-related diseases
It was observed that 36 percent of water-related diseases registered were conjunctivitis; 25percent allergy; 24 percent malaria and 15 percent skin ulcers. Dangerous water-relateddiseases like malaria appeared to be prevalent in Kollam municipal area. Water-logging, mosquitomenace and overall environmental degradation may have profound impact upon the highwater-borne morbidity in the study area
Method of treatment
It was found that 94 percent of households depended on allopathy; 5 percent on homeopathy,and 1 percent on ayurveda.
Dependence of Government/Private hospitals for treatment
Seventy percent of households in Kollam municipal area sought medical care from privatehospitals while 30 percent depended on government hospitals.
Immunisation of children between 1 and 2 years
It was documented that 95 percent of children in the municipal area had been subjected tofull immunisation while the rest 5 percent to partial immunisation. It was significant to note

43
that every child in the study area was immunised. This indicated that people were fully awareof the need for child immunisation programme for guarding against the adverse environmentalconditions. It was observed that 10.1 percent of households was recorded as very poor;34.1 percent as somewhat poor; 26.3 percent as middle class; 16.9 percent as above middleclass and 12.6 percent registered to be rich based on various indicators. The first twogroups were considered to belong to the below poverty line (BPL) with a share of 44.2percent of population. Further it was noticeable that the percentage of the very poor and therich categories were recorded to be low.
Figure 4.1 Scarcity of drinking water
Figure 4.2 Water-borne diseases of Kollam municipal area
Figure 4.3 Water-related diseases of Kollam municipal area

44
5. Socio-economic and Health Status
Incidence of water borne diseases: Diarrhoea
It may be seen that 17.8 to 60.4 percent of households had histories of diarrhoeal disease.However, a higher percentage of diarrhoeal incidence occurred in households of lower socio-economic status. In other words, a declining trend of incidence of diarrhoeal disease wasobserved with increase in socio-economic status. The evidence further indicated thatdeterioration of various environmental factors including drinking water quality has higherimpact on people belonging to lower socio-economic status.
Incidence of water-borne disease: Gastroenteritis
It was recorded that 12.8 to 51.8 percent of households had incidence of gastroenteritis.Lower socio-economic status groups of people had higher incidence of gastrointestinal diseasethan higher status groups. This may be due to the deprived environmental characteristics aswell as poor drinking water quality of the latter.
Incidence of water-borne disease: ascariasis
It was observed that 7.9 to 28.3 percent of households had incidence of ascariasis. Lowersocio-economic groups had higher percentage of ascariasis than higher socio-economicgroups. Poor environmental factors accelerate the incidence of water-borne diseases likeascariasis.
Incidence of water-borne disease: Typhoid
It was seen that 4.9 to 13.5 percent of households had incidence of typhoid. Further,the incidence was higher among lower socio-economic groups (very poor and somewhatpoor). This was due to the fact that deterioration of environment includingcontaminated water caused more water-borne diseases like typhoid.
Incidence of water-borne disease: Enterobiasis
About 1.9 to 12.3 percent of households had the incidence of enterobiasis. The incidence ofenterobiasis was more among households of lower socio-economic status. This might havebeen due to the deprived environment of the lower socio-economic groups of people in thestudy area.
Incidence of water-borne disease: Cholera
It was found that 0 to 7.4 percent of households had incidence of cholera. It was furthernoted that the incidence of cholera was found only among the lower socio-economic groups.This might have been due to poor environmental factors as well as poor quality of drinkingwater.

45
Incidence of water-borne disease: Polio
It was noticed that 0.7 to 2.5 percent of households had the incidence of polio. The higherpercentage of polio infections was found among lower socio-economic groups, may be alsodue to the impact of poor environmental factors.
Incidence of water-borne disease: Amoebic dysentery
It was recorded that 0 to 2.5 percent of households had the incidence of amoebic dysentery.Only households of lower socio-economic status had experienced amoebic dysentery whereashigher status (status 4 and 5) had no such problem. This might have been due to thedeteriorated environment of people living below poverty line (BPL).
Incidence of water-borne disease: Infectious hepatitis
It was noted that 0 to 2.4 percent of households had incidence of infectious hepatitis. It isagain households in the lower socio-economic status that had high incidence of hepatitis.This was due to the deprived environmental conditions including poor quality of drinkingwater available to the lower socio-economic groups.
Incidence of water-related disease: Conjunctivitis
It was observed that 6.9 to 31.1 percent of households had conjunctivitis. The incidence ofconjunctivitis was higher in the lower socio-economic groups owing to their poor environmentalcharacteristics.
Incidence of water-related disease: Allergy
Of the sample households, 6.9 to 23.4 percent had different kinds of allergic complaints. Itwas the lower socio-economic groups, which had higher incidence of allergy than highersocio-economic groups. The deteriorated environmental factors including contaminated waterhad greater damaging effect on the poor than on the well-to-do.
Incidence of water-related disease: Malaria
About 5.9 to 23.4 percent of households had bouts of malaria. Higher malarial incidenceoccurred among housedholds of the lower socio-economic status due to the deprivedenvironment including widespread mosquito menace.
Incidence of water-related disease: Skin ulcers
The majority of households belonging to the lower socio-economic groups hadhigher incidence of skin ulcers. It was noted that 4.9 to 14.8 percent of households had beenaffected with skin ulcers. The lower socio-economic groups living under deprived environmentwere the prime victims of skin ulcers.

46
Method of treatment: Allopathy
It may be noted that 85.7 to 96.7 percent of households depended upon allopathy. It was thelower socio-economic groups which had to undergo frequent medical treatment.
Method of treatment: Ayurveda
Only less than three percent of the households depended on ayurvedic method of treatmentfor their ailments. Poor people were found to avoid ayurvedic method of treatment maybe due to the fact that ayurvedic treatment was relatively expensive.
Method of treatment: Homoeo
The percentage of households from lower socio-economic status which depended onhomeopathic method of treatment was even lower.
Agency of treatment: Government hospital
The proportion of households in the municipal area of Kollam which depended on governmenthospitals varied between 2.9 and 38.7 percent. A higher percentage of households fromlower socio-economic status depended on government hospitals because treatment ingovernment hospitals was less expensive than in private hospitals.
Agency of treatment: Private hospital
It was found that 62.7 to 97.1 percent of households depended on private hospitals. It waspeople from higher socio-economic status who depended more on private hospitals. Thesocio-economic status of people in the study area had profound impact upon the selection ofthe agency of treatment.
Immunisation of children: Fully immunised
It was seen that 87.2 to 100 percent of households had taken full immunisation of theirchildren. This indicated that the degree of awareness of the people about the need for preventionof diseases.
Immunisation of children: Partially immunised
Only 2.5 to 11.1 percent of the households reported partial immunisation of children.

47
Tab
le
5.1
Rel
atio
nshi
p be
twee
n So
cio-
econ
omic
sta
tus
(SE
S) a
nd S
anit
ary
stat
us o
f ho
useh
olds
Dec
imal
No.
of
Que
stio
nnai
re
Par
amet
ers
SE
5.
1
Def
ecat
ion:
O
pen
air
Sept
ic ta
nk
Pit l
atri
ne
Publ
ic la
trin
e
30 .
28.
32.
8. 6
5.
1.1
5.
2
5.2.
1
Type
of l
atri
ne:
Sani
tary
latr
ine
Non
san
itary
latr
ine
Hig
h al
titud
e: la
trin
e w
ith w
ater
sou
rce
Dis
tanc
e be
twee
n w
ater
sou
rce
and
latr
ine
0-1
0 ft
. dis
tanc
e
11-
20 ft
. dis
tanc
e
21-
30 ft
. dis
tanc
e
31
ft.>
dis
tanc
e
28 .
40.
47 .
27.
45 .
13.
13 .

48
Tab
le 5
.1 c
ontd
. R
elat
ions
hip
betw
een
Soci
o-ec
onom
ic s
tatu
s (S
ES)
and
Hea
lth
stat
us o
f ho
useh
olds
D
ecim
al N
o. o
f Q
uest
ionn
aire
Par
amet
ers
SE
S 1
5.2
.2
Pre
sent
sta
te o
f lat
rine
:
Goo
d
Mod
erat
e
Poo
r
3.6
%
39.
3% 5
7.1%
5.2
.3
5.2
.4
5.2
.5
Leak
age
of la
trine
dur
ing
rain
y se
ason
Fr
eque
ncy
of c
lean
ing
of la
trin
e:
Dai
ly
W
eekl
y
Mon
thly
Not
at a
ll
Latri
ne b
uilt
with
the
aid
of a
n ag
ency
53.
6% …
3
4.5%
58.
2% 7
.3%
2
5.5%

49
Dec
imal
No.
of
Que
stio
nnai
re
Par
amet
ers
SES
5.
3 5
.4
5.6
5
.7
5.7
.1
Wat
er lo
ggin
g en
viro
nmen
t M
osqu
ito m
enac
e Pr
ovis
ion
of a
dra
inag
e sy
stem
D
omes
tic s
olid
was
tes d
ispo
sal:
D
umpi
ng
Bur
ning
N
o fa
cilit
y D
ispo
sal o
f chi
ld fa
eces
: Si
mpl
y th
row
In
sept
ic ta
nk
65.
8 % 1
00%
25.
0 % 6
.3%
2.5
% 9
1.0 %
81.
8 % 1
8.2 %
Tab
le 5
.1 c
ontd
. R
elat
ions
hip
betw
een
Soci
o-ec
onom
ic s
tatu
s (S
ES)
and
Hea
lth
stat
us o
f ho
useh
olds

50
Tab
le
5.2
Rel
atio
nshi
p be
twee
n So
cio-
econ
omic
sta
tus
(SE
S) a
nd H
ealt
h st
atus
of
hous
ehol
ds
D
ecim
al N
o. o
f Q
uest
ionn
aire
Par
amet
ers
S
6
.1
6
.2
Con
sum
er’s
opi
nion
on
drin
king
wat
er:
Safe
for d
rink
ing
Not
saf
e fo
r dri
nkin
g U
se o
f boi
led
drin
king
wat
er:
Drin
king
wat
er b
eing
boi
led
befo
re u
se
Drin
king
wat
er n
ot b
eing
boi
led
befo
re u
se
3 6
6.
2.1
6
.4
6.
6.1
Add
som
ethi
ng to
incr
ease
the
tast
e of
wat
er
Hav
e te
sted
drin
king
wat
er
Wat
er b
orne
dis
ease
s:
D
iarr
hoea
Gas
troe
nter
itis
Asc
aria
sis
2 6 5 2

51
Dec
imal
No.
of
Que
stio
nnai
re
Par
amet
ers
SE
S 1
6
.6.2
Typ
hoid
E
nter
obia
sis
Cho
lera
P
olio
A
moe
bic
dyse
nter
y In
fect
ious
hep
atit
is (
Jaun
dice
) W
ater
rel
ated
dis
ease
s
Con
junc
tivi
tis
All
ergy
M
alar
ia
Ski
n ul
cers
9.8
%
12.
3 7
.4%
2
.5%
1
.2%
2
.4%
3
1.0%
23.
4% 2
3.4%
14.
8%
Tabl
e 5.
2 co
ntd.
R
elat
ions
hip
betw
een
Soci
o-ec
onom
ic s
tatu
s (S
ES)
and
Hea
lth
stat
us o
f ho
useh
olds
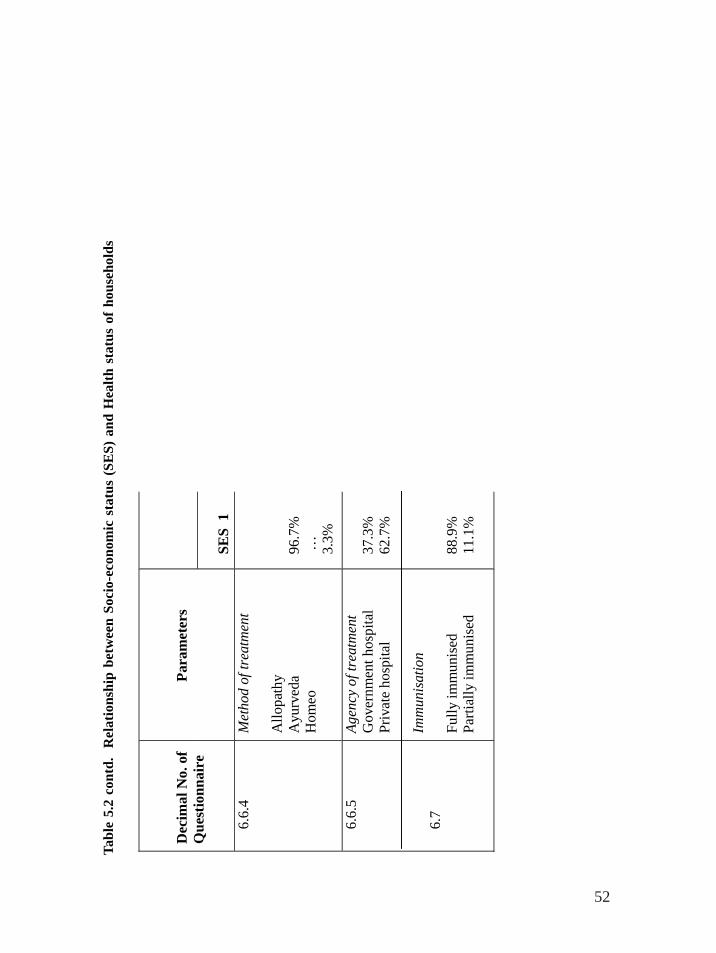
52
D
ecim
al N
o. o
f Q
uest
ionn
aire
Par
amet
ers
SE
S 1
6.6
.4
Met
hod
of tr
eatm
ent
All
opat
hy
Ayu
rved
a H
omeo
96.
7%
…
3
.3%
6
.6.5
6.7
Age
ncy
of tr
eatm
ent
Gov
ernm
ent h
ospi
tal
Pri
vate
hos
pita
l Im
mun
isat
ion
Full
y im
mun
ised
Pa
rtia
lly
imm
unis
ed
37.
3%
62.
7%
88.
9%
11.
1%
Tabl
e 5.
2 co
ntd.
R
elat
ions
hip
betw
een
Soci
o-ec
onom
ic s
tatu
s (S
ES)
and
Hea
lth
stat
us o
f ho
useh
olds

53
6. Conclusion
Results of the study indicated that all water sources including dug-wells, tube wells (KWA),municipal tap water supply (KWA), small public and private tap water supplies, and pondwater were highly contaminated and not safe for drinking as per Bureau of Indian Standards(BIS).
It was further observed that serious lapses in drinking water disinfection and treatment alongwith intermittent supply, non-sanitary latrines, open defecation, water-logging environment,poor drainage facilities and unscrupulous dumping of domestic wastes resulted in thedeterioration of water quality in the study area. The study also revealed that poor quality ofdrinking water was recorded as the major risk factor for the large-scale water-borne morbidityin the area.
Recommendations for improvement of water quality/quantity/distribution
(i) Sustainable management of both solid and liquid waste
(ii) Provision of adequate drainage facilities with utmost care and routine.
(iii) Protection and prevention of water-borne diseases by adequate measurers in co-ordination with both governmental and non-governmental participation
(iv) Water literacy in order to keep drinking water safe.
(v) Environmental sanitation with good hygiene practices at household level.
(vi) Cultivation of the habit of drinking boiled water.
(vii) Protection and disinfection of all open dug-wells. Dug-well water should be considereda good source of drinking water and adequate steps should be taken for the preventionof contamination of well water from household environment.
(viii) Maintenance of adequate distance of the pipeline from drainage canals and latrinesources. Water sources should be kept at a minimum distance of 15 metres awayfrom latrines and animal waste dumping sites.
(ix) Water source protection in order to keep water clean and safe for drinking.
(x) Periodic and routine monitoring of the quality of tap water and other sources ofdrinking water. There should be a network of water-quality-monitoring laboratoriesboth in rural and urban areas.
(xi) Avoidance of open-air defecation and elimination of non-sanitary latrines.
(xii) Protection of dug-wells with cement platform, protected wall, and net for adequatecovering.
(xiii) Regular chlorination in dug-wells using chlorine, bleaching powder, and chlorine tablets.
(xiv) Regular treatment of water and testing of water samples periodically.

54
(xv) Scientific application and monitoring of chlorine.
(xvi) Training of technical staff for attedning pipeline breakage.
(xvii) Ensuring continuous supply of water in the municipal piped-water system.
(xviii) Strengthening of water quality research and finding out of the possible health implicationsof water quality parameters like trihalomethanes (THMs) due to hyperchlorination andincreased organic matter.
(xix) Strict legislation against occurrence of high percentage of coliform organisms in drinkingwater sources.
(xx) Eradication of the mosquito menace with adequate steps taken to treat stagnant waterbodies.
(xxi) Establishment of a “water quality surveillance system” with the co-ordination of variousgovernmental and non-governmental organisations in order to improve the quality ofdrinking water. This will definitely improve the quality of life of the people in the area.

55
References
Abhayambika, A., Devi, K. I., Nathan, N and Varghese, M.O. “Epidemiological study ofdiarrhoeal diseases in Southern Kerala”, Proc. Ker. Sci. Con. pp. 237-238. 1989.
Aravindan, K. P. “A study of epidemic diarrhoeal deaths in Kerala”, Proc. Ker. Sci Con,pp.361-366, 1989.
Calvert, P. and Andersson, I. “The compost toilet: A positive experience in Kerala, India”,Global Environment Sanitation Initiative. Water Supply Sanitation Collaborative Council,Geneva, 2000.
GOK.1974. Fifth Five-Year Plan (1974-‘79), Trivandrum: State Planning Board, 1974.
Jalasandesh. “Potwats Programme – promoting intensive chlorination of wells”, Socio-Economic Units, Kerala. 6 (3). 1994.
Kannan, K. P, Thankappan, K.R., Kutty, V. R. and Aravindan, K. P Health and developmentin rural Kerala, Kerala Sastra Sahitya Parishad. 1991.
Komath, M., Unni, P.N, and Harikumar, P.S “Impact of solid waste disposal on ground waterquality of Nheliyanparamba, Cheruvannur, Kozhikode: A case study”, Proc. 12th Ker. Sci.Con. pp. 624-626. 2000.
KSSP. Health survey. Trivandrum. 1987.
KWA. “The bacterial quality of water in selected wells in Kerala”, Socio-economic Units,Kerala. Integrated water supply & sanitation programme. 1991.
Panicker, S., Basi, E., Alexander, P. K. and Ravindran, P. C. “Assessment of bacteriologicalquality of potable water and evaluation of water purification technique”, Proc.12th Ker. Sci.Cong. pp.75-76, 2000.
Panikar, P.G.K. and Soman, C. R. Health status of Kerala. (CDS), Thiruvananthapuram:Centre for Development Studies. 1984.
Pillai, G.M and Ouseph, P.P. “Water quality management in wells –A case study”, Proc. 12th
Ker. Sci. Con. 2000.
Radhakrisnan, A., Dina, S., Shaji, C., Thankamani, V. and Calvert, P. “Bacteriological qualityof water from a coastal village - Pulluvila (Kerala)”, Proc. National seminar on rural watersupply and sanitation. Trivandrum. pp.147-148. 1996.
Soman, C.R. An evaluation of the DDS and income generating component of the CPWP inKerala, UNICEF. 1981.

56
Soman,C.R., Damodaran, M., Rajasree, R., Ramankutty, V. and Kumar,V. High morbidityand low mortality- The experience of urban pre-school children in Kerala. J. Trop. Pediatrics,Vol. 37. 1991.

![[XLS]services.iriskf.orgservices.iriskf.org/FCKeditor/_samples/asp/excel/Niraj... · Web viewrspl_hub@rediffmail.com vwdip.bandyopadhyay@rediffmail.com nhemdev@indiatimes.com bajaj@hotpop.com](https://img.dokumen.tips/doc/110x75/5ab070417f8b9a6b308e7f75/xls-viewrsplhubrediffmailcom-vwdipbandyopadhyayrediffmailcom-nhemdevindiatimescom.jpg)


![[XLS]services.iriskf.orgservices.iriskf.org/FCKeditor/_samples/asp/excel/Merged... · Web viewrobin_kentucky@yahoo.com robinagore@hotmail.com robinn@rdiland.org robinnielsen@rdiland.org](https://img.dokumen.tips/doc/110x75/5ae47a867f8b9a90138f07ad/xls-viewrobinkentuckyyahoocom-robinagorehotmailcom-robinnrdilandorg-robinnielsenrdilandorg.jpg)


