Embed Size (px)
Citation preview
201
13 Noise and Vibration
13.1 Introduction
This section of the ES describes the noise and vibration impacts arising from the construction and operation of the scheme.
Sections 13.2 presents information on the existing noise climate in the area potentially affected by the tram. Construction impacts are discussed in Section 13.3 (noise) and 13.4 (vibration) and operational impacts in Section 13.5 (tram operating noise), 13.6 (depot operation), 13.7 (operational vibration) and 13.8 (road traffic noise). Criteria against which predicted noise and vibration levels are assessed have been derived from recognised national and international guidance. Where noise and vibration predictions show the potential for significant impacts the scope for mitigation has been investigated and proposed measures are set out. Any residual impacts remaining after mitigation has been applied are described.
A glossary of terminology used in the assessment is provided in Appendix I.
13.2 Baseline Environment
13.2.1 Overview
An important consideration in assessing the noise impact of any proposal is the change in ambient noise levels that it produces at noise sensitive receptors (eg residential dwellings and schools). Accordingly, a baseline noise survey has been carried out close to potentially affected receptors to determine existing noise levels. This was undertaken in July 2003 and established noise conditions at 26 representative receptor locations along the route. The monitoring locations are shown on Figure 13.1.
The survey measured 10 minute samples of ambient noise at positions adjacent to the chosen receptors. The LA10, LA90, LAeq and LAmax noise levels were recorded using calibrated sound level meters. The monitoring equipment was set up so that the microphone was in a free-field position approximately 1.5 m above ground level adjacent to the receptor. Levels were measured during the day and evening, and also in night-time hours when the tram will operate (ie 2300 to 0030 hours and 0500 to 0700 hours). Further survey details and the results are presented in Appendix I.
The baseline results used for the purpose of the assessment are presented in Table 13.1 and the existing noise climate on each route section is described below.
13.2.2 Princes Street to Haymarket
The heavy, congested traffic on Princes Street dominated the noise climate in the city centre. The eastbound carriageway on Princes Street is reserved for buses and taxis and therefore the traffic flows more freely. Pedestrians and general activity on the busy streets also contribute to the overall noise climate. The noise from buses setting down and starting up was the major contributor of noise at Shandwick Place, although noise from passing traffic and pedestrians also added to the overall level. Traffic was again the major source of noise at West Maitland Place.

202
Table 13.1 Baseline Noise Levels used in Assessment (Free-field)
Sound Pressure Level (dB) Position Description
Daytime LAeq, 10 mins
Night-time (1) LAeq, 10 mins
LAmax, range of 10min samples
1 Balbirnie Place 55 52 71-81
2 Roseburn Maltings 51 49 59-67
3 Upper Coltbridge Terrace 45 35 54-67
4 Blinkbonny Road 47 37 53-69
5 Craigleith Bank 47 38 50-67
6 South Groathill Avenue 51 48 56-82
7 Groathill Gardens East 47 40 64-67
8 Telford Drive 44 42 60-66
9 West Granton Approach Road 59 55 76-78
10 Pilton March West 68 56 77-84
11 Lower Granton Road 71 65 81-88
12 Trinity Crescent 68 57 75-85
13 Starbank Road 69 65 84-85
14 Pier Place 71 67 80-83
15 Hotel: Ocean Drive 66 58 74-84
16 31 Ocean Drive 63 61 77-79
17 Constitution Place 67 57 79-87
18 30 Constitution Street 66 64 77-82
19 137 Constitution Street 65 63 76-82
20 81 Leith Walk 70 62 77-99
21 329-337 Leith Walk 69 67 76-88
22 Gayfield Place 65 61 76-89
23 York Place 68 65 70-87
24 Princes Street 70 66 82-84
25 Shandwick Place 72 66 82-88
26 West Maitland Place 71 68 84-85 (1) Night-time noise levels were based on measurements generally made in the period 0500 to 0700 hours or 2300 to 0030, with the lowest (i.e. worst case) level reported herein.
Following the route west, the tram runs alongside the Edinburgh to Glasgow railway line. The frequent trains approaching and leaving Edinburgh and Haymarket dominate the noise climate in this area.
During periods without trains, the area is reasonably quiet, with just the distant sound of traffic from the A8 audible.

203
13.2.3 Roseburn to Drylaw
As the tram heads north, the proposed route is along the disused railway corridor, currently used as a cycle path and walkway. The corridor is screened from most sources of ambient noise by the houses and embankments and the noise climate is therefore quiet along most of this section. Traffic noise is evident at locations close to where roads cross the corridor, such as Haymarket Terrace, Ravelston Dykes, Queensferry Road and Telford Road. Elsewhere along the corridor noise from pedestrians and cyclists is also significant during the day.
13.2.4 Drylaw to Lower Granton Road
Continuing north, the tram route crosses the busy Ferry Road junction and carries on along the recently constructed West Granton Approach Road. The major source of noise in this area is the relatively infrequent but fast traffic along the new road. Ambient traffic from Ferry Road and other local roads also contributes to the overall noise level.
The tram then passes through the industrial estate built around West Harbour Road. There are no noise sensitive receptors along this section of the route and noise level measurements were not undertaken in this area. Vehicles, including HGVs, accessing the various industrial units, along with industrial noise from the industrial facilities, would be expected to dominate the noise climate in this area.
13.2.5 Lower Granton Road to Leith Walk South
After the industrial estate, the tram heads east towards Leith along the coastal roads. The noise climate at all positions along this stretch of the route is dominated by the heavy and frequent traffic on Starbank Road, Pier Place, Lindsay Road and Ocean Drive etc. During the survey the traffic included many buses and HGVs and was therefore subjectively noisy. Traffic accessing the Ocean Terminal shopping and entertainment complex was also a major source of noise, particularly along Ocean Drive. Noise from the Leith Docks was also audible.
The depot is located at the junction of Ocean Drive and Constitution Street. Due to the possibility of 24 hour depot operation, noise levels at this position were recorded throughout the night-time period. Infrequent traffic along the cobbled street was the major source noted at this location. Taxis and vehicles accessing the all night Casino located close by on Ocean Drive made up the majority of the local traffic.
From Constitution Street the tram route continues south along Leith Walk, back towards the city centre. The noise climate at all positions along this section is dominated by heavy traffic, including a significant number of buses and HGVs, travelling both to and from the city centre.
13.2.6 Leith Walk South to Princes Street
At the junction of Leith Walk and York Place, the route runs along York Place before rejoining Princes Street. The noise climate of York Place is dominated by traffic and in particular the large number of buses.

204
13.3 Construction Noise
13.3.1 Predicting Construction Noise
Construction noise has been predicted in accordance with the methodology outlined in British Standard (BS) 5228: Part 1: 1997 (1). This Standard sets out indicative noise level outputs for a wide range of construction plant items and activities expressed as Sound Power Levels (LWA) and Activity LAeq. A glossary of noise terms is provided in Appendix I. The prediction framework allows the quoted noise levels to be extrapolated to potential noise-sensitive receptor positions and LAeq, period noise levels to be derived. Factors that are taken into account include:
• the sound power outputs of processes and plant;
• their periods of operation;
• the distances between noise sources and receptors;
• the presence of screening by barriers;
• the reflection of sound; and
• attenuation by any intervening soft ground.
Construction works will involve a number of different activities. For the purpose of this assessment, the following phases of construction have been considered :
• demolition works;
• enabling works;
• track laying;
• OLE installation; and
• construction of stops.
Noise levels associated with enabling works and track laying will be typical of the noise emissions that will be produced on a day-to-day basis during the construction phase and will affect receptors along the length of the proposed alignment. Demolition works and stop construction are only likely to affect those receptors located within the immediate vicinity of these works.
It is important to note that whilst overall the construction works will take many months, the durations over which noise will be produced in the vicinity of any given receptor will be much shorter. The following rates of work are typical of this type of construction:
• On-street track construction up to 100m per month;
• Off-street track construction up to 200m per month;
• OLE installation c. 200m per month; and
• Stop construction 2-3 months. (1) BS 5228 Noise and vibration control on construction and open sites, Part 1, Code of practice for basic information and procedures for noise and vibration control, BSi 1997.

205
OLE (Overhead Line Equipment) installation has been assumed to involve relatively low key activities in noise terms and will take place for a short period of time (one to two weeks) at each location.
Further details of the construction programme are provided in Appendix A. Normal hours of work may vary from site to site depending upon the nature of the area but normal hours of work are expected to be Monday to Saturday from 0700 hours to 1900 hours. Work will be required outside these hours, but where this is the case, prior approval must be sought from the local authority.
Various equipment is likely to be used during construction including tracked excavators and dozers, pneumatic breakers, cranes and hoists, concrete plant including lorries, mixers and pumps, asphalt spreaders and road rollers and small equipment such as compressors and hand tools. Details are not available at this stage but based on experience from similar projects an inventory of construction site plant has been estimated for each phase of construction, from which an effective total sound power level (LWA) has been calculated for each team of plant (see Appendix I). This has been used to estimate noise levels (LAeq, period) at noise-sensitive receptors based on the distance of the receptor from the centre of the plant team. Distances between receptors and construction activity have been estimated based upon the distance between the most exposed façade of the receptor building and the approximate centre line of the nearest section of track or stop, or the approximate geometric centre of other construction works. Where works are in close proximity to a receptor, it has been assumed that the centre of the noise source is at a distance of 10 m. This is to allow for the effect of plant moving around the works area and maintaining minimum safe working distances from receptors.
13.3.2 Evaluation Criteria
To evaluate the impact of construction noise it is necessary to establish criteria above which some noticeable adverse effect may be experienced. Thresholds above which a significant construction noise impact is considered to occur are set out in Table 13.2. Further details are given in Appendix I.
Table 13.2 Criteria for Significant Noise Impacts During Construction
Period Building/Location (façade level)
Threshold for Significant Impact LAeq
Purpose
Daytime (0700 – 1900) Dwellings/Offices 75 dB To maintain speech intelligibility
Educational Buildings 65 dB To maintain speech intelligibility in classrooms
Evening (1900 – 2300) Dwellings 65 dB To avoid disturbance
Night-time (2300 – 0700) Dwellings
45 dB (1) To avoid sleep disturbance
(1) or equal to ambient LAeq levels if the ambient noise level is higher than 45 dB
The criteria in Table 13.2 apply at 1 m from the façades of residential and other noise sensitive properties and take into account reflection effects. It should be noted that these criteria are not aimed at providing noise limits for construction activities, but are used to determine whether significant impacts are expected to occur.

206
13.3.3 Daytime Construction Noise Impacts
Table 13.3 presents predicted noise levels at receptors during enabling works and track laying along the route in the absence of any measures to mitigate noise. Table 13.4 presents predictions for nearby receptors during stop construction.
Table 13.3 Predicted Worst Case Daytime (Facade) Construction Noise Levels with no Mitigation (Excluding Stops) – dB LAeq, 0700 to 1900 hours
Location Criterion dB LAeq
Building Usage Approx. Distance to Track (m)
Enabling Works
Track Laying
Greatest Exceedance of Criterion
1- Balbirnie Place 75 Residential 10 88 70 13
2- Roseburn Maltings 75 Residential 18 83 71 8
3- Upper Coltbridge Terrace 75 Residential 10 88 70 13
4- Blinkbonny Road 75 Residential 21 82 71 7
5- Craigleith Bank 75 Residential 16 84 71 9
6- South Groathill Avenue 75 Residential 12 87 70 12
7- Groathill Gardens East 75 Residential 17 83 71 8
8- Telford Drive 75 Residential 28 79 71 4
9- West Granton Approach Road 75 Residential 25 80 71 5
10- Pilton March West 75 Residential 10 88 70 13
11- Lower Granton Road 75 Residential 15 84 71 9
12- Trinity Crescent 75 Residential 10 88 70 13
13- Starbank Road 75 Residential 10 88 70 13
14- Pier Place 75 Residential 10 88 70 13
15- Hotel: Ocean Drive 75 Hotel 45 75 72 0
16- 31 Ocean Drive 75 Residential 10 88 70 13
17- Constitution Place 75 Residential 10 88 70 13
18- 30 Constitution Street 75 Residential/Commercial 10 88 70 13
19- 137 Constitution Street 75 Residential/Commercial 10 88 70 13
20- 81 Leith Walk 75 Residential/Commercial 13 86 70 11
21- 329-337 Leith Walk 75 Residential/Commercial 14 85 70 10
22- Gayfield Place 75 Residential/Commercial 19 83 71 8
23- York Place 75 Office 15 84 71 9
24- Princes Street 75 Commercial 23 81 71 6
25- Shandwick Place 75 Commercial 10 88 70 13
26- West Maitland Place 75 Commercial 10 88 70 13

207
Table 13.4 Predicted Worst Case Daytime (Facade) Noise Levels from Construction of Stops with no Mitigation - dB LAeq, 0700 to 1900
Location Stop Criterion dB
Building Usage Approx. Distance to
Stop (m)
Predicted Noise
Level (dB)
Greatest Exceedance of Criterion
S1- Roseberry House Haymarket 75 Office 3 88 13
S2- 1 Wester Coates Terrace Roseburn 75 Residential 5 84 9
S3- Ravelston Court Ravelston Dykes 75 Residential 15 74 0
S4- 16 Craigleith Crescent Craigleith 75 Residential 16 74 0
S5- 41 Groathill Avenue Groathill Road North
75 Residential 50 64 0
S6- 4 Easterdrylaw Drive Crewe Toll 75 Residential 22 71 0
S7- 101 Crewe Road West West Granton 75 Residential 50 64 0
S8- No Receptor Caroline Park - Industrial Estate - - -
S9- No Receptor Granton Waterfront
- Industrial Estate - - -
S10- 1 West Harbour Road Granton Square 75 Residential 7 81 6
S11- 14 Lower Granton Road Lower Granton Road
75 Residential 13 76 1
S12- 113 Pier Place Newhaven 75 Residential 3 88 13
S13- Ocean Terminal Ocean Terminal 75 Commercial 50 64 0
S14- Constitution Place Ocean Drive 75 Residential 80 60 0
S15- 69 Constitution Street Constitution Street 75 Commercial/Residential 5 84 9
S16- 23 Leith Walk Duke Street 75 Commercial/Residential 6 82 7
S17- 271 Leith Walk Balfour Street 75 Commercial/Residential 6 82 7
S18- 72 Elm Row McDonald Rd 75 Commercial/Residential 7 81 6
S19- 14 Picardy Place Broughton St 75 Commercial/Residential 22 71 0
S20- 38 South St Andrew Street St Andrew Square 75 Commercial 2 92 17
S21- 12 South St David Street St Andrew Square 75 Commercial 20 72 0
S22- 90 Princes Street Princes Street East 75 Commercial 19 72 0
S23- 122 Princes Street Princes Street West
75 Commercial 19 72 0
S24- 8 Atholl Crescent Shandwick Place 75 Office 50 64 0
The predictions exclude screening effects which will be significant for works in sections that run through cuttings along the disused railway corridor.
Without mitigation significant impacts are predicted to occur at all the selected receptors during enabling works with levels 10 dB or more above the assessment criterion at more than half. Significant impacts are not predicted to occur during track laying. During stop construction impacts are predicted at 10 locations.
The Control of Pollution Act 1974 requires that best practicable means shall be used to control noise from construction and these will be adopted for construction of Line One. All contractors will be expected to adhere to contract conditions on appropriate methods of construction, choice of plant and

208
equipment and the hours of work. Mitigation measures which will be required to reduce impacts may include:
• fitting of all vehicles and mechanical plant with effective exhaust silencers and maintenance in good and efficient working order;
• use of silenced models for compressors, generators and pumps models fitted with properly lined and sealed acoustic covers or enclosures, which will be kept closed whenever the machines are in use;
• fitting of mufflers or silencers of the type recommended by the manufactures to pneumatic percussive tools;
• shutting down of machines in intermittent use in periods between work, or throttling down to a minimum,
• housing of noise emitting equipment which is required to run continuously in suitable acoustic enclosures;
• maintenance of plant in good working condition to minimise extraneous noises arising from mechanical vibration;
• where practicable, carrying out demolition works using equipment which breaks concrete by bending, in preference to percussive methods;
• where practicable, actuating rotary drills and bursters for excavating hard materials by hydraulic or electrical power;
• siting noisy plant and equipment as far away as possible from noise sensitive receptors, and use of barriers (eg site huts, acoustic sheds or partitions) to reduce the level of construction noise at receptors wherever possible;
• careful vehicle loading and unloading, dismantling scaffolding or moving materials etc to reduce noise emissions; and
• locating accesses to work compounds to keep disturbance from site personnel and vehicles entering or leaving the site to a minimum.
Where these generic measures are not sufficient to control noise, fixed and mobile noise barriers (typically to a height of approximately 2.4 m) will be used adjacent to areas of noisy ground level activity to limit noise at adjacent receptors. Where multi-storey receptors overlook the construction works acoustic enclosures will be used to specifications outlined in BS5228. Low noise construction plant may also be used to further reduce noise.
With these mitigation measures, noise levels should generally be reduced by up to 10 dB(A). This leaves a number of locations where impacts may still occur during enabling works, including areas represented by the receptors at Balbirnie Place, Upper Coltbridge Terrace, Pilton March West, Trinity Crescent, Starbank Road, Pier Place, Ocean Drive, Constitution Place, Constitution Street, Leith Walk, Shandwick Place and West Maitland Place.
Stop construction will take place over approximately two to three months at each site and with mitigation measures is likely to result in residual noise impacts at Rosebery House, Pier Place, and 38 South St Andrew Street.

209
13.3.4 Night-time Noise Impacts
Work at night may be required at a small number of locations during construction, for example at busy road junctions. Locations where this may be required are not currently known, however, where it is required the impact will be much greater due to lower background noise levels and the stricter threshold for significance. Where ambient noise levels are low (less than LAeq, period 45 dB), such as along the disused rail corridor, night-time construction works, even with mitigation, are likely to cause significant impact at residential properties within about 140m unless screening is provided by intervening buildings or topography.
13.3.5 Depot Construction and Temporary Compounds
There are newly constructed residential developments along Constitution Street and Ocean Drive near the proposed depot site. Other land uses nearby are industrial. Two scenarios have been assessed, one with the main construction plant at the centre of the depot site to represent a typical case, and one with plant located just inside the site boundary to represent a worst case.
When works are taking place across the depot site significant impacts are not predicted at the nearest receptors, but impacts could occur at the closest property when work is concentrated near the site boundary.
Near temporary work compounds delivery, operation and storage of plant, equipment and materials will all give rise to noise on an intermittent basis. Provisional locations are identified in Chapter 2 and without mitigation, significant impacts would be expected at any receptors within about 25 metres.
The following mitigation measures will be employed at these locations:
• locating equipment as far from noise sensitive receptors as possible;
• using electrical forklifts and cranes in preference to diesel powered machinery wherever possible;
• locating site offices so that they acoustically screen noisy activities;
• keeping night-time work to a minimum;
• moving materials required for night-time working as close as possible to the work area for which they are required during daytime;
• providing screening of lorry haul routes;
• screening or enclosing noisy activities; and
• maximising the use of pre-fabricated components.
13.4 Construction Vibration
Vibration from construction works can cause:
• impacts on people or equipment within buildings; and
• impacts on buildings (or other structures) themselves.
210
Vibration annoyance and damage from construction work is most typically associated with percussive piling. This is not expected to be required for construction of Line One and other sources (operation of heavy equipment and vehicles) will give rise to lower levels. Whilst these may be perceptible at receptors close to construction activity, the temporary nature of the works mean that they is not expected to give rise to adverse comment from residents or other occupiers. Vibration should not cause cosmetic or structural damage at any properties along the route.
13.5 Noise from Tram Operations
13.5.1 Prediction of Noise from Tram Operations
Noise from tram operations has been predicted using a spreadsheet model implementing calculation routines based on the Calculation of Railway Noise procedure (CRN), produced by the Department of Transport in 1995. Adjustments have been made to allow for differences between the typical characteristics of trams and conventional railways, so tram speeds are generally slower, receptors can be much closer and routes often run on-street. A specific noise/speed relationship has been used based on measurements taken on Croydon Tramlink scheme (Bombardier C400 vehicle) and other comparable street-running systems.
Predictions are based on the following frequencies of service:
• Monday to Friday 0500-0700 4 trams per hour
0700-1900 8 trams per hour
1900-0030 4 trams per hour
• Saturday 0600-0900 4 trams per hour
0900-0000 8 trams per hour
• Sunday 0600-0030 4 trams per hour
Where there are tight bends on the route there may be the potential for wheel squeal to occur. These locations have been identified, and are discussed below.
13.5.2 Evaluation of Tram Noise
The significance of noise from new developments is usually evaluated:
• by comparing the levels of noise that are expected to be generated with the new source against threshold levels at which annoyance or disturbance of everyday activities is likely to occur; and/or
• by considering the change in noise that will occur with the development in operation.
This assessment adopts both approaches drawing guidance from Planning Advice Note PAN 56 (1) and other sources discussed in Appendix I. The potential for a significant noise impact is considered to arise if the overall ambient noise at a receptor (calculated as a free-field level) exceeds 55 dB LAeq 16
hour during the daytime (0700-2300 hours) and 45 dB LAeq 8 hour at night (2300-0700 hours).
(1) The Scottish Office Development Department (April 1999) Planning Advice Note: PAN 56 Planning and Noise.

211
If noise with the scheme falls below these thresholds then no impacts are expected. If noise is above these thresholds then the significance of the impact is evaluated by considering the change in overall ambient noise level at the receptor. The predicted level of tram noise is added to the measured ambient noise level to establish the change in noise that would be expected, and significance is rated in accordance with the Institute of Acoustics and Institute of Environmental Assessment and Management’s draft guidance on the Assessment of Environmental Noise(1) .
• <3 Slight
• 3-5 dB Moderate
• 5-10 dB Substantial
• >10 dB Severe.
In addition if maximum pass-by free-field noise (LAmax, the instantaneous ‘peak’ as the tram passes) exceeds 82 dB a significant impacts is considered to occur, based on guidance in PAN56 on prevention of sleep disturbance.
13.5.3 Predicted Tram Noise Impacts
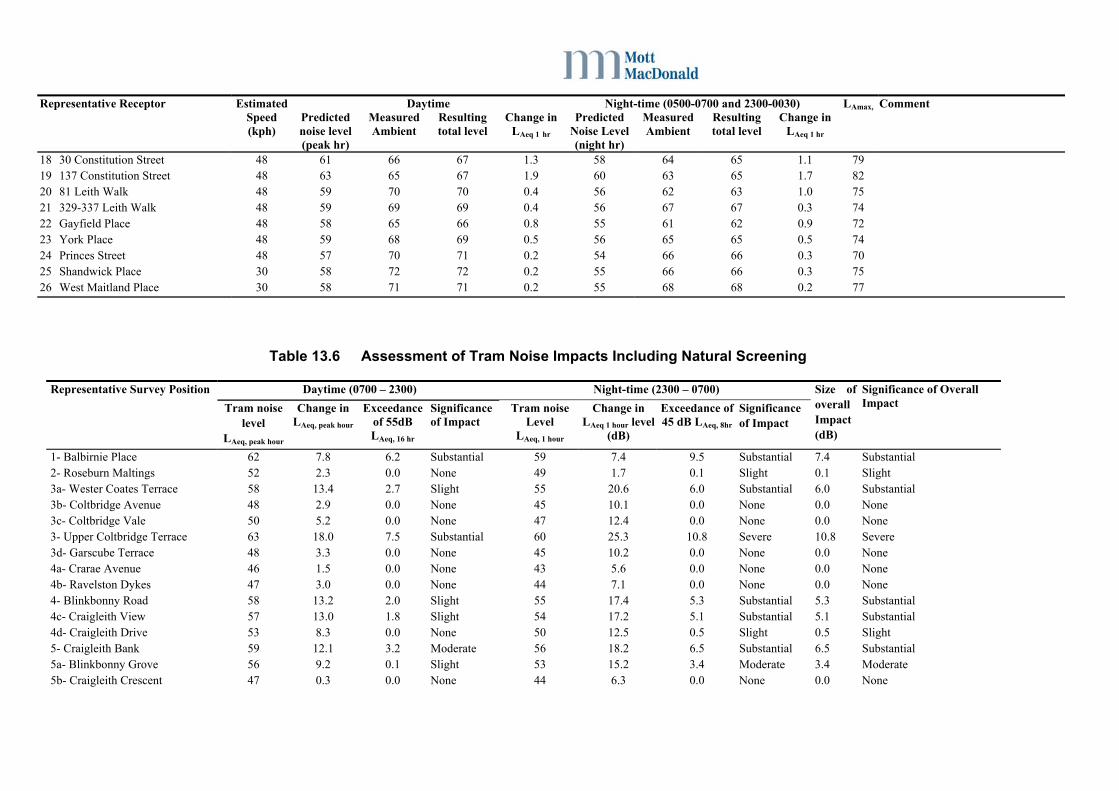
Predicted noise levels during operation of Line One are set out in Table 13.5. The peak LAeq 1 hour noise levels from the tram, the measured ambient level, the resulting total ambient level with the tram, and the change in ambient, during the day (0700–2300) and at night (2300-0030 and 0500-0700), together with the maximum pass-by level, are presented for each receptor location. Night-time noise predictions are omitted where the receptor is not residential, and therefore not sensitive to night-time noise impacts. There will be some natural noise screening effects at certain receptors along the disused rail corridor/cycle path as the track varies between being at grade, within a cutting or on embankment. These locations are noted in Table 13.5.
Table 13.6 presents the results amended to account for the pattern of traffic over the full day (16 hours) and all night (8 hours) and to take into account screening. The longer periods are used so that the overall noise level with the tram can be compared with the thresholds for significant noise impact identified above (55dB LAeq 16 hour during the day and 45 dB LAeq 8 hour at night). When averaged over a full 8 hour night the LAeq, 8 hour level is around 4 dB lower than the LAeq 1 hour levels because of the absence of service between 0030 and 0500. In the daytime, the LAeq 16 hour level is 1dB lower than the peak LAeq 1 hour level because of the reduced service level in the evening.
The significance of changes in noise levels during the day and at night is identified and an overall assessment is made based on the period with the most significant impact at each location.
Line One operation will increase raise ambient noise levels at the majority, but not all receptors, by varying amounts. The findings are summarised for each section below. It should be noted that these predictions exclude any mitigation other than that provided by the existing landform.
West Princes Street to Drylaw Impacts at receptors along Princes Street, Shandwick Place and West Maitland Place are generally slight because of high baseline noise levels in the city centre. Following the alignment west towards the Roseburn Railway Corridor, severe impact is predicted at Upper Coltbridge Terrace as a result of low background noise levels and the small distance between
(1) Institute of Environmental Management and Assessment and Institute of Acoustics (April 2002) Guidelines for Noise Impact Assessment, consultation draft.
212
the alignment and the affected properties. Substantial impacts are predicted at Balbirnie Place, Wester Coates Terrace, Blinkbonny Road, Craigleith View, Craigleith Bank, Groathill Road South, South Groathill Avenue and Groathill Gardens East and moderate impacts at Blinkbonny Grove, Groathill Avenue, Telford Drive and Easter Drylaw Avenue. Slight impacts are predicted at Roseburn Maltings, Craigleith Drive, Blinkbonny Grove West and Maidencraig Crescent. The impact of the tram at these and other locations is lessened by the natural screening provided by the existing embankments. Mitigation is discussed below. Drylaw to Lower Granton Road The section of the route from Drylaw to Lower Granton Road is mainly through industrial areas that are not noise sensitive. The only noise sensitive receptors identified are on the West Granton Approach Road and West Pilton March. Slight and moderate noise impacts are predicted at these receptors, respectively. Lower Granton Road to Leith Walk South There are many noise sensitive receptors identified on the coastal route from Lower Granton Road to Leith Walk South. However, due to high background noise levels tram noise is not expected to increase ambient noise levels by more than 3dB, so the predicted impacts due to tram noise do not exceed slight at any receptor.

Table 13.5 Predicted Noise Levels and Increases in Ambient Noise (dB LAeq, 1 hour free-field)
Daytime Night-time (0500-0700 and 2300-0030) Comment Representative Receptor Estimated Speed (kph)
Predicted noise level (peak hr)
Measured Ambient
Resulting total level
Change in LAeq 1 hr
Predicted Noise Level (night hr)
Measured Ambient
Resulting total level
Change in LAeq 1 hr
LAmax,
1 Balbirnie Place 70 62 55 63 7.8 59 52 60 7.4 83 2 Roseburn Maltings 60 52 51 55 3.8 49 49 52 3.3 70 Tram on embankment 5dB screening 3a Wester Coates Terrace 70 58 45 59 13.4 55 35 55 20.6 75 3b Coltbridge Avenue 70 58 45 58 12.9 55 35 55 20.1 75 Tram on embankment 10dB screening 3c Coltbridge Vale 70 57 45 57 12.2 54 35 54 19.4 73 Tram on embankment 7dB screening 3d Garscube Terrace 70 53 45 53 8.3 50 35 50 15.2 65 3 Upper Coltbridge Terrace 70 63 45 63 18.4 60 35 60 25.7 86 4a Crarae Avenue 70 56 45 56 11.5 53 37 53 15.6 71 Tram in cutting 10dB screening 4b Ravelston Dykes 70 56 45 57 12.0 53 37 53 16.1 72 Tram in cutting 10dB screening 4 Blinkbonny Road 70 58 45 58 13.2 55 37 55 17.4 74 4c Craigleith View 70 57 45 58 13.0 54 37 54 17.2 74 4d Craigleith Drive 70 59 45 59 14.3 56 37 56 18.5 77 Tram on embankment 6dB screening 5 Craigleith Bank 70 59 47 59 12.2 56 38 56 18.4 77 5a Blinkbonny Grove 70 56 47 56 9.2 53 38 53 15.2 70 5b Craigleith Crescent 70 57 47 57 10.3 54 38 54 16.3 73 Tram in cutting 10dB screening 5c Blinkbonny Grove West 70 55 47 56 8.7 52 38 52 14.6 69 6 South Groathill Avenue 70 60 51 61 10.2 57 48 58 9.8 80 7a Maidencraig Crescent 70 55 47 55 8.5 52 40 52 12.0 69 7b Groathill Road South 70 62 47 62 15.5 59 40 59 19.3 84 7 Groathill Gardens East 70 59 47 59 11.8 56 40 56 15.5 76 7c Groathill Avenue 70 57 47 57 10.0 53 40 54 13.6 72 8 Telford Drive 65 56 44 56 12.7 53 42 53 11.3 72 8a Easter Drylaw Drive 70 57 44 57 13.7 54 42 54 12.3 73 9 West Granton Approach Road 70 57 59 61 2.1 54 55 58 2.4 73 10 Pilton March West 70 62 68 69 0.9 59 56 61 4.6 83 11 Lower Granton Road 48 57 71 71 0.2 54 65 65 0.3 74 12 Trinity Crescent 30 59 68 69 0.5 56 58 60 2.1 77 13 Starbank Road 30 60 69 70 0.5 57 65 66 0.6 81 14 Pier Place 30 59 71 71 0.2 56 67 67 0.3 77 15 Hotel: Ocean Drive 25 50 66 66 0.1 47 58 59 0.3 61 16 31 Ocean Drive 30 59 63 64 1.6 56 61 62 1.2 78 17 Constitution Place 25 57 67 67 0.4 54 57 59 1.9 77
Daytime Night-time (0500-0700 and 2300-0030) Comment Representative Receptor Estimated Speed (kph)
Predicted noise level (peak hr)
Measured Ambient
Resulting total level
Change in LAeq 1 hr
Predicted Noise Level (night hr)
Measured Ambient
Resulting total level
Change in LAeq 1 hr
LAmax,
18 30 Constitution Street 48 61 66 67 1.3 58 64 65 1.1 79 19 137 Constitution Street 48 63 65 67 1.9 60 63 65 1.7 82 20 81 Leith Walk 48 59 70 70 0.4 56 62 63 1.0 75 21 329-337 Leith Walk 48 59 69 69 0.4 56 67 67 0.3 74 22 Gayfield Place 48 58 65 66 0.8 55 61 62 0.9 72 23 York Place 48 59 68 69 0.5 56 65 65 0.5 74 24 Princes Street 48 57 70 71 0.2 54 66 66 0.3 70 25 Shandwick Place 30 58 72 72 0.2 55 66 66 0.3 75 26 West Maitland Place 30 58 71 71 0.2 55 68 68 0.2 77
Table 13.6 Assessment of Tram Noise Impacts Including Natural Screening
Daytime (0700 – 2300) Night-time (2300 – 0700) Representative Survey Position
Tram noise level
LAeq, peak hour
Change in LAeq, peak hour
Exceedance of 55dB LAeq, 16 hr
Significance of Impact
Tram noise Level
LAeq, 1 hour
Change in LAeq 1 hour level
(dB)
Exceedance of 45 dB LAeq, 8hr
Significance of Impact
Size of overall Impact(dB)
Significance of Overall Impact
1- Balbirnie Place 62 7.8 6.2 Substantial 59 7.4 9.5 Substantial 7.4 Substantial 2- Roseburn Maltings 52 2.3 0.0 None 49 1.7 0.1 Slight 0.1 Slight 3a- Wester Coates Terrace 58 13.4 2.7 Slight 55 20.6 6.0 Substantial 6.0 Substantial 3b- Coltbridge Avenue 48 2.9 0.0 None 45 10.1 0.0 None 0.0 None 3c- Coltbridge Vale 50 5.2 0.0 None 47 12.4 0.0 None 0.0 None 3- Upper Coltbridge Terrace 63 18.0 7.5 Substantial 60 25.3 10.8 Severe 10.8 Severe 3d- Garscube Terrace 48 3.3 0.0 None 45 10.2 0.0 None 0.0 None 4a- Crarae Avenue 46 1.5 0.0 None 43 5.6 0.0 None 0.0 None 4b- Ravelston Dykes 47 3.0 0.0 None 44 7.1 0.0 None 0.0 None 4- Blinkbonny Road 58 13.2 2.0 Slight 55 17.4 5.3 Substantial 5.3 Substantial 4c- Craigleith View 57 13.0 1.8 Slight 54 17.2 5.1 Substantial 5.1 Substantial 4d- Craigleith Drive 53 8.3 0.0 None 50 12.5 0.5 Slight 0.5 Slight 5- Craigleith Bank 59 12.1 3.2 Moderate 56 18.2 6.5 Substantial 6.5 Substantial 5a- Blinkbonny Grove 56 9.2 0.1 Slight 53 15.2 3.4 Moderate 3.4 Moderate 5b- Craigleith Crescent 47 0.3 0.0 None 44 6.3 0.0 None 0.0 None

Daytime (0700 – 2300) Night-time (2300 – 0700) Representative Survey Position
Tram noise level
LAeq, peak hour
Change in LAeq, peak hour
Exceedance of 55dB LAeq, 16 hr
Significance of Impact
Tram noise Level
LAeq, 1 hour
Change in LAeq 1 hour level
(dB)
Exceedance of 45 dB LAeq, 8hr
Significance of Impact
Size of overall Impact(dB)
Significance of Overall Impact
5c- Blinkbonny Grove West 55 8.7 0.0 None 52 14.6 2.8 Slight 2.8 Slight 6- South Groathill Avenue 60 10.0 4.5 Moderate 57 9.6 7.8 Substantial 7.8 Substantial 7a- Maidencraig Crescent 55 8.5 0.0 None 52 12.0 2.5 Slight 2.5 Slight 7b- Groathill Road South 59 11.8 2.9 Slight 56 15.5 6.2 Substantial 6.2 Substantial 7- Groathill Gardens East 59 11.8 2.9 Slight 56 15.5 6.2 Substantial 6.2 Substantial 7c- Groathill Avenue 57 10.0 0.9 Slight 53 13.6 4.2 Moderate 4.2 Moderate 8- Telford Drive 56 12.6 0.3 Slight 53 11.2 3.6 Moderate 3.6 Moderate 8a- Easter Drylaw Drive 57 13.7 1.4 Slight 54 12.3 4.8 Moderate 4.8 Moderate 9- West Granton Approach Road 57 2.1 1.3 Slight 54 2.4 4.6 Slight 2.4 Slight 10- Pilton March West 62 0.9 6.2 Slight 59 4.6 9.5 Moderate 4.6 Moderate 11- Lower Granton Road 57 0.2 1.2 Slight 54 0.3 4.5 Slight 0.3 Slight 12- Trinity Crescent 59 0.5 3.3 Slight 56 2.1 6.6 Slight 2.1 Slight 13- Starbank Road 60 0.5 4.3 Slight 57 0.6 7.6 Slight 0.6 Slight 14- Pier Place 59 0.2 3.0 Slight 56 0.3 6.3 Slight 0.3 Slight 15- Hotel: Ocean Drive 50 0.1 0.0 None 47 0.3 0.0 None 0.0 None 16- 31 Ocean Drive 59 1.6 3.6 Slight 56 1.2 6.9 Slight 1.6 Slight 17- Constitution Place 57 0.4 1.4 Slight 54 1.9 4.7 Slight 1.9 Slight 18- 30 Constitution Street 61 1.3 5.9 Slight 58 1.1 9.2 Slight 1.3 Slight 19- 137 Constitution Street 63 1.9 7.2 Slight 60 1.7 10.5 Slight 1.9 Slight 20- 81 Leith Walk 59 0.4 3.8 Slight 56 1.0 7.1 Slight 1.0 Slight 21- 329-337 Leith Walk 59 0.4 3.5 Slight 56 0.3 6.8 Slight 0.4 Slight 22- Gayfield Place 58 0.8 2.3 Slight 55 0.9 5.6 Slight 0.9 Slight 23- York Place 59 0.5 3.2 Slight 56 0.5 6.5 Slight 0.5 Slight 24- Princes Street 57 0.2 1.4 Slight 54 0.3 4.7 Slight 0.3 Slight 25- Shandwick Place 58 0.2 2.1 Slight 55 0.3 5.4 Slight 0.3 Slight 26- West Maitland Place 58 0.2 2.1 Slight 55 0.2 5.4 Slight 0.2 Slight

216
Leith Walk South to West Princes Street On the section from Leith Walk South to West Princes Street, slight noise impacts have been predicted at noise sensitive receptors. Along the Lower Granton Road to Leith Walk South section, high background noise levels reduce the impact of the tram.
13.5.4 Mitigation of Operating Noise Given the scale of potential noise impacts the selection of the tram vehicles for the system will include stringent noise performance standards. Whilst this assessment is based on a typical modern tram design, it may be possible to select a slightly quieter model which will reduce impacts at all locations below those predicted in the assessment. Noise control will also be important in the selection of tram and track systems, and will be tested throughout the development and commissioning of the scheme. It will be particularly important to ensure a high standard of maintenance during the operating life of the system to avoid noise levels increasing unnecessarily due to wear and tear of the wheel and rail surfaces. Impacts ranked as slight in this assessment are not considered to require further mitigation. These include on street running sections where the effect of tram noise adding to road traffic noise will be small. One exception to this is along West Pilton March where moderate impacts are likely in the quieter night-time periods. Here, it is anticipated that a roadside noise barrier could be built as identified below. Along the disused rail corridor where more significant impacts are predicted to occur, careful design and positioning of noise barriers will provide acoustic screening. Bunds and barriers will offer substantial mitigation where necessary. These are identified in Table 13.7.
Table 13.7 Potential Noise Barrier Locations
Receptor Number
Description Estimated Number of Properties Affected
Indicative Length of Barrier Required (m)
1 Balbirnie Place 30 250 3a Wester Coates Terrace 10 250 3 Upper Coltbridge Terrace 6 10 4 Blinkbonny Road 30 300 4c Craigleith View 13 200 5 Craigleith Bank 25 10 5a Blinkbonny Grove 10 130 6 South Groathill Avenue 10 50
Groathill Road South & 7 Groathill Gardens East
30 250
7c Groathill Avenue 20 220 8 Telford Drive 30 250 8a Easter Drylaw Drive 50 500 10 Pilton March West 6 100
This assessment indicates that 2.5km of noise barriers could be required to mitigate predicted impacts. The actual requirement will depend on elements of the design of the system that will affect noise, including the precise alignment of the track, tram speeds, and ground formations that may provide acoustic screening. It will therefore be necessary to consider the requirements for noise barriers in greater detail as the design progresses to make this possible. It will also be necessary to consider the practicality of barriers in particular locations.
217
Factors to be considered in each location will include: • track safety: HMRI requirements limit structures close to railway tracks so as to allow room for
escape; this means that in general a noise barrier can be located no closer than approximately 3m from the track and may make barriers impracticable, for example on embankments;
• tram driver sight line requirements: on curves noise barriers could compromise line of sight ahead,
and so may be impossible;
• visual impact: in highly visible locations noise barriers may not be desirable;
• insecurity: in built up areas noise barriers can create areas where anti-social and criminal activity can be encouraged by being hidden from view; barriers can also attract graffiti;
• construction and maintenance difficulties: noise barriers can require deep foundations or be
unstable on sloped land. Residents views will also be important in determining the appropriateness of barriers in particular locations. It is anticipated that in most cases, noise barriers will be possible. With noise barriers, houses bordering the Roseburn Railway Corridor will notice some change to the noise environment, but residual impacts should be slight. Where barriers are provided their designs will be developed to integrate with the track, footpath and OLE. Where the track is on embankment locating barriers as close as possible to the tracks will minimise their height. Where noise barriers are visible to adjacent houses materials sympathetic to the local setting will be used and suitable landscaping included. Noise from within trams and at tram stops will be avoided by making announcements inside the vehicle. Emergency, safety, security and service disruption announcements may occasionally be needed at stops. The use of screens at the rear of platforms, directional speakers and signal limiting devices will help to minimise impacts from these announcements. Output sound levels will be lowered within applicable guidance limits, in sensitive locations.
13.5.5 Curve Noise As trams travel around sharp curves the contact with the rails can cause wheel squeal. This results from lateral slipping of the wheel sets relative to the rail as the tram passes around the curve. The wheel undergoes a number of sticking and slipping events that excite the wheel into vibration that leads to sound being generated. In general, wheel squeal will not occur where the track radius is greater than 100 times the vehicle wheelbase (for non-steering axles) although it can sometimes occur at much lower radii. Many factors influence the occurrence of wheel squeal including tram speed, wheel design and track condition. Based upon the above conservative guidance, curve noise could occur at various locations on the Line One route listed in Table 13.8.

218
Table 13.8 Locations of Possible Curve Related Noise
Location
Estimated Curve Radius (m)
Receptors
Crewe Toll “S-Bend” 25 Residential Caroline Park 35 Industrial West Harbour Road 35 Residential Ocean Terminal/Ocean Drive 30 Hotel Ocean Drive to Victoria Dock 30 Commercial Ocean Drive to Constitution Street 50 Residential York Place to North St Andrew St 35 Commercial York Place to North St David St 35 Commercial South St Andrew St to Princes St 35 Commercial South St David St to Princes St 35 Commercial
Three locations are in the vicinity of residential properties. In general ambient noise levels in these areas are high and will tend to lessen the impact, but measures will be taken to minimise its occurrence in design of the tram (eg acoustic damping of wheels) and if necessary dampening the wheels with water to reduce wheel/rail frictional forces.
13.6 Impacts from Depot Operation The tram depot will be located on Constitution Street. It will be used for storage and maintenance of the trams and as the operations centre. As such, there is the potential for noisy activity within and around the depot including vehicle cleaning, use of machine tools, compressors and lifting jacks, and bogey handling. At this stage detailed predictions of noise from the depot are not possible, however, indicative noise levels can be gauged from experience at similar light rail service sheds and depots, for example London Underground Ltd’s Stratford Market Depot. The noise from the depot is likely to arise mainly within buildings, although doors to the buildings will be opened from time to time. It is assumed that the majority of works within the depot will be at night as the trams will be in use during the day. Table 13.9 provides a preliminary assessment of possible impacts associated with the operation of the Edinburgh Tram Depot based on indicative noise predictions. Impacts have been calculated from a sound power level from the depot shed assuming the operations described above and taking into account noise break out from the opening of the doors.
Table 13.9 Possible Night-time Impacts Associated with the Operation of the Edinburgh Tram Depot
Receptor Distance to Depot Boundary (m)
Building Usage Likely Significance of Unmitigated Night-time Noise Impact
4 Constitution Street 70 Residential Moderate 1 Constitution Street 25 Residential Severe Casino (Ocean Drive) 60 Leisure Substantial 15 Constitution Place 40 Residential Substantial
This preliminary assessment indicates that night-time operation of the depot will result in significant noise impacts. A detailed noise impact study will be undertaken at a later stage in accordance with the BS4142 method based on the final building layout, uses, materials and operating procedures. Whilst there will be opportunities to reduce the noise impacts through careful design of the building,

219
mitigation for external noise sources, such as tram shunting and washing, will be limited and given the proximity to residential areas some level of residual noise impact is likely.
13.7 Vibration from Tram Operations Movement of trams has the potential to cause impacts through vibration, causing building occupiers to perceive vibration and at certain levels to become annoyed by it. There may also be concern that vibration from tram vehicles could damage building structures. These impacts are evaluated by reference to the criteria set out in Table 13.10.
Table 13.10 Criteria for Evaluating the Significance of Vibration During Construction
Period Building/Location Criterion Purpose
Anytime Any location 0.1 mm/s rms Limit of perception
Daytime (0700 – 2300) Inside dwellings 0.4 m/s 1.75 VDV Prevention of annoyance
Night-time (2300 – 0700) Inside dwellings 0.13 m/s 1.75 VDV Prevention of annoyance
Anytime Reinforced or framed buildings
50 mm/s PPV Protection of building structure
Anytime Un-reinforced or light framed buildings
15 mm/s PPV Protection of building structure
rms = root mean square velocity; ground vibration can be perceived at rms > 0.1 mm/sec. VDV = vibration dose value is a measure of the accumulated level of ground vibration over a period and is used to predict the likelihood of adverse comments from building occupants (BS 6472, 1992). PPV = peak particle velocity; ground vibration can be perceived at PPV > 0.15 to 0.3 mm/sec (BS 7385 Part 2, 1993).
Estimates of levels of ground vibration from Line One have been made based on levels measured adjacent to comparable systems, including a detailed investigation into vibration levels from Phase 1 of the Manchester Metro in 1996 (1). The Manchester Metro study involved 150 train pass-by vibration measurements, at four locations involving street running operation and three locations involving ballasted track running. The trackform of street running sections comprised welded rail mounted in an Edilon lined resilient trench. The results are summarised below in Table 13.11.
Table 13.11 Measured Vibration Levels from the Manchester Metrolink – Street Running Sections at Full Speed
Distance to nearest rail (m)
Peak particle velocity (mm/s)
Weighted acceleration (m/s2)
Estimated VDVday (m/s1.75)(1)
1 to 3 1.5 to < 2.0 0.06 to < 0.1 0.5 to < 1.0
3 to 5 1.0 to 1.2 0.03 to 0.06 0.2 to 0.5
5 to 10 0.6 to 1.0 0.01 to 0.03 0.08 to 0.2
10 to 15 0.3 to 0.6 0.005 to 0.01 0.03 to 0.08
(1) Presentation of Vibration Data Measures on Phase 1 of the Manchester Metrolink, ERM, Halcrow Fox and CES, February 1996

220
Distance to nearest rail (m)
Peak particle velocity (mm/s)
Weighted acceleration (m/s2)
Estimated VDVday (m/s1.75)(1)
15 to 20 0.15 to 0.3 0.003 to 0.005 0.015 to 0.03
(1) Vibration Dose Value
The levels tabulated above are considered to provide a reasonable estimate of the ground vibration levels that can be expected from Line One. It is expected that a resilient track system will be used. These levels are below the criteria in Table 13.5 for the structural integrity of buildings and no impacts on buildings located adjacent to the scheme are therefore expected to occur. Ground vibration may be perceptible at receptors within approximately 20 m of the alignment (depending on final design details). There are properties within this distance along the Roseburn corridor. The estimated VDV levels are not expected to exceed the 0.4 m/s1.75 criterion for daytime annoyance beyond approximately 4 m from the tracks. Hence, whilst vibration may be perceptible it is not expected to give rise to adverse comment and significant impacts are not expected to occur.
Rail transport systems can also generate ground borne noise (noise radiating from the ground as a result of vibration rather than being transmitted through the air). Ground borne noise from trams is usually at levels below noise arriving via the conventional airborne path and is generally of more concern for underground railways where airborne noise is absent and resilient track forms of various types are used as mitigation. For the tram, particularly sensitive buildings that are well insulated against external airborne noise sources, could be affected. No such land uses have been identified next to the Line One route and impacts from ground borne noise are not predicted to occur.
13.8 Changes in Road Traffic Noise
In addition to noise impacts arising directly from tram operations, Line One will also affect the noise climate in Edinburgh by changing traffic flows on the road network. Road traffic changes are described in Chapter 5. The impacts of these changes on noise have been assessed following the approach detailed in STAG and GOMMS(1). The key performance measure used in the appraisal is the change in estimated population annoyed by noise (measured in households).
Indicative traffic noise levels (the Basic Noise Level from the Calculation of Road Traffic Noise) have been calculated using outputs from traffic modelling (link-based traffic flow, speed and heavy vehicle composition data) on over 1300 road links, for the base case today and with and without the scheme in 2011 and 2026. The noise level calculations are approximate as effects of road gradient and topographic screening are not considered, approximations are made for traffic at slow speed, and a nominal road to receptor separation distance is assumed. However, these approximations do not effect the change in noise that may be produced from the change in traffic flow, speed and composition produced by the scheme.
The numbers of households exposed to different levels of change in traffic noise with the scheme have been estimated using 2001 census data. Households are counted within a standard assumed zone of noise influence 25m either side of each link.
(1) Scottish Transport Appraisal Guidance, 2003 and Department of Transport Guidance on Multi-Modal Studies, 2002.

221
A standard noise/annoyance response relationship is applied to the calculated noise levels and household numbers to give an estimate of households annoyance for each link. These are then summed across all links to give the total for the whole study area, thus allowing the overall change in annoyance to be established for each case.
Where road links overlap, households are counted more than once. This has been addressed by applying a correction factor to the total estimates summed across all links. The estimates are therefore approximate, but they do provide an adequate basis for comparing the relative noise annoyance of different cases.
It must be appreciated that this approach to the traffic noise appraisal is indicative only and should not be interpreted as providing any indication of actual noise levels at particular properties.
The results are presented in Table 13.12.
Table 13.12 Assessment of Household Annoyance
Scheme Estimated Households Annoyed Existing 14500 2011 Do Minimum 14800 2011 With Scheme 14800 2026 Do Minimum 15400 2026 With Scheme 15400
It can be seen that there is expected to be an increase in road traffic annoyance between now and 2011 and 2026 without the tram. This is caused by the expected general increase in road traffic. In comparison there will be no significant change in noise annoyance caused by the tram in either 2011 or 2026. Numbers of households affected by perceptible increases and decreases in noise levels (ie of more than 3dB) have also been estimated using a similar technique and are reported in Table 13.13.
Table 13.13 Households Exposed to Perceptible Noise Changes
With Scheme Households experiencing increase in road traffic noise
levels of >3dB
Households experiencing decrease in road traffic noise
levels of >3dB 2011 0 50 2026 0 50
Based on the traffic modelling data available at this stage, no properties are predicted to experience perceptible increases in noise and there will be a small number experiencing a perceptible decrease suggesting a very small beneficial impact from Line One operation.