Embed Size (px)
Citation preview

Annual Report 2010
www.hnbassurance.com
HN
B A
SSUR
AN
CE
PLC
AN
NU
AL
RE
POR
T 2010
make us howe are
You www.hnbassurance.com

Companies are no greater than their stakeholders - those who bring power, wealth and integrity to each enterprise. Our stakeholders include our Shareholders, Customers, Employees, Business Partners, Environment and Society at large.
We recognise that YOU are the strength of our organisation, the reason for our success. Together we created this strongly knitted organisation; that is HNB Assurance.
Annual Report 2010
make us howe are
You
In 2001, a small sapling; HNB Assurance was planted in the vast Insurance Industry by Hatton National Bank PLC, one of the largest commercial banks in Sri Lanka. It was a small player among the giants, but its intentions were high to grow bigger and stronger. Day by day it grew taking the attention of all; customers, shareholders and business partners who were looked after with extended care. Its existence could not be shaken by the intense competition. Extensive skills and competencies have been rendered by the workforce showing great potential in achieving success, a fact that can never be forgotten.
Time has created it so firm; now it can give protection to whoever who comes under it. HNBA is standing at the threshold of an important milestone in its history, with open arms to welcome an enlightened future...
Produced by eMAGEWISE®
Photography by Studio TimesDigital Plates by Imageline Printing by ACE Printing & Packging

1HNB ASSURANCE PLC ANNUAL REPORT 2010
Contents
Vision, Mission and Values Statement 2Corporate Information 3Financial Highlights 4Chairman’s Message 6Managing Director’s Review 8Board of Directors 12Executive Committee 15Management Team 16Operational Highlights 18
Management Discussion & Analysis
Overview 20Financial Review 26General Insurance Review 32Life Insurance Review 40Review of the Investment Portfolios 45Human Resources Review 47Distribution Network 49HNB Assurance Brand 51IT Review 52Future Outlook 54
Sustainability Report
Managing Director’s Statement 56How We Think About Sustainability 57The Value We Add to our Stakeholders 64Shareholders 65Employees 68Business Partners 76Customers 81Community 86Environment 91Key Performance Indicators 93Global Reporting Initiative (GRI) G3 Index 95
Corporate Governance and Risk Management
Corporate Governance 100A snapshot of HNBA level of Compliance with the Code of Best Practice on Corporate Governance 102Compliance Status with the Code of Best Practice on Corporate Governance 103Other Aspects of Corporate Governance Initiatives 120Compliance Table with the Listing Rules of CSE 124Composition and Main Functions of Board Sub - Committees 126Risk Management 127
Financial Information
Audit Committee Report 140Remuneration Committee Report 143Annual Report of the Board of Directors on the Affairs of the Company 145Directors’ Interest in contracts with the Company 151 Directors’ Responsibility for Financial Reporting 152 Chief Executive Offi cer’s and Chief Financial Offi cer’s Responsibility Statement 153Certifi cation of Incurred But Not Reported (IBNR) and Incurred But Not Enough Reported (IBNER) Claims Reserve 154Report of the Life Actuary 155Financial Calendar 156Independent Auditor’s Report 157Balance Sheet 158Statement of Income 159Statement of Changes in Equity 160Cash Flow Statement 161Balance Sheet - Segmental Review – 2010 162Balance Sheet - Segmental Review – 2009 163 Income Statement - Segmental Review – 2010 164Income Statement - Segmental Review – 2009 165Cash Flow Statement - Segmental Review – 2010 166Cash Flow Statement - Segmental Review – 2009 167Notes to the Financial Statements 168Balance Sheet of the Life Insurance Fund - Supplemental 192Notes to the Balance Sheet of the Life Insurance Fund – Supplemental 193 Insurance Revenue Accounts 199Share Information 200Quarterly Analysis 2010 and 2009 203Ten Year Summary 204Glossary 206 Notice of Meeting 208Form of Proxy 209Investor Feedback Form 211

2
Values• Show mutual respect in all our interactions
• Empower people to strive for excellence
• Inculcate positive thinking
• Treasure integrity and ethical conduct• Foster diversity as a corporate strength
VisionTo be Sri Lanka’s most admired and trusted partner in meeting insurance needs professionally with a spirit of caring.
MissionWorking together with a passion for excellence and a team spirit none can match, to provide innovative, customised solutions, exploring opportunities beyond conventional boundaries.
3HNB ASSURANCE PLC ANNUAL REPORT 2010
Corporate Information
Name of the CompanyHNB Assurance PLC
Legal FormA Public limited liability Company incorporated on 23rd August 2001 under the Companies Act, No. 17 of 1982 in Sri Lanka. The Company was re-registered under the Companies Act, No. 7 of 2007.
HNB Assurance PLC is a composite insurance Company licensed by the Insurance Board of Sri Lanka (IBSL).
Company Registration No.PQ 108
Stock Exchange Listing The Ordinary Shares of the Company are listed on the Main Board of the Colombo Stock Exchange. Stock Exchange code for the Company share is “HASU”.
Tax Payer Identifi cation (TIN) No.134009373
VAT Registration No.134009373-7000
Fiscal Year-End31st December
Principal ActivitiesCarrying on General and Life Insurance business.
Registered Offi ceNo. 479, T B Jayah Mawatha, Colombo 10, Sri Lanka.
Head Offi ceNo. 10, Sri Uttarananda Mawatha,Colombo 03, Sri Lanka.Telephone - +94 11 2421885 – 7Facsimile - +94 11 4793728E-mail - [email protected] - www.hnbassurance.com
Board of Directors Rienzie T. Wijetilleke - (Chairman)Manjula de Silva - (Managing Director)R TheagarajahM U de SilvaJ M J PereraJ D N KekulawalaPratapkumar de SilvaD M de S WijeyeratneSarath Ratwatte
Board SecretaryIndrani GoonesekeraAttorney-at-Law & Notary Public
Audit CommitteeD M de S Wijeyeratne - ChairmanJ D N KekulawalaSarath Ratwatte
Remuneration CommitteeM U de Silva - ChairmanD M de S WijeyeratneSarath Ratwatte
Investment CommitteeJ D N Kekulawala - ChairmanSarath RatwatteManjula de SilvaRajive Dissanayake
Executive CommitteeManjula de Silva - Managing DirectorLalith Fernando - General Manager- Marketing and DistributionIndrani Weerasinghe - General Manager - LifeNiranjan Manickam - General Manager - GeneralNamal Gunawardhane - Head of IT Chandana L Aluthgama - Head of Corporate Business Development Vipula Dharmapala - Head of Finance
Consultant ActuariesLife InsuranceActuarial and Management Consultants (Pvt) Ltd.,1st Floor, 434, R A de Mel Mawatha, Colombo 03.
General InsuranceM/S. K A PanditConsultants & Actuaries, 2nd Floor, Churchgate House,Veer Nariman Road, Fort, Mumbai - 400 001, India.
GratuityHugh Terry (Fellow of the Institute of Actuaries, U.K.)Insight Consulting Group (Pte) Ltd.,Level 31, 6 Battery Road,Singapore 049909.
AuditorsKPMG Ford, Rhodes, Thornton & Co.,Chartered Accountants,32 A, Sir Mohamed Macan Markar Mawatha, Colombo 03.
Credit Rating (Fitch)National Long Term Rating A (lka)Financial Strength A (lka)
BankersHatton National Bank PLCCommercial Bank of Ceylon PLC
Reinsurance PanelMunich ReToa ReMitsui Sumitomo ReGeneral Insurance Corporation of India Trust ReMalaysian Re BEST Re Korean ReLabuan ReNational Insurance Trust Fund

4
Financial Highlights
Profi t After Tax
Rs. 242 Million
+20%
Rs. Mn. 2010 2009 Change
Gross Written Premium 2,428 2,116 +15%
Net Earned Premium 1,844 1,568 +18%
Investment Income 517 468 +11%
Profi t Before Tax 270 231 +17%
Life Surplus 156 130 +20%
Profi t After Tax 242 202 +20%
Basic Earnings Per Share (Rs.) 6.45 5.38 +20%
Price Earnings Ratio (Times) 12.10 9.21 +31%
Dividend Per Share (Rs.) 1.80 1.50 +20%
Earnings Highlights and Ratios

5HNB ASSURANCE PLC ANNUAL REPORT 2010
Shareholders’ Fund
Rs. 1 Billion
+22%
Rs. Mn. 2010 2009 Change
Assets 4,548 3,672 +24%
Liabilities 3,532 2,841 +24%
Shareholders’ Fund 1,016 831 +22%
Stated Capital 375 375 -
Revenue Reserves 641 456 +41%
Net Assets Per Share (Rs.) 27.10 22.16 +22%
Market Price Per Share - Last Traded Price (Rs.) 78.00 49.50 +58%
Return On Equity (%) 24% 24% -
Life Fund 2,385 1,854 +29%
Funds Under Management 3,421 2,768 +24%
Balance Sheet Highlights and Ratios
6
Chairman’s Message
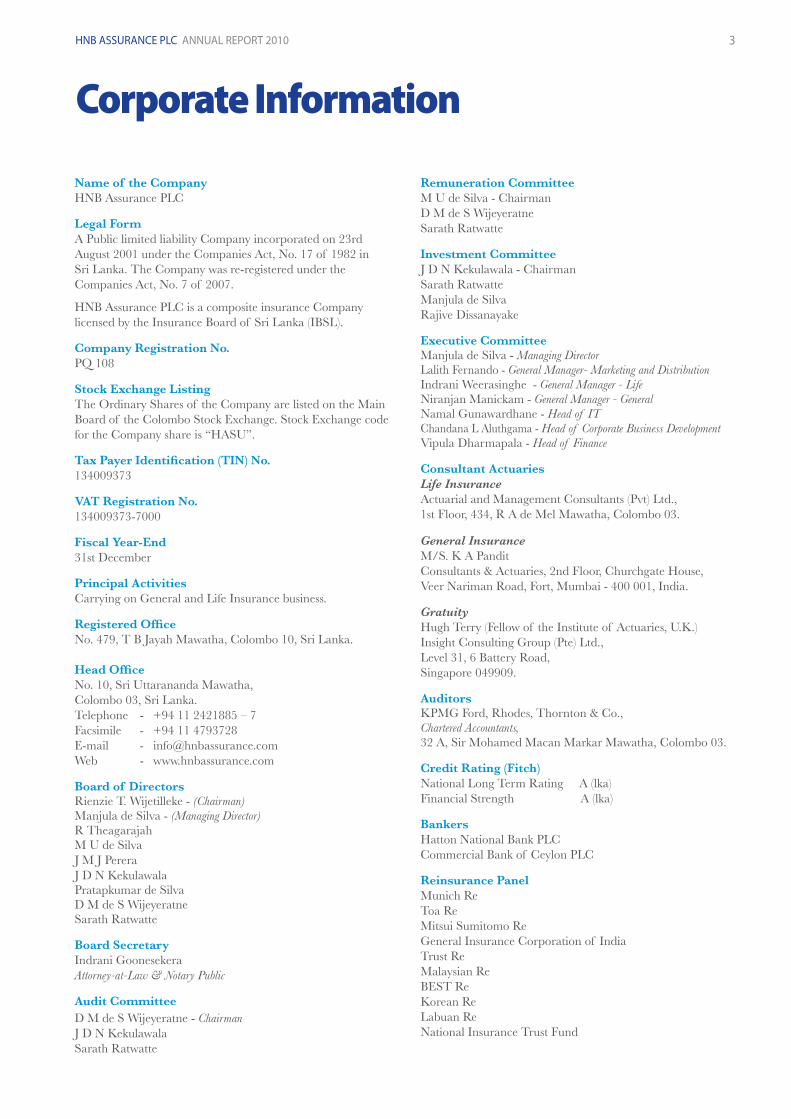
On behalf of the Board of Directors, I am pleased to welcome you to the ninth Annual General Meeting of the Company and present to you the Annual Report and Financial Statements for the year ended 31st December 2010.
The Economy
During the year 2010 the Sri Lankan economy recorded a strong and robust growth in all vital sectors as expected in the fi rst full year of the post-confl ict era. It is expected that the country’s Gross Domestic Product (GDP) would grow by about 8% which is signifi cantly higher than the growth rate of 3.5% achieved last year. It is heartening to note that all three sectors of the economy – Agriculture, Industry and Services – had all contributed to this achievement by recording sectoral growth rates in excess of 6.5% for the fi rst three quarters of the year.
Another positive feature on the economic front has been the managing of the infl ation rate within single digit levels throughout the year. The point to point infl ation rate based on the Colombo Consumers Price Index (CCPI) reached a low of 4.3% in July after which it increased slightly to reach 6.9% by December due to the mild escalation in international commodity prices and supply shortages in the domestic market. The Annual Average Rate of Infl ation stood at 5.9%, a little above the 3.4% level recorded for 2009. Sharp increases in the prices of certain essential items at the turn of the year 2011 has caused some anxiety with regard to a possible hike in the infl ation rate, but it is hoped that appropriate action will be taken promptly to address the supply-side constraints that have led to this situation.
Due to the Central Bank of Sri Lanka (CBSL) easing its monetary policy further, market interest rates continued its downward trend throughout the year with 3 month and 12 month Treasury Bill Yields ending the year at 7.24% and 7.55% respectively. While this was welcome news to
borrowers, it posed a signifi cant challenge to those dependent on interest income. Cushioning off the impact of this to some extent, the Colombo Stock Exchange grew by a remarkable 96% to emerge as the second best performing market of the world for the second consecutive year.
Despite having to grapple with numerous challenges such as the sharp reduction in both interest rates and the income from terrorism covers, the insurance industry staged a strong recovery during the year under review with both Life and General Insurance markets recording double digit rates of growth.
Regulatory Framework
The long-awaited bill to amend the Regulation of Insurance Industry Act No.43 of 2000 was fi nally passed in Parliament at the turn of the year 2011. It contains some progressive steps such as permitting corporate entities to become agents of Insurance Companies. This will provide a much needed boost to bancassurance, micro insurance and the development of alternate distribution channels which is greatly needed to raise the level of insurance penetration in the country. I also welcome the move to bring the National Insurance Trust Fund (NITF) under the provisions of the Regulation of Insurance Industry Act and the purview of the Insurance Board of Sri Lanka (IBSL), which will help to restore a level- playing fi eld in the Industry to some extent.
However, the provision to segregate the Life and General Insurance businesses into two separate companies has been retained in the new Act despite the strong reservations expressed by those connected to the Industry. Since implementation is over a four year period, it is hoped that the authorities will re-visit this regressive provision that will place an additional burden, especially on small to medium sized companies, and at least consider exempting the existing companies from this onerous requirement.
Rienzie T. WijetillekeChairman

7HNB ASSURANCE PLC ANNUAL REPORT 2010
Performance
Taking advantage of the much improved external environment, the Company was able to achieve commendable growth rates in both turnover and profi t, thereby managing the challenges referred to above that were unique to the industry. The Company’s turnover grew again by 15% matching the growth rate achieved in the previous year. Both Life and General Insurance sectors have now crossed the Rs.1 billion mark with the combined turnover recording Rs.2,428 million. Company was able to deliver a strong growth in its profi ts, maintaining its enviable track record. The Profi t Before Tax (PBT) grew by 17% to reach Rs. 270 million while the Profi t After Tax (PAT) grew by 20% to register Rs. 242 million. It is also noteworthy that the Company’s Market Capitalisation representing the net worth of the Company exceeded the Rs.3 billion mark during the year.
Social Responsibility
Mindful of its obligations towards the general public, the Company carried out a number of CSR initiatives during the year touching the lives of a large number of people. As in past years, the areas of focus were providing water and other basic facilities to needy schools, assisting the healthcare sector, supporting the arts and sponsoring events of national importance. These are described in detail in the Managing Director’s Review and the Sustainability Report.
Recognitions
The Company was the proud recipient of several noteworthy recognitions during the year. Its innovative ‘mylife’ brand was chosen for the bronze award in the ‘Best New Entrant’ category at the SLIM Brand Excellence Awards 2010. The Company also received several awards for its Annual Report – 2009. The most signifi cant among them was the award given for the second place in Corporate Governance Disclosures at the Best Presented Accounts Awards 2010 held in Kathmandu, Nepal by the South Asian Federation of Accountants (SAFA). The Company also won a silver as the First Runner-up in the Insurance Category at the Annual Report Awards conducted by the Institute of Chartered Accountants of Sri Lanka (ICASL). The Company also featured in the list of ‘Top 100 Brands’ compiled by Lanka Monthly Digest in association with Brand Finance for the 3rd consecutive year.
Future Outlook
As the Company completes its tenth year since incorporation and with a macro environment built on a strong foundation of peace and stability, your Company has even greater prospects for the future. The Company will make a vigorous effort to reap the maximum benefi ts of this favourable climate and accelerate its growth. However, being in the insurance business, it will be conscious of the need to balance such ambitions with the need to be selective in order to preserve quality in the interest of all its stakeholders. Hence, the Company will remain committed to a path of balanced growth with equal emphasis being given to both turnover and profi tability as in the past.
Appreciation
I take this opportunity to thank the Chairperson and other offi cials of the Insurance Board of Sri Lanka for their guidance and continued support. I also wish to acknowledge the valuable contribution made to the industry by the Insurance Ombudsman.
I also thank my fellow Directors for their support and co-operation. The Management and staff have worked together admirably to deliver commendable results. I wish to express my sincere appreciation of their commitment.
On behalf of the Board of Directors, I assure you that the Company will aim to end the last year of its fi rst decade of operations on a high note overcoming whatever challenges faced through the methodical execution of well thought-out strategies while upholding the highest standards of corporate governance and enter its second decade with a renewed sense of confi dence and optimism.
Rienzie T. WijetillekeChairman
31st January, 2011
Taking advantage of the much improved external environment,
the Company was able to achieve commendable growth rates
in both turnover and profi t, thereby managing the challenges
unique to the industry.

8
Managing Director’s Review
It gives me great pleasure to present a review of our Company’s performance during the year ended 31st December 2010, which has been a period of signifi cant achievement.
Financial Results
The year ended 31st December 2010 saw the Company achieving the targeted volumes of turnover in respect of both its major lines of business. The Gross Written Premium (GWP) from General Insurance business grew by 19% to reach Rs 1,344 million while the Gross Written Premium (GWP) from Life Insurance business reached Rs. 1,084 million recording a growth of 10%. This is the fi rst time that both GWP measures crossed the Rs. 1 billion mark resulting in a combined turnover of Rs. 2,428 million.
As in every single year since 2004, the Company was able to record commendable growth rates in both Profi t Before Tax (PBT) and Profi t After Tax (PAT), the former growing by 17 % to record Rs. 270 million and the latter by 20% to reach Rs. 242 million. Another important milestone reached during the year was market capitalisation surpassing the Rs.3 billion mark for the fi rst time on 14th September 2010 when the share price crossed Rs. 80/=. It dipped slightly towards the end of the year to fi nish at Rs. 2,925 million. The Company was also able to deliver a Return On Equity (ROE) of 24 % maintaining it above 20% for the 5th successive year.
Key Challenges
As expected, the year ended 31st December 2010 posed numerous challenges to the insurance industry. As predicted in a presentation made by me at the National Insurance Congress 2009, the main challenges turned out to be the declining interest rates, sharp contraction in the income from terrorism covers, erosion of the level-playing fi eld and the unfavourable interpretation of tax rules to the detriment of the industry.
Manjula de Silva Managing Director

9HNB ASSURANCE PLC ANNUAL REPORT 2010
Responses at Company and Industry Level
It is pleasing to note that HNB Assurance PLC was able to successfully manage the fi rst two issues referred to above minimising their impact on its turnover and profi ts. Despite having to contend with a continuously declining interest rate regime, the Company’s Investment Management team was able to meet the budgeted investment income targets generating growth rates of 9% and 14% respectively on Life and General Investment Income. High yields earned from investments made some time ago with great foresight and the active realisation of capital gains from both equities and government bonds contributed towards this achievement. However, signifi cant amounts of unrealised gains have been retained in both equity and bond portfolios providing a buffer against possible future shortfalls in investment income.
With regard to the inevitable decline in the income generated from terrorism covers in a post-confl ict environment, the Company took effective steps to protect its margins and increase the growth in sales from other classes of business. It is a refl ection of such initiatives that the Company was able to achieve a GWP growth of 19% for the year from General Insurance while losing Rs. 90 million of terrorism premium in the same period.
With respect to the last two issues mentioned above, namely those relating to the level-playing fi eld and taxation, the Company supported the efforts taken by the Insurance Association of Sri Lanka (IASL) which launched a concerted lobby on these issues led by me in my capacity as its President with the support of the entire industry. These efforts resulted in signifi cant successes with the Government moving to bring the NITF under the ambit of the Regulation of Insurance Industry Act and exempting reinsurance recoveries on claims and commissions from the application of Value Added Tax (VAT).
Other key factors contributing to superior performance
In addition to meeting the above challenges successfully at both Company and industry levels, several other factors contributed to the Company’s successful performance in the year 2010. In the area of Life Insurance, the Company
placed greater emphasis on regular premium endowment products, reducing its dependence on single premium business. Numerous sales competitions and incentive schemes were targeted at both generation of new business as well as premium retention. These efforts were well supported by training and development activities carried out in a structured manner for the agency force. Due to the successful execution of above strategies, the GWP from endowment business grew by an impressive 27% with the new business premium recording a growth of 71% which augurs well for the future of the Life Insurance business. The expected recovery in the housing loan business at HNB fuelled a signifi cant growth of 55% in the sale of Mortgage Reducing Policies (MRP) as well.
A very encouraging development witnessed in the year 2010 is the phenomenal growth achieved by the bancassurance channel which generated a GWP of Rs. 158 million recording a growth rate of 78% over the previous year. The number of bancassurance units operating from HNB branches with a dedicated staff member from HNB Assurance attached to it grew from 74 to 98 as at end 2010. The contribution made by the bancassurance channel grew to 15% of the total Life GWP, a very satisfactory level indeed.
With regard to General Insurance, the Company’s distribution channels were under pressure to make up for the loss of terrorism premium as well as some business lost to newly established companies. They rose to the challenge remarkably delivering a 19% growth in GWP for the year which is praiseworthy. However, a matter for concern is that a signifi cant part of this growth is attributed to the growth in Medical Insurance business which tends to impact negatively on underwriting results. The Company will closely monitor this business in the coming year and retain only such business that will not adversely affect the profi tability of the portfolio.
In spite of the slight imbalance created in the portfolio mix through the growth of Medical Insurance business as mentioned above, the Company was successful in bringing down the Combined Ratio to 107%. It is pleasing to note that in each of the last two years, the Company has been able to bring down this ratio, by 2% and 1% in 2009 and
As in every single year since 2004, the Company was able to
record commendable growth rates in both Profi t Before Tax (PBT)
and Profi t After Tax (PAT), the former growing by 17 % to record
Rs. 270 million and the latter by 20% to reach Rs. 242 million.

10
Managing Director’s Review
2010 respectively. However, it is important to note that the improvement in the Combined Ratio was achieved through a reduction in the Expense Ratio which was brought down from 42% to 39% partly offsetting an increase in the Net Claims Ratio which went up from 66 % to 68 %. As mentioned earlier, this is attributable mainly to the increase in Medical Insurance business, a trend that will be closely monitored and curbed in the year 2011.
Preventing a decline in the investment income and even recording a modest growth in spite of the prevailing low interest rate environment helped maintain profi t growth in line with expectations. The conscious and determined effort taken by all levels of management and staff to keep expenses below budgeted levels greatly helped the Company to post satisfactory results despite facing numerous challenges.
Social Responsibility
Always conscious of the need to contribute meaningfully to raise the living standards of the community at large, the Company undertook and completed numerous CSR projects during the year. Taking forward the ambitious initiative launched in 2008 to provide water to needy schools that lacked access to water, fi ve more schools were covered during the year raising the number of schools assisted under this programme to an impressive total of 14 within three years. In addition, the Company renovated the children’s park at G/Dombagoda Maha Vidyalaya, a school built as a part of the post-tsunami rehabilitation effort.
Reaching out to other sections of society, the Company carried out several CSR initiatives in the Northern Province which is emerging from the scars of a 30-year long war. A surgical ward of the Jaffna Teaching Hospital was renovated at the Company’s expense while 25 beds along with mattresses and other accessories were donated to the Deaf and Blind School in Jaffna. The Company also supported the St. Mary’s Pre-school in Seeduwa through a fi nancial grant at the request of Zonta Club III of Colombo. A donation of medical equipment was also made to the Kegalle Base Hospital.
Fast emerging as a leading benefactor of the arts, the Company sponsored the annual cultural event conducted by the ‘Pehesara Sansadaya’ in the remote town of Thawalama to felicitate outstanding local artistes for the 3rd successive time. The artistes recognised this year were three highly acclaimed dramatists – Lucien Bulathsinhala, Nissanka Diddeniya and Jayalath Manoratne. In line with its focus on youth fuelled by the innovative ‘mylife’ campaign, the Company co-sponsored the launch of a new album titled ‘Sara Sihina’, released by Bathiya & Santhush, its renowned brand ambassadors.
Along the same lines, a well-attended three-day youth drama festival was also conducted in association with the Lanka Children’s and Youth Theatre Foundation (LCYTF) with whom the Company has partnered to stage events of this nature for the last fi ve years. It is pertinent here to note that His Excellency the President has called upon banks and fi nancial institutions to sponsor the staging of at least one award winning drama during 2011-12 in his recent budget speech. I am pleased to report that HNB Assurance has exceeded this expectation in the past several years by sponsoring drama festivals featuring award winning productions since 2005, having recognised the role played by the performing arts in shaping the hearts and minds of the general public.
Coming to the forefront as a sponsor of major national events, the Company supported the prestigious Sri Lankan Entrepreneur of the Year Awards conducted by the Federation of Chambers of Commerce and Industry of Sri Lanka (FCCISL) as a main sponsor. The highlight of this award scheme was that the main national event held at BMICH under the patronage of the Hon. Prime Minister was supplemented by four other award ceremonies held at provincial level. The Company was also associated with the United Nations Day organised by the United Nations Association of Sri Lanka, as in previous years.
On a religious note, the Company sponsored the media coverage of the Vesak celebrations held in Chennai by the Mahabodhi Society, acknowledging the importance of this event to build bridges between the people of Sri Lanka and South India. It also made donations to places of worship representing all major religions during the year under review.
Key Areas of Strategic Focus
The Company will strategically focus on fi ve areas during the next corporate plan period, 2011-13, with the objective of steering the Company’s growth while balancing the interests of all key stakeholders. These have been broadly identifi ed as General Insurance, Life Insurance, Distribution Network, Information Technology and Brand Awareness. In each of these areas the Company’s Corporate Planning Team has identifi ed key action steps that will be executed during the year in pursuit of the above objective.
With regard to General Insurance, the Company’s strategic thrust will be to accelerate growth of business from identifi ed profi table segments such as retail and small commercial lines sourced through the branch network while scaling down some of the unprofi table corporate business, especially those with a high Medical Insurance component. At the same time, efforts will be made to increase the capture of profi table corporate

11HNB ASSURANCE PLC ANNUAL REPORT 2010
business such as marine, engineering and liability classes. A signifi cant improvement in the loss ratio is expected from the corporate business portfolio while maintaining the healthy loss ratio currently achieved on the branch business.
In the area of Life Insurance, the Company will attempt to reduce its reliance on single premium policies and focus more on regular premium endowment policies. Within this category, greater focus will be placed on introducing new products of a non-participatory nature as such products tend to contribute more to profi tability if effectively managed. The Company will also try to accelerate the growth of MRP business (which also falls into the non-participating category) benefi tting from the growth in housing loans. Towards this end, a special effort will be made to improve the competitiveness in the pricing of MRPs.
While the numerical expansion of the distribution network will be restricted to the opening of only two more branches in the year 2011, efforts will be made to improve the productivity of branches and the fi eld force. Better MIS being generated by the newly upgraded system will be utilised to monitor the performance of branches as well as individual salespersons, with training and counseling inputs being provided as needed. Attention will also be paid to the development of alternate distribution channels taking advantage of positive developments in the regulatory environment.
The main focus of the Information Technology team will be to complete the implementation of the core application, whilst also channelling their attention towards the use of technology to provide low cost solutions to meet customer needs as well as obtain productivity gains. Numerous initiatives will be launched to benefi t from available technology to meet business needs.
Building on the successful campaign implemented to launch and establish the ‘mylife’ product, the Company will develop a brand awareness and advertising strategy to transfer a part of the brand equity created to the corporate brand while promoting other selected product brands. Innovative campaigns will be developed with the support of the Company’s brand ambassadors to position HNB Assurance as a dynamic, fast growing insurer who can provide superior value to customers. The ideal communications mix will be chosen to get the maximum impact for the amount spent. The Company’s Marketing and Brand Development expertise will also be strengthened to spearhead this effort.
Appreciation
The year 2010 has been one of remarkable achievement for the Company and this is a refl ection of the wonderful team spirit and utmost commitment displayed by my entire team at HNB Assurance comprising General Managers, Heads of Divisions, Managers, members of staff, the fi eld management and Insurance Advisors. All of them worked with an amazing level of enthusiasm and a clear sense of purpose to deliver results exceeding expectations. I also wish to express my deep appreciation to the Chairman and the Board of Directors for their invaluable guidance and continuous support.
As always, we received excellent support from managers and staff of all HNB branches, insurance brokers, other intermediaries, reinsurers, reinsurance brokers and other strategic partners to whom I wish to extend my sincere appreciation.
Future Direction
HNB Assurance is entering its 10th year of serving the insuring public of Sri Lanka with a feeling of justifi able pride stemming from its enviable track record and a sense of optimism arising from the positive macro environment it is faced with. The Company is fully conscious of the weight of ever increasing expectations thrust on it and is determined to foster its image as an entity that delivers results exceeding the expectations of all its stakeholders. During the year 2011, it will aim to cross traditional boundaries in search of innovations that could provide superior customer value to enhance its position in a fi ercely competitive market. At the same time it will be constantly mindful of its obligations towards the shareholders, employees, intermediaries, suppliers and the general public. Hence, the Company will make a determined effort to accelerate its growth while fi rmly ensuring that this will not be at the expense of quality and profi tability. We have done this with remarkable success in the past and strongly believe it could be repeated in the immediate future as well.
Manjula de Silva Managing Director
31st January, 2011

12
Board of Directors
RIENZIE T. WIJETILLEKE FCIB (London), FIB (Sri Lanka)
- Chairman
Non-Executive Director. Chairman since March 2004. Chairman of Hatton National Bank PLC, Sithma Development (Pvt) Ltd and Sunshine Holdings PLC, a Director of Nawaloka Hospitals PLC, Ceylon Biscuits Ltd and Mahaweli Reach Hotels PLC. Former Chairman of HNB Stockbrokers (Pvt) Ltd, HNB Securities Ltdand Colombo Stock Exchange.
M U DE SILVA FCIB (London)
- Director
Non-Executive Director. Retired Senior Deputy General Manager (Administration & Marketing), Hatton National Bank PLC. Counts over 43 years experience in Banking including 15 years at the Corporate Management level of Hatton National Bank PLC. Past President of Association of Professional Bankers. Past President of Chartered Institute of Bankers – Colombo Centre. Presently holds the position of Secretary General – Sri Lanka Banks’ Association (Guarantee) Ltd. Director – Lanka Financial Services Bureau Ltd. Member – National Payments Council and Financial Systems Stability Consultative Committee of the Central Bank of Sri Lanka.
MANJULA DE SILVA BA Hons (Colombo), MBA (London), FCMA (UK)
- Managing Director
Executive Director. Managing Director since March 2006. Chief Executive Offi cer from July 2004. President of the Insurance Association of Sri Lanka (IASL). Member of the Financial Systems Stability Consultative Committee of the Central Bank of Sri Lanka.Committee Member of the Ceylon Chamber of Commerce. Former Director General – Public Enterprises Reform Commission of Sri Lanka. Also served at Eagle Insurance Company PLC for a period of 14 years in many capacities, including General Manager – Corporate Lines and Human Resources and General Manager – Eagle NDB Fund Management Company Ltd.
J M J PERERA FCIB (London)
- Director
Non-Executive Director. Senior Deputy General Manager (Business Development & International Relations) of Hatton National Bank PLC. Counts over 39 years experience in Banking. Director - Acuity Partners (Pvt) Ltd, Acuity Securities Ltd, Acuity Stockbrokers (Pvt) Ltd and Lanka Ventures PLC.

13HNB ASSURANCE PLC ANNUAL REPORT 2010
R THEAGARAJAH FCMA (UK), FCA (Sri Lanka), MBA (Cranfi eld), FIB (Hon) Sri Lanka
- Director
Non-Executive Director. Managing Director/Chief Executive Offi cer of Hatton National Bank PLC. Member of the Corporate Management of Hatton National Bank PLC since 1997. Counts over 26 years experience in Banking including overseas assignments. Chairman of Acuity Partners (Pvt) Ltd, Acuity Stock Brokers (Pvt) Ltd and Acuity Securities Ltd. Director of Sithma Development (Pvt) Ltd and Lanka Financial Services Bureau Ltd. He was a past Chairman of Sri Lanka Banks’ Association (Guarantee) Ltd and Financial Ombudsman Sri Lanka (Guarantee) Ltd, Chairman of the Asian Bankers Association. Member of the Sri Lanka Accounting & Auditing Standards Monitoring Board, Committee of the Ceylon Chamber of Commerce and Chartered Institute of Management Accountants Governing Board Sri Lanka. Council Member of the Institute of Directors of Sri Lanka.
J D N KEKULAWALA FCIB (London), FCA (England & Wales), MBA (Manchester)
- Director
Non-Executive Director. Senior Deputy General Manager - Strategy of Hatton National Bank PLC. Counts over 25 years of commercial banking experience including 17 years as a member of the Corporate Management of the Hatton National Bank PLC. Director of Sithma Development (Pvt) Ltd and Lanka Ventures PLC.
PRATAPKUMAR DE SILVA FICM (Sri Lanka), FICM (England)
- Director
Non-Executive Director. Chairman of Alliance Finance Co. PLC. First Sri Lankan to be honoured as a Fellow of the Institute of Credit Management, England. Honorary Consul of the Republic of Peru in Sri Lanka. Senior Chairman, Alliance Group of Companies, Director of several other Companies and institutions. President – Sri Lanka Institute of Credit Management. Director representing Finance Companies on the Board of the Credit Information Bureau of Sri Lanka. Advisory Councillor – Committee of The Finance Houses Association of Sri Lanka.
“The HNB Assurance Board comprises eminent corporate leaders, counting many years of management expertise and strong commitment to good governance”

14
Board of Directors
D MANIK DE SILVA WIJEYERATNE ACA (Sri Lanka)
- Director
Non-Executive Director. Has over 30 years of varied post qualifi cation experience in Accounting/Finance and Human Resources having worked both in Sri Lanka and overseas, holding senior positions in the private sector and the NGO sector. He was the CFO of Comsip Al A’ali WILL, a large Electrical and Instrumentation Company based in Bahrain (a subsidiary of GEC Alsthom, a large French Electrical & Engineering Company), the Director Finance, Administration and Human Resources – IUCN Pakistan Country Offi ce (one of the biggest NGOs in the fi eld of environment) and the CFO of the Pership Group of Companies.
SARATH RATWATTE FCMA (UK)
- Director
Non-Executive Director. Has over 30 years of private sector experience in the fi elds of Accounting, Financial & Treasury Management, Project Financing & Development, Investments and Risk Management. He has held senior positions in several multinational organisations and conglomerates in Sri Lanka and overseas. He has worked in the Aitken Spence Group of companies for a period of 18 years in many capacities including that of the positions of Group Treasurer/Director - Corporate Finance, Director - Ace Power Embilipitiya (Pvt) Ltd and Director - Aitken Spence (Garments) Ltd.
INDRANI GOONESEKERA Attorney-at-Law & Notary Public
- Board Secretary
Appointed Board Secretary in August 2001 at the incorporation of the Company. She is the Deputy General Manager (Legal) and the Board Secretary of the Hatton National Bank PLC and is a member of the Corporate Management of the Bank for over 14 years. She is the Board Secretary of Sithma Development (Pvt) Ltd and was the Board Secretary of Acuity Securities Ltd (formerly HNB Securities Ltd) up to 31st December 2010.

15HNB ASSURANCE PLC ANNUAL REPORT 2010
Executive Committee
1. MANJULA DE SILVA BA Hons (Colombo), MBA (London), FCMA (UK)
Managing Director
2. LALITH FERNANDO CMSLIM, EDBA (Colombo), CII (Award) UK
General Manager - Marketing and Distribution
3. INDRANI WEERASINGHE ACII (UK), BSc Hons (J’pura), PgDip Stat (J’pura),
Chartered Insurer
General Manager - Life
4. NIRANJAN MANICKAM ACII (UK), Chartered Insurer
General Manager - General
5. NAMAL GUNAWARDHANE BCom Hons (Delhi), BIT (IGNOU)
Head of IT
6. CHANDANA L ALUTHGAMA BCom Sp. (Kelaniya), FCMI (UK), MBA (Colombo)
Head of Corporate Business Development
7. VIPULA DHARMAPALA BSc (Bus. Admin) Sp. (J’pura), ACA
Head of Finance
1
62
4
7
3
5

16
Management Team
Ivan NicholasHead of Distribution
Manikavasakar PuvirajBSc Hons (Jaffna), Dip in HR (Mora-tuwa)
Zonal Manager - North and East
Donald NandalalBSc Eng (Hons), PG Dip B & Fin Ad(SL), AMIE (SL)
Manager - Motor Claims
Asanka UnambooweLUTCF (USA)
Sales Manager - Bancassurance
Sajeewa Chandrasena
Regional Manager - Uva/Sabaragamuwa
Jude WeerakoonAMInstCM (UK), ASSM (UK)
Zonal Manager - Central
Jehan HaniffDip. in Training (IVQ-U.K.), CII (Award) UK, Mgt. Diploma - CHS, AMSLIM, AITD (SL)
Manager - Sales Training and Development
A R Bazlin Salih
Regional Manager - Southern
Geethani SaramMBCS, MBA (Australia), Cert. PM
Manager - IT Projects
Hiran FernandopulleBCom Special (Colombo)
Zonal Manager - North Western
Vivekanandan Chitparan
Finance Manager

17HNB ASSURANCE PLC ANNUAL REPORT 2010
Hazana CaffoorDip. MGT (Peradeniya)
Manager - Motor Underwriting
Ananda KulasooriyaB.A. (Kelaniya), Diploma in Insurance (NIBM)
Regional Manager - Kurunegala
Sanjeewani PitadeniyaDICCM (UK), DIP (SLII)
Manager - Customer Relations
Dinesh UdawattaBSc Hons (Colombo), AIII, MBA (Colombo)
Manager - Life Underwriting
Salinda PereraMIM (SL), Dip in BM (IMSL)
Manager - Administration
Sitari JayasundaraAttorney-at-Law & Notary Public
Manager - Legal
Nilesh AmarasingheBSc Hons (London), M BUS (Fin) (Sydney)
Manager - Investments
Kamini GunawardeneBA Hons (Colombo), Dip in Econ (Colombo)
Manager - Marketing Communication
Sawan Rodrigo
Manager - Branch Operations
Chrysantha Wijemanne
Manager - Non-Motor
“Our senior management is a youthful and dynamic team of professionals, committed to living the Company values, geared to drive performance and determined to deliver results.”

18
Operational Highlights
Company
2010 2009
Gross Written Premium (Rs. Mn.) 2,428 2,116 Net Written Premium (Rs. Mn.) 1,979 1,662 Profi t for the Year (Rs. Mn.) 242 202 Return On Equity (ROE) 24% 24%
General InsuranceNet Claims Ratio 68% 66%Expense Ratio 39% 42%Combined Ratio 107% 108%
Life InsuranceNet Claims Ratio 6% 7%Expense Ratio 59% 58%Combined Ratio 65% 65%
Customer
2010 2009
Number of Life Insurance Policies 79,321 70,485Number of General Insurance Policies 195,439 129,796 Insurance claims and benefi ts (Rs. Mn.) 648 512 Number of New Products 3 3 Number of Branches 51 47
Shareholder
2010 2009
Market Price Per Share as at 31st December (VWA) (Rs.) 78.00 49.50 Basic Earnings Per Share (Rs.) 6.45 5.38 Dividend Per Share (Rs.) 1.80 1.50 Market Capitalisation (Rs. Mn.) 2,925 1,856 Price Earnings Ratio (Times) 12.10 9.21
Profi t After Tax (Rs. Mn.)242 2022010 2009
Dividend Per Share (Rs.) 1.80 1.50 2010 2009
Company commenced business in
Year 2001 and this is the
10th consecutive year it is
reporting a Profi t
HASU Market Capitalisation crossed the
Rs. 3 billion mark during the year 2010
recording a 58% growth
Employees 2010 2009 Number of Staff Number Percentage Number Percentage
Branches 368 62% 305 56%Head Offi ce 229 38% 235 44%Total 597 540 Career Development 2010 2009
Number of training programmes 200 190Number of induction and familiarisation programmes 3 3Training cost per employee (Rs.) 11,811 15,217 2010 2009Field Staff Number of full time trainers 6 4Pass rate at Life Insurance technical competency test (%) Sinhala medium 81% 83% Tamil medium 61% 53%Number of fi eld staff 1,401 1,546Commission paid to fi eld staff (Rs. Mn.) 181 167

Management Discussion & Analysis

20
Management Discussion & Analysis
OverviewThe year 2010 marked the completion of nine years in providing insurance solutions to our valued customers and HNB Assurance is now close to completing it’s fi rst decade in operation. During this period the Company passed many important milestones, some of which include;
• becoming the fastest insurance company in the country to generate an annual combined turnover in excess of One Billion Rupees, reaching the landmark in its fi fth year of operation
• obtaining ‘A’ ratings from Fitch Rating Lanka Limited for its Insurer Financial Strength and National Long Term Rating, being accredited with the second-best rating received by a local insurance company from Fitch Rating
• the Company’s annual report being recognised in both local and international Annual Report awards competitions
• ‘HNB Assurance’ brand being ranked within the ‘Top 100 Brands’ compiled by Lanka Monthly Digest (LMD) magazine in association with Brand Finance
• the Company’s ‘mylife’ product winning the Bronze Award in the Best New Entrant category at the SLIM Brand Excellence Awards 2010
The above recognitions and achievements were made in addition to the consistent fi nancial performance produced over the years which is best displayed through consistent double digit growth in profi ts and turnover, continuous increase in market share and also the continuous improvement in market capitalisation, up to Rs. 2.9 billion by the end of 2010.
With these achievements, we believe that our Company is moving in the right direction towards achieving its vision; “to be Sri Lanka’s most admired and trusted partner in meeting insurance needs professionally with a spirit of caring”.
Our vision goes beyond the position of a market leader and more importantly emphasises the need to become the most admired and trusted partner in providing insurance solutions. It also acknowledges the need to balance professionalism with a spirit of caring, a much-needed dimension in a people focused business.
The business environment we faced during the year has been very challenging for some segments of the business and favourable for others. Amidst this dynamic business environment the Company was able to produce some exceptional results in line with stakeholder expectations.
HNB Assurance in the Insurance Industry
Competition
The year under review saw one new insurance company entering the market. With the new player, the Sri Lankan insurance industry now comprises twenty players as at the end of 2010, out of which twelve companies operate as composite insurance companies selling both Life and General Insurance policies. There are two companies selling only Life Insurance and six companies selling General Insurance only. The competition in the industry is therefore exceedingly high. In particular, price competition in General Insurance has become a serious challenge to all players. However, it has forced all players to provide high quality, cost-effective services to customers, which we greatly welcome.
The Life Insurance market is a comparatively conservative business as pricing is determined by actuaries, but the challenge lies in acquiring new business in a market where insurance is not yet considered an important element in people’s spending.
Most of the insurance companies are either subsidiaries or partners of large private sector companies or of the Government, and this factor has its own advantages and disadvantages. On one hand, having strong fi nancial and/or business backing of the parent
Financial Highlights 2010
Life GWP – Rs. 1,084 Mn.General GWP – Rs. 1,344 Mn.Total GWP – Rs. 2,428 Mn.
Profi t After Tax – Rs. 242 Mn.Market Capitalisation – Rs. 2,925 Mn. Shareholders’ Funds – Rs. 1,016 Mn.
Awards in 2010
Annual Report
• 1st Runner up in Corporate Governance Disclosure at SAFA Annual Report Awards held in Kathmandu, Nepal - 2010.
• Runner up in the Small Scale category at ACCA Sustainability Reporting Awards - 2010
• Silver Award in the Insurance Sector at ICASL Annual Report Awards - 2010.
Brands• Bronze Award for the Best new Entrant at
the SLIM Brand Excellence Awards 2010

21HNB ASSURANCE PLC ANNUAL REPORT 2010
or group companies is a strength to such companies. On the other hand, the limitation is that such companies tend to focus or largely depend on the businesses of their parent companies or groups, which may impede open market competition.
The insurance industry in Sri Lanka has a combined GWP of Rs. 57 billion (as per IBSL Annual Report 2009) which is 1.19% of GDP. The GWP is distributed between Life and General Insurance as Rs. 24 billion and Rs. 33 billion respectively. As a percentage, General Insurance accounts for 58% of the total GWP whilst the balance 42% is from Life Insurance. There are fi ve large companies accounting for more than 85% of the total GWP in the industry. The balance 15 companies are competing for the remaining 15% of the market.
Industry Rs. Mn. 2009 2008 Growth
Long Term Insurance 23,859 23,613 1%General Insurance 33,485 34,553 -3%GWP Total 57,344 58,166 -1%As a % of GDP 1.19% 1.32% -10%
Thus, the Sri Lankan insurance industry can be segregated into two categories; that is, the big league which has a market share of 85% and the small and medium sized league which has a market share of 15%. HNB Assurance, a company having been in the market for just over 9 years, leads the league of small and medium sized companies. It’s market shares in respect of Life and General Insurance stood at 4.13% and 3.38% respectively at the end of 2009.
Regulatory backgroundThe insurance industry is primarily governed by the provisions of the Regulation of Insurance Industry Act, No. 43 of 2000 and the rules and determinations issued thereon by the Insurance Board of Sri Lanka (IBSL). During the year, there were no major changes in the existing regulations issued by IBSL. However, the existing Act is expected to be amended soon and the relevant Bill has already been passed in Parliament.
According to the bill presented to the Parliament, the new Act would bring about a number of signifi cant changes to the regulatory framework. Some of the key changes that are to be effective with the Act are;
• All insurance companies to be segregated as Long Term Insurance (Life Insurance) companies and General Insurance companies, within four years.
• All insurance companies to be listed in the Colombo Stock Exchange within fi ve years. New entrants have to do so within three years.
• Minimum stated capital to be increased as notifi ed by the IBSL.
• Institutions to be allowed to act as Agents of insurance companies.
• National Insurance Trust Fund (NITF) to be brought under the scope of the Regulation of Insurance Industry Act and the purview of IBSL.
There will be many other changes to the law with the new Act which have to be analysed carefully in terms of the potential impact to the Company.
We strongly welcome the new provision to permit institutional agents, as that will immensely help the industry to open new channels of distribution. We also welcome the proposal to increase the minimum stated capital and will take necessary steps to comply with such requirements at the appropriate time. However, the provision introduced to segregate Life and General insurance businesses will have a negative impact on small and medium sized companies and it is hoped that this will be reviewed again in light of the strong objections raised by the industry.
As per the 2009 Annual Report of the IBSL, it is in the process of introducing a risk based supervision regime (RBC) in place of the existing compliance based system, following the worldwide trend. Accordingly, risk-based supervision will supplement sound regulation with a focus on the volatile nature of the insurance business that can affect solvency and the ability to meet contingencies.
Further, the budget presented in Parliament in November 2010 brought several key changes to the tax structure in the country, which will have a positive impact on the Company. These include;

22
• reduction in corporate tax rate to 28% from the previous rate of 35%,
• reduction in the deemed dividend tax from 25% to 10%,
• reduction in the NBT rate from 3% to 2%,
• NBT to be allowed fully as a deductible expense for income tax
• reduction in the disallowed percentage of advertising expenses to 25% from 50%,
• waiving off Debit tax
All these changes will come into effect from the year 2011 onwards. In addition, one other signifi cant positive change introduced by the budget was exempting re-insurance commissions and claims from VAT and this will immensely benefi t the insurance industry as a whole.
Macro-Economic EnvironmentWhen analysing the performance of the Company for the year 2010, it is necessary that due attention is given to the macro-economic environment within which the Company operated. This is very important as the prevailing trends and developments in the macro-environment will inherently infl uence the effectiveness and effi ciency of any company’s performance. The matter deserves further attention due to the signifi cant volatilities experienced during last few years in the world economy following the fi nancial crisis.
World Economy The year 2010 saw a continuation of the global economic struggle to revive after the particularly painful recession experienced in 2008. Many economies worldwide were aware of the need to rise fast in order to erase the dark stains of the recession. According to the International Monetary Fund (IMF), the overall growth of the world economy was expected to be 5% in 2010.
Policy Responses
In the aftermath of the recession, the survival strategies of most economies largely revolved around expansionary policies. Expansionary monetary policy supported by unconventional liquidity provision, and expansionary fi scal policy, provided a major stimulus in response to the deep downturn. Although this trend is expected to continue through 2011 until the global economy is entirely recovered, countries would also be required to pay attention to fi scal consolidation in order to ensure past mistakes are not repeated.
Two-Speed Recovery
At the beginning of the year, the IMF had forecasted positive but low growth in advanced economies and fast growth in emerging economies. This two-speed recovery did materialise during the year and is expected to dominate 2011 as well.
Emerging economies were able to come back stronger than advanced economies because they were able to increase domestic demand so as to supplement the defi cit created by the still tainted global trade. However in advanced economies the crisis damage was much deeper and there is still much uncertainty about the true health of such economies and the effectiveness of fi nancial intermediation. Consequently, with the additional burden of correcting past excesses, the recovery in advanced economies has been long and slow.
Capital Flows
With the two speed recovery working in favour of emerging economies by giving rise to better growth prospects, it triggered a welcome resurgence of capital fl ows towards these economies. Key drivers behind the renewed capital fl ows include rapid growth in emerging economies, large yield differentials in their favour, and a returning appetite for risk taking. Capital fl ows contributed towards shifting these countries’ demand from external to internal by leading to an appreciation of their currencies and by making it cheaper to borrow. The stimulated internal demand in turn compensated for the absence of external demand due to the recession, which enabled emerging economies to rise fast.
Management Discussion & Analysis

23HNB ASSURANCE PLC ANNUAL REPORT 2010
However, along with the capital infl ows, arise the attendant risk of overheating, infl ationary pressure and asset bubbles and hence the need for these economies to be cautious.
Infl ation
In the world economy, the price of crude oil is a main indicator of infl ation. While 2009 saw a drop in oil prices, the trend reversed in 2010. Consequently, defl ation has not been as prominent as expected. As economies regain and capacity utilisation levels surge, infl ation expectations and infl ation itself could be expected to rise. However, in 2011 and 2012, emerging and developing economies are expected to benefi t from further reductions in infl ation.
Financial Markets
Policy intervention on an unprecedented scale helped improving fi nancial conditions and real activity as well. Money markets have stabilised, equity markets have rebounded, and the credit cycle may be turning up.
Asian equities appear to be more attractive for investors than those in U.S. and Europe, as the focus of attention of the world is fast moving towards the East. Asia experiences less leverage which will mean stronger recovery potential and thus the ability to rise as a signifi cant player. The European and American equity markets have lost their attraction as their economies remain slow.
The Way Forward: The Need for Economic Rebalancing
Rebalancing, internal and external, continues to be crucial. Policies aimed at stimulating domestic demand only, will not be sustainable in the long run. The defi cit countries must rely more on external demand and symmetrically, surplus countries must shift from external demand to domestic demand and reduce their dependence on exports. Although recovery may be possible without rebalancing, such recovery may not be sustainable and will lead to repetitive occurrence of periodic crises as in the past.
Sri Lankan Economy
Gross Domestic Product
In the fi rst year after decades of ethnic confl ict, the Sri Lankan economy grew by approximately 8% with all major sectors (agriculture, industry and services) recording healthy levels of growth. This was in contrast to the subdued growth of 3.5% experienced in year 2009. The end of the war in May 2009 accelerated the country’s growth in the third and fourth quarters of 2009 and this trend continued into year 2010. As a result, the fi rst three quarters of 2010 saw the Sri Lankan economy grow at 7.1%, 8.5% and 8.0% respectively. The growth rate of 8.5% in the second quarter of 2010 remains the highest-ever quarterly GDP growth recorded in the country since 2002 while the 8% growth in the third quarter remains the second highest.
With Government infrastructure development initiatives taking shape rapidly and with no major funding diffi culties foreseen due to the country’s decreased risk, borrowing from concessionary (IMF, etc.) and non-concessionary (from foreign and local markets) sources is no longer a problem. The Central Bank estimates that strong macroeconomic fundamentals and the post-war revival should allow the economy to grow by more than 8.5% in the year 2011 and beyond.
In terms of sectoral development for the fi rst three quarters of 2010, agriculture grew by 6.8% with tea and rubber production showing relatively high levels of growth while coconut production faltered compared to the same period last year. The industrial sector grew by 8.3% with all major subsectors including mining and quarrying, manufacturing, and construction showing healthy levels of growth.
The service sector posted a growth of 7.9% with hotels and restaurants showing the highest level of growth on the back of a record number of tourist arrivals into the country (tourist arrivals increased by 46.1% to 654,476 in 2010 compared to 2009).

24
Other subsectors which showed high relative growth in the service sector include transport and communication, banking, insurance and real estate, wholesale and retail trade.
Infl ation and Interest Rates
Infl ationary pressures for the year remained relatively low with the point-to-point infl ation as measured by the year on year change in the CCPI (Colombo Consumers’ Price Index) being 6.9% at end 2010 compared to 4.8% the previous year. Lower levels of infl ation at the beginning of the year allowed the annual average infl ation level to remain at 5.9% for the year compared to 3.4% in the previous year. Prices remained low as a result of positive base year effects and the rising supply of food items, especially from Northern and Eastern provinces. The Central Bank would have to remain vigilant in 2011 however to maintain this low level of infl ation, which has recently been creeping upwards due to factors such as high economic growth creating demand pressure, escalating domestic food prices due to supply destructions from adverse weather conditions and increasing commodity prices with the recovery of the global economy.
Amidst low levels of infl ation, the Central Bank kept its benchmark interest rates low during the year to support the post-war economic growth. Policy rates for the year were only adjusted in July and August when the Repurchase Rate and Reverse Repurchase Rate were revised downwards by 25 basis points (bps) and 75 bps to 7.25% and 9% respectively.
Yields on government securities declined in the primary market for government securities over the course of the year with the 91-day Treasury bill rate declining by 42 bps to 7.24% and the 365-day Treasury bill rate declining by 177 bps to 7.55% by the year end, while the lowest 365-day Treasury Bill rate for the year was recorded in the month of October when it touched 7.10%.
The Average Weighted Deposit Rate (AWDR), which refl ects the movement of interest rates pertaining to all interest bearing deposits held with commercial banks, has declined by about 175 basis points over the course of the year to 6.23%. A sharper decline of about 268 basis points for the year was observed in the Average Weighted Fixed Deposit Rate (AWFDR), which is computed in respect of fi xed deposits maintained with commercial banks, as it dropped to 8.20%.
In line with the reduction in the cost of funds of banks, their lending rates have also declined. The Average Weighted Prime Lending Rate (AWPLR), which serves as a benchmark for other selected lending rates, declined by 190 basis points during the year to 9.27%. Decline in interest rates will help to boost the economy as it decreases the cost of borrowing and encourages investments and economic activities.
External Trade
The Central Bank reported that cumulative earnings from exports during the fi rst ten months of 2010 increased by 13.2% while the cumulative expenditure on imports during the same period increased by 32.8%. The biggest contributors to the gain in export earnings included agricultural exports and industrial exports while the biggest contributors to import expenditure included consumer goods, petroleum goods and transportation equipment. The relatively larger increase in import expenditure over export earnings caused the trade defi cit to increase by 79.2% on a year-on-year basis.
Workers’ remittances, after adjusting for revisions by commercial banks, for the fi rst ten months of 2010 increased by 21.9% over that of the corresponding period of 2009.
Management Discussion & Analysis

25HNB ASSURANCE PLC ANNUAL REPORT 2010
Exchange Rates
The LKR strengthened against the USD by approximately 2.7% and the EUR by approximately 10% over the course of the year 2010. The LKR is expected to remain strong during 2011 as well. Overall foreign exchange reserves reached a record USD 6.6 billion without Asian Clearing Union Funds in October 2010. This was mainly bolstered by infl ows from lending agencies, foreign direct investments, remittances and increased export earnings. The Central Bank was a net buyer of foreign exchange in December following three months of net sales to maintain the peg with the US dollar. The Governor of the Central Bank, in a speech on monetary policy for 2011, projected the gross offi cial reserves of the country to grow to USD10 billion by 2011.
Equity Market
The Colombo Bourse was one of the best performing stock markets in the world in 2010 as well, with the All Share Price Index (ASPI) recording a growth of 96% and the Milanka Price Index (MPI) recording a growth of 83%. Colombo Stock Exchange (CSE) remained the best performer in the Asian region and the second best performer in the world for the second consecutive year. The price to earnings ratio (PER) of the Sri Lankan stock market leapt from 16.5 times in the beginning of the year to 28.44 times on October 1, 2010 refl ecting the positive investor sentiment towards CSE. The Price Earnings Ratio (PER) of the market as at 31st of December was 22.48 times.
After taking nearly three decades to reach the one trillion mark in terms of market turnover in October 2009, the CSE reached the two trillion mark in just 11 months in September 2010. The market capitalisation at the end of the year stood at Rs. 2,210 billion. The boom of initial public offerings lined up for next year (more than 50 IPOs) is expected to increase the market capitalisation close to three trillion rupees by the end of year 2011.
26
Financial ReviewHNB Assurance completed yet another successful year by achieving both its top and bottom line targets amidst a very competitive and challenging environment. This is the fi rst time in the Company’s history that it achieved both Life and General Insurance Gross Written Premium (GWP) targets. It also crossed the Rs. 1 billion mark in both lines of business and recorded a combined GWP of Rs. 2,428 million.
Shareholders’ equity of the Company reached the Rs. 1 billion mark during the year, which is another signifi cant milestone for the Company. The Company continued to deliver strong growth in its profi ts by recording a 20% growth in Profi t After Taxation (PAT). The Company’s market capitalisation reached the Rs. 3 billion mark during the year. However, market capitalisation at the end of the year dropped to Rs. 2.9 billion with the slowing down of the stock market towards the year-end.
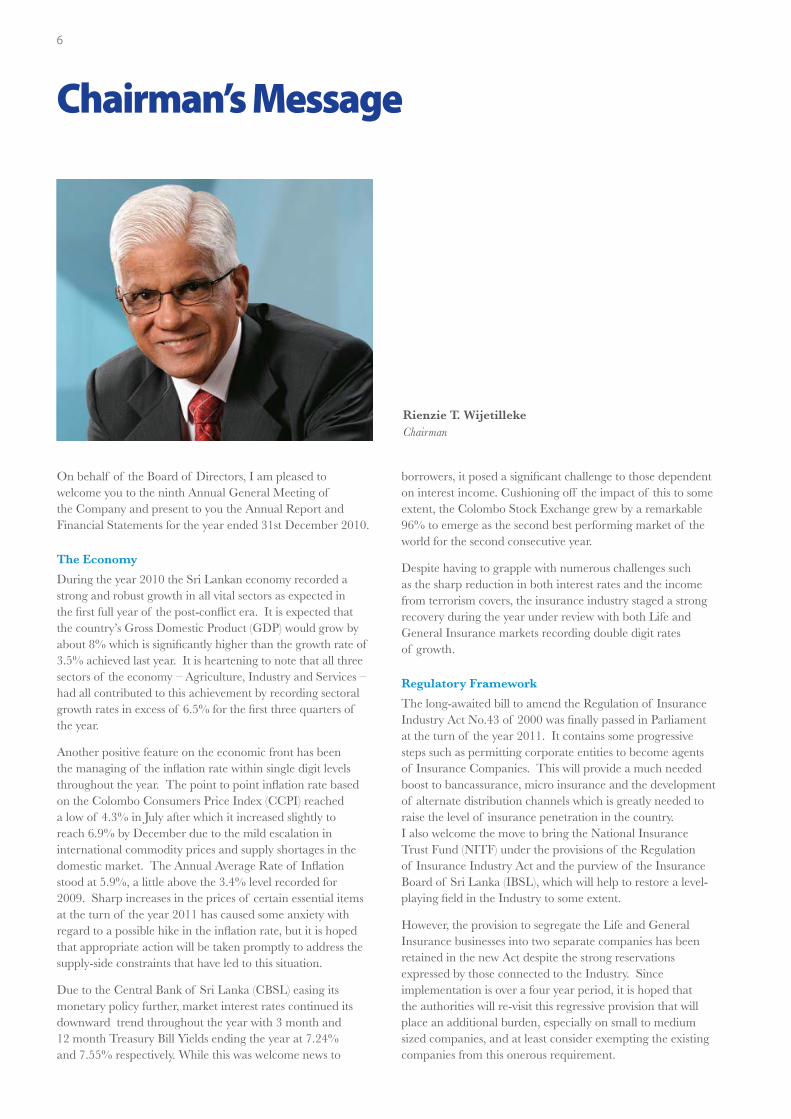
General and Life GWP (Rs. Mn.)
2006 2007 2008 2009 2010
General 619 704 925 1,131 1,344
Growth 32% 14% 31% 22% 19%
Life 503 768 914 985 1,084
Growth 42% 53% 19% 8% 10%
Growth in Gross Written Premium (GWP)The Company recorded a growth of 15% in GWP to reach Rs. 2, 428 million as against the GWP of Rs. 2,116 million in 2009. The General Insurance GWP grew by 19% while Life Insurance recorded a growth of 10% during the year.
General Insurance recorded a GWP of Rs. 1,344 million and increased its contribution to overall GWP from 53% last year to 55% this year. The growth in General Insurance was mainly due to the impressive growth in Miscellaneous and Motor Insurance classes, of 83% and 24% respectively. Marine insurance grew marginally by 5% while fi re GWP declined by 5% compared to last year’s performance. These are discussed in detail under General Insurance review on pages 32 to 39.
GWP (Rs. Mn.)
2006 2007 2008 2009 2010
General 619 704 925 1,131 1,344
Life 503 768 914 985 1,084
Total 1,122 1,472 1,839 2,116 2,428
Growth 36% 31% 25% 15% 15%
The contribution from Life Insurance to the total GWP declined further during the year to 45% from 47% in the previous year. However, for the fi rst time in the Company’s history, Life Insurance GWP reached the Rs. 1 billion mark and achieved a GWP of Rs. 1,084 million, recording a growth rate of 10% against the growth rate of 8% in 2009. Further, GWP from the traditional endowment policies recorded a 27% growth during the year and this will give the Company the opportunity to target a steady growth in Life Insurance in ensuing years. Even though there is a comparative decrease in contribution from Life Insurance GWP to the Company GWP, it is believed that the Company is on the correct path considering the exceptional growth in the endowment business, which is a key component of the Life Insurance business.
GWP Mix
2006 2007 2008 2009 2010
General 55% 48% 50% 53% 55%
Life 45% 52% 50% 47% 45%
Without being restricted to the traditional mode of focusing on Insurance Advisor driven sales, a bancassurance channel was started with the blessings of the parent company in the year 2008 and this channel has now started generating outstanding results as expected. The GWP generated from the bancassurance channel grew by 78% to record Rs. 158 million in the current year. Much higher results are expected from this channel in the future. This is discussed in detail in the Life Insurance review on pages 40 to 44.
Management Discussion & Analysis

27HNB ASSURANCE PLC ANNUAL REPORT 2010
General Insurance business was able to generate consistent performance in the GWP except for the decline shown in the second quarter. This was mainly due to the removal of the terrorism cover from 1st April 2010 and the reduction in renewal premiums of a few large policies due to severe competition in the market and changes in underlying asset values.
However, the growth in Life Insurance was not consistent during the year particularly due to the large volumes of Single Premium Investment Policies sold during the fi rst three quarters of 2009. Nevertheless, the Company recovered strongly in the 4th quarter, recording a GWP growth of 59% over the corresponding period in the previous year. This resulted in the annual growth rate in Life Insurance GWP being restored to double digit levels again.
Other than in the second quarter, the Company maintained reasonable growth rates in combined GWP. However, we recorded an exceptional growth of 46% in the fourth quarter breaking all records, helping the Company to reach a 15% growth in combined GWP for the year. All employees, insurance advisors and other partners of HNB Assurance put their best possible effort to achieve this remarkable growth rate in GWP, particularly in the fourth quarter. It was a team effort that clearly demonstrated the capabilities and potential of the Company.
Profi ts (Rs. Mn.)
2006 2007 2008 2009 2010
Profi t Before Tax
General 63 78 70 101 114
Life 30 65 100 130 156
Company 93 143 170 231 270
Growth 50% 54% 19% 36% 17%
Profi t After Tax
Company 91 123 164 202 242
Growth 52% 35% 33% 23% 20%
2010 (Rs. Mn.)
Q1 Q2 Q3 Q4 Total
General GWP 306 299 357 382 1,344
Life GWP 232 227 304 321 1,084
Total GWP 538 526 661 703 2,428
2009 (Rs. Mn.)
Q1 Q2 Q3 Q4 Total
General GWP 240 307 303 280 1,130
Life GWP 217 230 337 201 985
Total GWP 457 537 640 481 2,115
Growth
Q1 Q2 Q3 Q4 Total
General GWP 27% -3% 18% 36% 19%
Life GWP 7% -1% -10% 59% 10%
Total GWP 18% -2% 3% 46% 15%
Profi tability
The Company produced outstanding results in profi tability, consistent with its performance in the past. The Company generated a 17% growth in PBT to record Rs. 270 million and a 20% growth in PAT to record Rs. 242 million.
The contribution of General Insurance to PBT was Rs. 114 million, indicating a growth of 12% over the profi t of Rs. 101 million recorded in 2009. PAT from General Insurance was Rs. 86 million for the year which was a growth of 20% from the Rs. 72 million recorded last year. The PAT growth is on par with the growth in Company PAT.
Life Insurance generated a surplus of Rs. 156 million during the year, recording a growth of 20% over the surplus generated last year of Rs. 130 million. The said surplus was calculated by the Consultant Actuary following his valuation of the Life Insurance Fund at the year end, keeping due allowances for all liabilities including bonuses for Life Insurance Policyholders.
During the year the claim ratio of General Insurance rose to 68% compared to 66% in the previous year. Thus, profi t on General Insurance was achieved mainly through the effi cient expense management strategies adopted by the Company which brought down the General Insurance expense ratio to 39% in 2010 from 42% recorded in the year 2009. Finally, the Combined Ratio showed a 1% improvement, recording a fi gure of 107% in the current year, down from 108% recorded in the year 2009.

28
A detailed discussion of General and Life Insurance profi tability is given on page 34 and 43.
Combined Ratio in Life Insurance remained at 65% in both years. While the Claim Ratio has improved from 7% in 2009 to 6% in 2010, the Expense Ratio has shown a 1% increase from 58% in 2009 to 59%in 2010.
Investment income generated an increase of 11% to record Rs. 517 million during the year. This is truly a commendable effort given the sharp drop in market interest rates over the year and the tight regulatory environment with limited options for investments. It is expected that interest rates will remain at these levels in the short to medium term and therefore there will be more focus on managing underwriting results. Accordingly, the Company will pay more focused attention on claims and expense management during the year 2011.
Investment Income (Rs. Mn.)
2006 2007 2008 2009 2010
General 56 86 127 156 178
Growth 44% 54% 48% 23% 14%
Life 53 114 215 311 339
Growth 102% 115% 89% 45% 9%
Company 109 200 342 467 517
Growth 69% 84% 71% 37% 11%
Earnings Per ShareEarnings Per Share (EPS) refers to the portion of a company’s profi t allocated to each issued ordinary share. EPS serves as one of the key indicators of a company’s profi tability. In addition, EPS is also considered to be the single most important variable in determining the price of a share.
The Company’s Earnings Per Share has also grown steadily over the years and has increased by 20% from Rs. 5.38 in 2009 to Rs. 6.45 in 2010. The graph on clearly the consistent growth recorded in EPS over the last few years.
Return on Equity (ROE)The Return on Equity stood at 24% at the year end, consistent with the last year. This is a very attractive rate of return considering the current economic environment, and comparing with the average risk free return which is recording about 8.59% (one year treasury bill rate) for the year.
The graph shows ROE over the years. It also indicates the Company’s commitment to deliver consistent performance and value addition for its shareholders in every year.
Reinsurance The total Reinsurance outgo (premium ceded to reinsurers) of the Company came down by 1% to Rs 449 million from the Reinsurance cost of Rs. 454 million of 2009.
Drop in Reinsurance can be mainly attributed to General Insurance since its Reinsurance outgo came down by 3% compared to the last year. The chief reason for this is the change in the General Insurance class mix. The contribution from Motor and Miscellaneous classes to General Insurance GWP grew compared to the last year and these classes have a lower Reinsurance component compared to Fire and Marine Classes.
Reinsurance from Life Insurance increased by 7% to Rs. 99 million from the Reinsurance outgo of Rs. 93 million incurred in the year 2009.
ClaimsInsurance claims and benefi t expenses, which are the main costs of an insurer, increased by 27% during the year.
Net claims incurred in General Insurance grew by 31%. A high claim experience in the Miscellaneous and Motor classes is the main contributory factor for this unfavourable increase in claims. Claim experience in other classes was also exceptionally high during the year due to reasons such as the frequent occurrence of fl oods.
Management Discussion & Analysis

29HNB ASSURANCE PLC ANNUAL REPORT 2010
Net claims incurred in Life Insurance declined by 6% during the year. This was mainly because of the decreasing surrender of Single Premium Investment Policies. However, the maturity claims during the year showed a growth of 116% with a high volume of maturities coming up as the Company gets older.
Underwriting and Net Acquisition CostsThe underwriting and net acquisition cost increased by 10% during the year. Main cost component under this is the commission and other acquisition costs paid to intermediaries. Commissions from reinsurers are netted off against the cost in line with the guidelines of the Statement of Recommended Practice (SoRP) issued by ICASL for Insurance Companies. Overall growth in Underwriting and Net Acquisition Costs was managed at this level with the receipt of attractive commissions and profi t commissions from reinsurers.
Other Insurance Related Expenses All direct expenses in respect of underwriting such as pre-underwriting inspection fees, medical fees, NBT paid on reinsurance etc are included in this category. Pre-underwriting inspections and NBT on reinsurance were new cost components which came into effect in the latter part of 2009 and therefore, the increase in overall cost over last year is very high at 60%. In particular, it was decided to implement pre-underwriting inspection procedures in order to minimise the underwriting risk, which in turn helps reduce claims. This resulted in an increase in the direct cost associated with the acquisition of General Insurance business.
Other Operating, Investment Related and Administration Expenses This includes all expenses other than what was discussed above. Salaries, administration expenses, depreciation and amortisation are few of its major components.
The overall growth of this expense category was managed at 14%. Strict but sensible expense management strategies adopted by the Company throughout the year has produced these results. In particular, this has resulted in bringing down the Expense Ratio in General Insurance from 42% recorded last year to 39%, which is a commendable achievement.
Income TaxesThe income tax expense reduced by 6% during the year. The main contributory factor for this favourable variance in Income Tax is the realisation of profi ts from the well performing equity market, which is tax free. More funds of the Company were moved to the equity market during the year on a well planned and systematic approach and some of the gains were realised during the year.
As discussed above, the 2011 budget proposals introduced a number of initiatives to reduce the tax burden on corporate entities and it is expected that these measures will have a positive impact from the fi nancial year 2011 onwards.
Asset GrowthAs an insurer, a solid fi nancial base is essential for a sustainable business. Thus, HNB Assurance continues to build and maintain a strong balance sheet through growth in the total asset base comprising a quality asset portfolio which follows the guidelines issued by regulators strictly. The Company focuses on improving the proportion of income generating assets included in total assets without heavily burdening the balance sheet with non-income generating assets. This solid commitment to stability has given the ability to overcome challenges posed by these diffi cult times. In line with the trend the total assets of the Company increased by 24%, from Rs. 3,672 million in 2009 to Rs. 4,548 million in 2010. Income generating assets constitute 80% of the total assets.
Details of the Company’s investments included under total assets are discussed on page 45 to 47.

30
Shareholders’ FundsShareholders’ funds surpassed the important milestone of Rs. 1 billion during the year to record Rs. 1,016 million from Rs. 831 million recorded in 2009. Growth in the Shareholders’ equity compared to the corresponding period was 22%. It must be noted that recording Rs. 1 billion shareholders’ equity with organically generated funds was one of the prime targets set at the beginning of the year.
DividendThe Company proposes a fi nal dividend of Rs 1.80 per share on profi ts for the year under review, which will amount to a total dividend payout of Rs 67.5 million. The proposed dividend is at a growth of 20% over the last year’s dividend per share of Rs. 1.50.
Net Asset Value Per Share (NAVPS)Net Asset Value Per Share (NAVPS) is used as one of the key performance indicators of the stability of a company. The net asset position of the Company has been consistently growing over the years, strengthening the Company’s stability year by year. Company’s NAVPS as at 31st December 2010 was Rs. 27.10 which is a growth of 22% from Rs. 22.16 recorded last year.
Life Insurance FundThe Life Fund of the Company crossed Rs. 2 billion mark during the year and stood at Rs. 2,385 million at the end of the year. This was a 29% growth over the Life Fund of Rs. 1,854 million in 2009. As in the previous years, the Company arranged for a Consultant Actuary to value the Life Fund and the Report of the Consultant Actuary is given on page 155. Adequate provisions have been made in respect of bonus to policyholders, solvency and other contingencies out of the current year’s surplus as per the Actuary’s Report.
General Insurance FundThe General Insurance Fund liability also increased by 22% during the year to reach Rs. 731 million from Rs. 599 million recorded in the year 2009. Net Unearned Premium, Claims Outstanding, Reserves for Incurred But Not Reported (IBNR) and Incurred But Not Enough Reported (IBNER) claims, Net Deferred Acquisition Costs are the components of the General Insurance Fund Liability.
The Management has taken all reasonable steps to ensure adequate provisioning for Net Unearned Premium, Net Deferred Acquisition Costs and Claims Outstanding including provisions for IBNR and IBNER reserves. The Management has also consulted an Independent Actuary in the process of valuing IBNR and IBNER reserves and his report is given on page 154.
Both the Life and General Insurance Funds are valued based on best available information and in accordance with the provisions of Regulation of Insurance Industry Act, No. 43 of 2000 and in line with rules and guidelines issued by the Insurance Board of Sri Lanka (IBSL).
Solvency MarginsThe Company continued to satisfactorily meet the Solvency Margins criteria issued in 2004 by the Insurance Board of Sri Lanka (IBSL) throughout the year in both General and Life Insurance. This was achieved by adopting prudent investment policies and monitoring the positions of admissible assets and liabilities continuously.
The Statement of Solvency and Approved Assets covering General and Life Insurance businesses is presented below.
General Insurance - Solvency Margin
The admissible assets in General Insurance amounted to Rs. 1,300 million at the year-end of 2010 while the total liabilities amounted to Rs. 901 million resulting in an Available Solvency Margin of Rs. 399 million. As the Required Solvency Margin in General Insurance amounted to only Rs. 199 million, the Company exceeded the required solvency margin by 2.01 times.
Management Discussion & Analysis

31HNB ASSURANCE PLC ANNUAL REPORT 2010
Life Insurance - Solvency Margin
In Life Insurance, the Required Solvency Margin was Rs. 108 million while the Company maintained an Available Solvency Margin of Rs. 122 million resulting in the maintenance of a solvency ratio of 1.13 times. For meeting this purpose, the Company maintained admissible assets amounting to Rs. 2,460 million whilst the total liabilities stood at Rs. 2,338 million at the end of 2010.
Statement of Solvency
The statement of solvency for General Insurance and Life Insurance has been prepared in accordance with the Solvency Margin (General Insurance) Rules – 2004 and Solvency Margin (Life Insurance) Rules – 2002 respectively and is in line with the formats stipulated by the Insurance Board of Sri Lanka (IBSL).
Rs. ‘000
General Insurance Business 1.Value of Admissible Assets 1,300,1412. Amount of Total Liabilities 901,125 3. Value of Admissible Assets minus Amount of Liabilities 399,016 4. Required Solvency Margin 198,688 5. Solvency Ratio [Line 3 divided by Line 4] 2.01
Life Insurance Business 1. Value of Admissible Assets 2,459,534 2. Amount of Liabilities: 2.1 Policy Liabilities 2,162,776 2.2 Other Liabilities 174,893 2,337,669 3. Value of Admissible Assets minus Amount of Liabilities 121,865 4. Factor 5%5. Required Solvency Margin 108,139 6. Solvency Ratio [Line 3 divided by Line 5] 1.13
Approved Assets Determined as per Section 25 (1) of the Regulation of Insurance Industry Act, No. 43 of 2000 and the Determination made by the IBSL in terms of the said Act.
General Insurance Business 1. Approved Assets maintained in General Insurance Business 1,106,0292. Technical reserve 658,8993. Approved Assets in Excess of the Technical Reserve 447,1304. Approved Assets as a % of the Technical Reserve 168%5. Required Ratio 100%
Life Insurance Business 1. Approved Assets maintained in Life Insurance Business 2,399,4552. Life Insurance Fund 2,385,246 3. Excess in Approved Assets over the Life Insurance Fund 14,209 4. Approved Assets as a % of Life Insurance Fund 101%5. Required Ratio 100%

32
General Insurance Review
Business EnvironmentGeneral Insurance business had to compete in very challenging market conditions during 2010. The post war era ushered in tremendous optimism for growth and development, especially in the area of infrastructure development and tourism. Some of the planned government initiatives took off the ground this year thereby creating more insurance opportunities, but private sector insurers were deprived from exploiting these opportunities as a treasury circular restricted the placement of such insurance covers to only the two state insurers. Declining premium rates also had an adverse impact on the market with growth hovering in single digits.
With the end of the war and the dawning of a more peaceful environment, many customers opted not to purchase the terrorism cover. This was not surprising and the Government Pool for Riot, Strikes and Terrorism recognising the reduced risk exposure, dropped their rates by 75% for these covers. This reduction was necessary and justifi able but the sudden drop in premium levels contributed towards the low growth rate recorded by the market, which is still adjusting to this new development.
Motor Insurance which contributes substantial amounts towards the market premium and Marine Insurance were growth areas seen in 2010. Even though the Marine growth was marginal, it nevertheless was a change from the fl at trend seen in the last year. Both these classes benefi ted from the liberalised import duty environment especially for motor vehicles.
Weather related claims emanating from two major fl oods experienced in Colombo and its suburbs resulted in numerous property and motor claims, which had an adverse effect on loss ratios. Falling interest rates resulted in investment returns shrinking when compared with previous years and these factors combined to create a major challenge to maintain profi tability.
Despite this negative trend, we also saw new insurers commence operations, and this augurs well for the industry. Currently there are eighteen General Insurance companies competing for business as at end 2010.
The market performance during 2010 has shown a turnaround after the negative growth experienced in 2009. We believe this positive trend will continue and look forward to an even better year in 2011.
Business ReviewGeneral insurance recorded a Gross Written Premium (GWP) income of Rs 1,344 million (2009 - Rs. 1,131) which is a 19% growth over last year. This growth rate is considerably above the industry growth rate and has resulted in an increase in the market share this year. The fact that we have been able to increase our market share consistently during the past couple of years is a very satisfying trend.
Growth in Gross Written Premium (GWP)……
The highest growth rate in General Insurance was recorded in the Miscellaneous Class. This grew by 83%, whilst Motor Insurance grew by 24%. Marine Insurance which had a negative trend in previous years recorded a growth of 5%. However Fire Insurance experienced a marginal drop in income recording a negative growth rate of 5%.
GWP in classes……
The negative growth experienced in some of the classes had an impact on the class mix this year. The Motor Class continued to dominate with 68% but we saw a change in the contribution of the Miscellaneous Classes which rose from 6% to 9%. This factor combined with a negative growth in the Fire Class resulted in its contribution to total GWP falling from 27% to 21%. Even though the Marine Class grew, its contribution towards the mix diminished when compared to the previous year, as the quantum of growth in terms of premiums was not signifi cant.
Management Discussion & Analysis

33HNB ASSURANCE PLC ANNUAL REPORT 2010
Business in ChannelsThe year under review did not see any major changes in our business channel mix towards the overall premium of Rs 1,344 million. HNB was the main contributor with 41% (42% in 2009) whilst business from brokers and direct sources recorded 27% (29% in 2009) and 23% (22% in 2009) respectively. However it was heartening to observe the slight increase in the agent’s contribution, which went up to 9% this year (7% in 2009).
HNB, the highest contributing channel…..
The Hatton National Bank channel backed by business emanating from its head offi ce and branches, continues to be the backbone of our income. This dependency, however, has been on a reducing trend. This is in keeping with the Company’s strategy, as reducing over-reliance on one channel and creating a more broad-based network of income sources adds stability to the Company’s continued progress.
Contribution from HNB Channel
2006 2007 2008 2009 2010
61% 64% 52% 42% 41%
The Company however recognises the importance of harnessing the HNB network and all efforts are taken to maximise the opportunities from this business source. Senior management and their teams from both companies committed themselves towards pursuing planned goals and this approach has seen increased income generation, resulting in growth both in terms of volume and profi tability.
The Company introduced various competitions and events in order to ensure HNB staff remains motivated in this quest. Our branches too played an active role, liaising with the relevant branches of the HNB to enhance customer satisfaction and thereby business volumes.
During the year, the HNB channel recorded a premium income of Rs. 551 million which is a 16% growth over the last year (Rs 476 million in 2009). With the reduction in vehicle import tax and the interest rates for lending on the decline, we believe there would be more opportunities for business growth, especially in the areas of leasing and SME lending by the bank. This would translate into business opportunities to us as well and hence there is reason to be optimistic about an increased business growth from this channel over the next couple of years.
Contribution from the Broker channel
The broker channel recorded a GWP of Rs. 360 million, which is a growth of 8% over last year (2009 – Rs. 333 million). However, the contribution of the channel towards the overall income has declined slightly to 27% from 29% in the year 2009. Nevertheless, we are pleased with the support extended by the brokering companies with some beginning to transact business more frequently. This indicates the increasing confi dence placed in us by this important community. We saw a signifi cant growth in this channel in the year 2009 and we have seen a steady stream of business being chanelled towards us during the year under review as well.
Contribution from Broker Channel
2006 2007 2008 2009 2010
11% 10% 15% 29% 27%
We recognise the importance of this business source and are keen to expand and develop the business relationship. Towards this the Company organised regular training programmes for employees of the broker companies, to educate them on technical aspects and also brief them about the procedures and practices of the Company. This no doubt has created a better understanding between us and the brokering companies.
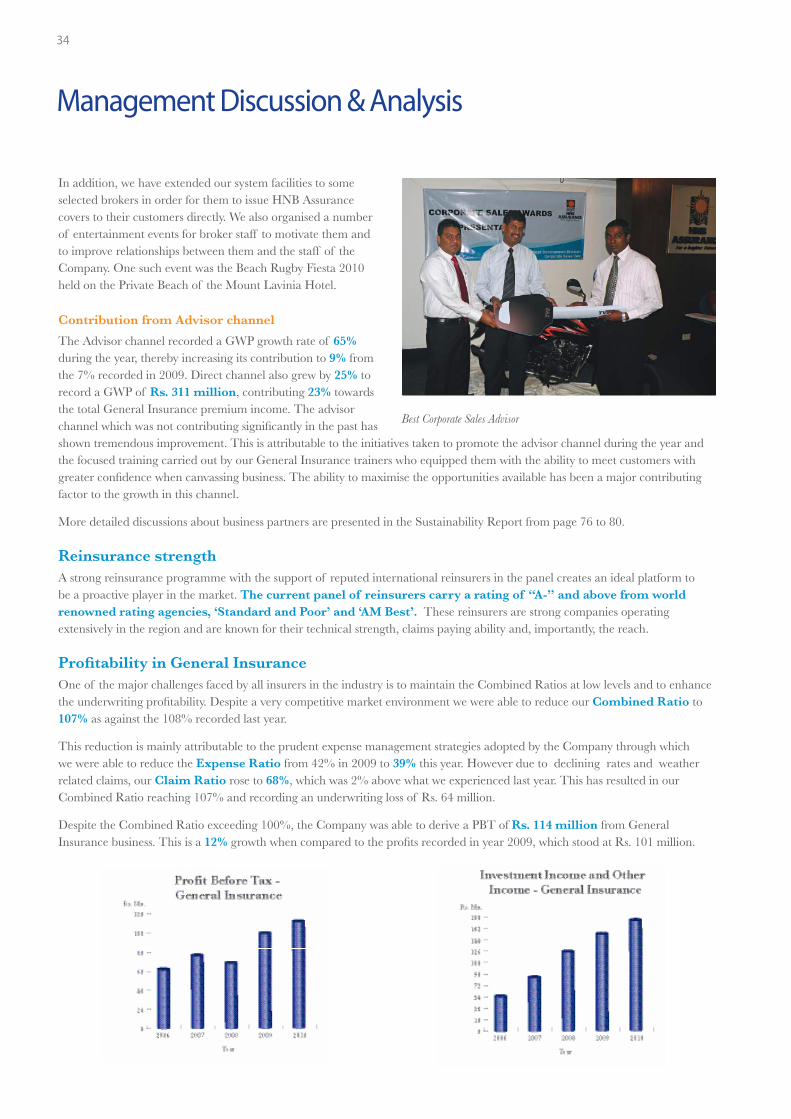
34
In addition, we have extended our system facilities to some selected brokers in order for them to issue HNB Assurance covers to their customers directly. We also organised a number of entertainment events for broker staff to motivate them and to improve relationships between them and the staff of the Company. One such event was the Beach Rugby Fiesta 2010 held on the Private Beach of the Mount Lavinia Hotel.
Contribution from Advisor channel
The Advisor channel recorded a GWP growth rate of 65% during the year, thereby increasing its contribution to 9% from the 7% recorded in 2009. Direct channel also grew by 25% to record a GWP of Rs. 311 million, contributing 23% towards the total General Insurance premium income. The advisor channel which was not contributing signifi cantly in the past has shown tremendous improvement. This is attributable to the initiatives taken to promote the advisor channel during the year and the focused training carried out by our General Insurance trainers who equipped them with the ability to meet customers with greater confi dence when canvassing business. The ability to maximise the opportunities available has been a major contributing factor to the growth in this channel.
More detailed discussions about business partners are presented in the Sustainability Report from page 76 to 80.
Reinsurance strengthA strong reinsurance programme with the support of reputed international reinsurers in the panel creates an ideal platform to be a proactive player in the market. The current panel of reinsurers carry a rating of “A-” and above from world renowned rating agencies, ‘Standard and Poor’ and ‘AM Best’. These reinsurers are strong companies operating extensively in the region and are known for their technical strength, claims paying ability and, importantly, the reach.
Profi tability in General Insurance One of the major challenges faced by all insurers in the industry is to maintain the Combined Ratios at low levels and to enhance the underwriting profi tability. Despite a very competitive market environment we were able to reduce our Combined Ratio to 107% as against the 108% recorded last year.
This reduction is mainly attributable to the prudent expense management strategies adopted by the Company through which we were able to reduce the Expense Ratio from 42% in 2009 to 39% this year. However due to declining rates and weather related claims, our Claim Ratio rose to 68%, which was 2% above what we experienced last year. This has resulted in our Combined Ratio reaching 107% and recording an underwriting loss of Rs. 64 million.
Despite the Combined Ratio exceeding 100%, the Company was able to derive a PBT of Rs. 114 million from General Insurance business. This is a 12% growth when compared to the profi ts recorded in year 2009, which stood at Rs. 101 million.
Best Corporate Sales Advisor
Management Discussion & Analysis

35HNB ASSURANCE PLC ANNUAL REPORT 2010
Profi t After Tax from General Insurance was Rs.86 million with a growth of 20% over Rs.72 million recorded last year.
The growth in General Insurance profi ts was mainly due to exceptional investment yields which generated an investment income of Rs 178 million, with a growth of 14% over the last year.
Having recognised the need to maintain the Combined Ratio below 100%, the management has introduced various measurers to curtail expenditure and minimise claims costs. Meeting profi t expectations next year is a very challenging task, especially with the sharp decline in interest rates and intense price competition, which would adversely impact profi tability. However we are confi dent that we have the capability to take on this uphill task.
General Insurance Ratios
2006 2007 2008 2009 2010
Net Claim Ratio 60% 62% 67% 66% 68%
Expense Ratio 38% 39% 43% 42% 39%
Combined Ratio 98% 101% 110% 108% 107%
Initiatives during the yearAll major products of General Insurance were moved to operate under a new IT system during the year with the objective of uploading the entire backlog of historical data during the fi rst quarter of 2011.Through this new initiative, we would be connecting our entire branch network into one integrated platform which would enable us to service our customers from anywhere in the island. This no doubt would improve our service to customers, with extended connectivity into customer domains, enabling quicker client servicing as planned in the next phase.
Another key initiative taken by the General Division was the formation of the General Insurance Academy, primarily aimed at improving the technical competency of the staff attached to the Division. The opportunity to follow the three tiered learning programme was also open to staff attached to other divisions as well, with many from other units too enrolling themselves to expand their knowledge base. The course is designed and conducted by in-house resource persons. It is envisaged that this would create a greater appreciation and awareness of our product range among wider groups of people within the Company in addition to imparting technical knowledge and skills.
Motor Insurance during the yearMotor Insurance recorded a growth of 24% during the year to record a GWP of Rs. 916 million. This is a commendable achievement considering the market environment during the year. As mentioned before, the rate revision on terrorism cover and the ever increasing requests to delete this cover from the policy by existing customers had a signifi cant impact on premium income. The premium generated through this cover in Motor Insurance for 2010 was just Rs. 27 million which is a decline of 61% over 2009. Despite this, Motor Insurance continued to be the spearhead of the Company’s General Insurance business.
The contribution to the total General Insurance GWP from Motor insurance increased to 68%, from 65% in the year before. Tying up with leasing institutions and an aggressive approach in preferred segments vehicle types were strategies which were adopted to expand this portfolio. The reduced import tax regime, which increased the number of vehicle imports, also contributed to the growth in this class.
COMBINED RATIO
What Does Combined Ratio Mean?
Combined Ratio is “a measure of profi tability used by an insurance company to indicate how well it is performing in its daily opera-tions. A ratio below 100% indicates that the company is making underwriting profi ts”.
The Combined Ratio consists of the Claim Ratio and the Expense Ratio. The Claim Ratio is claims paid and owed as a percentage of revenue earned from premiums. The Expense Ratio is operating costs as a percentage of revenue earned from premiums.
Calculated as: Incurred Claims + Expenses
Net Earned Premium
Even if the Combined Ratio is above 100%, a company can still make a profi t, because the ratio does not include the income from investments.

36
“motorGuard” the best Motor Insurance Product in the marketOur motor insurance product is marketed under the brand name ‘motorGuard’ and some of it’s key features are;
• Product with the fastest time to obtain a No Claim Bonus (NCB) of 75% (within 6 years)
• NCB reduction only after 2 accidents for a year• If repair exceeds 30 days on a leased vehicle – lease payment up to 2 instalments
subject to a maximum amount of Rs. 100,000/-• Same NCB continued for the second vehicle. • Free towing charges up to Rs. 2,500/-• Free Air bag cover• Free learner driver cover for spouse and family• Cash grant for Children’s education up to Rs. 250,000/- in the event of accidental death and if spouse is unemployed
Motor insurance service improvements ……
In a price sensitive environment, service becomes an important cog in the wheel for business retention. Not forgetting this aspect, we have introduced a few facilities which are aimed at providing our customers a satisfying service.
Pre underwriting surveys - Our motor assessors are sent to inspect a client’s vehicle at a convenient location of their choice prior to acceptance. This not only facilitates the completion of the proposal form but also helps to identify any areas of the vehicle which needs immediate attention.
24 hour Helpline - The Company operates a customer relations centre with a 24 hour helpline (0114 - 883883). This enables our customers to report a claim at any time or make an inquiry.
Fast track unit- In order to facilitate a speedy service on small claims, we operate a fast track system which processes claim payments below Rs. 25,000/- within 24 hours of the accident.
Immediate Assessment - We currently have an independent assessor panel with assessors stationed at various parts of the country. This facilitates prompt claims assessments anywhere, at any time.
Camera Phones for Assessors - Assessors operating in selected areas have been provided with special camera phones, which enable them to upload pictures of the vehicle in its post accident state directly to our system and almost immediately from the site of the accident. This feature facilitates quick assessments whilst also acting as a deterrent to staged and fraudulent claims.
SMS Alert - The Company has developed systems using the advancements in the area of mobile technology to serve our client base more effi ciently. We communicate to our clients the name of the assessor and the time he would visit the accident site to carry out the loss assessment through a SMS. This enables our customers to be informed of the actions taken by us following their loss intimation. Our Customer Relations Centre (CRC) also keeps in touch with the designated assessor through the same medium.
Approved garages and spare part suppliers for a cashless service – We have a network of approved garages and spare part suppliers covering all major towns in the country. When using their services following an accident, customers do not pay for the service rendered to them, as all payments are made directly by the Company. This reduces the burden placed upon the customers to settle bills for services obtained.
Management Discussion & Analysis

37HNB ASSURANCE PLC ANNUAL REPORT 2010
Profi tability on Motor Insurance…..
Due to the adverse weather conditions experienced during the year we were beset with many fl ood related claims. Despite this, we were able to end with a Claim Ratio of 65%, which is marginally lower than the 66% recorded last year.
Non Motor Insurance during the year Non-Motor Insurance consists of all classes of business other than Motor Insurance and generally includes Fire, Engineering, Marine, Workmen’s Compensation, Health, Travel Insurance etc. The contribution to Company’s total General Insurance GWP from these classes was recorded at 32% in the year under review, which is a 3% decline in contribution when compared to 2009. The main reason for this change is due to the Fire Class not being able to achieve the premium levels envisaged for the year.
Fire Insurance performance during the year…..
Despite the Company being able to secure most of its renewal business and also win new customers, Fire Insurance recorded a 5% decline during the year in GWP compared to 2009. The downward revision in the values proposed for insurance by key clients, non renewal of a large corporate account due to its decision to seek insurance protection within the group, reduced terrorism premium due to rate revision and lack of demand, and fi erce competition, were some of the reasons this decline could be attributed to. The GWP generated from ‘Terrorism Cover’ on Fire Insurance was only Rs. 19 million recording a 70% decline of the GWP generated from this cover in 2009 which stood at Rs. 64 million.
However, we were also able to secure a few large accounts as new business during the year whilst successfully providing continued insurance cover for some of the leading development projects in the country. The decision by the government to insure all state sponsored projects only through the state insurers strangled our participation but we remain hopeful that this decision would be reviewed, in the near future.
Fire Insurance profi tability……
Fire Insurance recorded a Claim Ratio of 37% during the year. This is a 20 percentage point increase when compared with the Claim Ratio of 17% recorded in 2009. However this Claim Ratio is much lower when compared with the Claim Ratios of other classes. A major reason for the increase in claims this year was weather related losses. Even though we did not experience many large losses, numerous small claims which arose from fl ooding experienced in May and November had an impact on profi tability.
Marine Insurance
This policy covers the transient risk involved whilst goods are being moved between locations either as an export, import or land transit item. Usually terms are negotiable based on annual values but single transits are also insured upon request.
Marine Insurance performance during the year…..
Marine Insurance recorded a GWP of Rs. 24 million during the year and this was a 5% increase when compared with the GWP recorded in 2009. However, this increase did not have a signifi cant impact on the overall GWP due to its very low contribution.
The Marine Insurance class has been sluggish over the last two years and we are hopeful this trend would change. With the ‘Magampura’ port coming into full operation and upon completion of other ports in the country, which are currently under construction, we believe that there will be greater potential for Marine business in the future.
We are conscious of growth opportunities and therefore have convinced our reinsurers to increase our capacity under Marine Insurance by 16% with more underwriters being recruited for this unit. An internet based policy issuance system is a feature which would be introduced soon to facilitate documentation and increase operational effi ciency.

38
Marine Insurance profi tability……
The Marine Claim Ratio for 2010 which is at 34% is higher than the Ratio experienced in 2009 (12%). Many small attritional losses in a very price conscious environment along with a few weather related claims have had an adverse impact on the contribution to profi tability.
Miscellaneous Insurance during the year…..
This class has shown tremendous growth recording a premium income of Rs. 115 million which is 83% more than last year. The predominant contribution for the growth has come from corporate medical portfolios which were underwritten as accommodation business in conjunction with the property portfolios of the entities concerned. As a business segment, medical insurance has not been a value addition to profi tability but has become an integral part of corporate portfolios. There has also been a growth seen in the burglary, travel and personal accident business segments which are also accounted under this class.
A key area of growth in the future would be the liability class of insurance, with entities seeking more protection against the possible exposures arising from products marketed by them and the facilities at premises provided to public when interacting with them. The inquiry for legal liability insurance is low but increased globalisation and progress in law reforms may compel the need for this cover.
Miscellaneous Insurance profi tability……
This class recorded the highest Claim Ratio among all classes. The Claim Ratio as at end 2010 was 142% which however was lower than the 158% Claim Ratio recorded in 2009. Even though the Claim Ratio has declined, it nevertheless had a higher adverse impact on profi tability in terms of quantum due to the high growth in GWP from this class in 2010. The main contributor towards the high Claim Ratio has been the medical portfolio. We currently use the services of Medilink International, a third party administrator (TPA), as our service provider to handle all our medical claims. Revised structures and terms along with effi cient claims management are the measures being formulated to manage the adverse trend with Medilink being involved in developing these measures jointly with the Company.
Non Motor Insurance products……
The Company is equipped with insurance solutions to meet the diverse needs of both our corporate and personal lines customers. Whilst corporates have specially designed insurance policies to cover their needs based on exposure, structure and reach; individuals have many ‘off the shelf ’ packaged products which are capable of meeting their specifi c needs.
Some of the main products under our corporate line are;
Commercial All Risk /Fire insurance
Entities with offi ces, factories, warehouses etc. are able to protect their physical assets against a range of risks such as Fire, Malicious Damage, Riots, Strike, Natural Perils, Unexpected Accidental Damages etc. through this policy. These policies are mainly handled through our corporate business development unit but could be purchased through our distribution network as well.
Public Liability / Product Liability
These are two main policies sought by corporate entities to protect their legal exposure arising from the premises they operate and the products manufactured by them. Coverage is agreed based on the exposure, location, operational size, policy limits, jurisdiction and geographical reach.
Medical Insurance
Usually purchased by corporates along with their non-medical portfolio, Corporate medical schemes are designed based on their requests. Flexibility is granted within specifi c limits which are factored into the price structure. As a Company policy, we avoid writing this business on a stand alone basis.
Management Discussion & Analysis

39HNB ASSURANCE PLC ANNUAL REPORT 2010
Contractor’s All Risks / Erection All Risks
This product is also handled by our Corporate Business Development Division due to the complexity involved in the underwriting of risks. It covers any unforeseen or accidental damage to the construction or erection of the property/item before the completion date.
Some of the personal line insurance products that cater to our retail clients are given below;
Aruna is an umbrella policy that protects homes from disasters such as fi re, lightning, cyclone, fl ood, earthquake, tsunami, theft and falling trees. There are also optional covers for terrorism, personal accidents and damage to gardens (landscaping), all under a single policy.
All overseas travellers can now purchase Travel Insurance at competitive terms. We have policies which cater to the needs of both one-off travellers and persons travelling frequently. The policy covers emergency medical expenses, dental care, hospitalisation, lost baggage, lost passports, fi nancial emergencies and even trip delays and cancellations. Cover could be purchased for a whole year’s travel through a single premium payment or for each trip. The special feature of this product is that subject to conditions, cover could be purchased by persons up to 80 years.
A revolutionary concept which provides ‘Travel Assistance’ as opposed to ‘Travel Insurance’. This product is designed to provide for any requirement from medical house calls, to emergency hospitalisation, surgery, dental care, legal assistance, cash for bail, lost luggage and lost passports. It is offered in partnership with Assist Card of Switzerland, whose worldwide network has 48 regional call centres and over 850 support centres on-call 24 hours a day. The special feature of this product is that it has no age limit and also pays for medical expenses arising from existing ailments up to specifi ed limits.
This is a comprehensive policy for business establishments such as retail shops, tailor shops, salons, dispensaries and professional offi ces, Navoda offers cover for fi re & lightning, riot and strike, malicious damage, cyclones & storms, fl oods, bursting pipes and overfl owing tanks, burglary, loss or damage to personal property of directors or employees, loss of rent and a variety of other benefi ts.

40
Life Insurance Review
Business EnvironmentThe post-war era has created a new dawn in the Life Insurance industry and improved the market conditions, particularly with greater access to markets in the emerging Northern and Eastern provinces of the country. The low interest rates prevailing in the market have also made a positive impact on some aspects of the Life Insurance industry, such as increasing the number of housing loans thereby creating an opportunity for increased sales of Mortgage Reducing Policies (MRP).
However, the low interest rates have also had a negative impact on investment income, which was adversely affected during the year. It also dampened the demand for single premium investment policies which has been a signifi cant contributor to GWP growth in the last few years. Despite the high competition among the 14 Life Insurance companies in the market, the Company was able to compete well through innovation and by capitalising on the Company’s strengths.
Business ReviewThe year 2010 ended on a happy note for the Life Insurance business of the Company, surpassing the important milestone of Rs. 1 billion of Gross Written Premium (GWP) for the fi rst time in its history. The Life GWP stood at Rs. 1,084 million at the end of the year (2009 – Rs. 985 million). The Life Fund also surpassed the Rs. 2 billion mark to reach Rs. 2,385 million.
Towards end of the year, the Life insurance business bounced back to its growth momentum by achieving a growth rate of 10% when compared with the 8% growth recorded in 2009. In the fi rst three quarters of the year, Life Insurance did not show a positive growth over the previous year, due to the lack of demand for the single premium products. However during the last quarter, Life GWP recorded a signifi cant growth of 56% compared to the relevant fi gure of the previous year and restored the annual growth rate back to double digit levels. An improved performance from single premium policies (Rs. 44 million) coupled with excellent growth from both endowment policies and MRPs contributed towards this.
Life Insurance GWP growth rates
Year 2004 2005 2006 2007 2008 2009 2010
GWP 98% 72% 42% 53% 19% 8% 10%
Growth in Gross Written Premium (GWP)A further analysis of achieving a 10% growth rate is given below.
The GWP on traditional endowment policies contributed to this growth by recording a growth rate of 27%. The growth in endowment policies came from ‘First Premium’ (new business premium) which recorded an outstanding growth rate of 71%, the ‘First Year Premium’ growth rate of 18% and ‘Renewal Premium’ growth rate of 23%.
The GWP recorded through single premium Mortgage Reducing Policies (MRP) grew at a rate of 55% whilst the GWP generated on Micro Insurance policies recorded a 100% growth rate. Even though the latter did not have a big impact on the overall GWP, it showed a positive future for the development of Micro Insurance in the country.
However, GWP generated through the Investment Policy, which was introduced by the Company in previous periods utilising the opportunities available then, declined by 59% recording a GWP of Rs. 86.5 million (2009 – Rs. 211 million). The decline in the GWP on Investment policy was anticipated due to the interest rates of the country being on a single-digit level throughout the year. We planned for a drop in Single Premium Investment Policies for the year and therefore paid maximum attention on the development of traditional endowment policies, a strategy which has yielded results over and above expected levels. GWP generated through Group Life business recorded a marginal growth of 2%. However, this did not have a major impact on the overall Life Insurance GWP since the contribution to the overall GWP of this product was less than 1%.
Management Discussion & Analysis

41HNB ASSURANCE PLC ANNUAL REPORT 2010
GWP generated in channels......
Bancassurance channel grew from strength to strength…….
The Company capitalised on the business potential from its main strength, Hatton National Bank PLC (HNB), during the year and recorded a GWP growth rate of 78% through the bancassurance channel, which continues to be the fastest growing business channel in the Company for Life Insurance business. The business generated through this channel recorded a GWP of Rs. 158 million (2009 – Rs. 89 million), which resulted in an increase in the contribution to the total Life GWP from 9% to 15%.
The phenomenal growth in the bancassurance channel is mainly due to the success of the initiative which began in 2008 to station Company employees in selected HNB branches to sell Life Insurance policies. This year the project was expanded to 98 HNB branches from 74 HNB branches in 2009 and this project recorded a GWP growth rate of 135%. The project is spearheaded and closely monitored by the management of both the Company and HNB and is expected to continue strongly in the year 2011, expanding to cover 24 more HNB branches.
The other factor that has helped expand the bancassurance channel is the reduction in housing loan interest rates in the market. This has given an opportunity for selling more Mortgage Reducing Policies (MRP), and during the year the GWP generated through MRPs was Rs. 76 million (2009 – Rs. 49 million) recording a growth of 55%. The housing industry has not performed to its full potential during the year due to various reasons, but it is believed the industry will develop in the coming years and provide more opportunities for MRP business in the year 2011 and beyond. In view of this opportunity, we are in the process of enhancing our MRP product to be more competitive in the market, thereby to grab the opportunities the market provides.
Advisor channel continued to be the highest contributor for Life GWP……….
The main contributor to the Life GWP continued to be the advisor channel. However, due to the rapid growth in the bancassurance channel as discussed above, the contribution percentage of the advisor channel to the total Life GWP came down from 83% in 2009 to 74% in 2010. Nevertheless, GWP generated through the endowment products (traditional Life Insurance products), which is the main product category sold through this channel, showed a commendable growth of 21%. Particularly, First Premium (New Business Premium) generated on endowment products recorded a growth rate of 49% showing the potential of this channel.
Considering the importance of selling endowment policies, the Company maintained the focus of the advisor channel on selling these policies, and did not aim to sell any investment products through this channel. Therefore, even though there is a growth in GWP from endowment policies, the total GWP generated through this channel was Rs. 805 million (2009 – Rs. 813 million) recording a negative growth of 1%.
Contribution from Direct and Broker channels……….
During the year, the investment policy was sold entirely through the direct channel, hence the GWP recorded through the direct channel grew at a rate of 38%, increasing its contribution to the total Life GWP to 11% from 8% in the previous year.
The contribution to the Life Insurance industry through the broker channel has been minimal. In the year 2010, GWP generated through the broker channel grew at a rate of 161% but this did not have a huge impact on the total Life GWP since the contribution from this channel is less than 1%. However, the Company is taking actions in developing Life business through the broker channel, particularly for the sale of MRPs and Group Life Policies.
Bancassurance launch at HNB Vavuniya

42
Life Insurance Products
Innovative products launched in previous years worked out for us this year……
The two innovative products ‘Ran Aswanu’ and ‘mylife’ launched in recent years contributed signifi cantly to increase the fi rst premium GWP during this year.
The product ‘Ran Aswanu’ performed well generating a GWP of Rs. 25 million during the year. Product ‘Ran Aswanu’, best termed as a ‘policy that never lapses’, offers benefi ts to the seasonal income earners such as farmers, fi shermen and cultivators. This policy covers the risk of natural and accidental death till maturity. The policy holders can pay the premium any time during the year and it also comes with additional benefi ts for those in the rural sector. It is considered as a secure life protection that is designed to pay a death benefi t to the insured’s benefi ciary regardless of policy status. As long as the fi rst premium payment is made, the policy will never lapse or cancel. Due to these features the product was very much in demand from outside the urban areas of the country.
Considering the appealing features and the potential demand for the product, it was re-launched in Tamil as ‘Thanga Aruwadai’ targeting the tamil speaking people, especially in the North and East.
The product ‘mylife’, which was introduced last year exclusively targeting the youth as the fi rst of its kind introduced in Sri Lanka, was able to generate a premium income of Rs. 21 million. The unique feature of the product is the ability to withdraw 15% of the sum assured subject to conditions, at the event of the insured’s marriage, birth of a child, child’s school admission or purchase of a vehicle. This product has been strongly supported through media advertising and promotions resulting in the brand winning the ‘Best New Entrant’ Bronze award, at the SLIM Brand Excellence Awards 2010.
Some of the other products in our life portfolio……..
Ranmaga is the best selling product in our portfolio. The contribution from this product during the year was Rs. 587 million. Ranmaga is a unique Life Policy that is both an insurance and an investment. As a Life Policy the sum assured increases by 5% every year, but the premium payments remain the same. The added fi nancial benefi ts make it a solid investment plan.
‘Dedunu’ is tagged as the best way to secure a child’s future. This product has a variety of optional benefi ts for both the parent and child and also provides a life cover for the parent up to eight years after premium payments cease. The product was able to generate a GWP of Rs. 96 million during the year.
Management Discussion & Analysis
Media Conference held in Jaffna at the launch of ‘Thanga Aruwadai’

43HNB ASSURANCE PLC ANNUAL REPORT 2010
A comprehensive insurance plan for the entire family, Ran Kirana covers parents for critical illness, hospitalization, disability, natural or accidental death and funeral expenses, with coverage for up to four children. However, this product did not generate a signifi cant volume of business in the year under review.
‘Pradeepa’ is not just a life policy, but also an investment plan. Its cover includes hospitalisation, critical illness, disability and accidents. It is an ideal instrument for fi nancial planning with a high insurance cover for a low premium. ‘Pradeepa’ recorded a GWP of Rs. 63 million in 2010.
Araksha - Mortgage Reducing Policy (MRP)
MRP is for people who wish to buy a house, renovate a house or buy a land on a loan from a bank or a fi nancial institution. In the event of the unfortunate death or total permanent disability of the insured, the balance loan due will be settled by this policy. The sum assured reduces gradually during the policy term in line with the outstanding loan balance. The product performed very well during the year to record a GWP of Rs. 76 million, 55% more than the previous year.
Profi tability in Life Insurance The Company continued to generate and allocate profi ts in Life Insurance business for both its policyholders and shareholders in the year 2010. The profi ts were allocated after maintaining adequate reserves for future liabilities and contingencies. Accordingly, we offered Rs. 54 million as bonus to policyholders. The bonus rates varied according to the year of purchase of each policy with a maximum of Rs. 50/- per Rs. 1,000 sum assured for policies purchased during 2002 and 2003. This is a growth of 38% over the previous year’s bonus allocated to policyholders which stood at Rs. 39 million.
The surplus released to shareholders also grew by 20%, from Rs. 130 million last year to Rs. 156 million in the year 2010. The prudent underwriting procedures adopted by our underwriters helped the Company earn a profi t commission of Rs. 21 million from the reinsurer as a part of profi ts made by the reinsurer from the business ceded to them by the Company.
Life Fund grew stronger this yearThe Company valued its Life Fund in December 2010 and transferred Rs. 156 million as profi ts to shareholders. Following the transfer, the Life Fund showed an increase of 29% and stood at Rs. 2,385 million. This is the fi rst time the Company’s Life Fund reached a fi gure in excess of Rs. 2 billion, which is a another milestone for the Company’s Life Insurance business.
Key challenges faced by the Life Insurance businessPolicy lapsation is one of the major challenges faced by any life insurance company. However, with greater focus on improving the situation, the lapse ratio (fi rst year lapse ratio) which stood at 59.5% in 2009 was brought down to 50.69% at the end of 2010. In addition, the premium persistency rate which measures how much of the due premium is collected also improved from 69.9% at end 2009 to 81.4% at end 2010.

44
With the low interest rates, the Life Insurance business is faced with its biggest challenge in maintaining the growth momentum in the investment income generated. However, during the year Life Insurance business was able to record a yield of 16.44%, which is a highly commendable achievement considering the decreasing interest rate environment. Due to the low interest rates, we have shifted towards other sources of investment such as equities, without taking any undue risk. The proportion of equity investment in our Life Insurance portfolio is only 7% (at market value) and we intend to keep it within 10% into the foreseeable future.
The high turnover of advisors is also a challenge the Company faced which is again an issue that is common to the entire industry. We believe this trend will continue in the coming years mainly due to job opportunities arising out of the growth in tourism, agriculture and other industries.
One other key challenge the Life Insurance business faced is the limited understanding of the public about the procedures and practices of Life Insurance business, such as importance of completing the proposal form, obtaining a receipt for premium payments, etc. The Company has taken several initiatives to educate its customers through the fi eld force and branch management on the importance of these. We appreciate the initiatives taken by the Insurance Board of Sri Lanka (IBSL) in educating the general public through press advertisements and other mechanisms. We have also committed our fullest support to the public awareness campaign being launched in early 2011 by the Insurance Association of Sri Lanka (IASL).
Process Improvements during the YearDuring the year, the Company was able to move all its endowment policies to its new system TCS Bancs. This enabled the Company to give a better service to its customers and also helped the management in providing necessary management information faster.
In addition, the quality of the communication documents sent to customers such as premium notices, lapse notices etc. were also improved and now these documents are sent in all three languages (English, Sinhala and Tamil). Further, policy documents of the main products are translated to Tamil, enabling the Tamil speaking customers to have a better understanding of the insurance policies they buy. During the year, steps were taken to move towards a paperless environment by introducing the e-document concept.
The Company also started communicating with its customers through SMSs during the year which is identifi ed to be a very effective mode of communication today. This enabled customers to get frequent updates on their policies through a medium which provides a better assurance of being noticed.
The Company has provided a number of ways of paying the insurance premium for the customers. This includes payments through the our own distribution network of 51 branches, direct bank deposits from all HNB branches island wide, standing orders through HNB, standing orders on HNB Credit cards, online payment through our website, etc. The Company is in the process of introducing a few more new methods of collecting insurance premiums, which will come into operation in the year 2011.
Life Fund
The Insurance Industry Act, No. 43 of 2000 requires every Life Insurance Company maintain a separate fund to be called the “Long Term Insurance Fund” and credit all money received in respect of the long term Insurance business (Life Insurance) to that Fund. This is also referred as the “Insurance Provision - Life”.
The size of the fund that needs to be maintained is determined by an actuarial valuation.
The Life Actuary also determines the excess assets over the policyholders’ liabilities of the Fund which is the Life Surplus. This is determined after considering bonuses to policyholders and other regulatory provisions.
The amount that is determined to be transferred to the shareholders from the said Life surplus is recorded as “Profi t for the year ” in the Life Insurance segment in the fi nancial statements.
Management Discussion & Analysis

45HNB ASSURANCE PLC ANNUAL REPORT 2010
Review of the Investment Portfolios
Investment objective, strategy and frameworkAt HNB Assurance, the investment strategy strives to maximise the investment returns while managing the risks within an acceptable risk-return profi le, considering the risk appetite of an insurance company and the regulatory framework. In doing so, we at HNB Assurance, aim to match the maturity mix of the investment portfolios with liabilities to the maximum extent possible. Accordingly, the Company’s Investment Policy, including the Asset and Liability Management (ALM) and Liquidity Management Policies, is geared towards achieving the above objectives.
The investment portfolios of the Company, which consist of Life Fund, General Fund and the Life Shareholders Fund (under General Insurance), are managed in house by the Company’s Investment Department. No external fund managers are used.
Investment PerformanceThe excellent performance of the investment portfolios in 2010 greatly helped the Company’s overall profi tability. Even in a diffi cult market environment with interest rates continuously declining over the course of the year and especially with the bulk of the Company’s assets consisting of fi xed income securities, the investment income grew by 11% to Rs. 517 million from Rs. 468 million in the previous year.
The investment income from the Life Fund grew by 9% to reach Rs. 339 million. Investment income from the General Fund was Rs. 178 million which was a 14% year-on-year growth on Rs.156 million recorded in the year 2009. Accordingly, the average yield on the Life Fund and the General Fund stood at 16.62% and 16.94% respectively. The fact that the Company was able to achieve very healthy yields during 2010 for both Life and General Funds amidst average yields of both short and long term fi xed income securities declining further due to prevailing market conditions (1 year treasury bill rate declined to as low as 7.10% during the year) is commendable especially considering the fact that above results were achieved without taking undue or excessive risks.
As in the past, this commendable performance resulted from cautious but active and dynamic investment management strategies adopted by the Company within an acceptable risk return profi le through a combination of prudent asset allocation backed by effective investment analysis, timely reaction to market changes, comprehensive liquidity and treasury management and win-win rate negotiations with fi nancial intermediaries.
With interest rates likely to remain at current low levels for the foreseeable future and with the equity market unlikely to perform exceptionally well compared to the last two years, it will be a huge challenge for the Company and the industry to improve or at least to maintain the investment performance at this level. Thus, we are looking for attractive investment opportunities with an acceptable level of risk. In particular, we expect that the Corporate Debt market will improve during the year and that the proposed amendments to the Determination on Investments and the Solvency Margin rules will permit insurance companies to act more aggressively to exploit such opportunities. We also welcome the recent changes in foreign exchange regulations which allow Sri Lankan Insurance Companies to invest out of the country. The Company’s Investment Management team will closely evaluate available options to invest overseas and take advantage of any opportunity to enhance returns subject to an acceptable level of risk.
Funds under managementThe total funds under management passed the Rs. 3 billion mark during the year and as at year end it stood at Rs. 3.4 billion recording a commendable growth of 24%. Funds under the Life Insurance business grew signifi cantly by 31% over the previous

46
year to Rs. 2,243 million by the year end, recording a Rs. 534 million increase over the, previous year. The General and Life Shareholder Funds also recorded a growth of 11% for the year ended 31st December 2010. The sum of both funds, which stood at Rs. 1,059 million at the beginning of the year, increased to Rs. 1,178 million by the end of the year 2010.
Investment portfoliosThe Company takes every step to maintain a well diversifi ed investment portfolio so that the portfolio returns can be optimised while minimising the risks. Further, asset allocation decisions are taken after carefully analysing the market environment including global and Sri Lankan economic realities with focus on infl ation, interest rates, exchange rates, etc.
During the year 2010, the continuous decline of interest rates was a huge challenge to the Company. Therefore, in order to counter the lower income generation from fi xed income securities and to grasp the opportunities in the Colombo Stock Exchange (CSE), which continued to show robust growth in a post-war scenario, we increased our total exposure to Equity in our General Fund to 5.4% (at market value) from 2.1% in 2009. Equity Exposure of the Life Fund which stood at 1.6% in 2009 was increased up to 7.1% by the end of 2010. Accordingly, the total exposure to the equity market was increased by Rs. 177.5 million by the end of the year despite signifi cant capital gain realisations from both Life and General equity portfolios.
Further, considering the low interest rate environment, we trimmed down our General Fund’s asset allocation to Government Securities to 60.4% from 67.4% in 2009 while the Life Fund’s allocation, which stood at 77% in 2009, was reduced to 70.6% by the year end. During the year, both Funds subscribed for a 5 Year Debenture, issued by the Urban Development Authority of Sri Lanka and guaranteed by the Treasury, by investing Rs. 86.7 million from the Life Fund and Rs. 25.7 million from the General Fund. This Investment amplifi ed the exposure on Debentures to 13.1% (2009 - 8.1%) and 8.9% (2009 – 5.9%) in General and Life Funds respectively.
Investment Risk ManagementManaging investment risks effi ciently and effectively is an integral part of the Company’s investment management process, whereby investment risks inherent in the investment portfolios are clearly identifi ed, measured, monitored and controlled.
Company’s Investment portfolios are regularly audited by the External and Internal Auditors of the Company. Further, regular reports on assets under management are forwarded to the Investment Committee and the Insurance Board of Sri Lanka.
In addition, Fitch Ratings Lanka Limited, which is the rating agency for HNB Assurance, reviews the investment portfolios in order to asses the risks arising from the investment portfolios of the Company to the overall stability of the Company. HNB Assurance is rated as A (lka) in both Insurer Financial Strength Rating and the National Long Term Rating by Fitch Rating Lanka Limited which is also a refl ection of the quality of the Investment portfolios and the Investment management process.
Further, all the Corporate Debt Investments of the Company have been made in above investment grade rated instruments and the fact that the Company has not experienced any defaults with regard to its assets under management in its entire history shows the strength of the risk management process.
The Company’s investments in Government Securities are made solely through recognised primary dealers and we have signed up Master Repo Agreements with all such institutions with whom we deal, to ensure that adequate security is guaranteed during the investment placement and the disposal process. Further, as a risk management measure, Investment Front Offi ce and Back Offi ce functions are segregated and the two departments function independently with the Back offi ce reporting to the Head of Finance.
Management Discussion & Analysis
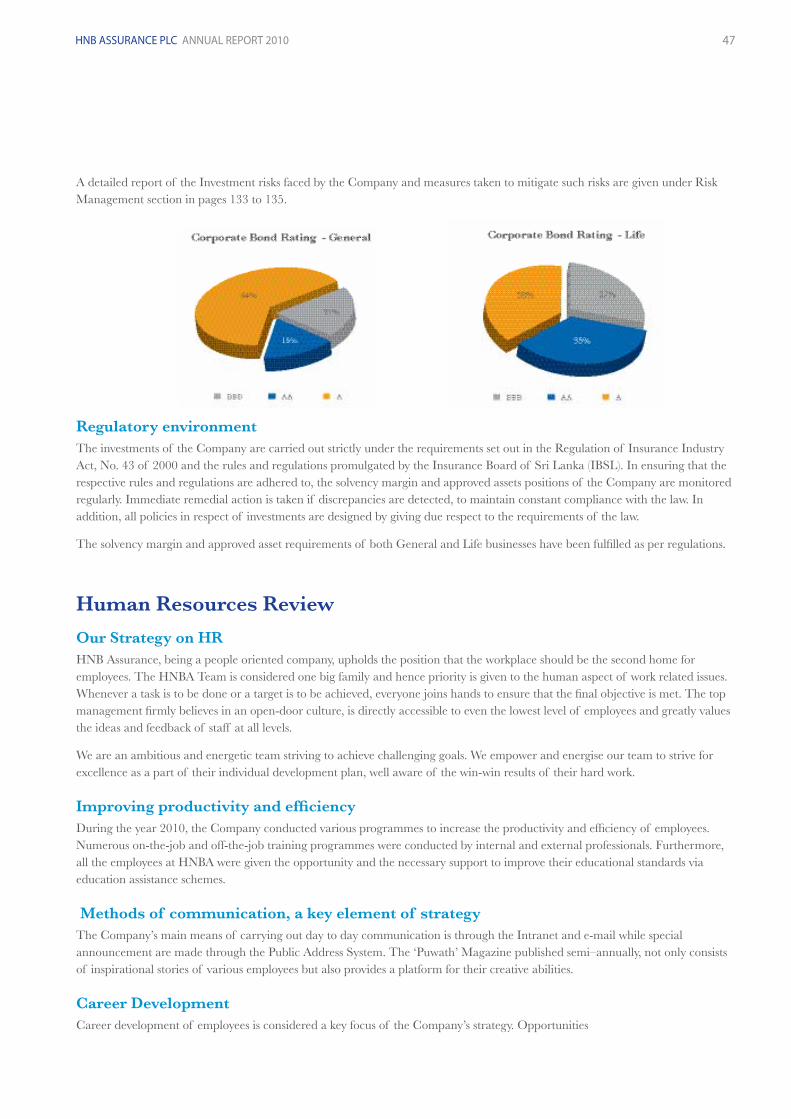
47HNB ASSURANCE PLC ANNUAL REPORT 2010
A detailed report of the Investment risks faced by the Company and measures taken to mitigate such risks are given under Risk Management section in pages 133 to 135.
Regulatory environment The investments of the Company are carried out strictly under the requirements set out in the Regulation of Insurance Industry Act, No. 43 of 2000 and the rules and regulations promulgated by the Insurance Board of Sri Lanka (IBSL). In ensuring that the respective rules and regulations are adhered to, the solvency margin and approved assets positions of the Company are monitored regularly. Immediate remedial action is taken if discrepancies are detected, to maintain constant compliance with the law. In addition, all policies in respect of investments are designed by giving due respect to the requirements of the law.
The solvency margin and approved asset requirements of both General and Life businesses have been fulfi lled as per regulations.
Human Resources Review
Our Strategy on HRHNB Assurance, being a people oriented company, upholds the position that the workplace should be the second home for employees. The HNBA Team is considered one big family and hence priority is given to the human aspect of work related issues. Whenever a task is to be done or a target is to be achieved, everyone joins hands to ensure that the fi nal objective is met. The top management fi rmly believes in an open-door culture, is directly accessible to even the lowest level of employees and greatly values the ideas and feedback of staff at all levels.
We are an ambitious and energetic team striving to achieve challenging goals. We empower and energise our team to strive for excellence as a part of their individual development plan, well aware of the win-win results of their hard work.
Improving productivity and effi ciencyDuring the year 2010, the Company conducted various programmes to increase the productivity and effi ciency of employees. Numerous on-the-job and off-the-job training programmes were conducted by internal and external professionals. Furthermore, all the employees at HNBA were given the opportunity and the necessary support to improve their educational standards via education assistance schemes.
Methods of communication, a key element of strategyThe Company’s main means of carrying out day to day communication is through the Intranet and e-mail while special announcement are made through the Public Address System. The ‘Puwath’ Magazine published semi–annually, not only consists of inspirational stories of various employees but also provides a platform for their creative abilities.
Career DevelopmentCareer development of employees is considered a key focus of the Company’s strategy. Opportunities

48
are frequently created for employees to showcase their talents and capabilities, and also to use these for the development of themselves and the Company. Priority is always given to internal employees whenever a vacancy arises in the organisation.
Giving opportunities to people to demonstrate their capabilities and good qualities is an important element in strategies pertaining to career development. Guidance and support is always provided to employees, while closely monitoring their performance.
Performance management and feedbackThe performance management system plays a vital role in determining the career development of employees. Each employee attached to the permanent cadre is given a clear set of performance and personal development objectives at the beginning of a year, and the same is reviewed bi-annually at the appraisals, with a view to giving productive feedback for their development. All increments, bonuses and other benefi ts are given strictly on performance which is assessed through a clear and transparent procedure.
Succession Planning The Company has a rigorous succession planning process to ensure the smooth functioning of the Company’s operations. This ensures the effectiveness and continuity of functions, especially at the top management level of the organisational structure. The succession plan is regularly reviewed by the Managing Director in collaboration with the HR Manager, in order to ensure the accuracy and timeliness of same. In addition, the succession plan is also periodically reviewed by the Remuneration Committee of the Board. The identifi ed successors are paid special attention in arranging customised training and development opportunities.
Company cultureThe Company’s culture has been designed in line with the HR strategy of the Company. HNB Assurance upholds an Open Door Culture where employees are free to express their ideas. This culture has enabled employees to access the top-level management very easily, facilitating quick action in the case of crisis situations. The Company regularly makes a conscious effort to maintain the friendly and familiar culture of the organisation through staff activities, welfare events and fellowship.
Professionalism plays a vital role in carrying out the day-to-day activities in the Company. While HNB Assurance maintains a comfortable work environment for its employees, the Company is also mindful that the same should be balanced with professionalism through the dress code, punctuality, adherence to policies and procedures, and most importantly, in the manner in which we deal with stakeholders. The Company is vigilant about the effectiveness of its HR strategies and improves them at every opportunity in order to maintain the desired Company culture.
HR improvements during the year
During 2010, the Company undertook a major project to implement a new ‘Human Resource Information System’ (HRIS), acquired from hSenid to automate the HR processes such as attendance, overtime, leave and reports on personal details, educational qualifi cations, special achievements, career development, etc.
Our Strengths in HRM We believe that our biggest strength is our dedicated and motivated, young and vibrant team of employees. We consider that it is our utmost duty to take good care of them and to provide a comfortable working environment so that they will do their best for the betterment of the Company which in turn adds value to their own personal development as well. (Please refer page 69 in the Sustainability Report for the indicators of our staff strength)
Hiran FernandopulleZonal Manager – North Western
“Being a graduate I was looking for a place where I can apply what I learned. At HNB Assurance I was allowed to practice the theories I learned in an environment which supports me to grow as a leader. This has helped me to progress from the post of Assistant Manager to the Zonal Manager and to lead the way to win the award for the best Zonal offi ce in the Company. Today I am really proud to say that HNB Assurance is the place that I was looking for.”
Management Discussion & Analysis

49HNB ASSURANCE PLC ANNUAL REPORT 2010
Challenges in HRMSince the industry is becoming more and more competitive, retaining experienced and talented employees in the organisation is one of the biggest challenges faced by the Company. But the Company hopes to overcome this challenge successfully with the implementation of various HR strategies and motivational tools.
Future plans of HRMWith the adoption of the new Human Resources Information System, we plan to concentrate more on implementing new HR strategies in order to motivate and develop people and to ensure the betterment of employees which in turn will contribute to the productivity and effectiveness of the organisation.
Distribution Network
Our Strategy in DistributionOur strategy in distribution is to focus on multiple channels, while giving equal attention to all parts of the country. We take measures to constantly communicate with our distribution partners to identify areas for improvement and encourage existing strengths, Thus we welcome ideas, suggestions and constructive criticism.
Structure of the Distribution NetworkWe strongly believe that visibility and penetration is essential to ensure that customers in all parts of the island are given the opportunity to enjoy the unique insurance solutions provided by the Company. Hence we now possess over 50 branches that are capable of serving the needs of our customers spread island-wide.
We have clustered them into six Zones/Regions in order to provide an effi cient service by delegation of authority. The Company has three Zonal Offi ces and three Regional Offi ces to overlook the branches they have been allocated.
Our Distribution Outside Western ProvinceWe fi rmly believe in the importance of customers in regional towns and rural areas; hence we have marked our presence outside Western Province with 36 branches catering to the insurance needs of even the remotest areas.
The GWP contribution from the areas outside the Western Province was 51.2%, which we believe is a strong position when compared with other players in the industry. We consider this to be one of our biggest strengths in facing future challenges.
Our Distribution Expansion in North & EastThe contribution from the Northern and Eastern Provinces to the Company’s total GWP is 10%. At the beginning of the year the Company had branches in Jaffna, Vavuniya, Mannar, Kalmunai, Batticaloa, Ampara, and Trincomalee to serve our customers in the North and East. Considering the fast-growing potential in this area, two new branches were opened during the year in Nelliady and Manipay, expanding our presence in the North. In addition, six new Bancassurance units were also located in these areas during the year.
Main Distribution ChannelsWe are proud of the robust distribution arm we possess today. The HNB Assurance fi eld force, comprising 1,401 advisors directly involved in serving our valued customers, is the live wire of the Company.
With the support of our parent company, we have marked our presence at 98 branches of Hatton National Bank spread across the island through our the Bancassurance project. Thus, we have rendered the services of 98 Bancassurance Offi cers, which is now becoming another powerful distribution channel of HNB Assurance. Apart from these, tremendous support is received from the Broker Channel, with which we have maintained a steady relationship throughout the years.

50
Distribution Network
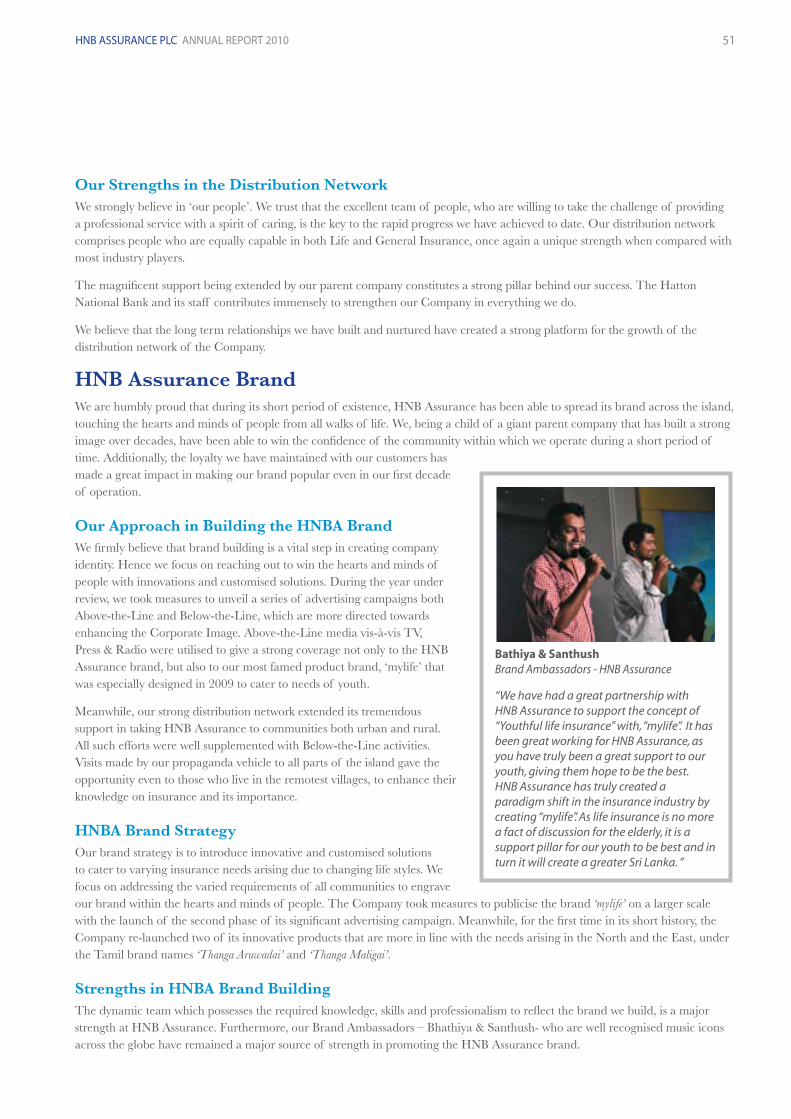
51HNB ASSURANCE PLC ANNUAL REPORT 2010
Our Strengths in the Distribution NetworkWe strongly believe in ‘our people’. We trust that the excellent team of people, who are willing to take the challenge of providing a professional service with a spirit of caring, is the key to the rapid progress we have achieved to date. Our distribution network comprises people who are equally capable in both Life and General Insurance, once again a unique strength when compared with most industry players.
The magnifi cent support being extended by our parent company constitutes a strong pillar behind our success. The Hatton National Bank and its staff contributes immensely to strengthen our Company in everything we do.
We believe that the long term relationships we have built and nurtured have created a strong platform for the growth of the distribution network of the Company.
HNB Assurance BrandWe are humbly proud that during its short period of existence, HNB Assurance has been able to spread its brand across the island, touching the hearts and minds of people from all walks of life. We, being a child of a giant parent company that has built a strong image over decades, have been able to win the confi dence of the community within which we operate during a short period of time. Additionally, the loyalty we have maintained with our customers has made a great impact in making our brand popular even in our fi rst decade of operation.
Our Approach in Building the HNBA BrandWe fi rmly believe that brand building is a vital step in creating company identity. Hence we focus on reaching out to win the hearts and minds of people with innovations and customised solutions. During the year under review, we took measures to unveil a series of advertising campaigns both Above-the-Line and Below-the-Line, which are more directed towards enhancing the Corporate Image. Above-the-Line media vis-à-vis TV, Press & Radio were utilised to give a strong coverage not only to the HNB Assurance brand, but also to our most famed product brand, ‘mylife’ that was especially designed in 2009 to cater to needs of youth.
Meanwhile, our strong distribution network extended its tremendous support in taking HNB Assurance to communities both urban and rural. All such efforts were well supplemented with Below-the-Line activities. Visits made by our propaganda vehicle to all parts of the island gave the opportunity even to those who live in the remotest villages, to enhance their knowledge on insurance and its importance.
HNBA Brand Strategy Our brand strategy is to introduce innovative and customised solutions to cater to varying insurance needs arising due to changing life styles. We focus on addressing the varied requirements of all communities to engrave our brand within the hearts and minds of people. The Company took measures to publicise the brand ‘mylife’ on a larger scale with the launch of the second phase of its signifi cant advertising campaign. Meanwhile, for the fi rst time in its short history, the Company re-launched two of its innovative products that are more in line with the needs arising in the North and the East, under the Tamil brand names ‘Thanga Aruwadai’ and ‘Thanga Maligai’.
Strengths in HNBA Brand Building The dynamic team which possesses the required knowledge, skills and professionalism to refl ect the brand we build, is a major strength at HNB Assurance. Furthermore, our Brand Ambassadors – Bhathiya & Santhush- who are well recognised music icons across the globe have remained a major source of strength in promoting the HNB Assurance brand.
Bathiya & SanthushBrand Ambassadors - HNB Assurance
“We have had a great partnership with HNB Assurance to support the concept of “Youthful life insurance” with, “mylife”. It has been great working for HNB Assurance, as you have truly been a great support to our youth, giving them hope to be the best. HNB Assurance has truly created a paradigm shift in the insurance industry by creating “mylife”. As life insurance is no more a fact of discussion for the elderly, it is a support pillar for our youth to be best and in turn it will create a greater Sri Lanka. ”

52
Amila Nadeeshani of ‘Sirasa Super Star’ fame who joined us in 2008 as a Public Relations Representative has served the Company in many ways taking our message to the public throughout the last few years.
In our comparatively short period of existence, we have also built sustained relationships with our media partners, thus bringing another major advantage to the Company. The excellent media coverage received for all Company events bears ample testimony to this.
Challenges in HNBA Brand Building and Our ResponsesStanding amidst a massive chorus of competitors who have been playing a major role in the Insurance Market for decades is one of the major challenges we face as a comparative new comer. But we have managed this scenario well, with strategic decisions which aim at maximising the strengths we are equipped with. With the advantage of having one of the largest private fi nancial institutions in the country as the parent company, we have been able to gain the confi dence and acceptance from the general public since our establishment.
The challenge of the negative perception borne by Sri Lankans on Insurance is common to HNB Assurance too, as it is for the whole industry. The industry was also faced with the direct and indirect impacts of the global fi nancial crisis which eroded the level of confi dence in the fi nancial sector. Nevertheless, we managed to overcome these obstacles to arrive at a profi table growth with the support of our brand building strategies and effective communications.
AchievementsHNB Assurance ‘mylife’ was the proud winner of the Bronze Award in the Best New Entrant category at the SLIM Brand Excellence Awards 2010.
HNB Assurance brand has improved its brand visibility and has been rated as A+, while continuing to be ranked within the ‘Top 100 Brands’ as compiled by Lanka Monthly Digest (LMD) magazine in association with Brand Finance.
IT Review
Our Strategy in ITThe primary focus of our IT strategy is to facilitate the successful delivery of the Company’s business strategy. Thus, our IT strategy is geared to ensure that the Company achieves its corporate objectives and is totally in line with the corporate plan.
This alignment helps to create a proper and successful IT road map within the Company. As IT is a discipline where rapid change is the only constant, our well-defi ned and well thought out corporate plan truly helps in being selective in terms of relevant technologies from a plethora of choices that are churned out every day.
Focus in 2010In 2009, we selected a world leading insurance application known as TCS Bancs from a globally renowned leading software company, Tata Consultancy Services (TCS) of India, with whom we have been working since 2003. Our main focus in the year 2010 was to implement this core insurance application in the Company.
Amila Nadeeshani at a Field Promotion
SLIM Brand Excellence Awards 2010
Management Discussion & Analysis
53HNB ASSURANCE PLC ANNUAL REPORT 2010
Centralising and streamlining infrastructure such as network, security and data centers were also given high priority and carried out extensively during the year.
As it stands today, the core application implementation is completed for Life Insurance and the work on General Insurance along with supporting modules such as fi nance and customer care solutions is in progress. By the end of 2010, 90% of the business processes of the Company were on a totally integrated single solution environment, which in turn impacted our business processes very positively.
During the year, we also acquired a fully fl edged HRIS system from hSenid, a leading local vendor of software which could support the HR activities of the Company. We intend to implement the system in early 2011.
Our Strengths in IT Our strengths in IT stems from the knowledge and experience of our people as well as from the solutions we have chosen. The Company’s IT solutions range from Proprietary Applications to Open Source Solutions and our staff is enabled to be very much hands-on in both these worlds of technology.
The Company has always selected and continues to select the most cost-effective and suitable solutions based on its requirements. The Company has already signed up with Microsoft on an Enterprise Agreement (EA) to streamline our infrastructure environment. At the same time, Oracle is working with the Company very closely to support our data center to manage data in a secure and effi cient manner.
Open Source too gets top priority at HNB Assurance, given its natural cost-benefi ts while being as good as any proprietary solution, if not better in some spheres of activity. Open Source based solutions have been widely deployed in many areas such as Networking, Security and System Platforms. Due the features of Open Source, the Company has been able to implement many a complicated solution with unmatchable effi ciency and cost-effectiveness.
Delighting Customers through IT enhancementsHNBA has clearly identifi ed the customer’s need of the hour. When a client is faced with an issue, our response time to him/her is of paramount importance, along with crystal clear communications on the state of progress.
To ensure that we not merely satisfy these but stand to delight our customers, we have setup a well-equipped customer support center with IP driven solutions where customers are served with a personal touch with information with a high degree of accuracy.
Further, we have improved connectivity with our clients by leaps and bounds via technologies such as SMS. Information on their policy status as well as reminders on renewals is communicated through text messages.
Our motor claim process has been signifi cantly improved by introducing mobile technologies to gain accident inspection information online. Now, we are in a position to obtain information of an accident including images online and to process the claim immediately. Claim settlement has also signifi cantly improved and customers are able to receive faster settlement with these initiatives.
Apart from these, our online portal enables customers to obtain information as well as to pay premiums. At the same time, we have integrated our systems with the systems employed by the Registrar of Motor vehicles (RMV) to obtain our customers’ revenue licenses online.
Plans for 2011In 2011 our main focus will be on completing the implementation of the core application while closely monitoring in-house processes thereby improving the end-user effi ciency at least by another 40%.
Use of BI (Business Intelligence) and mobile applications is also planned to support decision making while improving customer service quality.
With regard to systems, it is expected to introduce open source enterprise level solutions to adjust with changes in a cost-effective manner without compromising functionality or quality.
Application and Hardware consolidation is another key strategy planned and we expect to introduce a common development framework in the years to come.

54
Future Outlook As the Company reaches the tenth year of its operation, and moves towards the second decade, it remains very optimistic of the macro economic environment. But there will be new challenges coming out of the regulatory changes, environmental effects and increasing competition. However, we at HNB Assurance are positive and confi dent about our strengths and the platform that has been built over the last nine years to be ready to exploit any opportunities the market provides to extend our track record of consistent delivery of outstanding results.
The insurance industry will face many challenges in the coming years but we are confi dent that the Company has the people, networks, and strong support from our parent company to be a leading insurer by increasing our market share and establishing an even stronger presence in the market.
Future outlook on Life Insurance businessIn the post war era, the country is geared for rapid growth in all aspects and according to the Government forecasts, per capita GDP will be doubled to USD 4,000/- in just fi ve years. This will defi nitely generate more business opportunities in Life Insurance and particularly as a country with a very low insurance penetration (at 10% currently), the increase in per capita income will induce more business growth and thereby the insurance penetration.
The reduction in interest rates and the expected boom in housing and other loans will also create more opportunities for insurance products such as MRPs in coming years. It is also believed that with the development in rural areas of the country, the potential of the Micro-insurance products will also rise. The Company is ready to cater to this sector, with the support of the parent company HNB and partnerships with other signifi cant players in this sector such as SEEDS.
Life Insurance penetration of the country still remains around 10% and the competition being limited to urban areas shows that potential for Life Insurance business remains in rural areas of the country. We believe our products such as ‘Ran Aswanu’ and ‘Thanga Aruwadai’ can perform better in these areas.
The expected increase in the aging population by 2020 and the Government’s efforts of fi nding solutions for this from now onwards will give opportunities for retirement related insurance products to be introduced to the market in the years to come.
The Company has noted during the recent past that the expectations of policyholders are increasing. Therefore the Company is faced with the challenge of introducing various novel products and new features for existing products to suit the ever increasing demands of the customers.
We believe the year 2011 will provide a much friendlier environment to the Life Insurance business and the Company is waiting to grab any opportunity the market provides to add more value to both our policyholders and shareholders.
Future outlook on General Insurance businessThe General Insurance industry which experienced a negative growth in 2009 showed signs of improvement in 2010 by registering a positive growth. As infrastructure development moves ahead, creating new townships with small and medium sized business enterprises mushrooming throughout the country, we believe this would generate many new opportunities for insurance business.
The change in weather patterns is a cause of concern for General Insurance business. Losses emanating from these hazards coupled with declining rates due to intense competition are affecting the profi tability of the companies. The current data on fl ood and land slide affected areas too need to be updated and foresee a hardening of terms for natural perils in order to maintain balances in portfolios.
At present most General Insurance companies record underwriting losses, but this adverse impact is minimised through attractive investment returns earned in the recent years. But with fi xed interest rates remaining at single digit levels, the potential to earn high investment income would be minimal in future. Therefore, General Insurance business would have to focus on better underwriting and claims management processes to minimise underwriting losses and continue its profi t momentum.
Regulatory outlookThe recent amendments to the RII Act will have a signifi cant impact on market conditions in the next couple of years. We believe these regulatory changes and the adverse weather patterns experienced would compel the market to ‘return to basics’ to achieve profi tability with greater emphasis being laid on technically sound practices.
Management Discussion & Analysis

Sustainability Report

56
Managing Director’s Statement
Dear Stakeholder,
I take great pleasure in placing before you the Sustainability Report for the fi nancial year ended 31st December 2010.
As in previous years, the Company focused on all four critical components of sustainability i.e. the Social, Economic, Environmental and Cultural aspects during the year under review.
On the social front, we demonstrated our concern for various sections of society who need support ranging from children attending remote schools which lack access to basic facilities such as water to differently-abled children attending the Nuffi eld School for the Deaf and Blind in Kaithadi, Jaffna who were badly in need of beds and mattresses. With regard to economic aspects, we have captured these well within our business philosophy extending the reach of our insurance products to all segments of the population. In particular, our low–priced micro insurance products have been made available to micro entrepreneurs through HNB’s ‘Gami Pubuduwa’ loan scheme as well as the micro–fi nancing schemes offered to members of SEEDS (Sarvodaya Economic Enterprise Development Services Ltd). It is heartening to note that the number of micro insurance policies sold has grown by 55 % during the year.
The Company also placed great emphasis on the environmental aspect considering its growing importance amidst clear evidence that this country’s weather patterns are also signifi cantly affected by the effects of global warming. Our efforts in this regard were of two types, i.e. activities carried out to conserve valuable resources in our day to day operations and activities performed to improve awareness on the need for protecting the environment beyond the confi nes of our offi ces.
Finally, the Company showed its affection and concern for cultural aspects by supporting a number of activities to promote diverse forms of arts. We strongly believe in the freedom of expression and feel that different sections of the public must have opportunities to enjoy vastly different types of cultural activities. Hence, our support was extended to a range of activities as diverse as the recognition of outstanding artistes of yesteryear and the launch of an album of popular contemporary music.
For us at HNB Assurance, sustainability has now become a way of life. Every member of our staff aspires to create value to all our stakeholders in a sustainable manner. The Sustainability Report that follows will give you in-depth accounts of the manner in which we have succeeded in fulfi lling this mission.
It gives me great pleasure to inform you that we were placed Runner–up in the small scale category at the ACCA Sri Lanka Sustainability Reporting Awards 2010. This is the second successive year in which we have been recognised by these awards.
We inspire ourselves by what we do and commit ourselves to do even better in each passing year for the betterment of all who share our environment.
Manjula de SilvaManaging Director
31st January, 2011

57HNB ASSURANCE PLC ANNUAL REPORT 2010
You Make Us Who We Are…
Our Vision is “to be Sri Lanka’s most admired and trusted partner in meeting insurance needs professionally with a spirit of caring”.
This is the goal our employees strive for and our business partners render their invaluable support towards. To achieve this we use the fi nancial resources of our investors, operate in the society and use the natural resources of the environment. In return, we have an obligation to provide adequate returns for all those who provided resources, support and commitment.
You are our stakeholders. We exist for and because of you; our past, present and future revolve around you. It is you who make us who we are…
How We Think About Sustainability For us, sustainability is keeping our customers happy while adding value to all our other stakeholders. In doing so, we maximise the returns to our shareholders who are the backbone of the Company. We also manage the risks faced by customers, allowing them to focus on developing their businesses and improving the quality of their personal lives. We develop our people; maintain sustainable relationships with business partners, and fulfi l the needs of the community while safeguarding the environment.
We thereby contribute to the sustainable development of our economy, society and environment. All this is embedded in our business strategy, incorporated into our systems and considered in our decision making processes.
About This ReportWe believe that acting in a sustainable manner alone does not suffi ce. We are accountable to our stakeholders about our performance and also the positive and negative impacts we have on the economy, society and the environment. Through this report we hope to demonstrate our accountability by the measurement and disclosure of our performance and impacts.
We have prepared this report in line with the globally accepted framework for sustainability reporting, the Global Reporting Initiative (G3) guidelines. However, we continue to report through a stakeholder perspective, and discuss the economic, social and environmental impacts of our activities under each stakeholder group.
Organisational Profi leHNB Assurance PLC, a subsidiary of Hatton National Bank PLC, is one of the fastest growing insurance companies in Sri Lanka.
As a Company with a turnover of Rs. 2,428 million and market capitalisation of Rs. 2,925 million, HNB Assurance’s total assets amount to Rs. 4,548 million and it provides employment to 597 individuals.
A clear insight to the Company’s business operations and fi nancial information is given in the fi nancial and business reviews appearing from pages 26 to 54. No signifi cant changes were made in the Company’s operations, structure or size during the reporting period.

58
Sustainability Report
Report Profi leThis is our second report prepared in accordance with the Global Reporting Initiative (G3) guidelines; our most recent report, published on the 28th of January 2010 was the fi rst one prepared in accordance with the framework. This report was adjudged the Runner-up in the Small Scale Category of the ACCA Sustainability Reporting Awards 2010.
Our Sustainability Report is published as a part of our Annual Report every year and we are most willing to respond to or clarify any inquiries regarding this report or any of its contents. Such inquiries could be directed to;
E-mail - [email protected]
Address - HNB Assurance PLC 10, Sri Uttarananda Mawatha, Colombo 03, Sri Lanka.
Website - www.hnbassurance.com
Report Scope and BoundaryWe are a Sri Lankan company carrying out business activities within the island and have no subsidiaries. Hence, this report covers the activities of HNB Assurance PLC for the year ending 31st December 2010.
Honouring our commitment to continuous improvement and based on the level of materiality we have assessed our report at a self-declared application level of ‘B’.
All key functions of the Company are carried out in-house in order to maintain a competitive advantage. However, non core functions have been outsourced in the following instances and this report does not cover these services.
- Security services - Payroll services
- Tea services - Janitorial services
- Offi ce equipment maintenance services - Internal audit and tax consultancy
• All fi nancial data presented in this report has been extracted from the Audited Financial Statements of the Company for the year ending 31st December 2010, which have been prepared in accordance with the Sri Lanka Accounting Standards and the provisions of the Company’s Act No. 07 of 2007.
• All non fi nancial data relating to social and environmental aspects have been compiled by the relevant divisions of the Company throughout the year.
• The previous year’s data has been restated where applicable for better comparability and presentation.
• No signifi cant changes have been made in the scope, boundary or measurement techniques during the reporting period.
The content of this report includes all material sustainability issues of the Company. We have used the GRI framework as the basis to identify key sustainability issues and performed a materiality test to determine the issues to be reported on. This test took the form of a questionnaire in which issues covered by each GRI indicator were rated based on their importance to stakeholders and the current or potential impact on the Company.
In order to identify issues that are considered to be important to our stakeholders, we used the responses we received via our stakeholder engagement process as well as issues capable of posing challenges to the insurance sector. We also considered those issues identifi ed by experts as having signifi cant impacts on sustainability.
The issues which have a current or potential impact on the Company are those that can create a signifi cant risk or opportunity for the Company or help to uphold the values of the Company. Issues that aid us to successfully deliver our business strategy or where we possess a competence to contribute to sustainability are also considered to be of importance to the Company.
In addition to the issues identifi ed using the GRI framework we have also reported on others which are not directly covered by the framework but are important to our stakeholders as well as our Company.
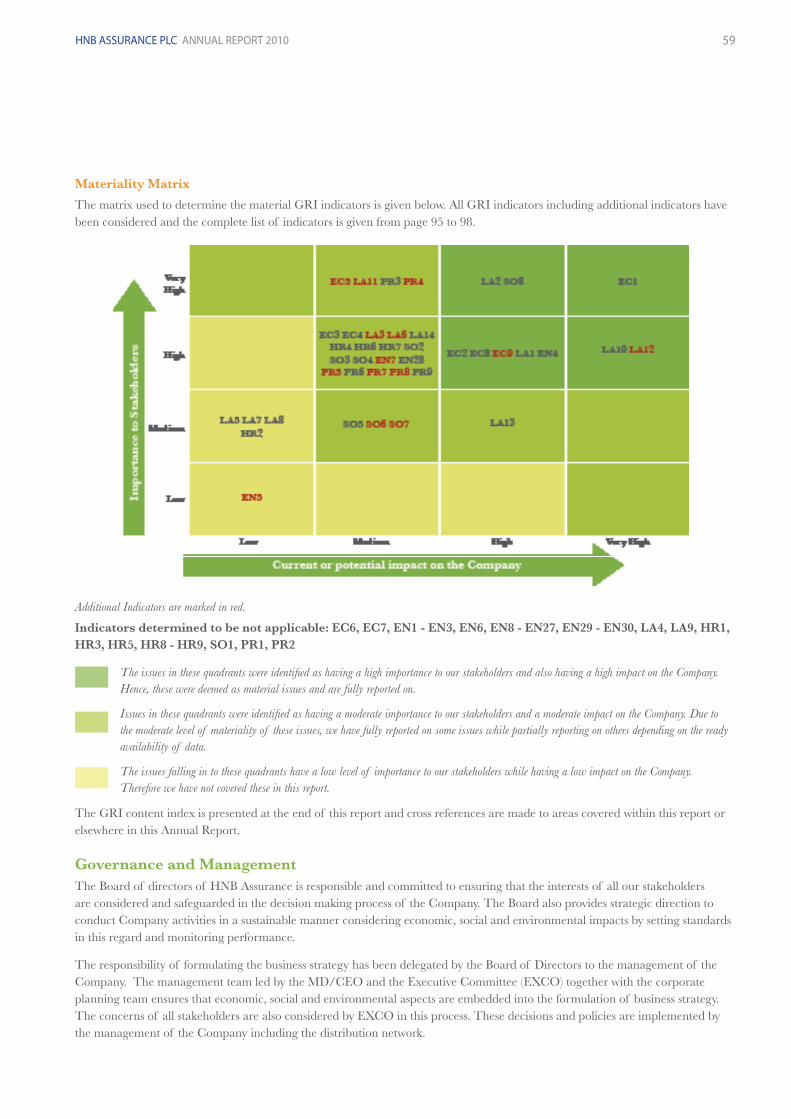
59HNB ASSURANCE PLC ANNUAL REPORT 2010
Materiality Matrix
The matrix used to determine the material GRI indicators is given below. All GRI indicators including additional indicators have been considered and the complete list of indicators is given from page 95 to 98.
Additional Indicators are marked in red.
Indicators determined to be not applicable: EC6, EC7, EN1 - EN3, EN6, EN8 - EN27, EN29 - EN30, LA4, LA9, HR1, HR3, HR5, HR8 - HR9, SO1, PR1, PR2
The issues in these quadrants were identifi ed as having a high importance to our stakeholders and also having a high impact on the Company. Hence, these were deemed as material issues and are fully reported on.
Issues in these quadrants were identifi ed as having a moderate importance to our stakeholders and a moderate impact on the Company. Due to the moderate level of materiality of these issues, we have fully reported on some issues while partially reporting on others depending on the ready availability of data.
The issues falling in to these quadrants have a low level of importance to our stakeholders while having a low impact on the Company. Therefore we have not covered these in this report.
The GRI content index is presented at the end of this report and cross references are made to areas covered within this report or elsewhere in this Annual Report.
Governance and ManagementThe Board of directors of HNB Assurance is responsible and committed to ensuring that the interests of all our stakeholders are considered and safeguarded in the decision making process of the Company. The Board also provides strategic direction to conduct Company activities in a sustainable manner considering economic, social and environmental impacts by setting standards in this regard and monitoring performance.
The responsibility of formulating the business strategy has been delegated by the Board of Directors to the management of the Company. The management team led by the MD/CEO and the Executive Committee (EXCO) together with the corporate planning team ensures that economic, social and environmental aspects are embedded into the formulation of business strategy. The concerns of all stakeholders are also considered by EXCO in this process. These decisions and policies are implemented by the management of the Company including the distribution network.

60
An open door policy encourages employees at all levels to bring sustainability concerns to the notice of the operational management or even to the members of the EXCO and the MD/CEO. These concerns would then be addressed and where necessary reported to the Board for decision.
In addition, this year the Company formed a separate committee for Sustainability Reporting comprising representatives from each division of the Company. The Committee is headed by the Head of Finance and reports to the EXCO. All our key stakeholders have been assigned to one or more of the committee members who will identify and communicate their concerns. Sustainability related issues and impacts are also brought to light by the committee members and decisions are made or brought to the notice of the EXCO where necessary. Further, this Committee is also responsible for the collection, measurement and reporting of data for the Sustainability Report.
The Company complies with the Code of Best Practice on Corporate Governance issued jointly by ICASL and the Securities and Exchange Commission of Sri Lanka and with the Listing rules of the Colombo Stock Exchange. Our levels of compliance are explained in greater detail in the Corporate Governance Report on page 124 to 126 of this Annual Report.
CommitmentsHNB Assurance holds membership in the following entities.
• Insurance Association of Sri Lanka (IASL)
• Ceylon Chamber of Commerce (CCC)
• Federation of Afro-Asian Insurers and Reinsurers (FAIR)
Stakeholder Engagement Our stakeholders’ views and concerns about our economic, social and environmental impact are of vital importance to us. These concerns are captured through our stakeholder engagement process, addressed and considered in the formulation of our business strategy.
The methods by which we engage with each stakeholder group and the manner in which we address their concerns will be discussed throughout this report in greater detail, under each stakeholder group. The following is a summary of our engagement mechanisms.
Sustainability Report
Awards won during the year
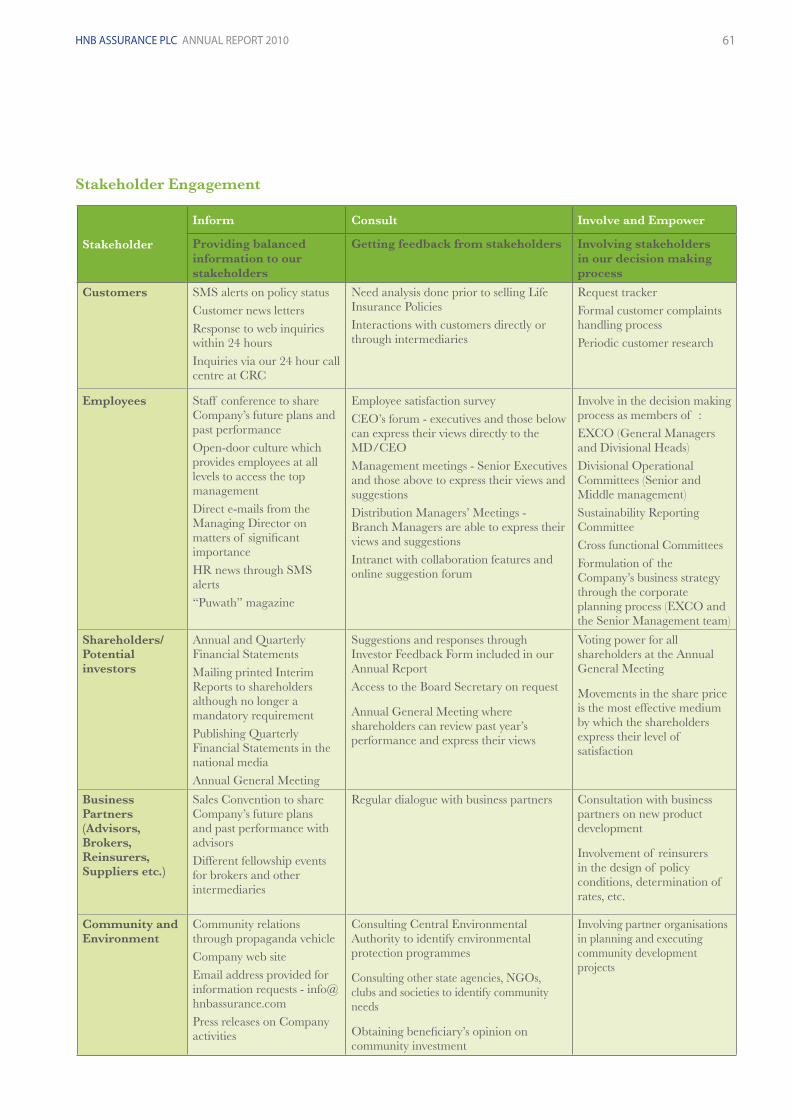
61HNB ASSURANCE PLC ANNUAL REPORT 2010
Stakeholder
Inform Consult Involve and Empower
Providing balanced information to our stakeholders
Getting feedback from stakeholders Involving stakeholders in our decision making process
Customers SMS alerts on policy statusCustomer news lettersResponse to web inquiries within 24 hoursInquiries via our 24 hour call centre at CRC
Need analysis done prior to selling Life Insurance PoliciesInteractions with customers directly or through intermediaries
Request trackerFormal customer complaints handling process Periodic customer research
Employees Staff conference to share Company’s future plans and past performanceOpen-door culture which provides employees at all levels to access the top managementDirect e-mails from the Managing Director on matters of signifi cant importance HR news through SMS alerts“Puwath” magazine
Employee satisfaction surveyCEO’s forum - executives and those below can express their views directly to the MD/CEOManagement meetings - Senior Executives and those above to express their views and suggestionsDistribution Managers’ Meetings - Branch Managers are able to express their views and suggestionsIntranet with collaboration features and online suggestion forum
Involve in the decision making process as members of :EXCO (General Managers and Divisional Heads)Divisional Operational Committees (Senior and Middle management)Sustainability Reporting CommitteeCross functional CommitteesFormulation of the Company’s business strategy through the corporate planning process (EXCO and the Senior Management team)
Shareholders/Potential investors
Annual and Quarterly Financial StatementsMailing printed Interim Reports to shareholders although no longer a mandatory requirementPublishing Quarterly Financial Statements in the national media Annual General Meeting
Suggestions and responses through Investor Feedback Form included in our Annual ReportAccess to the Board Secretary on request
Annual General Meeting where shareholders can review past year’s performance and express their views
Voting power for all shareholders at the Annual General Meeting
Movements in the share price is the most effective medium by which the shareholders express their level of satisfaction
Business Partners(Advisors, Brokers,Reinsurers,Suppliers etc.)
Sales Convention to share Company’s future plans and past performance with advisors Different fellowship events for brokers and other intermediaries
Regular dialogue with business partners Consultation with business partners on new product development
Involvement of reinsurers in the design of policy conditions, determination of rates, etc.
Community and Environment
Community relations through propaganda vehicleCompany web siteEmail address provided for information requests - [email protected] releases on Company activities
Consulting Central Environmental Authority to identify environmental protection programmes
Consulting other state agencies, NGOs, clubs and societies to identify community needs
Obtaining benefi ciary’s opinion on community investment
Involving partner organisations in planning and executing community development projects
Stakeholder Engagement

62
Stakeholder Concerns Our Commitments and Performance
Goals for 2011
Customers Product attributes with more value to customers
Improved service standards
Faster claims handling
Easy access to service points
Competitive pricing and other benefi ts
Innovative ways of meeting needs
Investment in a new integrated system for customer service improvement
Continuous development of new products to meet customer needs (e.g. Super 4 series III and IV)
Faster claim settlement initiatives (e.g. Fast Track Claims Settlement process for motor claims below Rs. 25,000)
Settlement of claims to customer accounts directly
Customer service training to all staff, advisors and assessors
Bonus to Life policyholders
No claim bonus to motor policyholders at highest possible levels
Customer competitions to award gifts
Introducing a few more innovative new products
Enhancing customer service through new technology (e.g. for quick information, facilities for premium payments, etc)
Increasing the number of premium collection centres by tying up with various parties
Expanding the Bancassurance channel by increasing the number of Bancassurance offi cers stationed around the island
Opening new branches and re-locating existing branches to enhance the accessibility to customers
Completing the implementation of the TCS Bancs system
Employees Job security
Transparent methods for recruitment, confi rmation, increments and promotions
Benefi ts, Rewards and Recognition
Compliance with all laws, regulations and ethical norms
Access to all relevant information
Training and Development
Financial support for their needs
Career advancement
Safe and friendly work environment
Balance between work and personal life
Competitive remuneration packages, periodic reviews with market rates and periodic scale adjustments to remuneration packages to be in line with market rates
Structured training programmes and opportunities to participate at local and overseas training events.
Loan facilities for education, marriage and other urgent needs
Chairman’s Award and other Recognitions and Rewards for high performers
Employee satisfaction survey to get employee feedback on the Company’s activities
Formation of cross- functional project teams consisting of employees in different departments
Upgrading systems for easy job performance
Full compliance with all laws and regulations and Corporate Governance practices
Offer remuneration packages in line with market rates
Management skills development programmes to develop the newly promoted managerial and executive staff.
HRIS to be implemented to increase the effi ciency and effectiveness of managing employee information.
More opportunities for employees to work in cross functional teams to develop their leadership and other skills
Performance Against Commitments and Goals
Sustainability Report

63HNB ASSURANCE PLC ANNUAL REPORT 2010
Stakeholder Concerns Our Commitments and Performance
Goals for 2011
Shareholders/ Potential investors
Growth in top and bottom lines
Consistency in results
Share price performance
Stability and Liquidity
Compliance with all laws and regulations and ethical standards
Acting with social responsibility
Consistent growth in fi nancial results over the last few years
Exceptional performance in the Company Shares (outperformance of the All Share Price Index since inception as seen in the graph on page 67)
Maintaining a Return On Equity (ROE) in excess of 20% over the last 5 years
Full compliance with all laws and regulations and Corporate Governance practices
Maintaining consistent growth in GWP and profi t
Enhancing the Company value and improving the returns
Business Partners
(Advisors, Brokers, Reinsurers, Suppliers etc.)
Keeping promises
Sound business relationships
Professionalism and integrity
Continuous support in terms of training and development (particularly to advisors and brokers)
Financial support for their needs (advisors)
Structured training programmes (brokers and advisors)
Number of recognitions/ awards for achievers including overseas trips (for brokers and advisors)
Help in improving productivity and effi ciency (advisors)
Timely payout of commissions, reinsurance and other payments
Loan facilities for education, marriage and other urgent needs (advisors)
Demonstrating the selling cycle to our advisor force through a video produced by the Company
Improved training, development, recognitions and benefi ts
Targeting to get at least one member qualifi ed for the MDRT programme this year
Community Contribution to Community Development
Taking into account social and cultural needs in decision making
Helping the needy in society by donations and other CSR projects, sponsorships etc.
Extensive usage of distribution network to identify community needs
Focussed attention on Micro Insurance to give the benefi ts of insurance to the lower segment of the society
Community relations through the propaganda vehicle
Providing safe water facilities to a few more schools
Supporting more events to promote Sri Lankan Arts and Culture
Contributing further towards the improvement of healthcare facilities
Expanding Micro insurance to reach a greater number of people
Environment Minimise adverse impact on the environment
Energy saving initiatives such as the use of energy saving computers, lights, etc.
Movement towards e-documentation
Assisting Central Environmental Authority to carryout environmental protection activities around Bolgoda Lake
Expanding use of e-documentation and energy saving initiatives
Carrying out one signifi cant environmental protection programme
Performance Against Commitments and Goals (Contd.)

64
The Value We Add to Our StakeholdersAs responsible corporate citizens, we focus not only on the bottom line but believe in creating value for all our stakeholders as well as the country’s economy. Value created could be in monetary and non-monetary terms and the impact of such value creation would be delivered by either direct or indirect methods.
Direct monetary value created by the Company in respect of each key stakeholder is demonstrated in the Value Added Statement given below.
Value Added Statement The value generated by the Company increased to Rs. 1,435.3 million in 2010 from Rs. 1,277.3 million in 2009. We have allocated 3.9% (2009 – 3.7%) to our shareholders as dividends and retained 15.7% (2009 – 14.9%) for future investments.
2010 2009 Rs. ‘000 Rs. ‘000
Net Earned Premium 1,844,360 1,567,747 Investment and Other Income 516,880 469,038 2,361,240 2,036,785 Net Claims & Benefi ts (648,137) (511,911)Cost of External Services (277,782) (247,580)Value Addition 1,435,321 1,277,294
Distribution of Value Added
% %
To Employees Salaries and Other Benefi ts 281,439 19.61 246,729 19.32To Intermediaries
Commission Cost 310,267 21.62 268,707 21.04To Government
Income Tax 27,786 1.94 29,471 2.31To Life Policyholders
Increase in Life Insurance Fund 531,733 37.05 493,008 38.60To Shareholders
Dividend Paid 56,250 3.92 46,875 3.67
To Society 2,020 0.14 2,557 0.20
For Expansion and Growth Retained as Depreciation and Amortisation 40,337 2.80 35,212 2.75
Retained in Reserve 185,489 12.92 154,735 12.11 1,435,321 100.00 1,277,294 100.00
Sustainability Report
65HNB ASSURANCE PLC ANNUAL REPORT 2010
Rs. 531.7 million which is 37.1% of total value added (38.6% in 2009) was distributed among Life Policyholders and 21.6% (21.1% in 2009) to our intermediaries. The value shared with our employees increased from 19.3% in 2009 to 19.6% in 2010, amounting to Rs. 281.4 million. We have also contributed towards the development of the economy by way of taxes amounting to Rs. 27.8 million which is 1.9% of our value added (2.3% in 2009).
Our community investment decreased slightly in monetary terms from Rs. 2.6 million in 2009 (0.2% of value added) to Rs.2 million (0.14% of value added) in 2010. However, the non monetary impact of our investment is much greater, best demonstrated by the comments made by the benefi ciaries of these investments, a few of which we have included within this Sustainability Report.
Economic goals, policies and performance of the Company are discussed in great detail in the Management Discussion and Analysis appearing on pages 26 to 54 of this Annual Report.
HNB Assurance PLC has not received any fi nancial assistance from the Government during the year under review.
Our policy is to deliver sustainable value to all our stakeholders.
Shareholders
A decision made a decade ago by our parent company HNB to create a new insurance service provider, resulted in the birth of HNB Assurance. We are indeed thankful to HNB, and to all our other shareholders and investors for making us who we are today. We consider it our duty to deliver sustainable value to them in the long run and are most committed to this motive.
Engaging with Our ShareholdersOur Annual Report which is the main tool of communication between the Company and shareholders plays a vital role in updating our shareholders on Company activities, fi nancials, governance, etc. We have included an Investor feedback form in this Annual Report and our Shareholders are encouraged to provide feedback on our sustainability related activities.
At the Annual General Meeting, shareholders can raise their concerns, review our fi nancial and non- fi nancial performance, and can take part in appointing the Board of Directors and making important decisions of the Company.
Although mailing printed interim fi nancial statements is no longer a mandatory requirement, we continue with the practice to keep our shareholders informed about the Company’s interim fi nancial performance via printed statements in addition to publishing the same in the Colombo Stock Exchange web site. In addition, interim fi nancial results are also published in national newspapers at the end of every quarter as another best practice, adopted voluntarily.
GrowthDuring the year under review we were able to record steady growth in revenue, profi ts, dividends and net assets thereby maintaining the growth momentum we have recorded over the past years. The following table and graphs depict the above. Further, growth in Return On Equity and Earnings Per Share are depicted on graphs on page 28 of the Management Discussion and Analysis.
Description Growth Rate
2006 2007 2008 2009 2010
Gross Written Premium – Company 36% 31% 25% 15% 15%Profi t After Tax – Company 51% 35% 33% 23% 20%Net Assets 21% 22% 23% 23% 22%

66
Dividend PayoutThe dividend payout ratio in 2010 remained at 28% (2009 - 28%), with the fi rst and fi nal dividend of Rs. 1.80 per share declared by the Company.
HASU in 2010The Market Capitalisation of HASU (the CSE code given to the Company’s share), which measures the total market value of all of Company’s outstanding shares, surpassed the Rs. 3 billion mark on 14th of September 2010. It recorded its highest market value per share on 16th of September by trading at Rs. 90.00. This is an exceptional achievement considering the fact that the Company just crossed the Rs. 2 billion mark in Market Capitalisation in the year 2009.
The closing market price of HASU, was Rs. 78.00 recording an increase of 57.58% in the share price for the year 2010.
Total Return IndexTotal Shareholder Return (TSR) is defi ned as the return on investment a shareholder receives over a specifi ed time. It combines the change in the value (appreciation/depreciation) of a listed company’s share price and dividends paid in order to illustrate the total return to the shareholder.
During the year 2010, HASU appreciated by 57.58%. Dividend yield for the year was 3.03% since HNB Assurance paid a dividend of Rs. 1.50 per share during 2010. Accordingly TSR on HASU for 2010 was 60.61%.
The All Share Price Index (ASI) computed on total returns basis is known as the All Share Total Return Index (ASTRI) and the MPI computed on total returns is known as the Milanka Total Return Index (MTRI).
On 31st of December 2010 the Total Return Index on All Shares (ASTRI) recorded 7,899.11 points refl ecting a growth of 100.24%. The Total Return Index on Milanka Shares (MTRI) closed at 8,481.73 points gaining 88.22% for the year 2010.
Value Addition to InvestorHNB Assurance’s performance has also been refl ected in high profi tability ratios. Return-on- equity (ROE) stood at 24% in 2010, at the same level as a year earlier. During 2010 the Company reported an EPS of Rs. 6.45, representing an increase of 20% over the previous year. It’s commendable that the EPS increase has surpassed the Revenue growth of 2010 which stood at 16%. Price-to Earnings Ratio, which stood at 9.21 times at the end of 2009, increased to 12.10 times in 2010 refl ecting the positive investor sentiment towards HASU and the CSE as a whole.
Rs 1,000/- invested at HASU IPO
A sum of Rs 1,000/- invested at the HNB Assurance IPO is now valued almost 10 times the initial investment at Rs. 9,970/-, yielding an 897% return considering the bonus issue and dividends paid over the years. This amounts to an annualised effective return of 38.9%.
Financial StrengthWe continue to maintain our fi nancial strength at a strong level with a National Long Term Financial Strength Rating of ‘A (lka)’ and an Insurer Financial Strength Rating of ‘A (lka)’ as well.
Sustainability Report

67HNB ASSURANCE PLC ANNUAL REPORT 2010

68
Compliance with Regulatory BodiesWe comply with all rules, regulations, circulars and guidelines issued by relevant regulatory bodies and submit all regulatory requirements well within the stipulated deadlines.
Awards and AccoladesDuring the year under review HNB Assurance was well recognised with several awards and accolades which enhanced the value as well as the image of our Company.
• Annual Report 2009
• 1st Runner up in Corporate Governance Disclosures for 2009 Annual Report –South Asian Federation of Accountants (SAFA) Annual Report Awards 2010
• Silver Award in the Insurance Sector for 2009 Annual Report – Annual Report Awards organised by the Institute of Chartered Accountants of Sri Lanka (ICASL) in 2010
• Runner-up in the Small Scale Category of the ACCA Sustainability Reporting Awards 2010 (based on 2009 Annual Report)
• ‘mylife’ brand
• Bronze Award for the Best New Entrant – SLIM Brand Excellence Awards 2010
• Top 100 brands
• Featured among the list of top 100 brands compiled by the Lanka Monthly Digest (LMD) in association with Brand Finance, for the 3rd successive year
EmployeesThe most valuable asset we possess is our team of employees. They strive to delight our Customers, enhance the value of our Company, and uphold integrity and ethical conduct when interacting with our business partners and society.
We endeavour to recruit the right people to add to this asset and sharpen their knowledge and skills through training and development. While rewarding them for their performance and providing equal opportunity, we are committed to fostering diversity. We consider it our duty to care for their safety and to help them achieve a work-life balance.
We are an equal opportunity employer who fosters diversity as a corporate strength; we offer employment, rewards and recognition regardless of gender, race, or religion.
Key Employee Indicators• We have the strength of 597 individuals in our dynamic team as at 31st
December 2010 (2009 – 540). Additions to this team are made through a very transparent process; based on knowledge, skills and experience of candidates.
• We are an equal opportunity employer who fosters diversity as a corporate strength. Hence, we offer employment, rewards and recognition regardless of gender, race or religion.
Hazana CafforManager - Motor Underwriting
“I joined HNB Assurance in 2001 at the start of the Company as an Underwriting Assistant. From that day onwards I was given the necessary guidance and support which helped me to climb up the career ladder and reach the post of Manager – Motor Underwriting. Further, the Company recognised my dedication and commitment to work by awarding me with the ‘Chairman’s Award for Excellence’ in the year 2008”.
Sustainability Report
SAFA Awards : 1st Runner-up Corporate Governance Disclosures

69HNB ASSURANCE PLC ANNUAL REPORT 2010
Staff Category 2010 2009
Male Female Total Male % Female % Male % Female %
Managing Director and General Managers 3 1 4 75% 25% 75% 25%Heads of Divisions 4 0 4 100% 0% 100% 0%Managers and Assistant Managers 50 11 61 82% 18% 83% 17%Executives 65 32 97 67% 33% 67% 33%Non Executives 261 170 431 61% 39% 62% 38%Total 383 214 597 64% 36% 66% 34%
• 36% of our workforce is female and this year there is a slight increase of 2% in female employee numbers when compared to last year.
• Our team consists of 88% of permanent cadre while 12% is on contract basis.• We have a young and vibrant team with 81% of our staff members being below the age of 35 years.• 57% of our team has been with us for over two years.• 63% of our employment opportunities are offered in the Western Province while 37% is in other provinces.

70
Staff Turnover Ratios
• Employee turnover has increased considerably from 16% in 2009 to 24% in 2010. The key reason for this is the high level of turnover of Bancassurance staff employed on contract basis. Employee turnover excluding Bancassurance staff is at a much healthier level of 15%.
• The turnover of male employees is 22% whereas the turnover of female employees is 27%. The key reason for this difference is because some female employees tend to leave employment due to family commitments.
• Turnover is highest among employees below the age of 25 because those of this age category tend to change employment frequently in their search for the most suitable career or to pursue higher education.
Employee Engagement
• Staff conference At this gala event for employees, the Company’s past performance is summarised and future plans are communicated. It is also the
occasion at which the seven best performers of the previous year are felicitated by being awarded ‘Chairman’s Award for Excellence’.
• Open – door culture The open-door policy practiced encourages employees of all levels to voice their concerns to the top management, even
General Managers or the Managing Director.
• SMS alerts HR related news alerts are communicated via SMS for the convenience of employees. This includes SMS alerts confi rming
that their salaries have been credited to their bank accounts.
• “Puwath” Magazine Our newsletter “Puwath” written by and for employees and members of the fi eld force, brings news and enjoyment.
• Employee satisfaction survey An employee satisfaction survey was carried out this year to assess the level of employee satisfaction and to identify areas for
improvement. To ensure confi dentiality and to give confi dence to employees to present their feelings freely, this was conducted by a third party, MTI Consulting and participation was open to the entire staff on a voluntary basis.
A high level of enthusiasm was seen among staff resulting in a response rate of 78% (i.e. 454 of total staff 575). Overall satisfaction proved to be high with 79% of the respondents rating that their morale is high.
Findings were communicated to and discussed by the Remuneration Committee, Executive Committee, Divisional Operational Committees and the Management team. Necessary action is being taken to strengthen positive areas and make improvements where necessary to management practices, HR policies and remuneration packages. Chairman’s Award winners in 2010
Sustainability Report

71HNB ASSURANCE PLC ANNUAL REPORT 2010
• CEO’s Forums
Six CEO’s Forums were held this year too to provide employees in the executive grade and below an opportunity to express their concerns directly to the Managing Director without the presence of their own management.
• Management / Distribution management meetings
At the four management meetings held, employees at senior executive level and above presented their departments’ performances and also voiced their concerns to the top management.
The distribution management met fi ve times during the year to review their performance and discuss their issues in the presence of the top management team. Distribution management meetings are very helpful in developing the coordination between the head offi ce and the distribution network.
• Intranet
Our staff has access to an intranet facility which includes collaboration features and also an online suggestion forum. All suggestions made are directed to the HR Department. It also carries news and announcements of relevance to the entire staff.
• Committees
Employees become directly involved in the decision making process through committees formed at different levels. The key decision making committees are the Executive Committee and Divisional Operational Committees whilst cross functional committees are also formed as and when needed. Please refer page 126 for more details on committees operating within the Company.
• Corporate planning sessions
We empower people to strive for excellence. The members of the EXCO and a selected team of senior management formulate the future strategies of the Company each year at Corporate Planning Workshops and conduct periodic reviews throughout the year.
• Risk Management Committee
Risk management is an integral part of our business. Members of all key functions of the Company are given the opportunity to participate and contribute to the risk management process of the Company through the Risk Management Committee.
Training and DevelopmentOurs is a learning culture. We encourage and empower people to strive for excellence through focused training and development of all individuals who are a part of the HNB Assurance team.
Training
Our staff members are encouraged to participate in training programmes organised by our HR department and by different divisions of the Company. These programmes are conducted using both internal and external resource persons. Our employees received 14, 466 hours of in-house training, averaging to 25.5 hours of in-house training per employee for the year. In addition, they are also given the opportunity to participate in external workshops and seminars as well as overseas training.
We are committed to train and develop our people and empower them to strive for excellence.
Lasantha AbeyratneSenior Accounts Executive
“I joined HNB Assurance as a Cashier, soon after my Advanced levels in 2001. Today I have progressed up to Senior Accounts Executive level leading three important functions in the Finance Division. Working with cross functional teams in various projects has given me lots of opportunities to grow as a team player and improve my leadership skills”

72
Highlights of Our Training Calendar
• Participation in induction and familiarisation programmes is a mandatory requirement for all new recruits. A unique feature of our induction programme is that it is conducted by the Top Management team of the Company led by the Managing Director.
• All new recruits to the branch network are given on the job training at our head offi ce for a period of fi ve days.
• Customer Service Excellence training sessions were conducted by well-known trainer, Mr. Dhammika Kalapuge for the entire staff of HNB Assurance. A total of 9 programmes were conducted in 5 locations island-wide.
• Training in the use of MS Offi ce package was provided to all head offi ce staff.
• A corporate grooming programme was conducted by Ms. Nayana Karunaratne for the female staff in head offi ce.
• Underwriting training (Life and General) was given to the entire branch network staff covering all regions.
• Staff attached to all regions was trained on our new system, TCS Bancs.
• A job focused Tamil language course was launched to enable employees of executive and non executive grades to better serve our Tamil clientele. Two batches have successfully completed this course.
• A General Insurance Academy was established to share the expertise of technical specialists in our General Division. Basic Level training has been completed for two batches and Intermediate level training has already commenced.
• A programme on “Examination Success” was conducted by our Managing Director to guide and motivate staff to become successful in their professional and academic studies.
• To improve the effectiveness and objectivity of the performance appraisal process, an awareness programme was conducted by our Managing Director for management staff who conduct appraisals to address a need that was highlighted in the employee satisfaction survey.
• All junior executives of the Company participated in an out-bound professional development training programme organised by Sri Lanka Business Development Centre (SLBDC) at the Dambulu Oya Family Park.
• Staff at divisional level also attended out-bound training programmes conducted to enhance their leadership qualities and teamwork.
In-house Training Programmes
Programme 2010 2009
Number of Number of Number of Number of Programmes participants Programmes participants
Induction & Familiarisation Programmes 3 157 3 124Other In-house Training Programmes 33 1583 50 1351Total In-house Training programmes 36 1740 53 1475
External Training Programmes
Department 2010 2009
Programmes Participants Programmes Participants
MD’s Offi ce 11 11 3 5Finance & Corporate Services 40 55 33 47General 22 35 19 41Human Resource 12 15 4 5Investment 14 18 22 35IT 7 12 8 11Legal 10 13 7 7Life 11 25 12 35Marketing & Distribution 20 35 19 47Total 147 219 127 233
Overseas Training Programmes
Department 2010 2009
Number of Participants Number of Participants
MD’s Offi ce 1 1 Finance & Corporate Services 1 0General 1 2Investment 1 0IT 3 0Life 1 3Marketing & Distribution 1 2Total 9 8
Sustainability Report

73HNB ASSURANCE PLC ANNUAL REPORT 2010
Professional and Personal DevelopmentWe also place great emphasis on the professional and personal development of employees.
• Management Development Pool Employees in senior grades identifi ed as having the potential to be future
leaders are included in the Management Development Pool, and are trained and groomed to take up senior management positions in future.
• Speech Craft Programme
A Speech Craft programme conducted by Word Blasters Unlimited (formed by a few past presidents of the Colombo Toast Masters Club) has been organised by the Company to improve presentation and leadership skills of employees. HNBA intends to establish a Toast Masters Club upon the completion of this programme.
• Theatre Day and Singing Competition
A Theatre Day was organised by our HR Department to discover the hidden talents of our employees. This drew a very enthusiastic response with over 150 employees displaying their talents in front of a packed audience.
We also facilitated the unveiling of vocal talent through a singing Competition modelled on popular reality shows with the participation of several popular artistes as judges.
Knowledge Sharing
Knowledge sharing is a vital facet of our learning culture. Our employees who participate in external and overseas training share the knowledge gained with their co-workers upon their return. The growing number of academically and professionally qualifi ed members in the HNBA team feeds the overall personal and professional development of their co-workers.
Madusha Kulatunga Branch Manager - Embilipitiya Branch
“As an underwriting trainee I learned the basics of insurance at HNB Assurance. The Company helped me to identify my true potential and change my career to the fi eld of Marketing. Today I am a Branch Manager and winning the award for the Best Service Centre in the Company last year was a memorable milestone in my life.”

74
• Library facilities
An in-house library fi lled with books ranging from insurance texts to fi ction, journals and periodicals provides food for thought while our corporate membership of the British Council provides employees further access to books and periodicals.
• E- learning
The entire HNBA team which includes our Bancassurance Offi cers stationed at HNB branches has access to e-learning modules specially designed by each department as well as a variety of other learning material.
• Quiz Competition
The HNBA Quiz Competition organised for the 3rd time which attracted teams from all regions proved to be a resounding success. The level of participation was very high with 77 staff members taking part.
• Motivational quotes
As planned last year, motivational quotes are displayed throughout our Head Offi ce premises to inspire our employees. In addition, our intranet also features inspirational quotes.
Guidance and Ethics
• Employee hand book
The employee hand book made available via our intranet communicates the HR policies of the Company and provides clear guidelines to our employees.
• Code of Ethics
Treasuring integrity and ethical conduct is one of our corporate values. All employees must adhere without exception to the HNBA Code of Ethics, which clearly sets out the criteria for employee conduct and the Company’s anti corruption policies. This too is made available through the intranet.
Our employees are required to treasure integrity and ethical conduct. We maintain a zero tolerance approach towards fraud, bribery and corruption.
Performance AppraisalsAll employees in our permanent cadre who have completed their probation period go through a formal and transparent performance appraisal twice a year. All promotions and increments are granted on the basis of the results obtained.
Mid-probation appraisals are also conducted for employees during their probationary period.
Rewards, Recognition and Benefi tsOur salaries are aligned with industry standards and are based purely on performance and merit regardless of gender, age, race or religion. The Company’s minimum wages and salaries are above the country’s legal requirements. Remuneration packages are frequently adjusted to align with market rates based on salary surveys.
• Commendation
Exceptional performers are commended by superiors and brought to the notice of the top management. Gift vouchers are also offered in recognition of good work done and 72 staff members were accordingly recognised during the year.
The talents of the HNBA team - Talent Show
Enthusiastic participants of the HNBA Quiz Competition
Facilities for professional development
• Clear career path
• Reimbursement of professional examination fees on successful completion
• Payment of professional subscription fees
• Examination loans
Sustainability Report

75HNB ASSURANCE PLC ANNUAL REPORT 2010
• Chairman’s Award for Excellence
Employees who perform their duties beyond the call of duty are honoured with the Chairman’s Award for Excellence at the Staff Conference. This year too, seven members of the HNBA team were honoured with this recognition.
• 5 year completion awards
Our staff members who complete 5 years of continuous service are recognised with these awards and 29 employees were accordingly honoured this year.
• Defi ned contribution plan
The Company contributes to the Employees’ Provident Fund (EPF) and Employees’ Trust Fund (ETF) on behalf of its employees. 12% of the basic salary of an employee is contributed to EPF by the Company while 8% is contributed by the employee. To ETF, the Company contributes 3% of an employees’ basic salary.
Company’s contribution - Rs.’000 2010 2009
EPF (12% of Employee’s basic salary) 20,273 17,143
ETF (3% of Employee’s basic salary) 5,068 4,286
• Defi ned benefi t plan
All permanent employees in continuous service for over 5 years in the Company are entitled to receive a retirement gratuity of a half month’s basic salary for every year in employment. The Company’s liability for retirement gratuity as at the balance sheet is given on page 184 of this Annual Report. The gratuity liability is valued by a Consultant Actuary (Mr. Hugh Terry - Fellow of the Institute of Actuaries, U.K.) every year using the Projected Unit Credit (PUC) method.
• Loan facilities
Permanent employees are eligible for the following loan facilities:
- Vehicle loans (senior grades only) - Wedding loans
- Emergency loans - Educational loans
We offer protection to our people through a personal accident cover, group life cover and a staff health insurance scheme which includes cover for the spouse and children as well.
• Recreational facilities provided
- Gym and swimming pool facilities
- Holiday bungalow – Victoria Park, Digana (senior grades only)
Grievance Handling and Human Rights• The Company has an agreed grievance handling procedure.
• All grievances are looked into and fairly resolved.
• No cases of discrimination were reported during the year.
• No forced or compulsory labour reported at HNB Assurance.
• We only recruit individuals who are 18 years or above.
A Chairman’s Award winner
Work out at the gym at the end of the day

76
Work Life BalanceWe provide all possible encouragement and guidance to balance work and personal life.
• An Annual Company Trip together with a number of entertainment activities was organised by the Company’s Welfare Society for the enjoyment of employees and their families
• A multi religious ceremony and a pirith ceremony were organised in memory of our deceased colleagues and to obtain blessings for our employees and their families.
• A Vesak Lantern Competition was organised by our Marketing and Distribution Division which attracted the enthusiastic participation of Head Offi ce Staff belonging to all religions.
Health and Safety
• Sick room and fi rst aid committee A sick room is available for employees to rest if they feel
unwell and fi rst aid boxes are placed in each division. A fi rst aid committee was formed this year with two representatives from each division and special training was provided to them on fi rst aid methods.
• Preventive health care A Preventive Health Care programme was initiated this year
and consulting sessions with a Doctor are organised twice a month for employees who wish to use the facility. In addition to normal consulting sessions at which 141 employees participated, an eye clinic and an ENT clinic were also held for the benefi t and convenience of our staff.
We provide a healthy and safe work environment for our people and have facilities and processes in place to maintain a healthy workforce.
Business PartnersThe role of our business partners is indispensable to the success of our Company. As an insurance service provider our main form of income- our GWP is channelled to us through our Advisors, Brokers, Bancassurance staff as well as the relationships within the HNB group.
Our panel of Reinsurers is the pillar of our strength and our suppliers are the vital facilitators in our customer service.
Whilst thanking our business partners for their continued support, we acknowledge their contribution to our top line as depicted in the channel wise GWP graphs on page 33 and 41 of this Annual Report.
We show mutual respect in all our interactions and focus on maintaining win-win relationships.
Vesak lantern competition
Consulting a doctor at our own offi ce
Sunil PereraAssistant Group Field Manager
“I started my career as a Business Promotion Offi cer at HNB Assurance. Within a short period of time I was able to get promoted as an Assistant Group Field Manager. During my career ladder, I was lucky enough to win the Best Field Managers’ Award for the last fi ve consecutive years. The assistance and guidance provided by HNB Assurance helped me immensely to enlighten my career path. “
Sustainability Report

77HNB ASSURANCE PLC ANNUAL REPORT 2010
Engaging Our Business PartnersWe maintain a regular dialogue with our valued business partners and consider their feed back in our decision making. An annual Sales Convention is organised for our Advisors where the past year’s performance is reviewed and the coming year’s plans are communicated. This is also the occasion at which the top performers of the fi eld force in respect of the previous year are felicitated and rewarded. In addition, a number of different events are organised to appreciate and recognise the contribution made by our valued business partners. A few of these events are the Beach Rugby Fiesta for brokers, Mid-Year Award ceremony for HNB Branch managers, Broker Cocktails, Regional get-togethers for HNB staff, etc.
AdvisorsWe are proud that we possess an excellent team of advisors whose dedication, talent and professionalism coupled with their service excellence stands to delight our valued Customers. Their tremendous efforts and contribution in making us one of the fastest growing insurance companies is invaluable. We are extremely grateful to them as they have played an unforgettable role in making us who we are.
Recruitment
We are in the process of expanding the strength of our fi eld sales force which currently amounts to 1,401 dedicated Insurance Advisors and Field managers (2009 – 1,546). Our Advisors come from all regions of the country with 273 of Advisors and fi eld managers operating in the North and East. During recruitment, we maintain strict compliance with the IBSL regulations requiring;
• A pass in Technical Competency Course in Life Insurance for Life Insurance Advisors
• A pass in Technical Competency Course in General Insurance for General Insurance Advisors
• A service letter from the previous company for recruitments made from within the industry
Training and Development
All our Advisors undergo an extensive training curriculum developed a few years ago with the technical assistance of ICICI Prudential Life Insurance Company of India. The programme consists of fi ve modules, all driven by performance, and the successful participants are awarded company certifi cation at the end of each module.
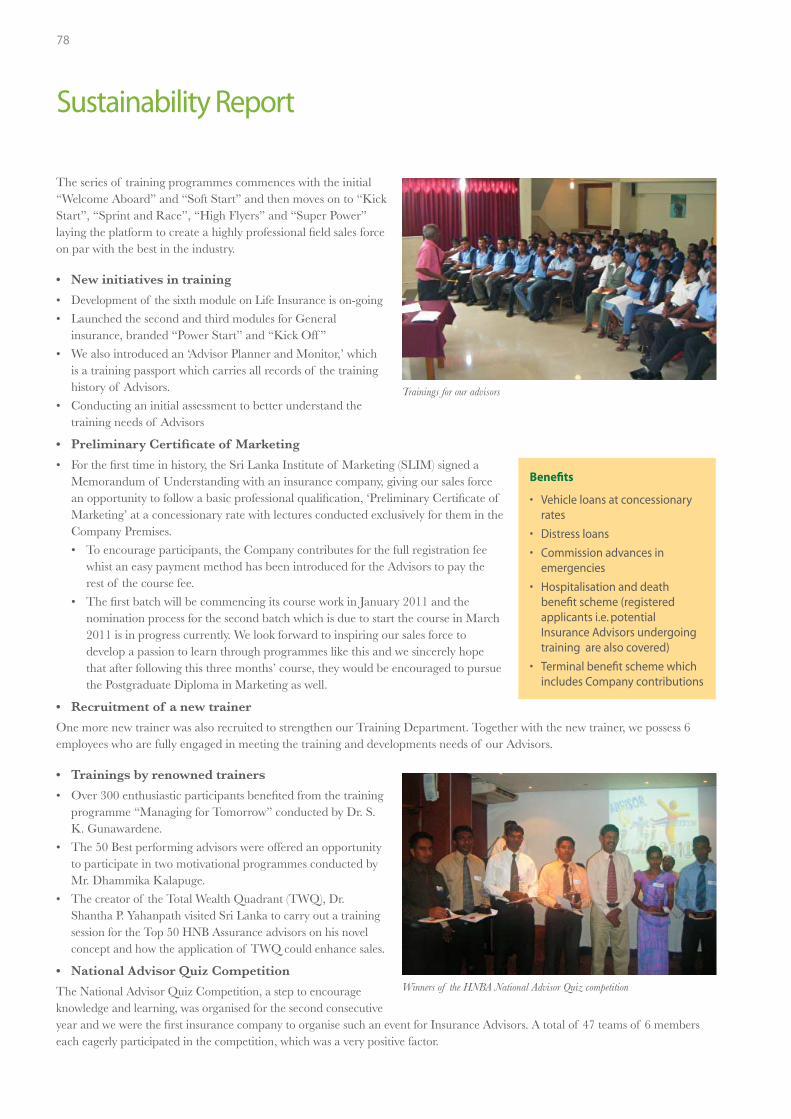
78
The series of training programmes commences with the initial “Welcome Aboard” and “Soft Start” and then moves on to “Kick Start”, “Sprint and Race”, “High Flyers” and “Super Power” laying the platform to create a highly professional fi eld sales force on par with the best in the industry.
• New initiatives in training
• Development of the sixth module on Life Insurance is on-going
• Launched the second and third modules for General insurance, branded “Power Start” and “Kick Off ”
• We also introduced an ‘Advisor Planner and Monitor,’ which is a training passport which carries all records of the training history of Advisors.
• Conducting an initial assessment to better understand the training needs of Advisors
• Preliminary Certifi cate of Marketing
• For the fi rst time in history, the Sri Lanka Institute of Marketing (SLIM) signed a Memorandum of Understanding with an insurance company, giving our sales force an opportunity to follow a basic professional qualifi cation, ‘Preliminary Certifi cate of Marketing’ at a concessionary rate with lectures conducted exclusively for them in the Company Premises.
• To encourage participants, the Company contributes for the full registration fee whist an easy payment method has been introduced for the Advisors to pay the rest of the course fee.
• The fi rst batch will be commencing its course work in January 2011 and the nomination process for the second batch which is due to start the course in March 2011 is in progress currently. We look forward to inspiring our sales force to develop a passion to learn through programmes like this and we sincerely hope that after following this three months’ course, they would be encouraged to pursue the Postgraduate Diploma in Marketing as well.
• Recruitment of a new trainer
One more new trainer was also recruited to strengthen our Training Department. Together with the new trainer, we possess 6 employees who are fully engaged in meeting the training and developments needs of our Advisors.
• Trainings by renowned trainers
• Over 300 enthusiastic participants benefi ted from the training programme “Managing for Tomorrow” conducted by Dr. S. K. Gunawardene.
• The 50 Best performing advisors were offered an opportunity to participate in two motivational programmes conducted by Mr. Dhammika Kalapuge.
• The creator of the Total Wealth Quadrant (TWQ), Dr. Shantha P. Yahanpath visited Sri Lanka to carry out a training session for the Top 50 HNB Assurance advisors on his novel concept and how the application of TWQ could enhance sales.
• National Advisor Quiz Competition
The National Advisor Quiz Competition, a step to encourage knowledge and learning, was organised for the second consecutive year and we were the fi rst insurance company to organise such an event for Insurance Advisors. A total of 47 teams of 6 members each eagerly participated in the competition, which was a very positive factor.
Benefi ts
• Vehicle loans at concessionary rates
• Distress loans
• Commission advances in emergencies
• Hospitalisation and death benefi t scheme (registered applicants i.e. potential Insurance Advisors undergoing training are also covered)
• Terminal benefi t scheme which includes Company contributions
Trainings for our advisors
Winners of the HNBA National Advisor Quiz competition
Sustainability Report

79HNB ASSURANCE PLC ANNUAL REPORT 2010
• Pass rates achieved in the competency course conducted by the Sri Lanka Insurance Institute (SLII)
• Life Insurance Competency Course - Sinhala 81% (2009 - 83%)
• Life Insurance Competency Course - Tamil 61% (2009 - 53%)
• General Insurance Competency Course - Sinhala 59.7%
Rewards, Recognition and Benefi ts
Our Advisors make an enormous contribution to the betterment of the Company and we appreciate their untiring efforts and unstinted co-operation through rewards and recognition.
• The agency ranking model is used to grade Advisors and monthly medals are awarded based on performance.
• Star performers are recognised with Super Gold, Gold, Silver and Bronze medals at the Annual Sales Convention.
• Star performers are also offered foreign trips or laptop/ desktop computers.
- 34 Advisors and Field Management visited China and Thailand (2009 – 48)
- 15 opted to receive laptop computers while 20 opted for desktop computers
BrokersDuring the year, we maintained win-win relationships with 64 Insurance Brokers. Contribution made by brokers to General Insurance GWP was Rs. 360 million (2009 – Rs. 333 million).
• Events organised to recognise their support
• Beach Rugby Fiesta (participation- ten teams)
• Broker cocktail for all our Brokers
• Training programmes for Broker Staff
• Various other entertainment activities
Bancassurance and the HNB groupBancassurance model which commenced in 2008 with HNB has shown exceptional performance during the year. This facility is offered exclusively to HNB customers and HNB Assurance has supported the “Financial Supermarket” concept of the Bank by becoming the insurance service provider to its customers at branch level.
• Offi cers positioned within HNB branches - 98 (2009 – 74)• Contribution to General Insurance GWP – Rs. 551 million (2009 - Rs. 476 million)• Contribution to Life Insurance GWP – Rs. 92 million
(2009 – 39 million)• Life Insurance GWP - MRP growth rate 62%• Life Insurance GWP – Endowment policies growth rate 135%
As seen above, this channel has shown lots of potential for growth and we are fully committed to strengthening and motivating the team through various activities. Blessings of the HNB management team are also a major contributory factor for this exceptional performance.
A tour to China and Thailand for our star performers
Best performer - Sales Convention 2010
Beach Rugby Fiesta for our brokers

80
Some of our commitments during the year to support this channel:
• A Mid-year award ceremony was organised to appreciate the contribution from the entire HNB network and its staff
• Fellowship among HNB staff and our staff is encouraged through regional staff get-togethers
• Partnering with HNB’s sustainable development project “Gami Pubuduwa” through our Micro Insurance scheme
• Being an active participant in promotional campaigns carried jointly with HNB Leasing
ReinsurersIt is our Reinsurers who enable us to accept the risks of others. Without their continuous support and guidance, we would not have been able to come such a long way in business in a short period like 9 years. We follow stringent criteria in selecting our Reinsurer panel.
• Key criteria used :
• Sound fi nancial strength of the reinsurer
• Reputation
• Minimum fi nancial rating of ‘A-’ and above given by S & P or AM Best (in excess of IBSL requirement)
• Their presence, experience and abilities in the region
• Relationship maintained with us
Our Reinsurer panel and their credit ratings are given on page 131.
Suppliers Open and transparent procedures are used in selecting all our suppliers. Strict criteria are used to select suppliers who directly interact with our customers and continuous checks are performed to ensure the quality of their service.
• Assessors - No. of Assessors as at 31st Dec 2010 - 97 ( 2009 - 90)
• Only qualifi ed degree/ diploma holders are appointed to our assessor panel
• We provide continuous training to enhance their skills
• Camera phones are provided for damage inspections so that images could be transmitted instantly
• Assessor fees are directly credited to their bank accounts for their convenience
• Recommended Laboratories/Hospitals - No. of Laboratories/Hospitals as at 31st Dec 2010 - 134 ( 2009 - 115)
• Selected through a rigorous process. Selection criteria include;
* Inspection and recommendation by Head offi ce/branch
* Inspection of certifi cates
* Rates
• Service levels and adherence to instructions checked via random checks and mystery visits by Head offi ce staff
Those found to be performing below the standard expected are removed from the list.
• Recommended Vehicle Repair Centres/Garages - No. of Garages as at 31st Dec 2010 - 52 ( 2009 - 53)• Selection after inspection by our Motor Claims Department
• Name boards provided to assist our Customers in identifi cation
A Winner at the Mid-Year Awards
Sustainability Report

81HNB ASSURANCE PLC ANNUAL REPORT 2010
CustomersWe strive to delight our Customers as they are the key to our existence. They have chosen us as their insurance partner and we consider it our duty to meet their needs or exceed their expectations by offering innovative, customised insurance solutions, professionally with a spirit of caring. This is the prime focus of our Life and General Insurance products and our service levels.
We are committed to provide innovative, customised solutions to our Customers, professionally with a spirit of caring.
Engaging Our Customers
• SMS alerts Our Customers are informed of their policy status, renewal due dates, information regarding damage inspection, etc. via SMS
(commenced during the year).
• Customer newsletters We send periodic newsletters to keep them updated on Company news.
• Response to web inquiries All inquiries made through our website (via [email protected]) are responded to within 24 hours.
• 24 hour Call Centre at our Customer Relations Centre (CRC) Our 24 hour call centre at the Customer Relations Centre is established to receive intimations of accidents and telephone inquiries.
These will be responded to effi ciently and relevant action taken. During the year, we invested heavily in this area to equip our staff with world class facilities in order to ensure service beyond expectations to all our customers or potential customers.
Our CRC helpline is 011-4 883 883.
• Need analysis prior to issuing Life policies
Prior to issuing Life Insurance policies, our advisors perform a need analysis to correctly identify customer needs. Comprehensive training has been given to advisors in respect of this area and completion of relevant documentation before issuing policies is compulsory.
• Cross Functional Product Development Committees
Customer needs are identifi ed by Cross Functional Product Development Committees and products are developed to cater to those needs. The Company’s Actuaries are also consulted in this process prior to the development of the products.
General InsuranceOur General Insurance Customers span from small retail clients who purchase a specifi c type of policy to large institutional clients whose entire insurance needs are satisfi ed by a portfolio of our products. In addition to our standard products, we are well equipped to customise products to cater to the exact needs of customers. Our key General Insurance products are given on page 32 to 39 of the Management Discussion and Analysis.
Life InsuranceOur Life Insurance products are designed to offer complete Life Insurance solutions based on the varying needs of customers, ranging from those who seek an attractive return on their long-term investments to seasonal income earners and micro insurance customers. Our key Life Insurance products are given on page 40 to 44 of the Management Discussion and Analysis.
Our Advisors conduct a need analysis prior to selling our Life Insurance products to ensure that we meet the exact needs of our Customers.
Padmasiri RanawakaarachchiGeneral Manager (Operations)Lanka Ceramic PLC
“Our relationship with HNB Assurance dates back to its inception. Initially we selected them due to our longstanding relationship with their parent, HNB but soon we realised their personalised and highly professional service offered at very competitive rates truly exceeds our expectations. “

82
Innovation
We are committed to offering innovative products and enhancements to existing products to suit the exact needs of our Customers.
• General Insurance
• ‘Navoda’ our combined insurance solution for small scale businesses was redesigned with pricing changes to be in line with market rates.
• ‘Ran Madura’, a policy offering protection for dwelling houses was re-launched as ‘Thanga Maligai’ for the benefi t of our Tamil speaking customers.
• Life Insurance
• This year we expanded the scope of Mortgage Reducing Policies (MRP) which were conventionally offered on long term housing loans, to cover personal loans as well. This is offered specifi cally for personal loans from HNB; dependants are safeguarded in the case of the Policyholder’s death or permanent disability.
• Identifying the need for higher returns on investments amid falling interest rates, we took the initiative to offer the third series of ‘Super 4’ Single Premium Investment Policy which guaranteed an attractive return on a four year investment along with a life cover and a unique interim payment at the end of two years.
• ‘Ran Aswanu’ a unique policy which never lapses was re-launched as ‘Thanga Aruwadai’ for the convenience of our Tamil speaking customers. Designed for seasonal income earners, customers could stop after paying one premium or continue to pay fl exible premiums as and when they wish. We also added a critical illness cover to the initial life and disability covers offered.
Service Enhancements
• Online help desk
All inquiries, complaints and suggestions made via email, telephone or fax are channelled through our Customer Relations Centre (CRC) Online help desk. Persons responsible in the particular area will automatically be assigned the task and notifi cations given to supervisors if service standards are not met, enabling us to maintain a high level of customer service. Initiated fi rst with the Life Division with CRC being responsible for follow up, this will be expanded to General and other divisions in 2011.
• Better service through technology
• Mobile technology – To leverage on the improvements in mobile technology and the popularity of mobile telephone use, several initiatives were taken to serve our customers better.
- Fast and accurate information is sent to customers via text messages regarding Life policy status, premium notice, Motor renewal notice, etc. Advisors are able to check policy status through SMS inquiry.
- Text (SMS) alerts to customer and relevant branch offi cer when claim payment is credited to customer’s bank account
• Other Service improvements for our Motor Insurance customers are discussed in detail on page 36 of the Management Discussion and Analysis.
• All Life and General Insurance products have been migrated to the new centralised core insurance application (TCS Bancs). Migration of the Finance module is currently in progress.
- All types of policies can now be issued from branches enabling us to add value through decentralisation
- Accurate information is readily available at Head Offi ce and throughout the branch network, enabling a better and faster service
Re- branding products - Thanga Maligai and
Thanga Aruwadai
Effi cient service from our Motor Claims Department
Sustainability Report

83HNB ASSURANCE PLC ANNUAL REPORT 2010
• Island-wide distribution network and service points
• Our customers can now access us through our branch network totalling 51 branches at the year end (2009 – 47) with the addition of four new branches. Our branches are spread out across 23 districts covering all provinces of the country and our presence in the North and East is very strong with 9 branches in the region.
• A total of 98 Bancassurance offi cers are stationed at HNB branches island wide, which together with our own branches add up to 152 service points for our customers including our Head offi ce, the customer desk at HNB Towers and our Customer Relations Centre (CRC).
• We are able to serve customers through our 1401 strong Field Force, HNB branches in every corner of the country and all insurance Brokers and fi nancial institutions island-wide who are affi liated with us.
• We also relocated 3 branches to more spacious premises whilst expanding another for the convenience of our customers.
New Branches Relocations Expansions
Nelliady Galle Matara
Manipay Kurunegala
Thambuththegama Batticaloa Balangoda
• Restructuring the General Division
The General Division was restructured to align underwriting and claims operations with the regional branch structure. Dedicated staff members are assigned to service each region, facilitating a more effi cient service to our customers. A fully integrated Motor Claims Department was established by merging the Motor Engineering Department with the Motor Claims.
• Talent pool for General Insurance underwriting
Aimed at enhancing the skills and knowledge of our underwriting staff, a talent pool was formed this year with the creation of the General Insurance Academy. Specialised training sessions are conducted by our own experienced senior staff members for Basic, Intermediate and Advanced levels. As this is open to the entire staff of the Company, the knowledge imparted would help enhance service levels to all our Customers.
In addition, pooling data through the intranet has also widened, making our customers the ultimate benefi ciary.
• Region-wise trainings - General and Life
General Insurance underwriting and claims handling training programmes were organised for all 5 regions of the Company to improve the technical competency and knowledge on claims handling procedure in both Motor and Non- Motor classes.
Life Insurance underwriting and claims handling training programmes were also conducted for branch network staff of all 5 regions.
In addition we also provided trainings on using our new system, TCS Bancs, throughout the country.
Opening of the Nelliady Branch
• Over 150 service points island wide
• Facility for premium payment from any HNB branch
• Standing order from any credit card
• Standing order from any bank account
• Online via www.hnbassurance.com• 0% installment plan for HNB credit card
holders
• Direct credit of claim payments to bank accounts of HNB account holders
• Updates via text messages (SMS)
• 24 hr call centre and online help desk
• Onsite claim settlements made by our Fast Track Claims Settlement

84
Dhammika Kalapuge
“The mere signifi cance which I noticed while working with HNB Assurance was that setting up this customer service culture was initiated by the CEO and the top management. Moreover, they were present at every programme, which was conducted across the company to all staff members, to assure support and the guidance needed to establish this service culture. The enthusiasm demonstrated by all at all levels at the learning sessions made the fact evident that they are going to achieve the desired response from this initiative. I was pleased that I had the opportunity to associate with such a company that continues to make a difference in the society.”
• Customer service training
Our commitment to deliver a superior level of service to our Customers was solidifi ed through the training conducted by Mr. Dhammika Kalapuge on Customer Service Excellence, for all our Employees throughout the island. Participation of every employee was mandatory and members of the EXCO were present at all training sessions facilitating a two way discussion on employee concerns and suggestions on customer service. A high level of enthusiastic participation during group work and discussions was a feature of this programme.
• Focus on the North and East
As one of corporate strategies in year 2010, we recruited more Tamil speaking employees during the year to focus on customers in the North and East as well as to provide clear communications to all our Tamil speaking customers, whilst better understanding their needs. Now all divisions in the Company have at least one employee fl uent in Tamil especially at decision making level. In line with these objectives, job focused Tamil training programmes were also conducted for staff in both executive and non-executive grades.
• Recruitment of a new Head of Distribution
We created a new position and recruited a Head of Distribution to lead our distribution network under the guidance of our General Manager, Marketing and Distribution. We believe this would enhance the service levels we provide to our customers in regions by ensuring a closer monitoring of the distribution network.
• Streamlining claims and payments processes
We are currently in the process of streamlining and removing bottlenecks in our claims and payments processes which would result in a more effi cient customer service.
• Faster, effi cient and accurate claim estimations
• Assessors are deployed for accident inspections within set standard time frames after intimation (within 30 minutes is the expected standard) and communication between customer, CRC and assessor is made through telephone and text messages.
• Upon inspection and mobile upload of photographs, Assessors use the new data base of spare part prices to provide more accurate claim estimations, enabling our customers to get a realistic idea about the claim amount and the cost of repair.
• We maintain a database of Approved Suppliers island-wide who would deliver spare parts to any garage upon our request.
• Fair and hassle free claims settlement
• Our prime responsibility is to support our customers in a spirit of caring when their risks become unfortunate realities. Consequently, we not only honour all claims that are within our terms and conditions but the management considers humanitarian reasons and settles claims even if policy conditions are breached in certain cases. This process is handled through the Claims Panel with the involvement of the top management.
• To relieve customers of the hassle of waiting for or collecting claim payment cheques, we have introduced a direct credit facility to the customers’ bank accounts upon their consent. At present this is only offered to HNB account holders but we hope to expand it to account holders in other banks in future. When payments are made we also notify the customer via text messages.
Sustainability Report

85HNB ASSURANCE PLC ANNUAL REPORT 2010
Awareness Creation on Insurance
Creating awareness on the benefi ts of insurance for individuals or businesses is a key area of concern. Our fi eld promotional staff visit even remote villages to educate the general public - 149 towns and villages (2009 – 199) were covered this year. We visited 5 preschools to convey this message to parents and also visited 3 garment factories to educate their young employees on the insurance needs of youth through a promotional campaign on ‘mylife’. The Company has also committed its support towards the public awareness campaign that will be launched in 2011 by the Insurance Association of Sri Lanka (IASL).
Rewarding Our Customers
Every year we celebrate our anniversary by rewarding a number of customers that matches the number of our anniversary year. During the year, while celebrating our 9th anniversary, 5 Life insurance Policyholders and 4 General Insurance Policyholders became the lucky recipients of return air tickets to popular tourist destinations.
Products for Social Benefi t
We are committed to uplifting the living standards of fellow citizens, especially those who are low income earners.
• Our Micro Insurance cover offered for HNB’s ‘Gami Pubuduwa’ loans is designed purely with this purpose in mind. Not confi ning to simply settling the loan amount in case of the Policyholders’ demise, we also pay the entire sum assured to their dependants to tide them over their diffi culties.
• ‘Sathkara’ a co-branded product with SEEDS, the micro-fi nance arm of the Sarvodaya Movement, is available for its members. Customers can opt for policies with or without maturity values. Financial benefi ts are also provided for Policyholders’ children on reaching important milestones in their education.
• ‘Saviya’ is yet another product affordable even to very low-income earners such as estate workers and daily pay casual workers.
ms%hka;s,;d l=ud˙ uy;añh
^Tmamq ysñ - CIqø rCIK&
“HNB weIQjrkaia wdh;kfhka ug ,enQk
rlaIK wdjrKh ksid jHdmdrh oshQKQ
lrkak uu .;a; Kh uQo, ys;g nrla
jQfka kE' ta ksid ys; ksoyiska jHdmdrh
oshQKQ lrkak ug yels jQkd' wms jf.A fmdä
ñksiaiQkAg †hqKq fjkAk msgQjy,lA fjk
HNB weIQjrkaiA jf.A wdh;k wmsg;A
rgg;A f,dl= YlA;shlA'”
Field promotions

86
CommunityHNB Assurance has gained respect over the years for being a socially responsible corporate citizen, closely partnering the people of Sri Lanka towards common progress. We are unwavering and passionate about lending a helping hand to the community within which we operate, which has contributed tremendously to make us who we are today. We have demonstrated our strong commitment towards society through our efforts to meaningfully enrich lives and meet the needs of the society. We attempt to fulfi l our responsibility and duty towards society by means of community investment projects and sponsorships. We proudly say that our Company has built a trusting and steadfast relationship with all communities over the years.
While our core business of insurance is in itself a responsibility towards society, we have also made signifi cant contributions to a variety of segments in society through our initiatives in education, health, and arts and culture.
As a socially responsible corporate citizen we are committed to catering to the needs of our Community. We are committed to facilitating basic needs such as water, education and health. Promoting arts and culture is another core focus.
Engaging with Our CommunityWe engage with our community in different ways. A vastly expanded distribution network and advisor force, activities and initiatives through visits made by our propaganda vehicle island wide, our website and regular press releases are a few of our customer engagement points. Community needs are identifi ed through all these sources and we intervene where possible to fulfi l them.
;s<sKs osfkaIsld
m%Odk YsIH kdhsld
uQ;=lKAâh mshjr II lKsgQ ú≥y,
§wm c,h ,nd.;Af;A mdif,A ;sfnk fmd¥
<sf|kah' fuu <sf|a c,h mdhk ld,hg is|S
hhs' túg wm c,h ,nd.;af;A mdi, wjg
ksfjia j,skah' fï <sf|ka c,h ,nd.ekSug
l=vd <uQkag wmyiqh' l=vd kx.s,d u,a,s,d
c,h ,nd.ekSug hkúg Tjqkaf.a fnda;,A o
<s|g jegQKs'
Tn wdh;kh úiska wmg ,nd¥ka fuu
c, k< moaO;sh ksid wm mdif,a f,dl=u
¥IAlr;djhlaj ;snq mdkSh c, wjYH;djh
imqrd ,Su ms<snoj wm mdif,a isiQka
fjkQfjka uy;A lD;{ fjñ'¶
Sustainability Report

87HNB ASSURANCE PLC ANNUAL REPORT 2010
A Drop of WaterIn 2008, we set ‘making clean water and sanitation accessible to under privileged schools in the country’ as a CSR goal of HNB Assurance. Since then, providing clean water to quench the thirst of students in remote schools has become one of the major ongoing community projects of our Company. We screen remote schools where students have no access to purifi ed drinking water and take measures to establish a supply of water to fulfi l this basic need.
During the year in review, we came forward to facilitate safe drinking water to fi ve needy schools, a project from which their students have benefi ted enormously.
In Moneragala, we provided safe drinking water to the Muthukandiya Kanishta Vidyalaya which our Monaragala branch identifi ed as a school in need of our assistance. Around 130 students at this school were forced to use deep wells to meet their water requirements. We constructed a water supply line connected to the main line and installed taps and sinks which has helped the children to avoid the dangers associated with drawing water from such deep wells.
In Kilinochchi, we targeted the Kilinochchi Hindu Primary Vidyalayam, which is the main primary school in the vicinity and is home to 390 students. The school was displaced during the war and has only found a permanent resettlement recently, but it continued to be deprived of basic facilities. The deep well they had on the premises was not at all suitable for primary students and getting water for day to day needs had become a challenge to these small children. We were able to install taps and other facilities in the school so that these young students were no longer deprived of this basic need.
In Anuradhapura, we provided safe drinking water systems to Vellaragama Kanishta Vidyalaya and Thiriyankulama Vidyalaya, two schools catering to the educational needs of around 200 students in total. Most of the students in these two schools are from very low income earning families who have no means to assist in the development of the schools. Through our initiative both schools now have proper water supply lines and water storage facilities from which the students benefi t immensely.
We also helped K/ Iddamalpahana Maha Vidyalaya, Atala which is a school providing education to around 260 students in the Kegalle district. This school had no pipe borne water system or even a tank to store the water collected from a nearby spring.
EducationEducation is a prerequisite to building a harmonious society; it opens the doors for better prospects in life and in careers. Thousands of underprivileged students face many obstacles to their education due to a lack of resources and we are committed to help at least some of these students with an opportunity to improve their lives through better education. Our Kalutara branch staff identifi ed 28 such deserving children at Ukgalbooda Maha Vidyalaya, Kalutara and donated all the books and equipment they required to commemorate the 10th anniversary of the branch.
St. Mary’s Pre School, Seeduwa is another such centre of education which was identifi ed as a place in need of fi nancial
K/Iddamalpana Maha VidyalayaKegalle
K/Iddamalpana Maha Vidyalaya is the alma mater of around 260 girls and boys in the Kegalle District. Although the students of this school are eager learners, their school could only provide them with very basic facilities; even the drinking water was collected from a nearby spring. These children and their teachers had no way of storing the water or using it in a convenient manner due to the lack of a water tank and a proper pipe borne water system.
As a continuation of our initiative to provide water to needy schools, we at HNB Assurance decided to step in and provide these children with this basic facility.
Now, every section of the school has access to water through pipe lines and a water tank is also available. The magnitude of the importance of this facility is best displayed by the students forming a “Water Management Committee” to protect this facility.
Happy faces at play – Children’s Park at G/Dombagoda Maha Vidyalaya

88
assistance. Upon a request made by the Zonta Club III of Colombo, we identifi ed that the pre-school was at risk of being shut down due to lack of funds. The school provides high quality pre-school education at a comparatively low fee of Rs. 300/- per month and therefore attracted a vast number of underprivileged students whose parents were unable to afford even the low fees levied. We took measures to lend a hand by providing fi nancial assistance to run the preschool for a period of one year.
Children’s ParkChildren’s recreation is also given top priority in our community investments. We focus on children in remote areas not only to enrich their living standards, but also to bring a smile to their little faces. One such initiative was to refurbish and improve the facilities at the children’s park of G/ Dombagoda Maha Vidyalaya which was in bad condition. The delighted little faces enjoying the newly opened park refl ected the impact it had on them.
Helping the Differently AbledWe believe we have a duty to provide opportunities to differently abled children to be treated with equality and inclusivity. The Company looked in to the needs of the children at the Nuffi eld School for the Deaf and Blind in Kaithadi, Jaffna and found that many of them did not have proper facilities for a good night’s rest. We stepped in and facilitated the provision of 25 beds and mattresses to enhance the comforts available to these children.
UN DayThe 65th UN Day Celebration held in Colombo was sponsored by HNB Assurance for the 6th consecutive year with Honourable Prof. G. L. Peiris, Minister of External Affairs as the chief guest and Mr. Neil Buhne, Resident Representative of the United Nations as the guest of honour. A large number of children representing all parts of the island were recognised for winning oratorical, essay and quiz competitions held by the United Nations Association of Sri Lanka. We are humbled by our ability to bring happiness to a large gathering of students by this action, which has now become an annual event in the HNB Assurance calendar as well.
A good night’s rest for the differently abled
Mohamed Zawahir Secretary GeneralUnited Nations Association of Sri Lanka
“Being the principal sponsors of this event HNB Assurance PLC has always come forward in making this event a success particularly at a time when our country was going through business diffi culties. This clearly outlines the commitment of this organisation and their people towards creating people of value to the progress of our nation. This is a towering strength to all of us at the Association not only for their valuable fi nancial contribution but also in the active involvement in organising an event of this magnitude.”
Upali SenanayakePrincipal , G/ Dombagoda Maha VidyalayaTiththagalle, Ahangama
“After the renovation of our Children’s Park, our students come to school more eagerly and spend their school hours with greater enthusiasm. This has also helped a rapid development in our school whilst adding beauty to the school grounds.”
Sustainability Report

89HNB ASSURANCE PLC ANNUAL REPORT 2010
Arts and CultureThroughout the years we have proven our passion and commitment towards the protection and promotion of Sri Lankan Arts and Culture. We fi rmly believe that the arts and culture lay a solid foundation for a civilized society, instilling and sharpening human values and moulding good citizens, paving the way for an enlightened society. Therefore, we have made a serious effort to encourage and uplift arts and culture in Sri Lanka.
For the 3rd consecutive year we made our sincere contribution to ‘Pehesara Kala Ulela’, which is an event organised by a group of volunteers in Thawalama, an extremely remote area in Galle district.
We also continued to extend our generous support to Lanka Children’s and Youth Theatre Foundation (LCYTF) which strives to inculcate positive values in children and youth through the creative arts. This year’s Youth Drama Festival featuring three award winning stage dramas – Vikurthi, Gladiator Premaya and Sanda Langa Maranaya, was held at Lionel Wendt Theatre and attracted a large gathering.
The Company co-sponsored the 5th mega album, ‘Sara Sihina’ by our brand ambassadors, Bathiya & Santhush. This album featuring Bathiya & Santhush along with renowned Indian artistes Asha Bosle and Hariharan is a valuable contribution to the music industry in Sri Lanka and was launched at a well-attended event.
Media coverage of the Chennai Vesak celebrations organised by the Mahabodhi Society was sponsored by the Company considering the importance of this religious as well as cultural event. Donations to places of worship of all major religions in the country were also made during the year.
Somalatha SubasingheFounding Director of Lanka Children’s and Youth Theatre Foundation
“At a time when the commercial sector in Sri Lanka was almost reluctant to support the artistic national culture of the country, the gesture of sponsorship by HNB Assurance to us is greatly encouraging and so we the LCTYF has been able to tread forward with our regular service to the cause of children and youth theatre of the nation as well as theatre at large. The regular annual festival is a symbol of appreciation and recognition artistes need and it has carried to the nation the message of invaluable contribution theatre can make to the development of the younger generation. Our sincere gratitude and appreciation to the aesthetic and humane vision of HNB Assurance. “

90
Further, our Welfare Society organised “SWARA”, a concert featuring four renowned Sri Lankan classical artistes, Neela Wickremesinghe, Amarasiri Peris, T. M. Jayaratne and Victor Ratnayake with music by Suresh Maliyadda and team, especially for the fans of classical music. The event was held at the Ananda College auditorium with the participation of about 800 music lovers.
HealthIn keeping with our tradition of helping to save lives by supporting the National Blood Bank, we organised a blood donation campaign for the 5th consecutive year. Our sincere appreciation go to the 203 noble donors who participated in this life saving event.
We also donated medical equipment to the Paediatric Ward of the General Hospital, Kegalle. This hospital is the main hospital in the district from which patients from all parts of the district including remote villages benefi t. Renovation of the surgical ward of the Jaffna Hospital started last year was also completed this year.
Further, we offered a sponsorship for the Annual Fund Raiser of Mahamaya Girl’s College Past Pupils Association (Colombo Branch) to be utilised towards the needs of the Nephrology - Renal Transplant Unit of the Teaching Hospital Kandy. This hospital is presently the largest facility in Sri Lanka that has a regular renal transplant programme.
Also, our welfare society undertook to install a shelter at the entrance to the Medical Intensive Care Unit of the Paediatric Ward of the Lady Ridgway Hospital, which will be completed within the current year.
Our Company also participated in the 2010 Colours of Courage Cricket Tournament organised by the Colours of Courage Trust to support the National Cancer Institute. The National Cancer Institute, Maharagama is the only government owned hospital in Sri Lanka where patients from all over the island come for medication for this serious illness and therefore continued support for this institution is vital to provide adequate facilities to their needs.
Pehesara Kala Ulela
We sponsored the ‘Pehesara Kala Ulela’, a touching event organized by a group of volunteers in Thawalama, an extremely remote area off Galle. Amidst great fi nancial diffi culties, this annual event is organised with a genuine wish to inspire the rural community to get involved in arts and culture and thereby identify and sharpen their own skills and talents. At the same time, three renowned artistes - Lucian Bulathsinhala, Jayalath Manoratne and Nissanka Diddeniya - were recognised for their invaluable contributions towards the enrichment of performing arts
An evening of classical music - SWARADonations to places of worship
Medical equipment for the Kegalle Hospital
Sustainability Report

91HNB ASSURANCE PLC ANNUAL REPORT 2010
EntrepreneurshipWe acknowledge the need to recognise and reward Sri Lankan entrepreneurs to encourage to contribute positively to the country’s economy. Thus, we partnered with the Federation of Chambers of Commerce and Industry of Sri Lanka (FCCSL) by sponsoring the “Young Entrepreneur of the Year” awards category of the Sri Lankan Entrepreneur of the Year, 15th Annual Awards. In addition to the National level winners, Regional Entrepreneurs were also recognised at 4 provincial level awards ceremonies covering all provinces of the country held in Vavuniya, Ratnapura, Kurunegala and Hambantota in collaboration with Regional Chambers of Commerce. The gala national event at which Mr Richard Jayatissa Managing Director of Richard Trading Company (Pvt) Ltd. was crowned the Sri Lankan Entrepreneur of the year 2010 and Mr D Marlon Ferreira of Exterminators (Pvt) Ltd. was recognised with the Young Entrepreneur of the year 2010 award was held at the BMICH under the auspicious of the Honourable D.M. Jayaratne, Prime Minister of Sri Lanka.
EnvironmentAs an insurance service provider, drastic changes in the environment leading to heavy rains, fl oods or droughts present challenges to our business operations. We are committed to safeguarding our environment not merely because of this reason, but also because all of us have a duty to protect our environment which gives life to all earth’s living beings. No fi nes or sanctions were imposed on the Company for non-compliance with environmental laws and regulations during the year.
We strive to conduct our business activities in an eco-friendly manner and aid in safeguarding our environment.
Energy Saving InitiativesWe continue to implement and improve on the energy saving initiatives started last year, and have also rolled out some new initiatives this year:• Removal of one 20w fl uorescent tube each from all three panelled fi ttings• Only laptops or computers with LCD monitors which consume less
energy are purchased upon new computer requests• Replacement of monitors with LCD screens • Automatic switching off of monitors to standby mode after a specifi ed time• Virtualisation of servers to maximise energy saving.• Switching off of all unnecessary lights and air conditioners after standard offi ce hours. • Fixing standard times for staff transportation after late work, saving fuel
Conservation of TreesWe aim to reduce the number of trees that are being felled because of our actions and the initiatives taken include;
• Strict use of reusable envelopes for all internal communications (each envelope can be used up to 40 times)
• Using both sides of paper and recycling used paper - we entered into an agreement with Neptune Papers (Private) Limited to collect and recycle our used paper towards the latter part of the year. Savings from the said initiative within a short period of time in the current year are shown in the table.
Sri Lankan Entrepreneur of the Year Awards - 2010
Dr. Ananda GunasekaraDirectorNational Blood Transfusion Services
“It’s with great pleasure that we inform you that, we at the National Blood Transfusion Services regard, HNB Assurance and its employees as a valuable asset to the National Blood Bank. Their enthusiasm and commitment in organising annual blood donation drives through the past fi ve years are very much appreciated as it helped us to fi nd much needed blood donors and to save many lives.
Type Savings made
Trees 41Water 78,337 litresElectricity 9860 KilowattsOil 4326 litresLandfi ll 7 cubic metres

92
Green ITWe continue leveraging on technology and conform to the concept of Green IT to transform our business operations to an eco-friendly platform. Several steps were taken to use information technology and communication systems effi ciently and effectively in order to reduce the impact on the environment.
• 7 servers were virtualised during the year, and 23 more servers are identifi ed for virtualisation
• Minimising paper usage through a department-wise request tracking system (online help desk) which eliminates the need to maintain duplicate copies and to maintain printouts of requests made via email
• Paper size unifi cation to reduce paper wastage and the need to use several types of printers, thereby conserving energy.
• Conversion to e-docs with the adoption of TCS Bancs, eliminating the need to print documents thereby saving paper, energy and storage space
• Leave application system in Head offi ce is now computerised and completely paperless
• Communication with both internal and external parties is made via email on all possible occasions, saving both paper and energy
• Mobile photo upload facility used by 31% of our assessors renders the development of photos unnecessary, thereby reducing the release of harmful chemicals to the environment and saving energy in the process
• Adoption of workfl ow driven requests and approvals for internal processes is currently initiated to eliminate the use of paper and energy, while minimising the usage of storage space via the introduction of e-documents
• We hope to expand the request tracker to other divisions and build a remote receipting facility in 2011 along with more server virtualisations
Conservation of Eco-systemsIn addition to the initiatives taken to protect our environment in our day to day operations, this year we decided to get actively involved in environmental conservation outside our business activities. This will be implemented through the erection of sign boards around the Bolgoda Lake Environmental Protection Area. The objective of this initiative is to create awareness among the peripheral community about the legal status and the importance of conserving this eco-system which is the largest natural water body in the Western Province of Sri Lanka. The Bolgoda Lake system has also been declared as an Environmental Protection Area by the Central Environmental Authority upon whose request this initiative was launched.
Sustainability Report

93HNB ASSURANCE PLC ANNUAL REPORT 2010
Stakeholder Indicator 2010 2009 2008
Customers Number of active policies
General Insurance
Life Insurance
195,439
79,321
129,796
70,485
75,559
65,982
Value of Insurance Claims and Benefi ts – net (paid and outstanding)
Rs.648 million Rs.512 million Rs.408 million
Number of branches 51 47 43
Number of new products 3 3 Nil
Our staff located in HNB Branches 98 74 29
Number of customers who won return air tickets 9 8 7
Maximum rate of Bonus to life policyholders (per Rs. 1,000/- sum assured)
Rs.50/- Rs.45/- Rs.40/-
Percentage of onsite claim inspections 97% 96% 73%
Number of employees given training on customer service
All employees 40 46
Number of villages/towns visited by our propaganda vehicle
149 199 120
Number of customer news letters 1 1 1
Customer feedback surveys - 1 -
Number of web inquiries 787 553 10
Number of customer complaints received 365 429 284
Number of customer complaints settled 284 319 229
Number of third party cases settled 23 4 2
Employees Number of employees 597 540 457
Employee forums
CEO’s forum
Management Meetings
Distribution Management Meetings
6
4
5
9
3
5
4
4
6
Employee recognitions
Chairman’s Awards
Five year completion awards
7
29
7
22
7
51
Number of Employees who received assistance for Insurance examinations 42 68 78
Employees eligible for insurance covers 100% 100% 100%
Number of employees appraised
(all confi rmed employees are appraised twice a year) 430 395 345
Attendance at the Staff Conference 97% 96% 96%
Employees’ participation at in-house, out bound, local - external and overseas training programmes are available on
Page 72 Page 72 -
Analysis of employees on age, gender and service are available on
Page 69 - -
Key Performance Indicators
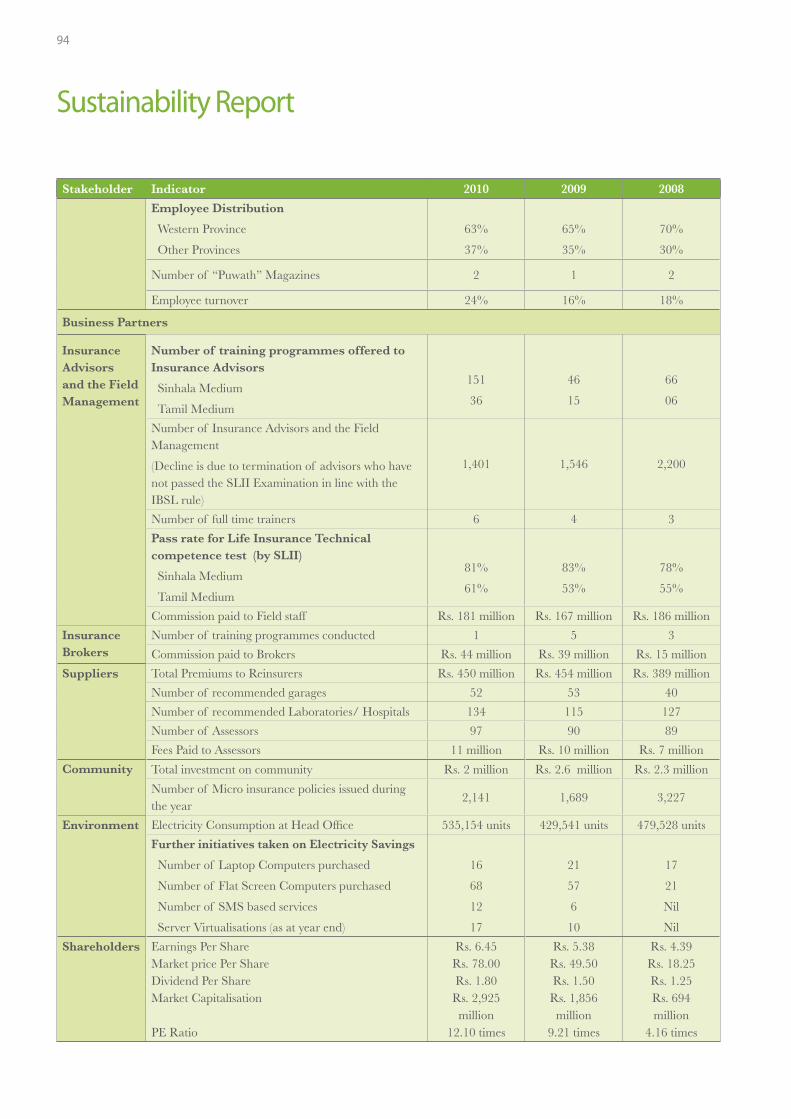
94
Stakeholder Indicator 2010 2009 2008
Employee Distribution
Western Province
Other Provinces
63%
37%
65%
35%
70%
30%
Number of “Puwath” Magazines 2 1 2
Employee turnover 24% 16% 18%
Business Partners
Insurance Advisors and the Field Management
Number of training programmes offered to Insurance Advisors
Sinhala Medium
Tamil Medium
151
36
46
15
66
06
Number of Insurance Advisors and the Field Management
(Decline is due to termination of advisors who have not passed the SLII Examination in line with the IBSL rule)
1,401 1,546 2,200
Number of full time trainers 6 4 3
Pass rate for Life Insurance Technical competence test (by SLII)
Sinhala Medium
Tamil Medium
81%
61%
83%
53%
78%
55%
Commission paid to Field staff Rs. 181 million Rs. 167 million Rs. 186 million
Insurance Brokers
Number of training programmes conducted 1 5 3
Commission paid to Brokers Rs. 44 million Rs. 39 million Rs. 15 million
Suppliers Total Premiums to Reinsurers Rs. 450 million Rs. 454 million Rs. 389 million
Number of recommended garages 52 53 40
Number of recommended Laboratories/ Hospitals 134 115 127
Number of Assessors 97 90 89
Fees Paid to Assessors 11 million Rs. 10 million Rs. 7 million
Community Total investment on community Rs. 2 million Rs. 2.6 million Rs. 2.3 million
Number of Micro insurance policies issued during the year
2,141 1,689 3,227
Environment Electricity Consumption at Head Offi ce 535,154 units 429,541 units 479,528 units
Further initiatives taken on Electricity Savings
Number of Laptop Computers purchased
Number of Flat Screen Computers purchased
Number of SMS based services
Server Virtualisations (as at year end)
16
68
12
17
21
57
6
10
17
21
Nil
Nil
Shareholders Earnings Per ShareMarket price Per ShareDividend Per ShareMarket Capitalisation
PE Ratio
Rs. 6.45Rs. 78.00Rs. 1.80Rs. 2,925 million
12.10 times
Rs. 5.38Rs. 49.50Rs. 1.50Rs. 1,856 million
9.21 times
Rs. 4.39Rs. 18.25Rs. 1.25Rs. 694 million
4.16 times
Sustainability Report

95HNB ASSURANCE PLC ANNUAL REPORT 2010
Index No:
GRI Indicator Report SectionPage No:
1. Strategy and Analysis
1.1 Statement from the Managing Director/CEO Managing Director’s Statement 56
1.2 Description of key impacts, risks and opportunities
Chairman’s Message
Managing Director’s Review
Management Discussion & Analysis
Risk Management
6 - 7
8 - 11
20 - 54
127 - 138
2. Organisational Profi le
2.1 Name of the organisation Corporate Information 3
2.2 Primary brands, products and/or services Management Discussion & Analysis 32 - 44
2.3 Operational structure of the organisationCorporate Governance Report - Company Structure
100
2.4 Location of organisation’s headquarters Corporate Information 3
2.5 Number and name of countries with operations Only in Sri Lanka
2.6 Nature of ownership and legal form Corporate Information 3
2.7 Markets served Management Discussion & Analysis 49 - 51
2.8 Scale of the reporting organisation Sustainability Report - Organisational Profi le 57
2.9 Signifi cant changes during the reporting period Sustainability Report - Organisational Profi le 57
2.10 Awards received in the reporting period Sustainability Report - Shareholders 68
3. Report Parameters – Report Profi le
3.1 Reporting period Sustainability Report - Scope and Boundary 58
3.2 Date of most recent previous report Sustainability Report - Report Profi le 58
3.3 Reporting cycle Sustainability Report - Report Profi le 58
3.4 Contact point Sustainability Report - Report Profi le 58
Report Parameters – Report Scope and Boundary
3.5 Defi ning report content Sustainability Report - Scope and Boundary 58 - 59
3.6 Report scope and boundary Sustainability Report - Scope and Boundary 58
3.7 Limitations on scope/boundary Sustainability Report - Scope and Boundary 58
3.8
Basis for reporting on joint ventures, subsidiaries, leased facilities, outsourced operations, and other entities that can signifi cantly affect comparability from period to period and/or between organisations
Sustainability Report - Scope and Boundary 58
3.9 Data measurement techniques Sustainability Report - Scope and Boundary 58 - 59
3.10 Explanation of the effect of any re-statements Sustainability Report - Scope and Boundary 58
3.11 Signifi cant changes Sustainability Report - Scope and Boundary 58
Report Parameters – GRI Content Index
3.12 Location of the Standard Disclosures in the report Global Reporting Initiative (GRI) G3 Index 95 -98
3.13 External assurance for the report No external assurance was obtained for this report
4. Governance and Commitments
4.1 Governance structure of the organisation Corporate Governance Report 100 - 126
4.2Indicate whether the Chairman of the Board is also an executive offi cer
Chairman is a Non-Executive Director. Corporate Governance Report
106 - 107
Global Reporting Initiative (GRI) G3 Index

96
Index No:
GRI Indicator Report SectionPage No:
4.3 Independent and/or Non-Executive Directors Annual Report of the Board of Directors 146
4.4Mechanisms for shareholders and employees to provide recommendations or direction to Board
Corporate Governance Report
Sustainability Report – Governance and Management/Stakeholder Engagement
100 -126
59 - 61
4.5Linkage between compensation for members of the highest governance body, senior managers, and executives, and the organisation’s performance
Corporate Governance Report
Remuneration Committee Report
112 - 114
143
4.6Processes in place for the highest governance body to ensure confl icts of interest are avoided
Disclosure of Directors’ Interest in Contracts 151
4.7Process for determining the qualifi cations and expertise of the members of the Board for guiding the organisation’s strategy
Nomination Committee Annual Report of the Board of DirectorsCorporate Governance Report
126145104 - 107
4.8
Statements of mission or values, codes of conduct and principles relevant to economic, environmental and social performance and the status of their implementation
Mission and Values
Sustainability Report
2
57 - 92
4.9
Procedures of the highest governance body for overseeing the organisation’s identifi cation and management of economic, environmental, and social performance, risks and opportunities, and adherence or compliance with internationally agreed standards, codes of conduct, and principles
Sustainability Report
Corporate Governance Report
57 - 92
100 - 126
4.10Processes for evaluating the highest governance body’s own performance, particularly with respect to economic, environmental, and social performance
Corporate Governance Report
Board appraisal to be done in year 2011
110
4.11Precautionary approach or principle is addressed by the organisation
Risk Management Report127 - 138
4.12 Externally developed principles, or other initiatives Sustainability Report – Governance 59 - 60
4.13 Memberships in associations Sustainability Report – Commitments 60
Stakeholder Engagement
4.14 List of stakeholder groups engaged by the Organisation Sustainability Report 62 - 63
4.15 Basis for identifi cation and selection of StakeholdersSustainability Report – Stakeholder Engagement
60 - 61
4.16 Approaches to stakeholder engagementSustainability Report – Stakeholder Engagement/ Each stakeholder group
60 - 6165 - 92
4.17Key topics and concerns that have been raised through stakeholder engagement
Sustainability Report 56 -92
Sustainability Report

97HNB ASSURANCE PLC ANNUAL REPORT 2010
Index No: GRI Indicator Status Page No:
Economic Performance Indicators
Disclosure on Management Approach 62 - 68
EC1 Direct economic value generated and distributed R 64 - 65
EC2 Financial Implications due to Climate Change R 91 - 92, 130
EC3 Coverage of the organisation’s defi ned benefi t plan obligations R 75
EC4 Signifi cant fi nancial assistance received from Government R 65
EC5 Standard entry level wage compared to local minimum wage (additional) R 74
EC8Development and impact of infrastructure investments and services provided primarily for public benefi t
R 86 - 91
EC9 Signifi cant indirect economic impacts (additional) R 65 - 92
Environmental Performance Indicators
Disclosure on Management Approach 62 - 63, 91 - 92
EN4 Indirect energy consumption by primary source R 94
EN5 Energy saved due to conservation and effi ciency improvements (additional) NM
EN7 Initiatives to reduce indirect energy consumption and reductions achieved ( additional) R 91 - 94
EN28Monetary value of signifi cant fi nes and total number of non-monetary sanctions for non-compliance with environmental laws and regulations
R91
Social Performance Indicators : Labour Practices & Decent Work
Disclosure on Management Approach 62 - 63, 68 - 92
LA1 Breakdown of total workforce R 69
LA2 Employee turnover R 70
LA3Benefi ts provided to full-time employees that are not provided to temporary/part-time employees (additional)
R 68 - 76
LA5Minimum notice period(s) regarding operational changes, including whether it is specifi ed in collective agreements
NM
LA6Percentage of total workforce represented in formal joint management-worker health and safety committees (additional)
R 76
LA7Rates of injury, occupational diseases, lost days and absenteeism, and of work-related fatalities by region
NM
LA8Education, training, counselling, prevention, and risk-control programmes in place to assist workforce members, their families, or community members regarding serious diseases
NM
LA10 Average hours of training per year per employee (additional) R 71
LA11 Programmes for skills management and lifelong learning R 71 - 74
LA12 Employees receiving regular performance and career development reviews (additional) R 74, 93
LA13 Employees according to diversity R 69
LA14 Basic salary of men and women R 74
Social Performance Indicators: Human Rights
Disclosure on Management Approach 62 - 63, 68 - 92
HR2Percentage of signifi cant suppliers and contractors that have undergone screening on human rights and actions taken
NM
HR4 Total number of incidents of discrimination and actions taken R 75
HR6 Operations identifi ed as having signifi cant risk for incidents of child labour R 75
HR7Operations identifi ed as having signifi cant risk for incidents of forced or compulsory labour
R75
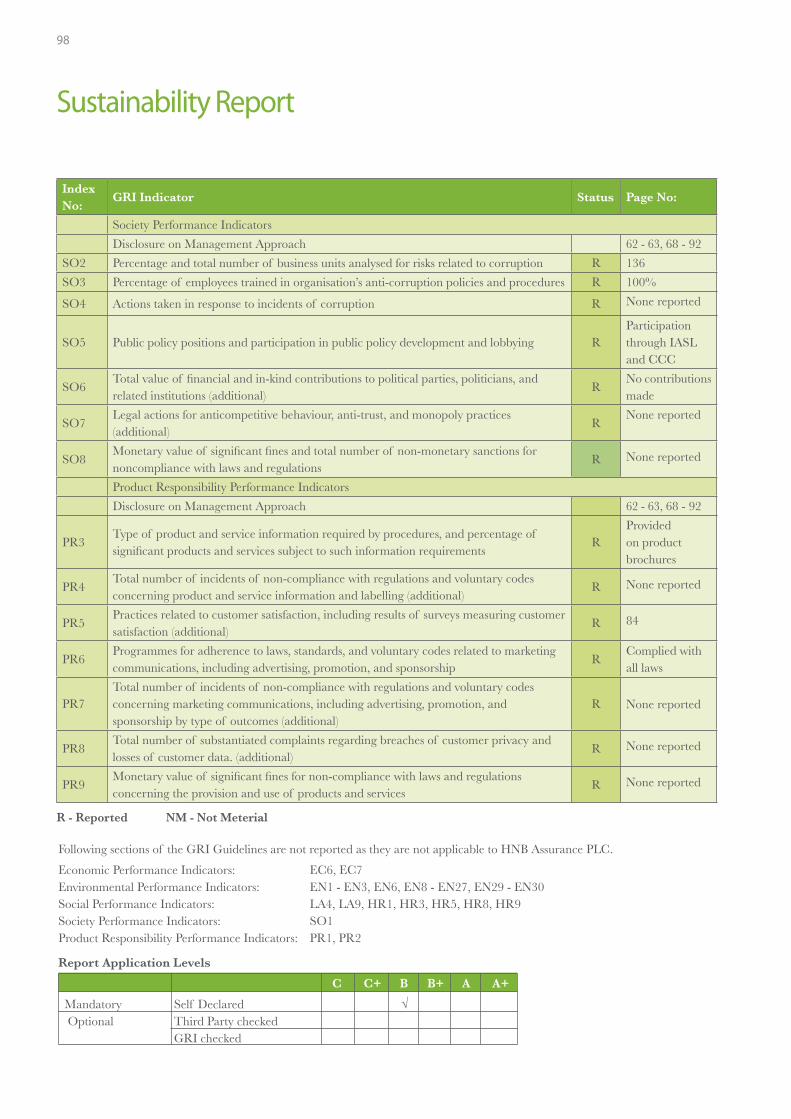
98
Index No:
GRI Indicator Status Page No:
Society Performance Indicators
Disclosure on Management Approach 62 - 63, 68 - 92
SO2 Percentage and total number of business units analysed for risks related to corruption R 136
SO3 Percentage of employees trained in organisation’s anti-corruption policies and procedures R 100%
SO4 Actions taken in response to incidents of corruption R None reported
SO5 Public policy positions and participation in public policy development and lobbying RParticipationthrough IASL and CCC
SO6Total value of fi nancial and in-kind contributions to political parties, politicians, and related institutions (additional)
RNo contributions made
SO7Legal actions for anticompetitive behaviour, anti-trust, and monopoly practices (additional)
RNone reported
SO8Monetary value of signifi cant fi nes and total number of non-monetary sanctions for noncompliance with laws and regulations
R None reported
Product Responsibility Performance Indicators
Disclosure on Management Approach 62 - 63, 68 - 92
PR3Type of product and service information required by procedures, and percentage of signifi cant products and services subject to such information requirements
RProvided on product brochures
PR4Total number of incidents of non-compliance with regulations and voluntary codes concerning product and service information and labelling (additional)
R None reported
PR5Practices related to customer satisfaction, including results of surveys measuring customer satisfaction (additional)
R 84
PR6Programmes for adherence to laws, standards, and voluntary codes related to marketing communications, including advertising, promotion, and sponsorship
RComplied with all laws
PR7Total number of incidents of non-compliance with regulations and voluntary codes concerning marketing communications, including advertising, promotion, and sponsorship by type of outcomes (additional)
R None reported
PR8Total number of substantiated complaints regarding breaches of customer privacy and losses of customer data. (additional)
R None reported
PR9Monetary value of signifi cant fi nes for non-compliance with laws and regulations concerning the provision and use of products and services
R None reported
Sustainability Report
Following sections of the GRI Guidelines are not reported as they are not applicable to HNB Assurance PLC.
Economic Performance Indicators: EC6, EC7Environmental Performance Indicators: EN1 - EN3, EN6, EN8 - EN27, EN29 - EN30 Social Performance Indicators: LA4, LA9, HR1, HR3, HR5, HR8, HR9Society Performance Indicators: SO1Product Responsibility Performance Indicators: PR1, PR2
Report Application Levels
C C+ B B+ A A+
Mandatory Self Declared √ Optional Third Party checked GRI checked
R - Reported NM - Not Meterial

Corporate Governance& Risk Management

100
Corporate Governance
What is Good Governance?
Governance is the act of exercising power and decision-making for a group of people. It happens everywhere – from urban centres to rural villages – and the well-being of a community depends on the choices made by those people who are vested with the authority to govern.
Good Governance has become a widely discussed subject today in every corner of the world. Good governance is, in short, a situation in which authority and its institutions are accountable, effective and effi cient, participatory, transparent, responsive, consensus-oriented, and equitable. In recent years, the need to institutionalise strong governance systems in both the public sector and private enterprise has become a widely discussed subject. It is commonly agreed that good governance is integral to economic growth, the eradication of poverty, hunger and inequality, and sustainable development. For good governance to exist in both theory and practice, citizens must be empowered to participate in meaningful ways in decision-making processes.
Good governance is a prerequisite for the effective and effi cient functioning of every government, corporation, NGO, society, association, etc. Thus, Governance within an entity can defi nitely contribute towards enhancing the overall performance of an organisation.
What is Corporate Governance?
Corporate Governance deals with the manner in which rights and responsibilities are shared among the managers, directors and shareholders of a corporate entity. The exact structure of how Corporate Governance is carried out will determine what rights, responsibilities and privileges are extended to each of the corporate participants, and the degree to which each participant may enjoy those rights.
In essence, Corporate Governance revolves around ensuring that the objectives of all stakeholders of a corporate entity are considered and reasonably met. At HNB Assurance, we believe in Corporate Governance as a pillar of success and thus take all possible measures to make sure all stakeholders are recognised equitably. This commitment of caring for everybody is ingrained even in our Vision, which is “to be Sri Lanka’s most admired and trusted partner in meeting insurance needs professionally with a spirit of caring”.
In pursuing the Corporate Objectives, we are committed to the highest level of governance and strive to foster a culture that values and rewards exemplary ethical standards, personal and corporate integrity and respect for others. Our approach to Governance is fi rmly based on the belief that Good Corporate Governance is the glue that binds responsible business practices,
which ensures positive workplace management, marketplace responsibility, environmental stewardship, community engagement, and sustained fi nancial performance.
The following diagram depicts the Governance Structure of HNBA.
The Board of Directors (BOD), as the body responsible to stakeholders for the sustainable development of the Company, recognises Corporate Governance as one of their most critical responsibilities. Accordingly, the Board together with the management has proven their commitment to effective Corporate Governance through several measures, such as -
• Forming a Board comprising professionals who have vast knowledge and experience in different areas of expertise
• Appointing three Independent Non-Executive Directors out of eight Non-Executive Directors, which is over and above the regulatory requirement
• Ensuring substantial compliance with the Code of Best Practice on Corporate Governance issued jointly by the Institute of Chartered Accountants of Sri Lanka (ICASL) and Securities and Exchange Commission of Sri Lanka (SEC), and full compliance with the Rules on Corporate Governance published by the Colombo Stock Exchange (CSE).

101HNB ASSURANCE PLC ANNUAL REPORT 2010
• Assigning board responsibilities to four Board Sub Committees, to make sure that the Board oversees the Company’s operations effectively and demonstrates the commitment to transparency in all dealings. Such committees are;
• Audit Committee • Nomination Committee• Remuneration Committee • Investment Committee
• Introducing ‘Audit Committee evaluation procedures’ to improve the performance of the Audit Committee. Performance of the Audit Committee was evaluated by the members themselves and the Executive Committee.
• Performing a voluntary Interim Audit (though not mandatory) for the six months ended 30th June 2010 to obtain an independent opinion on Company’s fi nancial performance and internal controls
• Publishing the Company’s Quarterly Financial Statements in newspapers and circulating same to all shareholders even though it is no longer a mandatory requirement
• Complying with all laws applicable to the Company and settling all taxes and dues to regulatory authorities on time without a single exception
• Encouraging all members of the Company to demonstrate integrity and transparency in all their activities both at Company and personal level.
The Company’s commitment to Corporate Governance was further affi rmed when our Corporate Governance disclosures in the Annual Report of 2009 won us second place in the Corporate Governance Disclosure category at the South Asian Federation of Accountants (SAFA) Best Presented Accounts Awards 2010 held in Kathmandu, Nepal.
At HNBA, it is our belief that compliance with Corporate Governance requirements demonstrates the Company’s commitment to transparency and accountability. We also believe that it supports us to stay strong and to grow rapidly in a highly competitive and dynamic environment. Better Corporate Governance makes our business better managed and directed in a more transparent and accountable manner, which in turn makes us more attractive to our stakeholders.
Our Compliance with the Laws
As discussed above, we have taken every possible action to ensure compliance with the Laws and Best Practices on Corporate Governance. We are very proud to say that HNBA is substantially compliant with the code of best practice on Corporate Governance issued jointly by the SEC and ICASL. In addition, we have achieved fully compliant status with the applicable sections of the Listing Rules on Corporate Governance issued by the CSE.
Our status of compliance with each section of the Code of Best Practice on Corporate Governance issued jointly by ICASL and SEC is outlined below. We have also included a table which summarises the Company’s compliance status with Rule No. 7.10 of the Listing Rules of the CSE on pages 124 and 125.
We trust that this Report will assist you to gain a better understanding on how Corporate Governance works at HNB Assurance PLC. As an organisation which believes in transparency and accountability as the key to success, we welcome your valuable feedback as it is important for us to continuously improve our Corporate Governance framework. Please contact us on;
E-mail - [email protected]
Address - HNB Assurance PLC 10, Sri Uttarananda Mawatha, Colombo 03, Sri Lanka.
Website - www.hnbassurance.com
Compliance with the Code of Best Practice on Corporate Governance Issued Jointly by the SEC and the ICASL
The above code was issued in 2008 with the objective of establishing good Corporate Governance practices in Sri Lanka. The code deals with six key areas which a Company should focus on when developing the Corporate Governance structure of that company.
A. DirectorsB. Directors’ Remuneration C. Relations with ShareholdersD. Accountability and Audit
E. Institutional Shareholders F. Other Investors
As discussed above, HNB Assurance is fully committed to be compliant with the Code. During the last few years, the Company has been taking a number of initiatives in order to achieve this target and at present it is substantially complete. The Company’s commitment to compliance with the Code is discussed below in detail, under each of the criteria required by the Code. We continuously review our Corporate Governance principles and practices not only to improve our Corporate Governance framework but also to ensure that it remains relevant.
Focuses on the Company
Focuses on the Shareholders
}}
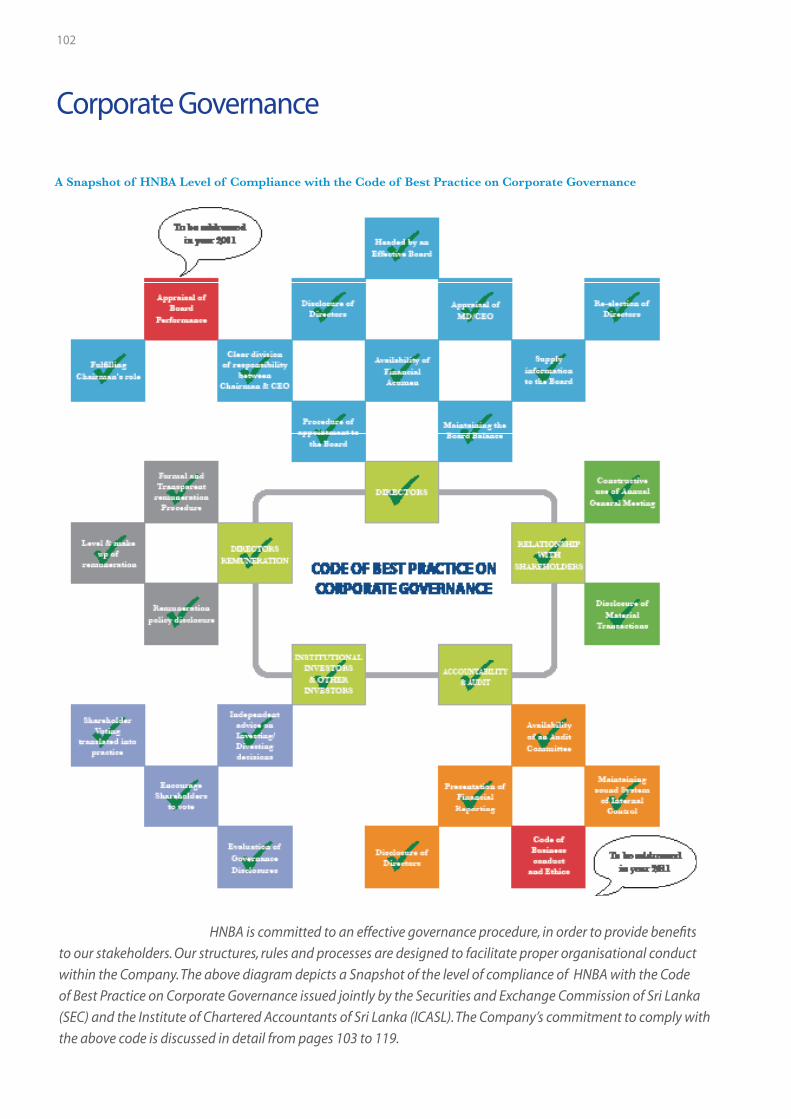
102
Corporate Governance
HNBA is committed to an effective governance procedure, in order to provide benefi ts
to our stakeholders. Our structures, rules and processes are designed to facilitate proper organisational conduct
within the Company. The above diagram depicts a Snapshot of the level of compliance of HNBA with the Code
of Best Practice on Corporate Governance issued jointly by the Securities and Exchange Commission of Sri Lanka
(SEC) and the Institute of Chartered Accountants of Sri Lanka (ICASL). The Company’s commitment to comply with
the above code is discussed in detail from pages 103 to 119.
A Snapshot of HNBA Level of Compliance with the Code of Best Practice on Corporate Governance

103HNB ASSURANCE PLC ANNUAL REPORT 2010
SectionNo. Principle Company’s CommitmentCompliance
Status
The Board comprises nine Directors including Executive, Non-Executive and Independent Non- Executive Directors. The Managing Director is the only Executive Director on the Board.
The Board meets once a month to review the Company’s performance and to determine whether its strategies and business practices are in line with the expectations of the Board as well as other stakeholders. It may hold additional meetings as and when necessary.
The names of the Directors of the Company who held offi ce as at the year end, together with a brief description of their profi les are presented on page 12 to 14, of this Annual Report.
The Board’s main role is to provide entrepreneurial leadership to the Company through a prudent and effective process.
The Board has delegated the responsibility and the authority to achieve the corporate objectives to the Managing Director/CEO.
The Board monitors the decisions and actions of the Managing Director/CEO and the performance of the business to gain assurance that progress is being made towards the achievement of corporate objectives.
Key performance indicators are used to monitor the progress at Board meetings held every month.
Compliant
Compliant
1 THE COMPANY
A DIRECTORS
A.1 THE BOARD
Every public company should be headed by an effective Board.
The Board should meet regularly (at least once every quarter).
During the year the Board met on 12 occasions.
The following sub-committees also meet on a regular basis.
• Audit Committee (5 times) • Remuneration Committee (2 times)
The number of Board meetings and subcommittee meetings held during 2010 together with individual attendance of board members is given on page 147.
A.1.1
The Board has taken the full responsibility for the overall success of the Company. The Board is involved in formulating the overall strategy and makes sure the same is implemented through the MD/CEO. Compliant
The Board should,
• ensure formulation and implementation of a sound business strategy.
MD/CEO together with the management team develops corporate strategies, annual budgets, and the business plan in line with the overall strategy for each year. The corporate plan is approved by the Board every year and achievement of the objectives set in the plan is monitored very closely by the Board.
A Non-Executive Director sits with the management every quarter and reviews the effectiveness of implementation of the set strategies.
A.1.2
HNBA Compliance with the Code of Best Practice on Corporate Governance issued jointly by the SEC and ICASL
The Board actively works to ensure that MD/CEO and the management team continue to have the right balance of skills, experience, and knowledge necessary to discharge their responsibilities in accordance with the highest standards of governance.
Compliant• ensure that MD/CEO and
the management team possess the necessary skills, experience and knowledge for effective implementation of the strategy.
The Board gets involved in the recruitment of the senior management, paying due attention to knowledge, skills and experience.

104
SectionNo. Principle Company’s CommitmentCompliance
Status
Succession plans are in place for all members of the senior management and have been tabled at a meeting of the Remuneration Committee. The key aspect of the succession plan is to develop internal people in order to ensure that there are adequate options available internally to replace key
Effective systems and procedures are in place to ensure integrity of information, internal controls and information security. Such systems are continuously monitored by the management, internal and external auditors, and at times by independent experts in relevant areas.
The Board ensures that the Company adheres to the highest ethical standards in compliance with all statutory requirements.
Compliant
Compliant
Compliant
• adopt effective CEO and senior management succession strategy.
• ensure effective systems are in place to secure integrity of information, internal controls and risk management.
• ensure that the Company activities are conducted in compliance with laws, regulations and ethical standards.
The qualifi cations of the MD/CEO, Executive Committee (EXCO) members and the Management Team are provided on page 15 to 17.
During the year, the Executive Committee (EXCO) was strengthened by increasing its composition from four members to seven members. New members brought into the EXCO are;
- Head of IT - Head of Corporate Business Development - Head of Finance
In addition, the Company recruited a new Head of Distribution during the year to strengthen the management of the distribution network.
personnel when required to ensure smooth transition and business continuity. The Company culture is designed to identify and develop internal personnel to fi ll key positions whenever possible.
Also, effective mechanisms are in place to identify, assess and manage/mitigate risks faced by the Company. Please refer the Risk Management section on page 127 to 138 for further information.
The Board monitors this process closely through the Audit Committee and the Investment Committee.
The Company has appointed a Manager - Legal and Compliance, who reports to the Audit Committee on a quarterly basis for continuous monitoring of the level of compliance with laws and regulations.
A compliance checklist covering all applicable laws and regulations is signed off by the management on a quarterly basis and tabled at the Audit Committee meetings.
The Company has also issued a Code of Ethics applicable to all employees. Refer pages 117 and 118 for details.
The Board ensures that the rights of all stakeholders are considered and safeguarded in making corporate decisions. Details are discussed under Sustainability Reporting on pages 56 to 98.
Compliant• ensure that all stakeholder
interests are considered in corporate decisions.
As a measure of the Company’s success in this regard, the Company was awarded second place in the Small Scale category at the ACCA Annual Sustainability Reporting Awards 2010.
Corporate Governance

105HNB ASSURANCE PLC ANNUAL REPORT 2010
SectionNo. Principle Company’s CommitmentCompliance
Status
The Board takes all its decisions paying due attention to the interests of all stakeholders. Also the Board intervenes where necessary in any other function that is vital, given the scale, nature and the complexity of the Company’s business.
As mentioned above, the Board is collectively and individually devoted to ensure full compliance with all laws and regulations applicable to the Company.
All Directors are permitted to seek independent professional advice at the Company’s expense if considered appropriate and necessary, at any time, which could be coordinated through the Company Secretary.
The Company’s accounting policies are fully in line with Sri Lanka Accounting Standards. Accounting policies are reviewed annually to be in line with the changing business requirements, evolving international and local accounting standards and best practices in the industry.
There were no changes in accounting policies during the year under review.
Compliant
Compliant
Compliant
• fulfi l other Board functions that are vital, given the scale, nature and complexity of the business concerned.
The Board collectively, and Directors individually, must act in accordance with the laws of the country. Also there should be a procedure for Directors to obtain independent professional advice where necessary.
• ensure that the Company’s values and standards are set with emphasis on adopting appropriate accounting policies and fostering compliance with fi nancial regulations.
However, the Institute of Chartered Accountants of Sri Lanka has issued a new Volume of Sri Lanka Accounting Standards which will become applicable for fi nancial periods beginning on or after 1st January 2012.
These will have a signifi cant impact on the Company’s fi nancials. The management is in the process of reviewing and measuring the impact of these standards on the Company.
Please refer Independent Auditor’s Report which affi rms that the Company’s Financial Statements are in line with Sri Lanka Accounting Standards, given on page 157.
In addition, signifi cant emphasis is placed on compliance with applicable fi nancial regulations such as IBSL rules and determinations, CSE and SEC rulings, CBSL rulings etc.
A.1.3
However, no such advice has been taken by any of the Directors during the period.
The Company Secretary, who is an Attorney-at-Law by profession, is accessible to any Director at any time. The Company Secretary advises the Board and ensures that matters concerning the Companies Act, Board procedures
CompliantAll Directors should have access to the advice and services of the Company Secretary.
and other applicable rules and regulations are followed. Removal of the Company Secretary has to be by a resolution involving the entire Board.
The Company Secretary possesses the required qualifi cations set out in the Companies Act, to discharge duties as a Company Secretary. Please refer Page 14 for the profi le of the Company Secretary.
A.1.4

106
SectionNo. Principle Company’s CommitmentCompliance
Status
The Board is conscious of its obligations to ensure that Directors avoid confl icts of interests (both real and apparent) between their duty to the Company and other interests.
Directors are expected to make decisions objectively and in the best interest of the Company. All Non-Executive Directors
CompliantAll Directors should bring independent judgment to bear on issues of strategy, performance, resources and standards of business conduct.
in particular are expected to bring independent judgment and scrutinise the decisions taken by the Board on issues of strategy, performance, resources and business conduct.
The Board of Directors is required to disclose all the transactions with the Company including those of their close family members as required by the Sri Lanka Accounting Standards - 30 and the Companies Act, No. 7 of 2007. This has been fully complied with and disclosed adequately in this Annual Report.
Please refer page 151 for information on related parties and Directors’ Interest in Contracts respectively.
A.1.5
The Board met 12 times during the year in addition to the various Board Sub Committee meetings held. Please refer page 147 to see the attendance of each Director at Board and Sub Committee meetings.
New Directors are inducted to the Board with comprehensive understanding of their duties and responsibilities. The Board acknowledges the need for continuous professional development and knowledge expansion to perform their duties as Directors.
Compliant
Compliant
Every Director should dedicate adequate time and effort to matters of the Board and the Company.
Every Director should receive appropriate training when fi rst appointed to the Board and subsequently as necessary.
Board and Sub-Committee meetings are conducted based on a formal agenda covering the main responsibilities and duties, which is prepared and circulated among all the Board or sub-committee members with adequate time for perusal.
In addition, the Board members have meetings and discussions with the management when required.
Accordingly, the Company facilitates appropriate knowledge sharing opportunities for both new and existing Directors on a continuous basis in respect of matters relating to the general aspects of directorships and matters specifi c to the industry and the Company.
Particularly, the Directors are constantly updated on the latest trends and issues facing the Company and the insurance industry in general. For instance, the Company facilitated the attendance of the Audit Committee Chairman at seminars on changes in Accounting Standards during the year.
A.1.6
A.1.7
A.2 CHAIRMAN AND CHIEF EXECUTIVE OFFICER (CEO)
The functions of the Chairman and the Managing Director/CEO are clearly separated to ensure a balance of power and authority.
The positions of the Chairman and the Managing Director/CEO are separated.
Compliant
Not Applicable
There should be a clear division of responsibilities at the head of the Company.
If the positions of Chairman and the CEO are combined, the fact needs to be disclosed.
A.2.1
The Chairman is responsible for providing effective leadership to the Board whilst the MD/CEO is responsible for ensuring the effective functioning of day to day operations and the achievement of fi nancial and non-fi nancial objectives agreed annually with the Board.
Corporate Governance

107HNB ASSURANCE PLC ANNUAL REPORT 2010
SectionNo. Principle Company’s CommitmentCompliance
Status
The Chairman is responsible for leading the Board and ensuring that it operates at the highest standards of governance. The Chairman is charged with encouraging the effective participation of all directors in decision making processes and thereby ensuring effective performance of the Board.
The Board is made up of knowledgeable and experienced individuals for guidance on matters of fi nance. All Directors possess qualifi cations and/or experience in accounting and fi nance.
Members of our Board are;
The Chairman is a Non-Executive Director elected by the Board and has experience in performing the role of Chairman in other large corporate entities in the country including HNBA’s parent company. With his vast experience and knowledge, the Chairman provides effective leadership to the Board by,
• maintaining effective participation and contribution of both Executive and Non-Executive Directors,
• encouraging debate and constructive criticism,• setting agendas for meetings of the Board in conjunction
with the Company Secretary,• ensuring that adequate time is available for discussion on
strategic issues,• ensuring a proper balance of power between Executive and Non- Executive Directors,• representing the views of the Board to the shareholders
and public and • ensuring that the Board is in complete control of the
Company’s affairs.
Compliant
Compliant
Compliant
The Chairman should preserve order and facilitate effective discharge of Board functions.
The Board should ensure the availability within it of those with suffi cient fi nancial acumen and knowledge to offer guidance on matters of fi nance.
The Chairman should conduct Board proceedings in a proper manner and ensure, inter-alia, that
• the effective participation of both Executive and Non- Executive Directors is secured
• all Directors are encouraged to make an effective contribution
• a balance of power exists between Executive and Non- Executive Directors
• the views of Directors on issues under consideration are ascertained; and
• the Board is in complete control of the Company’s affairs.
A.3.1
A.4 FINANCIAL ACUMEN
A.3 CHAIRMAN ROLE
- Rienzie T. Wijetilleke FCIB (London), FIB (Sri Lanka) – Chairman (Banker with over 50 years of experience)
- Manjula de Silva BA Hons (Colombo), MBA (London), FCMA (UK) - Managing Director (Management Accountant with over 20 years of experience in Fund Management and Insurance)
- R Theagarajah FCMA (UK), FCA (Sri Lanka), MBA (Cranfi eld), FIB (Hon) Sri Lanka – Non-Executive Director (Chartered and Management Accountant with over 25 years of experience in banking)
- M U De Silva FCIB (London) – Non-Executive Director (Banker with over 40 years of experience)
- Pratapkumar de Silva FICM (Sri Lanka), FICM (England) – Independent Non-Executive Director (Fellow of the Institute of Credit Management with over 50 years of experience in fi nance sector)
- D M De S Wijeyeratne ACA (Sri Lanka) - Independent Non-Executive Director (Chartered Accountant and an experienced CFO)
- J M J Perera FCIB (London) - Non-Executive Director (Banker with over 35 years of experience)
- Sarath Ratwatte FCMA (UK) - Independent Non-Executive Director (Management Accountant and an experienced Treasurer)
- J D N Kekulawala FCIB (London), FCA (England & Wales), MBA (Manchester) - Non-Executive Director (Chartered Accountant, experienced CFO and a Banker with over 25 years of banking experience)
Brief profi les of each Board member can be found on pages 12 and 14.

108
SectionNo. Principle Company’s CommitmentCompliance
Status
The Board comprises eight Non-Executive Directors and one Executive Director who also functions as the Managing Director/CEO. Names of the Directors in each category are given on page 146.
CompliantThe Board should have a balance of Executive and Non-Executive Directors.
The Board has eight Non-Executive Directors which is far in excess of one third of the total number of Directors. Please refer page 12 to 14 for the profi les of these directors.
Of the eight Non-Executive Directors of the Company, Mr. Pratapkumar de Silva, Mr. D M de S Wijeyeratne and Mr. Sarath Ratwatte are independent Non- Executive Directors. Therefore, the number of Independent Non-Executive Directors is in excess of one third of Non-Executive Directors.
Compliant
Compliant
The Board should include at least two Non-Executive Directors or such number of Non-Executive Directors equivalent to one third of the total number of Directors, whichever is higher.
Two or one-third of Non- Executive Directors appointed to the Board, should be ‘Independent Non-Executive Directors’.
All three Independent Non-Executive Directors meet the criteria for independence as per the Rules and are deemed to be independent of management and free of any business or other relationship that could materially interfere with the exercise of their unfettered and independent judgment.
All Non-Executive Directors have submitted the declaration of independence or non-independence as per the Code of Best Practice on Corporate Governance and Listing Rules.
The Board, in its Annual Report has determined the Independence or non-independence of each director. This has been declared at the Board Meeting held on 31st January 2011.
The report is given on pages 145 to 150.
Since the roles of the Chairman and the CEO are separated, this requirement does not arise.
Compliant
Compliant
Compliant
Not Applicable
For a Director to be deemed ‘Independent’, such Director should be independent of management and free of any business or other relationship that could materially interfere with the exercise of their unfettered and independent judgment.
A declaration should be signed by each Non-Executive Director annually, stating independence or non-independence against specifi ed criteria.
The Board should make a determination of independence or non-independence of Directors based on the above declaration and other information available to the Board.
When the Chairman and the CEO is the same, the Board should appoint Independent Non-Executive Director to be the Senior Independent Director.
A.5 BOARD BALANCE
A.5.1
A.5.2
A.5.3
A.5.4
A.5.5
A.5.6
Corporate Governance

109HNB ASSURANCE PLC ANNUAL REPORT 2010
SectionNo. Principle Company’s CommitmentCompliance
Status
Please refer the comment above.
The Board meets at least once a year, without the presence of MD/CEO. One of the main areas of focus at this meeting is the performance of MD/CEO and to agree on his remuneration package.
Any other such meeting would be held on a need basis.
All decisions of the Board were taken unanimously and there were no such concerns raised by the Directors during the year, which needed to be recorded in the Board Minutes.
However, if there is such an incident, the Company policy is to record such concerns accordingly.
Not Applicable
Compliant
Compliant
The Senior Independent Director should make himself available for confi dential discussions with other Directors.
The Chairman should hold meetings with Non-Executive Directors, without the presence of the Executive Directors, at least once a year.
When Directors have concerns about the matters of the Company which cannot be unanimously resolved, they should be recorded in the Board Minutes.
A.5.7
A.5.8
A.5.9
The Management ensures that a set of information which is timely, accurate, relevant and comprehensive is provided to the Directors before the Board Meeting every month, with adequate time for Directors to review the same and prepare
When appointing new Directors, the Board adopts a formal and transparent procedure. However, no new Directors were appointed to the Board during the year.
All Board Papers and papers for Sub Committee meetings are circulated at least one week (seven days) prior to such meetings.
The Nomination Committee comprises four Directors including the Chairman and the MD/CEO.
The members are;
Compliant
Compliant
Compliant
Compliant
Management has an obligation to provide the Board with appropriate and timely information.
There should be a formal and transparent procedure for appointment of new Directors to the Board.
The minutes, agenda and papers required for a Board Meetings should be provided at least Seven days before the meeting.
A Nomination Committee should be established to make recommendations to the Board.
A.6.1
A.6.2
A.7.1
A.6 SUPPLY OF INFORMATION
A.7 APPOINTMENTS TO THE BOARD
for discussions. All signifi cant fi nancial and non-fi nancial information for the period is included in these analyses.
In addition, the Board requests additional information with respect to the Company’s operations, industry and competitors, risk management, laws and regulations, Corporate Governance etc. on a need basis.
- Rienzie T. Wijetilleke - Chairman - R Theagarajah - Member Non-Executive Director Non-Executive Director
- Manjula de Silva - Member - M U De Silva - Member Managing Director Non-Executive Director
Responsibilities and other information in respect of the Nomination Committee is disclosed on page 126.

110
SectionNo. Principle Company’s CommitmentCompliance
Status
The composition of the Board is subject to continuous review by the Nomination Committee, especially with regard to changes in environment and regulations. The Committee makes recommendations for new appointments where necessary.
CompliantAn annual assessment of the Board composition should be conducted by the Nomination Committee
A.7.2
After the last review, the Board was satisfi ed about the current composition of the Board and therefore the composition remained unchanged during the year 2010.
All appointments of new Directors are informed to the shareholders with suffi cient details, via immediate notifi cation to the Colombo Stock Exchange.
The Annual Report also carries details of new appointments of Directors together with a brief profi le of each Director.
According to the Articles of Association of the Company, each Director other than the MD/CEO and any nominee Director, retires by rotation and is required to stand for
Directors who have been appointed to the Board during the year, hold offi ce until the next AGM. They are required to retire and be re-elected by the Shareholders.
No new Directors were appointed to the Board during the year.
The performance of the Board and its Sub Committees are evaluated by the Chairman. The Audit Committee started a self-assessment process from the current year to ensure it functions effectively and effi ciently and discharges all its responsibilities as outlined in the Audit Committee Charter.
Compliant
Compliant
Compliant
To be fully
implemented in
year 2011
The Company should disclose information to the shareholders upon new appointments of Directors.
Non-Executive Directors should be appointed for specifi ed terms subject to re-election.
All Directors and Chairman should be subject to election by shareholders at the fi rst opportunity after the appointment and to re-election at regular intervals.
The Board should annually appraise its own performance in the discharge of key responsibilities.
A.7.3
A.8.1
A.8.2
A.9.1
All Directors should be required to submit themselves for re-election at regular intervals and at least once in every three years.
The Board should periodically appraise their own performance in order to ensure that Board responsibilities are satisfactorily discharged.
A.8 RE-ELECTION
A.9 APPRAISAL OF BOARD PERFORMANCE
re-election by the shareholders at the Annual General Meeting. The proposed re-election of Directors is subject to prior review by the full Board. Accordingly, Mr. M U de Silva retires by rotation at the AGM and offers himself for re-election under the Articles of Association of the Company. The Board has recommended his re-election.
Please refer the Notice of Meeting on page 208 for more information in this regard.
The self-assessment was carried out using a formal questionnaire covering all the responsibilities of the Committee.
In addition, the Executive Committee also carried out a performance review of the Audit Committee with the objective of facilitating continuous improvement of the role of the Audit Committee in the Company’s operations.
It is planned to expand this performance appraisal process to a 360 degree appraisal by getting Internal Auditors and External Auditors also involved in the year 2011.
Corporate Governance

111HNB ASSURANCE PLC ANNUAL REPORT 2010
SectionNo. Principle Company’s CommitmentCompliance
Status
As noted above, the Audit Committee started a self-assessment process for the year 2010. We have already planned to implement a formal appraisal procedure for the Board as well as for other Board Sub Committees in the year 2011.
The performance of the Audit Committee was evaluated based on the Audit Committee Charter. Main areas of focus were;
Required information in respect of Directors is disclosed in this Annual Report where relevant.
In consultation with the MD/CEO, the Board sets reasonable fi nancial and non-fi nancial targets to be achieved by the MD/CEO every year which are in line with short, medium and long term objectives of the Company. These Corporate Objectives are included in the Corporate Plan for the year which is reviewed and approved by the Board. The main areas of focus of the Corporate Plan 2010 were;
To be fully
implemented in
year 2011
Compliant
Compliant
The Board should undertake an annual self-evaluation of its own performance and that of its committees.
The Board should state in the Annual Report how such performance evaluations have been conducted.
Annual Report should contain details of all Directors.
The Board should set, with consultation of CEO, the fi nancial and non-fi nancial targets to be achieved by the CEO during the year in line with short, medium and long term objectives of the Company.
A.9.2
A.9.3
A.10.1
A.10
A.11.1
• Objective, Composition, Meetings, etc. • External Audit • Financial Reporting • Compliance and Litigation• Risk Management, Internal Control and Internal Audit • Other Responsibilities
However, as discussed above, performance evaluations should be extended to the Board and other Sub Committees, which we intend to do in the year 2011.
- The profi les of all Board members are provided on pages 12 to 14.- Details of Directors’ Interests in Contracts are provided on pages 151.- Details of related party transactions are provided on pages 188 and 190.- The composition of Board sub committees and attendance at Board meetings and Board sub-committee meetings
by each Director are provided on pages 126 and 147 respectively.
- Market Share - Profi tability- Dividend Payout - Underwriting Results- Premium Persistency - Reasonable remuneration to employees- Gross Written Premium for Life and General Insurance
The Board monitored the achievement of these targets throughout the year and provided guidance to the MD/CEO where necessary.
Shareholders should be kept advised of relevant details in respect of Directors.
The Board should be required, at least annually, to assess the performance of the MD/CEO.
DISCLOSURE OF INFORMATION IN RESPECT OF DIRECTORS
A.11 APPRAISAL OF MD/CEO
To be fully
implemented in
year 2011

112
SectionNo. Principle Company’s CommitmentCompliance
Status
Based on the agreed objectives described in A.11.1,the performance of the MD/CEO is evaluated by the Board at the end of each year.CompliantThe performance of the MD/
CEO should be evaluated by the Board at the end of each year.
A.11.2
A Remuneration Committee has been appointed and functions within agreed terms of reference.
The Main responsibility of the Remuneration Committee
All members of the Remuneration Committee are Non- Executive Directors. The Board appoints its Chairman.
Please refer Remuneration Committee Report on pages 143 and 144 for the functions of the Remuneration Committee.
Non- Executive Directors who are nominees of the parent company are paid a nominal fee and other Non-Executive Directors are remunerated in line with market practices, based on attendance at Board and Sub Committee meetings.
Members of the Committee are;- M U De Silva FCIB (London) - Chairman Non-Executive Director
Compliant
Compliant
Compliant
Board should set up a Remuneration Committee to make recommendations to the Board.
The Remuneration Committee should consist of Non-Executive Directors, accompanied by a Chairman.
Determination of Remuneration of Non-Executive Directors.
Members of the Remuneration committee should be listed in the Annual report.
B.1.1
B.1.2
B.1.4
B.1.3
is to assist the Board with regard to the remuneration policy of the Company. According to the Company policy, no Director or employee should get involved in deciding his/her own remuneration.
The MD/CEO and Assistant Manager – Human Resources participate in Remuneration Committee Meetings by invitation.
Remuneration Committee met twice during the year.
Please refer pages 143 and 144 for the Remuneration Committee Report.
Companies should establish a formal and transparent procedure for developing policies on executive remuneration and for fi xing the remuneration packages of individual Directors. No Director should be involved in deciding his/her own remuneration.
B DIRECTORS’ REMUNERATION
B.1 REMUNERATION PROCEDURE
- D M De S Wijeyeratne ACA - Member - Sarath Ratwatte FCMA (UK)- Member Independent Non-Executive Director Independent Non-Executive Director
Responsibilities and other information in respect of the Remuneration Committee are disclosed on page 126.
Compliant
The Committee consults the MD/CEO where necessary and has access to professional advice from within and outside the Company.
The Committee reviewed the results of the Employee Satisfaction Survey carried out during the year by an
CompliantRemuneration Committee can consult MD/CEO or outside consultant regarding the remuneration of Executive Directors.
B.1.5
external consultant (M/S MTI Consultants) and a few reports of Salary Surveys in which the Company participated. Information gathered from these sources was used when deciding the remuneration levels for the year 2011.
Corporate Governance

113HNB ASSURANCE PLC ANNUAL REPORT 2010
SectionNo. Principle Company’s CommitmentCompliance
Status
The remuneration package of the MD/CEO who is the only Executive Director is linked to corporate and individual performance.
The Remuneration Committee compares the remuneration levels of the Company with such packages of comparable companies in the industry and is sensitive to changes in the remuneration levels. It reviews reports of salary surveys periodically to get an assessment of comparable industry standards.
Remuneration Committee considers the group remuneration levels when deciding HNBA’s remuneration packages.
However in most cases, HNBA’s scales are not comparable with other companies in the Group as they operate in different industries.
As stated above, performance related elements of the remuneration package of MD/CEO and other executive employees are linked to corporate and individual performance.
The Company does not have any type of share option scheme for the employees, at present.
Compliant
Compliant
Compliant
Compliant
Not Applicable
Remuneration Committee should provide attractive packages to retain Executive Directors.
Remuneration Committee should set remuneration in line with industry standards and the Company performance.
Remuneration Committee should consider employment conditions and remuneration elsewhere in the Company or within the Group, when determining the remuneration levels.
Performance related elements of remuneration of Executive Directors should be aligned with the interest of the Company and main stakeholders.
Executive Share Options should not be offered at a discount.
B.2.1
B.2.2
B.2.3
B.2.4
B.2.5
Remuneration of all executive employees will be dependent on the achievement of personal objectives set at the beginning of the year and their individual performance on selected personal attributes. Remuneration of Non-Executive employees will be dependent only on their personal attributes.
The levels of remuneration of both Executive and Non- Executive Directors should be suffi cient to attract and retain the Directors needed to run the Company successfully. A proportion of Executive Directors’ remuneration should be structured to link rewards to corporate and individual performance.
B.2 THE LEVEL AND MAKE UP OF REMUNERATION
- The MD/CEO and employees at all levels are eligible for annual performance linked bonuses based on the achievement of Life and General business targets and profi tability targets.
- The Company does not have any long term incentive schemes, including share option schemes.
Compliant
Remuneration Committee should design a performance related remuneration scheme, in line with the provisions set in the standard.
B.2.6
- There are no pension schemes other than gratuity. The consequences on gratuity are considered when determining salary increases.
- Performance-related remuneration schemes are not applied retrospectively.
- Annual bonuses are not pensionable.
- Non-Executive Directors are not eligible for performance based remuneration schemes.

114
SectionNo. Principle Company’s CommitmentCompliance
Status
There are no terminal compensation commitments other than gratuity in the Company’s contracts of service.
The Company has a mechanism to record all proxy votes and proxy votes lodged on each resolution.
All Non-Executive Directors are paid only on his/her attendance at meetings.
Non-Executive Directors who are nominees of the parent company, are paid a nominal fee for their services.
Other Non-Executive Directors are remunerated in line with market practices.
Compliant
Compliant
Compliant
Compensation commitments on early termination.
Companies should count all Proxy Votes
Remuneration of Non-Executive Directors should refl ect the time, commitment and responsibilities of their role, in line with market practices.
B.2.7 & B.2.8
C.1.1
B.2.9
The aggregate remuneration paid to MD/CEO and Non- Executive Directors is disclosed on pages 188 to 190 of this report.
The Remuneration Committee’s report which highlights the remuneration policy of the Company is given on pages 143 and 144.
CompliantRemuneration policy and details of remuneration of the Board should be stated in the Annual Report.
B.3.1
The Company’s Annual Report should contain a Statement of Remuneration Policy and details of remuneration of the Board as a whole.
The Board should use the AGM to communicate with Shareholders and should encourage their participation.
B.3 DISCLOSURE OF REMUNERATION
C RELATIONS WITH SHAREHOLDERS
C.1 CONSTRUCTIVE USE OF THE ANNUAL GENERAL MEETING (AGM) AND CONDUCT OF GENERAL MEETINGS
Each substantially separate issue is proposed as a separate resolution.
The adoption of the Annual Report of the Board of Directors along with the Financial Statements is also proposed as a separate resolution.
CompliantCompanies should propose a separate resolution at the AGM on each substantially separate issue.
C.1.2
The Chairman of the Board makes sure that the Chairmen of Board Sub Committees, External Auditors, etc. are present at the AGM to answer any query by shareholders.
No queries were raised by shareholders to the Chairmen of the Sub Committees at the last AGM held on 30th March 2010.
CompliantThe Board Sub Committees’ Chairman should be available at the AGM to answer questions of the shareholders.
C.1.3
The Annual Report together with notice of meeting and related documents and other resolutions, if any, are circulated to the shareholders at least fi fteen (15) working days prior to the date of the AGM.Compliant
Companies should arrange for circulation of notice of meeting and related documents to shareholders before the meeting.
C.1.4
Corporate Governance

115HNB ASSURANCE PLC ANNUAL REPORT 2010
SectionNo. Principle Company’s CommitmentCompliance
Status
The proxy form which includes a summary of the procedures governing voting at the AGM is circulated to all shareholders as noted.
During the fi nancial year under review, there were no major transactions which materially affected/altered the Company’s net asset position.
Compliant
Compliant
Summary of procedures governing voting at the AGM should be circulated with every notice of General Meeting.
Directors should disclose all material facts of major transactions to the shareholders.
C.1.5
C.2.1
2009 Annual Report was submitted to the Colombo Stock Exchange on 24th February 2010 and posted to all shareholders by 1st March 2010. The AGM was held on 30th March 2010.
Please refer page 208 for the notice of meeting of the AGM 2011.
The latest Annual Report and Interim Financial Statements are published in the Company’s web site for the benefi t of other stakeholders.
The Company’s Financial Results are also published in leading newspapers on a quarterly basis as a demonstration of the Company’s commitment to transparency.
All material transactions i.e. which if entered into, would materially alter/vary the net asset value of the Company should be disclosed.
C.2 MAJOR TRANSACTIONS
However, if there were such transactions, it is the policy of the Company to disclose them in the Quarterly and Annual Financial Statements in accordance with relevant Sri Lanka Accounting Standards and the Companies Act.
Compliant
The Board should be responsible in presenting balanced and understandable Financial Statements, other price- sensitive public reports and reports to regulators.
D.1.1
D.1
D ACCOUNTABILITY AND AUDIT
All Regulatory Reports were fi led by the due dates.
Price sensitive information was also disclosed to the Colombo Stock Exchange on a timely basis during the year 2010.
The Company’s fi nancial position and prospects have been discussed in detail in the following reports:
• Chairman’s Message on pages 6 and 7.
• MD’s Review on pages 8 to 11.
• Management Discussion and Analysis (MD&A) on pages 20 to 54.
The Company presents its Financial Statements in line with Sri Lanka Accounting Standards and other applicable laws and regulations. The Company strives to provide a detailed and transparent analysis of performance and future strategies to enable investors to make informed decisions.
The Interim Annual Financial Statements were published on a timely basis during 2010.
Directors’ report contains a declaration by Directors addressing the areas given in the Code of Best Practice on Corporate Governance.CompliantDirectors’ Report should contain
declaration by the Directors.
D.1.2
FINANCIAL REPORTING
The Board should present a balanced and understandable assessment of the Company’s fi nancial position, performance and prospects.

116
SectionNo. Principle Company’s CommitmentCompliance
Status
Management Discussion and Analysis section is included in pages 20 to 54 covering all relevant areas.
The Board, after conducting necessary reviews and inquiries, decided to apply the ‘Going Concern’ assumption in preparing the Company’s Financial Statements for the year 2010.
Although the likelihood of such a situation is remote, if it arises, an EGM would be called to inform shareholders.
Page 147 contains the statement setting out the responsibilities of the Board for the preparation and presentation of Financial Statements.
Auditor’s Report is provided on page 157.
Compliant
Compliant
Compliant
Compliant
Annual Report should contain a Management Discussion and Analysis.
The Board should report that the business is a going concern.
Directors shall summon an EGM to notify shareholders, if net assets fall below one half of the shareholder’s funds.
Annual Report should contain a statement setting out the responsibilities of the Board for the preparation and presentation of fi nancial statements together with the Auditors’ Report.
D.1.4
D.1.5
D.1.6
D.1.3
The declaration of the Company as a “Going Concern” is given in the Directors’ Report on page 145.
The Board has overall responsibility for the system of internal controls and has delegated some of these responsibilities to the Board Audit Committee.CompliantThe Board should review the
effectiveness of the internal control system at least annually.
D.2.1
D.2
The Audit Committee closely monitors the internal controls system through various mechanisms. Some of these include;
- Review and agree on the Internal Audit and External Audit Plans and their scope
- Review the Company’s Risk Management Report with the assistance of the management and discuss and agree on further actions to be taken to mitigate identifi ed risks
- Review all Internal Audit Reports/ Management Letters and discuss issues/ concerns with the management and auditors where necessary
- Maintain an effective relationship with Internal/ External Auditors at all times
- Meet separately with Internal and External Auditors to discuss matters relating to the Company where necessary
The Company has appointed M/S Ernst & Young Advisory Services (Pvt) Ltd as the internal auditors for the Company. Also, Ernst & Young has been appointed as the IT Auditor to CompliantNeed for internal audit function.
Should be reviewed from time to time.
D.2.2
cover IT-related risk areas. All reports by internal auditors are fi led with the Audit Committee in a timely manner.
In addition, the Company is planning to establish a new department namely Internal Control and Compliance Department in the year 2011 in order to strengthen this area further.
INTERNAL CONTROL
The Board should maintain a sound system of internal controls to safeguard shareholders’ investments and Company’s assets.
Corporate Governance

117HNB ASSURANCE PLC ANNUAL REPORT 2010
SectionNo. Principle Company’s CommitmentCompliance
Status
The Audit Committee comprises three Directors, all of whom are Non-Executive. Also, two Directors of the Committee are Independent Non-Executive Directors.
The Audit Committee monitors and reviews the effectiveness of the Company’s Internal and External Audit functions and ensures proper coordination exists between all the relevant parties, so that the Company receives adequate services.
Compliant
Compliant
The Audit Committee should comprise Non-Executive Directors, a majority of whom should be independent.
Effectiveness of the audit and independence and objectivity of auditors should be reviewed by the Audit Committee
D.3.1
D.3.2
D.3 AUDIT COMMITTEE
The Board should establish formal and transparent arrangements for considering how they should select and apply accounting policies, fi nancial reporting and internal control principles and maintain an appropriate relationship with the Company’s auditors.
Also, in 2010, the Audit Committee conducted evaluations to ensure the integrity, competency and professionalism of auditors and concluded that no aspect of the auditor’s work was impaired due to lack of independence.
The Audit Committee has the primary responsibility for making recommendations on the appointment, re-appointment or removal of the External Auditor in-line with professional standards and regulatory requirements.
Further, the Company’s external auditor, M/S KPMG Ford, Rhodes, Thornton & Co. has given a declaration of its independence to the Audit Committee as per the relevant rules.
The Audit Committee operates with clearly defi ned terms of reference. Main areas of focus in the Audit Committee Charter are;
CompliantAudit committee should have a written Terms of Reference.
D.3.3
- Composition - Internal Audit- Meetings - External Audit- Financial Reporting - Compliance and litigation - Risk management and internal control - Reporting responsibilities- Other responsibilities
The summary of the duties of the Committee is provided on page 126.
CompliantNames of the Directors comprising the Audit Committee and their independence should be disclosed in the Annual Report.
D.3.4
- J D N Kekulawala FCIB (London), FCA (England & Wales), MBA (Manchester) - Member Non-Executive Director
The Audit Committee Report, which is given on pages 140 to 142, also highlights the names of the members, determination of independence of auditors and other information on relevant areas.
Members of the Audit Committee are;- D M De S Wijeyeratne ACA - Chairman Independent Non-Executive Director
- Sarath Ratwatte FCMA (UK) - Member Independent Non-Executive Director
D.4 CODE OF BUSINESS CONDUCT & ETHICS
Companies must adopt a Code of Business Conduct & Ethics for Directors and members of the senior management team and must promptly disclose any waivers of the Code by Directors or others.

118
SectionNo. Principle Company’s CommitmentCompliance
Status
The Company has adopted a Code of Business Conduct and Ethics for all its employees and has mandated that it should be followed without any exception. The Company is planning to issue a Code of Business Conduct and Ethics for the Board in the year 2011.
To be fully
implemented
in year 2011
Companies must adopt a Code of Business Conduct and Ethics for Directors and senior management
D.4.1
The code addresses areas such as - avoiding confl ict of interests - fair dealings- confi dentiality and privacy - proper use of computer systems- protection and proper use of Company assets - compliance with laws and regulations- communication with regulators and auditors - insider information- ethical business standards and fraudulent conduct - outside business activities- avoiding acceptance of expensive gifts, fees - political activities- trading of Company shares by employees - conduct in public, etc.- non-discrimination - duty of loyalty and communication of any misconduct or unethical behaviour
There were no material violations of the Code of Business Conduct and Ethics during the year except for certain insignifi cant fraudulent activities noted at operational level for which appropriate actions have been taken.
Please refer Annual Report of the Board of Directors on page 150 which affi rmed that there are no material violations of the Company’s Code of Business Conduct and Ethics during the year 2010.
The Board has implemented a systematic process supported by a culture in which compliance is at a maximum level with the provisions of the Code of Best Practice on Corporate Governance issued jointly by the ICASL and SEC and the
Compliant
Compliant
The Board must affi rm that there is no violation of provisions of the Code.
The Directors should include a Corporate Governance report in the Annual Report.
D.4.2
D.5.1
D.5
Rule No. 7.10 of Listing Rules issued on Corporate Governance by the CSE.
This report sets out the manner and extent to which the Company has complied with the principles and provisions of the above mentioned Codes and Rules. The Corporate Governance section can be found from pages 100 to page 126 of this Annual Report.
The Annual Report, Quarterly Financial Statements and the AGM are the main means of communication between the Company and the shareholders. The shareholders are always encouraged to participate and vote at the AGM.
CompliantListed companies should conduct regular and structured dialogue with shareholders.
E.1.1
Should ensure institutional shareholders’ voting intentions are translated into practice.
2 SHAREHOLDERS
E INSTITUTIONAL INVESTORS
E.1 Shareholders Voting
The Chairman ensures that the views expressed at the AGM are properly addressed.
CORPORATE GOVERNANCE DISCLOSURE
Directors should be required to disclose the extent to which the Company adheres to established principles and practices of good Corporate Governance.
Corporate Governance
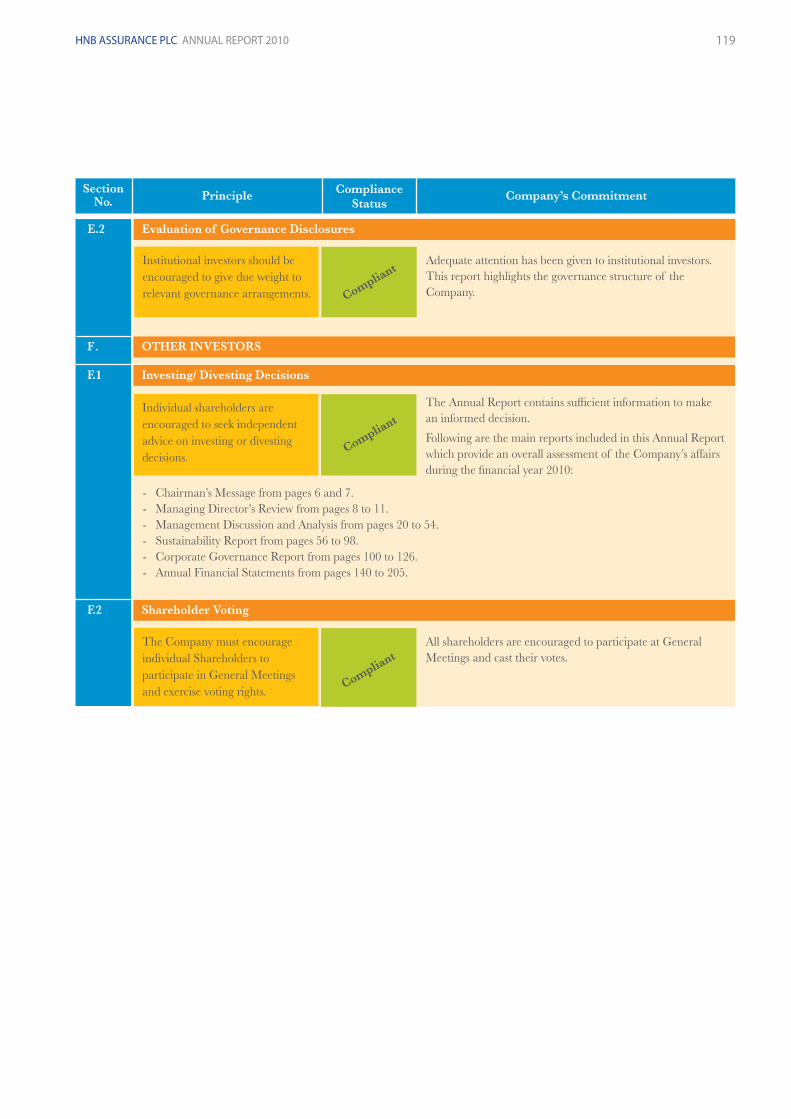
119HNB ASSURANCE PLC ANNUAL REPORT 2010
SectionNo. Principle Company’s CommitmentCompliance
Status
Adequate attention has been given to institutional investors. This report highlights the governance structure of the Company.Compliant
Institutional investors should be encouraged to give due weight to relevant governance arrangements.
E.2 Evaluation of Governance Disclosures
The Annual Report contains suffi cient information to make an informed decision.
Following are the main reports included in this Annual Report which provide an overall assessment of the Company’s affairs during the fi nancial year 2010:
All shareholders are encouraged to participate at General Meetings and cast their votes.
Compliant
Compliant
Individual shareholders are encouraged to seek independent advice on investing or divesting decisions.
The Company must encourage individual Shareholders to participate in General Meetings and exercise voting rights.
F . OTHER INVESTORS
F.1 Investing/ Divesting Decisions
F.2 Shareholder Voting
- Chairman’s Message from pages 6 and 7. - Managing Director’s Review from pages 8 to 11.- Management Discussion and Analysis from pages 20 to 54.- Sustainability Report from pages 56 to 98.- Corporate Governance Report from pages 100 to 126.- Annual Financial Statements from pages 140 to 205.

120
Other Aspects of Corporate Governance Initiatives
The following table demonstrates the other aspects of Corporate Governance at HNBA, apart from the Code of Best Practice on Corpo-rate Governance issued jointly by the ICASL and SEC.
INVESTMENT COMMITTEE
EXEUTIVE COMMITTEE (EXCO)
OPERATIONAL COMMITTEE (OPCOs)
The Investment Committee is chaired by a Non-Executive Director and comprises three other members including the Managing Director. Members of the Committee are;
- J D N Kekulawala FCIB (London), FCA (England & Wales), MBA (Manchester) – Chairman
Non-Executive Director
- Sarath Ratwatte FCMA (UK) – Member Independent Non-Executive Director
- Manjula de Silva BA Hons (Colombo), MBA (London), FCMA (UK) – Member
Managing Director
- Rajive Dissanayake BBA (Colombo), ACMA (UK) , CFA (USA) - Member
Senior Manager - Strategic Planning (HNB)The Committee meets quarterly to review the asset allocation and performance of the key investment portfolios and provides guidance on investment strategy at a macro level. It also monitors compliance with Investment, Asset and Liability Management (ALM) and Liquidity policies that have been adopted by the Company.
The responsibilities of the Investment Committee are given on page 126.
The EXCO currently comprises seven members.
- Managing Director, - General Manager - Marketing & Distribution- General Manger - Life Insurance- General Manager - General Insurance- Head of Information Technology- Head of Corporate Business Development- Head of Finance
The EXCO is the top management committee of the Company which is chaired by the Managing Director. The EXCO is responsible for the effective functioning of all operations of the Company. The Committee meets regularly and during the year 2010, it has met on 18 occasions.
EXCO together with other members of the management team also meets periodically with a designated Non-Executive Director to review the progress of the implementation of strategies and action plans contained in the Corporate Plan, which is approved by the Board of Directors annually.
Operational Committees (OPCOs) are headed by the General Manager or the Head of Division, and consists of the senior management teams of the respective divisions. Existing OPCOs are;
- Marketing and Distribution OPCO- General Insurance OPCO- Life Insurance OPCO- Finance and Corporate Services OPCO
The Objectives of OPCOs are to ensure the effective functioning of divisional responsibilities and to ensure proper coordination among all divisions.
Operational Committees meet on a regular basis to discuss and resolve issues relating to day to day operations. Key offi cers of other divisions are also invited where necessary, a strategy that has been proven to be very effective in improving communication and co-ordination among different divisions.
The Managing Director also attends OPCO meetings at times, by invitation, to brief the OPCOs on important developments in the Company.
Corporate Governance
121HNB ASSURANCE PLC ANNUAL REPORT 2010
CLAIMS PANELS
PROCUREMENT COMMITTEES
OTHER COMMITTEES
Settlement of Insurance Claims is one of the most critical processes of the Company. According to the nature of the process, we receive complaints or appeals from our customers to review a repudiation decision that has been made in respect of a claim or to reconsider the amount offered.
In order to handle these cases, we have introduced two claims panels that will look into these cases independently.
Members of the panel are:
- Managing Director
- Relevant Technical General Manager (General or Life Insurance depending on the line of business)
- Head of Finance
The Panel reviews the complaint or the appeal together with the opinion of technical claim managers and decides on the best course of action as a team. Other relevant factors such as the commercial value of the customers and humanitarian grounds are also taken into consideration in the process. The effectiveness of this process has been proven by the fact that HNBA has only a limited number of court cases or matters referred to the Insurance Ombudsman with respect to claims.
HNBA has formed Procurement Committees in order to handle purchasing of Fixed Assets and services in a more transparent and accountable manner. Currently, the following two committees are functioning effectively.
- IT Related Fixed Assets Procurement Committee
- Other Fixed Assets Procurement Committee
Another Committee was recently appointed to handle purchasing of marketing related services.
These Committees comprise members of the relevant function as well as from the Finance Division.
The procedures adopted by these committees are transparent and auditable. The Procurement Committee renders its recommendations to the relevant approving authority only after a unanimous decision is reached.
In addition, the Company makes it a practice at all times to appoint cross functional committees to handle those activities on which the Company spends a substantial amount of money. This practice has proven to be very effective and also provides opportunities for employees to demonstrate their talents outside their job scope.
A few such committees that functioned effectively during the year are;
- Annual Report Committee headed by the Head of Finance
- Complementary Items Committee headed by the Manager Marketing Communications
- Staff Conference Committee headed by the Assistant Manager – Human Resources
- Business Continuity Planning Committee headed by the Head of Finance
As this practice has shown a lot of positives such as transparency and participative decision - making, we are planning to introduce a few more committees in the year 2011 to handle various other aspects.

122
Manual of Financial Authority
The Board has delegated its fi nancial authority to the MD/CEO and the management through a comprehensively documented Manual of Financial Authority (MOFA). The MOFA indicates the responsibilities of all staff members who enter into fi nancial transactions and commitments on behalf of the Company, including persons responsible for recommendation, as well as the approval and payment. Adherence to the MOFA is strictly monitored throughout the year.
IT Governance
IT Governance is considered an integral part of Corporate Governance in the modern business world. HNBA’s IT Governance is an exercise where IT strategy is aligned with overall business strategy, thereby ensuring that the Company stays on track to achieve strategies and goals and implement better ways to measure IT performance. It makes sure that all stakeholders’ interests are taken into account and that processes provide measurable results.
HNBA follows a carefully planned IT Governance system, where IT values and alignment, accountability, performance measurement, and risk management are considered the key objectives driving the governance process.
HNBA’s IT Governance implementation is two dimensional, focussing on Governance in operational management and in service level management. The ownership of the implementation of IT Governance is distributed between both IT personnel as well as Non IT personnel to ensure that good governance prevails in the Company.
Governance in operational management concentrates on vital areas such as;
• Business Continuity and Disaster Recovery,• Compliance with Regulatory Requirements,
• Information Security • Risk Management
Service level management has concentrated on implementing best practices on
• IT Service Management• Knowledge Management• Project Governance
While IT standards are continuously improved within the organisation, regular reviews by the Executive Committee, Board Sub Committees and independent evaluations by internal / external audits ensure adherence to key governance objectives in operational and service level IT values and risk management. Periodic performance measurement and reviews guarantee operational excellence, ensuring continuous assessment and the mitigation of current and emerging threats. These reviews facilitate implementing accountability and strict compliance, while enabling continued enrichment of the IT Governance processes.
Performance Governance
Performance Governance at HNBA is derived from the strategic direction and corporate objectives, aimed at successfully managing business risks. Based on corporate strategy, the Board sets objectives for the year in consultation with the MD/CEO. The Corporate Plan is the formal presentation of the Company’s strategy. The Board with the MD/CEO provides leadership in achieving those objectives. The achievement of objectives is measured against key performance indicators.
Corporate Governance

123HNB ASSURANCE PLC ANNUAL REPORT 2010
HNBA has a target driven performance culture where employees are motivated to achieve targets within the set deadlines. Achievement of these targets is monitored closely at different levels throughout the year. Some such mechanisms are;
• Performance objectives given to all executive staff and semi annual performance appraisals being conducted to evaluate their performance,
• Performance linked increments and bonus payments,
• Periodic distribution management meetings, regional meetings to discuss performance,
• Discussion of Company performance at Executive Committee meetings based on monthly management information,
• Submission of monthly fi nancial information to the Board, listing KPIs in comparison with budgeted targets and the growth over the previous year
• Quarterly review of the status of the Corporate Plan objectives by the Executive Committee together with a Non-Executive Director
The performance governance approach at HNBA is shown in the following Diagram.
HR Governance
HR Governance is a systematic approach that enables the different functions of the Company to achieve their strategic and operational objectives and performance outcomes. By establishing a HR Governance system at HNBA, we intend to achieve following objectives:
• Establish a clear reporting structure
• Provide role clarity
• Create value additions to HR activities and decisions taken at each level of the organisation
• Integrate logical decision making processes and controls with business priorities
• Minimise duplication of activities
• Manage organisational confl icts
• Enhance the transparency of the processes in order to increase employee trust and commitment
All these activities would enable us to reduce operational and legal risks while enhancing the ability to deliver strong performance.

124
RuleNo. Subject RemarksCompliance
StatusRequirement
7.10.2(a)
7.10.2(b)
7.10.3(a)
7.10.3(b)
7.10.3(c)
7.10.3(d)
7.10.5
7.10.5(a)
7.10.5(b)
7.10.1 Non-Executive Directors
Independent Directors
Disclosures Relating toDirectors
RemunerationCommittee
Compliance with Corporate Governance Rules as per Section 7.10 of the Listing Rules of the Colombo Stock Exchange
The following table has been published in accordance with the requirement to disclose the level of compliance with the above Rules.
Two or one third of total number of Directors shall be Non-Executive Directors, whichever is higher
Two or one third of Non-Executive Directors appointed to the board, whichever is higher shall be Independent
Each Non-Executive Director shall submit a declaration of Independence/non- independence in the prescribed format
The Board shall disclose the names of the Independent Directors in the Annual Report
In the event a Director does not qualify as independent as per the Rule on Corporate Governance, but if the Board is of the opinion that the Director is nevertheless independent, the Board shall specify the basis for that determination in the Annual Report
The Board shall publish a Directors’ brief resume in the Annual Report with the experience in relevant area
The Board shall provide a brief resume of newly appointed Directors to the Exchange for dissemination to the public
A listed entity shall have a Remuneration Committee
- The Remuneration Committee shall comprise Non-Executive Directors, a majority of whom shall be independent
- One Non-Executive Director shall be appointed as Chairman of the Committee by the Board of Directors.
The Remuneration Committee shall recommend the remuneration of Managing Director/Chief Executive Offi cer.
Compliant
Compliant
Compliant
Compliant
Not Applicable
Compliant
Compliant
Compliant
Compliant
Compliant
Eight out of nine Directors at HNBA function as Non-Executive Directors.
Three out of eight Non-Executive Directors are Independent.
Non-Executive Directors have submitted the declaration during 2010.
Please refer Annual Report of the Board of Directors on page 146.
No such situation has arisen during the year.
Please refer Directors’ profi les on pages 12 to 14.
No new appointments were made during the year 2010.
Details of the Remuneration Committee are given on Page 143.
- The Remuneration Committee comprises three Non-Executive Directors, two of whom are independent.
- Mr. M U de Silva (Non-Executive Director) functions as the Chairman of the Remuneration Committee.
Please refer the functions of the Remuneration Committee on page 126.
Corporate Governance

125HNB ASSURANCE PLC ANNUAL REPORT 2010
RuleNo. Subject RemarksCompliance
StatusRequirement
7.10.6
7.10.6(a)
7.10.6(b)
7.10.6(c)
7.10.5(c)
Audit Committee
The annual report should set out:- Names of the Directors serving in the Remuneration Committee- Statement of Remuneration Policy- Aggregate remuneration paid to Executive and Non- Executive Directors
A Listed Entity shall have an audit committee
The Audit Committee shall comprise Non-Executive Directors, a majority of whom shall be independent
One Non-Executive Director shall be appointed as Chairman of the Committee by the Board of Directors
Chief Executive Offi cer (CEO) and Chief Financial Offi cer (CFO) shall attend Audit Committee meetings
Chairman or one member of the Committee should be a Member of a recognised professional accounting body.
The Functions of the Audit Committee shall be as set out in the section 7.10 of the Listing Rules
The Annual Report should set out,- Names of the Directors serving in the Audit
Committee- The Committee shall make a determination of
the independence of the Auditors and disclose the basis of such determination
- A report by the Audit Committee setting out the manner of compliance with the requirements set out in section 7.10 of the Listing Rules
Compliant
Compliant
Compliant
Compliant
Compliant
Compliant
Compliant
Compliant
- Please refer page 126 for composition of the Remuneration Committee
- Please refer Remuneration Committee Report on pages 143 and 144
- Please refer Notes to the Financial Statements on page 189.
Please refer page 126.
The Audit Committee comprises three Non-Executive Directors, two of whom are independent.
Mr. D M de S Wijeyeratne (Independent Non-Executive Director) functions as the Chairman of the Committee
MD/CEO attends meetings by invitation. Head of Finance also attends meetings in the capacity of Secretary to the Committee and CFO
Chairman is an Associate Member of the Institute of Chartered Accountants of Sri Lanka (ICASL). The other two members are also members of recognised professional accounting bodies
Please refer page 126 for a brief description of the functions of the Committee and pages 140 to 142 for Report of the Audit Committee
- Please refer page 126 for the composition of the Audit Committee
- Please refer page 141 for the Report of the Audit Committee
- Please refer pages 140 to 142 for the report on Audit Committee

126
Committee Audit CommitteeInvestment Committee
Nomination Committee
Remuneration Committee
Chairman
Members
Frequency
Secretary
Invitees
Main Functions ofthe Committees
Circulation of the Agenda & Papers
D M de S Wijeyeratne*
Sarath Ratwatte*J D N Kekulawala**
Quarterly
One week in advance
Head of Finance
Managing DirectorGeneral ManagersHead of ITCompliance Offi cerAccountantExternal & Internal AuditorsConsultant Actuary
Overseeing the process of preparation and presentation of the Financial Statements (Interim and Annual).
Continuous review of the Company’s compliance with fi nancial reporting requirements such as Sri Lanka Accounting Standards, Companies Act, Regulations of Insurance Industry Act and other regulations of the Insurance Board of Sri Lanka.
Reviewing the Company’s internal control and risk management process.
Monitoring and reviewing the effectiveness of the Internal Audit function.
Making recommendations to the Board on the remuneration, appointment, re-appointment and removal of the External Auditors.
Reviewing and monitoring the External Auditor’s independence and objectivity and the effectiveness of the audit process.
Composition and Main Functions of Board Sub-Committees
M U de Silva**
Sarath Ratwatte*D M de S Wijeyeratne*
Twice a year
One week in advance
Assistant Manager-HR
Managing Director
Reviewing and recommending to the Board on remuneration package for MD/CEO, top management and other employees of the Company.
Reviewing and making recommendations to the Board on annual increments, promotions, etc.
Reviewing and ensuring that the Company has a sound performance appraisal process for employees at all levels.
Review of leadership needs of the organisation, both Executive and Non-Executive, with a view to ensuring the continued ability of the organisation to compete effectively in the market place.
Rienzie T. Wijetilleke**
Manjula de Silva***R Theagarajah**M U de Silva**
As required
One week in advance
Board Secretary
None
Identifying and nominating for the approval of the Board, candidates to fi ll Board vacancies as and when they arise.
Regularly reviewing and evaluating the structure, size, and composition, balance of skills, knowledge and experience of the Board and making recommendations for improvement.
J D N Kekulawala**
Sarath Ratwatte*Manjula de Silva***Rajive Dissanayake
Quarterly
One week in advance
Head of Finance
Manager - Investments
Executive - Investments
Developing and setting guidelines and policies on investment portfolios of the Company.
Making recommendations on investment strategies by evaluating and reviewing the performance of the investment portfolios.
Monitoring compliance with laws and regulations relating to Investments.
Monitoring the implementation of the Investment policy, Asset and Liability Management (ALM) policy and Liquidity policy of the Company
* Independent Non-Executive Director ** Non-Executive Director *** Executive Director
Corporate Governance

127HNB ASSURANCE PLC ANNUAL REPORT 2010
Risk Management
How we value Risk Management....………Risk is an integral part of any business and being an insurance company, our business is transferring and managing various types of risks to generate profi table returns. Hence, Risk Management is a fundamental aspect of our business activity. We have, therefore, embedded risk management practices into our daily operations in order to ensure that it remains the core responsibility of everyone within the Company.
At HNB Assurance, we follow a Risk Management process which includes developing strategies and different techniques to recognise and confront risks which can negatively impact on the business, with the objective of early identifi cation and minimising impact.
Risks we face……………..As an insurance company, we face a number of risks specifi c to our business in addition to generic risks faced by all others in the environment in which we operate. Each of these risks has the potential to harm our fi nancial performance or hinder the achievement of our strategic objectives.
The risks we face can be divided into fi ve main categories.
• Strategic Risk • Regulatory Risk• Insurance Risk • Investment Risk• Operational Risk
These categories are discussed in detail throughout this report.
What we expect from a sound Risk Management process………….If risks are not managed effectively, the chance of failure by way of incurring losses, missing potential opportunities etc. can be very high and perhaps not redeemable. Moreover, factors such as high turbulence on a global scale, fi erce competition, interest rate fl uctuations, emergence of Corporate Governance codes and complex regulatory requirements are persuading organisations to consider Risk Management as an integral component of the overall business strategy. Hence, today a formal Risk Management framework is considered a requirement for every company, with this task becoming much more serious and challenging everyday. Accordingly, we expect our Risk Management framework to encompass many features including;
• creating value for the organisation • being an integral part of organisational processes• supporting the decision making process • addressing uncertainty in the business processes• being systematic and structured • capturing and using better available information• blending with the Company culture • considering the human factors• being clear to everyone and being transparent • being dynamic, iterative and responsive to change• being capable of continuous improvement and enhancement
How we manage Risks at HNB Assurance…………….The Risk Management framework at HNB Assurance provides us the means to identify, measure, manage and monitor different types of risks we face. This enables us to make appropriate decisions to limit and control the impact that such risks may have on our strategic objectives.
However, as seen by the tragic events that unfolded during the recent natural catastrophes, which was partly attributable to irresponsible behavior of people, it is almost impossible to identify and measure some of the risks faced by an insurer suffi ciently or estimate their potential impact accurately.
Nevertheless, every effort is taken to identify and manage all risks faced by the Company to the maximum possible extent. Based on the set measurement criteria which fall outside the tolerance limit, we decide what actions need to be taken to manage the risks (or groups of risks). After agreeing on the actions required to mitigate the identifi ed risks the implementation component is assigned to the relevant member of the management with target timelines and is subjected to close monitoring.
Responsibility of Managing Risks at HNB Assurance…………..The Board of Directors is principally responsible for establishing a sound Risk Management policy for the Company and monitoring effectiveness of implementation. In discharging the said responsibility the Board mainly relies upon the Audit and Investment Committees.

128
Risk Management
The Executive Committee (EXCO) as the top management team of the Company together with other representatives of all departments actively takes part in the risk management process. Operational Committees (OPCOs) who represent the management team of each division also play a major role as do employees who are in front line operations. The Manager - Legal and Compliance monitors whether all actions planned to mitigate the identifi ed risks are effectively implemented and operated throughout the Company.
M/S Ernst & Young Advisory Services (Pvt) Ltd. acts as the Internal Auditor and they report their fi ndings to the management on a monthly basis and to the Audit Committee on a quarterly basis. Moreover, M/S KPMG Ford Rhodes, Thornton & Co. the External Auditor of the Company also plays a vital role in the monitoring process of Risk Management activities in the Company.
Risk Management activities at HNB Assurance…………….The Risk Assessment report that was prepared in the previous year was updated this year by the Risk Management team. The team discussed in detail the risks faced by the Company in terms of the main categories identifi ed above and analysed them based on the experiences and future possibilities. This year this process led to a change in the weighting of the 73 risks identifi ed and all identifi ed risks were documented in the risk schedule and plotted on the risk grid as per the diagram given below.
The updated position was reported to the Audit Committee and necessary steps for improvements as recommended by the Committee were taken.
Signifi cant risks identifi ed in the said process together with controls in place to mitigate/manage such risks are presented in summary form.
Each major risk category discussed below consists of one or more individual risks which fall into the different quadrants of the HNBA risk grid. The risk rating of the quadrant which contains the highest number of individual risks of a particular major category has been taken as the overall risk rating of that major

129HNB ASSURANCE PLC ANNUAL REPORT 2010
category. For instance, if there are fi ve risks identifi ed under one risk category, overall risk rating has been determined as “Low” if three of them fall into the “Low” risk quadrant. In certain cases, past experience and the managements’ judgment are also used in determining the overall risk rating.
STRATEGIC RISK Risk Rating - Low
Nature of the RiskStrategic Risk or Business risk is the risk associated with the Company’s future business plans and strategies. This category includes failure of future business plans, unexpected threats from rivals or new entrants, inadequate expansion of service levels and infrastructure, etc. (e.g. information technology and networking).
In other words, strategic risk refers to non achievement of set objectives and the risk of the Corporate Plan and Budgets becoming irrelevant/ inappropriate due to unexpected changes in external and internal environments.
HNB Assurance responses to manage Strategic Risk
• Corporate Plan is prepared every year by the planning team addressing potential risks and future plans for the next three years and subsequently approved by the Board after a due review.
• Based on the agreed plan, objectives for the year are set for all employees above the executive category.
• Performance appraisals of such employees will be done primarily based on the achievement of the objectives given (performance appraisals are done twice a year).
• The EXCO, together with other members of the senior management, reviews the achievement of agreed milestones periodically and action is taken to manage unfavorable deviations. A Non-Executive Director participates in these reviews to bring independent monitoring into the process.
• Monthly budget review meetings are held with relevant members of the management to address unfavorable variances.
• Company’s Corporate Plan and Budgets are reviewed in the middle of the year to ensure that these are in line with the changes in the environment in which the Company operates and necessary revisions are done with the agreement of the Board.
Proof of the effectiveness of Strategic Risk Management ….
• Life Insurance GWP target for the year 102% Achieved• General Insurance GWP target for the year 100% Achieved• Profi tability target for the year 100% Achieved
REGULATORY RISKRisk Rating - Low
Nature of the RiskRegulatory Risk may arise if the Company is not able to comply with regulatory requirements which may change from time to time.
HNB Assurance responses to manage the Regulatory Risk
• All employees are educated to commit to the goal of 100% compliance to applicable laws and regulations.
• A compliance checklist is prepared on a quarterly basis covering all the applicable laws and regulations for the Company by taking sign-offs from all relevant members of the management.
• Manager - Legal and Compliance submits a report to the Audit Committee highlighting the Company’s compliance with applicable laws on a quarterly basis.
• The Audit Committee reviews and approves all fi nancial reports and statutory returns to IBSL and information to CSE before they are submitted.

130
• The Board also focuses on the need to be in compliance with all laws and regulations applicable and monitors the same through the Audit and Investment Committees.
• The services of a separate Compliance Offi cer, an Attorney at Law by profession, is obtained and this individual is made responsible for the Company’s compliance with applicable laws and regulations.
• Special care and attention is given when handling all employee related areas and thereby avoid labour law related issues.
• Both Internal and External Auditors have been requested to review the Company’s compliance to laws and regulations and all deviations are to be reported to the management and the Audit Committee.
Proof of the effectiveness of Regulatory Risk Management ….
• All compliance reports were submitted to IBSL on time.• Quarterly and year end fi nancial statements were submitted to CSE on time.• All taxes and other dues to regulators were paid on time.• No penalty or surcharges were paid during the year for non-compliance with any laws or regulations.
INSURANCE RISK Risk Rating - Low
Insurance Risk can be specifi cally identifi ed in the following categories in light of the operations of the Company.
UNDERWRITING RISKRisk Rating - Low
Nature of the RiskThis refers to the risk of accepting insurance business that carries an unacceptably high exposure to the risk of claims and accepting risks at rates that do not contain an adequate risk premium.
This is a primary area of focus in the Company’s Risk Management programme. Underwriting risk could also arise due to a lack of understanding regarding changes in the environment, particularly the effect of climate change on account of global warming and other issues.
HNB Assurance mechanisms to manage Underwriting Risk
• Always ensuring an adequate level of segregation of duties.
• Strict adherence to the Manual of Financial Authority which is reviewed regularly.
• Signifi cant investment on conducting regular training for underwriting and claims management staff including those attached to the distribution network.
• “General Insurance Academy” started during the year aimed at improvement of technical knowledge in General Insurance across the Company.
• Selective underwriting considering both the risk and return, not just focusing on the growth in the top line.
• Strict controls on the issue of cover notes.
• Underwriters carrying key performance indicators on both turnover and profi tability.
• Maintenance of statistical databases on loss making clients and making sure such clients are declined strategically.
• Carrying out post-underwriting audits to ensure set guidelines have been observed.
• No insurance cover is issued without placing adequate reinsurance and also reviewing the adequacy of reinsurance support for catastrophe / extreme events on a regular basis.
Specifi c to Life Insurance
• Getting the maximum input of its Consultant Actuary and Reinsurer in deciding on the terms and conditions of products and thereby ensuring that the products are adequately priced.
• Using only registered laboratories when obtaining medical reports.
Risk Management

131HNB ASSURANCE PLC ANNUAL REPORT 2010
• Regular visits by the management to such laboratories to monitor the quality of their service.
• Providing focused training on proper selling in all three languages (Sinhala, Tamil and English) to Insurance Advisors.
• Using Customer Need Analysis Form to identify and sell the most appropriate policy in terms of customer needs.
Proof of the effectiveness of Underwriting Risk Management ….
• Receiving profi t commission from the reinsurer due to profi table business underwritten.• Ability to reduce the loss ratio on Motor Insurance which is the predominant class of business.
REINSURANCE RISK Risk Rating – Low
Nature of the RiskReinsurance risk is;
- Retaining risks beyond the Company’s net retention capacity without having adequate reinsurance.
- Inability of reinsurers to meet their commitments due to insuffi cient fi nancial strength.
HNB Assurance responses to manage Reinsurance Risk
• Maintaining a very close and professional relationship with all reinsurers.
• Making sure that no cover is issued without a properly confi rmed reinsurance in place.
• Using only globally trusted and stable portfolio of reinsurance companies who are all rated ‘A-’ and above by Standard & Poor or AM Best.
• Constantly reviewing our reinsurer ratings.
• Reviewing the outstanding reinsurance receivables in a timely manner and making sure that all dues are collected or set off against payables on time.
Proof of the effectiveness of Reinsurance Risk Management ….
• No failures on reinsurance arrangements. • All dues from reinsurers are collected without any provisions for bad debts. Age
analysis of reinsurance receivables as at 31st December 2010 is shown below. • Using only reinsurers rated ‘A-’ and above by Standard & Poor or AM Best.
Reinsurer Security Rating Rating Agency
Mitsui Sumitomo Re AA- Standard & Poor
Munich Re A+ AM Best
Toa Re A+ Standard & Poor
General Insurance Corporation of India A- AM Best
Trust International A- AM Best
Malaysian Re A- AM Best
BEST Re A- AM Best
• Continuous support on training and development for the staff from reinsurers.• Year on year increase in treaty limits and benefi ts.

132
CLAIM RESERVING RISK
Risk Rating – Low
Nature of the RiskRisk of not providing adequate reserves to meet future obligations arising from claims in the General Insurance business and claims and maturities in the Life Insurance business.
HNB Assurance responses to manage Claim Reserving Risk
General Insurance
• Claim intimation through a 24 hour fully fl edged Customer Relations Center (CRC).
• Independent and expert panel of assessors/ loss adjustors working throughout the island on a 24 hour basis.
• Certifi ed garages located islandwide to provide a better service to customers by comprehensive assessments of claims.
• Immediate assessment of claims upon intimation and reserving accordingly.
• Involvement of the Claims Panel (comprising Managing Director, General Manager - General and Head of Finance) to take decisions on signifi cant/ problematic claims and appeals made in respect of claims.
• Monthly review of signifi cant outstanding claims by the management.
• Engaging the services of a qualifi ed Independent Actuary twice a year to assess the adequacy of reserves made in relation to Incurred But Not Reported (IBNR) and Incurred But Not Enough Reported (IBNER) claims.
• Review of all third party claim intimations separately with the support of Manager - Legal and Compliance.
Life Insurance
• Engaging an Independent Actuary to carry out valuations of the Life Fund twice a year.
• Immediate reserving for claims at the intimation or on the availability of information of a death or injury of an insured.
• Making additional reserves to meet contingency needs in excess of statutory requirements as a measure of prudence with the advice of the Consultant Actuary.
• Involvement of the Claims Panel (comprising Managing Director, General Manager - Life and Head of Finance) to take decisions on signifi cant/problematic claims and appeals made in respect of claims.
CREDIT RISKRisk Rating – Low
Nature of the RiskRisk pertaining to uncertainty in the debtors’ ability to meet obligations to the Company.
HNB Assurance responses to manage Credit Risk
• Strict implementation of Premium Payment Warranty (PPW) and cancelling all General Insurance policies for which payment is outstanding for more than 60 days.
• Follow up meetings on debt collections with the participation of Finance, Distribution and Underwriting offi cials on a monthly basis
• Information regarding policies cancelled due to non payment of premiums being submitted to the industry database on a routine basis.
• Use of new technology such as SMSs to inform customers on premiums due to the Company.
• Claim settlements being done only after reviewing the position of outstanding receivables.
• All other receivables including reinsurance receivables being reviewed on a timely basis and recoveries being made on time.
• No credit risk in Life Insurance as premiums are recorded only upon collection of cash.
Proof of the effectiveness of Credit Risk Management ….
• No receivables over 60 days at any given month end unless there is a subsequent settlement within the next 7 days• Nil bad debts in Reinsurance Receivables• Very low level of bad debts in other receivables
Risk Management

133HNB ASSURANCE PLC ANNUAL REPORT 2010
INVESTMENT RISK
Risk Rating – Moderate
Company handles a signifi cant portfolio of investments and is therefore exposed to a substantial amount of risks relating to the investments held. We have identifi ed specifi c investment related risk categories as discussed below.
CONCENTRATION RISKRisk Rating – Moderate
Nature of the RiskThe risk of over exposure to a particular company or sector due to lack of diversifi cation in the investment portfolio.
HNB Assurance responses to manage Concentration Risk
• Investment Committee in consultation with the management sets the target asset allocations which is regularly reviewed in terms of changes in the environment. Particularly, Company’s exposure to Equities and Corporate Debt is regularly reviewed and updated.
• Strict adherence to the Investment Policy guidelines and Investment Authority Manual in all placements.
• Review of the investment portfolio by the Managing Director and Head of Finance on a monthly basis with the participation of both front offi ce and back offi ce investment staff.
• Meeting with the Investment Committee on a quarterly basis to review the investment portfolios, investment strategy, future outlook, etc.
• Monthly review by the Board of all new investment placements made by the Company.
• Single party exposure limits are decided based on the credit ratings and regulatory requirements which are monitored closely at different levels.
• Allocating a considerable portion of investments to Government Securities which is risk free.
• Review by the Internal Auditors on the Company’s compliance with set policies and best practices.
Proof of the effectiveness of Concentration Risk Management ….
Diversity of the Company’s asset allocation and the sectoral allocation of equity investments as at 31st December 2010 is shown in the graphs below.
CREDIT RISK IN INVESTMENTSRisk Rating – Moderate
Nature of the RiskThis relates to the risk of not being able to recover the capital and/or interest relating to investments. This is mainly applicable to investment in Corporate Debt.

134
HNB Assurance responses to manage Credit Risk in Investments
• Investment Committee has adopted a list of approved entities which in the opinion of the Committee carries minimal credit risk.
• Creditworthiness of potential investment entities are checked mainly through ratings assigned to the issuing institution or to an issue.
• Any investments made in any other entity are carried out only with the explicit approval of the Committee.
• Single party exposure limits are decided based on the credit ratings and regulatory requirements which is monitored closely at different levels.
• Master Repo agreements are signed with all primary dealers the Company works with in order to ensure zero level of default risk in respect of Government securities bought through such parties even in the event of their bankruptcy.
Proof of the effectiveness of Investment Credit Risk Management ….
Credit quality of the Corporate Debt portfolio as at 31st December 2010 is well within acceptable levels as seen from the graph given on page 47.
INTEREST RATE RISKRisk Rating – Moderate
Nature of the RiskThis refers to the risk of the Company’s inability to earn adequate returns to meet promised liabilities due to volatility in interest rates.
HNB Assurance responses to manage Interest Rate Risk
• Market interest rates and other macro economic indictors are monitored closely by both the management and the Investment Committee and necessary changes to the asset allocations are made, where necessary.
Proof of the effectiveness of Interest Rate Risk Management ….
The Company yield was well above the market yield during the year, as indicated in the graph.
LIQUIDITY RISKRisk Rating – Low
Nature of the RiskThis refers to the inability to meet contractual obligations such as claim settlements and payments to reinsurers due to the insuffi cient availability of cash and other liquid investments.
HNB Assurance responses to manage Liquidity Risk
• Maturity mix of investment portfolio is reviewed and agreed by the management and the Investment Committee on a regular basis.
• All large cash outfl ows are planned in advance and necessary arrangements are made to ensure the availability of funds to meet such outfl ows.
• Life Insurance policies sold with a guaranteed return are fully backed by corresponding investments for a similar return and period.
Proof of the effectiveness of the Liquidity Risk Management ….
The Company has never faced a liquidity issue in its history. The maturity mix of the investment portfolios as at 31st December 2010 is shown below.
• In addition, the Company is entitled to obtain cash calls from reinsurers in the event of large claims.• Being a subsidiary of a large commercial bank in the country, we have the ability to negotiate quick overdraft facilities in the
event of a cash need.
Risk Management

135HNB ASSURANCE PLC ANNUAL REPORT 2010
MARKET RISKRisk Rating – Moderate
Nature of RiskMarket risk refers to change in the value of investments due to volatility of stock prices.
HNB Assurance responses to manage Market Risk in Investments
• Investments decisions are based on fundamental principles.
• The Company has developed a target portfolio of stocks based on the fi nancial strength and growth potential of listed companies.
• Only selected investments are made after carrying out in-depth research into identifi ed stocks.
• Review of the investment portfolio by the Managing Director and Head of Finance on a monthly basis with the participation of both front offi ce and back offi ce investment staff.
• Meeting with the Investment Committee on a quarterly basis to discuss about the investment portfolios, investment strategy, future outlook, etc.
Proof of the effectiveness of the Market Risk Management ….
Performance of the Company’s equity portfolio against the market is shown in the graph.
OPERATIONAL RISK Risk Rating – Low
This refers to operational failures due to inadequate or failed internal processes, people and systems or on account of external events.
BUSINESS CONTINUITY RISKRisk Rating – Moderate
Nature of the RiskThis is the risk of business operations being disrupted due to an unexpected eventuality.
HNB Assurance responses to manage Business Continuity Risk
• Effective implementation of the Business Continuity Plan (BCP)
• Availability of IT infrastructure to support the virtual operation of the Company in a situation where the Company Head Offi ce is not accessible

136
Proof of the effectiveness of the Business Continuity Risk Management ….
• During the year there were no incidents reported on business interruption due to any reason
• The Company was able to serve its customers and branch network from its BCP location on two days when the head offi ce was inaccessible due to security reasons.
FRAUD RISKRisk Rating – Moderate
Nature of the RiskThis refers to the risk of fraud being perpetrated due to inadequate internal controls.
HNB Assurance responses to manage Fraud Risk
• Strict adherence to the Manual of Financial Authority (MOFA) which is approved by the Board.
• Properly delegated responsibilities through a clearly defi ned organisation structure.
• Proper segregation of duties implemented for all signifi cant operations.
• Strong control environment which is subjected to periodic monitoring by an independent Internal Audit team (M/S Ernst & Young Advisory Services (Pvt) Ltd).
• Monthly reports submitted by the Internal Auditors reviewed by the Audit Committee of the Board which monitors the implementation of all agreed follow-up actions.
• Availability of a Code of Best Practice and Ethics to be adopted by employees at all levels without exception.
• Any complaints or indications whatsoever regarding possible fraud or misappropriation by employees or members of the agency force are investigated immediately and appropriate action is taken promptly. There is zero tolerance on fraud.
• With the implementation of the new system, a number of initiatives have been taken to minimise the dependence on manual controls and documents
Proof of the effectiveness of the Fraud Risk Management ….
• No signifi cant frauds were noted during the year.
SOCIO-ECONOMIC AND POLITICAL RISKRisk Rating – Low
Nature of the RiskSocio-economic and political factors have a direct impact on insurance business as well as on the investment activities of the Company. Particularly, when the country is economically or politically unstable, insurance business similar to other businesses can be seriously affected. This was clearly evident at the height of the confl ict and during the recent economic downturn, for example.
HNB Assurance responses to manage Socio-Economic and Political Risk
• Signifi cant attention is paid to Socio-Economic and Political factors at the corporate planning sessions on an annual basis.
• Company seeks advice from independent specialists such as economists whenever necessary to identify these trends and to understand their fi nancial implications.
• Review pricing of insurance policies in light of infl ation, fl uctuation in interest rates, etc.
• Take actions to minimise lapsations in Life Insurance which is likely to increase in unstable economic conditions.
Proof of the effectiveness of the Socio-Economic and Political Risk Management
• Improvements in lapsation position in Life Insurance and over 20% growth in GWP from Endowment Policies.
• Achieving General GWP growth of 19% in spite of losing terrorism premium income of Rs. 90 million.
Risk Management

137HNB ASSURANCE PLC ANNUAL REPORT 2010
INFORMATION SECURITY RISKRisk Rating – Low
Nature of the RiskThis refers to incurring losses as a result of the improper use of information systems or as a result of a disaster or breakdown. It also covers losses that could occur due to the leakage or misuse of vital data or information.
HNB Assurance responses to manage Information Security Risk
• Adequate investments have been made on IT infrastructure to improve both access and applications controls.
• Strict application of IT Security Policy which is communicated to all employees.
• Carrying out IT Security Audits/ penetration tests periodically to ensure the Company’s systems are well secured and are not exposed to hacking.
• The Company has also set up a Disaster Recovery Center with adequate IT infrastructure.
Proof of the effectiveness of the Information Security Risk Management ….
• No Information Security issues were noted during the year.
REPUTATIONAL RISKRisk Rating – Moderate
Nature of the riskThis refers to the impairment of the goodwill of the Company due to a particular event or behavior.
HNB Assurance responses to manage Reputational Risk
• A sound system of internal controls has been established and this is regularly monitored by various parties as discussed above.
• The Company is highly committed to be in full compliance with all laws and regulations applicable to the Company.
• All employees and advisors of the Company are required to show a high level of integrity and professionalism at all times.
• Management maintains a good relationship with regulators, other players in the industry and all other stakeholders in order to ensure any potential risk is identifi ed in advance and addressed adequately.
• The Company has adopted a Code of Business Conduct and Ethics to be followed by all employees and advisors without exception .
• The release of fi nancial information to the public is subject to approval by the Audit Committee and the Board.
Proof of the effectiveness of the Reputational Risk Management ….
• The Company’s reputation has remained intact during the year. • The Company maintains a very good relationship with all printed and electronic media.
138
HUMAN RESOURCE RISKRisk Rating – Low
Nature of the RiskThe main risk in human resource area is the lack of professionally qualifi ed personnel in the industry, which has resulted in relatively high staff turnover ratios.
HNB Assurance responses to manage Human Resource Risk
• Company HR policy is to support continuous education and development of employees at all levels.
• At every opportunity, employees at all levels are provided with in-house, external and other training to enhance knowledge and develop skills.
• The Company always aims to have its remuneration packages in line with the industry to retain and attract qualifi ed staff.
• The Company supports all industry initiatives to address the training and development needs of professionals engaged in the industry and those seeking to join it.
• Opportunities are given to the staff to meet the Managing Director and exchange ideas without the presence of their superiors through CEO’s forums.
• An ‘open-door’ culture enables any employee to access the highest levels of management to report or discuss any issues requiring their attention.
• Exit interviews are carried out when a member of the staff leaves in order to identify the causes for the person leaving the Company.
• Employee satisfaction surveys are carried out to assess satisfaction levels and identify areas for improvement.
• The Company invests in staff welfare through the Welfare Society, Human Resource Department and relevant divisional activities to motivate the staff.
• Regular management meetings and distribution management meetings are conducted to convey the key decisions taken at the top management level and to communicate what is happening in the Company to all members.
• An Annual Staff Conference is held at which the entire staff of the Company is briefed on the Company’s performance and future plans.
Proof of the effectiveness of the Human Resource Risk Management ….
• High level of training provided to employees at all levels. (Please refer Sustainability Report in page 72 for details)• Overall employee satisfaction level was ascertained to be 79% and employee response rate was 78% in the customer
satisfaction survey conducted by M/S MTI consulting (454 out of total staff of 575 had responded to the survey).
Risk Management

Financial Statements

140
Audit Committee Report
Composition
The Audit Committee, appointed by and responsible to the Board of Directors, comprises three Non-Executive Directors, two of whom are independent. The Committee is made up of members who bring their varied expertise and knowledge to effectively carry out their duties.
Mr. D M de S Wijeyeratne ACA - ChairmanIndependent Non- Executive Director
Mr. J D N Kekulawala FCIB (London), FCA (England & Wales), MBA (Manchester) - MemberNon-Executive Director
Mr. Sarath Ratwatte FCMA (UK) - MemberIndependent Non- Executive Director
A brief profi le of each member is given on pages 12 and 14 of this Annual Report.
The Head of Finance acts as the Secretary to the Audit Committee.
The functions of the Audit Committee are governed by an Audit Committee Charter, which is reviewed on an annual basis.
Meetings
The Committee met fi ve times during the fi nancial year under review. The attendance of each member is given on page 147. There were additional meetings with the Internal Auditors, External Auditors and members of the management during the year. Agendas of the Meetings were prepared and distributed suffi ciently in advance to members, along with appropriate briefi ng material.
The Managing Director attends all meetings by invitation. The Head of Finance also attends all meetings in the capacity of Secretary to the Audit Committee as well as the Chief Financial Offi cer. Executive Committee Members, Manager – Legal and Compliance and other members of the Management are also invited to attend these meetings when necessary.
Objective and Authority
The key objectives of the Audit Committee are;
• To satisfy themselves that a good fi nancial reporting system is in place in order to present accurate and timely fi nancial information to the Board of Directors, regulators and shareholders and to make sure that these are prepared in accordance with Sri Lanka Accounting Standards (SLAS) and other relevant laws and regulations.
• To satisfy themselves of the effectiveness of the Company’s risk management processes to identify and mitigate risks.
• To review the design and implementation of the internal control systems and take steps to strengthen them as necessary.
• To ensure that the conduct of the business is in compliance with the applicable laws and regulations of the country and policies and procedures of the Company
• To monitor processes for compliance with laws and regulations
• To assess the independence of the External Auditors and monitor the performance of Internal and External Auditors
• To assess the Company’s ability to continue as a going concern in the foreseeable future
The Audit Committee is empowered to seek any information it requires from the management and staff (all of whom are directed to co-operate with the Committee) or external parties, meet with the management and staff, External and Internal Auditors, the Consultant Actuary, regulators or outside counsel, in order to achieve the objectives stated above.
Activities and Responsibilities
The Committee carried out following activities during the year.
Financial Reporting:
The Committee, as a part of its responsibility to oversee the Company’s fi nancial reporting process on behalf of the Board of Directors, reviewed in consultation with the External Auditors and the management when necessary, signifi cant accounting and reporting issues, developments in the fi nancial reporting framework (Sri Lanka Accounting Standards), the consistency of the accounting policies and methods adopted and their compliance with the Sri Lanka Accounting Standards, disclosure requirements and other applicable accounting and fi nancial reporting requirements such as Companies Act, No. 7 of 2007, Regulation of Insurance Industry Act, No. 43 of 2000, etc.
The Committee also reviewed with the management the Interim and year-end Financial Statements and recommended the adoption of the same to the Board.
Compliance with Laws and Regulations:
The Committee reviewed the quarterly compliance reports submitted by the Compliance Offi cer to ensure that the Company has complied with all statutory requirements including those set out by the Regulation of Insurance Industry Act, No. 43 of 2000.
Statutory Reporting to the Insurance Board of Sri Lanka (IBSL):
The Committee reviewed and approved all Quarterly and Annual Returns submitted by the Company to the Insurance Board of Sri Lanka under the Regulation of Insurance Industry Act, No. 43 of 2000.
141HNB ASSURANCE PLC ANNUAL REPORT 2010
External Audit:
The Audit Committee met with the External Auditors to discuss the proposed audit scope and plan, including coordination of the audit effort with the internal auditors and its audit quality control /assurance processes for the year.
The Committee perused the Report of the Auditors and the Management Letters issued by them. The Committee followed up on recommendations made in those reports. The External Auditors were given adequate access to the Audit Committee and all relevant information required.
The Committee has recommended to the Board of Directors that Messrs. KPMG Ford, Rhodes, Thornton & Co. be reappointed as Auditors for the fi nancial year ending 31st December 2011 subject to the approval of Shareholders at the Annual General Meeting to be held on 29th March 2011.
The Audit Committee also recommends the fees payable to the statutory auditors for approval by the Board.
The Audit Committee met the External Auditors without the management being present on one occasion during the year.
Independence of External Auditors
As far as the Audit Committee is aware, the Auditors do not have any relationship (other than that of the Auditor) with the Company. The Committee has also received a declaration from Messrs. KPMG Ford, Rhodes, Thornton & Co, as required by the Companies Act, No. 7 of 2007, confi rming that they do not have any relationship with the Company, which may have a bearing on their independence within the meaning of the Code of Best Practice on Corporate Governance issued jointly by the Institute of Chartered Accountants of Sri Lanka (ICASL) and the Securities and Exchange Commission of Sri Lanka (SEC) and the Guidelines for Listed Companies on Audit and Audit Committees issued by the Securities and Exchange Commission of Sri Lanka (SEC). In addition, the lead audit partner is rotated every fi ve years.
Provision of non-audit services
The Committee is responsible for reviewing the nature of non- audit services the External Auditor may undertake to provide in order to ensure that auditor independence is not impaired in such circumstances. However, no such non-audit services were provided by the External Auditors during the year under review.
Internal Audit:
The Internal Audit function has been out-sourced to Messrs. Ernst & Young Advisory Services (Pvt) Ltd. The Committee reviewed and approved the Internal Audit plan, scope, and reporting requirements, etc. of the Company.
The Committee reviewed 11 Internal Audit reports covering the operations of 33 branch locations and several head offi ce
functions i.e. underwriting, claims, reinsurance, credit control, fi nance, investments, etc. Audit fi ndings presented in the reports are prioritised based on the level of risk. Progress on implementation of Internal Audit recommendations was also regularly followed up by the Committee. Internal Audit reports are made available to the External Auditors as well. The Audit Committee met the Internal Auditors without the management being present once during the year.
Reports of External Actuaries
The Audit Committee received written representations from the Life and General Independent External Actuaries and their observations and comments with regard to the work performed in valuing Life Insurance Policyholder Liabilities and General Insurance Incurred But Not Reported Claims (IBNR) and Incurred But Not Enough Reported Claims (IBNER).
Internal Control and Risk Management
During the year, the Committee reviewed all reports published by the Internal and External Auditors. The Committee also received an update of the Risk Management Report which included signifi cant risks identifi ed by the Risk Management Committee of the Company. The Committee therefore reviewed the process for identifi cation, evaluation and management of signifi cant risks throughout the Company and the effectiveness of the mitigating actions taken or to be taken by the management. The effectiveness of the Company’s internal controls and risk management processes are mainly evaluated by the reports furnished by the management, External and Internal Auditors.
A Manager – Internal Control and Compliance, who reports to the Managing Director and the Audit Committee has been appointed from within the staff from the year 2011. He will assist the Committee to carry out its functions more effectively, ensure that internal and external auditor’s recommendations are implemented, independently review the design and implementation of internal controls and ensure that risk identifi cation and mitigation measures are adequate, effective and function as designed.
IT Risk and Control Assessment
The Committee pays attention to the risks of IT related processes of the Company. Thus, the Committee appointed Messrs. Ernst & Young to carry out a comprehensive IT Security Audit which is to be commenced soon .
The Committee also reviewed the comments in respect of IT general controls made by the Internal Auditors and discussed with the management appropriate actions required to mitigate identifi ed risks.

142
Audit Committee Report
Compliance with the Code of Best Practices on Corporate Governance
The Company is fully compliant with the Corporate Governance Rules as per Section 7.10 of the Listing Rules of the Colombo Stock Exchange. Please refer pages from 124 to 125 for the Compliance table.
In addition, the Company is substantially compliant with the Code of Best Practice on Corporate Governance issued jointly by the Securities and Exchange Commission of Sri Lanka (SEC) and the Institute of Chartered Accountants of Sri Lanka (ICASL). Please refer pages from 103 to 119 for the Compliance table.
Performance Evaluation of the Committee
The Audit Committee formally approved a checklist indicating their responsibilities / functions in order to achieve the objectives of the Committee. Based on the checklist, the Committee is currently conducting a self evaluation. An evaluation by the management of the Committee’s performance is also being carried out. The Committee intends to discuss these evaluations with the Chairman of the Board and the Board of Directors. The fi nal objective of these evaluations is to improve the effectiveness of the activities of the Committee and enhance its support to the management and the Board of Directors.
Conclusion
The Committee is satisfi ed that the Company’s internal controls are effectively implemented as designed, and the Company’s assets are adequately safeguarded. The Company’s Internal and External Auditors have been effective and independent throughout the year. The Committee is also satisfi ed that the operational controls and the application of appropriate accounting policies provide reasonable assurance that the Financial Statements of the Company are true and fair.
D M de S Wijeyeratne,Chairman - Audit Committee
Colombo, Sri Lanka31st January 2011

143HNB ASSURANCE PLC ANNUAL REPORT 2010
Remuneration Committee Report
Composition and Charter of the Remuneration Committee;
The Remuneration Committee comprises the following Directors as at the year end.
• Mr. M U de Silva – Chairman (Non-Executive Director)
• Mr. D M de S Wijeyeratne (Independent Non-Executive Director)
• Mr. Sarath Ratwatte (Independent Non-Executive Director)
The Managing Director attends all meetings by invitation. The Assistant Manager – Human Resources acts as the Secretary to the Committee and also assists the Committee by providing information required for its decision making process.
Responsibilities of the Remuneration Committee:
• Maintaining a competitive, attractive and reasonable remuneration package for employees at all levels on par with industry standards bearing in mind business performance and long term shareholder returns.
• Making sure that the remuneration packages of employees are linked to individual performance, responsibility, expertise and contribution.
• Formulating formal and transparent procedures in implementing the remuneration policy of the Company.
• Recommending annual increments, and changes in perquisites and incentives.
• Ensuring that no Director is involved in setting his own remuneration package.
Remuneration Committee Meetings
The Committee meets twice each year and the minutes of the meetings are circulated to the Board. Please refer page 147 for each Director’s attendance record.
Remuneration Principles
The remuneration policy of the Company;
• should be reasonable, attractive, competitive and linked to individual performance, and
• should be in line with both industry standards and the Company’s performance
Remuneration Package
Employees
The remuneration packages of employees consist of a fi xed component and a variable component. In addition, some other benefi ts are also available to employees as noted below.
Fixed Variable Other Components Components Benefi ts
Basic Salary Annual bonus Vehicle Loans for all staff (Selected categories of staff) Traveling Allowance Production Bonus Examination Loans for Distribution Management Team, Other Marketing Other Loans personnel and (Emergency, Wedding etc) Bancassurane offi cers Insurance Benefi ts Education Assistance Scheme
Fixed Components
Basic salary and traveling allowance are the fi xed components in the package which is based on the scope and complexity of the role and is reviewed annually. Annual performance appraisals are conducted and increments and promotions are granted purely based on results of such exercises. Distribution of performance gradings in the year-end appraisal process is shown in the graph below. Overall competence and performance are key factors that determine an individual’s base pay.
Variable Components
The main component of our variable pay is the annual bonus to employees at all levels based on individual performance as evaluated at the annual performance appraisals and the

144
Remuneration Committee Report
performance of the Company. In addition, the Distribution Management Team, other marketing personnel in the distribution network and the Bancassurance Offi cers are entitled to a production bonus scheme based on achievement of business targets under pre determined criteria.
Other Employee Benefi ts
Benefi ts provided to employees include vehicle loans, examination loans, other loans, various insurance benefi ts including the Staff Health Insurance Cover, Critical Illness Cover and the Personal Accident Cover, regular health check ups and doctor consultations through a reputed medical services provider.
Retirement Benefi ts
There are no retirement benefi ts to employees other than gratuity.
Board of Directors
No remuneration is paid to Non-Executive Directors other than the nominal fees paid based on their participation at Board and Sub Committee meetings. The Managing Director’s remuneration is decided by the Board annually on the recommendation of the Remuneration Committee based on the achievement of Company objectives and individual performance. Total fees and remuneration paid to all Directors is disclosed on page 189. Non-Executive Directors are not entitled to retirement benefi ts. The Managing Director is entitled to gratuity as all other employees.
Share Plans for Directors
The Company does not have a share plan for Directors.
Directors’ Shareholding
The shareholdings of Directors are provided on page 147.
Personal Loans for Directors
No Director is entitled to Company loans.
M U de SilvaChairman - Remuneration Committee
Colombo, Sri Lanka31st January 2011

145HNB ASSURANCE PLC ANNUAL REPORT 2010
Annual Report of the Board of Directors on the Aff airs of the CompanyThe Board of Directors of HNB Assurance PLC (the Company) has pleasure in presenting their Report with the audited Financial Statements for the year ended 31st December 2010 and the Auditors’ Report thereon. The Financial Statements were accepted and approved by the Board of Directors on 31st January 2011.
Principal Activities
General Insurance and Life Insurance businesses remained the principal activity of the Company with no signifi cant changes during the fi nancial year under review. The Company has not engaged in any activities which contravene laws and regulations of the country.
Review of Performance and Future Developments
A review of the Company’s fi nancial and operational performance during the year and future developments is contained in the Chairman’s Message (pages 6 to 7), Review of the Managing Director (pages 8 to 11) and Management Discussion and Analysis (pages 19 to 54). These reports, together with the Financial Statements, refl ect the state of affairs of the Company and form an integral part of this report.
Financial Statements
The Financial Statements of the Company are prepared in conformity with the Sri Lanka Accounting Standards (SLAS) laid down by the Institute of Chartered Accountants of Sri Lanka (ICASL) and comply with the requirements of the Companies Act, No. 7 of 2007 and the Regulation of Insurance Industry Act, No. 43 of 2000 and other rules and regulations of the Insurance Board of Sri Lanka (IBSL). The formats and disclosures are also in accordance with the Statement of Recommended Practice (SoRP) for Insurance Contracts, adopted by the Institute of Chartered Accountants of Sri Lanka (ICASL).
The Financial Statements of the Company for the year ended 31st December 2010 duly signed by the Chairman, Managing Director and Head of Finance of the Company are given on pages 158 to 198 which form an integral part of the Annual Report of the Board.
Signifi cant Accounting Policies
The signifi cant accounting policies adopted in preparation of these Financial Statements are given on pages 168 to 175. There were no material changes in the accounting policies adopted with those of the previous year.
Going Concern
The Board has made necessary reviews and inquiries including review of the Company’s budget and Corporate Plan for ensuing years, future prospects and risks, capital expenditure requirements, cash fl ows, etc. Accordingly, the Board is satisfi ed that the Company has adequate resources to continue its
operations in the foreseeable future and continues to adopt the going concern basis in preparing these Financial Statements.
Auditors
The Financial Statements for the year ended 31st December 2010 have been audited by Messrs. KPMG Ford, Rhodes, Thornton & Co., (Chartered Accountants) and their report on the Financial Statements which form an integral part of the Report of the Board of Directors is given on page 157 of this Annual Report.
Reappointment of Auditors
The retiring Auditors, Messrs. KPMG Ford, Rhodes, Thornton & Co., have expressed their willingness to continue in offi ce as the Company Auditor. In accordance with the Companies Act, No. 7 of 2007, a resolution relating to their re-appointment and authorising the Directors to determine their remuneration will be proposed at the forthcoming Annual General Meeting.
Auditors Fees and Expenses
The fees paid/ payable to auditors Messrs. KPMG Ford, Rhodes, Thornton & Co., for the services provided to the Company during the year together with corresponding fi gures for the previous year are presented below.
2010 2009 Rs.’000 Rs.’000
Audit Fees and Expenses 888 800Audit Related Fees and Expenses 551 100Total 1,439 900
Audit related fees and expenses consist of fees for the interim audit, reports issued to Commissioner General of Inland Revenue (CGIR), Insurance Board of Sri Lanka (IBSL), etc. As far as the Directors are aware, the Auditors do not have any relationship (other than that of an Auditor) with the Company. The Auditors have provided a declaration confi rming their independence.
Risk and Internal Control
The Board considers that strong internal controls are integral to the sound management of the Company and is committed to maintain strict fi nancial, operational and risk management controls over all activities of the Company.
The Directors are ultimately responsible for the Company’s system of internal controls and for reviewing its effectiveness. Such a system is designed to manage, rather than eliminate, the risk of failure to achieve business objectives and can provide only reasonable and not absolute assurance against material misstatement or loss.
The Company has an ongoing process for identifying, evaluating

146
Annual Report of the Board of Directors on the
Aff airs of the Companyand managing the risks that are faced by the Company, and the Directors have reviewed this process through the Audit Committee.
The Board is satisfi ed with the effectiveness of the system of internal control for the year under review and up to the date of approval of the Annual Report and Financial Statements.
Corporate Governance
The Board of Directors is committed to maintain an effective Corporate Governance structure and process and to be in compliance with all possible rules, regulations and best practices on Corporate Governance.
The Company, being a listed Company of the Colombo Stock Exchange (CSE), is fully compliant with the rules on Corporate Governance under the Listing Rules of the CSE with regard to the composition of the Board and its Sub Committees. In addition, the Company is substantially compliant with the Code of Best Practice on Corporate Governance issued jointly by the Securities and Exchange Commission of Sri Lanka (SEC) and Institute of Chartered Accountants of Sri Lanka (ICASL).
A separate report on governance is given on pages 103 to 119.
Turnover / Gross Written Premium (GWP)
The total turnover as measured by Gross Written Premium (GWP) of the Company for the fi nancial year under review amounted to Rs. 2,428 million (2009 - Rs. 2,116 million). The above GWP is made up of General and Life Insurance premium income amounting to Rs. 1,344 million (2009 - Rs. 1,131 million) and Rs. 1,084 million (2009 - Rs. 985 million) respectively.
A detailed analysis of the total GWP achieved by the Company is given in Note 20 to the Financial Statements on page 185.
Financial Results and Appropriations
The Income Statement of the Company is given on page 159. Transfers to/from reserves of the Company are shown in the Statement of Changes in Equity on page 160.
Description 2010 2009 Rs. ’000 Rs. ’000
Profi t Before Taxation (PBT) 269,525 231,081Income Tax Expense (27,786) (29,471)Profi t After Taxation (PAT) 241,739 201,610Unappropriated Profi t brought forward 455,851 301,116Profi ts available for appropriation 697,590 502,726Appropriations Dividends Paid (56,250) (46,875)Unappropriated Profi t carried forward 641,340 455,851
Dividends
The Board of Directors is satisfi ed with the Solvency Test in terms of the provisions of the Companies Act, No. 7 of 2007, immediately after distribution of the fi rst and fi nal dividends proposed and to be paid on 7th April 2011. The Statement of Solvency prepared by the Board was audited by Messrs. KPMG Ford, Rhodes, Thornton & Co.
The Board of Directors recommend a fi rst and fi nal dividend of Rs. 1.80 (2009 - Rs. 1.50) per share payable on 7th April 2011 to holders of issued and paid up Ordinary Shares of the Company as at the close of business on 29th March 2011.
The dividend will be paid partly out of dividend received and partly out of taxable profi ts of the Company. The dividends to be paid out of profi ts will be subject to withholding tax.
The Board of Directors
The Board of Directors of the Company consists of nine Directors (2009 – nine Directors) during the year with wide fi nancial and commercial knowledge and experience.
The following Directors held offi ce as at the Balance Sheet date and their brief profi les are given on pages 12 and 14 of the Annual Report.
Name of the Director Status
Rienzie T. Wijetilleke (Chairman) Non-Executive DirectorManjula de Silva (Managing Director) Executive DirectorM U de Silva Non-Executive DirectorPratapkumar de Silva Independent Non-Executive DirectorD M de S Wijeyeratne Independent Non-Executive DirectorSarath Ratwatte Independent Non-Executive DirectorR Theagarajah Non-Executive DirectorJ M J Perera Non-Executive DirectorJ D N Kekulawala Non-Executive Director
Appointments of Directors
No new appointments were made to the Board during the year under review.
Retirement and re-election/ Re-appointment of Directors recommended
Mr. M U de Silva retires by rotation at the AGM and offers himself for re-election under the Articles of Association of the Company.
Mr. Rienzie T. Wijetilleke and Mr. Pratapkumar de Silva – Directors, having attained the age of 70 years, retire at the AGM under the provisions of the Companies Act. Mr. Pratapkumar de Silva offers himself for re-appointment. Mr. Rienzie T. Wijetilleke has declared that he would not be offering himself for re-appointment.

147HNB ASSURANCE PLC ANNUAL REPORT 2010
The re-election/re-appointment of the aforesaid Directors has the unanimous support of the Board.
Board Sub Committees
The Board while assuming the overall responsibility and accountability in the management of the Company has also appointed Board Committees to ensure control over certain affairs of the Company, conforming to Corporate Governance Standards of the Listing Rules of the Colombo Stock Exchange (CSE) and adopting best practices. Accordingly, the following Committees have been constituted by the Board.
• Audit Committee• Remuneration Committee• Nomination Committee
In addition, the Board has appointed an Investment Committee comprising members of the Board and an outside expert to oversee control over investments. The composition of each
Name of the Director Board Audit Remuneration Investment Nomination Meetings Committee Committee Committee Committee Meetings Meetings Meetings Meetings
A B A B A B A B A B
Rienzie T. Wijetilleke (Chairman) 12 11 - - - - - - - -
Manjula de Silva (Managing Director) 12 12 - - - - 4 4 - -
M U de Silva 12 11 - 2 2 - - - -
Pratapkumar de Silva 12 10 - - - - - - - -
D M de S Wijeyeratne 12 11 5 5 2 2 - - - -
Sarath Ratwatte 12 11 5 5 2 2 4 4 - -
R Theagarajah 12 12 - - - - - - - -
J M J Perera 12 12 - - - - - - - -
J D N Kekulawala 12 9 5 5 - - 4 4 - -
A = Number of meetings held during the period the Director held offi ce in the yearB = Number of meetings attended.
Committee is given on page 126 which is a part of the Annual Report of the Board.
Directors’ Meetings
The number of Directors’ meetings which comprise Board meetings, Audit Committee meetings, Remuneration Committee meetings, Nomination Committee meetings and Investment Committee meetings together with the attendance of each Director at these meetings during the year are tabulated above.
Directors’ responsibility for Financial Reporting
The Directors are responsible for the preparation and presentation of these Financial Statements of the Company
to refl ect a true and fair view of the state of its affairs of the Company. The Statement of Directors’ Responsibility for Financial Reporting is given on page 152 which forms an integral part of the Annual Report of the Board of Directors.
Directors’ Interests Registers
The Company maintains a Directors’ Interest Register conforming to the provisions of the Companies Act.
All Directors of the Company have disclosed their interests in other Companies to the Board and those interests are recorded in the Interest Register conforming to the provisions of the Companies Act. The particulars of those entries are set out on page 151 of the Financial Statements which form an integral part of the Annual Report of the Board of Directors.
a) Directors’ Interests in Contracts
None of the Directors had a direct or indirect interest in any contracts or proposed contracts with the Company other than as disclosed on page 151.
b) Directors’ Interests in Shares as at the Balance Sheet date.
The following table discloses the Directors’ interest in shares of the Company.
Name of the Director As at As at 31st Dec 31st Dec 2010 2009
Rienzie T. Wijetilleke 750 750Manjula de Silva 25,000 25,000M U de Silva 2,250 2,250Pratapkumar de Silva 1,000 -D M de S Wijeyeratne 500 500Sarath Ratwatte 11,000 11,000R Theagarajah 6,250 6,250J M J Perera 5,250 5,250J D N Kekulawala 30,000 26,000
148
Annual Report of the Board of Directors on the
Aff airs of the Company
There has been no change in their interests in shares between 31st December 2010 and 31st January 2011, being the date of this Report.
c) Directors’ Remuneration and Other Benefi ts
Total Directors’ emoluments including post employment benefi ts to Directors for the fi nancial year ended 31st December 2010 is Rs. 16.7 million (2009 - Rs. 12.8 million). Directors are not allowed to obtain loans of any kind from the Company.
The Managing Director’s remuneration is decided by the Board with the recommendation of the Remuneration Committee considering the individual and Company performance. Due attention is also paid to industry standards, infl ationary factors and future plans when deciding the remuneration package of the Managing Director.
No remuneration is paid to Non- Executive Directors other than the nominal fees paid in line with the attendance of each Director to Board and Sub Committee meetings.
Related Party Transactions
The Directors have also disclosed the transactions with related parties in terms of Sri Lanka Accounting Standard 30, Related Party Disclosures (revised 2005), which is adopted in the preparation of these Financial Statements. Those transactions disclosed by the Directors are given in Note 31 to the Financial Statements in page 188 which forms a part of the Annual Report of the Board.
Share Information
Information relating to earnings, dividend, net assets and market price per share is given on page 202. Information on share trading is also given on page 202 of the Annual Report.
Shareholding
The number of registered shareholders of the Company as at 31st December 2010 was 3,665 (2009 - 3,845). The distribution and analysis of shareholdings are given on pages 200 and 201.
Equitable Treatment to all Shareholders
The Company has at all times ensured that all shareholders are treated equitably.
Major Shareholders
The twenty largest shareholders of the Company as at 31st December 2010, together with comparative shareholding as at 31st December 2009 are given on page 201. Hatton National Bank PLC (Mr. Rienzie T. Wijetilleke, Chairman and Mr. R. Theagarajah, Managing Director who are also Directors of the Company) owns 59.99% (2009 - 59.99%) shares of HNB Assurance PLC.
Corporate Donations
The Company made charitable donations amounting to Rs. 300,000 (2009 - Rs. 300,000). This includes the supply of medical and other needed items to a value of Rs. 200,000 to the Pediatric Unit of the General Hospital, Kegalle. Additionally, the Company donated a sum of Rs. 100,000 to religious institutions belonging to the four main religions. No donations were made to political parties or for politically infl uential activities.
Taxation
Income Taxes are computed on rates enacted or substantively enacted as at the Balance Sheet date. The Income Tax rate applicable to the Company’s operations is 35% (2009 - 35%). The income tax expense of the Company is given in Note 28 to the Financial Statements on page 187.
As further explained in Note 28.3 to the Financial Statements, no Deferred Tax asset is recognised since it is not probable that future taxable profi ts will be adequate to utilise the available tax losses fully in the foreseeable future.
Statutory payments
The Directors, to the best of their knowledge and belief, are satisfi ed that all statutory payments in relation to the Government, the Insurance Board of Sri Lanka (IBSL) and related to the employees have been made on time.
Compliance with Laws and Regulations
The Company has complied with all applicable laws and regulations. A compliance checklist is signed on a quarterly basis by responsible offi cers, and reported to the Audit Committee.
The Company has submitted all returns and other required details to the relevant regulators on or before the due dates.
Investments
The amount of investments (excluding cash and cash equivalents) held by the Company as at 31st December 2010 amounted to Rs. 3,404 million (2009 - Rs. 2,717 million). A detailed description of the Investments held is disclosed in Note 4 to the Financial Statements on pages 176 and 179.
Property, Plant and Equipment (PPE)
The capital expenditure on acquisition of Property, Plant and Equipment during the year amounted to Rs. 44.9 million (2009 - Rs. 53.2 million). Net book value of Property, Plant and Equipment as at the Balance Sheet date amounted to Rs. 131 million (2009 - Rs. 117 million). An analysis of the Property, Plant and Equipment of the Company, additions and disposals made together with the depreciation charge for the year are set out in Note 6 to the Financial Statements on page 180.

149HNB ASSURANCE PLC ANNUAL REPORT 2010
Market Value of Property, Plant and Equipment (PPE)
The Company uses the cost method as the accounting policy for maintaining records of Property, Plant and Equipment and the market value of such assets is considered not materially different to the book values.
Intangible Assets
The capital expenditure on acquisition of Intangible Assets during the year amounted to Rs. 22.2 million (2009 - Rs. 40 million) which is mainly the expenditure on acquisition of the new software TCS Bancs. The Net Book Value of Intangible Assets as at the Balance Sheet date amounted to Rs. 67 million (2009 - Rs. 55 million). A movement of Intangible Assets from the balance as at 1st January 2010 to the balance as at 31st December 2010 having additions and disposals made together with the amortisation charge for the year are set out in Note 5 to the Financial Statements on page 179.
Capital Commitments
No signifi cant capital expenditure commitments exist as at 31st December 2010 (2009 - Rs. Nil).
Liabilities Provisions
The Directors have taken all reasonable steps to ensure adequate provisioning for all known liabilities.
Adequate provisions are made for unearned premiums and claims outstanding including provisions for Claims Incurred But Not Reported (IBNR) and Claims Incurred But Not Enough Reported (IBNER) in General Insurance. The Directors have also consulted an independent Actuary in the process of valuing IBNR and IBNER reserves and his report is given on page 154.
Moreover, the Directors have arranged a Consultant Actuary to value the Life Fund and the report of the Consultant Actuary is given on page 155.
Gratuity liability was also valued by an independent Actuary as required by the Sri Lanka Accounting Standards No 16 - Employee Benefi ts (revised 2006).
As at the date of this report, the Directors are not aware of any circumstances which would render inadequate provisions made in the Financial Statements.
Contingencies
In the opinion of the Directors, and in consultation with the Company Lawyers, litigation currently pending against the Company would not have a material impact on the reported fi nancial results of the Company. All pending litigations for claims have been evaluated and adequate provisions have been made in these Financial Statements where necessary.
Stated Capital and Reserves
The stated capital of the Company as at 31st December 2010 was Rs. 375 million (2009 - Rs. 375 million) comprising 37,500,000 ordinary shares. There were no changes in the stated capital during the year.
The total reserves of the Company as at 31st December 2010 amounted to Rs. 641.3 million (2009 - Rs. 455.9 million). The movement of reserves is shown in the Statement of Changes in Equity on page 160.
Minimum Capital Requirements to continue General and Life Insurance Businesses
Section 13 (b) of the Regulation of Insurance Industry Act, No. 43 of 2000 requires a minimum stated capital of Rs. 100 million each to carry on General and Life Insurance businesses. HNB Assurance has an issued and fully paid stated capital of Rs. 375 million and therefore has fulfi lled the above mentioned statutory requirement. The Company has set aside Rs. 100 million out of Shareholders’ funds and invested in a separate fund, namely the Life Shareholder’s Fund, which is dedicated to the solvency requirements of Life Insurance.
Environment
The Company’s activities can have direct or indirect effects on the environment. It is the policy of the Company to minimise any such adverse effects by recycling resources as much as possible and creating awareness among its staff on current global environmental threats. The Company does its best to comply with the relevant environmental laws and regulations and has not engaged in any activity that is harmful or hazardous to the environment.
Events occurring after the Balance Sheet Date
There have not been any material events that occurred subsequent to the Balance Sheet date which requires adjustments to or disclosure in the Financial Statements other than the proposal of dividends for the year which is disclosed in Note 30 to these Financial Statements.
Human Resources
The employment strategies of the Company are framed to employ, train, develop and retain the best talent available. In order to facilitate the process of matching people to jobs, the Company’s employment policy is structured to include recruitment from external sources as well as internal promotions. The Company always respects the merits of the individual and provides career opportunities irrespective of gender, race or religion. The island wide distribution network of the Company helps providing employment opportunities to youth from almost all parts of the country, including the North and the East.

150
Recruitment levels are determined by the staff requirements forecast, which is updated every year. The annual staff requirements forecast is prepared by considering the projected growth and expansion of the distribution network, profi tability, expense ratio, level of automation of activities, productivity, work volumes, multiple skills etc. The number of employees as at 31st December 2010 was 597 (2009 - 540).
Medical and Life Insurance is available for all employees of the Company irrespective of their period of service. The Company encourages sports and recreational activities by supporting the Employees’ Welfare Society, which organises such activities, in addition to those organised by the Company’s HR Department.
Code of Conduct and Ethics
The Company has adopted a Code of Business Conduct and Ethics for all its employees and has mandated that it should be followed without any exception. There were no material violations of the Code during the year except certain insignifi cant fraudulent activities noted at the operational level for which appropriate action has been taken.
Vision, Mission and Corporate Conduct
The Company’s vision and mission is provided on page 2 of this report. In achieving its vision and mission, all Directors and employees conduct their activities with the highest level of ethical standards and integrity as set out in the Code of Ethics and in conformity with the values stated on page 2 of this report.
Reports of the Audit Committee and the Remuneration Committee
The Audit Committee and the Remuneration Committee reports are given on pages 140 to 142 and 143 to 144 respectively of this Annual Report.
Annual General Meeting
The ninth Annual General Meeting of the Company will be held at the Auditorium on level 22 of “HNB Towers” at No. 479, T B Jayah Mawatha, Colombo 10 on Tuesday, the 29th day of March 2011 at 10.00 in the forenoon. The Notice of the ninth Annual General Meeting is on page 208 of the Annual Report.
For and on behalf of the Board
Rienzie T. Wijetilleke Manjula de Silva Indrani Goonesekera Chairman Managing Director Board Secretary
Colombo, Sri Lanka31st January, 2011
Annual Report of the Board of Directors on the
Aff airs of the Company

151HNB ASSURANCE PLC ANNUAL REPORT 2010
Directors’ Interest in contracts with the Companya) The Company carries out transactions in the ordinary course of business at commercial rates with entities in which a Director of
the Company is the Chairman or a Director. The transactions with entities where a Director of the Company either has control or exercises signifi cant infl uence have been classifi ed as related party transactions and disclosed in Note No. 31 to the Financial State-ments. The details of such entities are given below.
Company Name of Director / Relationship
Hatton National Bank PLC Rienzie T. Wijetilleke – Chairman
R Theagarajah - Managing Director
Sithma Development (Pvt) Ltd Rienzie T. Wijetilleke - Chairman
R Theagarajah - Director
J D N Kekulawala - Director
Acuity Partners (Pvt) Ltd. R Theagarajah - Chairman
J M J Perera - Director
Acuity Securities Ltd R Theagarajah - Chairman
J M J Perera - Director
Acuity Stockbrokers (Pvt) Ltd. R Theagarajah - Chairman
J M J Perera - Director
Alliance Finance Co. PLC Pratapkumar de Silva - Chairman & Jt. Managing Director
Alliance Tech Trading (Pvt) Ltd. Pratapkumar de Silva - Chairman
Aprico Finance Co. PLC Pratapkumar de Silva - Chairman
Colours of Courage Trust (Guarantee) Ltd. R Theagarajah - Director
b) The entities where Directors of the Company neither have control nor exercise signifi cant infl uence, but only hold directorship and has transactions during the year are disclosed below:
Company Name of Director/Relationship Nature of Transaction Transaction Amount
2010 2009 Rs. ‘000 Rs. ‘000
Nawaloka Hospitals PLC Rienzie T. Wijetilleke - Director Insurance Premiums General 77 23

152
Directors’ Responsibility forFinancial ReportingThe responsibility of the Directors in relation to the Financial Statements of the Company prepared in accordance with the provisions of the Companies Act, No. 7 of 2007 is set out in the following statement. The responsibilities of the External Auditors in relation to the Financial Statements are set out in the Report of the Auditors given on page 157 of the Annual Report.
As per the provisions of the Companies Act, No. 7 of 2007 the Directors are required to prepare Financial Statements for each fi nancial year and place them before a general meeting. The Financial Statements comprise the balance sheet as at 31st December 2010, the Income Statement, Statement of Changes in Equity and Cash Flow statement for the year then ended and notes thereto.
The Financial Statements of the Company give a true and fair view of:
1. the state of affairs of the Company as at the Balance Sheet date; and
2. the profi t or loss of the Company for the fi nancial year ended on the Balance Sheet date.
In preparing these Financial Statements, the Directors are re-quired to ensure that:
1. the appropriate accounting policies have been selected and applied in a consistent manner and material departures, if any, have been disclosed and explained;
2. judgments and estimates have been made which are reason-able and prudent; and
3. all applicable accounting standards, as relevant have been followed.
The Directors are also required to ensure that the Company has adequate resources to continue in operation to justify applying the going concern basis in preparation of these Financial State-ments.
Further, the Directors have a responsibility to ensure that the Company maintains suffi cient accounting records to disclose, with reasonable accuracy the fi nancial position of the Company.
These Financial Statements which have been prepared and presented in the Report are consistent with the underlying books of accounts and are in conformity with the requirements of Sri Lanka Accounting Standards, Companies Act, No. 7 of 2007, Sri Lanka Accounting and Auditing Standards Act, No. 15 of 1995, Regulation of Insurance Industry Act, No. 43 of 2000 and the Listing Rules of the Colombo Stock Exchange. In addition, the Financial Statements are in conformity with the formats and disclosures prescribed in the Statement of Recommended Practice (SoRP) for Insurance Companies issued by the Institute of Chartered Accountants of Sri Lanka (ICASL).
The Directors have also taken reasonable steps to establish and maintain appropriate systems of internal controls to safeguard the assets of the Company, prevent and detect frauds and other irregularities and to secure as far as practicable the accuracy and reliability of records.
Directors are required to prepare the Financial Statements and to provide the Company’s External Auditors, Messrs KPMG Ford, Rhodes, Thornton & Company, with every opportunity to carry out whatever reviews and sample checks on the system of internal control they may consider appropriate and necessary for express-ing their independent audit opinion on the Financial Statements.
Further, as required by the Section 56(2) of the Companies Act, No. 7 of 2007, the Board of Directors has confi rmed that the Company, based on the information available, would satisfy the solvency test immediately after the distribution of dividends, in accordance with the Section 57 of the Companies Act, No. 7 of 2007, and has obtained a certifi cate from the Auditors, prior to declaring a fi nal dividend of Rs. 1.80 per share for this year, to be paid on 7th April 2011.
The Directors to the best of their knowledge and belief are satis-fi ed that all statutory payments in relation to all relevant regula-tory and statutory authorities which were due and payable by the Company as at the Balance Sheet date have been paid or where relevant provided for.
The Directors are of the view that they have discharged their responsibilities as set out in this statement.
By order of the Board
Indrani GoonesekeraBoard Secretary
Colombo, Sri Lanka31st January 2011

153HNB ASSURANCE PLC ANNUAL REPORT 2010
Chief Executive Offi cer’s and Chief Financial Offi cer’s Responsibility Statement The Financial Statements are prepared in compliance with the Sri Lanka Accounting Standards (SLAS) issued by the Institute of Chartered Accountants of Sri Lanka (ICASL) and the requirements of the Companies Act, No. 7 of 2007 and the Regulation of Insurance Industry Act, No. 43 of 2000. The formats and disclosures are also in accordance with the Statement of Recommended Practice for Insurance Contracts (SoRP), adopted by the Institute of Chartered Accountants of Sri Lanka (ICASL). The accounting policies used in the preparation of the Financial Statements are appropriate and are consistently applied, unless otherwise stated in the notes accompanying the Financial Statements.
The Board of Directors and the Management of the Company accept responsibility for the integrity and objectivity of these Financial Statements. The estimates and judgments relating to these Financial Statements were made on a prudent and reasonable basis, in order that the Financial Statements refl ect in a true and fair manner, the form and substance of transactions and that the Company’s state of affairs is reasonably presented. To ensure this, the Company has taken proper and suffi cient care in installing a system of internal control and accounting records, for safeguarding assets and for preventing and detecting frauds as well as other irregularities, which is reviewed, evaluated and updated on an ongoing basis. Our Internal Auditors have
conducted periodic audits to provide reasonable assurance that the established policies and procedures of the Company were consistently followed. However, there are inherent limitations that should be recognised in weighing the assurances provided by any system of internal controls and accounting.
The Financial Statements were audited by Messrs. KPMG Ford, Rhodes, Thornton & Co., Chartered Accountants, the Independent Auditors.
The Audit Committee of the Company meets periodically with the Internal Auditors and the External Auditors to review the manner in which these Auditors are performing their responsibilities, and to discuss auditing, internal controls and fi nancial reporting issues. To ensure complete independence, the External Auditors and the Internal Auditors have full and free access to the members of the Audit Committee to discuss any matter of substance.
We confi rm that the Company has complied with all applicable laws and regulations and guidelines and that there are no material litigations that are pending against the Company other than those arising in the normal course of conducting insurance business.
Manjula de Silva Vipula DharmapalaManaging Director / Chief Executive Offi cer Head of Finance / Chief Financial Offi cer
Colombo, Sri Lanka31st January 2011

154
Certifi cation of Incurred But Not Reported (IBNR) and Incurred But Not Enough Reported (IBNER) Claims Reserve
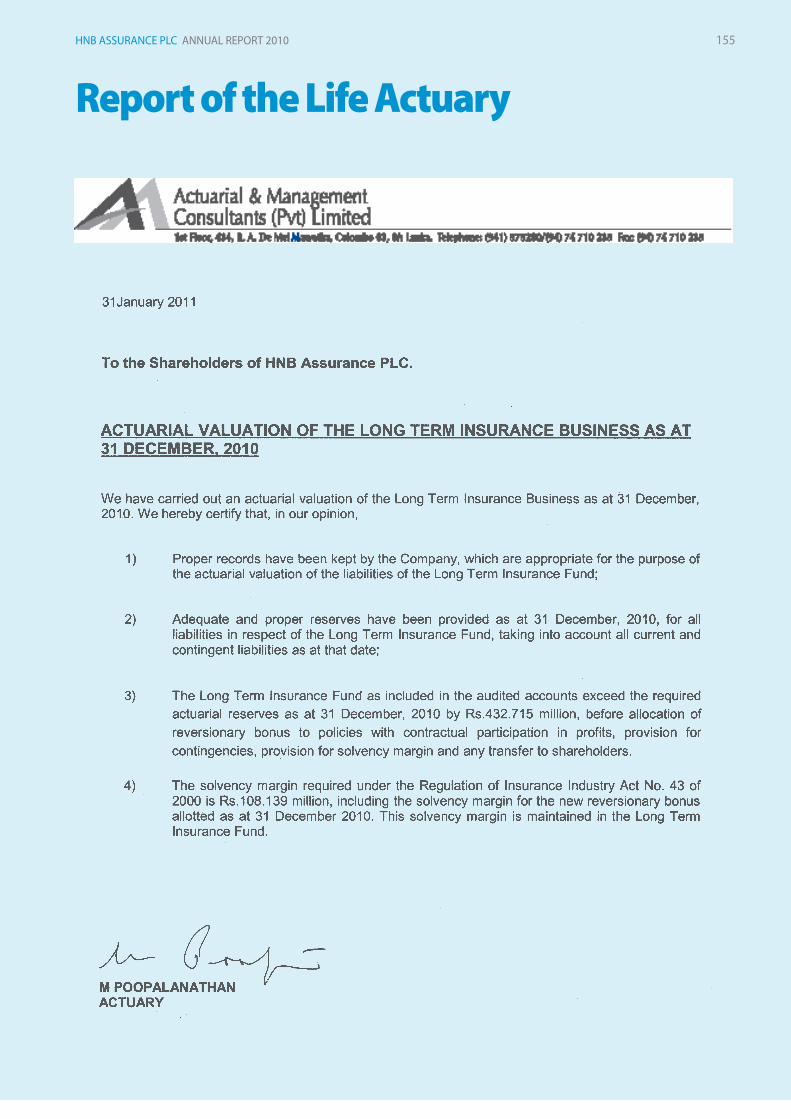
155HNB ASSURANCE PLC ANNUAL REPORT 2010
Report of the Life Actuary

156
Financial Calendar
SUBMISSION OF STATUTORY RETURNS TO IBSL Date of Submission Deadlines set by IBSL
• Annual Audited Financial Statement for year ended 31st December 2009 24th February 2010 30th June 2010
• Annual Statutory Returns for the year ended 31st December 2009 1st June 2010 30th June 2010
• Quarterly Returns for 2010 - March 13th May 2010 15th May 2010 - June 4th August 2010 15th August 2010 - September 12th November 2010 15th November 2010 - December 14th February 2011 15th February 2011
• Biannual Compliance (Circular 18) Certifi cate - 30th June 2010 6th August 2010 15th August 2010 - 31st December 2010 11th February 2011 15th February 2011
All IBSL statutory returns are submitted within the stipulated time lines
FINANCIAL CALENDAR Target set for 2011 Achievements in 2010
Interim Unaudited Reports 1st Quarter (ended 31st March) May 2011 26th April 2010 2nd Quarter (ended 30th June) August 2011 4th August 2010 3rd Quarter (ended 30th September) November 2011 29th October 2010 4th Quarter (ended 31st December) February 2012 3rd February 2011
Annual Report and Accounts 2009 February 2010 2010 February 2011 Dividend Payments First and fi nal dividend for 2009 April 2010 First and fi nal dividend for 2010 April 2011 Annual General Meeting Eight Annual General Meeting 30th March 2010 Ninth Annual General Meeting 29th March 2011

157HNB ASSURANCE PLC ANNUAL REPORT 2010
Independent Auditor’s Report
TO THE SHAREHOLDERS OF HNB ASSURANCE PLC
Report on the Financial Statements
We have audited the accompanying fi nancial statements of HNB Assurance PLC (the “Company”), which comprise the balance sheet as at 31st December 2010, and the income statement, statement of changes in equity and cash fl ow statement for the year then ended, and a summary of signifi cant accounting policies and other explanatory notes exhibited on pages 158 to 198 this Annual Report.
Management’s Responsibility for the Financial Statements
Management is responsible for the preparation and fair presentation of these fi nancial statements in accordance with Sri Lanka Accounting Standards. This responsibility includes: designing, implementing and maintaining internal control relevant to the preparation and fair presentation of fi nancial statements that are free from material misstatement, whether due to fraud or error; selecting and applying appropriate accounting policies; and making accounting estimates that are reasonable in the circumstances.
Scope of Audit and Basis of Opinion
Our responsibility is to express an opinion on these fi nancial statements based on our audit. We conducted our audit in accordance with Sri Lanka Auditing Standards. Those standards require that we plan and perform the audit to obtain reasonable assurance whether the fi nancial statements are free from material misstatement.
An audit includes examining, on a test basis, evidence supporting the amounts and disclosures in the fi nancial statements. An audit also includes assessing the accounting policies used and signifi cant estimates made by management, as well as evaluating the overall fi nancial statement presentation.
We have obtained all the information and explanations which to the best of our knowledge and belief were necessary for the purposes of our audit. We therefore believe that our audit provides a reasonable basis for our opinion.
Opinion
In our opinion, so far as appears from our examination, the Company maintained proper accounting records for the year ended 31st December 2010 and the fi nancial statements give a true and fair view of the Company’s state of affairs as at 31st December 2010 and its profi t and cash fl ows for the year then ended in accordance with Sri Lanka Accounting Standards.
Report on Other Legal and Regulatory Requirements
These fi nancial statements also comply with the requirements of Section 151(2) of the Companies Act, No. 07 of 2007. Pursuant to Regulation of Insurance Industry Act, No. 43 of 2000 Section 47 (2), we also report, so far as appear from our examination, proper accounting records have been maintained as required by the relevant rules made by the Insurance Board of Sri Lanka.
CHARTERED ACCOUNTANTS Colombo,31st January 2011

158
Balance Sheet
As at 31st December, 2010 2009 Note No. Page No. Rs.’000 Rs.’000
Assets Investments 4 176 3,403,905 2,717,415 Intangible Assets 5 179 66,999 54,744 Property, Plant and Equipment 6 180 130,971 117,070 Loans to Life Policyholders 7 180 13,263 9,309 Reinsurance Receivables 8 180 122,431 73,824 Premium Receivables 9 181 231,929 157,029 Other Assets 10 181 497,352 448,210 Cash and Cash Equivalents 11 181 81,354 94,100 Total Assets 4,548,204 3,671,701 Liabilities and Equity Liabilities Insurance Provision - Life 12 181 2,385,246 1,853,513 Insurance Provision - General 13 182 730,658 599,364 Other Liabilities 14 183 308,901 282,542 Reinsurance Creditors 15 184 81,983 87,251 Retirement Benefi t Obligation 16 184 25,076 18,180 Total Liabilities 3,531,864 2,840,850 Equity Stated Capital 17 184 375,000 375,000 Revenue Reserves 18 184 641,340 455,851 Total Equity 1,016,340 830,851 Total Liabilities and Equity 4,548,204 3,671,701 The Notes to the Financial Statements set out on pages 168 to 198 form an integral part of these Financial Statements. These Financial Statements are in compliance with the requirements of the Companies Act, No. 07 of 2007.
Vipula Dharmapala Head of Finance/Chief Financial Offi cer The Board of Directors is responsible for the preparation and presentation of these Financial Statements.
Signed and on behalf of the Board;
Rienzie T. Wijetilleke Manjula de Silva Chairman Managing Director / Chief Executive Offi cer Colombo, Sri Lanka 31st January 2011

159HNB ASSURANCE PLC ANNUAL REPORT 2010
Statement of Income
For the Year Ended 31st December, 2010 2009 Change Note No. Page No. Rs.’000 Rs.’000 % Revenue 19 185 2,361,240 2,036,785 16 Gross Written Premium 20 185 2,428,183 2,115,647 15 Premium Ceded to Reinsurers (449,461) (453,517) (1)Net Written Premium 1,978,722 1,662,130 19 Net Change in Reserves for Unearned Premium (134,362) (94,383) 42 Net Earned Premium 1,844,360 1,567,747 18 Benefi ts, Losses and Expenses Insurance Claims and Benefi ts (Net) 21 185 (648,137) (511,911) 27 Increase in Life Insurance Fund 12 181 (531,733) (493,008) 8 Underwriting and Net Acquisition Costs 22 185 (164,991) (150,108) 10 Other Insurance Related Costs (15,758) (9,865) 60 Total Benefi ts, Losses and Expenses (1,360,619) (1,164,892) 17 Net Earned Premium less Benefi ts, Losses and Expenses 483,741 402,855 20 Other Revenue Income from Investments 23 186 517,198 467,823 11 Other Net Income / (Loss) 24 186 (318) 1,215 (126) Expenses Other Operating, Investment Related and Administration Expenses 25 186 (731,096) (640,768) 14 Profi t from Operations 26 186 269,525 231,125 17 Finance Expenses 27 186 - (44) (100)Profi t Before Taxation 269,525 231,081 17 Income Tax Expenses 28 187 (27,786) (29,471) (6)Profi t for the Year 241,739 201,610 20 Basic Earnings Per Share (Rs.) 29 188 6.45 5.38 20 Dividends Per Share (Rs.) 30 188 1.80 1.50 20 The Notes to the Financial Statements set out on pages 168 to 198 form an integral part of these Financial Statements.

160
Statement of Changes in Equity
For the Year Ended 31st December 2010 Number of Stated Capital Revenue Total Shares Reserves Equity ’000 Rs.’000 Rs.’000 Rs.’000
Balance as at 31st December 2008 37,500 375,000 301,116 676,116
Profi t for the Year - - 201,610 201,610
Dividend Paid for 2008 - - (46,875) (46,875)
Balance as at 31st December 2009 37,500 375,000 455,851 830,851
Profi t for the Year - - 241,739 241,739
Dividend Paid for 2009 - - (56,250) (56,250)
Balance as at 31st December 2010 37,500 375,000 641,340 1,016,340
The Notes to the Financial Statements set out on pages 168 to 198 form an integral part of these Financial Statements.

161HNB ASSURANCE PLC ANNUAL REPORT 2010
Cash Flow Statement
For the Year Ended 31st December, 2010 2009 Note No. Rs.’000 Rs.’000
Cash Flows from Operating Activities Premium Received from Customers 2,368,943 2,079,023 Reinsurance Premium Paid (364,416) (362,623)Claims Paid (739,086) (498,057)Reinsurance Receipts in Respect of Claims 85,215 53,680 Cash Paid to and on behalf of Employees (267,169) (220,603)Interest Received 490,107 429,806 Dividend Received 7,609 3,873 Other Operating Cash Payments (776,437) (707,233)Cash Infl ow Generated from Operating Activities (A) 804,766 777,866 Gratuity Paid (795) (648)Economic Service Charges (ESC) Paid (12,374) (14,247)Net Cash Generated from Operating Activities 791,597 762,971
Cash Flows from Investing Activities Purchase of Liquid Investments (Other than Cash Equivalents) (45,623,529) (21,037,765)Purchase of Other Investments (Other than Cash Equivalents) (496,835) (380,888)Sale of Liquid Investments (Other than Cash Equivalents) 45,246,960 20,546,911 Sale of Other Investments (Other than Cash Equivalents) 186,913 200,217 Purchase of Intangible Assets (22,238) (19,781)Purchase of Property, Plant and Equipment (39,734) (49,026)Proceeds on Sale of Property, Plant and Equipment 370 2,096 Net Cash used in Investing Activities (748,093) (738,236)
Net Cash Infl ow before Financing Activities 43,504 24,735
Cash Flows from Financing Activities Lease Installments Paid - (1,031)Dividend Paid (56,250) (46,875)Cash used in Financing Activities (56,250) (47,906)
Net Increase / (Decrease) in Cash and Cash Equivalents (B) (12,746) (23,171)
Notes to the Cash Flow Statement
A. Reconciliation of Profi t Before Taxation with Cash Flow from Operating Activities Profi t Before Taxation 269,525 231,081 Amortisation Charge 9,983 8,279 Depreciation Charge 30,354 26,933 Provision for Retiring Gratuity 7,691 7,510 Provision for Diminution in Value of Investments - (8,245)(Profi t)/ Loss on Sale of Property, Plant and Equipment 318 (1,215)Lease Interest Paid - 44 Increase in Trade and Other Receivables (204,761) (162,815)Increase in Life Insurance Fund 531,733 493,008 Increase in Unearned Premium 124,127 96,421 Increase in Claims Provisions 12,451 38,364 Increase in Creditors 23,345 48,501
Cash Infl ow Generated from Operating Activities 804,766 777,866
B. Increase / (Decrease) in Cash and Cash Equivalents Net Cash and Cash Equivalents at the end of the Year 11 81,354 94,100 Net Cash and Cash Equivalents at the beginning of the Year 11 94,100 117,271 Net Increase / (Decrease) in Cash and Cash Equivalents (12,746) (23,171)
The Notes to the Financial Statements set out on pages 168 to 198 form an integral part of these Financial Statements.

162
Balance Sheet Segmental Review - 2010 As at 31st December 2010 General Life Total Insurance Insurance Rs.’000 Rs.’000 Rs.’000
Assets Investments 1,161,203 2,242,702 3,403,905 Intangible Assets 46,096 20,903 66,999 Property, Plant and Equipment 126,398 4,573 130,971 Loans to Life Policyholders - 13,263 13,263 Reinsurance Receivables 103,814 18,617 122,431 Premium Receivables 231,929 - 231,929 Other Assets 251,434 245,918 497,352 Cash and Cash Equivalents 68,349 13,005 81,354 Total Assets 1,989,223 2,558,981 4,548,204 Liabilities and Equity Liabilities Insurance Provision - Life - 2,385,246 2,385,246 Insurance Provision - General 730,658 - 730,658 Other Liabilities 163,913 144,988 308,901 Reinsurance Creditors 56,642 25,341 81,983 Retirement Benefi t Obligation 21,670 3,406 25,076 Total Liabilities 972,883 2,558,981 3,531,864 Equity Stated Capital 375,000 - 375,000 Revenue Reserves 641,340 - 641,340 Total Equity 1,016,340 - 1,016,340 Total Liabilities and Equity 1,989,223 2,558,981 4,548,204 The Notes to the Financial Statements set out on pages 168 to 198 form an integral part of these Financial Statements.

163HNB ASSURANCE PLC ANNUAL REPORT 2010
Balance Sheet Segmental Review - 2009 As at 31st December 2009 General Life Total Insurance Insurance Rs.’000 Rs.’000 Rs.’000
Assets Investments 1,031,342 1,686,073 2,717,415 Intangible Assets 40,091 14,653 54,744 Property, Plant and Equipment 110,896 6,174 117,070 Loans to Life Policyholders - 9,309 9,309 Reinsurance Receivables 57,541 16,283 73,824 Premium Receivables 157,029 - 157,029 Other Assets 227,686 220,524 448,210 Cash and Cash Equivalents 48,848 45,252 94,100 Total Assets 1,673,433 1,998,268 3,671,701 Liabilities and Equity Liabilities Insurance Provision - Life - 1,853,513 1,853,513 Insurance Provision - General 599,364 - 599,364 Other Liabilities 165,321 117,221 282,542 Reinsurance Creditors 62,314 24,937 87,251 Retirement Benefi t Obligation 15,583 2,597 18,180 Total Liabilities 842,582 1,998,268 2,840,850 Equity Stated Capital 375,000 - 375,000 Revenue Reserves 455,851 - 455,851 Total Equity 830,851 - 830,851
Total Liabilities and Equity 1,673,433 1,998,268 3,671,701
The Notes to the Financial Statements set out on pages 168 to 198 form an integral part of these Financial Statements.

164
Income Statement Segmental Review - 2010 For the Year Ended 31st December 2010 General Life Total Insurance Insurance Note No. Rs.’000 Rs.’000 Rs.’000
Revenue 1,036,662 1,324,578 2,361,240 Gross Written Premium 20 1,343,703 1,084,480 2,428,183 Premium Ceded to Reinsurers (350,264) (99,197) (449,461)Net Written Premium 993,439 985,283 1,978,722 Net Change in Reserves for Unearned Premium (134,362) - (134,362)Net Earned Premium 859,077 985,283 1,844,360 Benefi ts, Losses and Expenses Insurance Claims and Benefi ts (Net) (588,237) (59,900) (648,137)Increase in Life Insurance Fund - (531,733) (531,733)Underwriting and Net Acquisition Costs 12,539 (177,530) (164,991)Other Insurance Related Costs (8,264) (7,494) (15,758)Total Benefi ts, Losses and Expenses (583,962) (776,657) (1,360,619) Net Earned Premium less Benefi ts, Losses and Expenses 275,115 208,626 483,741 Other Revenue Income from Investments 177,889 339,309 517,198 Other Net Income / (Loss) (304) (14) (318) Expenses Other Operating, Investment Related and Administration Expenses (339,175) (391,921) (731,096)Profi t from Operations 113,525 156,000 269,525 Finance Expenses - - - Profi t Before Taxation 113,525 156,000 269,525 Income Tax Expenses (27,786) - (27,786)Profi t for the Year 85,739 156,000 241,739
The Notes to the Financial Statements set out on pages 168 to 198 form an integral part of these Financial Statements.

165HNB ASSURANCE PLC ANNUAL REPORT 2010
Income Statement Segmental Review - 2009 For the Year Ended 31st December 2009 General Life Total Insurance Insurance Note No. Rs.’000 Rs.’000 Rs.’000
Revenue 833,247 1,203,538 2,036,785 Gross Written Premium 20 1,130,781 984,866 2,115,647 Premium Ceded to Reinsurers (360,459) (93,058) (453,517)Net Written Premium 770,322 891,808 1,662,130 Net Change in Reserves for Unearned Premium (94,383) - (94,383)Net Earned Premium 675,939 891,808 1,567,747 Benefi ts, Losses and Expenses Insurance Claims and Benefi ts (Net) (448,210) (63,701) (511,911)Increase in Life Insurance Fund - (493,008) (493,008)Underwriting and Net Acquisition Costs 1,887 (151,995) (150,108)Other Insurance Related Costs (2,561) (7,304) (9,865)Total Benefi ts, Losses and Expenses (448,884) (716,008) (1,164,892) Net Earned Premium less Benefi ts, Losses and Expenses 227,055 175,800 402,855 Other Revenue Income from Investments 156,091 311,732 467,823 Other Net Income / (Loss) 1,217 (2) 1,215 Expenses Other Operating, Investment Related and Administration Expenses (283,238) (357,530) (640,768)Profi t from Operations 101,125 130,000 231,125 Finance Expenses (44) - (44)Profi t Before Taxation 101,081 130,000 231,081 Income Tax Expenses (29,471) - (29,471)Profi t for the Year 71,610 130,000 201,610
The Notes to the Financial Statements set out on pages 168 to 198 form an integral part of these Financial Statements.

166
Cash Flow Statement Segmental Review - 2010 For the Year Ended 31st December 2010 General Life Total Insurance Insurance Rs.’000 Rs.’000 Rs.’000
Cash Flows from Operating Activities Premium Received from Customers 1,276,828 1,092,115 2,368,943 Reinsurance Premium Paid (270,398) (94,018) (364,416)Claims Paid (692,652) (46,434) (739,086)Reinsurance Receipts in Respect of Claims 65,155 20,060 85,215 Cash Paid to and on behalf of Employees (224,117) (43,052) (267,169)Interest Received 179,655 310,452 490,107 Dividend Received 6,102 1,507 7,609 Other Operating Cash Payments (70,738) (705,699) (776,437)Cash Infl ow Generated from Operating Activities 269,835 534,931 804,766 Gratuity Paid (534) (261) (795)Economic Service Charges (ESC) Paid (12,374) - (12,374)Net Cash Generated from Operating Activities 256,927 534,670 791,597
Cash Flows from Investing Activities Purchase of Liquid Investments (Other than Cash Equivalents) (17,627,530) (27,995,999) (45,623,529)Purchase of Other Investments (Other than Cash Equivalents) (207,593) (289,242) (496,835)Sale of Liquid Investments (Other than Cash Equivalents) 17,575,505 27,671,455 45,246,960 Sale of Other Investments (Other than Cash Equivalents) 129,757 57,156 186,913Purchase of Intangible Assets (12,536) (9,702) (22,238)Purchase of Property, Plant and Equipment (39,126) (608) (39,734)Proceeds on Sale of Property, Plant and Equipment 347 23 370 Net Cash used in Investing Activities (181,176) (566,917) (748,093)
Net Cash Infl ow before Financing Activities 75,751 (32,247) 43,504
Cash Flows from Financing Activities Lease Installments Paid - - - Dividend Paid (56,250) - (56,250)Cash used in Financing Activities (56,250) - (56,250)
Net Increase / (Decrease) in Cash and Cash Equivalents 19,501 (32,247) (12,746)
Notes to the Cash Flow Statement
A. Reconciliation of Profi t Before Taxation with Cash Flow from Operating Activities Profi t Before Taxation 113,525 156,000 269,525 Transfer of Profi t 156,000 (156,000) - Amortisation Charge 6,531 3,452 9,983 Depreciation Charge 28,183 2,171 30,354 Provision for Retiring Gratuity 6,621 1,070 7,691 Provision for Diminution in Value of Investments - - - (Profi t)/ Loss on Sale of Property, Plant and Equipment 304 14 318 Lease Interest Paid - - - Increase in Trade and Other Receivables (173,079) (31,682) (204,761)Increase in Life Insurance Fund - 531,733 531,733 Increase in Unearned Premium 124,127 - 124,127 Increase in Claims Provisions 7,167 5,284 12,451 Increase in Creditors 456 22,889 23,345 Cash Infl ow Generated from Operating Activities 269,835 534,931 804,766
B. Increase / (Decrease) in Cash and Cash Equivalents Net Cash and Cash Equivalents at the end of the Year 68,349 13,005 81,354 Net Cash and Cash Equivalents at the beginning of the Year 48,848 45,252 94,100 Net Increase / (Decrease) in Cash and Cash Equivalents 19,501 (32,247) (12,746)
The Notes to the Financial Statements set out on pages 168 to 198 form an integral part of these Financial Statements.

167HNB ASSURANCE PLC ANNUAL REPORT 2010
Cash Flow Statement Segmental Review - 2009 For the Year Ended 31st December 2009 General Life Total Insurance Insurance Rs.’000 Rs.’000 Rs.’000
Cash Flows from Operating Activities Premium Received from Customers 1,095,726 983,297 2,079,023 Reinsurance Premium Paid (265,305) (97,318) (362,623)Claims Paid (451,947) (46,110) (498,057)Reinsurance Receipts in Respect of Claims 38,264 15,416 53,680 Cash Paid to and on behalf of Employees (186,455) (34,148) (220,603)Interest Received 158,430 271,376 429,806 Dividend Received 3,708 165 3,873 Other Operating Cash Payments (49,788) (657,445) (707,233)Cash Infl ow Generated from Operating Activities 342,633 435,233 777,866 Gratuity Paid (568) (80) (648)Economic Service Charges (ESC) Paid (14,247) - (14,247)Net Cash Generated from Operating Activities 327,818 435,153 762,971
Cash Flows from Investing Activities Purchase of Liquid Investments (Other than Cash Equivalents) (9,692,626) (11,345,139) (21,037,765)Purchase of Other Investments (Other than Cash Equivalents) (325,658) (55,230) (380,888)Sale of Liquid Investments (Other than Cash Equivalents) 9,612,314 10,934,597 20,546,911 Sale of Other Investments (Other than Cash Equivalents) 153,748 46,469 200,217 Purchase of Intangible Assets (9,685) (10,096) (19,781)Purchase of Property, Plant and Equipment (48,584) (442) (49,026)Proceeds on Sale of Property, Plant and Equipment 2,095 1 2,096 Net Cash used in Investing Activities (308,396) (429,840) (738,236)
Net Cash Infl ow before Financing Activities 19,422 5,313 24,735
Cash Flows from Financing Activities Lease Installments Paid (1,031) - (1,031)Dividend Paid (46,875) - (46,875)Cash used in Financing Activities (47,906) - (47,906)Net Increase / (Decrease) in Cash and Cash Equivalents (28,484) 5,313 (23,171)
Notes to the Cash Flow Statement
A. Reconciliation of Profi t Before Taxation with Cash Flow from Operating Activities Profi t Before Taxation 101,081 130,000 231,081 Transfer of Profi t 130,000 (130,000) - Amortisation Charge 7,094 1,185 8,279 Depreciation Charge 24,518 2,415 26,933 Provision for Retiring Gratuity 6,514 996 7,510 Provision for Diminution in Value of Investments (4,643) (3,602) (8,245)(Profi t)/ Loss on Sale of Property, Plant and Equipment (1,217) 2 (1,215)Lease Interest Paid 44 - 44 Increase in Trade and Other Receivables (81,911) (80,904) (162,815)Increase in Life Insurance Fund - 493,008 493,008 Increase in Unearned Premium 96,421 - 96,421 Increase in Claims Provisions 32,737 5,627 38,364 Increase in Creditors 31,995 16,506 48,501 Cash Infl ow Generated from Operating Activities 342,633 435,233 777,866
B. Increase / (Decrease) in Cash and Cash Equivalents Net Cash and Cash Equivalents at the end of the Year 48,848 45,252 94,100 Net Cash and Cash Equivalents at the beginning of the Year 77,332 39,939 117,271 Net Increase / (Decrease) in Cash and Cash Equivalents (28,484) 5,313 (23,171) The Notes to the Financial Statements set out on pages 168 to 198 form an integral part of these Financial Statements.

168
Notes to the Financial Statements
1. REPORTING ENTITY
HNB Assurance PLC (“the Company”) is a Listed Company incorporated on 23rd August 2001 with limited liability and domiciled in Sri Lanka. The registered offi ce of the Company is situated at No. 479, T B Jayah Mawatha, Colombo 10 and the principal place of business is situated at No. 10, Sri Uttarananda Mawatha, Colombo 3. The Ordinary Shares of the Company are listed on the Colombo Stock Exchange (CSE).
1.1 Principal Activities and Nature of Operations
The principal activity of the Company continued to be carrying on insurance business (both Life and General Insurance). There were no signifi cant changes in the nature of the principal activities of the Company during the fi nancial year under review.
1.2 Parent Entity and Ultimate Parent Entity
The Company’s parent entity is Hatton National Bank PLC. In the opinion of the Directors, the Company’s ultimate parent undertaking and controlling party is Hatton National Bank PLC which is incorporated in Sri Lanka.
1.3 Date of Authorisation for Issue
The Financial Statements of the Company for the year ended 31st December 2010 were authorised for issue in accordance with a resolution of the Board of Directors on 31st January 2011.
1.4 Responsibility for Financial Statements
The Board of Directors is responsible for preparation and presentation of these Financial Statements.
1.5 Number of Employees
The staff strength of the Company as at 31st December 2010 is 597 (2009 - 540).
2. BASIS OF PREPARATION
2.1 Statement of Compliance
The Balance Sheet, Income Statement, Statement of Changes in Equity and Cash Flow Statement together with notes have been prepared in accordance with the Sri Lanka Accounting Standards (SLAS) laid down by the Institute of Chartered Accountants of Sri Lanka (ICASL), and comply with the requirements of the Companies Act, No. 7 of 2007 and the Regulation of Insurance Industry Act, No. 43 of 2000. The formats and disclosures are also in accordance with the Statement of Recommended Practice (SoRP) for Insurance Contracts, adopted by the Institute of Chartered Accountants of Sri Lanka (ICASL).
Supplementary Statements - Balance Sheet of the Life Insurance Fund
Supplementary Balance Sheet of the Life insurance Fund together with the notes is disclosed in page numbers 192 to 198 as required by the Statement of Recommended Practice (SoRP) for Insurance Contracts, adopted by the Institute of Chartered Accountants of Sri Lanka (ICASL).
2.2 Basis of Measurement
The Financial Statements have been prepared on the historical cost basis except for investments in quoted securities which are stated at the lower of cost and market value on a portfolio basis, and applied consistently.
2.3 Functional and Presentation Currency
The Financial Statements are presented in Sri Lankan Rupees, which is the Company’s functional currency. Except as indicated, fi nancial information presented in Sri Lankan Rupees has been rounded to the nearest thousand.
2.4 Use of Estimates and Judgements
The preparation of Financial Statements requires management to make judgements, estimates and assumptions that affect the application of accounting policies and the reported amounts of assets, liabilities, income and expenses. The estimates and underlying assumptions are based on historical experience and various other factors that are believed to be reasonable under the circumstances. Actual results may differ from these estimates.
Estimates and underlying assumptions are reviewed on an ongoing basis. Revisions to accounting estimates are recognised in the period in which the estimate is revised and in any future periods affected.
Information about signifi cant areas of estimation and uncertainty that have the most signifi cant effects on the amounts recognised in the Financial Statements are described below;
2.4.1 Assessment of Impairment
The Company assesses at each Balance Sheet date whether there is objective evidence that an asset or a portfolio of assets is impaired. The recoverable amount of an asset or a cash generating unit is the greater of its value in use and its fair value less cost to sell. In assessing value in use, the estimated future

169HNB ASSURANCE PLC ANNUAL REPORT 2010
cash fl ows are discounted to present value using appropriate discount rates that refl ect the current market assessments of the time value of money and risks specifi c to the asset.
2.4.2 Insurance Provision - Life
The valuation of the Long Term insurance business as at 31st December 2010 was made by the Consultant Actuary based on the assumptions set out in Note No. 12.
2.4.3 Unearned Premium Reserve and Deferred Acquisition Cost
The valuation of Unearned Premium Reserve and Deferred Acquisition Cost are measured in accordance with guidelines of the Regulation of Insurance Industry Act, No. 43 of 2000.
2.4.4 Reserve for Gross Outstanding Claims
Signifi cant delays occur in the notifi cation of claims and a substantial measure of experience and judgment is involved in assessing outstanding liabilities, the ultimate cost of which cannot be known with certainty as at the Balance Sheet date.
The Incurred But Not Reported (IBNR) and Incurred But Not Enough Reported (IBNER) claims reserve has been actuarially computed as set out in Note No. 13.4.
2.4.5 Retirement Benefi t Obligations
The Liability as at the Balance Sheet date was actuarially valued based on the assumptions set out in Note No. 16.
2.5 Materiality and Aggregation
Each material class of similar items is presented separately. Items of dissimilar nature or function are presented separately unless they are immaterial.
2.6 Comparative Information
Comparative information has been re-classifi ed where necessary, to conform to the current year’s presentations.
3. SIGNIFICANT ACCOUNTING POLICIES
The accounting policies are consistent with those used in the previous year and have been consistently applied by the Company.
3.1 Segmental Reporting
Segmental information refl ects General Insurance and Life Insurance. Inter-segment transfers are based on fair market prices.
The Company’s business activities are located in Sri Lanka. Consequently, assets and liabilities by geographic region are considered not material to be disclosed. Expenses directly identifi ed to a particular segment are charged accordingly. Expenses that cannot be directly identifi ed to a particular segment are allocated on a basis decided by the management and applied consistently throughout the year.
3.2 Foreign Currency Transactions
Transactions in foreign currencies are initially recorded at the functional currency rate ruling at the date of the transaction. Monetary assets and liabilities denominated in foreign currencies are retranslated at the functional currency rate of exchange ruling at the Balance Sheet date. Foreign exchange differences arising on the settlement or reporting of the Company’s monetary items at rates different from those which were initially recorded are dealt with in the Income Statement.
Non-monetary assets and liabilities denominated in foreign currency that are stated at historical cost at the Balance Sheet date are translated in to Sri Lankan Rupees at the foreign exchange rates ruling at the date of the initial transaction.
ASSETS AND BASES OF THEIR VALUATION
3.3 Investments
3.3.1 Investments in Government Securities
Investments in treasury bonds, treasury bills and repurchase agreements on government securities are stated at cost and interest is accrued up to the year end.
3.3.2 Investments in Debt Instruments
Debt instruments are held on a long term basis and stated at cost. Provision for diminution in value is made when there is a permanent decline in the value of the investment together with the accrued interest.
3.3.3 Investment in Quoted Equities and Unit Trusts
Investments in Quoted Equities and Unit Trusts are carried at the lower of cost and market value/Managers’ buying price determined on the basis of the

170
aggregate portfolio. Unrealised losses and gains arising from reduction in market value and reversals of such reduction required to state current investments at lower of cost and market value are included in the Income Statement.
3.3.4 Disposal of Investments
On disposal of an investment, the difference between net disposal proceeds and the carrying amount is recognised as an income or expense.
3.4 Intangible Assets
3.4.1 Basis of Recognition
An Intangible Asset is recognised if it is probable that future economic benefi ts that are attributable to the asset will fl ow to the Company and the cost of the asset can be measured reliably. All computer software costs incurred, licensed for use by the Company, which are not integrally related to the associated hardware, which can be clearly identifi ed, reliably measured and it is probable that they will lead to future economic benefi ts, are included in the Balance Sheet under the category of intangible assets and carried at cost less accumulated amortisation and any accumulated impairment losses.
3.4.2 Subsequent Expenditure
Subsequent expenditure incurred on software is capitalised only when it increases the future economic benefi ts embodied in the specifi c asset to which it relates. All other expenditure is expensed as incurred.
3.4.3 Amortisation
Intangible assets are amortised on a straight line basis in the Income Statement from the date when the asset is available for use, over the best estimate of its useful economic life. The estimated useful life of computer software is six years. Changes in the expected useful life or expected pattern of consumption of future economic benefi ts embodied in the asset is accounted for by changing the amortisation period or method, as appropriate, and treated as changes in accounting estimates.
The amortisation expense on intangible assets is recognised in the Income Statement in the expense category consistent with the function of the intangible asset.
3.4.4 De-recognition
An Intangible Asset is de-recognised on disposal or when no future economic benefi ts are expected from it.
The gain or loss arising from the de-recognition of such Intangible Assets is included in the Income Statement when the item is derecognised.
3.5 Property, Plant and Equipment
Property, Plant and Equipment are tangible items that are held for servicing, or for administrative purposes, and are expected to be used during more than one year.
3.5.1 Basis of Recognition
Property, Plant and Equipment is recognised if it is probable that future economic benefi ts associated with the asset will fl ow to the Company and cost of the asset can be measured reliably.
3.5.2 Measurement
An item of Property, Plant and Equipment that qualifi es for recognition as an asset is initially measured at its cost. Cost includes expenditure that is directly attributable to the acquisition of the asset and cost incurred subsequently to add to or replace a part of it. The cost of self constructed assets includes the cost of materials and direct labour, any other costs directly attributable to bringing the asset to a working condition for its intended use and the costs of dismantling and removing the items and restoring at the site on which they are located. Purchased software that is integral to the functionality of the related equipment is capitalised as a part of computer equipment. The Company applies the cost model to Property, Plant and Equipment and records at cost of purchase or construction together with any incidental expenses thereon less accumulated depreciation and any accumulated impairment losses.
3.5.3 Subsequent Costs
The cost of replacing a part of an item of Property, Plant and Equipment is recognised in the carrying amount of the item if it is probable that the future economic benefi ts embodied within the part will fl ow to the Company and its cost can be measured reliably.
The cost of day to day servicing of Property, Plant and Equipment are charged to the Income Statement as incurred.
3.5.4 Depreciation
The Company provides depreciation from the date the assets are available for use up to the date of disposal, at the following rates on a straight-line basis over the periods appropriate to the estimated useful lives of the different types of assets.
Notes to the Financial Statements
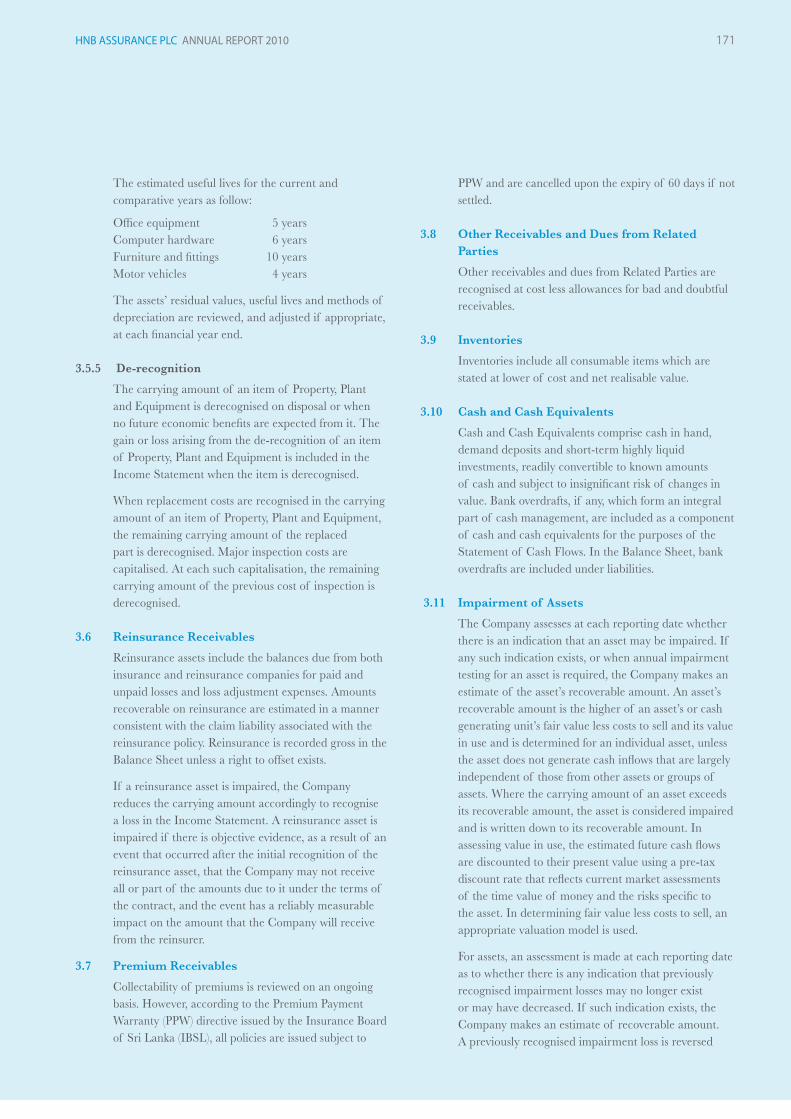
171HNB ASSURANCE PLC ANNUAL REPORT 2010
The estimated useful lives for the current and comparative years as follow:
Offi ce equipment 5 years Computer hardware 6 years Furniture and fi ttings 10 years Motor vehicles 4 years
The assets’ residual values, useful lives and methods of depreciation are reviewed, and adjusted if appropriate, at each fi nancial year end.
3.5.5 De-recognition
The carrying amount of an item of Property, Plant and Equipment is derecognised on disposal or when no future economic benefi ts are expected from it. The gain or loss arising from the de-recognition of an item of Property, Plant and Equipment is included in the Income Statement when the item is derecognised.
When replacement costs are recognised in the carrying amount of an item of Property, Plant and Equipment, the remaining carrying amount of the replaced part is derecognised. Major inspection costs are capitalised. At each such capitalisation, the remaining carrying amount of the previous cost of inspection is derecognised.
3.6 Reinsurance Receivables
Reinsurance assets include the balances due from both insurance and reinsurance companies for paid and unpaid losses and loss adjustment expenses. Amounts recoverable on reinsurance are estimated in a manner consistent with the claim liability associated with the reinsurance policy. Reinsurance is recorded gross in the Balance Sheet unless a right to offset exists.
If a reinsurance asset is impaired, the Company reduces the carrying amount accordingly to recognise a loss in the Income Statement. A reinsurance asset is impaired if there is objective evidence, as a result of an event that occurred after the initial recognition of the reinsurance asset, that the Company may not receive all or part of the amounts due to it under the terms of the contract, and the event has a reliably measurable impact on the amount that the Company will receive from the reinsurer.
3.7 Premium Receivables
Collectability of premiums is reviewed on an ongoing basis. However, according to the Premium Payment Warranty (PPW) directive issued by the Insurance Board of Sri Lanka (IBSL), all policies are issued subject to
PPW and are cancelled upon the expiry of 60 days if not settled.
3.8 Other Receivables and Dues from Related Parties
Other receivables and dues from Related Parties are recognised at cost less allowances for bad and doubtful receivables.
3.9 Inventories
Inventories include all consumable items which are stated at lower of cost and net realisable value.
3.10 Cash and Cash Equivalents
Cash and Cash Equivalents comprise cash in hand, demand deposits and short-term highly liquid investments, readily convertible to known amounts of cash and subject to insignifi cant risk of changes in value. Bank overdrafts, if any, which form an integral part of cash management, are included as a component of cash and cash equivalents for the purposes of the Statement of Cash Flows. In the Balance Sheet, bank overdrafts are included under liabilities.
3.11 Impairment of Assets
The Company assesses at each reporting date whether there is an indication that an asset may be impaired. If any such indication exists, or when annual impairment testing for an asset is required, the Company makes an estimate of the asset’s recoverable amount. An asset’s recoverable amount is the higher of an asset’s or cash generating unit’s fair value less costs to sell and its value in use and is determined for an individual asset, unless the asset does not generate cash infl ows that are largely independent of those from other assets or groups of assets. Where the carrying amount of an asset exceeds its recoverable amount, the asset is considered impaired and is written down to its recoverable amount. In assessing value in use, the estimated future cash fl ows are discounted to their present value using a pre-tax discount rate that refl ects current market assessments of the time value of money and the risks specifi c to the asset. In determining fair value less costs to sell, an appropriate valuation model is used.
For assets, an assessment is made at each reporting date as to whether there is any indication that previously recognised impairment losses may no longer exist or may have decreased. If such indication exists, the Company makes an estimate of recoverable amount. A previously recognised impairment loss is reversed

172
only if there has been a change in the estimates used to determine the asset’s recoverable amount since the last impairment loss was recognised. If that is the case, the carrying amount of the asset is increased to its recoverable amount.
LIABILITIES AND PROVISIONS
All known liabilities have been accounted for in preparing these Financial Statements.
3.12 Insurance Provision - Life
The Directors make the provision for the Life Insurance business based on the recommendation of the Independent Consultant Actuary following his annual investigation of the Life Insurance business. The actuarial valuation takes into account all liabilities including contingent liabilities and is based on assumptions recommended by the Independent Consultant Actuary.
3.13 Trade and Other Payables
Trade and other payables are stated at their cost.
3.14 Provisions (excluding Insurance Contracts)
Provisions are recognised when the Company has a present obligation (legal or constructive) as a result of a past event, where it is probable that an outfl ow of resources embodying economic benefi ts will be required to settle the obligation and a reliable estimate can be made of the amount of the obligation. When the Company expects some or all of a provision to be reimbursed, the reimbursement is recognised as a separate asset when the reimbursement is virtually certain. The expense relating to any provision is presented in the Income Statement net of any reimbursement.
3.15 Employee Benefi ts
3.15.1 Defi ned Benefi t Plan - Gratuity
A defi ned benefi t plan is a post-employment benefi t plan other than a defi ned contribution plan. Gratuity is a defi ned benefi t plan. The Company accounts for the provision for Defi ned Benefi t Plan - Gratuity in conformity with SLAS 16 - Employee Benefi ts (revised 2006). However, under the payment of Gratuity Act, No. 12 of 1983, the liability to an employee arises only on completion of fi ve years of continued service. The Company measured the present value of promised retirement benefi ts of Gratuity using the actuarial valuation method as recommended by SLAS 16 -
Employee Benefi ts (revised 2006), every year using the Projected Unit Credit method (PUC). The Gratuity liability is not externally funded.
3.15.2 Defi ned Contribution Plan
A defi ned contribution plan is a post-employment benefi t plan under which an entity pays fi xed contributions into a separate entity and will have no legal or constructive obligation to pay a further amount. Obligations for contributions to defi ned contribution plans are recognised as an expense in the Income Statement as and when they are due.
a) Employees Provident Fund
All employees of the Company are members of the Employees’ Provident Fund (EPF). The Company and employees contribute 12% and 8% respectively of the basic salary to EPF.
b) Employees Trust Fund
All employees of the Company are members of the Employees’ Trust Fund (ETF). The Company contributes 3% of the basic salary of each employeeto ETF.
3.16 Income Tax Expense
Income tax expense comprises current tax and deferred tax. Income tax expense is recognised in the Income Statement except to the extent that it relates to items recognised directly in equity, in which case it is recognised in equity.
3.16.1 Current Taxation
Current tax is the expected tax payable on the taxable income for the year, using tax rates enacted or substantively enacted on the Balance Sheet date, and any adjustment to tax payable in respect of previous years. Provision for taxation is based on the profi t for the year adjusted for taxation purposes in accordance with the provisions of the Inland Revenue Act, No. 10 of 2006 and the amendments thereto.
3.16.2 Deferred Tax
Deferred taxation is provided using the liability method, providing for temporary differences between the carrying amounts of assets and liabilities for fi nancial reporting purposes and the tax base of assets and liabilities, which is the amount attributed to those assets and liabilities for tax purposes. The amount of deferred tax provided is based on the expected manner of realisation or settlement of the carrying amount
Notes to the Financial Statements

173HNB ASSURANCE PLC ANNUAL REPORT 2010
of assets and liabilities, using tax rates enacted or substantively enacted by the reporting date.
Deferred tax assets, including those related to temporary tax effects of income tax losses and credits available to be carried forward, are recognised only to the extent that it is probable that future taxable profi ts will be available against which the asset can be utilised. Deferred tax assets, if any, are reviewed at each reporting date and are reduced to the extent that it is no longer probable that the related tax benefi t will be realised.
3.16.3 Withholding Tax on Dividends
Withholding tax that arises from the distribution of dividends by the Company is recognised at the same time as the liability to pay the related dividend is recognised.
3.16.4 Economic Service Charge (ESC)
As per the provisions of the Economic Service Charge Act, No. 13 of 2006, ESC is payable on the liable turnover at specifi ed rates. ESC is deductible from the income tax liability. Any unclaimed liability can be carried forward and set off against the income tax payable as per the relevant provisions in the Act.
3.16.5 Social Responsibility Levy (SRL)
As per the provisions of the Finance Act, No. 5 of 2005, as amended by the Finance Act, No. 8 of 2008, a Social Responsibility Levy (SRL) was introduced with effect from 1st January 2005. SRL is payable at the rate of 1.5% on all taxes and levies chargeable as specifi ed in the First Schedule of the Act.
3.17 Capital Commitments and Contingencies
All discernible risks are accounted for in determining the amount of all known liabilities. Contingent liabilities are possible obligations whose existence will be confi rmed only by uncertain future events or present obligations where the transfer of economic benefi t is not probable or cannot be reliably measured. Contingent liabilities are not recognised in the Balance Sheet but are disclosed unless they are remote.
3.18 Events Occurring after the Balance Sheet Date
All material post Balance Sheet events have been considered and where appropriate, adjustments or disclosures have been made in the respective notes to the Financial Statements.
3.19 Proposed Dividends
Dividend proposed by the Board of Directors after the Balance Sheet date is not recognised as a liability and is only disclosed as a Note to the Financial Statements (Note 30). Provision for dividend is recognised only at the time the dividend proposed by the Board of Directors is approved by the shareholders at the Annual General Meeting.
3.20 Earnings Per Share
The Company presents basic and diluted Earnings Per Share (EPS) data for its ordinary shares. Basic EPS is calculated by dividing the profi t or loss attributable to ordinary shareholders of the Company by the weighted average number of ordinary shares outstanding during the period. Diluted EPS is determined by dividing the profi t or loss attributable to the ordinary shareholders by the weighted average number of ordinary shares outstanding adjusted for the effects of all dilutive potential ordinary shares.
3.21 Cash Flow Statement
The Cash Flow Statement has been prepared using the Direct Method of preparing Cash Flows in accordance with the Sri Lanka Accounting Standard (SLAS) 9, Cash Flow Statements. Interest and dividend received are classifi ed as operating cash fl ows. Cash and cash equivalents comprise short term, highly liquid investments that are readily convertible to known amounts of cash and are subject to an insignifi cant risk of changes in value. The cash and cash equivalents include cash in-hand, balances with banks and short term deposits with banks. For cash fl ow purposes, cash and cash equivalents are presented net of bank overdrafts.
INSURANCE SPECIFIC TRANSACTIONS AND BALANCES
3.22 General Insurance Business
3.22.1 Gross Written Premium
Gross Written Premium is generally recognised as written upon inception of the policy. Upon inception of the contract, premiums are recorded as written and are earned primarily on a pro-rata basis over the term of the related policy coverage. However, for those contracts for which the period of risk differs signifi cantly from the contract period, premiums are earned over the period of risk in proportion to the amount of insurance protection provided.
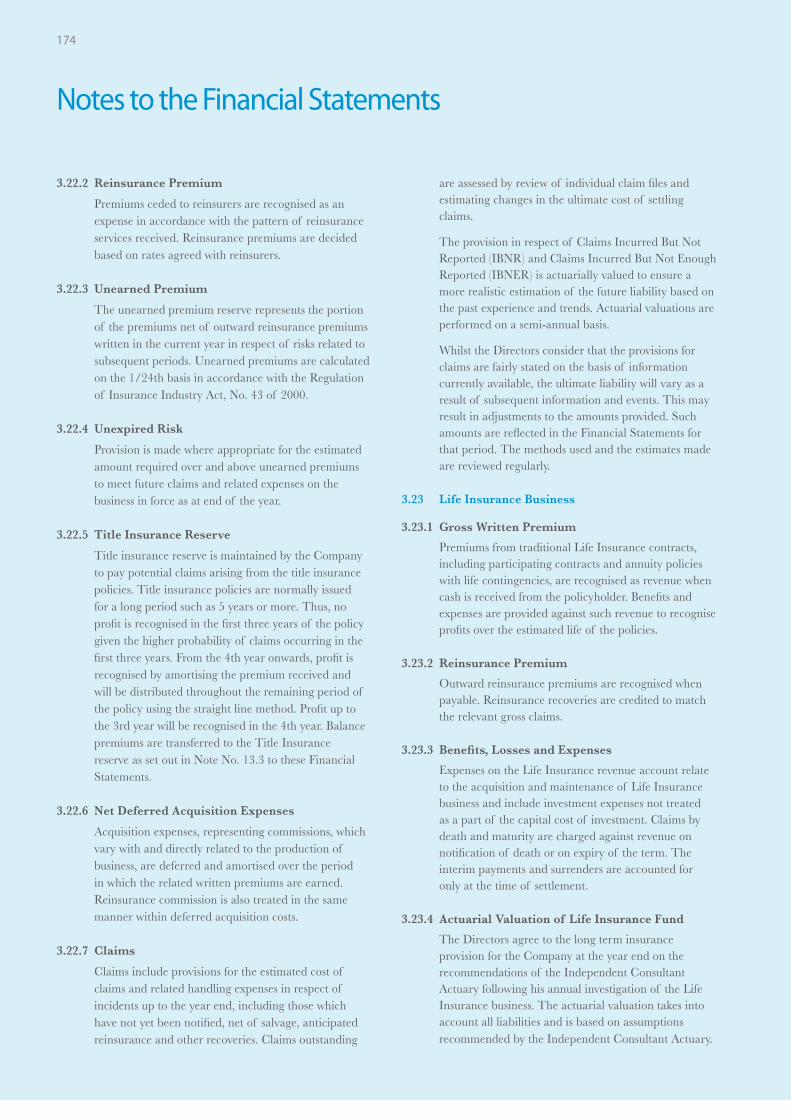
174
3.22.2 Reinsurance Premium
Premiums ceded to reinsurers are recognised as an expense in accordance with the pattern of reinsurance services received. Reinsurance premiums are decided based on rates agreed with reinsurers.
3.22.3 Unearned Premium
The unearned premium reserve represents the portion of the premiums net of outward reinsurance premiums written in the current year in respect of risks related to subsequent periods. Unearned premiums are calculated on the 1/24th basis in accordance with the Regulation of Insurance Industry Act, No. 43 of 2000.
3.22.4 Unexpired Risk
Provision is made where appropriate for the estimated amount required over and above unearned premiums to meet future claims and related expenses on the business in force as at end of the year.
3.22.5 Title Insurance Reserve
Title insurance reserve is maintained by the Company to pay potential claims arising from the title insurance policies. Title insurance policies are normally issued for a long period such as 5 years or more. Thus, no profi t is recognised in the fi rst three years of the policy given the higher probability of claims occurring in the fi rst three years. From the 4th year onwards, profi t is recognised by amortising the premium received and will be distributed throughout the remaining period of the policy using the straight line method. Profi t up to the 3rd year will be recognised in the 4th year. Balance premiums are transferred to the Title Insurance reserve as set out in Note No. 13.3 to these Financial Statements.
3.22.6 Net Deferred Acquisition Expenses
Acquisition expenses, representing commissions, which vary with and directly related to the production of business, are deferred and amortised over the period in which the related written premiums are earned. Reinsurance commission is also treated in the same manner within deferred acquisition costs.
3.22.7 Claims
Claims include provisions for the estimated cost of claims and related handling expenses in respect of incidents up to the year end, including those which have not yet been notifi ed, net of salvage, anticipated reinsurance and other recoveries. Claims outstanding
are assessed by review of individual claim fi les and estimating changes in the ultimate cost of settling claims.
The provision in respect of Claims Incurred But Not Reported (IBNR) and Claims Incurred But Not Enough Reported (IBNER) is actuarially valued to ensure a more realistic estimation of the future liability based on the past experience and trends. Actuarial valuations are performed on a semi-annual basis.
Whilst the Directors consider that the provisions for claims are fairly stated on the basis of information currently available, the ultimate liability will vary as a result of subsequent information and events. This may result in adjustments to the amounts provided. Such amounts are refl ected in the Financial Statements for that period. The methods used and the estimates made are reviewed regularly.
3.23 Life Insurance Business
3.23.1 Gross Written Premium
Premiums from traditional Life Insurance contracts, including participating contracts and annuity policies with life contingencies, are recognised as revenue when cash is received from the policyholder. Benefi ts and expenses are provided against such revenue to recognise profi ts over the estimated life of the policies.
3.23.2 Reinsurance Premium
Outward reinsurance premiums are recognised when payable. Reinsurance recoveries are credited to match the relevant gross claims.
3.23.3 Benefi ts, Losses and Expenses
Expenses on the Life Insurance revenue account relate to the acquisition and maintenance of Life Insurance business and include investment expenses not treated as a part of the capital cost of investment. Claims by death and maturity are charged against revenue on notifi cation of death or on expiry of the term. The interim payments and surrenders are accounted for only at the time of settlement.
3.23.4 Actuarial Valuation of Life Insurance Fund
The Directors agree to the long term insurance provision for the Company at the year end on the recommendations of the Independent Consultant Actuary following his annual investigation of the Life Insurance business. The actuarial valuation takes into account all liabilities and is based on assumptions recommended by the Independent Consultant Actuary.
Notes to the Financial Statements

175HNB ASSURANCE PLC ANNUAL REPORT 2010
INCOME STATEMENT
3.24 Income from Investments and Other Income
Investment income and Other Income is accounted for on the following basis:
Interest income - on accrual basis Dividends - when the right to receive is established Capital gains / losses - as and when realised / incurred Other Income - on accrual basis
3.25 Profi t / Loss on Sale of Property, Plant and Equipment
Profi t / loss on Sale of Property, Plant and Equipment is recognised in the period in which the sale occurs and is classifi ed under other income.
3.26 Expenses
3.26.1 Interest and Other Expenses
Interest and other expenses are recognised on an accrual basis.
3.26.2 Operating Leases
Payments made under operating leases are recognised in the Income Statement on a straight line basis over the term of the lease.
3.26.3 Commission and Fee Expenses
Commission and fee expenses are recognised on an accrual basis.
FUTURE CHANGES IN ACCOUNTING POLICIES
3.27 New Accounting Standards issued but not effective as at Balance Sheet date
The Institute of Charted Accountants of Sri Lanka has issued a new volume of Sri Lanka Accounting Standards which will become applicable for fi nancial periods beginning on or after 1st January 2012. Accordingly these Standards have not been applied in preparing these Financial Statements as they were not effective for the year ended 31st December 2010.
These Sri Lanka Accounting Standards comprise Accounting Standards prefi xed both SLFRS (corresponding to IFRS)and LKAS (corresponding to IAS). Application of Sri Lanka Accounting Standards prefi xed SLFRS and LKAS for the fi rst time shall be deemed to be an adoption of SLFRS’s.
The Company is currently in the process of evaluating the potential effects of these Standards on its Financial Statements and the impact on the adoption of these Standards have not been quantifi ed as at Balance Sheet date.
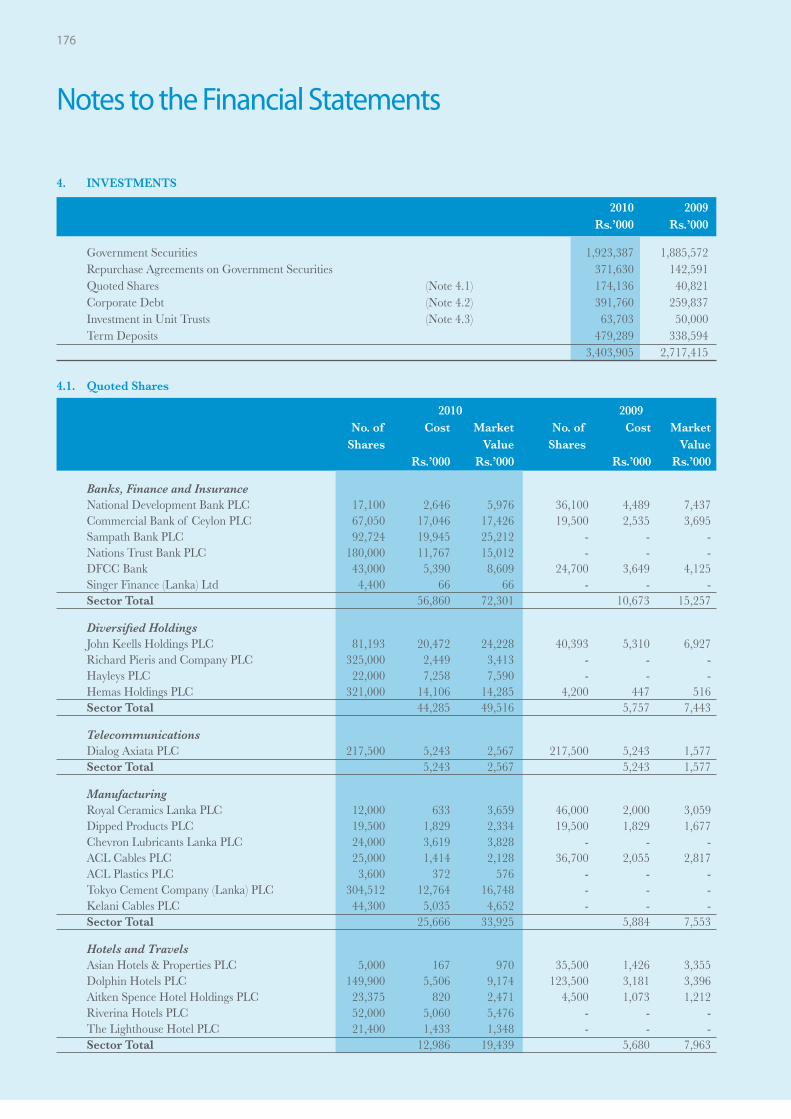
176
4. INVESTMENTS
2010 2009 Rs.’000 Rs.’000
Government Securities 1,923,387 1,885,572 Repurchase Agreements on Government Securities 371,630 142,591 Quoted Shares (Note 4.1) 174,136 40,821 Corporate Debt (Note 4.2) 391,760 259,837 Investment in Unit Trusts (Note 4.3) 63,703 50,000 Term Deposits 479,289 338,594 3,403,905 2,717,415
4.1. Quoted Shares
2010 2009 No. of Cost Market No. of Cost Market Shares Value Shares Value Rs.’000 Rs.’000 Rs.’000 Rs.’000
Banks, Finance and Insurance National Development Bank PLC 17,100 2,646 5,976 36,100 4,489 7,437 Commercial Bank of Ceylon PLC 67,050 17,046 17,426 19,500 2,535 3,695 Sampath Bank PLC 92,724 19,945 25,212 - - - Nations Trust Bank PLC 180,000 11,767 15,012 - - - DFCC Bank 43,000 5,390 8,609 24,700 3,649 4,125 Singer Finance (Lanka) Ltd 4,400 66 66 - - - Sector Total 56,860 72,301 10,673 15,257
Diversifi ed Holdings John Keells Holdings PLC 81,193 20,472 24,228 40,393 5,310 6,927 Richard Pieris and Company PLC 325,000 2,449 3,413 - - - Hayleys PLC 22,000 7,258 7,590 - - - Hemas Holdings PLC 321,000 14,106 14,285 4,200 447 516 Sector Total 44,285 49,516 5,757 7,443
Telecommunications Dialog Axiata PLC 217,500 5,243 2,567 217,500 5,243 1,577 Sector Total 5,243 2,567 5,243 1,577
Manufacturing Royal Ceramics Lanka PLC 12,000 633 3,659 46,000 2,000 3,059 Dipped Products PLC 19,500 1,829 2,334 19,500 1,829 1,677 Chevron Lubricants Lanka PLC 24,000 3,619 3,828 - - - ACL Cables PLC 25,000 1,414 2,128 36,700 2,055 2,817 ACL Plastics PLC 3,600 372 576 - - - Tokyo Cement Company (Lanka) PLC 304,512 12,764 16,748 - - - Kelani Cables PLC 44,300 5,035 4,652 - - - Sector Total 25,666 33,925 5,884 7,553
Hotels and Travels Asian Hotels & Properties PLC 5,000 167 970 35,500 1,426 3,355 Dolphin Hotels PLC 149,900 5,506 9,174 123,500 3,181 3,396 Aitken Spence Hotel Holdings PLC 23,375 820 2,471 4,500 1,073 1,212 Riverina Hotels PLC 52,000 5,060 5,476 - - - The Lighthouse Hotel PLC 21,400 1,433 1,348 - - - Sector Total 12,986 19,439 5,680 7,963
Notes to the Financial Statements

177HNB ASSURANCE PLC ANNUAL REPORT 2010
4. INVESTMENTS (Contd.)
4.1. Quoted Shares
2010 2009 No. of Cost Market No. of Cost Market Shares Value Shares Value Rs.’000 Rs.’000 Rs.’000 Rs.’000
Chemicals and Pharmaceuticals Chemical Industries (Colombo) PLC 116,500 10,905 16,392 63,600 3,882 4,007 Haycarb PLC 20,500 3,547 3,454 - - - Sector Total 14,452 19,846 3,882 4,007
Power and Energy Laugfs Gas Ltd 26,700 614 692 - - - Laugfs Gas Ltd - (Non Voting) 19,200 288 355 - - - Hemas Power PLC - - - 65,000 1,300 1,268 Sector Total 902 1,047 1,300 1,268
Construction and Engineering Colombo Dockyard PLC - - - 6,000 974 1,469 Sector Total - - 974 1,469
Beverage Food and Tobacco Renuka Agri Foods PLC 309,100 815 2,071 318,300 716 716 Cargills (Ceylon) PLC - - - 12,000 712 783 Sector Total 815 2,071 1,428 1,499
Information Technology PC House PLC 178,800 1,967 2,020 - - - Sector Total 1,967 2,020 - -
Investment Trusts Renuka Holdings PLC 70,000 2,970 4,333 - - - Sector Total 2,970 4,333 - -
Health Care Asiri Hospital Holdings PLC 928,200 7,990 8,168 - - - Sector Total 7,990 8,168 - -
Portfolio Total 174,136 215,233 40,821 48,036
Less. Provision for Diminution in Market Value Brought Forward - (8,245)
(Provision)/Reversal Made During the Year - 8,245 Provision for Diminution in Market Value Carried Forward - -
Carrying Value of total Investment in Quoted Shares 174,136 40,821

178
4. INVESTMENTS (Contd.)4.2 Corporate Debt
2010 2009
Redeemable No. of Cost Market Interest Rate No. of Cost Market Interest Rate Date Debentures Value (Per Annum) Debentures Value (Per Annum) Rs.’000 Rs.’000 Rs.’000 Rs.’000
a) Debentures - Quoted
Hatton National Bank PLC 31/03/2012 125,000 12,500 12,500 6 Month Net TB 125,000 12,500 12,500 6 Month Net TB
+2.25% +2.25%
Hatton National Bank PLC 31/03/2021 75,000 7,500 7,500 11% 75,000 7,500 7,500 11%
DFCC Bank 31/02/2016 5,000 5,000 5,000 14% 5,000 5,000 5,000 14%
DFCC Bank 26/09/2012 5,000 5,000 5,000 6 Months Gross TB 5,000 5,000 5,000 6 Months Gross TB
+1% +1%
Seylan Bank PLC 26/09/2011 100,000 10,000 10,000 16.75% 100,000 10,000 10,000 16.75%
Sampath Bank PLC 29/05/2012 250,000 25,000 25,000 3 Month Gross TB 250,000 25,000 25,000 3 Month Gross TB
+ 1.5% +1.5%
Singer Sri Lanka PLC 29/08/2012 240,000 24,000 24,000 1 Year Gross TB 240,000 24,000 24,000 1 Year Gross TB
+1.65% +1.65%
Bank of Ceylon 30/09/2012 200,000 20,000 20,000 6 Month Gross TB 200,000 20,000 20,000 6 Month Gross TB
+0.75% +0.75%
Bank of Ceylon 28/06/2015 200,000 20,000 20,000 11.50% - - - -
Bank of Ceylon 23/11/2013 150,000 15,000 15,000 6 Month Gross TB - - - -
+0.75%
Nations Trust Bank PLC 30/04/2013 17,000 17,000 17,000 20.53% 17,000 17,000 17,000 20.53%
Urban Development Authority 05/10/2015 1,124,200 112,420 112,420 11.00% - - - -
Total Investment in Quoted Debentures 273,420 273,420 126,000 126,000
Redeemable No. of Cost Directors’ Interest Rate No. of Cost Directors’ Interest Rate Date Debentures Valuation (Per Annum) Debentures Valuation (Per Annum) Rs.’000 Rs.’000 Rs.’000 Rs.’000
b) Debentures - Unquoted
Singer Sri Lanka PLC - - - - 50,000 5,000 5,000 14%
Senkadagala Finance Ltd 21/09/2012 40,000 40,000 40,000 15.50% 40,000 40,000 40,000 15.50%
Seylan Bank PLC 23/11/2011 150,000 15,000 15,000 15% 150,000 15,000 15,000 15%
DSI Holdings Ltd 31/12/2015 25,500 25,500 25,500 13.50% - - - -
Total Investment in Unquoted Debentures 80,500 80,500 60,000 60,000
c) Commercial Papers
People’s Merchant Bank PLC - - - 12,018 12,018 15.25%
Sampath Leasing and Factoring Ltd - - - 22,023 22,023 21.66%
Abans (Pvt) Ltd 06/06/2011 27,840 27,840 11.90% 29,796 29,796 13.70%
Total Investment in Commercial Paper 27,840 27,840 63,837 63,837
d) Promissory Notes
People’s Leasing Co. Ltd 23/06/2011 10,000 10,000 12.50% 10,000 10,000 19.25%
Total Investment in Promissory Notes 10,000 10,000 10,000 10,000
Total Investment in Corporate Debt 391,760 391,760 259,837 259,837
Notes to the Financial Statements

179HNB ASSURANCE PLC ANNUAL REPORT 2010
4. INVESTMENTS (Contd.)
4.3 Unit Trusts
2010 2009 No. of Units Cost Market No. of Units Cost Market Value/ Value/ Managers’ Managers’ Buying Buying price price Rs.’000 Rs.’000 Rs.’000 Rs.’000
Quoted NAMAL Acuity Value Fund 114,400 7,203 10,296 - - -
Total Investment in Quoted Unit Trusts 7,203 10,296 - - -
Unquoted
Ceybank Gilt-Edged Fund 1,500,000 15,000 18,480 1,500,000 15,000 18,705
NAMAL Gilt-Edged Fund 1,000,000 10,000 12,870 1,000,000 10,000 12,840
Ceybank Savings plus Money Market Fund 2,500,000 25,000 26,350 2,500,000 25,000 26,250
Ceylon Financial Sector Fund 664,622 6,500 6,267 - - -
Total Investment in Unquoted Unit Trusts 56,500 63,967 50,000 57,795 Total Investment in Unit Trusts 63,703 74,263 50,000 57,795
5. INTANGIBLE ASSETS
Balance Additions/ Disposals/ Balance As at Transfers Transfers As at 01.01.2010 31.12.2010 Rs.’000 Rs.’000 Rs.’000 Rs.’000
5.1 Gross Carrying Amounts At Cost Computer Software 63,484 31,666 - 95,150
5.2 Amortisation At Cost Computer Software 32,859 9,983 - 42,842
5.3 Capital work in progress At Cost Software under Development 24,119 18,344 27,772 14,691
5.4 Net Book Values At Cost Computer Software 30,625 52,308 Software under development 24,119 14,691 Total Carrying Amount of Intangible Assets 54,744 66,999
5.5 Capital work in progress represents the capital expenditure incurred for upgrading the Computer Software, which is in progress as at the year end.
5.6 During the fi nancial year, the Company acquired Intangible Assets (Computer Software) to the aggregate value of Rs. 22.2 million (2009 - Rs. 40 million). Cash payments amounting to Rs. 22.2 million (2009 - Rs. 19.8 million) were made during the year for purchase of Intangible Assets (Computer Software).
5.7 Intangible Assets includes fully depreciated Computer Software which are in the use of normal business activities having a cost of Rs. 21.2 million (2009 - Rs. 5.2 million)

180
Notes to the Financial Statements
6. PROPERTY, PLANT AND EQUIPMENT
As at Additions/ Disposals/ As at 01.01.2010 Transfers Transfers 31.12.2010 Rs.’000 Rs.’000 Rs.’000 Rs.’000
6.1 Gross Carrying Amounts At Cost Computer Hardware 87,965 21,238 - 109,203 Motor Vehicles 17,143 366 100 17,409 Offi ce Equipment 36,402 9,709 1,749 44,362 Furniture and Fittings 60,744 13,632 700 73,676 Total Value of Depreciable Assets 202,254 44,945 2,549 244,650 6.2 Depreciation At Cost Computer Hardware 43,319 12,971 - 56,290 Motor Vehicles 5,026 4,304 55 9,275 Offi ce Equipment 19,823 6,580 1,472 24,931 Furniture and Fittings 17,016 6,499 332 23,183 Total Depreciation 85,184 30,354 1,859 113,679 As at As at 01.01.2010 31.12.2010 Rs.’000 Rs.’000
6.3 Net Book Values At Cost Computer Hardware 44,646 52,913 Motor Vehicles 12,117 8,134 Offi ce Equipment 16,579 19,431 Furniture and Fittings 43,728 50,493 Total Carrying Amount of Property, Plant and Equipment 117,070 130,971 6.4 During the fi nancial year, the Company acquired Property, Plant and Equipment to the aggregate value of Rs. 44.9 million (2009 -
Rs. 53.1 million). Cash payments amounting to Rs. 39.7 million (2009 - Rs. 49 million) were made during the year for purchase of Property, Plant and Equipment.
6.5 Property, Plant and Equipment includes fully depreciated assets which are in the use of normal business activities having of a cost of Rs. 28.2 million (2009 - Rs. 22 million)
7. LOANS TO LIFE POLICYHOLDERS
2010 2009 Rs.’000 Rs.’000
Balance as at 1st January 9,309 4,666 Loans Granted during the Year 8,583 6,354 Repayments (4,629) (1,711) Balance as at 31st December 13,263 9,309 8. REINSURANCE RECEIVABLES Reinsurance Receivable on Outstanding Claims 86,309 56,963 Reinsurance Receivable on Settled Claims 36,122 16,861 122,431 73,824

181HNB ASSURANCE PLC ANNUAL REPORT 2010
9. PREMIUM RECEIVABLES
2010 2009 Rs.’000 Rs.’000
Premium Receivable from; Policyholders 15,580 15,458 Premium Receivable from Related Parties (Note 9.1) 19,755 38,543 Agents, Brokers and Intermediaries 196,594 103,028 231,929 157,029 9.1 Premium Receivable from Related Parties
2010 2009 Rs.’000 Rs.’000
Hatton National Bank PLC 12,306 27,538 Sithma Development (Pvt) Ltd. 6,057 9,404 Others 1,392 1,601 19,755 38,543
No allowance for bad and doubtful debts have been made in respect of the amount due from any party during the year.
10. OTHER ASSETS
2010 2009 Rs.’000 Rs.’000
Staff Loans (Note 10.1) 110,540 104,452 Agent / Advisor related Receivables 25,741 26,151 Allowance for Bad and Doubtful Advisor receivable (472) 25,269 - 26,151 Interest and Dividend Receivable 179,074 159,548 Advance Payments 33,560 23,177 Notional Tax, Economic Service Charge (ESC) and Other Taxes recoverable from the Commissioner General of Inland Revenue (CGIR) 145,275 125,919 Others 3,634 8,963 497,352 448,210 10.1 Staff Loans Balance as at 1st January 105,917 67,278 Loans granted during the year 58,101 75,127 164,018 142,405 Repayments during the year (51,964) (36,488) 112,054 105,917 Allowance for Bad and Doubtful Staff Loans (1,514) (1,465) Balance as at 31st December 110,540 104,452 11. CASH AND CASH EQUIVALENTS Cash in Hand and at Bank 64,318 43,987 Other Cash Equivalents 17,036 50,113 81,354 94,100 12. INSURANCE PROVISION - LIFE Balance as at 1st January 1,853,513 1,360,505 Increase in Life Insurance Fund Increase in Life Insurance Fund Before Distribution 687,733 623,008 Surplus Distributed to Shareholders (156,000) (130,000) Increase in Life Insurance Fund 531,733 493,008 Balance as at 31st December 2,385,246 1,853,513

182
12. INSURANCE PROVISION - LIFE (Contd.)
Long duration contract liabilities included in the Life Insurance Fund, result primarily from traditional participating and non-participating Life Insurance products. Short duration contract liabilities are primarily group term, accident and health insurance products. The actuarial reserves have been established based upon the following.
- interest rates which vary by product and as required by regulations issued by the Insurance Board of Sri Lanka (IBSL). - mortality rates based on published mortality tables adjusted for actual experience as required by regulations issued by the Insurance Board of Sri Lanka (IBSL). - surrender rates based upon actual experience.
The valuation of the Life Insurance business as at 31st December 2010 was made by Mr. M Poopalanathan, AIA, of M/S Actuarial and Management Consultants (Pvt.) Ltd. for and on behalf of HNB Assurance PLC. In accordance with the Consultant Actuary’s report, the reserve for the year amounts to Rs. 2,108.5 million (2009 - Rs. 1,588.4 million). In the opinion of the Consultant Actuary, the reserve is adequate to cover the liabilities pertaining to the Life Insurance business.
In the opinion of the Actuary, the Life Insurance Fund as included in these Financial Statements exceeds the required actuarial reserves as at 31st December 2010 by Rs. 432.7 million (2009 - Rs. 395.1 million) before allocation of reversionary bonus to policies with contractual participation in profi ts, provision for contingencies, provision for solvency margin and any transfer to shareholders.
Further the Actuary has estimated that the solvency margin required (including the solvency margin for the new reversionary bonus allotted as at 31st December 2010) under the Regulation of Insurance Industry Act, No. 43 of 2000 as Rs. 108.1 million (2009 - Rs. 81.4 million)
13. INSURANCE PROVISION - GENERAL
2010 2009 Rs.’000 Rs.’000
The General Insurance reserve as shown in the Balance Sheet represents the following:
Reserve for Unearned Premium - Gross 748,857 626,056 - Reinsurance (196,675) (202,352) - Net (Note 13.1) 552,182 423,704 Reserve for Deferred Acquisition Expenses (Note 13.2) (12,392) (4,644) Reserve for Title Insurance (Note 13.3) 12,641 9,244 Reserve for Gross Claims Outstanding (Note 13.4) 178,227 171,060 Total 730,658 599,364 13.1 Reserve for Net Unearned Premium Balance as at 1st January 423,704 331,148 Transfer during the Year 128,478 92,556 Balance as at 31st December 552,182 423,704 13.2 Reserve for Deferred Acquisition Expenses Balance as at 1st January (4,644) (6,735) Transfer during the Year (7,748) 2,091 Balance as at 31st December (12,392) (4,644) 13.3 Reserve for Title Insurance Balance as at 1st January 9,244 7,470 Net transfer during the Year 3,397 1,774 Balance as at 31st December 12,641 9,244
Notes to the Financial Statements

183HNB ASSURANCE PLC ANNUAL REPORT 2010
13. INSURANCE PROVISION - GENERAL (Contd.)
2010 2009 Rs.’000 Rs.’000
13.4 Reserve for Gross Outstanding Claims Balance as at 1st January 151,825 124,678 Claims Incurred during the Year 695,002 479,094 Claims Paid during the Year (692,652) (451,947) Balance as at 31st December 154,175 151,825 IBNR / IBNER balance as at 1st January 19,235 13,645 Increase / (Decrease) in IBNR / IBNER 4,817 5,590 IBNR / IBNER balance as at 31st December 24,052 19,235 Total Reserve for Gross Outstanding Claims 178,227 171,060 13.5 Reconciliation between Insurance Provision and Technical Reserve Insurance Provision 730,658 599,364 Reinsurance on Claims Reserves (71,759) (49,127) Technical Reserve 658,899 550,237
13.6 Gross Written Premium on Title Insurance is transferred 100% to the Title Insurance Reserve account to pay potential claims arising from title insurance policies and during the year Company recognised Rs. 2.7 million as profi t from Title Insurance. (Accounting policy on Title Insurance, refer Note 3.22.5).
13.7 Signifi cant delays occur in the notifi cation of claims and a substantial measure of experience and judgment is involved in assessing outstanding liabilities, the ultimate cost of which cannot be known with certainty as of the Balance Sheet date. The reserves are determined based on the information currently available. However, it is inherent to the nature of the business written that the ultimate liability may vary as a result of subsequent developments.
The Incurred But Not Reported (IBNR) and Incurred But Not Enough Reported (IBNER) claims reserve has been actuarially computed by Messrs. K A Pandit, Consultants & Actuaries, Mumbai, India. The valuation is based on internationally accepted actuarial methods and is performed on a semi annual basis.
14. OTHER LIABILITIES
2010 2009 Rs.’000 Rs.’000
Policyholders Advance Payments 37,494 29,860 Payables Acquisition Cost Payable 75,631 55,688 Government Levies 31,409 23,413 Income Taxes Payable 28,618 35,000 Amounts due to Related Parties (Note 14.1) 10,057 3,459 Others 125,692 135,122 308,901 282,542 14.1 Amounts due to Related Parties
2010 2009 Rs. ‘000 Rs. ‘000
Hatton National Bank PLC 9,975 3,313 Others 82 146 10,057 3,459

184
15. REINSURANCE CREDITORS
2010 2009 Rs.’000 Rs.’000
Domestic Reinsurers 34,161 39,105 Foreign Reinsurers 47,822 48,146 81,983 87,251 Payable to domestic reinsurers includes payables under co-insurance arrangements too.
16. RETIREMENT BENEFIT OBLIGATION
Provision for Retiring Gratuity As at 1st January 18,180 11,318 Provision during the year 7,691 7,510 25,871 18,828 Payments during the year (795) (648) Balance as at 31st December 25,076 18,180 As at 31st December 2010, the gratuity liability was actuarially valued under the Projected Unit Credit (PUC) method by Mr. Hugh
Terry (Fellow of the Institute of Actuaries, U.K.), Consultant Actuary as required by Sri Lanka Accounting Standard - 16.
16.1 Principal assumptions used
2010 2009
(a) Discount Rate 9.50% 10.50% (b) Salary Increase Rate 9% 10% The Gratuity Liability is not externally funded. 17. STATED CAPITAL
2010 2009 Number Rs.’000 Number Rs.’000
Fully Paid Ordinary Shares 37,500,000 375,000 37,500,000 375,000 17.1 Rights of Ordinary Shareholders The holders of Ordinary Shares are entitled to receive dividends as declared from time to time and are entitled to one vote per
share at meetings of the Company. 18. REVENUE RESERVES
2010 2009 Rs.’000 Rs.’000
Balance as at 1st January 455,851 301,116 Profi t for the year 241,739 201,610 Dividend paid for previous year (56,250) (46,875) Balance as at 31st December 641,340 455,851
Notes to the Financial Statements

185HNB ASSURANCE PLC ANNUAL REPORT 2010
19. REVENUE
2010 2009 Rs.’000 Rs.’000
Gross Written Premium (Note 20) 2,428,183 2,115,647 Premium Ceded to Reinsurers (449,461) (453,517) Net Written Premium 1,978,722 1,662,130 Net Change in Reserves for Unearned Premium (134,362) (94,383) Net Earned Premium 1,844,360 1,567,747 Income from Investments (Note 23) 517,198 467,823 Other net Income / (Loss) (Note 24) (318) 1,215 Total Revenue 2,361,240 2,036,785 20. GROSS WRITTEN PREMIUM
General Insurance Fire 287,660 304,151 Motor 916,406 740,274 Marine 24,147 23,086 Miscellaneous 115,490 63,270 Gross Written Premium - General Insurance 1,343,703 1,130,781 Life Insurance Individual Policies 1,074,972 975,537 Corporate Policies 9,508 9,329 Gross Written Premium - Life Insurance 1,084,480 984,866 Total Gross Written Premium 2,428,183 2,115,647 21. INSURANCE CLAIMS AND BENEFITS (NET) General Insurance Gross Claims Fire 101,721 30,457 Motor 503,005 409,456 Marine 7,318 2,081 Miscellaneous 87,620 42,732 Total Gross Claims 699,664 484,726 Reinsurance Recoveries (111,427) (36,516) General Insurance Net Claims and Benefi ts 588,237 448,210 Life Insurance Gross Claims - Death, Disability and Hospitalisation 51,718 51,737 Reinsurance Recoveries (22,393) (21,674) Net Insurance Claims 29,325 30,063 Surrenders 14,129 26,022 Policy Maturities 16,446 7,616 Life Insurance Net Claims and Benefi ts 59,900 63,701
Net Insurance Claims and Benefi ts 648,137 511,911 22. UNDERWRITING AND NET ACQUISITION COSTS Net Underwriting and Policy Acquisition Costs 186,240 152,779 Increase / (Decrease) in Deferred Acquisition Expenses (7,747) 2,091 Policy fees (13,502) (4,762) 164,991 150,108
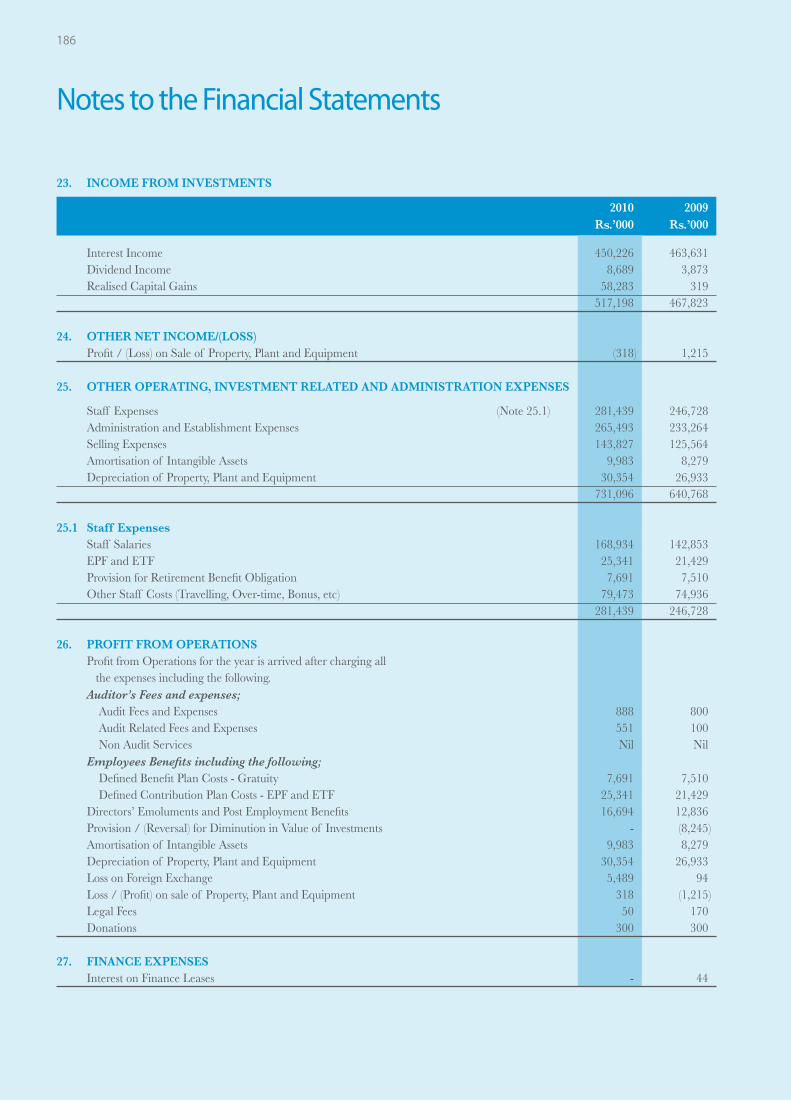
186
23. INCOME FROM INVESTMENTS
2010 2009 Rs.’000 Rs.’000
Interest Income 450,226 463,631 Dividend Income 8,689 3,873 Realised Capital Gains 58,283 319 517,198 467,823 24. OTHER NET INCOME/(LOSS) Profi t / (Loss) on Sale of Property, Plant and Equipment (318) 1,215
25. OTHER OPERATING, INVESTMENT RELATED AND ADMINISTRATION EXPENSES
Staff Expenses (Note 25.1) 281,439 246,728 Administration and Establishment Expenses 265,493 233,264 Selling Expenses 143,827 125,564 Amortisation of Intangible Assets 9,983 8,279 Depreciation of Property, Plant and Equipment 30,354 26,933 731,096 640,768
25.1 Staff Expenses Staff Salaries 168,934 142,853 EPF and ETF 25,341 21,429 Provision for Retirement Benefi t Obligation 7,691 7,510 Other Staff Costs (Travelling, Over-time, Bonus, etc) 79,473 74,936 281,439 246,728 26. PROFIT FROM OPERATIONS Profi t from Operations for the year is arrived after charging all the expenses including the following. Auditor’s Fees and expenses; Audit Fees and Expenses 888 800 Audit Related Fees and Expenses 551 100 Non Audit Services Nil Nil Employees Benefi ts including the following; Defi ned Benefi t Plan Costs - Gratuity 7,691 7,510 Defi ned Contribution Plan Costs - EPF and ETF 25,341 21,429 Directors’ Emoluments and Post Employment Benefi ts 16,694 12,836 Provision / (Reversal) for Diminution in Value of Investments - (8,245) Amortisation of Intangible Assets 9,983 8,279 Depreciation of Property, Plant and Equipment 30,354 26,933 Loss on Foreign Exchange 5,489 94 Loss / (Profi t) on sale of Property, Plant and Equipment 318 (1,215) Legal Fees 50 170 Donations 300 300
27. FINANCE EXPENSES Interest on Finance Leases - 44
Notes to the Financial Statements

187HNB ASSURANCE PLC ANNUAL REPORT 2010
28. INCOME TAX EXPENSES
2010 2009 Rs.’000 Rs.’000
The major components of income tax expense for the years ended 31st December are as follows :
Current Tax Current Tax on profi t for the year 28,208 29,074 Under/(Over) Provision for the year in respect of Prior Years (422) 397 27,786 29,471 Deferred Income Tax Deferred Taxation Charge / (Reversal) (Note 28.3) - - Income Tax Expense reported in the Income Statement 27,786 29,471 28.1 A reconciliation between tax expense and the product of accounting profi t multiplied by the statutory tax rate is as follows : Profi t for the year 241,739 201,610 Income Tax Expenses 27,786 29,471 Accounting Profi t before Income Tax 269,525 231,081
At the statutory income 35.0% 94,334 35.0% 80,878 Adjustments to Current Tax in respect of Previous Year (0.2%) (422) 0.2% 397 Income Exempt from Tax (24.5%) (66,137) (20.5%) (47,360) Net Non-Deductible Expenses 5.4% 14,558 4.6% 10,606 Social Responsibility Levy 0.2% 417 0.2% 430 Statutory Income Set-off Against Tax Losses Brought Forward (5.6%) (14,964) (6.7%) (15,480) Income Tax Expenses 10% 27,786 13% 29,471
28.2 The Company is liable to pay income tax at the rate of 35% on its taxable profi ts in accordance with the provisions of the Inland Revenue Act, No. 10 of 2006 and subsequent amendments thereto. As per the amendment made to Section 32 of the Inland Revenue Act, any loss incurred in the business of Life Insurance on or after 1st April 2007 shall be deducted only to the extent of the statutory income generated in the business of Life Insurance.
28.3 Deferred Tax Assets, Liabilities and Income Tax relates to the followings
Balance Sheet Income Statement 2010 2009 2010 2009 Rs.’000 Rs.’000 Rs.’000 Rs.’000
Deferred Tax Liability Capital allowances for tax purposes 13,911 22,212 (8,301) 9,289 13,911 22,212 (8,301) 9,289
Deferred Tax Assets Defi ned Benefi t Plans (6,068) (5,454) (614) (2,081) Brought Forward Tax Losses (7,843) (16,758) 8,915 (7,208) (13,911) (22,212) 8,301 (9,289)
Net Deferred tax charge/(reversal) - - Net Deferred Tax Liability - -
28.4 Impact due to corporate income tax change The corporate income tax rate has been reduced to 28% commencing from year of assessment 2011/12 as per budget proposals
for 2011 announced by the Finance Minister, which is considered to be substantially enacted pending legislation in 2011. Accordingly, deferred tax asset and liability have been computed based on 28%.
28.5 Tax loss brought forward and utilised during the year As at the year end, total carried forward tax loss is Rs. 224 million (2008 - Rs. 267 million). The Company has utilised such tax
losses to recognise a deferred tax asset up to the extent of the deferred tax liability arising from taxable temporary differences. Thus, no deferred tax asset is recognised in the Financial Statements as it is not probable that the future taxable profi ts will be adequate to utilise the available tax loses fully in the foreseeable future. The unrecognised deferred tax asset as at 31st December 2010 amounted to Rs. 55 million (2009 - Rs. 77 million)

188
29. BASIC EARNINGS PER SHARE29.1 Basic Earnings Per Share is calculated by dividing the net profi t for the year attributable to ordinary shareholders by the weighted
average number of ordinary shares outstanding during the year.
2010 2009
29.2 The following refl ects the profi t and share data used in the Basic Earnings Per Share computation.
Net Profi t Attributable to Ordinary Shareholders (Rs. ’000) 241,739 201,610 Weighted Average Number of Ordinary Shares (’000) 37,500 37,500 Basic Earnings Per Share (Rs.) 6.45 5.38
There were no potential dilutive ordinary shares outstanding at any time during the year. Therefore, diluted Earnings Per Share is same as basic Earnings Per Share shown above.
30. DIVIDENDS PAID AND PROPOSED
30.1 Dividend Declared and Paid during the Year Final dividend for 2009 : Rs 1.50/- per share ( 2008 : Rs 1.25/- per share) (Rs. ’000) 56,250 46,875
30.2 Proposed Dividends for approval at AGM The Board of Directors has recommended the payment of a fi rst and fi nal dividend of Rs. 1.80 per share for the year ended
31st December 2010 (2009 - Rs. 1.50/- per share) which is to be approved at the Annual General Meeting to be held on 29th March 2011. In accordance with Sri Lanka Accounting Standards No.12 - Events after the Balance Sheet Date (revised 2006), this proposed dividend has not been recognised as a liability as at 31st December 2010.
Under the Inland Revenue Amendment Act, No. 10 of 2006, a withholding tax of 10% has been imposed on dividends declared from 1st April 2004.
30.3 Compliance with Section 56 and 57 of the Companies act No. 7 of 2007 As required by Section 56 of the Companies Act, No. 7 of 2007, the Board of Directors of the Company has satisfi ed the Solvency
Test in accordance with the section 57, prior to recommending the fi rst and fi nal dividend for the year ended 31st December 2010. A statement of solvency completed and duly signed by the Directors on 31st January 2011 has been audited by M/S KPMG Ford, Rhodes, Thornton & Co.
31. RELATED PARTY DISCLOSURES The Company carries out transactions in the ordinary course of its business with parties who are defi ned as related parties in Sri
Lanka Accounting Standard - 30, Related Party Disclosures (revised 2005).
Transactions with related parties were made on the basis of the price lists in force with non-related parties, but subject to approved discounts. Outstanding balances with related parties other than balances relating to investment related transactions as at the Balance Sheet date are unsecured and interest free. Settlement will take place in cash. Such outstanding balances have been included under respective assets and liabilities together with balances arising from transactions with non-related parties.
Details of related party transactions are reported below.
31.1 Transaction with the parent and Ultimate Controlling Party Hatton National Bank PLC
2010 2009 Rs.’000 Rs.’000
Nature of Transaction Insurance Premium General 19,628 29,995 Life 3,834 4,098 Administration Expenses General 47,572 42,289 Life 21,502 9,706 Claims Incurred General 7,099 7,288
Notes to the Financial Statements

189HNB ASSURANCE PLC ANNUAL REPORT 2010
31. RELATED PARTY DISCLOSURES (Contd.)
2010 2009 Rs.’000 Rs.’000
Investments Balance as at 31 December (Includes Deposits & Debentures) General 74,090 67,516 Life 41,973 38,549 Current Account Balances as at 31 December General 33,979 13,732 Life 25,121 22,554 Investment Income General 3,955 8,084 Life 5,289 2,069 Rent Expenses 16,756 13,581 Dividends Paid 33,742 28,118 31.2 Transaction with / between Subsidiary Companies of the Parent Company Sithma Development (Pvt) Ltd Nature of Transaction Insurance Premium General 5,853 8,785
Claims Incurred General 4,464 7,236
31.3 Transactions with Key Management Personnel of the Company or its parent According to Sri Lanka Accounting Standard 30 (revised 2005) Related Party Disclosure, Key Management Personnel are those
having authority and responsibility for planning, directing and controlling the activities of the entity. Accordingly, the Directors (including Executive and Non-Executive Directors) of the Company and their immediate family members have been classifi ed as Key Management Personnel of the Company.
Immediate family member is defi ned as spouse or dependent. A dependent is defi ned as anyone who depends on the respective Director for more than 50% of his/her fi nancial needs. As the Hatton National Bank PLC is the ultimate parent of the Company, and the Board of Directors of the Bank have the authority and responsibility of planning, directing and controlling the activities of the Company, the Directors of the Bank and their immediate family members have also been identifi ed as Key Management Personnel of the Company.
a) Key Management Personnel Compensation
2010 2009 Rs.’000 Rs.’000
Short-term employee benefi ts 13,814 10,595 Non-Cash Benefi ts 2,880 2,241
In addition to salaries, the Company also provides non-cash benefi ts to Key Management Personnel and contributes to a defi ned benefi t plan (Gratuity) on behalf of the Executive Director .
b) Other Transactions with Key Management Personnel Insurance Premium - General 823 189 Insurance Premium - Life 5,685 2,139 Claims Paid - General 679 -
31.4 Transactions with Other Related entities Other related entities are those which are controlled or signifi cantly infl uenced, directly or indirectly by Key Management
Personnel of the Company. Signifi cant infl uence is presumed to be established if a Key Management Person of the Company has a more than 20% shareholding in an entity, unless otherwise reported by the Key Management Person . Further signifi cant infl uence is also established if in the view of the respective Key Management Person, he has the ability to infl uence the operating and fi nancial policies of an entity even in the absence of a 20% shareholding.

190
31. RELATED PARTY DISCLOSURES (Contd.)
Name of the Company Control, Joint Control or Signifi cant Nature of Insurance 2010 2009 Infl uence by Key Management Personnel transactions Segment Rs.’000 Rs.’000
ACUITY Stock Brokers (Pvt) Ltd R Theagarajah and J M J Perera Insurance Premium General 1,309 370 Claims Incurred General 270 433 ACUITY Securities Ltd. R Theagarajah and J M J Perera Insurance Premium General 353 195 Claims Incurred General 364 188 Investment in REPO* General 46,483 59,207 Life 98,894 67,428 Investment Income from REPO* General 5,175 4,099 Life 8,367 4,296 ACUITY Partners (Pvt) Ltd R Theagarajah and J M J Perera Insurance Premium General 510 - Life 470 - Colours of Courage Trust (Guarantee) Ltd. R Theagarajah Sponsorship General 112 - Aitken Spence Garments Ltd D H S Jayawardena Insurance Premium General 356 438 Aitken Spence Cargo (Pvt) Ltd D H S Jayawardena Insurance Premium General 221 - Alliance Finance Co. PLC Pratapkumar de Silva Insurance Premium General 5,187 3,137 Claims Incurred General 6,277 1,210 Alliance Tech Trading (Pvt) Ltd Pratapkumar de Silva Purchase and Maintenance of Property, Plant and Equipment General 143 240 Life 13 - Arpico Finance Co. PLC Pratapkumar de Silva Insurance Premium General 668 - Claims Incurred General 98 - Ceylon Garden Coir (Pvt) Ltd D H S Jayawardena and R.K.Obeyesekere Insurance Premium General 66 104 Elpitiya Plantations PLC D H S Jayawardena Insurance Premium General 198 291 Claims Incurred General 9 15 Milford Exports (Ceylon) Ltd D H S Jayawardena and R.K.Obeyesekere Insurance Premium General 39 25 Milford Developers (Pvt) Ltd D H S Jayawardena and R.K.Obeyesekere Insurance Premium General 460 - Stassen Exports Ltd D H S Jayawardena and R.K.Obeyesekere Insurance Premium General 11,922 12,170 Claims Incurred General 9,767 9,839 Stassen Natural Foods (Pvt) Ltd D H S Jayawardena and R.K.Obeyesekere Insurance Premium General 207 251 Stassen International Ltd D H S Jayawardena and R.K.Obeyesekere Insurance Premium General 1,325 885 Claims Incurred General - 276 Ambewela Live Stock Company Ltd. D H S Jayawardena and R.K.Obeyesekere Insurance Premium General - 25 Ambewela Products (Pvt) Ltd. D H S Jayawardena Insurance Premium General - 52 Claims Incurred General 6 - Beruwala Distillery (Pvt) Ltd. D H S Jayawardena and R.K.Obeyesekere Insurance Premium General - 164 Claims Incurred General 386 - Distilleries Company of Sri Lanka PLC. D H S Jayawardena and R.K.Obeyesekere Insurance Premium General 210 18,554 Claims Incurred General 2,758 1,303 Lanka Bell (Pvt) Ltd. D H S Jayawardena and R.K.Obeyesekere Insurance Premium General 44 737 Claims Incurred General 1,269 225 Telephone Expenses General 56 - Periceyl (Pvt) Ltd. D H S Jayawardena and R.K.Obeyesekere Insurance Premium General 328 187 Claims Incurred General 1,516 - Texpro Industries Ltd. D H S Jayawardena Insurance Premium General 613 582 Kelani Valley Plantations PLC R.Seevaratnam Insurance Premium General - 96 Claims Incurred General 20 - Lanka Milk Foods (CWE) PLC D H S Jayawardena and R.K.Obeyesekere Insurance Premium General 385 - Claims Incurred General 1,153 - Metecno Lanka (Pvt) Ltd R.Seevaratnam Insurance Premium General 191 - Claims Incurred General 61 - Finlay Rentokil Ceylon (Pvt) Ltd N G Wickremeratne Purchase of services General 227 - Lanka Dairies (Pvt) Ltd D H S Jayawardena and R.K.Obeyesekere Insurance Premium General 13 - Hethersett Hotels Ltd D H S Jayawardena Insurance Premium General 61 - Ace Distriparks (Pvt) Ltd D H S Jayawardena Insurance Premium General 49 - Ace Containers (Pvt) Ltd D H S Jayawardena Insurance Premium General 15 - Sri Lanka Insurance Corporation Ltd. (SLIC) SLIC holds a 15% stake in Hatton National Co-Insurance Premium General 687 1,860 Bank PLC (HNB), and thereby enjoys a Co-Insurance Claims General - 1,551 signifi cant infl uence over HNB and its controlled entities
* Investments held in the form of Repurchase Agreements in Government Securities (REPO) as at 31st December
Notes to the Financial Statements

191HNB ASSURANCE PLC ANNUAL REPORT 2010
32. EVENTS OCCURRING AFTER THE BALANCE SHEET DATE There have been no material events occurring after the Balance Sheet date that require adjustments to or disclosure in the Financial Statements, other than those disclosed in Note 30, in respect of proposed dividend for the year.
33. CAPITAL COMMITMENTSa) As at the year end, no capital expenditure approved by the Board and contracted for which a provision has been made in the
Financial Statements.
b). Future commitments on operating leases
2010 2009 Rs.’000 Rs.’000
Less than one year 17,721 15,994 Between one and fi ve years 10,351 7,612 Total Operating Lease Commitments 28,072 23,606 34. CONTINGENCIES In the opinion of the Directors, and in consultation with the Company Lawyers, litigation currently pending against the Company
would not have a material impact on the reported fi nancial results of the Company.
All pending litigations for claims have been evaluated and adequate provisions have been made in these Financial Statements where necessary.
35. COMPARATIVE INFORMATION The presentation and classifi cation of following items in these Financial Statements are amended to ensure comparability with the
current year information.
2009 Rs.’000
As reported previously (2009 Financial Statements): Revenue (a) 2,038,096 Underwriting and Net Acquisition Costs (a) 154,870 Other net Income / (Loss) (a) 2,526 Other Operating, Investment Related and Administration Expenses (a) 637,317 2010 2009 Rs.’000 Rs.’000
Current Presentation: Revenue 2,361,240 2,036,785 Underwriting and Net Acquisition Costs 164,991 150,108 Other net Income / (Loss) (318) 1,215 Other Operating, Investment Related and Administration Expenses 731,096 640,768
Reason for changes in the presentation and classifi cationsa) Policy Fees charged from customers were recorded under Other Income (in Life Insurance) and Other Operating, Investment
Related and Administration Expenses (in General Insurance) previously. However, as the Policy Fees are charged at the acquisition of the business to cover the direct administration costs, the same were re-classifi ed under Underwriting and Net Acquisition Costs from the current fi nancial year.
36. DIRECTORS’ RESPONSIBILITY STATEMENT The Board of Directors is responsible for the preparation and presentation of these Financial Statements. Please refer to page 152
of the Statement of Directors’ Responsibility for Financial Reporting.

192
Balance Sheet of the Life Insurance Fund - Supplemental As at 31st December, 2010 2009 Rs.’000 Rs.’000
Assets Investments (A) 2,242,702 1,686,073 Intangible Assets (B) 20,903 14,653 Property, Plant and Equipment (C) 4,573 6,174 Loans to Life Policyholders 13,263 9,309 Reinsurance Receivables (D) 18,617 16,283 Other Assets (E) 245,918 220,524 Cash and Cash Equivalents (F) 13,005 45,252 Total Assets 2,558,981 1,998,268
Liabilities Insurance Provision - Life (G) 2,385,246 1,853,513 Other Liabilities (H) 144,988 117,221 Reinsurance Creditors (I) 25,341 24,937 Retirement Benefi t Obligation (J) 3,406 2,597 Total Liabilities 2,558,981 1,998,268 The Notes to the Financial Statements set out on pages 168 to 198 form an integral part of these Financial Statements.

193HNB ASSURANCE PLC ANNUAL REPORT 2010
Notes to the Balance Sheet of the Life Insurance Fund - Supplemental 2010 2009 Rs.’000 Rs.’000
A. INVESTMENTS Government Securities 1,406,591 1,258,989
Repurchase Agreements on Government Securities 176,429 55,428 Quoted Shares (Note A.1) 118,901 21,821 Corporate Debt (Note A.2) 199,210 114,203 Investment in Unit Trusts (Note A.3) 27,020 8,000 Term Deposits 314,551 227,632 2,242,702 1,686,073
A.1. Quoted Shares
2010 2009 No. of Cost Market No. of Cost Market Shares Value Shares Value Rs. ’000 Rs. ’000 Rs. ’000 Rs. ’000
Banks, Finance and Insurance National Development Bank PLC 11,600 1,733 4,054 19,600 2,510 4,038 Commercial Bank of Ceylon PLC 44,750 11,270 11,631 10,500 1,403 1,990 Sampath Bank PLC 70,718 14,174 19,228 - - - Nations Trust Bank PLC 120,000 7,843 10,008 - - - DFCC Bank 38,000 4,353 7,608 17,700 2,614 2,956 Singer Finance (Lanka) Ltd 2,200 33 33 - - - Sector Total 39,406 52,562 6,527 8,984
Diversifi ed Holdings John Keells Holdings PLC 63,245 15,353 18,872 22,745 2,534 3,901 Richard Pieris and Company PLC 230,000 1,728 2,415 - - - Hayleys PLC 17,000 5,617 5,865 - - - Hemas Holdings PLC 221,000 9,553 9,835 4,200 447 516 Sector Total 32,251 36,987 2,981 4,417
Telecommunications Dialog Axiata PLC 80,000 1,663 944 80,000 1,663 580 Sector Total 1,663 944 1,663 580
Manufacturing Royal Ceramic Lanka PLC 9,000 475 2,744 24,000 1,053 1,596 Dipped Products PLC 11,000 1,031 1,317 11,000 1,031 946 Chevron Lubricants Lanka PLC 16,000 2,412 2,556 - - - ACL Cables PLC 25,000 1,414 2,128 25,000 1,414 1,919 ACL Plastics PLC 3,600 372 576 - - - Tokyo Cement Company (Lanka) PLC 212,325 8,775 11,678 - - - Kelani Cables PLC 27,000 3,058 2,835 - - - Sector Total 17,537 23,834 3,498 4,461
Hotels and Travels Asian Hotels & Properties PLC - - - 8,000 268 756 Dolphin Hotels PLC 117,600 4,161 7,197 68,000 1,758 1,870 Aitken Spence Hotel Holdings PLC 13,875 486 1,467 2,500 596 673 Riverina Hotels PLC 30,600 2,975 3,222 - - - The Lighthouse Hotel PLC 11,400 763 718 - - - Sector Total 8,385 12,604 2,622 3,299

194
Notes to the Balance Sheet of the Life Insurance Fund - Supplemental
A. INVESTMENTS (Contd.)
2010 2009
No. of Cost Market No. of Cost Market Shares Value Shares Value Rs. ’000 Rs. ’000 Rs. ’000 Rs. ’000
Chemicals and Pharmaceuticals Chemical Industries (Colombo) PLC 87,500 7,555 12,311 37,500 2,284 2,363 Haycarb PLC 13,000 2,245 2,191 - - - Sector Total 9,800 14,502 2,284 2,363 Power and Energy Laugfs Gas Ltd 16,800 386 435 - - - Laugfs Gas Ltd - (Non Voting) 12,100 182 224 - - - Hemas Power PLC - - - 38,900 778 759 Sector Total 568 659 778 759 Construction and Engineering Colombo Dockyard PLC - - - 3,500 568 857 Sector Total - - 568 857 Beverage Food and Tobacco Renuka Agri Foods PLC 309,100 815 2,071 189,100 425 425 Cargills (Ceylon) PLC - - - 8,000 475 522 Sector Total 815 2,071 900 947
Information Technology PC House PLC 110,200 1,212 1,245 - - -
Sector Total 1,212 1,245 - - Investment Trusts
Renuka Holdings PLC 50,000 2,121 3,095 - - - Sector Total 2,121 3,095 - - Health Care
Asiri Hospital Holdings PLC 598,200 5,143 5,204 - - - Sector Total 5,143 5,204 - - Portfolio Total 118,901 153,707 21,821 26,667 Less. Provision for Diminution in Market Value Brought Forward - (3,602)
(Provision)/Reversal Made During the Year - 3,602 Provision for Diminution in Market Value Carried Forward - -
Carrying Value of total Investment in Quoted Shares 118,901 21,821

195HNB ASSURANCE PLC ANNUAL REPORT 2010
A. INVESTMENTS (Contd.)A.2 Corporate Debt
2010 2009 Redeemable No. of Cost Market Interest Rate No. of Cost Market Interest Rate Date Debentures Value (Per Annum) Debentures Value (Per Annum) Rs.’000 Rs.’000 Rs.’000 Rs.’000
a) Debentures - Quoted
Hatton National Bank PLC 31/03/2021 75,000 7,500 7,500 11% 75,000 7,500 7,500 11%
DFCC Bank 26/06/2016 5,000 5,000 5,000 14% 5,000 5,000 5,000 14%
Seylan Bank PLC 29/05/2012 50,000 5,000 5,000 16.75% 50,000 5,000 5,000 16.75%
Sampath Bank PLC 29/08/2012 130,000 13,000 13,000 3 Month Gross TB 130,000 13,000 13,000 3 Month Gross TB
+1.5% +1.5%
Singer Sri Lanka PLC 30/09/2012 120,000 12,000 12,000 1 Year Gross TB 120,000 12,000 12,000 1 Year Gross TB
+1.65% +1.65%
Bank of Ceylon 23/11/2013 150,000 15,000 15,000 6 Month Gross TB 150,000 15,000 15,000 6 Month Gross TB
+0.75% +0.75%
Bank of Ceylon 28/06/2015 200,000 20,000 20,000 11.50% - - - -
Nations Trust Bank PLC 30/04/2013 10,000 10,000 10,000 20.53% 10,000 10,000 10,000 20.53%
Urban Development Authority 05/10/2015 867,100 86,710 86,710 11% - - - -
Total Investment in Quoted Debentures 174,210 174,210 67,500 67,500
Redeemable No. of Cost Directors’ Interest Rate No. of Cost Directors’ Interest Rate
Date Debentures Valuations (Per Annum) Debentures Valuations (Per Annum)
Rs.’000 Rs.’000 Rs.’000 Rs.’000
b) Debentures - Unquoted
Seylan Bank PLC - - - - 80,000 8,000 8,000 15%
Senkadagala Finance Ltd. 21/09/2012 25,000 25,000 25,000 15.50% 25,000 25,000 25,000 15.50%
Total Investment in Unquoted Debentures 25,000 25,000 33,000 33,000
c) Commercial Papers
Sampath Leasing and Factoring Ltd. - - - 13,703 13,703 21.66%
Total Investment in Commercial Paper - - 13,703 13,703
Total Investment in Corporate Debt 199,210 199,210 114,203 114,203
A.3 Unit Trusts
2010 2009 No. of Units Cost Market No. of Units Cost Market Value/ Value/ Managers’ Managers’ Buying Buying price price Rs.’000 Rs.’000 Rs.’000 Rs.’000
Quoted NAMAL Acuity Value Fund 80,000 5,020 7,200 - - - Total Investment in Quoted Unit Trust 5,020 7,200 - - -
Unquoted Ceybank Savings plus Money Market Fund 1,800,000 18,000 18,972 - - - Ceylon Financial Sector Fund 408,998 4,000 3,857 - - - Ceybank Savings plus Money Market Fund - - - 800,000 8,000 8,400 Total Investment in Unquoted Unit Trust 22,000 22,829 8,000 8,400 Total Investment in Unit Trusts 27,020 30,029 8,000 8,400
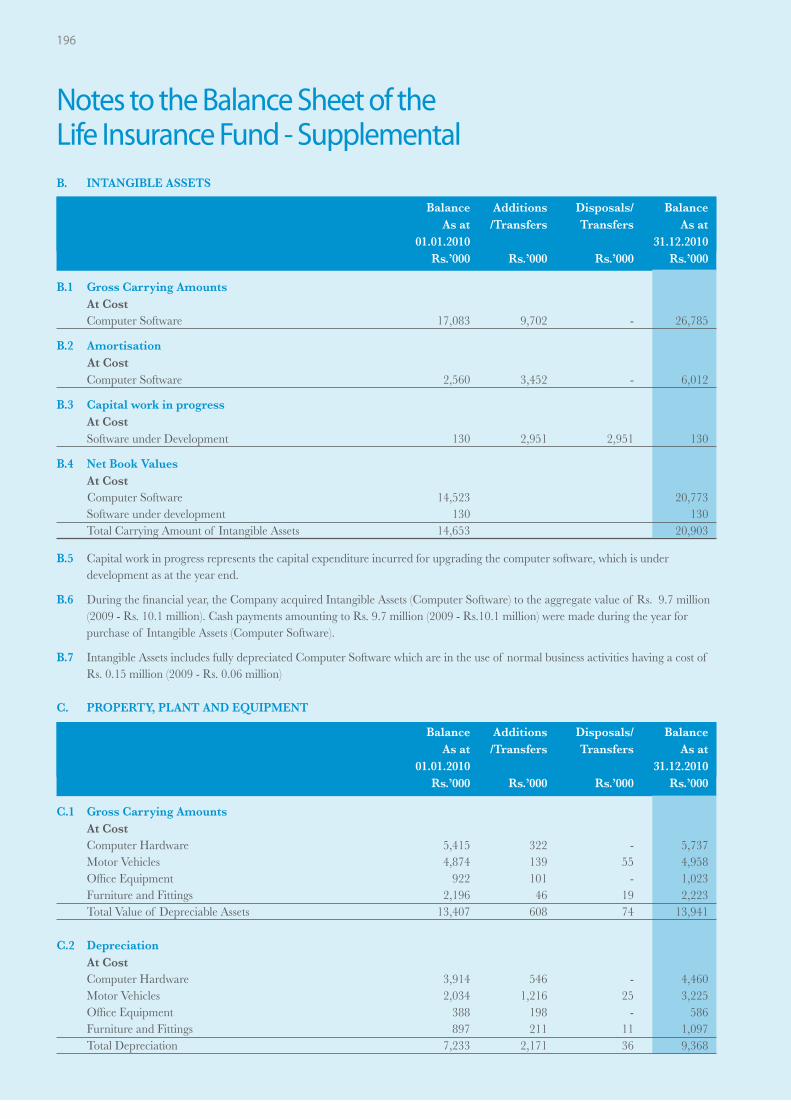
196
Notes to the Balance Sheet of the Life Insurance Fund - Supplemental
B. INTANGIBLE ASSETS
Balance Additions Disposals/ Balance As at /Transfers Transfers As at 01.01.2010 31.12.2010 Rs.’000 Rs.’000 Rs.’000 Rs.’000
B.1 Gross Carrying Amounts At Cost Computer Software 17,083 9,702 - 26,785 B.2 Amortisation
At Cost Computer Software 2,560 3,452 - 6,012 B.3 Capital work in progress
At Cost Software under Development 130 2,951 2,951 130 B.4 Net Book Values At Cost
Computer Software 14,523 20,773 Software under development 130 130 Total Carrying Amount of Intangible Assets 14,653 20,903 B.5 Capital work in progress represents the capital expenditure incurred for upgrading the computer software, which is under
development as at the year end.
B.6 During the fi nancial year, the Company acquired Intangible Assets (Computer Software) to the aggregate value of Rs. 9.7 million (2009 - Rs. 10.1 million). Cash payments amounting to Rs. 9.7 million (2009 - Rs.10.1 million) were made during the year for purchase of Intangible Assets (Computer Software).
B.7 Intangible Assets includes fully depreciated Computer Software which are in the use of normal business activities having a cost of Rs. 0.15 million (2009 - Rs. 0.06 million)
C. PROPERTY, PLANT AND EQUIPMENT
Balance Additions Disposals/ Balance As at /Transfers Transfers As at 01.01.2010 31.12.2010 Rs.’000 Rs.’000 Rs.’000 Rs.’000
C.1 Gross Carrying Amounts At Cost
Computer Hardware 5,415 322 - 5,737 Motor Vehicles 4,874 139 55 4,958 Offi ce Equipment 922 101 - 1,023 Furniture and Fittings 2,196 46 19 2,223 Total Value of Depreciable Assets 13,407 608 74 13,941 C.2 Depreciation
At Cost Computer Hardware 3,914 546 - 4,460
Motor Vehicles 2,034 1,216 25 3,225 Offi ce Equipment 388 198 - 586 Furniture and Fittings 897 211 11 1,097 Total Depreciation 7,233 2,171 36 9,368

197HNB ASSURANCE PLC ANNUAL REPORT 2010
C. PROPERTY, PLANT AND EQUIPMENT (Contd.)
As at As at 01.01.2010 31.12.2010 Rs.’000 Rs.’000
C.3 Net Book Values At Cost Computer Hardware 1,501 1,277 Motor Vehicles 2,840 1,733 Offi ce Equipment 534 437 Furniture and Fittings 1,299 1,126 Total Carrying Amount of Property, Plant and Equipment 6,174 4,573 C.4 During the fi nancial year, the Company acquired Property, Plant and Equipment to the aggregate value of Rs. 0.6 Million (2009 -
Rs. 0.4 Million). Cash payments amounting to Rs. 0.6 Million (2009 - Rs. 0.4 Million) were made during the year for purchase of Property, Plant & Equipment.
2010 2009 Rs.’000 Rs.’000
D. REINSURANCE RECEIVABLES Reinsurance Receivable on Outstanding Claims 14,550 7,836 Reinsurance Receivable on Settled Claims 4,067 8,447 18,617 16,283
E. OTHER ASSETS Staff Loans (Note E.1) - 8,690 Agent / Advisor related Receivables 3,751 25,146 Interest and Dividend Receivable 143,578 116,227 Advance Payments 5,187 4,139 Notional Tax, Economic Service Charge (ESC) and Other Taxes recoverable from the Commissioner General of Inland Revenue (CGIR) 93,289 66,250 Others 113 72 245,918 220,524
During the year, all Staff and Advisor Loans under Life Insurance Fund were transferred to Life Shareholders Fund (which is classifi ed together with General Insurance Fund) in order to ensure compliance with the Approved Assets requirement under Determination 1 (30/10/2005) of the Insurance Board of Sri Lanka.
2010 2009 Rs.’000 Rs.’000
E.1 Staff Loans Balance as at 1st January 8,690 8,563 Loans granted/transferred during the year (8,690) 4,926 - 13,489 Repayments during the year - (4,799) Balance as at 31st December - 8,690
F. CASH AND CASH EQUIVALENTS Cash in Hand and at Bank 13,005 22,835 Other Cash Equivalents - 22,417 Balance as at 31st December 13,005 45,252
G. INSURANCE PROVISION - LIFE Please refer - Note 12 on Page 181.
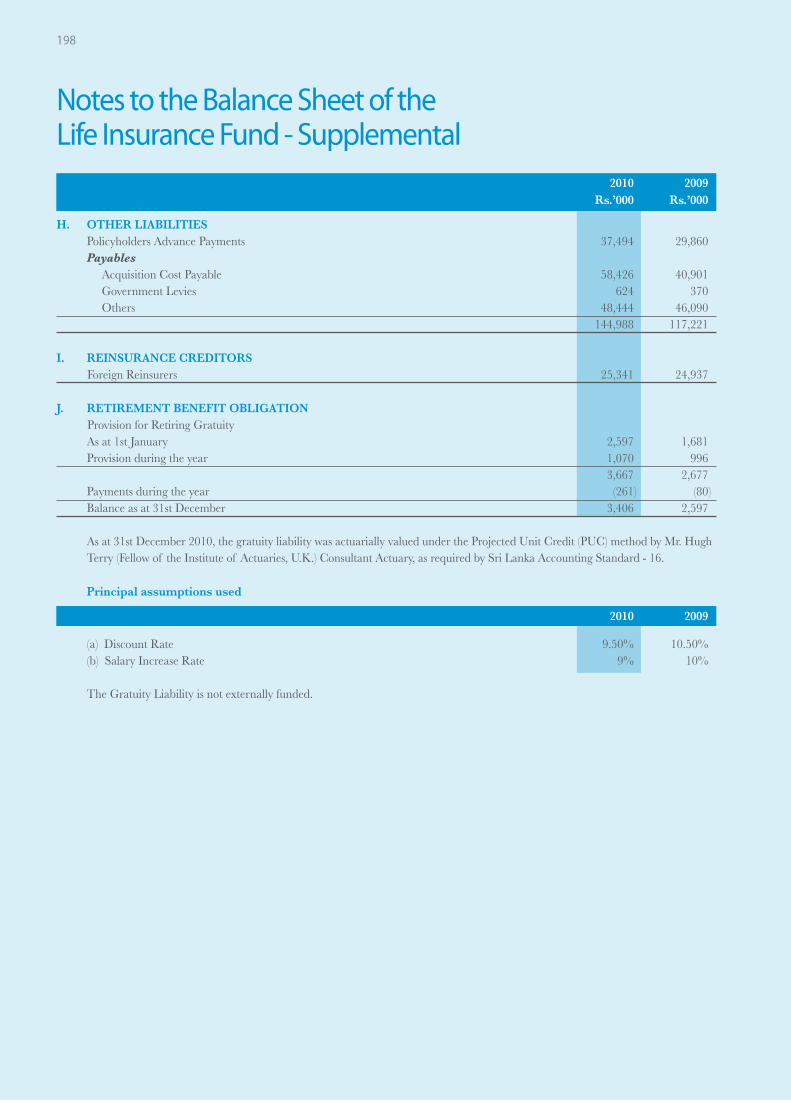
198
Notes to the Balance Sheet of the Life Insurance Fund - Supplemental
2010 2009 Rs.’000 Rs.’000
H. OTHER LIABILITIES Policyholders Advance Payments 37,494 29,860 Payables Acquisition Cost Payable 58,426 40,901 Government Levies 624 370 Others 48,444 46,090 144,988 117,221 I. REINSURANCE CREDITORS Foreign Reinsurers 25,341 24,937 J. RETIREMENT BENEFIT OBLIGATION Provision for Retiring Gratuity As at 1st January 2,597 1,681 Provision during the year 1,070 996 3,667 2,677 Payments during the year (261) (80) Balance as at 31st December 3,406 2,597 As at 31st December 2010, the gratuity liability was actuarially valued under the Projected Unit Credit (PUC) method by Mr. Hugh
Terry (Fellow of the Institute of Actuaries, U.K.) Consultant Actuary, as required by Sri Lanka Accounting Standard - 16. Principal assumptions used
2010 2009
(a) Discount Rate 9.50% 10.50% (b) Salary Increase Rate 9% 10% The Gratuity Liability is not externally funded.

199HNB ASSURANCE PLC ANNUAL REPORT 2010
Insurance Revenue Accounts
For the Year Ended 31st December, 2010 2009 Rs.’000 Rs.’000 General InsuranceGross Written Premium 1,343,703 1,130,781 Premium Ceded to Reinsurers (350,264) (360,459)Net Written Premium 993,439 770,322 Net Change in Reserves for Unearned Premium (134,362) (94,383)Net Earned Premium 859,077 675,939 Net Claims Incurred (588,237) (448,210)Net Commission (7,013) 527 (Increase) / Decrease in Deferred Acquisition Expenses 7,747 (2,091)Expenses (335,634) (282,348)Underwriting Surplus / (Defi cit) (64,060) (56,183)Income from Investments 177,889 156,091 Other net Income / (Loss) (304) 1,217 Operating Profi t from General Insurance Business 113,525 101,125 Life InsuranceGross Written Premium 1,084,480 984,866 Premium Ceded to Reinsurers (99,197) (93,058)Net Written Premium 985,283 891,808 Net Benefi ts Expense (59,900) (63,701)Net Commission (177,530) (151,995)Expenses Attributable to Policyholders (399,415) (364,834)Increase in Life Insurance Fund (531,733) (493,008)Income from Investments 339,309 311,732 Other net Income / (Loss) (14) (2)Surplus from Life Insurance Business 156,000 130,000 Reconciliation of Statement of Income and Insurance Revenue AccountsOperating Profi t from General Insurance Business 113,525 101,125 Surplus from Life Insurance Business 156,000 130,000 Profi t from Operations 269,525 231,125 Finance Expenses - (44)Profi t Before Taxation 269,525 231,081 Income Tax Expenses (27,786) (29,471)Profi t for the Year 241,739 201,610

200
Share Information
1. Stock Exchange Listing
The issued ordinary shares of HNB Assurance PLC are listed on the Colombo Stock Exchange. CSE code for HNB Assurance PLC share is HASU.
2. The Share
Stated Capital - Rs. 375,000,000/- i.e. 37,500,000 shares Class of Shares - Ordinary Shares Voting Rights - One vote per Ordinary Share Shares held by the public - 39.80% (as at 31st December 2010)
3. Shareholdings
There were 3,665 registered shareholders as at 31st December 2010 (2009 – 3,845). As per the rule No.7.6 (X) of the Colombo Stock Exchange, distribution and composition of Shareholders are given as follows.
4. Analysis of Shareholders
a) Resident / Non-Resident
b) Individual / Institutional
Shares Resident Non-Resident Total
No. of Shareholders
No. of Shares
% on Total No. of
Shares
No. of Shareholders
No. of Shares
% on Total No. of
Shares
No. of Shareholders
No. of Shares
%
1 - 1,000 2,165 736,961 1.97 8 4,100 0.01 2,173 741,061 1.98
1,001 - 10,000 1,352 4,292,838 11.45 10 42,000 0.11 1,362 4,334,838 11.56
10,001 - 100,000 112 2,476,426 6.60 4 147,500 0.40 116 2,623,926 7.00
100,001 - 1,000,000 11 2,517,625 6.71 - - - 11 2,517,625 6.71
Over - 1,000,000 3 27,282,550 72.75 - - - 3 27,282,550 72.75
Total 3,643 37,306,400 99.48 22 193,600 0.52 3,665 37,500,000 100
31st December 2010 31st December 2009
No. of Shareholders
No. of Shares % No. of Shareholders
No. of Shares %
Resident 3,643 37,306,400 99.48 3,813 37,256,250 99.35
Non-Resident 22 193,600 0.52 32 243,750 0.65
Total 3,665 37,500,000 100 3,845 37,500,000 100
31st December 2010 31st December 2009
No. of Shareholders
No. of Shares % No. of Shareholders
No. of Shares %
Individual 3,592 7,866,833 20.98 3,788 8,973,583 23.93
Institutional 73 29,633,167 79.02 57 28,526,417 76.07
Total 3,665 37,500,000 100 3,845 37,500,000 100

201HNB ASSURANCE PLC ANNUAL REPORT 2010
5. Directors’ Shareholding
As per the rule No. 7.6 (V) of the Colombo Stock Exchange, the Directors shareholding details during the year are given as follows
Name of the Director No. of Shares as at No. of Shares as at 31st December 2010 31st December 2009
Rienzie T. Wijetilleke (Chairman) 750 750 Manjula de Silva (Managing Director) 25,000 25,000 M U de Silva 2,250 2,250 Pratapkumar de Silva 1,000 - D M de S Wijeyeratne 500 500 Sarath Ratwatte 11,000 11,000 R Theagarajah 6,250 6,250 J M J Perera 5,250 5,250 J D N Kekulawala 30,000 26,000
6. Top 20 Shareholders
As per the rule No. 7.6 (III) of the Colombo Stock Exchange, the 20 largest shareholders as at 31st December 2010 together with their Shareholding as at 31st December 2009 are given below.
Name of the Shareholder 2010 2009 Shareholding % on Total Shareholding % on Total No. of Shares No. of Shares
Hatton National Bank PLC 22,494,750 59.99 22,494,750 59.99Mercantile Merchant Bank Ltd. 3,287,800 8.77 - -The Ceylon Guardian Investment Trust PLC 1,500,000 4.00 - -National Savings Bank 768,600 2.05 - -Employees Trust Fund Board 309,200 0.82 465,700 1.24Mr. M. F. Hashim 303,350 0.81 264,000 0.70Bank of Ceylon A/C Ceybank Century Growth Fund 288,100 0.77 - -Deutsche Bank AG - Comtrust Equity Fund 150,000 0.40 - -Mr. K.N.J. Balendra 142,300 0.38 - -Mr. M. H. V. U. Gunatilaka 120,075 0.32 117,545 0.31Mr. R. Senathirajah 119,900 0.32 60,000 0.16Mr. A. P. Somasiri 115,000 0.31 115,000 0.31Mr. S. Abishek 101,000 0.27 101,000 0.27Mr. K. Laveendrakumar 100,100 0.27 142,000 0.38Mrs. N. Hashim 96,650 0.26 91,650 0.24Malship Ceylon Ltd. 93,500 0.25 93,500 0.25Mr. B. Selvanayagam & Mrs. L. Selvanayagam 90,000 0.24 100,000 0.27Union Bank of Colombo Ltd. 76,500 0.20 - -Union Investments Ltd. 75,000 0.20 75,000 0.20The Sri Lanka Fund 70,700 0.19 - - 30,302,525 80.82
7. Public Shareholding
As per the Rule No. 7.6 (IV) of the Colombo Stock Exchange, the details of the public shareholding are given as follows.
2010 2009 No. of Shares % on Total No. of Shares % on Total
No. of Shares No. of Shares
Number of Shares 14,923,250 39.80 14,928,250 39.81

202
Share Information
8. Share Performance
As per the Rule No. 7.6 (XI) of the Colombo Stock Exchange, details relating to the Share Performance are given below.
2010 2009 2008 2007
Number of Transactions 4,812 7,084 3,641 6,141
Number of Shares Traded 13,201,900 10,535,000 3,566,900 7,343,100Value of Shares Traded (Rs.) 784,213,895 391,270,975 85,513,100 195,286,050CSE Turnover (Rs. Bn.) 570.30 142.50 110.50 105.00Market Capitalisation (Rs. Mn.) HNB Assurance PLC 2,925 1,856 694 919 CSE 2,210,452 1,092,138 488,813 820,652Dividend Per Share (Rs.) 1.80 1.50 1.25 1.00Dividend pay-out (Rs. Mn.) 67.5 56.3 46.9 37.5Basic Earnings Per Share (Rs.) 6.45 5.38 4.39 3.29Net Assets Per Share (Rs.) 27.10 22.16 18.03 14.64Market Price Per Share (Rs.) Highest 90.00 57.00 27.00 37.00 Lowest 45.00 17.25 17.00 18.00 Year end (VWA) 78.00 49.50 18.25 24.50P/E Ratio (Times) 12.09 9.20 4.16 7.45
9. Disclosure of Related Party Transactions
As required by the CSE listing rule number 7.6.(xvi), it is required to disclose Related Party transactions exceeding 10% of the Eq-uity or 5% of the total assets of the Entity. There were no individual transactions falling under this criteria during the year. However, all related party transactions at aggregate level have been disclosed under Note 31 to the Financial Statements.

203HNB ASSURANCE PLC ANNUAL REPORT 2010
Quarterly Analysis 2010 and 2009
Quarterly Analysis 2010 Company Statement of Income
1st Quarter 2nd Quarter 3rd Quarter 4th Quarter Total Jan-Mar 10 Apr-Jun 10 Jul-Sep 10 Oct-Dec 10 Jan-Dec 10 Rs. ‘000 Rs. ‘000 Rs. ‘000 Rs. ‘000 Rs. ‘000
Revenue 525,635 536,019 618,367 681,219 2,361,240 Gross Written Premium 538,028 526,173 661,408 702,574 2,428,183 Premiums Ceded to Reinsurers (102,429) (113,467) (114,500) (119,065) (449,461)Net Written Premium 435,599 412,706 546,908 583,509 1,978,722 Net Change in Reserves for Unearned Premium (28,500) 476 (52,494) (53,844) (134,362)Net Earned Premium 407,099 413,182 494,414 529,665 1,844,360 Benefi ts, Losses and Expenses Insurance Claims and Benefi ts (Net) (142,147) (150,914) (177,863) (177,213) (648,137)Increase in Life Insurance Fund (140,169) (135,712) (195,426) (60,426) (531,733)Underwriting and Net Acquisition Costs (43,271) (28,855) (42,872) (49,993) (164,991)Other Insurance Related Costs (4,856) (4,192) (4,233) (2,477) (15,758)Total Benefi ts, Losses and Expenses (330,443) (319,673) (420,394) (290,109) (1,360,619)Net Earned Premium less Benefi ts, Losses and Expenses 76,656 93,509 74,020 239,556 483,741 Other Revenue Income from Investments and Other Income 118,536 122,837 123,953 151,554 516,880 Expenses Other Operating, Investment Related and Administration Expenses (166,577) (182,709) (176,746) (205,064) (731,096)Profi t from Operations 28,615 33,637 21,227 186,046 269,525 Finance Expenses - - - - - Profi t Before Taxation 28,615 33,637 21,227 186,046 269,525 Income Tax Expense (8,506) (9,468) (4,557) (5,255) (27,786)Profi t for the period 20,109 24,169 16,670 180,791 241,739 Quarterly Analysis 2009 Company Statement of Income
1st Quarter 2nd Quarter 3rd Quarter 4th Quarter Total Jan-Mar 09 Apr-Jun 09 Jul-Sep 09 Oct-Dec 09 Jan-Dec 09 Rs. ‘000 Rs. ‘000 Rs. ‘000 Rs. ‘000 Rs. ‘000
Revenue 456,086 488,528 607,523 484,648 2,036,785 Gross Written Premium 457,287 537,110 640,272 480,978 2,115,647 Premiums Ceded to Reinsurers (93,100) (148,379) (96,794) (115,244) (453,517)Net Written Premium 364,187 388,731 543,478 365,734 1,662,130 Net Change in Reserves for Unearned Premium (17,484) (19,690) (55,899) (1,310) (94,383)Net Earned Premium 346,703 369,041 487,579 364,424 1,567,747 Benefi ts, Losses and Expenses Insurance Claims and Benefi ts (Net) (123,592) (116,119) (129,916) (142,284) (511,911)Increase in Life Insurance Fund (131,772) (166,670) (224,926) 30,360 (493,008)Underwriting and Net Acquisition Costs (42,390) (25,262) (43,947) (38,509) (150,108)Other Insurance Related Costs (1,883) (2,065) (3,688) (2,229) (9,865)Total Benefi ts, Losses and Expenses (299,637) (310,116) (402,477) (152,662) (1,164,892)Net Earned Premium Less Benefi ts, Losses and Expenses 47,066 58,925 85,102 211,762 402,855 Other Revenue Income from Investments and Other Income 109,383 119,487 119,944 120,224 469,038 Expenses Other Operating, Investment Related and Administration Expenses (134,545) (153,907) (175,963) (176,353) (640,768)Profi t from Operations 21,904 24,505 29,083 155,633 231,125 Finance Expenses (28) (15) - (1) (44)Profi t Before Taxation 21,876 24,490 29,083 155,632 231,081 Income Tax Expense (6,009) (6,453) (7,666) (9,343) (29,471)Profi t for the Period 15,867 18,037 21,417 146,289 201,610

204
Ten Year Summary
Statement of Income for the year ended 31st December, 2010 2009 2008 2007 2006 2005 2004 2003 2002 2001 Rs. ‘000 Rs. ‘000 Rs. ‘000 Rs. ‘000 Rs. ‘000 Rs. ‘000 Rs. ‘000 Rs. ‘000 Rs. ‘000 Rs. ‘000
GENERAL INSURANCE (*)
Gross Written Premium 1,343,703 1,130,781 924,709 704,577 618,502 469,929 338,708 243,392 122,232 11,785
Net Earned Premium 859,077 675,939 541,463 468,595 362,540 270,059 199,777 134,654 26,328 123 Income from Investments and Other Income 177,585 157,308 126,784 85,880 56,164 38,506 31,088 28,377 32,165 12,890 Net Claims Incurred (588,237) (448,210) (363,813) (291,283) (219,336) (144,548) (123,751) (59,632) (22,399) (85)Net Commission Incurred 12,539 1,887 (6,272) 1,546 (6,058) (4,947) (4,957) (7,460) (1,847) 136 Expenses (347,439) (285,843) (228,288) (186,406) (130,609) (107,061) (85,038) (61,502) (28,272) (4,793)Profi t Before Taxation 113,525 101,081 69,874 78,332 62,701 52,009 17,119 34,437 5,975 8,271
(*) General Insurance business commenced on 22.11.2001
LIFE INSURANCE
Gross Written Premium 1,084,480 984,866 914,170 767,576 503,321 354,181 205,885 104,436 35,297 -
Net Written Premium 985,283 891,808 834,218 698,048 451,920 318,684 188,980 95,009 32,755 - Income from Investments and Other Income 339,295 311,730 217,223 114,920 53,497 26,483 12,208 6,172 1,140 - Net Benefi ts Incurred (59,900) (63,701) (44,669) (25,595) (14,924) (12,183) (7,673) (1,478) (129) - Net Commission Incurred (177,530) (151,995) (161,894) (154,212) (115,132) (88,675) (58,785) (20,960) (1,427) - Expenses (399,415) (364,834) (265,047) (195,208) (138,458) (103,259) (49,191) (23,541) (3,312) - Increase in Life Insurance Fund (531,733) (493,008) (479,831) (372,953) (206,903) (131,050) (85,539) (55,202) (29,027) - Profi t Before Taxation 156,000 130,000 100,000 65,000 30,000 10,000 - - - -
(**) Life Insurance business commenced on 01.01.2002
COMPANY
Gross Written Premium 2,428,183 2,115,647 1,838,879 1,472,153 1,121,823 824,110 544,593 347,828 157,529 11,785
Net Earned Premium 1,844,360 1,567,747 1,375,681 1,166,643 814,460 588,743 388,757 229,663 59,083 123 Income from Investments and Other Income 516,880 469,038 344,007 200,800 109,661 64,989 43,296 34,549 33,305 12,890 Net Claims and Benefi ts (Net) (648,137) (511,911) (408,482) (316,878) (234,260) (156,731) (131,424) (61,110) (22,528) (85)Net Commission Incurred (164,991) (150,108) (168,166) (152,666) (121,190) (93,622) (63,742) (28,420) (3,274) 136 Expenses (746,854) (650,677) (493,335) (381,614) (269,067) (210,320) (134,229) (85,043) (31,584) (4,793)Increase in Life Insurance Fund (531,733) (493,008) (479,831) (372,953) (206,903) (131,050) (85,539) (55,202) (29,027) - Profi t Before Taxation 269,525 231,081 169,874 143,332 92,701 62,009 17,119 34,437 5,975 8,271 Income Tax Expense (27,786) (29,471) (5,401) (20,000) (1,377) (1,720) (733) 1,374 (1,109) (3,636)Profi t for the Year 241,739 201,610 164,473 123,332 91,324 60,289 16,386 35,811 4,866 4,635
Basic Earnings per Share (Rs.) 6.45 5.38 4.39 3.29 2.44 1.61 0.44 0.95 0.13 0.12 Dividend per Share (Rs.) 1.80 1.50 1.25 1.00 1.00 0.50 - - - -
Balance Sheet as at 31 st December, 2010 2009 2008 2007 2006 2005 2004 2003 2002 2001 Rs. ‘000 Rs. ‘000 Rs. ‘000 Rs. ‘000 Rs. ‘000 Rs. ‘000 Rs. ‘000 Rs. ‘000 Rs. ‘000 Rs. ‘000
GENERAL INSURANCE
Assets Investments 1,161,203 1,031,342 774,477 627,655 530,914 442,077 352,050 307,301 267,092 251,900 Intangible Assets 46,096 40,091 17,316 17,603 18,530 21,175 17,391 4,893 - - Property, Plant and Equipment 126,398 110,896 83,566 68,064 54,096 44,881 27,486 33,713 7,396 2,492 Reinsurance Receivable 103,814 57,541 59,289 24,683 7,620 14,268 1,558 1,499 - - Premium Receivable from Policyholders 231,929 157,029 120,922 86,721 95,572 67,538 67,536 48,350 36,130 11,399 Other Assets 251,434 227,686 184,361 121,267 104,772 98,798 68,777 16,929 9,834 6,939 Cash and Cash Equivalents 68,349 48,848 77,332 71,181 66,785 42,838 36,839 25,165 16,700 317 Total Assets 1,989,223 1,673,433 1,317,263 1,017,174 878,289 731,575 571,637 437,850 337,152 273,047
Liabilities and EquityLiabilities Insurance Provision - General 730,658 599,364 470,206 340,562 319,538 267,020 210,611 114,841 53,831 2,905 Other Liabilities 163,913 165,321 110,800 84,539 51,754 64,970 30,827 18,924 15,858 15,507 Reinsurance Creditors 56,642 62,314 50,504 36,375 52,661 24,961 17,022 8,017 7,802 - Retirement Benefi t Obligation 21,670 15,583 9,637 6,555 3,525 2,637 1,479 756 160 - Total Liabilities 972,883 842,582 641,147 468,031 427,478 359,588 259,939 142,538 77,651 18,412
Equity Stated Capital 375,000 375,000 375,000 375,000 250,000 250,000 250,000 250,000 250,000 250,000 Revenue Reserves 641,340 455,851 301,116 174,143 200,811 121,987 61,698 45,312 9,501 4,635 Total Equity 1,016,340 830,851 676,116 549,143 450,811 371,987 311,698 295,312 259,501 254,635
Total Liabilities and Equity 1,989,223 1,673,433 1,317,263 1,017,174 878,289 731,575 571,637 437,850 337,152 273,047
(*) General Insurance business commenced on 22.11.2001

205HNB ASSURANCE PLC ANNUAL REPORT 2010
Balance Sheet as at 31 st December, 2010 2009 2008 2007 2006 2005 2004 2003 2002 2001 Rs. ‘000 Rs. ‘000 Rs. ‘000 Rs. ‘000 Rs. ‘000 Rs. ‘000 Rs. ‘000 Rs. ‘000 Rs. ‘000 Rs. ‘000
LIFE INSURANCE Assets Investments 2,242,702 1,686,073 1,263,166 852,943 513,475 335,222 177,987 89,207 27,878 - Intangible Assets 20,903 14,653 5,742 2,936 1,872 204 116 50 - - Property, Plant and Equipment 4,573 6,174 8,151 4,333 3,086 2,994 2,637 2,429 - - Loans to Life Policyholders 13,263 9,309 4,666 1,588 1,277 982 - - - - Reinsurance Receivable 18,617 16,283 10,025 6,234 8,647 2,271 - - - - Other Assets 245,918 220,524 150,521 78,783 31,857 20,058 12,308 1,584 541 - Cash & Cash Equivalents 13,005 45,252 39,939 44,890 36,981 13,102 19,028 14,707 5,522 - Total Assets 2,558,981 1,998,268 1,482,210 991,707 597,195 374,833 212,076 107,977 33,941 -
Liabilities Insurance Provision - Life 2,385,246 1,853,513 1,360,505 880,674 507,721 300,818 169,768 84,229 29,027 - Other Liabilities 144,988 117,221 87,489 68,059 53,152 64,009 32,577 18,247 3,603 - Reinsurance Creditors 25,341 24,937 32,535 42,052 35,867 9,542 9,489 5,441 1,305 - Retirement Benefi t Obligation 3,406 2,597 1,681 922 455 464 242 60 6 - Total Liabilities 2,558,981 1,998,268 1,482,210 991,707 597,195 374,833 212,076 107,977 33,941 -
(**) Life Insurance Business commenced on 01.01.2002
Balance Sheet as at 31 st December, 2010 2009 2008 2007 2006 2005 2004 2003 2002 2001 Rs. ‘000 Rs. ‘000 Rs. ‘000 Rs. ‘000 Rs. ‘000 Rs. ‘000 Rs. ‘000 Rs. ‘000 Rs. ‘000 Rs. ‘000
COMPANY Assets Investments 3,403,905 2,717,415 2,037,643 1,480,598 1,044,389 777,299 530,037 396,508 294,970 251,900 Intangible Assets 66,999 54,744 23,058 20,539 20,402 21,379 17,507 4,943 - - Property, Plant and Equipment 130,971 117,070 91,717 72,397 57,182 47,875 30,123 36,142 7,396 2,492 Loans to Life Policyholders 13,263 9,309 4,666 1,588 1,277 982 - - - - Reinsurance Receivable 122,431 73,824 69,314 30,917 16,267 16,539 1,558 1,499 - - Premium Receivable 231,929 157,029 120,922 86,721 95,572 67,538 67,536 48,350 36,130 11,399 Other Assets 497,352 448,210 334,882 200,050 136,629 118,856 81,085 18,513 10,375 6,939 Cash and Cash Equivalents 81,354 94,100 117,271 116,071 103,766 55,940 55,867 39,872 22,222 317 Total Assets 4,548,204 3,671,701 2,799,473 2,008,881 1,475,484 1,106,408 783,713 545,827 371,093 273,047
Liabilities and Equity Liabilities Insurance Provision - Life 2,385,246 1,853,513 1,360,505 880,674 507,721 300,818 169,768 84,229 29,027 - Insurance Provision - General 730,658 599,364 470,206 340,562 319,538 267,020 210,611 114,841 53,831 2,905 Other Liabilities 308,901 282,542 198,289 152,598 104,906 128,979 63,404 37,171 19,461 15,507 Reinsurance Creditors 81,983 87,251 83,039 78,427 88,528 34,503 26,511 13,458 9,107 - Retirement Benefi t Obligation 25,076 18,180 11,318 7,477 3,980 3,101 1,721 816 166 - Total Liabilities 3,531,864 2,840,850 2,123,357 1,459,738 1,024,673 734,421 472,015 250,515 111,592 18,412
Equity Stated Capital 375,000 375,000 375,000 375,000 250,000 250,000 250,000 250,000 250,000 250,000 Revenue Reserves 641,340 455,851 301,116 174,143 200,811 121,987 61,698 45,312 9,501 4,635 Total Equity 1,016,340 830,851 676,116 549,143 450,811 371,987 311,698 295,312 259,501 254,635
Total Liabilities and Equity 4,548,204 3,671,701 2,799,473 2,008,881 1,475,484 1,106,408 783,713 545,827 371,093 273,047
2010 2009 2008 2007 2006 2005 2004 2003 2002 2001 Rs. ‘000 Rs. ‘000 Rs. ‘000 Rs. ‘000 Rs. ‘000 Rs. ‘000 Rs. ‘000 Rs. ‘000 Rs. ‘000 Rs. ‘000
Investor Information Return on Equity 23.79% 24.27% 24.32% 22.46% 20.26% 16.21% 5.26% 12.13% 1.88% 1.82%Market Price per Share as at 31st Dec (VWA) (Rs.) 78.00 49.50 18.25 24.50 25.00 12.75 12.50 10.25 - - Market Price per Share as at 31st Dec (VWA) (Rs.) - Adjusted for Bonus issue 78.00 49.50 18.25 24.50 16.67 8.50 8.33 6.83 - - Price Earnings Ratio (Times) 12.10 9.20 4.16 7.45 10.25 7.92 28.41 10.79 - - Market Capitalisation (Rs.Mn) 2,925 1,856 694 919 625 319 313 256 - -
Employee Information Number of Employees 597 540 457 377 308 262 208 180 99 23 GWP per Employee (Rs.Mn) 4.07 3.92 4.02 3.90 3.64 3.15 2.62 1.93 1.59 0.51 Net profi t per Employee (Rs.’000) 404.92 373.35 359.90 327.14 296.51 230.11 78.78 198.95 49.15 201.52 General Insurance OperationsNet Claims Ratio 68% 66% 67% 62% 60% 54% 62% 44% 85% 69%Expense Ratio 39% 42% 43% 39% 38% 41% 45% 51% 114% 3786%Combined Ratio 107% 108% 110% 102% 98% 95% 107% 95% 199% 3855%

206
Glossary
Acquisition ExpensesAll expenses which vary with, are primarily related to, the acquisition of new insurance contracts and the renewal of existing insurance contracts. E.g. Commissions.
ActuaryAn Expert concerned with the application of probability and statistical theories to problems of insurance, investment, fi nancial management and demography.
Admissible AssetsAssets that may be included in determining an insurer’s statutory solvency. Such assets are specifi ed under the rules made by the Insurance Board of Sri Lanka under the Regulation of Insurance Industry Act, No. 43 of 2000.
Approved AssetsAssets that represent the technical reserve and the Long- Term insurance Fund as per the Determinations made under the Regulation of Insurance Industry Act, No. 43 of 2000.
BancassuranceAn arrangement whereby banks sell insurance products to their customers on behalf of insurance companies.
Benefi ciaryA person or fi nancial institution named by the policyholder as the recipient of the sum insured and other benefi ts due in the event of the policyholder’s death.
ClaimsThe amount payable under a contract of insurance arising from the occurrence of an insured event.
Claims IncurredA claim is incurred when the event giving rise to the claim occurs. Claims incurred include the paid claims and movements in outstanding claims.
Claims Incurred But Not Reported (IBNR)Claims arising out of events which have occurred by the Balance Sheet date but have not been reported to the insurer as at that date.
Claims Incurred But Not Enough Reported (IBNER)A reserve made in respect of property, liability and pecuniary insurances to cover the expected cost of losses that have occurred but no comprehensive information is available to make adequate provisions as at the Balance Sheet date.
Claims Outstanding reserve (General Insurance Business)The amount provided to cover the estimated ultimate cost of settling claims arising out of events which have occurred by the Balance Sheet date, including IBNR and IBNER claims and claims handling expenses, less amounts already paid in respect of those claims.
Claims Outstanding Reserve (Life Insurance Business)The amount provided to cover the estimated ultimate cost of settling claims arising out of events which have been notifi ed by the Balance Sheet date being the sums due to benefi ciaries together with claims handling expenses, less amounts already paid in respect of those claims.
Co-InsuranceAn arrangement whereby two or more insurers enter into a single contract with the insured to cover a risk in agreed proportions at a specifi ed premium.
CommissionA payment made to an insurance broker or a sales advisor in return for selling and servicing an insurer’s products.
Deferred Acquisition Expenses (General Insurance Business) Acquisition Expenses relating to the unexpired period of risk of contracts in force at the Balance Sheet date which are carried forward from one accounting period to subsequent accounting periods.
Earned PremiumsWritten premiums adjusted by the unearned premium provisions at the beginning and at the end of the accounting period.
Fair ValueFair value is the amount for which an asset could be exchanged or a liability settled, between knowledgeable, willing parties in an arm’s length transaction.
Gross/netThe terms gross and net mean before and after deduction of the portion attributable to reinsurance.
Gross Written Premium - General InsurancePremium which an insurer is contractually entitled to receive from the insured in relation to contracts of insurance, before any reinsurance is taken into account.
Gross Written Premium - Life InsurancePremium to which the insurer is contractually entitled and received during the accounting period.
Insurance Provision - General Include net unearned premium, gross claims outstanding, reserve for claims incurred but not reported (IBNR) and reserve for claims incurred but not enough reported (IBNER) net of any deferred acquisition expenses.
Insurance Provision - LifeThe funds to be maintained by an insurer in respect of its Long Term Insurance business in accordance with the Regulation of Insurance Industry Act, No. 43 of 2000.

207HNB ASSURANCE PLC ANNUAL REPORT 2010
Key Insurance RatiosNet Claims Ratio = Net Claims Incurred
Net Earned Premium
Expense Ratio = Expenses other than Net Claims Incurred
Net Earned Premium
Combined Ratio = Net Claims Incurred + Expenses
Net Earned Premium
Market CapitalisationNumber of shares in issue multiplied by the market value of each share as at a given date.
Net Earned PremiumNet Earned Premium is the proportion of written premiums attributable to the risks borne, net of premiums ceded to reinsurance.
Net Written PremiumThe balance of the Gross Written Premium after deduction of any premium paid or payable by the insurer for reinsurance ceded. Commonly identifi es as Net Premium too.
Non-Participating BusinessLife Insurance business where policyholders are not entitled to share in the surplus of the relevant life fund.
Participating BusinessLife insurance business where the policyholders are contractually entitled to share in the surplus of the relevant life fund.
Primary Insurers Insurance Companies that assume risks in return for an insurance premium and have a direct contractual relationship with the holder of the insurance policy.
ReinsuranceTransfer of all or part of the risk assumed by a primary insurer under one or more insurance to another insurer, called the re-insurer.
Reinsurance Commission / DiscountCommission / discount received or receivable in respect of premiums paid to any reinsurer.
RetentionThe part of the risk assumed which the insurer / reinsurer does not reinsure, i.e. retained net for own account.
Solvency Margin - Life InsuranceThe difference between the value of admissible assets and the value of liabilities, required to be maintained by the insurer who carries on Long Term Insurance business as defi ned in Solvency Margin rules 2002, made under the Section 26 of the Regulation of Insurance Industry Act, No. 43 of 2000.
Solvency Margin - General InsuranceThe difference between the value of the admissible assets and the value of the liabilities, required to be maintained by any insurer who carries on General Insurance business as defi ned in Solvency Margin rules 2004, made under the Section 26 of the Regulation of Insurance Industry Act, No. 43 of 2000.
Surrender valueThe amount payable by an insurer to a policyholder on termination of an insurance policy before the expiry of its term (more common in Life Insurance).
UnderwritingThe process of selecting risks and classifying them according to their degrees of insurability so that the appropriate rates may be assigned.
Underwriting Profi tThe underwriting results generated by transacting in General Insurance business, without taking into account the investment income.
Unearned Premium Amount set aside as at end of a fi nancial year of an insurer, out of premiums in respect of risks to be borne by such insurer after the end of such fi nancial year, under a contract of insurance entered into, prior to the end of that fi nancial year.
YieldRate of return on an investment in percentage terms, taking in to account annual income and any change in capital value. Also the dividend payable on a share expressed as a percentage of the market price.

208
Notice of Meeting
Notice is hereby given that the Ninth (9th) Annual General Meeting of HNB Assurance PLC is convened on Tuesday the Twenty Ninth (29th) day of March 2011, at the Auditorium on Level 22 of “HNB Towers”, at No: 479, T.B. Jayah Mawatha, Colombo 10 at 10.00 in the forenoon when the following Ordinary Business will be transacted.
To receive and consider the Annual Report of the Board of Directors along with the Financial Statements of the Company for the year ended 31st December 2010, the Auditors’ Report thereon.
To declare a dividend of Rs. 1.80 per share for the year 2010, to the shareholders as recommended by the Directors.
To re-elect Mr M U de Silva who retires by rotation at the Annual General Meeting, a Director of the Company in terms of Article 86 of the Articles of Association of the Company.
To re-appoint Mr J E P A de Silva who retires at the Annual General Meeting, having attained the age of 72 years, a Director of the Company and to adopt the following resolution :-
Resolution - “That Mr Joseph Eardley Pratapkumar Aditya de Silva who has attained the age of 70 years on 18th December 2008, be and is hereby re-appointed a Director of the Company in terms of Section 211 of the Companies Act No: 7 of 2007 and it is hereby declared that the age limit of 70 years referred to in Section 210 of the Companies Act, shall not apply to the said Director”.
To re-appoint the Auditors for the ensuing year and to authorise the Directors to fi x their remuneration.
To authorise the Directors to determine payments for the year 2011 for charitable and other purposes.
By Order of the BoardHNB ASSURANCE PLC
Indrani GoonesekeraBoard Secretary
Colombo, Sri Lanka.31st January, 2011.
Notes :
1. A member entitled to attend or attend and vote at the meeting is entitled to appoint a proxy to attend or attend and vote as the case may be, in his stead.
2. A proxy need not be a member of the Company. The Form of Proxy is enclosed.
3. The completed Form of Proxy should be deposited with the Board Secretary at the Registered Offi ce of the Company at “HNB Towers”, Level 19, No:479, T.B. Jayah Mawatha, Colombo 10, not less than 48 hours before the time appointed for holding the meeting.

209HNB ASSURANCE PLC ANNUAL REPORT 2010
Form of Proxy
I/We ………………………………………………………….......................………………………………………………………….…of ……………………………………………………………………………………………………….……………… being *a member/members of the HNB Assurance PLC, hereby appoint ................................................................................................................................. …………………………...………………………… of ………………...........................................……………………… ……………………………….…….………….………………………………… or failing him/her Rienzie Theobald Wijetilleke or failing him Manjula Hiranya de Silva or failing him Madapathage Upali de Silva or failing him Joseph Eardley Pratapkumar Aditya de Silva or failing him Deepal Manik de Silva Wijeyeratne or failing him Sarath Carlyle Ratwatte or failing him Rajendra Theagarajah or failing him Joseph Michael Jayanth Perera or failing him Joseph Dacius Nihal Kekulawala, as *my/our proxy, to represent *me/us and to vote for *me/us on *my/our behalf on the resolutions (including the under mentioned) at the Ninth Annual Ordinary General Meeting of the Company to be held at the Auditorium on Level 22 of “HNB Towers” at No: 479, T B Jayah Mawatha, Colombo 10 on the 29th day of March 2011 at 10.00 in the forenoon and at any adjournment thereof and at every poll which may be taken in consequence thereof :
To declare a dividend of Rs. 1.80 per share In favour Against
To re-elect Mr M U de Silva, a Director of the Company In favour Against
To re-appoint Mr J E P A de Silva, a Director of the Company In favour Against
To re-appoint Auditors for the ensuing year/authorise the Directors to fi x their remuneration. In favour Against
To authorise the Directors to determine payments for charitable and other purposes In favour Against
Mark your preference with “√”
Signed this ……………………. day ………….………….. 2011.
Signature/s ..................................................................................... .....................................................................................
Please provide the details :
Shareholder’s NIC No./Company Registration No. .............................................................................
Folio No./Number of Shares held .............................................................................
Proxy holder’s NIC No. (if not a Director) .............................................................................
Note: See reverse hereof for instructions to complete the Proxy *Delete inappropriate words

210
Form of Proxy
INSTRUCTIONS TO COMPLETE PROXY
1. The full name and the registered address of the shareholder appointing the proxy should be legibly entered in the Form of Proxy, duly signed and dated.
2. The completed Proxy should be deposited with the Board Secretary, at the Registered Offi ce of the Company at “HNB Towers”, Level 19, No: 479, T B Jayah Mawatha, Colombo 10, not less than 48 hours before the time appointed for holding the Meeting.
3. The Proxy shall -
(a) in the case of an individual be signed by the shareholder or by his attorney, and if signed by an attorney, a notarially certi-fi ed copy of the Power of Attorney should be attached to the completed Proxy if it has not already been registered with the Company.
(b) in the case of a company or corporate body, either be under its Common Seal or signed by its attorney or by an offi cer on behalf of the Company or corporate body in accordance with the Articles of Association or the Constitution of that Com-pany or corporate body.
The Company may, but shall not be bound to, require evidence of the authority of any such attorney or offi cer.
(c) in the case of joint-holders, the fi rst joint-holder has the power to sign the proxy without the concurrence of the other joint-holder/s.
4. Every alteration or addition to the Proxy must be duly authenticated by the full signature of the shareholder, signing the Proxy. Such signature should as far as possible be placed in proximity to the alteration or addition intended to be authenticated.
211HNB ASSURANCE PLC ANNUAL REPORT 2010
Investor Feedback Form
To request information or submit a comment / query to the Company, please complete the following and return this page to -
Head of Finance,HNB Assurance PLC,No. 10, Sri Uttarananda Mawatha,Colombo 03,Sri Lanka.Fax : 0112327287E-mail : [email protected]
Name : .......................................................................................................................................................
Permanent Mailing Address : .......................................................................................................................................................
Contact Numbers - (Tel) : ............................................ ............................................ .......................................... Country Code Area Code Number
- (Fax) : ............................................ ............................................ .......................................... Country Code Area Code Number
E-mail :
Name of Company :(If Applicable)
Designation :(If Applicable)
Company Address :(If Applicable)
Comments/Queries : ..........................................................................................................................................................
...........................................................................................................................................................................................................................
...........................................................................................................................................................................................................................
...........................................................................................................................................................................................................................
...........................................................................................................................................................................................................................
...........................................................................................................................................................................................................................
...........................................................................................................................................................................................................................
...........................................................................................................................................................................................................................
...........................................................................................................................................................................................................................
...........................................................................................................................................................................................................................
...........................................................................................................................................................................................................................
...........................................................................................................................................................................................................................
...........................................................................................................................................................................................................................
..........................................................................................................................................................................................................................

Companies are no greater than their stakeholders - those who bring power, wealth and integrity to each enterprise. Our stakeholders include our Shareholders, Customers, Employees, Business Partners, Environment and Society at large.
We recognise that YOU are the strength of our organisation, the reason for our success. Together we created this strongly knitted organisation; that is HNB Assurance.
Annual Report 2010
make us howe are
You
In 2001, a small sapling; HNB Assurance was planted in the vast Insurance Industry by Hatton National Bank PLC, one of the largest commercial banks in Sri Lanka. It was a small player among the giants, but its intentions were high to grow bigger and stronger. Day by day it grew taking the attention of all; customers, shareholders and business partners who were looked after with extended care. Its existence could not be shaken by the intense competition. Extensive skills and competencies have been rendered by the workforce showing great potential in achieving success, a fact that can never be forgotten.
Time has created it so firm; now it can give protection to whoever who comes under it. HNBA is standing at the threshold of an important milestone in its history, with open arms to welcome an enlightened future...
Produced by eMAGEWISE®
Photography by Studio TimesDigital Plates by Imageline Printing by ACE Printing & Packging

Annual Report 2010
www.hnbassurance.com
HN
B A
SSUR
AN
CE
PLC
AN
NU
AL
RE
POR
T 2010
make us howe are
You www.hnbassurance.com