Embed Size (px)
Citation preview

RADIOCARBON, Vol 46, Nr 3, 2004, p 1059–1086 © 2004 by the Arizona Board of Regents on behalf of the University of Arizona
1059
MARINE04 MARINE RADIOCARBON AGE CALIBRATION, 0–26 CAL KYR BP
Konrad A Hughen1 • Mike G L Baillie2 • Edouard Bard3 • J Warren Beck4 • Chanda J H Bertrand1 • Paul G Blackwell5 • Caitlin E Buck5 • George S Burr6 • Kirsten B Cutler7 • Paul E Damon6 • Richard L Edwards8 • Richard G Fairbanks9 • Michael Friedrich10 • Thomas P Guilderson11,16 • Bernd Kromer12 • Gerry McCormac2 • Sturt Manning13,14 • Christopher Bronk Ramsey15 • Paula J Reimer2,11 • Ron W Reimer16 • Sabine Remmele10 • John R Southon17 • Minze Stuiver18 • Sahra Talamo12 • F W Taylor19 • Johannes van der Plicht20,21 • Constanze E Weyhenmeyer11
ABSTRACT. New radiocarbon calibration curves, IntCal04 and Marine04, have been constructed and internationally rati-fied to replace the terrestrial and marine components of IntCal98. The new calibration data sets extend an additional 2000 yr,from 0–26 cal kyr BP (Before Present, 0 cal BP = AD 1950), and provide much higher resolution, greater precision, and moredetailed structure than IntCal98. For the Marine04 curve, dendrochronologically-dated tree-ring samples, converted with abox diffusion model to marine mixed-layer ages, cover the period from 0–10.5 cal kyr BP. Beyond 10.5 cal kyr BP, high-res-olution marine data become available from foraminifera in varved sediments and U/Th-dated corals. The marine records arecorrected with site-specific 14C reservoir age information to provide a single global marine mixed-layer calibration from10.5–26.0 cal kyr BP. A substantial enhancement relative to IntCal98 is the introduction of a random walk model, which takesinto account the uncertainty in both the calendar age and the 14C age to calculate the underlying calibration curve (Buck andBlackwell, this issue). The marine data sets and calibration curve for marine samples from the surface mixed layer (Marine04)are discussed here. The tree-ring data sets, sources of uncertainty, and regional offsets are presented in detail in a companionpaper by Reimer et al. (this issue).
INTRODUCTION
Radiocarbon dates must be converted to calendar ages for greatest utility in comparison, for exam-ple, to known historical ages in archaeology or calendric ice cores and layer-counted marine sedi-ments as well as U/Th chronologies in paleoceanographic studies. Tree-ring dendrochronologiesprovide the most accurate and highest resolution calibration data for terrestrial 14C ages, but cur-rently are limited to the past 12.4 cal kyr BP (Friedrich et al., this issue). In addition, for calibrationof marine dates, tree-ring 14C ages must be modeled to derive equivalent ocean mixed-layer ages.
1Woods Hole Oceanographic Institution, Department of Marine Chemistry & Geochemistry, Woods Hole, Massachusetts02543, USA.
2School of Archaeology and Palaeoecology, Queen’s University Belfast, Belfast BT7 1NN, United Kingdom.3CEREGE, UMR-6635, Europole de l’Arbois BP80, 13545 Aix-en-Provence cdx 4, France.4Department of Physics, University of Arizona, Tucson, Arizona 85721, USA.5Department of Probability and Statistics, University of Sheffield, Sheffield S3 7RH, United Kingdom.6Department of Geosciences, University of Arizona, Tucson, Arizona 85721, USA.7U.S. Department of State, Office of Senior Coordinator for Nuclear Safety, 2201 C Street NW, Washington DC, USA.8Department of Geology and Geophysics, University of Minnesota, Minneapolis, Minnesota, USA.9Lamont-Doherty Earth Observatory of Columbia University, Palisades, New York 10964, USA.10Universität Hohenheim, Institut für Botanik-210, D-70593 Stuttgart, Germany.11Center for Accelerator Mass Spectrometry L-397, Lawrence Livermore National Laboratory, Livermore, California 94550,USA.
12Heidelberger Akademie der Wissenschaften, Im Neuenheimer Feld 229, D-69120 Heidelberg, Germany.13The Department of Fine Art, Sidney Smith Hall, 100 St. George Street, University of Toronto, Ontario M5S 3G3, Canada.14Department of Archaeology, University of Reading, P.O. Box 217 Whiteknights, Reading RG6 6AB, United Kingdom.15Oxford Radiocarbon Accelerator Unit, 6 Keble Rd., Oxford OX2 6JB, England.16Department of Ocean Sciences, University of California, Santa Cruz, California 92697, USA.17Department of Earth System Science, University of California, Irvine, California 92697, USA.18Quaternary Isotope Lab, University of Washington, Seattle, Washington 98195, USA.19Institute for Geophysics, University of Texas, Austin, Texas, USA.20Center for Isotope Research, Groningen University, 9747 AG Groningen, the Netherlands.21Faculty of Archaeology, Leiden University, P.O. Box 9515, 2300 RA Leiden, the Netherlands.

1060 K A Hughen et al.
High-resolution measurements of the marine 14C calibration curve beyond tree rings have beenobtained from planktonic foraminifera in layer-counted varved sediments, extending detailed cali-bration back to 14.7 cal kyr BP (Hughen et al. 2000). Additional marine data parallel to and beyondthe varved sediment record are available through extensive measurements from U/Th-dated coralsaround the world (Edwards et al. 1993; Bard et al. 1998; Burr et al. 1998; Burr et al., this issue; Cut-ler et al., this issue; Fairbanks et al., forthcoming).
In this paper, we describe the data sets and methods used to construct the new internationallyapproved marine calibration curve known as Marine04. Details concerning the original tree-ringdata used for the younger portion of Marine04, 0–10.5 cal kyr BP, are given in a companion paperby Reimer et al. (this issue). Because high-resolution marine data are lacking from 0 to 10.5 cal kyrBP, the calibration curve for surface mixed-layer marine samples, Marine04, is constructed over thisperiod from tree-ring measurements (Figure 1). The tree-ring data are combined using a randomwalk model (RWM) described in detail in Buck and Blackwell (this issue). The IntCal04 tree-ring-based curve that is estimated by the random walk model is then used as input to a global ocean-atmosphere box diffusion model (Stuiver and Braziunas 1993). The model is used to deconvolve the14C production rate from the tree-ring data and calculate the “global” ocean mixed-layer 14C ages.Beyond tree-rings, 14C measurements of foraminifera from Cariaco Basin varved sediments and U-series dated corals are used to construct the calibration curve. The high-resolution Cariaco Basindata set begins at 10.5 cal kyr BP, and the tree-ring-based data set is therefore only used back to thattime. The coral and foraminiferal 14C data sets are converted to “global” ocean mixed-layer valuesby subtracting the difference (∆R) between the regional reservoir age and the mixed-layer reservoirage R (Stuiver et al. 1986) calculated from the box diffusion model. The output from the globalocean-atmosphere box diffusion model and the normalized coral and foraminiferal 14C data are thencombined via the RWM to derive an estimate of the underlying marine curve. It is this estimate fromthe RWM which is continuous between 0 and 26 cal kyr BP that we call Marine04.
Figure 1 Schematic diagram of IntCal04 and Marine04 calibration data set construction. Tree-ring data extend from 0 to12.4 cal kyr BP. Beyond the end of the tree rings, coral and foraminifera data are converted to the atmospheric equivalentby subtracting a site-specific reservoir correction R. These data are input into the random walk model (RWM) to produceIntCal04. Marine data from 10.5–26.0 cal kyr BP are normalized to the “global” ocean by subtracting ∆R, the regional dif-ference from the model ocean reservoir age of 405 yr. The “global” marine data and the output from the box diffusionmodel (see main text) are used with the RWM to provide our estimate of the global marine calibration curve Marine04.

Marine04 Marine 14C Age Calibration, 0–26 cal kyr BP 1061
The IntCal04 working group, which met at Queen’s University Belfast in April 2002 and at WoodsHole Oceanographic Institution in May 2003, established criteria for acceptance of data into theIntCal04 and Marine04 calibration data set including general limitations on analytical errors andacceptable scatter and specific record-dependent criteria (Reimer et al. 2002). The criteria foracceptable tree-ring records are discussed in brief in Reimer et al. (this issue). For corals, criteriawere established to detect alteration of the original aragonite, including X-ray diffraction measure-ments to show <1% calcite, initial δ234U within ±5‰ of accepted seawater values, and concordantprotactinium ages where available, especially where diagenesis is most likely due to sub-aerialexposure. Numerous data from corals with pristine aragonite, and in several cases concordant Paages, have led to a revision in our understanding of the history of seawater δ234U (see Cutler et al.,this issue and references therein), and adoption of new criteria for coral initial δ234U values. Thesecriteria are discussed in greater detail in a later section. For layer-counted chronologies, such asthose based on varve counting, acceptance criteria include the need for multiple-core chronologiesto confirm that no sections are missing from core-breaks or erosion. In addition, independent radio-metrically-dated tie points should be employed whenever possible to validate and assess the qualityof the layer chronology. For all marine records, site-specific reservoir corrections should be mea-sured, and a “reasonable” error should be reported with the reservoir age (Reimer et al. 2002).
The calibration data sets for terrestrial and marine samples were presented for ratification at the 18thInternational Radiocarbon Conference in Wellington, New Zealand in September 2003. Suggestionsfrom conference participants have been incorporated into the final product. We do not make a rec-ommendation for calibration beyond 26 kyr at this time due to large disparities between the avail-able data sets (van der Plicht et al., this issue).
THE MARINE04 DATA SETS
The data sets used in the IntCal04 and Marine04 calibrations are given in full as supplemental mate-rial on the Radiocarbon Web site (www.radiocarbon.org) and are also available at www.calib.org.Uncertainties are given for the 14C ages and for the calibrated or cal time scales in order that theyboth may be accounted for in the curve building process (see Buck and Blackwell, this issue). Rep-licate 14C measurements within a laboratory or made by two or more laboratories are given sepa-rately, when available. These data are not necessarily completely independent estimates of theunderlying calibration curve, since they are derived from the same samples, but have been includedfor completeness.
Tree-Ring Data Sets (0–10.5 cal kyr BP)
The Holocene part of the Marine04 14C calibration is based on several millennia-long tree-ring chro-nologies, providing an annual, nearly absolute time frame, which was rigorously tested by internalreplication of many overlapping sections. Whenever possible, chronologies were cross-checkedwith independently established chronologies of adjacent regions. Details of individual tree-ring datasets are provided by Reimer et al. (this issue).
Marine Data Sets (10.5–26 cal kyr BP)
Marine calibration older than 10.5 cal kyr BP is provided by data from Cariaco Basin and coral U/Th ages. Cariaco and coral data are combined from 10.5 to 14.7 cal kyr BP, and coral data alone areused to extend calibration back to 26 cal kyr BP. We calculated site-specific reservoir correctionsfrom the weighted mean difference of marine and tree-ring 14C ages using data overlapping from500–12,500 BP (Table 1), not including recent pre-bomb data pairs used in previous publications.This was done in order to avoid uncertainty in the degree of fossil fuel influence on reservoir calcu-

1062 K A Hughen et al.
lations from recent samples, and also to assess changes in reservoir age due to different climaticstates (e.g. Younger Dryas). In addition, the increased number of marine-terrestrial age comparisonsprovides more realistic error estimates on calculated reservoir corrections. For each marine sample,the difference in 14C age was calculated for the point in the tree-ring-derived portion of IntCal04nearest to it in time. For this comparison, no error was included for the calendar age of the marinesamples. However, the IntCal04 curve was smoothed with a 20-point (100-yr) average to diminishthe influence of calendar age uncertainty. The variance of the difference was calculated as the sumof the squared errors of the marine and the IntCal04 14C ages. The weighted mean of all the differ-ences was calculated for each location and the observed standard deviation was taken as the uncer-tainty (Table 1). For the Vanuatu corals, a decadal average of the Burr et al. (1998) single-year datawas used for the comparison in addition to the Cutler et al. (this issue) data. For Mururoa, there areno overlapping tree-ring data points, so we use the value calculated for Tahiti, which is within a rea-sonable proximity. The calendar chronology for Cariaco Basin is based on a wiggle-match with thetree-rings, so there is obvious circularity in using this difference, although the calculated value over-laps with measurements from the core top (Hughen et al. 1996) and from corals from Isla Tortugas(Guilderson et al., forthcoming). For all sites, the reservoir corrections calculated here agree wellwithin errors with previous measurements (Table 1). For sites where we have compiled modern“pre-bomb” data (<100 BP), the inclusion of a fossil fuel correction (Bard et al. 1988; Southon et al.2002; Guilderson et al., forthcoming) may change calculated reservoir ages by up to 100 yr,although are generally still in agreement with the new values.
The current state of knowledge dictates that for construction of a global marine 14C calibrationcurve, site-specific reservoir and ∆R values are assumed to be constant with time. Although there isevidence for large (factor of two) reservoir age shifts in the past—e.g., during deglaciation in thehigh-latitude North Atlantic (Bard et al. 1994; Austin et al. 1995; Bjork et al. 1998; Bondevik et al.1999; Eiriksson et al. 2000; Waelbrook et al. 2001), Mediterranean Sea (Siani et al. 2001), and NewZealand region (Sikes et al. 2000)—all marine data sets used in Marine04 come from low-latitudetropics where the fluctuations in reservoir correction may not be as great. For example, CariacoBasin 14C ages agree closely with anchored tree-ring ages from 10.5 to 12.4 cal kyr BP across thelarge climatic shifts of the Younger Dryas (Hughen et al., this issue), exhibiting no evidence of sig-nificant reservoir variability. Nevertheless, the Cariaco comparison to floating tree-ring sectionsindicates the possibility that reservoir age increased by up to 50% during the Allerød (Kromer et al.,this issue). Therefore, both within single locations and between regions, some changes in reservoircorrection through time may be apparent—either as slight trends or increased/decreased variability(Figure 2). Many of these changes reflect real shifts in regional or local oceanography, such as sur-face circulation and advection, meridional overturning, or local upwelling, rather than analyticaluncertainties due to sample diagenesis or laboratory error. For example, the large variability in thePapua New Guinea and Vanuatu reservoir calculations are probably indications of changes in theamount of Eastern Equatorial water reaching these sites and local upwelling at Papua New Guinea.The Papua New Guinea coral data of Burr et al. (this issue), in comparison with the other marinedata sets (Figure A7), could be used to argue for a smaller reservoir correction than either theknown-age pre-bomb value of Edwards et al. (1993) or our calculation from the tree-ring overlap(Table 1), which underscores the high reservoir variability at this site.
Quantifiable records of changes in regional oceanographic conditions adequate for predicting andcorrecting such reservoir variability are presently lacking. Thus, a certain degree of scatter in site-specific reservoir values through time cannot be avoided, and must instead be characterized as res-ervoir uncertainty. This uncertainty incorporates all sources of error in reservoir measurement and
Marine04 Marine 14C Age Calibration, 0–26 cal kyr BP 1063
Figure 2 Site-specific reservoir corrections for the locations used in IntCal04 and Marine04. Sites include CariacoBasin (Hughen et al., this issue); Vanuatu (Burr et al. 1998; Cutler et al., this issue); Barbados (Bard et al. 1998; Fair-banks et al., forthcoming); Tahiti (Bard et al. 1998); Kirimati (Fairbanks et al., forthcoming); and Papua New Guinea(Edwards et al. 1993; Cutler et al., this issue). (a) Reservoir corrections from 0–12.5 cal kyr BP. Marine04 reservoir Rchanges from 0–10.5 due to shifts in atmospheric 14C production, but is held constant beyond 10.5. (b) Blow-up ofinterval of greatest marine-terrestrial data overlap. Slight but coherent changes in reservoir age through time are likelydue to real changes in oceanographic conditions (see text).
0
200
400
600
800
10000 10500 11000 11500 12000 12500
Marine04Cariaco BasinEspiritu Santu, TasmaloumUrelapaBarbadosTahitiKirimatiPapua New Guinea
Res
ervo
ir ag
e (
year
s)
Calendar age (yr BP)
0
200
400
600
800
0 2000 4000 6000 8000 10000 12000
Marine04Cariaco BasinVanuatu-Espiritu Santu, TasmaloumVanuatu-UrelapaBarbadosTahitiKirimatiPapua New Guinea
Res
ervo
ir ag
e (
year
s)
Calendar age (yr BP)
a
b

1064 K A Hughen et al.
calculation, and is likely an overestimation of true oceanic variability. Increased data density in thefuture may allow us to identify spatial and temporal patterns of reservoir variability, increasing pre-cision for calibration as well as our understanding of ocean circulation change.
U/Th-Dated Corals
Mass spectrometric techniques have been used to measure paired 14C and 230Th (as well as 231Pa)ages on fossil corals for 14C calibration. A plot of coral initial δ234U versus calendar age for coralswhich pass the <1% calcite criteria shows a distinct decline back in time (Figure 3). Adopting ascreening criteria based on modern seawater δ234U of 145.8 ± 5‰ (Cheng et al. 2000) as originallyproposed would eliminate approximately half of the data between 17 and 26 cal kyr BP. Many of theolder coral data show concordant 231Pa ages (Cutler et al., this issue; Fairbanks et al., forthcoming),and thus the lower value for initial δ234U is probably a reflection of true changes in seawater δ234Uthrough time. We set the acceptance criteria to be within 3 standard deviations of the mean value forthe 2 groups of corals before and after 17 cal kyr BP. For corals that grew from 0–17 cal kyr BP, ini-tial δ234U must lie within ± 7.2‰ (3 σ) of 145.2‰ (n = 171), close to our original criteria of acceptedseawater values. However, for older corals between 17 and 26 cal kyr BP in age, initial δ234Uappears to be lower and a new value has been adopted for screening, 140.6 ± 7.2‰ (3 σ, n = 80) (seeFigure 3). Although the data in Figure 3 could also accommodate a gradually changing seawaterδ234U, it is possible that seawater δ234U may have changed abruptly following input of high 234U/238U glacial flour during deglaciation (e.g. Robinson et al. 2004). Thus, a two-step model is usedhere for simplicity.
The data sets of Bard et al. (1990, 1998), Edwards et al. (1993), and Burr et al. (1998) were used inIntCal98 (Stuiver et al. 1998) and have been updated for inclusion in IntCal04 and Marine04. Exten-sive new coral data sets have been included from Cutler et al. (this issue) and Fairbanks et al. (forth-coming).
Table 1 New and previously determined site-specific marine reservoir corrections.
Location
Reservoir correction(tree-ring overlap)14C yr Uncertainty N
Previous value(known age, “pre-bomb”)14C yr
Barbados 360 80 22 400a
aBard et al. 1998.
Cariaco Basin 430 30 196 420b
bHughen et al. 1996.
Kirimati 330 80 27 300Mururoa Same as TahitiPapua New Guinea 490 150 17 407c
cEdwards et al. 1993.
Tahiti 280 120 22 300a
Vanuatu Espiritu Santu Tasmaloum
530 105 41494d
500d,e
dBurr et al. 1998.eCutler et al., this issue.
Vanuatu Urelapa
350 120 14400e

Marine04 Marine 14C Age Calibration, 0–26 cal kyr BP 1065
Bard et al. (1998) collected samples from boreholes drilled off the islands of Tahiti and Mururoa,French Polynesia, in order to complement the database previously obtained on Barbados corals(Bard et al. 1990, 1993). Nineteen dates from Barbados cover an age span from 0.7 to 22 cal kyr BP;27 dates from Tahiti cover 9.5 to 13.8 cal kyr BP; 4 dates from Mururoa span 15.5 to 23.5 cal kyr BP.
Edwards et al. (1993) measured paired 14C and 230Th ages on uplifted fossil corals from the HuonPeninsula, Papua New Guinea. Seventeen age pairs cover an age span from 7.6 to 13.1 cal kyr BP.Revised 234U and 230Th half-lives for 230Th-age and δ234U (Cheng et al. 2000) have been applied.
Burr et al. (1998) analyzed a single Diploastrea heliopora coral from Vanuatu. Growth bands in thecoral were used to identify individual years of growth. 14C measurements were made on each yearand are updated here to the original annual resolution; 352 dates over 4 discrete intervals cover anage span between 11.7 and 12.4 cal kyr BP. Burr et al. (this issue) analyzed a single Goniastrea favu-lus coral from drilling which took place on an uplifted Holocene terrace on the Huon Peninsula,Papua New Guinea, in the age range of 13.0 and 13.1 cal kyr BP in 6-month growth intervals.
Figure 3 Initial δ234U calculated from coral calibration data from 0–26 cal kyr BP. Symbols and references for sites are thesame as in Figure 2. The data show a general decrease in initial δ234U for the earlier interval, 17–26 cal kyr BP, althoughsome data points possess concordant 231Pa ages (solid symbols). A lower value for initial δ234U, 140.6 ± 7.2‰ (3 σ), hastherefore been adopted as part of the acceptance criteria for corals older than 17 cal kyr BP, and a value of 145.2 ± 7.2‰(3 σ) for corals younger than 17 cal kyr BP.
130
135
140
145
150
155
5000 10000 15000 20000 25000
VanuatuBarbadosTahitiKirimatiPapua New Guinea
23
4 U in
itial
(‰
)
Calendar age (yr BP)

1066 K A Hughen et al.
Cutler et al. (this issue) analyzed fossil corals in drill cores from Papua New Guinea and Vanuatu,obtaining calendar ages using both 230Th and 231Pa dating techniques. Six samples from Papua NewGuinea span an age range from 12.4 to 25.3 cal kyr BP; 48 samples were obtained from Vanuatu—25 dates from Tasmaloum spanning ages of 11.0 to 24.6 cal kyr BP, and 23 dates from Urelapa cov-ering ages from 5.4 to 19.6 cal kyr BP. 231Pa was measured for 11 samples from Papua New Guinea(18 measurements) and eight of those samples were found to be concordant. These measurementsare shown as solid triangles in Figure 3.
Fairbanks et al. (forthcoming) recovered drill cores from Barbados and Kirimati in the Caribbeanand central Pacific. Dating with 238U/234U/230Th used a multi-collector magnetic sector ICP massspectrometer: 190 dates from Barbados cover an age range from 0.7 to 25.8 cal kyr BP, and 64 datesfrom Kirimati span ages from 7.0 to 13.7 cal kyr BP. 231Pa was measured for a number of sampleswith low initial δ234U (Fairbanks et al., forthcoming).
Cariaco Basin Varved Sediments
For the IntCal98 data set (Stuiver et al. 1998), high-resolution calibration data older than tree ringswere provided by Cariaco Basin piston core PL07-PC56 (Hughen et al. 1998). Core 56PC was sam-pled every 10 cm, yielding approximately 100–200 yr resolution. For this IntCal04 curve, data areused from Cariaco piston core PL07-58PC, with a ~25% higher deposition rate than 56PC. Core58PC was sampled every 1.5 cm, providing 14C calibration at 10–15 yr resolution throughout theperiod of deglaciation (Hughen et al. 2000). The floating Cariaco varve chronology was anchored tothe revised and extended German pine chronology (Friedrich et al., this issue) by wiggle-matchingdetailed 14C structure over a 1900-yr window (Hughen et al., this issue); 388 dates span an age rangefrom 10.5 to 14.7 cal kyr BP.
Sources of Uncertainty
In cases where replicate 14C analyses have been made, it is possible to examine the actual variabilityin sample preservation, preparation, and measurement, and thus estimate an error multiplier bywhich the nominal laboratory error should be increased to allow for all additional sources or error.We compared the replicate analyses of Polynesian corals measured at the Gif-sur-Yvette AMS facil-ity (Bard et al. 1998; Paterne et al. 2004; Bard et al., this issue). The average nominal error in the 9replicated observations was 95 14C yr, whereas the observed standard deviation was 142 14C yr.Therefore, an error multiplier of 1.5 appears to be appropriate. We also compared replicate measure-ments of Barbados and Kirimati corals measured at CAMS (Fairbanks et al., forthcoming). For 118replicates, individual samples of coral were leached, graphitized, and analyzed. The average stan-dard deviation in the difference was 24 14C yr and the observed standard deviation was 19 14C yr,which gives an error multiplier of 0.8, rounded up to 1.0. The coral data measured at the NSF-Ari-zona AMS Laboratory were previously determined to have a multiplier of 1.0 (Donahue et al. 1997),and this value was used for all Arizona AMS coral measurements. For the remaining coral data, anerror multiplier of 2.0 was used as a conservative way to ensure that allowance is made for variabil-ity beyond the nominal laboratory error. In comparing these values with the existing literature, it isimportant to note that for corals, it has been customary to report the uncertainty at the 2-standarddeviation level (Edwards et al. 1993; Bard et al. 1998).
For Cariaco Basin forams, 80 replicate samples were picked, cleaned, and analyzed. The averagestandard deviation in the difference was 42 14C yr and the observed standard deviation was 28 14Cyr, which gives an error multiplier of 0.7, rounded up to 1.0. Another representation of 14C repro-ducibility for Cariaco samples can be obtained by the results of 28 measurements of the foram-rich

Marine04 Marine 14C Age Calibration, 0–26 cal kyr BP 1067
TIRI/FIRI turbidite sample made at the CAMS laboratory where the Cariaco samples were mea-sured (Guilderson et al. 2003), and from the comparison of 14C measurements between Cariaco for-aminifera and tree rings (Hughen et al., this issue). In both of these cases, the observed standarddeviation of the measurements is consistent with the uncertainty estimates derived from measure-ment error and background-correction uncertainties.
CALIBRATION CURVE CONSTRUCTION
The Marine04 curve is constructed in 2 parts using a combination of tree-ring and marine data sets(Figure 1). From 0–10.5 cal kyr BP, where high-resolution marine data are lacking, Marine04 usesthe dendrochronology-based curve of IntCal04. The tree-ring data are used along with the randomwalk model (RWM) detailed in Buck and Blackwell (this issue) to provide an estimate of the under-lying atmospheric calibration curve, known as IntCal04. This curve is then converted with an ocean-atmosphere box diffusion model to yield ocean mixed-layer 14C ages. The mixing and decay time of14C in the oceans slightly smoothes and attenuates the output of the box diffusion model, which isoffset from the atmospheric IntCal04 curve by a global mixed-layer reservoir age R (Figure 4a). The“global” reservoir 14C age of the surface ocean, R(t), is the time-dependent difference between themodeled or measured “global” surface ocean and atmospheric 14C ages. From 0–12.4 cal kyr BP,where both tree-ring and calculated mixed-layer ages exist, R varies with time as a result of rapidshifts in atmospheric ∆14C being attenuated in the surface ocean (Figure 4b). Beyond 10.5 cal kyrBP, Marine04 relies on direct measurements of marine 14C ages from corals and foraminifera. Indi-vidual marine data sets were corrected to a consistent global mixed-layer 14C data set by subtracting∆R. ∆R is defined as the difference between the regional surface ocean 14C age and the “global” sur-face ocean 14C age (Stuiver et al. 1986). Because atmospheric forcing of the regional part of theocean and the world ocean are approximately parallel, ∆R, for a given region, can, as a first approx-imation, be assumed to be constant. However, changes in oceanic circulation patterns or regionalupwelling of deep (older) water may cause ∆R to vary with time. Whether or not ∆R for a givenregion is constant through time is thus an important issue when establishing a chronology for marinerecords or calibrating marine 14C ages. A global R value for the period 10.5–26 cal kyr BP wasdetermined by the results of box diffusion model simulations for 500 yr from AD 1350–1850(described below), and equaled 405 ± 22 yr. The uncertainty in the corrected “global” marine dataset was calculated from the uncertainties in the marine 14C uncertainty and ∆R combined in quadra-ture, neglecting the box diffusion model uncertainty. The corrected “global” marine data and theoutput from the box diffusion model were then combined via the RWM to obtain our estimate of theglobal marine calibration curve, Marine04 (Figure 5).
To calibrate marine 14C ages using Marine04, one must know ∆R, the site-specific offset from theglobal ocean reservoir. Although global R in Marine04 changes from 0–10.5 cal kyr BP (but remainsconstant from 10.5–26 cal kyr BP), it is assumed that ∆R for any given marine location remains con-stant to a first approximation. To calculate ∆R, the site-specific marine 14C age is compared to theMarine04 mixed-layer 14C age for any known calendar age. For modern pre-bomb measurements,the calendar age is usually known or can be estimated accurately. A database of ∆R values calcu-lated for known-age marine samples is maintained at www.calib.org/marine. To evaluate theassumption of constant ∆R further back in time, terrestrial-marine pairs may be dated; however,great care must be taken to ensure that they are indeed contemporaneous. In those cases, ∆R can becalculated either by calibrating the terrestrial 14C age and comparing the difference between theequivalent marine age and the measured marine age (Southon et al. 1995) or by directly comparingthe terrestrial 14C age and the marine age using the combined IntCal04-Marine04 data set followingthe method of Stuiver and Braziunas (1993) and Reimer et al. (2002b). ∆R and its estimated uncer-tainty is then used in conjunction with the marine calibration curve in most calibration software.

1068 K A Hughen et al.
Figure 4 Global marine reservoir age “R” for the past 3000 yr. Atmospheric 14C changes quickly following productionspikes, but is muted in the ocean mixed layer. As a result, R calculated by the difference between IntCal04 and box diffusionmodel output (curve a) shows large variability (curve b). Beyond 10.5 cal kyr BP, when the Marine04 curve relies entirelyon marine 14C data sets, the global reservoir R is held constant at 405 yr (see Figure 2).
0
500
1000
1500
2000
2500
3000Marine04
IntCal04
14 C
age
(y
ears
BP
) R
250
300
350
400
450
500
0 500 1000 1500 2000 2500 3000
Marine R
14 C
age
(y
ears
BP
)
Calendar age (years BP)
a
b

Marine04 Marine 14C Age Calibration, 0–26 cal kyr BP 1069
Figu
re 5
Clo
se-u
p of
the
trans
ition
bet
wee
n tre
e-rin
g-ba
sed
and
mar
ine-
base
d se
ctio
ns o
f the
Mar
ine0
4 cu
rve.
Alth
ough
glo
bal R
(for
cal
cula
ting
mar
ine
data
∆R
>10
.5 c
alky
r BP)
is ta
ken
from
the
box
diffu
sion
mod
el o
utpu
t bet
wee
n A
D 1
300–
1800
, the
box
diff
usio
n m
odel
out
put o
f tre
e-rin
g da
ta a
lso
show
s a sm
ooth
tran
sitio
n to
the
RWM
outp
ut o
f mar
ine
data
sets
at 1
0.5
cal k
yr B
P.
9000
9200
9400
9600
9800
1000
0
1020
0
1040
0 1000
010
200
1040
010
600
1080
011
000
14CBP
calB
P
1070 K A Hughen et al.
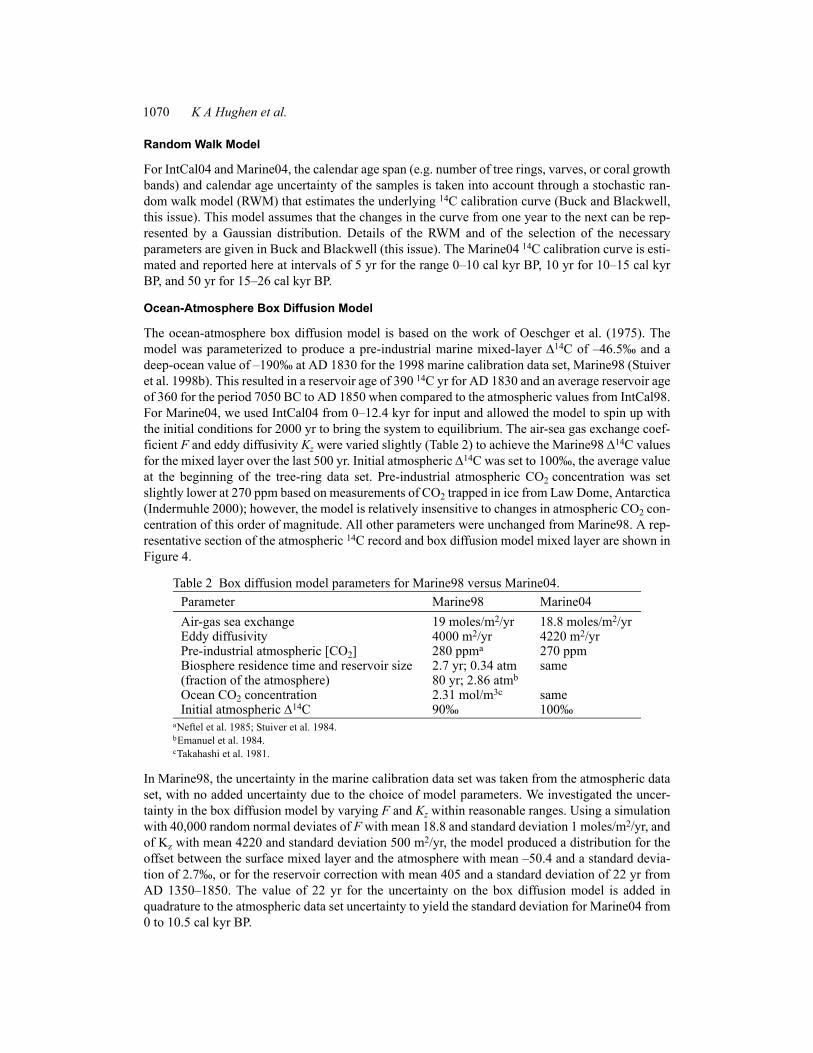
Random Walk Model
For IntCal04 and Marine04, the calendar age span (e.g. number of tree rings, varves, or coral growthbands) and calendar age uncertainty of the samples is taken into account through a stochastic ran-dom walk model (RWM) that estimates the underlying 14C calibration curve (Buck and Blackwell,this issue). This model assumes that the changes in the curve from one year to the next can be rep-resented by a Gaussian distribution. Details of the RWM and of the selection of the necessaryparameters are given in Buck and Blackwell (this issue). The Marine04 14C calibration curve is esti-mated and reported here at intervals of 5 yr for the range 0–10 cal kyr BP, 10 yr for 10–15 cal kyrBP, and 50 yr for 15–26 cal kyr BP.
Ocean-Atmosphere Box Diffusion Model
The ocean-atmosphere box diffusion model is based on the work of Oeschger et al. (1975). Themodel was parameterized to produce a pre-industrial marine mixed-layer ∆14C of –46.5‰ and adeep-ocean value of –190‰ at AD 1830 for the 1998 marine calibration data set, Marine98 (Stuiveret al. 1998b). This resulted in a reservoir age of 390 14C yr for AD 1830 and an average reservoir ageof 360 for the period 7050 BC to AD 1850 when compared to the atmospheric values from IntCal98.For Marine04, we used IntCal04 from 0–12.4 kyr for input and allowed the model to spin up withthe initial conditions for 2000 yr to bring the system to equilibrium. The air-sea gas exchange coef-ficient F and eddy diffusivity Kz were varied slightly (Table 2) to achieve the Marine98 ∆14C valuesfor the mixed layer over the last 500 yr. Initial atmospheric ∆14C was set to 100‰, the average valueat the beginning of the tree-ring data set. Pre-industrial atmospheric CO2 concentration was setslightly lower at 270 ppm based on measurements of CO2 trapped in ice from Law Dome, Antarctica(Indermuhle 2000); however, the model is relatively insensitive to changes in atmospheric CO2 con-centration of this order of magnitude. All other parameters were unchanged from Marine98. A rep-resentative section of the atmospheric 14C record and box diffusion model mixed layer are shown inFigure 4.
In Marine98, the uncertainty in the marine calibration data set was taken from the atmospheric dataset, with no added uncertainty due to the choice of model parameters. We investigated the uncer-tainty in the box diffusion model by varying F and Kz within reasonable ranges. Using a simulationwith 40,000 random normal deviates of F with mean 18.8 and standard deviation 1 moles/m2/yr, andof Kz with mean 4220 and standard deviation 500 m2/yr, the model produced a distribution for theoffset between the surface mixed layer and the atmosphere with mean –50.4 and a standard devia-tion of 2.7‰, or for the reservoir correction with mean 405 and a standard deviation of 22 yr fromAD 1350–1850. The value of 22 yr for the uncertainty on the box diffusion model is added inquadrature to the atmospheric data set uncertainty to yield the standard deviation for Marine04 from0 to 10.5 cal kyr BP.
Table 2 Box diffusion model parameters for Marine98 versus Marine04.Parameter Marine98 Marine04Air-gas sea exchange 19 moles/m2/yr 18.8 moles/m2/yrEddy diffusivity 4000 m2/yr 4220 m2/yrPre-industrial atmospheric [CO2] 280 ppma
aNeftel et al. 1985; Stuiver et al. 1984.
270 ppmBiosphere residence time and reservoir size(fraction of the atmosphere)
2.7 yr; 0.34 atm80 yr; 2.86 atmb
bEmanuel et al. 1984.
same
Ocean CO2 concentration 2.31 mol/m3c
cTakahashi et al. 1981.
sameInitial atmospheric ∆14C 90‰ 100‰
Marine04 Marine 14C Age Calibration, 0–26 cal kyr BP 1071
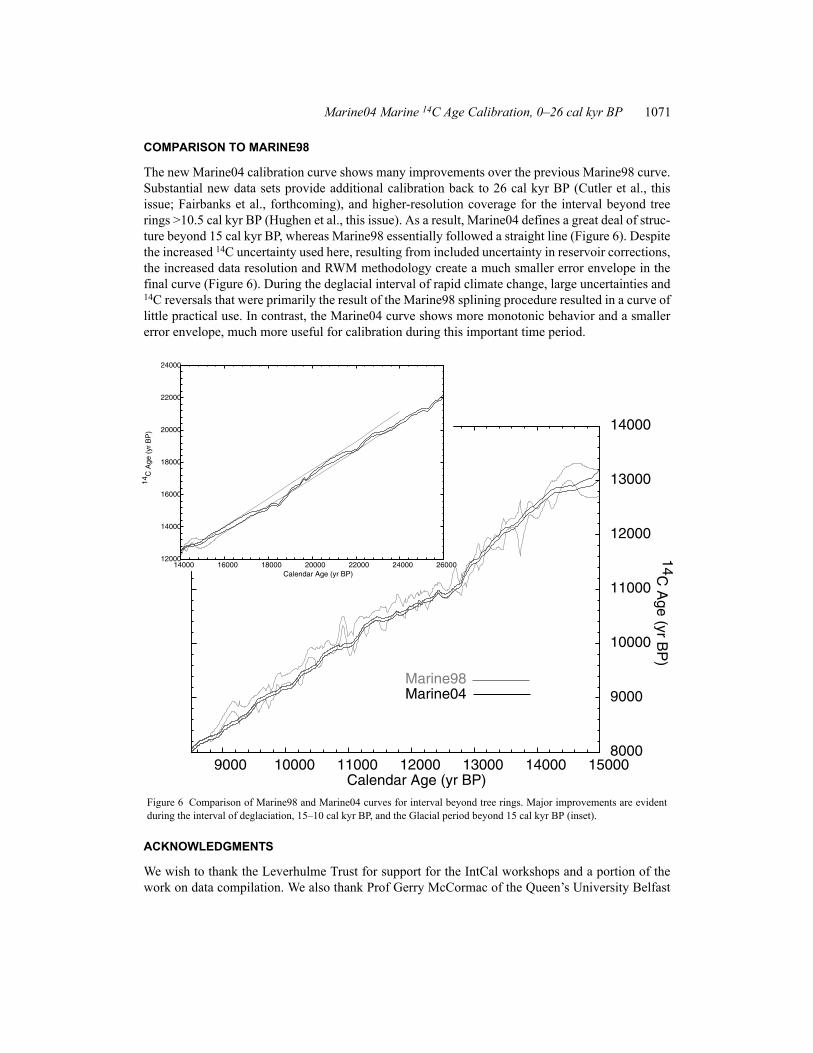
COMPARISON TO MARINE98
The new Marine04 calibration curve shows many improvements over the previous Marine98 curve.Substantial new data sets provide additional calibration back to 26 cal kyr BP (Cutler et al., thisissue; Fairbanks et al., forthcoming), and higher-resolution coverage for the interval beyond treerings >10.5 cal kyr BP (Hughen et al., this issue). As a result, Marine04 defines a great deal of struc-ture beyond 15 cal kyr BP, whereas Marine98 essentially followed a straight line (Figure 6). Despitethe increased 14C uncertainty used here, resulting from included uncertainty in reservoir corrections,the increased data resolution and RWM methodology create a much smaller error envelope in thefinal curve (Figure 6). During the deglacial interval of rapid climate change, large uncertainties and14C reversals that were primarily the result of the Marine98 splining procedure resulted in a curve oflittle practical use. In contrast, the Marine04 curve shows more monotonic behavior and a smallererror envelope, much more useful for calibration during this important time period.
ACKNOWLEDGMENTS
We wish to thank the Leverhulme Trust for support for the IntCal workshops and a portion of thework on data compilation. We also thank Prof Gerry McCormac of the Queen’s University Belfast
Figure 6 Comparison of Marine98 and Marine04 curves for interval beyond tree rings. Major improvements are evidentduring the interval of deglaciation, 15–10 cal kyr BP, and the Glacial period beyond 15 cal kyr BP (inset).
9000 10000 11000 12000 13000 14000 150008000
9000
10000
11000
12000
13000
14000
14CA
ge(yr
BP
)
Calendar Age (yr BP)
Marine98Marine04
12000
14000
16000
18000
20000
22000
24000
14000 16000 18000 20000 22000 24000 26000
14C
Age
(yr
BP
)
Calendar Age (yr BP)

1072 K A Hughen et al.
Radiocarbon Lab and Prof John Hayes of the National Ocean Sciences AMS Facility at Woods HoleOceanographic Institution for generous hospitality and support in hosting the meetings. A portion ofthis work was performed under National Science Foundation grant ATM-0407554. A portion of thiswork was performed under the auspices of the U S Department of Energy by the University of Cal-ifornia, Lawrence Livermore National Laboratory under Contract No. W-7405-Eng-48. This isWHOI contribution #11176.
Caitlin Buck acknowledges, with gratitude, the support and encouragement of her colleagues duringa period of ill health while working on this project. In addition, she wishes to thank the staff of theAccess to Work team in Sheffield and the Support Worker whom they funded, Sammy Rashid, with-out whose patience and practical and intellectual input she could not have completed her contribu-tion to this work.
REFERENCESAustin WEN, Bard E, Hunt JB, Kroon D, Peacock JD.
1995. The 14C age of the Icelandic Vedde ash—impli-cations for Younger-Dryas marine reservoir age cor-rections. Radiocarbon 37(1):53–62.
Bard E, Arnold M, Östlund HG, Maurice P, Monfray P,Duplessy J-C. 1988. Penetration of bomb radiocarbonin the tropical Indian Ocean measured by means of ac-celerator mass spectrometry. Earth and Planetary Sci-ence Letters 87:379–89.
Bard E, Hamelin B, Fairbanks RG. 1990. U-Th ages ob-tained by mass spectrometry in corals from Barbados;sea level during the past 130,000 years. Nature 346:456–8.
Bard E, Arnold M, Fairbanks RG, Hamelin B. 1993.230Th-234U and 14C ages obtained by mass spectrome-try on corals. Radiocarbon 35(1):191–9.
Bard E, Arnold M, Mangerud J, Paterne M, Labeyrie L,Duprat J, Melieres M-A, Sonstegaard E, Duplessy J-C. 1998. The North Atlantic atmosphere-sea surface14C gradient during the Younger Dryas climatic event.Earth and Planetary Science Letters 126:275–87.
Bard E, Ménot-Combes G, Rosek F. 2004. Present statusof radiocarbon calibration and comparison recordsbased on Polynesian corals and Iberian Margin sedi-ments. Radiocarbon, this issue.
Bjorck S, Bennike O, Possnert G, Wohlfarth B, Diger-feldt G. 1998. A high-resolution 14C-dated sedimentsequence from southwest Sweden: age comparisonsbetween different components of the sediment. Jour-nal of Quaternary Science 13:85–9.
Bondevik S, Birks HH, Gulliksen S, Mangerud J. 1999.Late Weichselian marine 14C reservoir ages at thewestern coast of Norway. Quaternary Research 52:104–14.
Buck CE, Blackwell PG. 2004. Formal statistical modelsfor estimating radiocarbon calibration curves. Radio-carbon, this issue.
Burr GS, Beck JW, Taylor FW, Recy J, Edwards RL, Ca-bioch G, Correge T, Donahue DJ, O’Malley JM. 1998.A high-resolution radiocarbon calibration between11,700 and 12,400 calendar years BP derived from
230Th ages of corals from Espiritu Santo Island, Van-uatu. Radiocarbon 40(3):1093–1105.
Burr GS, Galang C, Taylor FW, Gallup CD, Edwards RL,Cutler KB, Quirk B. 2004. Radiocarbon results froma 13-kyr BP coral from the Huon Peninsula, PapuaNew Guinea. Radiocarbon, this issue.
Cheng H, Edwards RL, Hoff J, Gallup CD, Richards DA,Asmerom Y. 2000. The half-lives of 234U and 230Th.Chemical Geology 169:17–33.
Cutler KB, Gray SC, Burr GS, Edwards RL, Taylor FW,Cabioch G, Beck JW, Récy J, Cheng H, Moore J. 2004.Radiocarbon calibration to 50 kyr BP with paired 14Cand 230Th dating of corals from Vanuatu and PapuaNew Guinea. Radiocarbon, this issue.
Donahue DJ, Linick TW, Jull AJT. 1990. Isotope-ratioand background corrections for accelerator mass spec-trometry radiocarbon measurements. Radiocarbon32(2):135–42.
Edwards RL, Beck JW, Burr GS, Donahue DJ, ChappellJMA, Bloom AL, Druffel ERM, Taylor FW. 1993. Alarge drop in atmospheric 14C/12C and reduced meltingin the Younger Dryas, documented with 230Th ages ofcorals. Science 260:962–8.
Eiriksson J, Knudsen KL, Haflidason H, Heinemeier J.2000. Chronology of late Holocene climatic events inthe northern North Atlantic based on AMS 14C datesand tephra markers from the volcano Hekla, Iceland.Journal of Quaternary Science 15:573–80.
Emanuel WR, Killough GG, Post WM, Shugart HH,Stevenson MP. 1984. Computer implementation of aglobally averaged model of the world carbon cycle.Washington, DC: U S Dept of Energy, Carbon DioxideResearch Division Report. DOE/NBB-0062. 79 p.
Fairbanks RG, Mortlock RA, Chiu T-C, Guilderson TP,Cao L, Kaplan A, Bloom A. Forthcoming. Marine ra-diocarbon calibration curve spanning 7000 to 50,000years BP based on paired 230Th/234U/238U and 14Cdates on pristine corals. Quaternary Science Reviews.
Friedrich M, Remmele S, Kromer B, Hofmann J, SpurkM, Kaiser KF, Orcel C, Küppers M. 2004. The 12,460-year Hohenheim oak and pine tree-ring chronology

Marine04 Marine 14C Age Calibration, 0–26 cal kyr BP 1073
from central Europe—a unique annual record for ra-diocarbon calibration and paleoenvironment recon-structions. Radiocarbon, this issue.
Guilderson TP, Southon JR, Brown TA. 2003. High-pre-cision AMS 14C results on TIRI/FIRI turbidite. Radio-carbon 45(1):75–80.
Guilderson TP, Cole JE, Southon JR. Forthcoming. Pre-bomb ∆14C variability and the Suess effect in CariacoBasin surface waters as recorded in hermatypic corals.Radiocarbon 47(1).
Hughen KA, Overpeck JT, Lehman SJ, Kashgarian M,Southon J, Peterson LC, Alley R, Sigman DM. 1998.Deglacial changes in ocean circulation from an ex-tended radiocarbon calibration. Nature 391:65–8.
Hughen KA, Southon JR, Lehman SJ, Overpeck JT.2000. Synchronous radiocarbon and climate shiftsduring the last deglaciation. Science 290:1951–4.
Hughen KA, Overpeck JT, Peterson LC, Trumbore S.1996. Rapid climate changes in the tropical Atlanticregion during the last deglaciation. Nature 380:51–4.
Indermuhle A, Monnin E, Stauffer B, Stocker TF,Wahlen M. 2000. Atmospheric CO2 concentrationfrom 60 to 20 kyr BP from the Taylor Dome ice core,Antarctica. Geophysical Research Letters 27:735–8.
Jones M, Nicholls G. 2002. New radiocarbon calibrationprogram. Radiocarbon 44(3):663–74.
Kromer B, Friedrich M, Hughen KA, Kaiser F, RemmeleS, Schaub M, Talamo S. 2004. Late Glacial 14C agesfrom a floating, 1270-ring pine chronology. Radiocar-bon, this volume.
Neftel A, Moor E, Oeschger H, Stauffer B. 1985. Evidencefrom polar ice cores for the increase in atmosphericCO2 in the past two centuries. Nature 315:45–7.
Oeschger H, Siegenthaler U, Schotterer U, GugelmannA. 1975. A box diffusion model to study the carbon di-oxide exchange in nature. Tellus 27:168–92.
Paterne M, Ayliffe LK, Arnold M, Cabioch G, Tisnérat-Laborde N, Hatté C, Donville E, Bard E. 2004. Paired14C and 230Th/U dating of surface corals from the Mar-quesas and Vanuatu (sub-equatorial Pacific) in the3000 to 15,000 cal yr interval. Radiocarbon 46(2):551–66.
Reimer PJ, Hughen KA, Guilderson TP, McCormac G,Baillie MGL, Bard E, Barratt P, Beck JW, Buck CE,Damon PE, Friedrich M, Kromer B, Bronk Ramsey C,Reimer RW, Remmele S, Southon JR, Stuiver M, vander Plicht J. 2002. Preliminary report of the first work-shop of the IntCal04 Radiocarbon Calibration/Com-parison Working Group. Radiocarbon 44(3):653–61.
Reimer PJ, McCormac FG, Moore J, McCormack F,Murray EV. 2002b. Marine reservoir corrections forthe subpolar North Atlantic for the last 5700 years.Holocene 12(2):129–35.
Reimer PJ, Baillie MGL, Bard E, Bayliss A, Beck JW,Bertrand CJH, Blackwell PG, Buck CE, Burr GS, Cut-ler KB, Damon PE, Edwards RL, Fairbanks RG,
Friedrich M, Guilderson TP, Hogg AG, Hughen KA,Kromer B, McCormac G, Manning S, Bronk RamseyC, Reimer RW, Remmele S, Southon JR, Stuiver M,Talamo S, Taylor FW, van der Plicht J, WeyhenmeyerCE. 2004. IntCal04 atmospheric radiocarbon age cal-ibration, 26–0 cal kyr BP. Radiocarbon, this issue.
Robinson LF, Henderson GM, Hall L, Matthews I, Ad-kins JF. 2004. Climatic control of riverine and seawa-ter uranium-isotope ratios. Science 305 (5685):851–4.
Siani G, Paterne M, Michel E, Sulpizio R, Sbrana A, Ar-nold M, Haddad G. 2001. Mediterranean Sea surfaceradiocarbon reservoir age changes since the last gla-cial maximum. Science 294:1917–20.
Sikes EL, Samson CR, Guilderson TP, Howard WR.2000. Old radiocarbon ages in the southwest PacificOcean during the last glacial period and deglaciation.Nature 405:555–9.
Southon JR, Rodman AO, True D. 1995. A comparisonof marine and terrestrial radiocarbon ages from north-ern Chile. Radiocarbon 37(2):389–93.
Southon J, Kashgarian M, Fontugne M, Metivier B, YimWWS. 2002. Marine reservoir corrections for the In-dian Ocean and southeast Asia. Radiocarbon 44(1):167–80.
Stuiver M, Braziunas TF. 1993. Modeling atmospheric14C influences and 14C ages of marine samples to10,000 BC. Radiocarbon 35(1):137–89.
Stuiver M, Burk RL, Quay PD. 1984. 13C/12C ratios intree rings and the transfer of biospheric carbon to theatmosphere. Journal of Geophysical Research D89:11,731–48.
Stuiver M, Pearson GW, Braziunas TF. 1986. Radiocar-bon age calibration of marine samples back to 9000cal yr BP. Radiocarbon 28(2B):980–1021.
Stuiver M, Reimer PJ, Bard E, Beck JW, Burr GS,Hughen KA, Kromer B, McCormac G, van der PlichtJ, Spurk M. 1998a. IntCal98 radiocarbon age calibra-tion. Radiocarbon 40(3):1041–83.
Stuiver M, Reimer PJ, Braziunas TF. 1998. High-preci-sion radiocarbon age calibration for terrestrial and ma-rine samples. Radiocarbon 40(3):1127–51.
Takahashi T, Broecker WS, Bainbridge AE. 1981. Thealkalinity and total carbon dioxide concentration inthe world oceans. In: Bolin B, editor. Carbon cyclemodelling. SCOPE 16:271–86.
van der Plicht J, Beck JW, Bard E, Baillie MGL,Blackwell PG, Buck CE, Friedrich M, Guilderson TP,Hughen KA, Kromer B, McCormac FG, BronkRamsey C, Reimer PJ, Reimer RW, Remmele S,Richards DA, Southon JR, Stuiver M, WeyhenmeyerCE. 2004. NotCal04—Comparison/Calibration 14Crecords 26–50 cal kyr BP. Radiocarbon, this issue.
Waelbroeck C, Duplessy JC, Michel E, Labeyrie L, Pail-lard D, Duprat J. 2001. The timing of the last deglaci-ation in North Atlantic climate records. Nature 412:724–5.
1074 K A Hughen et al.
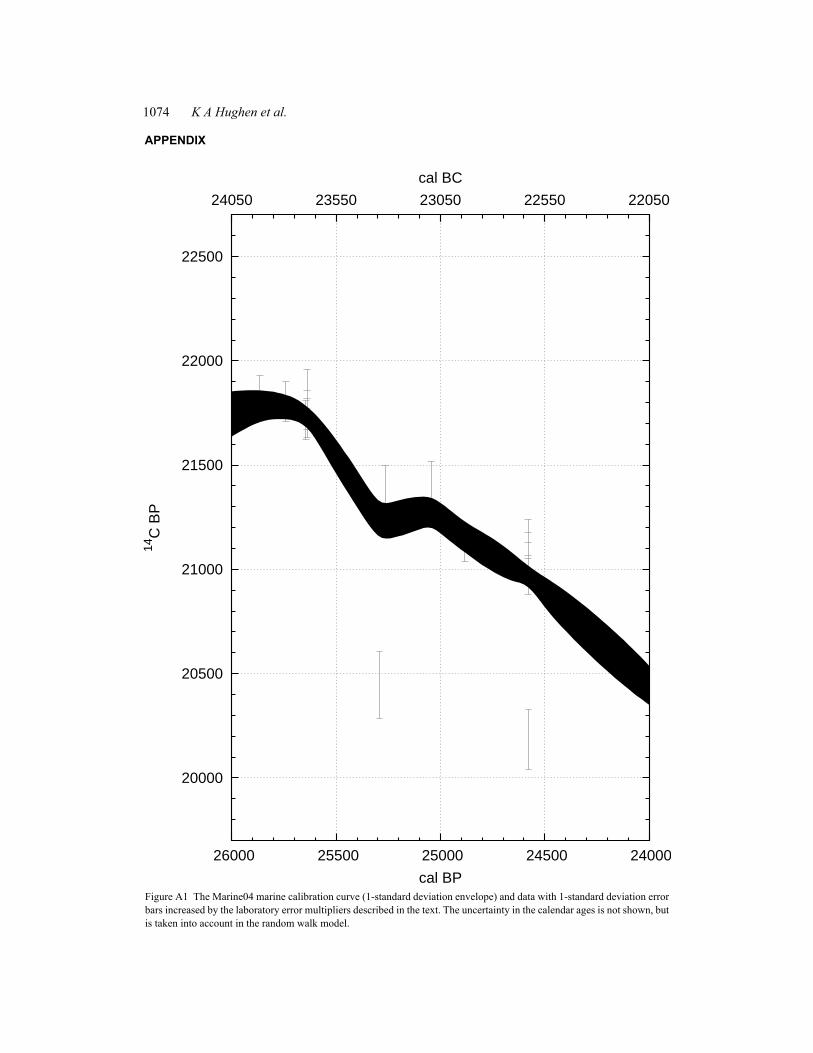
Figure A1 The Marine04 marine calibration curve (1-standard deviation envelope) and data with 1-standard deviation errorbars increased by the laboratory error multipliers described in the text. The uncertainty in the calendar ages is not shown, butis taken into account in the random walk model.
20000
20500
21000
21500
22000
22500
24000 24500 25000 25500 26000
2205022550230502355024050
14C
BP
cal BP
cal BC
APPENDIX

Marine04 Marine 14C Age Calibration, 0–26 cal kyr BP 1075
Figure A2 The Marine04 marine calibration curve (1-standard deviation envelope) and data with 1-standard deviation errorbars increased by the laboratory error multipliers described in the text. The uncertainty in the calendar ages is not shown,but is taken into account in the random walk model.
18500
19000
19500
20000
20500
21000
22000 22500 23000 23500 24000
2005020550210502155022050
14C
BP
cal BP
cal BC

1076 K A Hughen et al.
Figure A3 The Marine04 marine calibration curve (1-standard deviation envelope) and data with 1-standard deviation errorbars increased by the laboratory error multipliers described in the text. The uncertainty in the calendar ages is not shown, butis taken into account in the random walk model.
16500
17000
17500
18000
18500
19000
19500
20000 20500 21000 21500 22000
1805018550190501955020050
14C
BP
cal BP
cal BC

Marine04 Marine 14C Age Calibration, 0–26 cal kyr BP 1077
Figure A4 The Marine04 marine calibration curve (1-standard deviation envelope) and data with 1-standard deviation errorbars increased by the laboratory error multipliers described in the text. The uncertainty in the calendar ages is not shown, butis taken into account in the random walk model.
15000
15500
16000
16500
17000
17500
18000 18500 19000 19500 20000
1605016550170501755018050
14C
BP
cal BP
cal BC

1078 K A Hughen et al.
Figure A5 The Marine04 marine calibration curve (1-standard deviation envelope) and data with 1-standard deviation errorbars increased by the laboratory error multipliers described in the text. The uncertainty in the calendar ages is not shown,but is taken into account in the random walk model.
13500
14000
14500
15000
15500
16000
16000 16500 17000 17500 18000
1405014550150501555016050
14C
BP
cal BP
cal BC
Marine04 Marine 14C Age Calibration, 0–26 cal kyr BP 1079
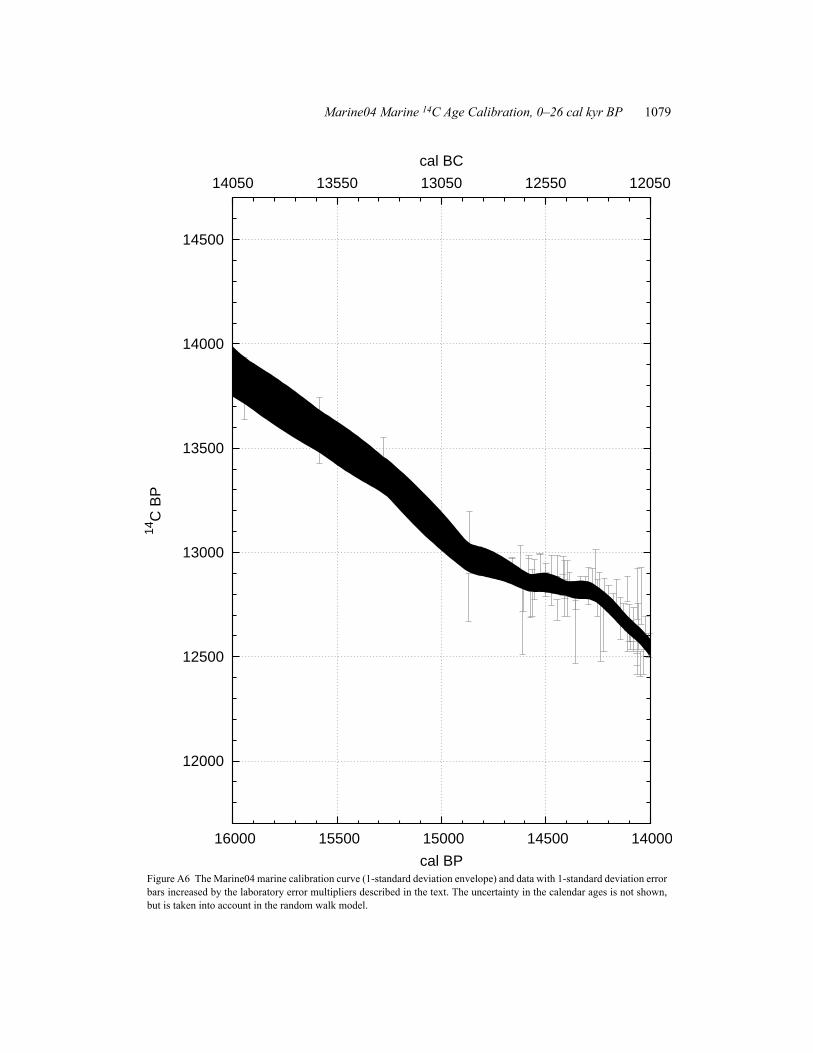
Figure A6 The Marine04 marine calibration curve (1-standard deviation envelope) and data with 1-standard deviation errorbars increased by the laboratory error multipliers described in the text. The uncertainty in the calendar ages is not shown,but is taken into account in the random walk model.
12000
12500
13000
13500
14000
14500
14000 14500 15000 15500 16000
1205012550130501355014050
14C
BP
cal BP
cal BC

1080 K A Hughen et al.
Figure A7 The Marine04 marine calibration curve (1-standard deviation envelope) and data with 1-standard deviation errorbars increased by the laboratory error multipliers described in the text. The uncertainty in the calendar ages is not shown,but is taken into account in the random walk model.
10500
11000
11500
12000
12500
13000
12000 12500 13000 13500 14000
1005010550110501155012050
14C
BP
cal BP
cal BC

Marine04 Marine 14C Age Calibration, 0–26 cal kyr BP 1081
Figure A8 The Marine04 marine calibration curve (1-standard deviation envelope) and data with 1-standard deviation errorbars increased by the laboratory error multipliers described in the text. The uncertainty in the calendar ages is not shown,but is taken into account in the random walk model.
8500
9000
9500
10000
10500
11000
11500
10000 10500 11000 11500 12000
8050 8550 9050 955010050
14C
BP
cal BP
cal BC

1082 K A Hughen et al.
Figure A9 The Marine04 marine calibration curve (1-standard deviation envelope) and data with 1-standard deviation errorbars increased by the laboratory error multipliers described in the text. The uncertainty in the calendar ages is not shown,but is taken into account in the random walk model.
6500
7000
7500
8000
8500
9000
9500
8000 8500 9000 9500 10000
60506550705075508050
14C
BP
cal BP
cal BC

Marine04 Marine 14C Age Calibration, 0–26 cal kyr BP 1083
Figure A10 The Marine04 marine calibration curve (1-standard deviation envelope) and data with 1-standard deviationerror bars increased by the laboratory error multipliers described in the text. The uncertainty in the calendar ages is notshown, but is taken into account in the random walk model.
5000
5500
6000
6500
7000
7500
8000
6000 6500 7000 7500 8000
40504550505055506050
14C
BP
cal BP
cal BC

1084 K A Hughen et al.
Figure A11 The Marine04 marine calibration curve (1-standard deviation envelope) and data with 1-standard deviation errorbars increased by the laboratory error multipliers described in the text. The uncertainty in the calendar ages is not shown,but is taken into account in the random walk model.
3000
3500
4000
4500
5000
5500
6000
4000 4500 5000 5500 6000
20502550305035504050
14C
BP
cal BP
cal BC

Marine04 Marine 14C Age Calibration, 0–26 cal kyr BP 1085
Figure A12 The Marine04 marine calibration curve (1-standard deviation envelope) and data with 1-standard deviationerror bars increased by the laboratory error multipliers described in the text. The uncertainty in the calendar ages is notshown, but is taken into account in the random walk model.
1500
2000
2500
3000
3500
4000
4500
2000 2500 3000 3500 4000
50 550105015502050
14C
BP
cal BP
cal BC
1086 K A Hughen et al.
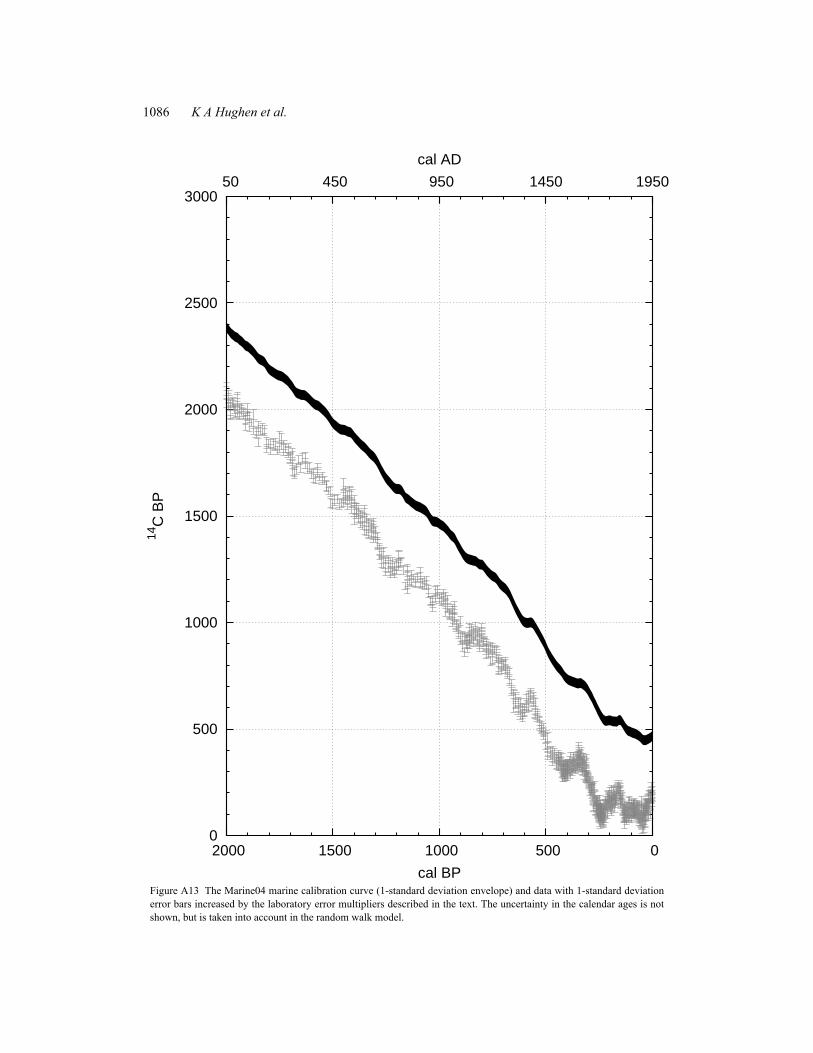
Figure A13 The Marine04 marine calibration curve (1-standard deviation envelope) and data with 1-standard deviationerror bars increased by the laboratory error multipliers described in the text. The uncertainty in the calendar ages is notshown, but is taken into account in the random walk model.
0
500
1000
1500
2000
2500
3000
0 500 1000 1500 2000
19501450 950 450 50
14C
BP
cal BP
cal AD
![F RADIOCARBON, UNIVERSITY OF TEXAS RADIOCARBON DATES II · F RADIOCARBON, Vor,. 6, 1964, P. 138-159] UNIVERSITY OF TEXAS RADIOCARBON DATES II M. A. TAMERS, F. J. PEARSON, JR., and](https://img.dokumen.tips/doc/110x75/606d59c493119417f12a3a02/f-radiocarbon-university-of-texas-radiocarbon-dates-ii-f-radiocarbon-vor-6.jpg)