Embed Size (px)
Citation preview

1
SUPPLEMENTARY INFORMATION
Supplementary Figures
Supplementary Figure S1 | Late Permian paleogeography. (a) Late Permian (~260 Ma) global
paleogeography showing the location of South China (base map is from Ron Blakey,
http://jan.ucc.nau.edu/~rcb7). (b) Late Permian paleogeographic configuration of South China
showing the location of the Meishan and Shangsi sections (red stars) (base map after ref. 12).

2
Supplementary Figure S2 | Geochronology, magnetostratigraphy, lithostratigraphy,
chemostratigraphy, cyclostratigraphy and conodont biostratigraphy of the upper Longtan,
Changxing, and lower Yinkeng formations at the Meishan section. Bed numbers are after refs.
13 and 14. Magnetostratigraphy is after ref. 33. Conodont biozones are from refs. 12-14 and 31.
Carbon isotope data and U-Pb ages are from ref. 12. The letter ‘E’ and ‘e’ represent interpreted
405-kyr and 100-kyr eccentricity cycles in the MS series.

3
Supplementary Figure S3 | Geochronology, lithostratigraphy, chemostratigraphy,
cyclostratigraphy and conodont biostratigraphy of the upper Changxing and lower Yinkeng
formations at the Meishan section. Bed numbers are after ref. 13. Conodont biozones are from
refs. 12, 13 and 31. Carbon isotope data and U-Pb ages are from ref. 12. The letter ‘e’ represents
interpreted 100-kyr eccentricity cycles in the MS series. Blue shaded area indicates mass extinction
interval (MEI).

4
0 2 4 6ARM (10-6 Am2/kg)
90
85
80
75
70
65
60
55
50
45
40
35
30
25
20
15
10
5
0
254.31 0.07
253.60 0.08
253.10 0.12
252.37 0.08
252.16 0.09252.28 0.13
252.68 0.12
254.79 0.14
-4 -2 0 2 4δ13C (‰)carb
C
. yin
i
H. e
uryp
yge
?
29
28
22
24
21
20
19
18
17
16
15
14
13
12
11
10
9
7
5
6
sisi
sic
sicsic
sic
sic
sisisi
si
sisisi
sic
sicsic
sic
sicsic
sic
sisisi
si
sisi
sic
c
c cc
cc
c
c
c
c
c
c
c
c
c
c cc
c csisi
sisisi
sisisi
sisisi
sisisi
sisisi
sisisi
sisisi
si
90
85
80
75
70
65
60
55
50
45
40
35
30
25
20
15
10
5
0)
m( htp
eD
)m( ht
pe
D
E 0E1
E2
E3
E4
E5
E6E7E8
E9E10
E11E12
E13
E14
E15
E16
E17
E18
E19
U-Pb ages(Ma)
Conodontbiostratigraphy
Lith
olo
gy.on deB
-oteng
aM st
ratig
raph
y
For
mat
ions
egatS
si si
c c
Legends
Limestone
Cherty nodular bearing limestone
Siliceous limestone
Carbon-bearing limestone
mudstone/clay stone
Shale
E -1naud
nI
naug
naixie
Fnoita
mroF gn
olaD
noitamro
F gnipaiju
W
naignipaihcu
Wnaignishgnah
C
259.5 0.9
+_+_+_+_+_
+_
+_
+_
+_
C. m
eish
anen
sis
C. c
hang
ensi
s
C. s
ubca
rina
ta
C. w
angi
C. o
rien
tali
sC
. tra
nsca
ucas
ica
Supplementary Figure S4 | Geochronology, magnetostratigraphy, lithostratigraphy,
chemostratigraphy, cyclostratigraphy and conodont biostratigraphy of the Wujiaping,
Dalong, and lower Feixianguan formations at the Shangsi section. Bed numbers are after ref. 25.
Magnetostratigraphy is after ref. 36. Conodont biozones and carbon isotope are from ref. 12. U-Pb
ages are from refs. 12, except the age of 259.5 ± 0.9 Ma in the lower part from ref. 18. The letter ‘E’
represents 405-kyr eccentricity cycles in the ARM series.

5
Supplementary Figure S5 | Geochronology, magnetostratigraphy, lithostratigraphy,
chemostratigraphy, cyclostratigraphy and conodont biostratigraphy of upper Dalong and
lower Feixianguan formations at the Shangsi section. Bed numbers are after ref. 25.
Magnetostratigraphy is after ref. 36. Conodont biozones and carbon isotope are from ref. 12. U-Pb
ages are from refs. 12. The letters ‘E’ and ‘e’ represent 405-kyr and 100-kyr eccentricity cycles in
the ARM series. Blue shaded area indicates mass extinction interval (MEI).

6
Supplementary Figure S6 | Tuning the Meishan MS stratigraphic series. (a) MS series in
stratigraphic depth at the Meishan section. Also shown are the bed boundaries (refs. 13 and 14),
conodont biozones (ref. 12), and U-Pb ages and durations (ref. 12). Uncertainties of the durations
are calculated by error propagation. The interpretation of 405-kyr eccentricity (E) and ~100-kyr
eccentricity (e) cycles was based on the spectral analysis in Fig. 3, Supplementary Figs. S8 and S9.
(b) The integrated stratigraphy and cycle analysis in the time framework constrained by five U-Pb
ages (ref. 12). The 405-kyr (red) and 100-kyr (blue) cycles were extracted with Gauss filters with
passbands of 0.002469 ± 0.00025 cycles/kyr and 0.01 ± 0.002 cycles/kyr, respectively. (c) 405-kyr
tuned MS series with 405-kyr (red), 100-kyr (blue) and 20-kyr (purple) filter outputs, with
passbands of 0.002469 ± 0.00025 cycles/kyr, 0.01 ± 0.0035 cycles/kyr and 0.05 ± 0.025 cycles/kyr,
respectively. The astronomically tuned ages (red) are shown with the U-Pb ages for comparison. (d)
adjusted 405-kyr tuned MS time series matching the Shangsi chronology at PTB (see main text).
Fm.=Formation, IN=Induan, WP=Wuchiapingian, YK=Yinkeng, LT=Longtan.

7
Supplementary Figure S7 | Tuning the Shangsi ARM stratigraphic series. (a) ARM series in
depth at the Shangsi section. The interpreted 405-kyr cycles (red) were extracted with Gauss filters
with passbands of 0.22 ± 0.08 cycles/m (1-14 m), 0.6 ± 0.3 cycles/m (14-26 m), 0.4 ± 0.12 cycles/m
(26-33 m) and 0.06 ± 0.02 cycles/m (33-93.6 m). The 100-kyr cycles (blue) band-pass filters are 0.8
± 0.2 cycles/m (1-14 m), 2.3 ± 0.7 cycles/m (14-26 m), 1.7 ± 0.34 cycles/m (26-33 m) and 0.26 ±
0.08 cycles/m (33-93.6 m). The U-Pb ages are from ref. 12 except the age of 259.5 ± 0.9 Ma in the
lower part from ref. 18. The duration uncertainties are calculated by error propagation. Bed numbers
are after ref. 25 and conodont biozones are after ref. 12. (b) U-Pb ages calibrated ARM series with
405-kyr (red) and 100-kyr (blue) signals extracted with Gauss filters with passbands of 0.002469 ±
0.00015 cycles/kyr and 0.01 ± 0.0015 cycles/kyr. (c) 405-kyr tuned ARM series with 405-kyr (red)
and 100-kyr (blue) filter outputs extracted using Gauss filters with passbands of 0.002469 ± 0.00075
cycles/kyr and 001 ± 0.0025 cycles/kyr. Fm.=Formation.
8
Supplementary Figure S8 | Meishan MS stratigraphic series spectrum. (a) 2 MTM power
spectrum, with significant peaks labeled in cm. The purple, red, green and blue (dashed) curves
represent the median smoothed, linear fitted red noise spectrum, and 90%, 95% and 99% confidence
levels. (b) Evolutionary FFT spectrum, with a 6 m sliding window. The red and blue colors
represent high and low power, normalized to 1. The dashed white lines labeled with E, e, O and P
representing the 405-kyr eccentricity, 100-kyr eccentricity, obliquity and precession cycles,
respectively.

9
Supplementary Figure S9 | Meishan time series and La2004 spectra. (a) 2 MTM power
spectrum for standardized, stacked La2004 eccentricity, obliquity and precession (“ETP”) of
240-249 Ma. (b) 2 MTM power spectrum of the Meishan MS U-Pb age-calibrated time series. (c)
Evolutionary spectrum for the U-Pb age-calibrated MS time series of the Meishan section, using a
500-kyr sliding window. Significant peaks are labeled in kyr. Legends as in Figure S8.

10
Supplementary Figure S10 | The Shangsi ARM stratigraphic series spectrum. (a) 3 MTM
power spectrum, with significant peaks labeled in cm. The purple, red, green and blue (dashed)
curves represent the median smoothed, linear fitted red noise spectrum, and 90%, 95% and 99%
confidence levels. (b) Evolutionary FFT spectrum, with a 6 m sliding window. The dashed white
line labeled with E, e, O and P represent the 405-kyr long eccentricity, 100-kyr short eccentricity,
obliquity and precession cycles, respectively. (c) Spectrum as in (a), but over a wider frequency
range. (d-g) 3 MTM power spectra of the ARM stratigraphic series subsets of 1-14 m, 14-26 m,
26-33 m and 33-93.6 m, respectively. Significant peaks are labeled in centimeters.
11
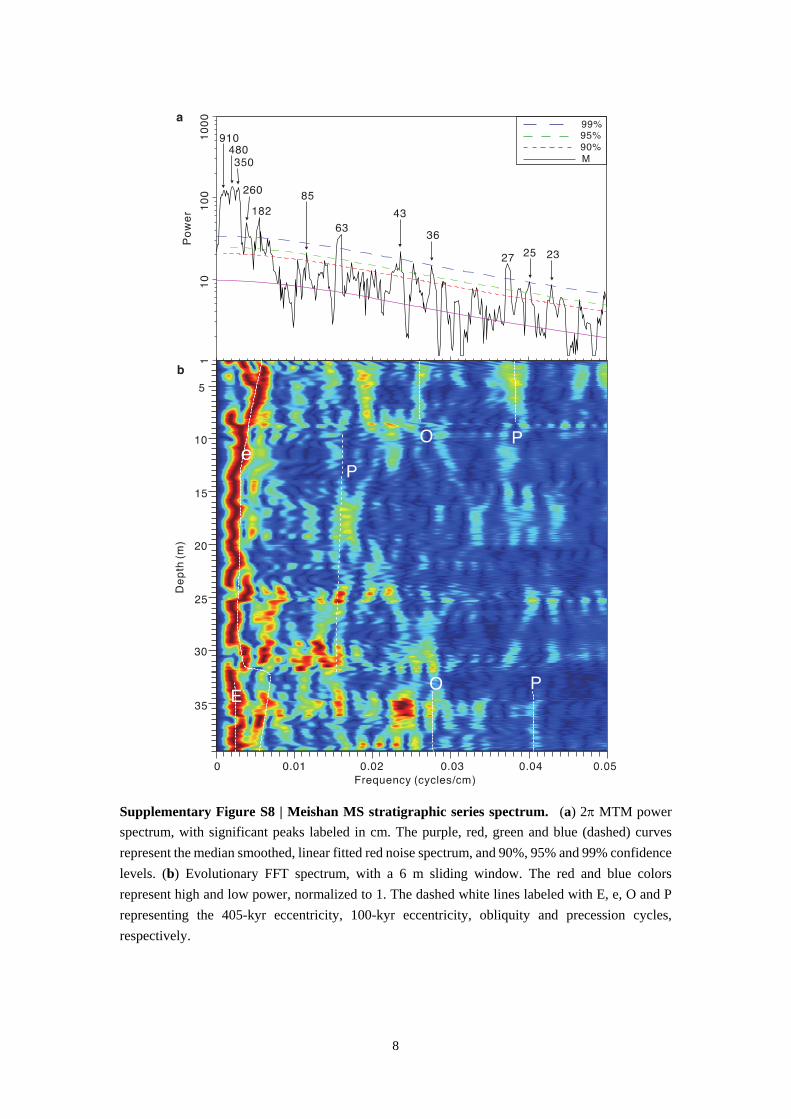
Supplementary Figure S11 | Outcropping section at Shangsi, China. (a) Photo of the upper
part (Beds 19-28) of the Changhsingian Dalong Formation. Five thin precession-scale beds are
bundled into 100-kyr eccentricity cycles (e), and four 100-kyr cycles are bundled into 405-kyr
eccentricity cycles (E). The ARM cycle interpretation is provided in Fig. 2, Supplementary Figs. S4,
S5 and S7. Eccentricity maxima are recorded by pronounced precession beds while the eccentricity
minima correlate to thick limestone beds (see main text). (b) Photo of upper Bed 16 to lower Bed 19.
(c) Photo of Beds 14 to 17 in the Dalong Formation. Beds 16 to 18 are composed of limestone and
black shales or mudstone, and record lower sedimentation rates compared to Beds 19 to 22. Circled
numbers indicate the bed numbers and red lines mark the bed boundaries.

12
Supplementary Figure S12 | The U-Pb age-calibrated Shangsi ARM time series spectrum. (a)
3 MTM power spectrum. (b) Evolutionary FFT spectrum, using a 500-kyr sliding window.
Significant peaks are labeled in kiloyears. Legends are as in Figure S8.

13
Supplementary Figure S13 | The 405-kyr tuned Meishan MS time series spectrum. (a) 2
MTM power spectrum. (b) evolutionary FFT spectrum, using a 500-kyr sliding window. Significant
peaks are labeled in kiloyears.

14
Supplementary Figure S14 | The 405-kyr-tuned Shangsi ARM time series spectrum. (a) 3
MTM power spectrum. (b) Evolutionary FFT spectrum, using a 500-kyr sliding window.
Significant peaks are labeled in kiloyears. Legends are as in Figure S8. (c) Wavelet scalogram of the
405-kyr-tuned ARM time series. The shaded contours in wavelet scalogram are normalized linear
variances, with blue representing low spectral power and red representing high spectral power.
Regions below curves on both ends indicate the cone of influence where edge effects become
significant.
15
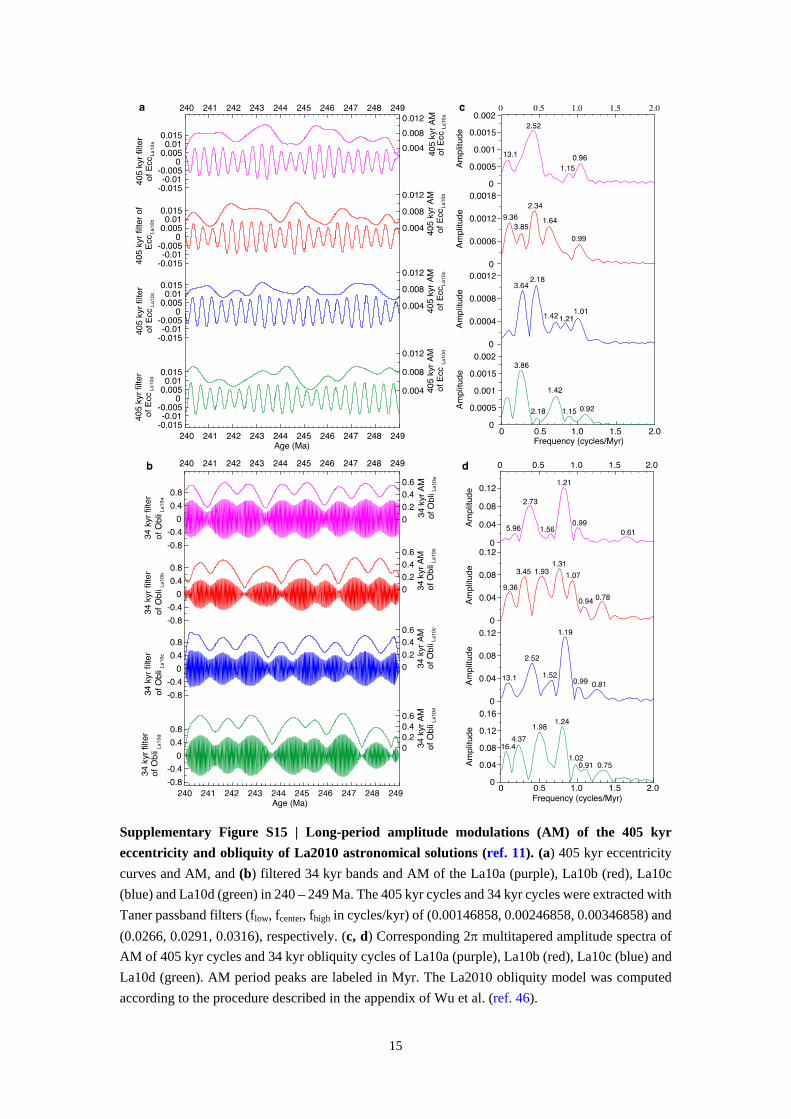
Supplementary Figure S15 | Long-period amplitude modulations (AM) of the 405 kyr
eccentricity and obliquity of La2010 astronomical solutions (ref. 11). (a) 405 kyr eccentricity
curves and AM, and (b) filtered 34 kyr bands and AM of the La10a (purple), La10b (red), La10c
(blue) and La10d (green) in 240 – 249 Ma. The 405 kyr cycles and 34 kyr cycles were extracted with
Taner passband filters (flow, fcenter, fhigh in cycles/kyr) of (0.00146858, 0.00246858, 0.00346858) and
(0.0266, 0.0291, 0.0316), respectively. (c, d) Corresponding 2 multitapered amplitude spectra of
AM of 405 kyr cycles and 34 kyr obliquity cycles of La10a (purple), La10b (red), La10c (blue) and
La10d (green). AM period peaks are labeled in Myr. The La2010 obliquity model was computed
according to the procedure described in the appendix of Wu et al. (ref. 46).
16
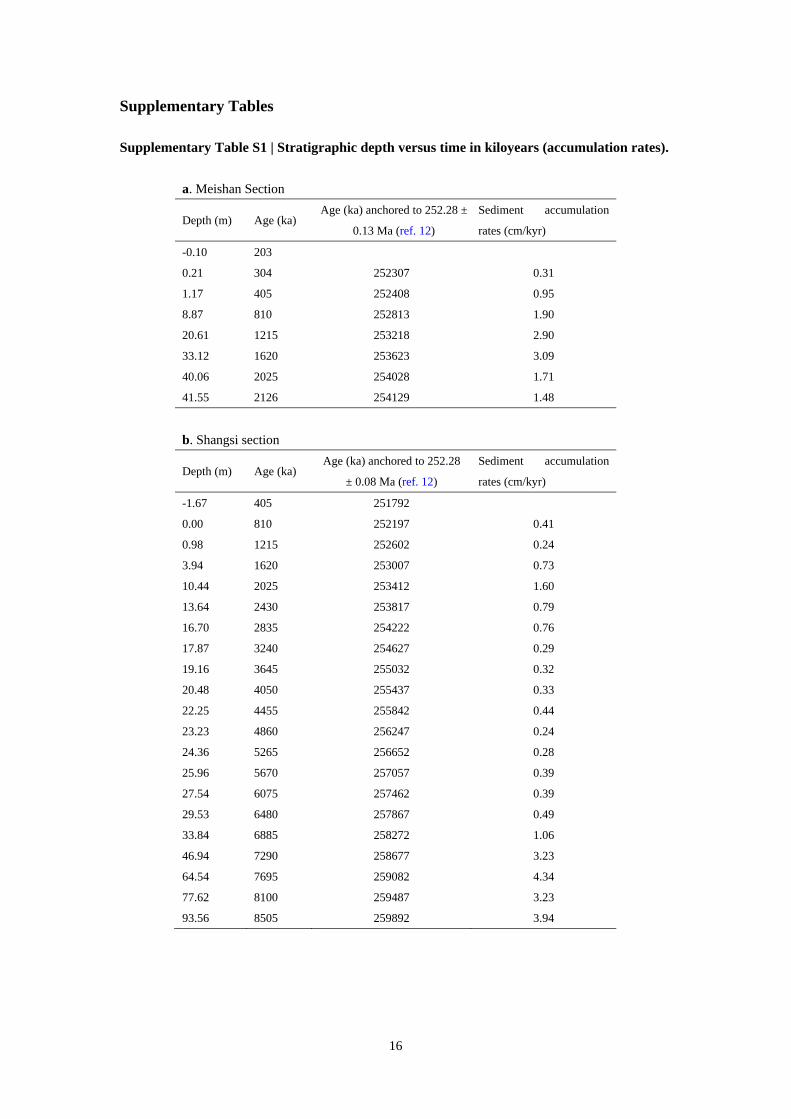
Supplementary Tables Supplementary Table S1 | Stratigraphic depth versus time in kiloyears (accumulation rates).
a. Meishan Section
Depth (m) Age (ka) Age (ka) anchored to 252.28 ±
0.13 Ma (ref. 12)
Sediment accumulation
rates (cm/kyr)
-0.10 203
0.21 304 252307 0.31
1.17 405 252408 0.95
8.87 810 252813 1.90
20.61 1215 253218 2.90
33.12 1620 253623 3.09
40.06 2025 254028 1.71
41.55 2126 254129 1.48
b. Shangsi section
Depth (m) Age (ka) Age (ka) anchored to 252.28
± 0.08 Ma (ref. 12)
Sediment accumulation
rates (cm/kyr)
-1.67 405 251792
0.00 810 252197 0.41
0.98 1215 252602 0.24
3.94 1620 253007 0.73
10.44 2025 253412 1.60
13.64 2430 253817 0.79
16.70 2835 254222 0.76
17.87 3240 254627 0.29
19.16 3645 255032 0.32
20.48 4050 255437 0.33
22.25 4455 255842 0.44
23.23 4860 256247 0.24
24.36 5265 256652 0.28
25.96 5670 257057 0.39
27.54 6075 257462 0.39
29.53 6480 257867 0.49
33.84 6885 258272 1.06
46.94 7290 258677 3.23
64.54 7695 259082 4.34
77.62 8100 259487 3.23
93.56 8505 259892 3.94

17
Supplementary Table S2 | Ages and durations constrained of geological and biological events
according to U-Pb ages and the 405-kyr-tuned ATS.
(a) Meishan section. The adjusted 405 kyr-tuned ages were obtained by shifting 134 kyr forward to
match the astronomical chronology at Shangsi.
Lower age (ka) Duration (kyr)
Stage Formation Conodont zones
Lower
depth
(m)
U-Pb
age
(ref.12)
405-kyr
-tuned
age
Adjusted
405-kyr
-tuned age
U-Pb age
(ref. 12)
405-kyr
tuned age
I. isarcica -0.06 252130 252215 252081
I. staeschei -0.03 252150 252224 252090 20 9
Induan H. parvus 0.00 252172 252234 252100 22 10
Yingkeng 0.16 252287 252283 252149 - -
Chang-h
singian 41.16 253911 254104 253970 1739 1870
Changxing 41.95 253979 254158 254024 1692 1875
C. meishanensis 0.16 252287 252283 252149 115 49
C. yini 3.10 252412 252511 252377 125 228
C. changxingensis 25.00 253106 253361 253227 694 850
C. subcarinata 34.05 253396 253679 253545 290 318
C. wangi 41.16 253911 254104 253970 515 425
Wuchia
-pingian C. orientalis -
Longtan -
(b) Shangsi Section
Stage Formation Conodont zones
Lower age (ka) Duration (kyr)
Lower
depth (m)
U-Pb
age
(ref.12)
405-kyr-
tuned age
U-Pb age
(ref. 12)
405-kyr-
tuned
age
Induan H. eurypyge -0.4 252178 252100
Feixianguan 0 252246 252197
Changhsingian 15.9 254113 254115 1935 2015
Dalong 42.02 258296 258523 6050 6326
C. meishanensis 0.1 252264 252239 86 139
C. yini 2.7 253060 252837 796 598
C. changxingensis 9.05 253410 253325 350 488
C. subcarinata 10.6 253488 253431 78 106
C. wangi 15.9 254113 254115 625 684
Wuchiapingian -
C. orientalis 22.2 256016 255828 1903 1713
C. transcaucasica - - -
Wujiaping -