Embed Size (px)
Citation preview

0
10
20
30
40
50
60
70
80
Real yrs 1956 yrs
Lif
e e
xp
ec
tan
cy
1956 born1978 BA1982 DPhil1998 Married 2006 Gresham35th Pf Physic
Curriculum Vitae - Curriculum Mortis
35 yr
18 yr

Life and death in the new millennium
Where were the first improvements in health and longevity?
Why did life span double in Britain after 1800? What population processes? Which interventions?
Are we reaching maximum life expectancy?
Are "developing" countries actually developing?

Gresham College"The Third Universitie of England"
(1615)
1596 Matthew Gwinne, 1st Professor of Physic, Royal Physician, author of tragedy Nero
1608 "I ever have studied physic…by turning o’er authorities…" (Shakespeare, Pericles)
1647 Professors "so superbiously pettish…"1720 Lectures "should not be… intermingled with
exhortation…"1799 Lecture in Latin at 12 noon, vernacular at 1pm1904 WH Thompson (divinity) Nature and
Immortality

Terms of engagement
Health of humans in context of environment and evolution
Seeing is believing Distinguish known versus unknown Not just what happens but why Ask scientific questions for which I have
no answer Focus on populations (epidemiology)
rather than individuals (clinical)

Q1. Where were the first major
improvements in health and longevity?

20
30
40
50
60
70
80
1300 1400 1500 1600 1700 1800 1900 2000
Lif
e ex
pec
tan
cy a
t b
irth
(ye
ars) Wrigley & Schofield
Human Mortality Database
Clark
Industrial (r)evolution, health (r)evolution Life expectancy in England 1300-2000

THE SPECTRUM OF LIFE SPANS
From hunter-gatherers to…
… Japanese women

0
20
40
60
80
100
0 20 40 60 80 100
Age (years)
Pe
rce
nt
su
rviv
ing
Hunter-gatherers
Japanese women
Evolution: "Nasty, brutish..."Survival of hunter-gatherers and Japanese

Are humans more flexible than chimpanzees?
0
20
40
60
80
100
0 20 40 60 80Age (years)
Per
cen
t su
rviv
ing
Wild chimps
Captive chimps
Q2. What population
processes caused life expectancy double in 150
years?
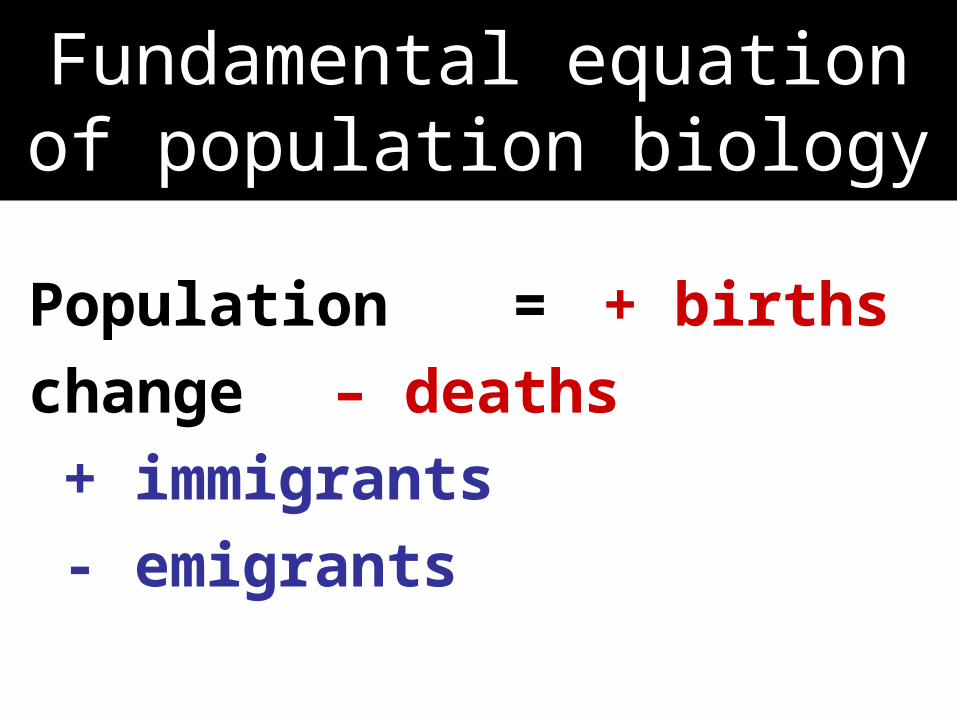
Population = + births
change – deaths
+ immigrants
- emigrants
Fundamental equation of population biology

Elim-i-nate the
negative, accen-tuate the positive

Feedback in health & population

20
30
40
50
60
70
80
1300 1400 1500 1600 1700 1800 1900 2000
Lif
e ex
pec
tan
cy a
t b
irth
(ye
ars) Wrigley & Schofield
Human Mortality Database
Clark
Industrial (r)evolution, health (r)evolution Life expectancy in England 1300-2000
500+ years of stasis → negative feedback

Thomas Robert Malthus1766-1834
Principle of Population (1798)
population, if unchecked, increases geometrically
2, 4, 8, 16, 32, 64, 128…
but food supply grows arithmetically
1, 2, 3, 4, 5, 6, 7, 8…
so population outruns food supply

50
100
150
200
250
300
0 10 20 30 40 50 60
Households with "substantial" taxable income (%)
Infa
nt
mo
rtal
ity
per
100
0 b
irth
sMalthus in 16-17th century London?
Poorer households had more child deaths
low income, high death rate
high income, low death rate
8 London parishes 1538-1653 (Landers 1993)

PO
SIT
IVE
FEED
BA
CK

20
30
40
50
60
70
80
1300 1400 1500 1600 1700 1800 1900 2000
Life
exp
ecta
ncy
at b
irth
(yea
rs) Wrigley & Schofield
Human Mortality Database
Clark
Industrial (r)evolution, health (r)evolution Life expectancy in England 1300-2000
Rapid increase → positive
feedback

John Graunt (1620-1674)
Observations on…
the Bills of Mortality 1662

Causes of Death in the Bills of Mortality
Childbed: death of mother from infection following childbirth
Chrisomes: death of infants in the first month of life (before baptism)
Consumption: tuberculosis
Dropsie: abnormal swelling due to build up of clear, watery fluid
Drowning, Execution, Murder
Flux: dysentery
Gowt: gout, inflammation, build up of uric acid in the tissues
Kingsevil: scrofula, tuberculosis of the neck
Livergrown: enlarged liver, possibly rickets
Purples: rash due to spontaneous bleeding in to the skin; in newborns, may be insufficient vitamin K
Quinsy: acute inflammation of the tonsils
Surfeit: vomiting from over eating or gluttony
Teeth: death of a teething infant

One death, one cause?

"Malnutrition-infection complex"
Better nutritionFewer infections e.g. less diarrhoea
Q3. What in(ter)ventions
allowed life expectancy double
in 150 years?

(1) AgricultureElimination of famine in England
0
2
4
6
8
10
12
14
averagepre-17th
17th 18th 19th 20thCenturies
Nu
mb
er
of
fam
ine
s
ea
ch
ce
ntu
ry
Excess food only 20-30% pre 17th century, with same fluctuation in yield
1 Agriculture and nutritionelimination of famine in England

2 Public health "sanitation revolution"
John Snow (1813-1858) Edwin Chadwick (1800-1890) Sanitary Condition of the Labouring
Population of Great Britain (1842) On The Mode of Communication of Cholera (1855)

3 Microbiology diagnostics vaccines drugs
1890s
C17th C19th C20th

Q4. Are we reaching
maximum life expectancy?

Growth: 1 extra year in 4
40
50
60
70
80
90
100
1820 1845 1870 1895 1920 1945 1970 1995 2020 2045 2070
Life expectancy
Maxima estimated inyear given
Inexorable growth in life expectancy?women in leading countries
source: Oeppen 2002
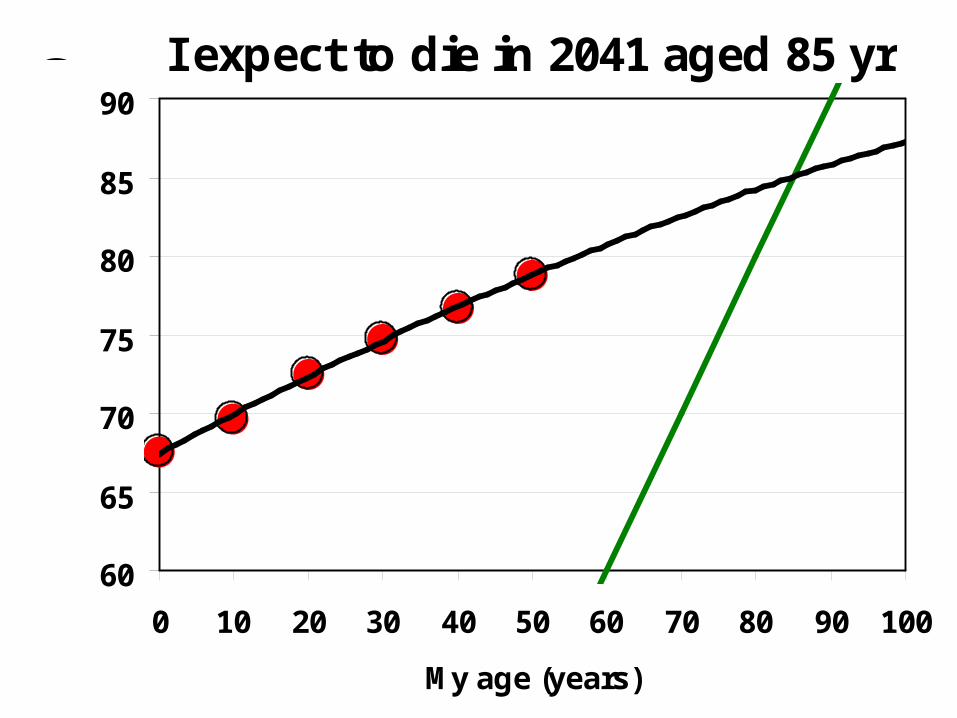
I expect to die in 2041 aged 85 yr
60
65
70
75
80
85
90
0 10 20 30 40 50 60 70 80 90 100
My age (years)
Line of immortality
Increase in life expectancy
Ex
pe
cte
d a
ge
of
de
ath
(y
ea
rs)
Q5. Are "developing"
countries developing?

William Gibson
"The future is already here,
it's just unevenly
distributed"
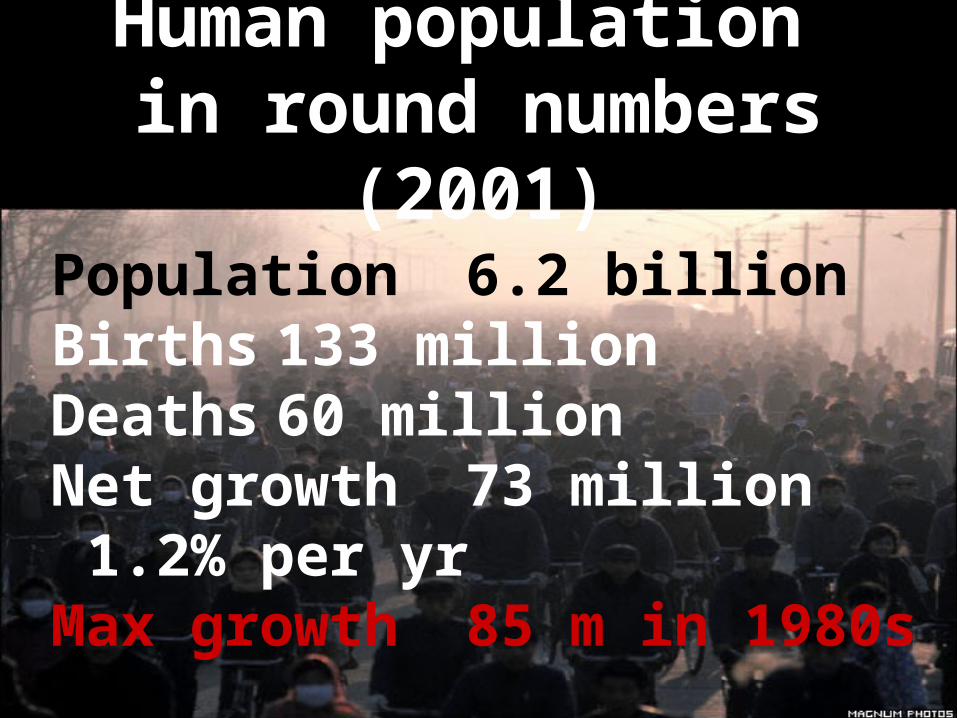
Human population in round numbers (2001)
Population 6.2 billionBirths 133 millionDeaths 60 millionNet growth 73 million
1.2% per yrMax growth 85 m in 1980s

Today's least favoured countries have longevity patterns of 19th century
FrancePortugal
ArgentinaGeorgia
AlgeriaIndonesia
MyanmarTimor-Leste
CambodiaEq Guinea
TanzaniaAngola
Zimbabwe
30
40
50
60
70
80
90
100
1780 1800 1820 1840 1860 1880 1900 1920 1940 1960 1980 2000
Year in which LE reached in leading countries
Lif
e e
xp
ec
tan
cy
wo
me
n 46 countries 146 countries
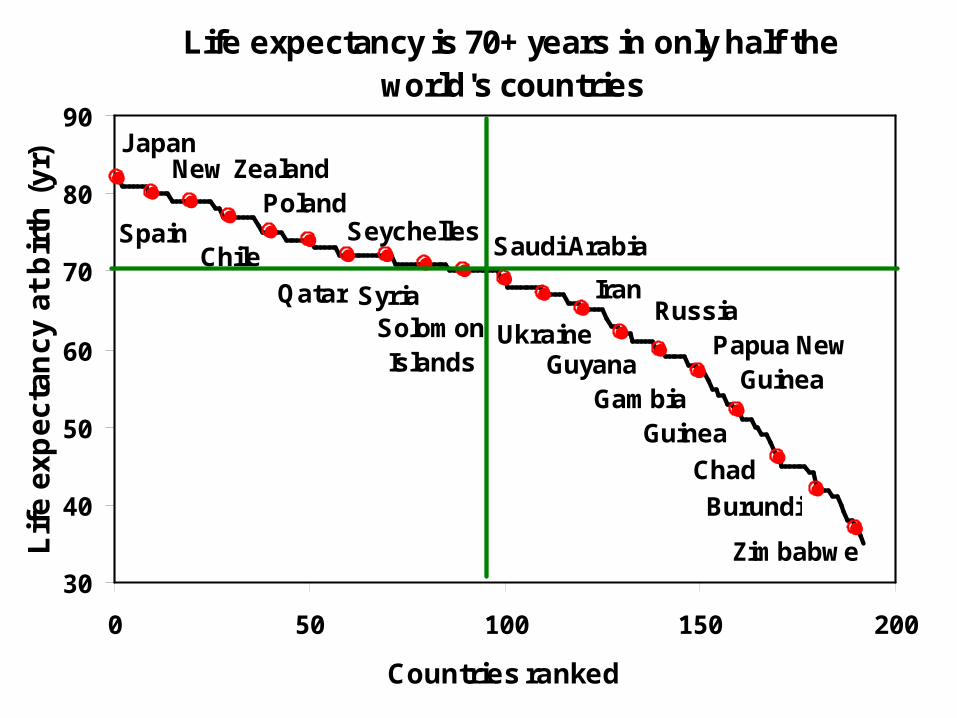
Life expectancy is 70+ years in only half the world's countries
Zimbabwe
Burundi
Chad
GuineaGambia
Papua New Guinea
Guyana
RussiaUkraine
Iran
Solomon Islands
Saudi Arabia
Syria
Seychelles
Qatar
Poland
Chile
New Zealand
Spain
Japan
30
40
50
60
70
80
90
0 50 100 150 200
Countries ranked
Lif
e e
xp
ec
tan
cy
at
bir
th (
yr)

0
20
40
60
80
100
<1 5-9
15-1
9
25-2
9
35-3
9
45-4
9
55-5
9
65-6
9
75-7
9
85-8
9
95-9
9
Age class (years)
Per
cen
t su
rviv
ing
JapanUK
India
Sierra Leone
Zimbabwe
Russia
Fate of 100 boys born in different countries in 2001

Global distribution of afflictionscommunicable, non-communicable, injuries

Where 60 million people die double burden of disease in low-income countries
0
2
4
6
8
Communicable,pregnancy,
nutrition
Non-communicable
Injuries
Dea
ths
per
mill
ion
po
pu
lati
on
Low-middle income
High income
0
1
2
3
4
Neonat
al
Respira
tory
Diarrh
oea
Other
s
Mal
aria
Mea
sles
HIV/A
IDS
Inju
ries
Mill
ion
s o
f d
ea
ths
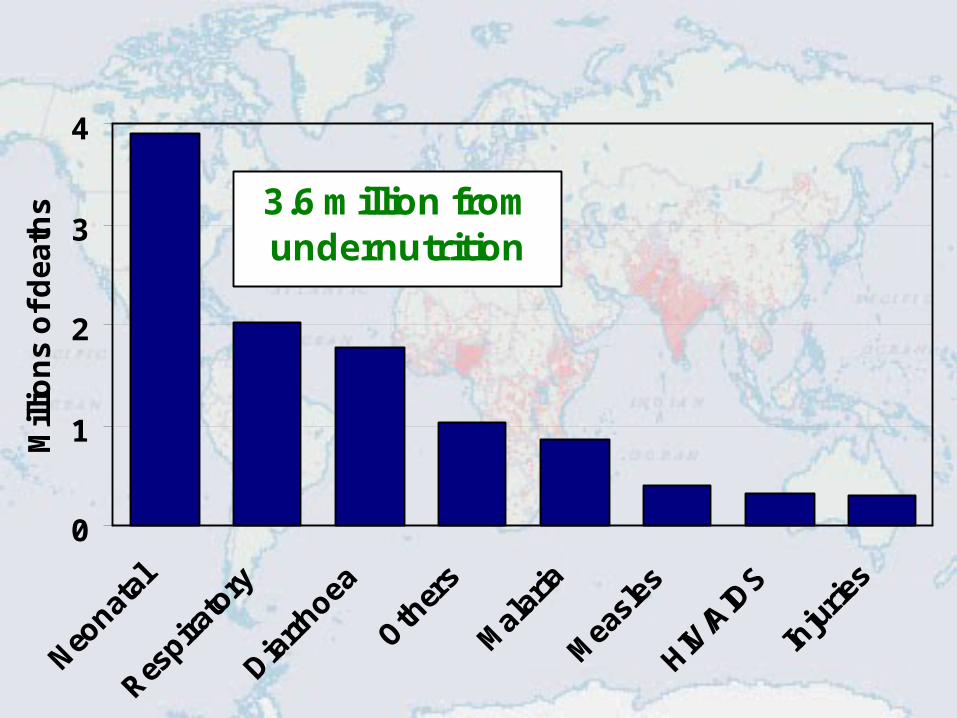
10 million children under 5 die each yearmostly of cheaply preventable conditions
3.6 million from undernutrition

Life expectancy is converging in low- and high- income countries
30
40
50
60
70
80
1960 1990 2002
Lif
e e
xp
ec
tan
cy
(y
ears
) Low-middle incomeHigh income

Thomas Jefferson
"Every generation needs a new revolution"
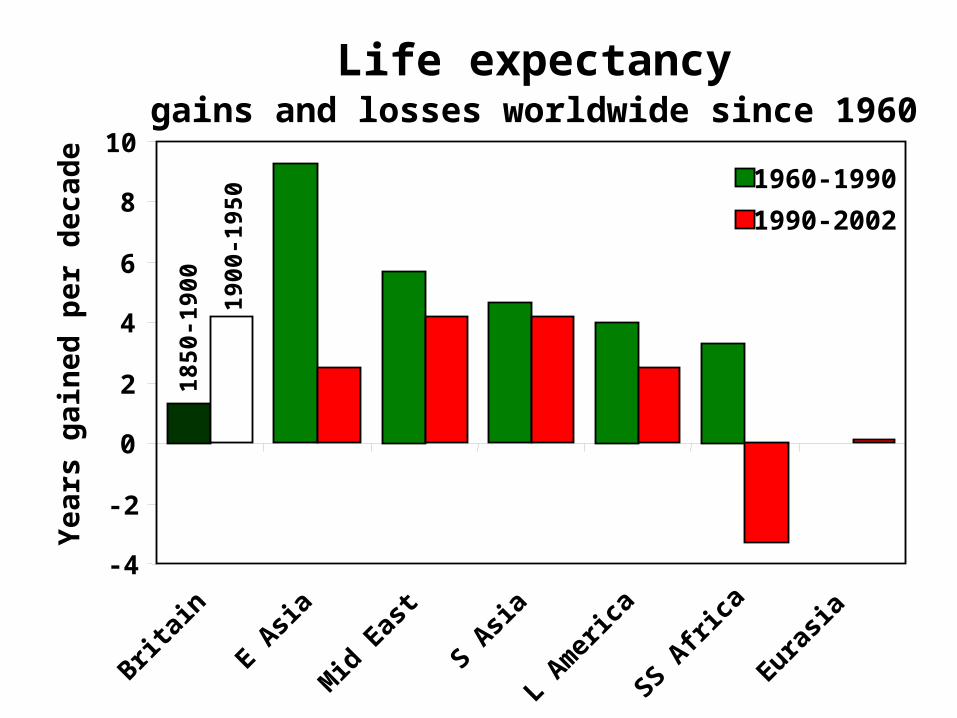
Life expectancy gains and losses worldwide since 1960
-4
-2
0
2
4
6
8
10
Britai
n
E Asi
a
Mid
Eas
t
S Asi
a
L Am
eric
a
SS Afri
ca
Eurasi
a
Yea
rs g
ain
ed p
er d
ecad
e 1960-1990
1990-200218
50-1
900
1900
-195
0

Chou En-lai
Q: What has been the impact of the French revolution?
A: "It's too early to tell"

69
4138
73
65
48
78
71
50
35
45
55
65
75
85
UK China Africa
Lif
e e
xp
ec
tan
cy
at
bir
th (
yr) 1952
1975
2002
China: the short march to long life

History of longevity
Human longevity - astonishingly plastic product of evolution
life span x2 in Western Europe 1800-1950 Escaping Malthus, the power of positive feedback
from environmental to genetic control Direct route to longer life
nutrition → epidemiology (public health) → microbiology (diagnosis, drugs and vaccines)
Not underestimating…
science, social institutions, capital, skilled labour

"Developing" countries Life spans range from hunter-gatherers to
industrialbut converging, with some exceptions
Cheap, effective technology to exploit +ve feedback outpaced the 1800-1950 revolutionChina and others since 1950
Lagging countries suffer old problems and new"infection-malnutrition", now with chronic
disease and AIDS; major reversals in E Europe & Africa
Technology only partly compensates for lack of science, institutions, capital, and labour
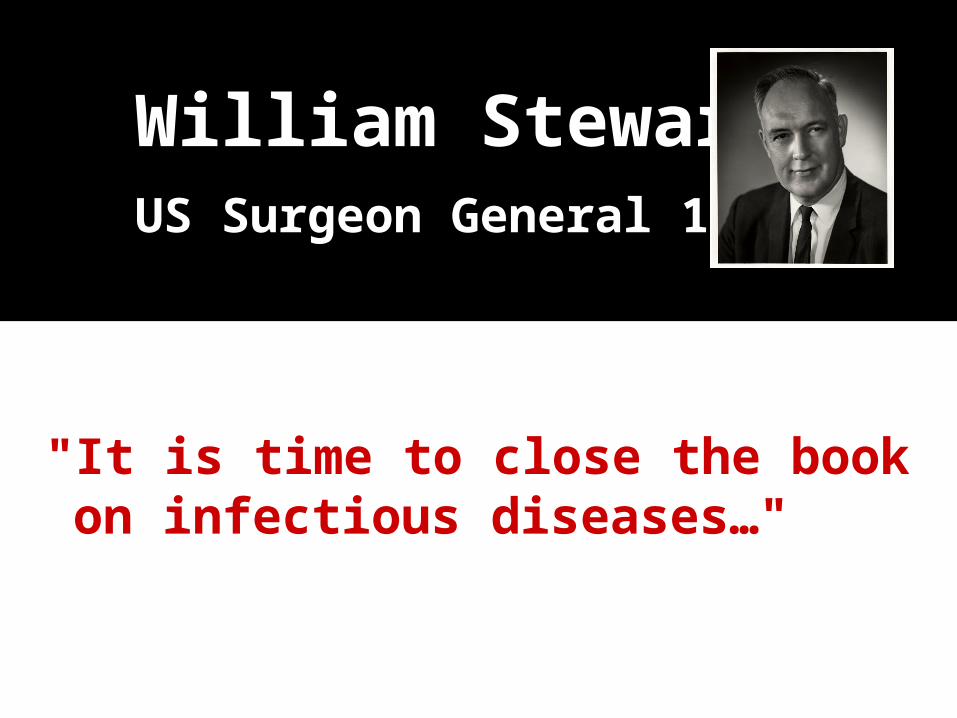
William Stewart US Surgeon General 1969
"It is time to close the book on infectious diseases…"