Embed Size (px)
Citation preview

© 2006 McGraw-Hill Ryerson Ltd..
Costs Terms, Concepts and Classifications
Chapter Two

© 2006 McGraw-Hill Ryerson Ltd
Learning Objectives
1. Identify and give examples of each of the three basic cost elements involved in the manufacture of a product.
2. Distinguish between product costs and period costs and give examples of each.
3. Prepare an income statement including the calculation of cost of goods sold.
4. Prepare a schedule of cost of goods manufactured.
After studying this chapter, you should be able to:

© 2006 McGraw-Hill Ryerson Ltd
Learning Objectives
5. Explain the difference in the behaviour of fixed and variable costs.
6. Distinguish between direct and indirect costs.7. Define and give examples of additional cost
classifications used in making decisions: differential costs, opportunity costs, and sunk costs.
8. (Appendix 2A) Identify the four types of quality costs and explain how they interact.
9. (Appendix 2A) Prepare and interpret a quality cost report.
After studying this chapter, you should be able to:

© 2006 McGraw-Hill Ryerson Ltd
The ProductThe Product
DirectMaterials
DirectMaterials
DirectLabourDirectLabour
ManufacturingOverhead
ManufacturingOverhead
Manufacturing Costs

© 2006 McGraw-Hill Ryerson Ltd
Direct Materials
Raw materials that become an integral part of the product and that can be conveniently traced
directly to it.
Example: A radio installed in an automobileExample: A radio installed in an automobile

© 2006 McGraw-Hill Ryerson Ltd
Direct Labour
Those labour costs that can be easily traced to individual units of product.
Example: Wages paid to automobile assembly workersExample: Wages paid to automobile assembly workers
© 2006 McGraw-Hill Ryerson Ltd
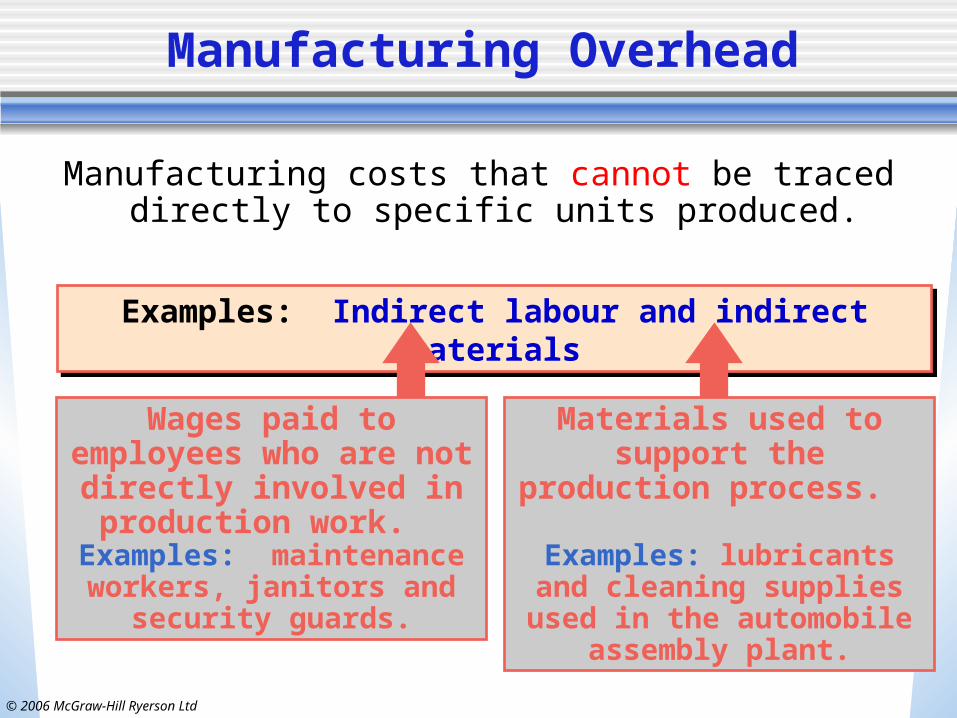
Manufacturing costs that cannot be traced directly to specific units produced.
Manufacturing Overhead
Examples: Indirect labour and indirect materialsExamples: Indirect labour and indirect materials
Wages paid to employees who are not directly
involved in production work.
Examples: maintenance workers, janitors and
security guards.
Materials used to support the production process.
Examples: lubricants and cleaning supplies used in the automobile assembly plant.

© 2006 McGraw-Hill Ryerson Ltd
Classifications of Costs
DirectMaterialDirect
MaterialDirectLabourDirectLabour
ManufacturingOverhead
ManufacturingOverhead
PrimeCost
ConversionCost
Manufacturing costs are oftenclassified as follows:

© 2006 McGraw-Hill Ryerson Ltd
Idle Time
The labour costs incurred during idle time are ordinarily
treated as manufacturing overhead.
Machine Breakdowns
Material Shortages
Power Failures

© 2006 McGraw-Hill Ryerson Ltd
Overtime
The overtime premiums for all factory workers are usually considered to be part
of manufacturing overhead.

© 2006 McGraw-Hill Ryerson Ltd
Employee Benefits
Employee benefits include employment taxes, medical plans, and pension costs.
Some companies include all of these
costs in manufacturing
overhead.
Other companies treat employee benefit
expenses of direct labourers as
additional direct labour costs.

© 2006 McGraw-Hill Ryerson Ltd
Non-manufacturing Costs
Marketing or Selling Cost
Costs necessary to get the order and deliver
the product.
Administrative Cost
All executive, organizational, and
clerical costs.

© 2006 McGraw-Hill Ryerson Ltd
Product Costs Versus Period Costs
Product costs include direct materials, direct
labour, and manufacturing overhead.
Period costs include all marketing or selling
costs and administrative costs.
Inventory Cost of Good Sold
BalanceSheet
IncomeStatement
Sale
Expense
IncomeStatement
© 2006 McGraw-Hill Ryerson Ltd
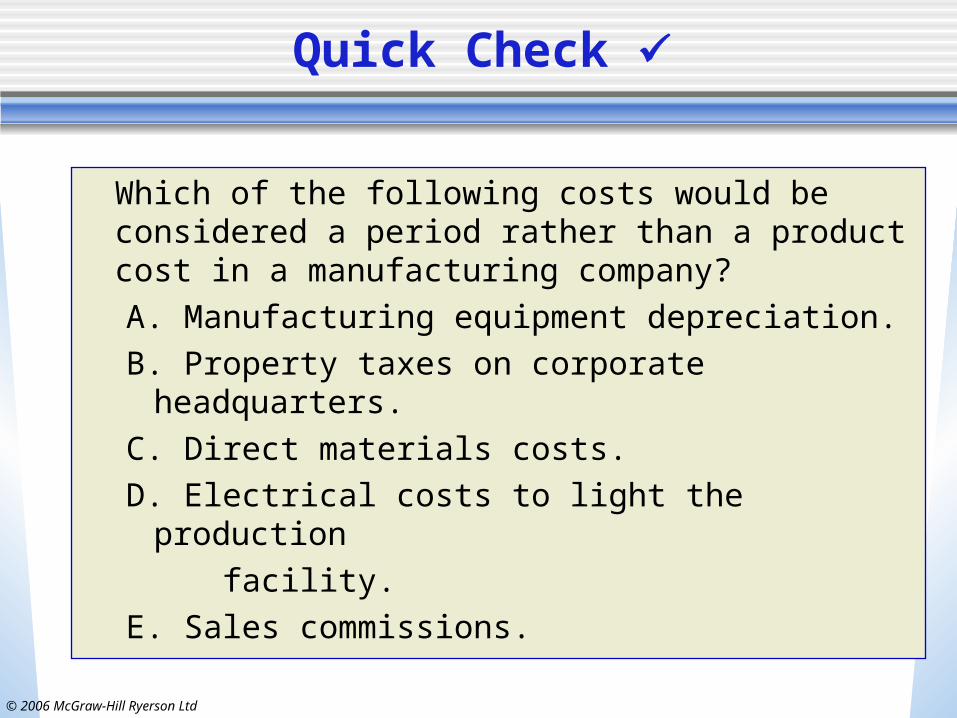
Quick Check
Which of the following costs would be considered a period rather than a product cost in a manufacturing company?
A. Manufacturing equipment depreciation.
B. Property taxes on corporate headquarters.
C. Direct materials costs.
D. Electrical costs to light the production
facility.
E. Sales commissions.

© 2006 McGraw-Hill Ryerson Ltd
Comparing Merchandising and Manufacturing Activities
Merchandisers . . . Buy finished goods. Sell finished goods.
Manufacturers . . . Buy raw materials. Produce and sell
finished goods.
MegaLoMart

© 2006 McGraw-Hill Ryerson Ltd
Balance Sheet
Merchandiser Current assets
CashReceivablesPrepaid ExpensesMerchandise
Inventory
Manufacturer Current Assets
Cash Receivables Prepaid Expenses Inventories
Raw Materials
Work in Process
Finished Goods
© 2006 McGraw-Hill Ryerson Ltd
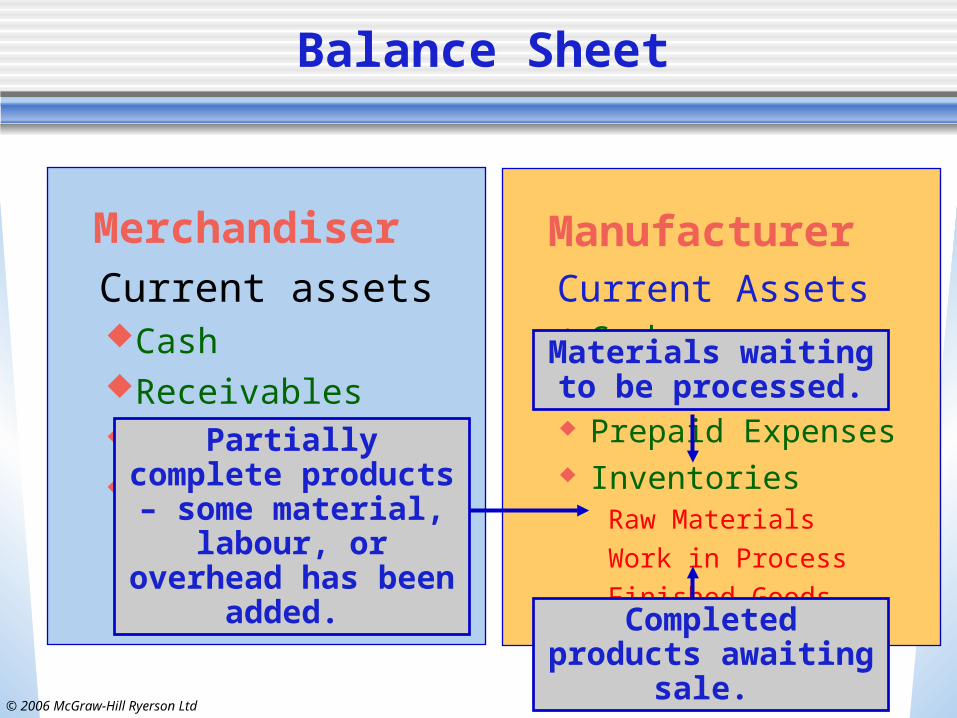
Balance Sheet
Merchandiser Current assets
CashReceivablesPrepaid ExpensesMerchandise
Inventory
Manufacturer Current Assets
Cash Receivables Prepaid Expenses Inventories
Raw Materials
Work in Process
Finished Goods
Partially complete products – some
material, labour, or overhead has been
added. Completed products
awaiting sale.
Materials waiting to be processed.

© 2006 McGraw-Hill Ryerson Ltd
The Income Statement
Cost of goods sold for manufacturers differs only slightly from cost of goods sold for merchandisers.
Merchandising Company
Cost of goods sold: Beg. merchandise inventory 14,200$ + Purchases 234,150 Goods available for sale 248,350$ - Ending merchandise inventory (12,100) = Cost of goods sold 236,250$

© 2006 McGraw-Hill Ryerson Ltd
Inventory Flows
Beginningbalance
$$
Beginningbalance
$$
Additions$$$
Additions$$$+ Available
$$$$$
Available$$$$$=
Endingbalance
$$
Endingbalance
$$=Withdrawals
$$$
Withdrawals$$$
_Available$$$$$
Available$$$$$

© 2006 McGraw-Hill Ryerson Ltd
Quick Check
If your inventory balance at the beginning of the month was $1,000, you bought $100 during the month, and sold $300 during the month, what would be the balance at the end of the month?
A. $1,000.
B. $ 800.
C. $1,200.
D. $ 200.

© 2006 McGraw-Hill Ryerson Ltd
Quick Check
If your inventory balance at the beginning of the month was $1,000, you bought $100 during the month, and sold $300 during the month, what would be the balance at the end of the month?
A. $1,000.
B. $ 800.
C. $1,200.
D. $ 200.
$1,000 + $100 = $1,100$1,100 - $300 = $800
© 2006 McGraw-Hill Ryerson Ltd
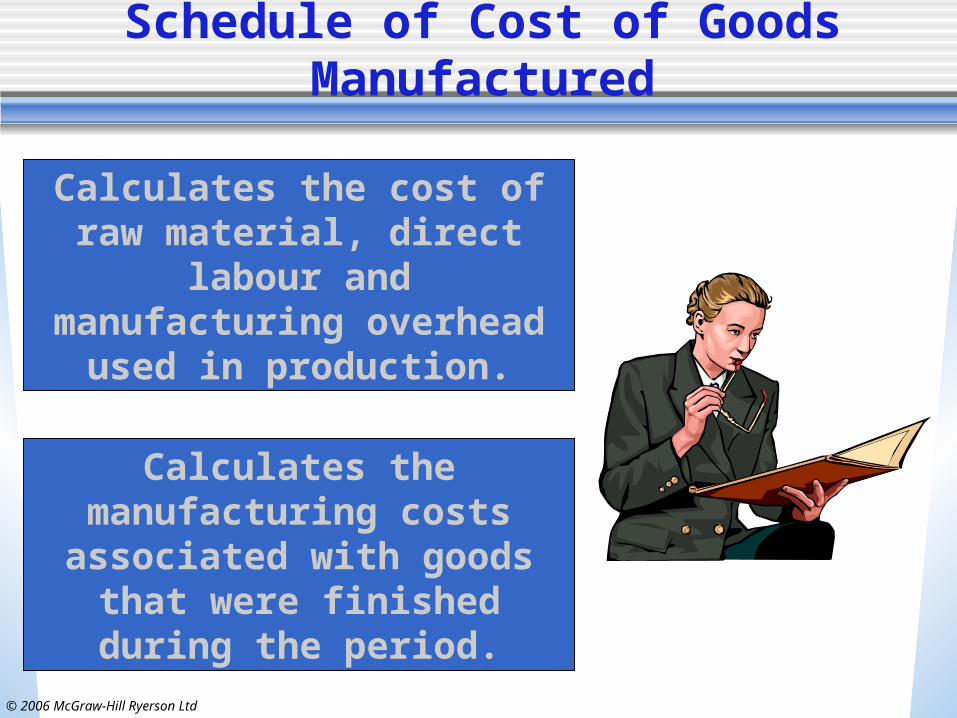
Schedule of Cost of Goods Manufactured
Calculates the cost of raw material, direct labour and
manufacturing overhead used in production.
Calculates the manufacturing costs associated with goods that were finished during the
period.

© 2006 McGraw-Hill Ryerson Ltd
Manufacturing WorkRaw Materials Costs In Process
Beginning raw Direct materials materials inventory
+ Raw materials purchased
= Raw materials
available for use in production
– Ending raw materials inventory
= Raw materials used
in production
As items are removed from raw materials inventory and placed into
the production process, they arecalled direct materials.
As items are removed from raw materials inventory and placed into
the production process, they arecalled direct materials.
Product Cost Flows

© 2006 McGraw-Hill Ryerson Ltd
Manufacturing WorkRaw Materials Costs In Process
Beginning raw Direct materials materials inventory + Direct labour
+ Raw materials + Mfg. overhead purchased = Total manufacturing
= Raw materials costs
available for use in production
– Ending raw materials inventory
= Raw materials used
in production
Conversion costs are costs
incurred to convert the
direct material into a finished
product.
Conversion costs are costs
incurred to convert the
direct material into a finished
product.
Product Cost Flows

© 2006 McGraw-Hill Ryerson Ltd
Manufacturing WorkRaw Materials Costs In Process
Beginning raw Direct materials Beginning work in materials inventory + Direct labour process inventory
+ Raw materials + Mfg. overhead + Total manufacturing purchased = Total manufacturing costs
= Raw materials costs = Total work in
available for use process for the in production period
– Ending raw materials inventory
= Raw materials used
in production
Product Cost Flows
All manufacturing costs incurred during the period are added to the
beginning balance of work in process.
All manufacturing costs incurred during the period are added to the
beginning balance of work in process.

© 2006 McGraw-Hill Ryerson Ltd
Manufacturing WorkRaw Materials Costs In Process
Beginning raw Direct materials Beginning work in materials inventory + Direct labour process inventory
+ Raw materials + Mfg. overhead + Total manufacturing purchased = Total manufacturing costs
= Raw materials costs = Total work in
available for use process for the in production period
– Ending work in process inventory
= Cost of goods
manufactured
Product Cost Flows
Costs associated with the goods that are completed during the period are
transferred to finished goods inventory.
Costs associated with the goods that are completed during the period are
transferred to finished goods inventory.

© 2006 McGraw-Hill Ryerson Ltd
Product Cost Flows

© 2006 McGraw-Hill Ryerson Ltd
Manufacturing Cost Flows
FinishedGoods
Cost of GoodsSold
Selling andAdministrative
Period CostsSelling andAdministrative
ManufacturingOverhead
Work in Process
Direct Labour
Balance Sheet Costs Inventories
Income StatementExpenses
Material Purchases Raw Materials

© 2006 McGraw-Hill Ryerson Ltd
Quick Check
Beginning raw materials inventory was $32,000. During the month, $276,000 of raw material was purchased. A count at the end of the month revealed that $28,000 of raw material was still present. What is the cost of direct material used?
A. $276,000
B. $272,000
C. $280,000D. $ 2,000

© 2006 McGraw-Hill Ryerson Ltd
Quick Check
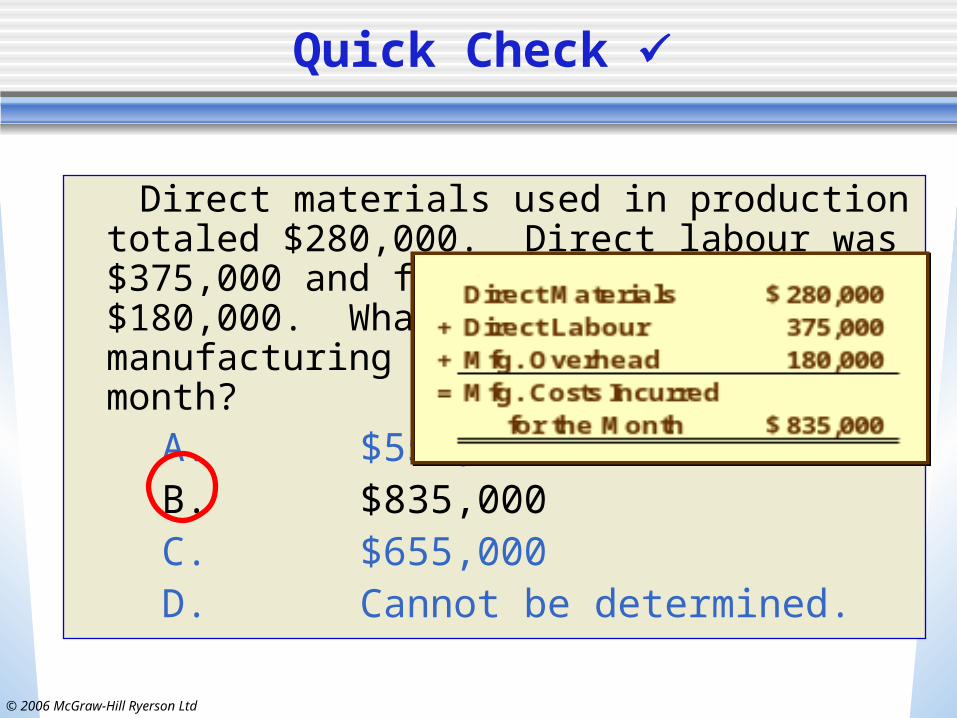
Direct materials used in production totaled $280,000. Direct labour was $375,000 and factory overhead was $180,000. What were total manufacturing costs incurred for the month?
A. $555,000B. $835,000C. $655,000D. Cannot be determined.
© 2006 McGraw-Hill Ryerson Ltd
Direct materials used in production totaled $280,000. Direct labour was $375,000 and factory overhead was $180,000. What were total manufacturing costs incurred for the month?
A. $555,000B. $835,000C. $655,000D. Cannot be determined.
Quick Check

© 2006 McGraw-Hill Ryerson Ltd
Quick Check
Beginning work in process was $125,000. Manufacturing costs incurred for the month were $835,000. There were $200,000 of partially finished goods remaining in work in process inventory at the end of the month. What was the cost of goods manufactured during the month?
A. $1,160,000B. $ 910,000C. $ 760,000D. Cannot be determined.

© 2006 McGraw-Hill Ryerson Ltd
Beginning work in process was $125,000. Manufacturing costs incurred for the month were $835,000. There were $200,000 of partially finished goods remaining in work in process inventory at the end of the month. What was the cost of goods manufactured during the month?
A. $1,160,000B. $ 910,000C. $ 760,000D. Cannot be determined.
Quick Check

© 2006 McGraw-Hill Ryerson Ltd
Quick Check
Beginning finished goods inventory was $130,000. The cost of goods manufactured for the month was $760,000. And the ending finished goods inventory was $150,000. What was the cost of goods sold for the month?A. $ 20,000.B. $740,000.C. $780,000.D. $760,000.

© 2006 McGraw-Hill Ryerson Ltd
Quick Check
Beginning finished goods inventory was $130,000. The cost of goods manufactured for the month was $760,000. And the ending finished goods inventory was $150,000. What was the cost of goods sold for the month?A. $ 20,000.B. $740,000.C. $780,000.D. $760,000.
$130,000 + $760,000 = $890,000$890,000 - $150,000 = $740,000

© 2006 McGraw-Hill Ryerson Ltd
Cost Classifications for Predicting Cost Behaviour
How a cost will react to changes in the level of
activity within the relevant range.
Total variable costs change when activity changes.
Total fixed costs remain unchanged when activity changes.
How a cost will react to changes in the level of
activity within the relevant range.
Total variable costs change when activity changes.
Total fixed costs remain unchanged when activity changes.

© 2006 McGraw-Hill Ryerson Ltd
Total Variable Cost
Your total long distance telephone bill is based on how many minutes you talk.
Minutes Talked
Tot
al L
ong
Dis
tanc
eT
elep
hone
Bill
© 2006 McGraw-Hill Ryerson Ltd
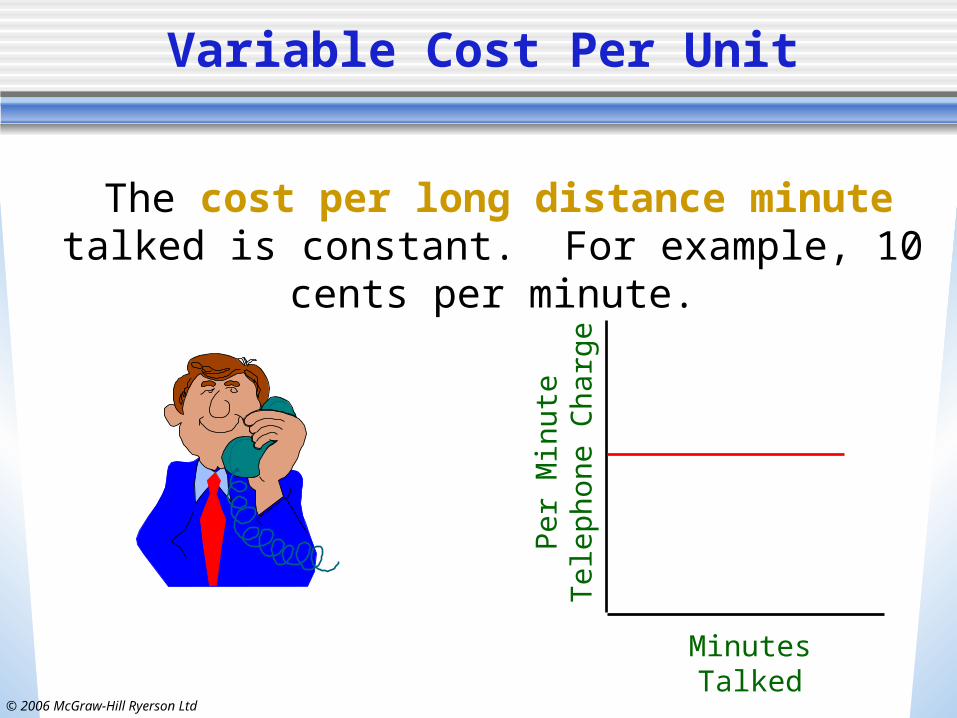
Variable Cost Per Unit
Minutes Talked
Per
Min
ute
Tel
epho
ne C
harg
e
The cost per long distance minute talked is constant. For example, 10 cents per minute.
© 2006 McGraw-Hill Ryerson Ltd
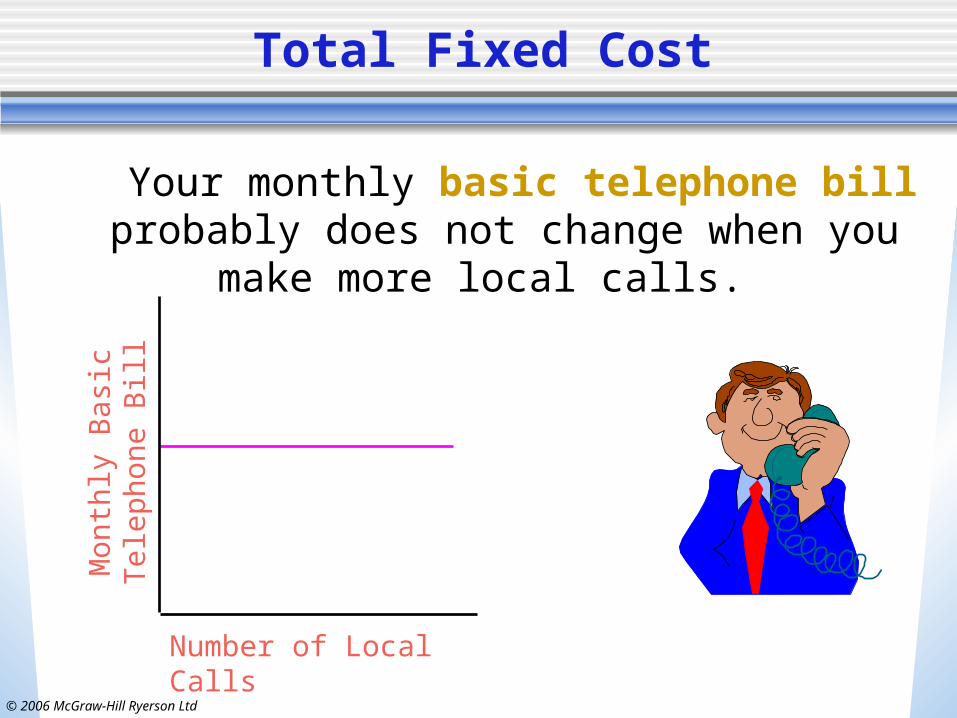
Total Fixed Cost
Your monthly basic telephone bill probably does not change when you make more local
calls.
Number of Local Calls
Mon
thly
Bas
ic
Tel
epho
ne B
ill

© 2006 McGraw-Hill Ryerson Ltd
Fixed Cost Per Unit
Number of Local Calls
Mon
thly
Bas
ic T
elep
hone
B
ill p
er L
ocal
Cal
l
The average fixed cost per local call decreases as more local calls are made.

© 2006 McGraw-Hill Ryerson Ltd
Cost Classifications for Predicting Cost Behaviour
Behaviour of Cost (within the relevant range)
Cost In Total Per Unit
Variable Total variable cost changes Variable cost per unit remainsas activity level changes. the same over wide ranges
of activity.
Fixed Total fixed cost remains Average fixed cost per unit goesthe same even when the down as activity level goes up.
activity level changes.

© 2006 McGraw-Hill Ryerson Ltd
Quick Check
Which of the following costs would be variable with respect to the number of cones sold at an ice cream shop? (There may be more than one correct answer.)
A. The cost of lighting the store.
B. The wages of the store manager.
C. The cost of ice cream.
D. The cost of napkins for customers.

© 2006 McGraw-Hill Ryerson Ltd
Assigning Costs to Cost Objects
Direct costs
• Costs that can beeasily and conveniently traced to a unit of product or other cost object.
• Examples: direct material and direct labour
Indirect costs• Costs that cannot be easily
and conveniently traced to a unit of product or other cost object.
• Example: manufacturing overhead

© 2006 McGraw-Hill Ryerson Ltd
• Every decision involves a choice between at least two alternatives.
• Only those costs and benefits that differ between alternatives are relevant in a decision. All other costs and benefits can and should be ignored.
Cost Classifications for Decision Making

© 2006 McGraw-Hill Ryerson Ltd
Differential Costs and Revenues
Costs and revenues that differ among alternatives.
Example: You have a job paying $1,500 per month in your hometown. You have a job offer in a neighboring city that pays $2,000 per month. The commuting cost to the city is $300 per month.
Example: You have a job paying $1,500 per month in your hometown. You have a job offer in a neighboring city that pays $2,000 per month. The commuting cost to the city is $300 per month.
Differential revenue is: $2,000 – $1,500 = $500
Differential cost is: $300
© 2006 McGraw-Hill Ryerson Ltd
Opportunity Costs
The potential benefit that is given up when one alternative is selected over another.
Example: If you werenot attending college,you could be earning$15,000 per year. Your opportunity costof attending college for one year is $15,000.

© 2006 McGraw-Hill Ryerson Ltd
Sunk Costs
Sunk costs have already been incurred and cannot be changed now or in the future. They should be ignored
when making decisions.
Example: You bought an automobile that cost $10,000 two years ago. The $10,000 cost is sunk because whether you drive it, park it, trade it, or sell it, you cannot change the $10,000 cost.

© 2006 McGraw-Hill Ryerson Ltd
Quick Check
Suppose you are trying to decide whether to drive or fly to Toronto to attend a concert. You have ample cash to do either, but you don’t want to waste money needlessly. Is the cost of the plane ticket relevant in this decision? In other words, should the cost of the plane ticket affect the decision of whether you drive or fly to Toronto?
A. Yes, the cost of the plane ticket is relevant.
B. No, the cost of the plane ticket is not relevant.

© 2006 McGraw-Hill Ryerson Ltd
Quick Check
Suppose you are trying to decide whether to drive or fly to Toronto to attend a concert. You have ample cash to do either, but you don’t want to waste money needlessly. Is the annual cost of licensing your car relevant in this decision?
A. Yes, the licensing cost is relevant.
B. No, the licensing cost is not relevant.

© 2006 McGraw-Hill Ryerson Ltd
Quick Check
Suppose that your car could be sold now for $5,000. Is this a sunk cost?
A. Yes, it is a sunk cost.
B. No, it is not a sunk cost.

© 2006 McGraw-Hill Ryerson Ltd
Quick Check
Suppose that your car could be sold now for $5,000. Is this a sunk cost?
A. Yes, it is a sunk cost.
B. No, it is not a sunk cost.

© 2006 McGraw-Hill Ryerson Ltd
Summary of the Types of Cost Classifications
• Financial reporting• Predicting cost behaviour• Assigning costs to cost objects• Decision making
© 2006 McGraw-Hill Ryerson Ltd..
Review Problem
Schedule of Cost of Goods Manufactured and Income Statement

© 2006 McGraw-Hill Ryerson Ltd
Review Problem Text P.48
The following information was taken from the accounting records of Klear-Seal Company: Selling expenses $140,000 Raw materials inventory, January 1 90,000 Raw materials inventory, December 31 60,000 Utilities, factory 36,000 Direct labour cost 150,000 Depreciation, factory 162,000 Purchases of raw materials 750,000 Sales 2,500,000

© 2006 McGraw-Hill Ryerson Ltd
Review Problem
Insurance, factory 40,000 Supplies, factory 15,000 Administrative expenses 270,000 Indirect labour 300,000 Maintenance, factory 87,000 Work in process inventory, January 1 180,000 Work in process inventory, December 31 100,000 Finished goods inventory, January 1 260,000 Finished goods inventory, December 31 210,000
Management wants to organize these data into a better format so that financial statements can be prepared for the year.

© 2006 McGraw-Hill Ryerson Ltd
Quality of Conformance
When the overwhelming majority of products produced conform to design
specifications and are free from defects.

© 2006 McGraw-Hill Ryerson Ltd
Prevention and Appraisal Costs
Prevention Costs
Support activities whose purpose is to
reduce the number of defects
Appraisal Costs
Incurred to identify defective products
before the products are shipped

© 2006 McGraw-Hill Ryerson Ltd
Internal and External Failure Costs
Internal Failure Costs
Incurred as a result of identifying defects
before they are shipped
External Failure Costs
Incurred as a result of defective products being delivered to
customers

© 2006 McGraw-Hill Ryerson Ltd
Examples of Quality Costs
Prevention Costs• Quality training• Quality circles• Statistical process control activities
Appraisal Costs• Testing & inspecting incoming materials• Final product testing• Depreciation of testing equipment
Internal Failure Costs• Scrap• Spoilage• Rework
External Failure Costs• Cost of field servicing & handling complaints• Warranty repairs• Lost sales

© 2006 McGraw-Hill Ryerson Ltd
Distribution of Quality Costs
When quality of conformance is low, total quality cost is high and consists mostly of internal and external failure.
Companies can reduce their total quality cost by
focusing on prevention and appraisal. The cost savings
from reduced defects usually swamps the costs
of the additional prevention and appraisal efforts.

© 2006 McGraw-Hill Ryerson Ltd
Quality cost reports provide an estimate of the financial
consequences of the
company’s current defect
rate.
Amount Percent* Amount Percent*Prevention costs:
Systems development 400,000$ 0.80% 270,000$ 0.54%Quality training 210,000 0.42% 130,000 0.26%Supervision of prevention activities 70,000 0.14% 40,000 0.08%Quality improvement 320,000 0.64% 210,000 0.42%
Total prevention cost 1,000,000 2.00% 650,000 1.30%
Appraisal costs:Inspection 600,000 1.20% 560,000 1.12%Reliability testing 580,000 1.16% 420,000 0.84%Supervision of testing and inspection 120,000 0.24% 80,000 0.16%Depreciation of test equipment 200,000 0.40% 140,000 0.28%
Total appraisal cost 1,500,000 3.00% 1,200,000 2.40%
Internal failure costs:Net cost of scrap 900,000 1.80% 750,000 1.50%Rework labor and overhead 1,430,000 2.86% 810,000 1.62%Downtime due to defects in quality 170,000 0.34% 100,000 0.20%Disposal of defective products 500,000 1.00% 340,000 0.68%
Total internal failure cost 3,000,000 6.00% 2,000,000 4.00%
External failure costs:Warranty repairs 400,000 0.80% 900,000 1.80%Warranty replacements 870,000 1.74% 2,300,000 4.60%Allowances 130,000 0.26% 630,000 1.26%Cost of field servicing 600,000 1.20% 1,320,000 2.64%
Total external failure cost 2,000,000 4.00% 5,150,000 10.30%Total quality cost 7,500,000$ 15.00% 9,000,000$ 18.00%
* As a percentage of total sales. In each year sales totaled $50,000,000.
Year 2 Year 1
Ventura CompanyQuality Cost ReportFor Years 1 and 2

© 2006 McGraw-Hill Ryerson Ltd
Quality Cost Reports: Graphic Form
$10
9
8
7
6
5
4
3
2
1Appraisal
0Prevention Prevention
1 2Year
Qu
alit
y C
ost
(in
mil
lio
ns)
Appraisal
Internal Failure
External Failure
Internal Failure
External Failure
20
18
16
14
12
10
8
6
4
2Appraisal
0Prevention Prevention
1 2Year
Qu
alit
y C
ost
as
a P
erce
nta
ge
of
Sal
es
Appraisal
Internal Failure
External Failure
Internal Failure
External Failure
Quality reports
can also be
prepared in
graphic form.

© 2006 McGraw-Hill Ryerson Ltd
Uses of Quality Cost Information
Help managers see the financial significance of
defects
Help managers identify the relative importance of
the quality problems
Help managers see whether their quality
costs are poorly distributed

© 2006 McGraw-Hill Ryerson Ltd
Limitations of Quality Cost Information
Simply measuring quality cost problems does not solve quality problems
Results usually lag behind quality
improvement programs
The most important quality cost, lost sales, is
often omitted from quality cost reports

© 2006 McGraw-Hill Ryerson Ltd
ISO 9000 Standards
ISO 9000 standards have become an international measure of quality. To become
ISO 9000 certified, a company must demonstrate:
1. A quality control system is in use, and the system clearly defines an expected level of quality.
2. The system is fully operational and is backed up with detailed documentation of quality control procedures.
3. The intended level of quality is being achieved on a sustained basis.
© 2006 McGraw-Hill Ryerson Ltd
End of Chapter 2