Embed Size (px)
Citation preview
© 2003 McGraw-Hill Ryerson Limited
1111Chapt
er
Chapt
er
Cost of CapitalCost of Capital
McGraw-Hill Ryerson ©2003 McGraw-Hill Ryerson Limited
Based on:Terry Fegarty
Carol Edwards,Lawrence J. Gitman
April 18, 2005
© 2003 McGraw-Hill Ryerson Limited
Chapter 11 - Outline
Cost of Capital Cost of Debt Cost of Preferred Stock Cost of Common Equity:
Common Stock Retained Earnings
Weighted Average Cost of capital Optimum Capital Structure Marginal Cost of Capital Summary and Conclusions
PPT 11-2
© 2003 McGraw-Hill Ryerson Limited
Cost of Capital
For Investors/Creditors, the rate of return on a security is a benefit of investing/lending.
For the Firms, that same rate of return is a cost of raising funds that are needed to operate the firm or finance a project.
In other words, the cost of raising funds is the firm’s cost of capital.
© 2003 McGraw-Hill Ryerson Limited
Cost of Capital
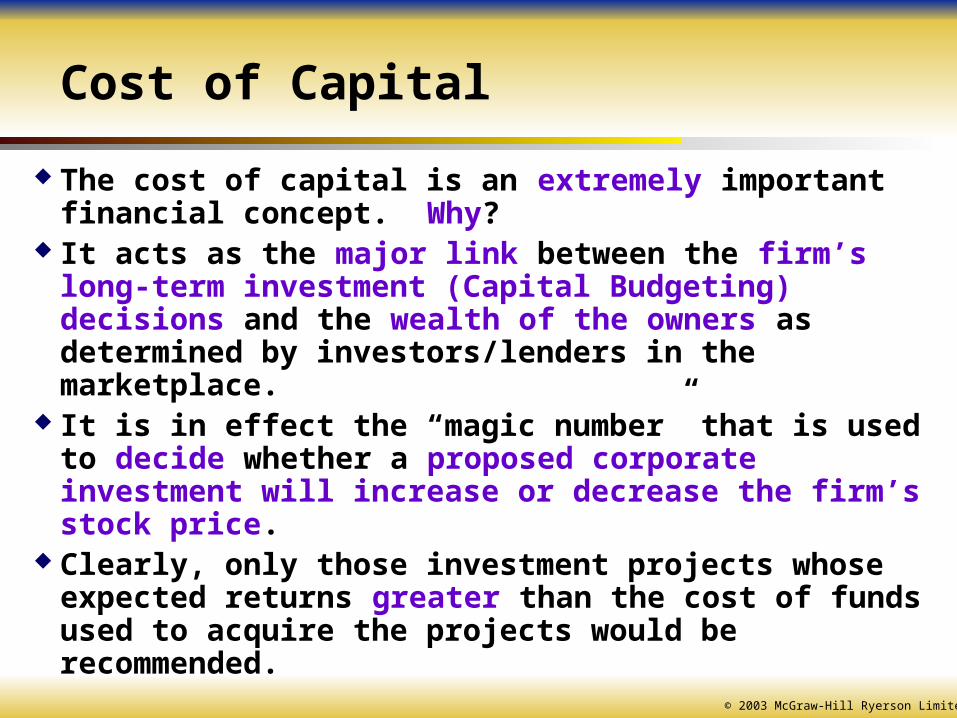
The cost of capital is an extremely important financial concept. Why?
It acts as the major link between the firm’s long-term investment (Capital Budgeting) decisions and the wealth of the owners as determined by investors/lenders in the marketplace.
It is in effect the “magic number” that is used to decide whether a proposed corporate investment will increase or decrease the firm’s stock price.
Clearly, only those investment projects whose expected returns greater than the cost of funds used to acquire the projects would be recommended.
© 2003 McGraw-Hill Ryerson Limited
How does a firm raise capital?
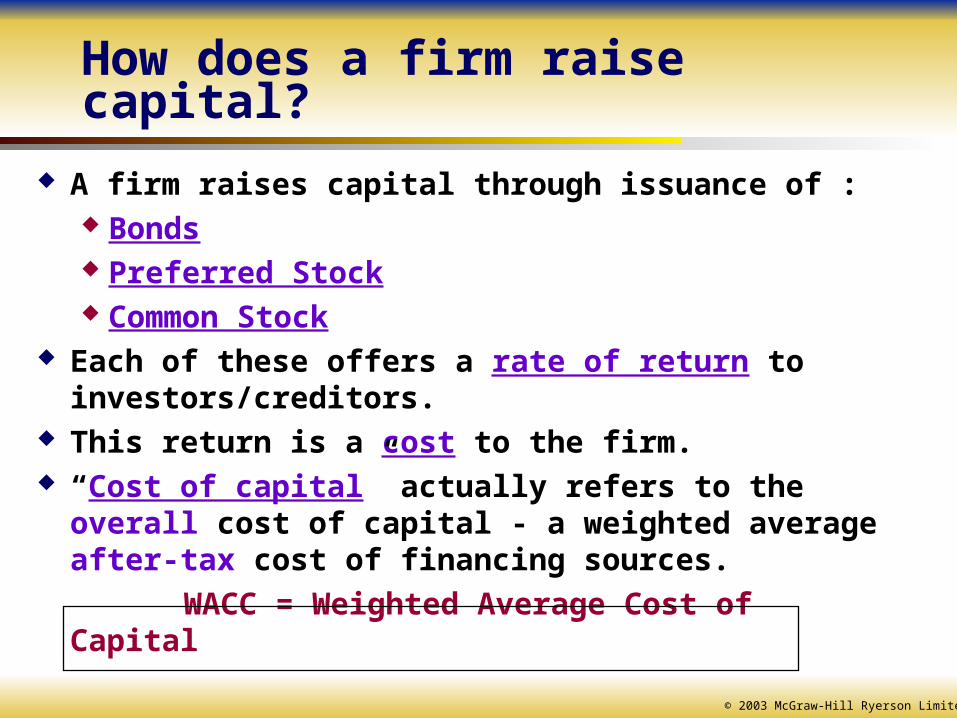
A firm raises capital through issuance of : Bonds Preferred Stock Common Stock
Each of these offers a rate of return to investors/creditors.
This return is a cost to the firm. “Cost of capital” actually refers to the overall cost of
capital - a weighted average after-tax cost of financing sources.
WACC = Weighted Average Cost of Capital
© 2003 McGraw-Hill Ryerson Limited
Cost of Debt
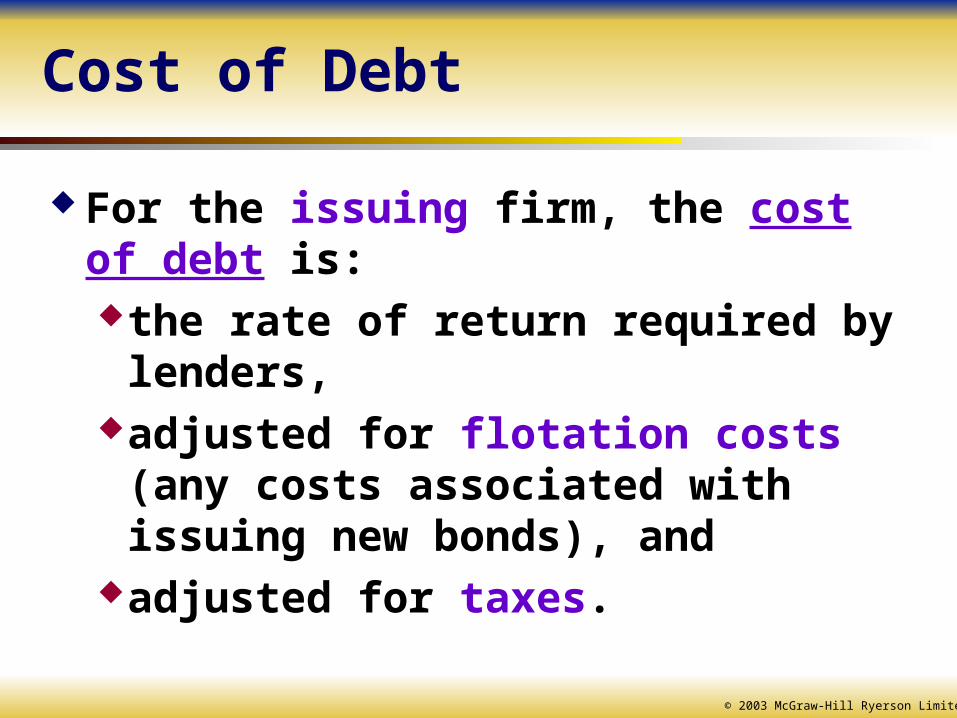
For the issuing firm, the cost of debt is:the rate of return required by lenders,adjusted for flotation costs (any costs
associated with issuing new bonds), and adjusted for taxes.
© 2003 McGraw-Hill Ryerson Limited
Cost of Debt
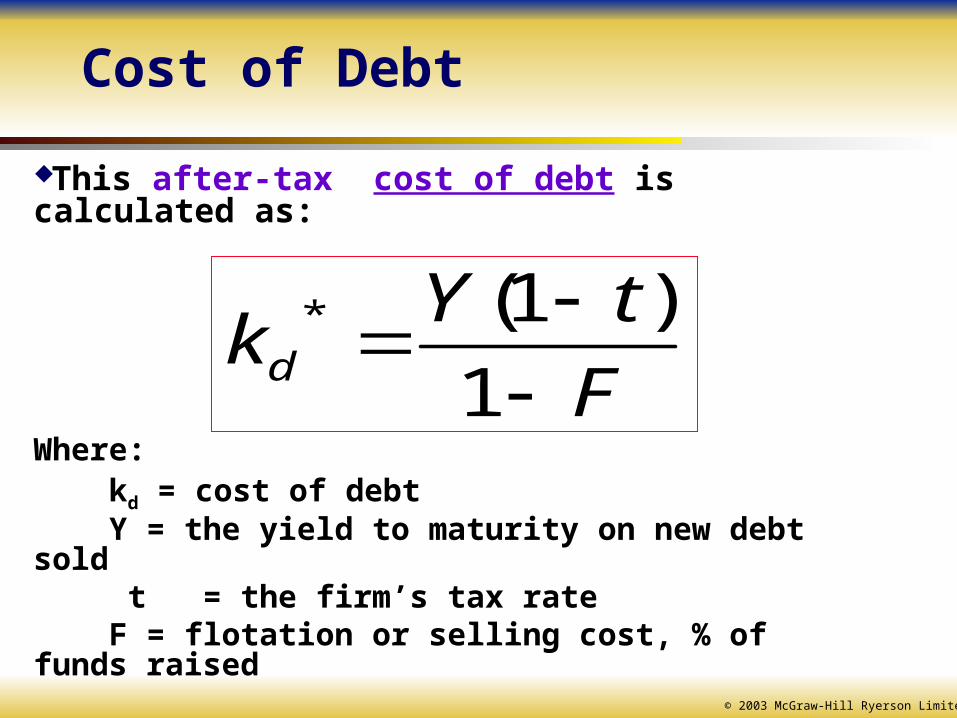
This after-tax cost of debt is calculated as:
Where: kd = cost of debt Y = the yield to maturity on new debt sold t = the firm’s tax rate F = flotation or selling cost, % of funds raised
F
tYkd
1
)1(*
© 2003 McGraw-Hill Ryerson Limited
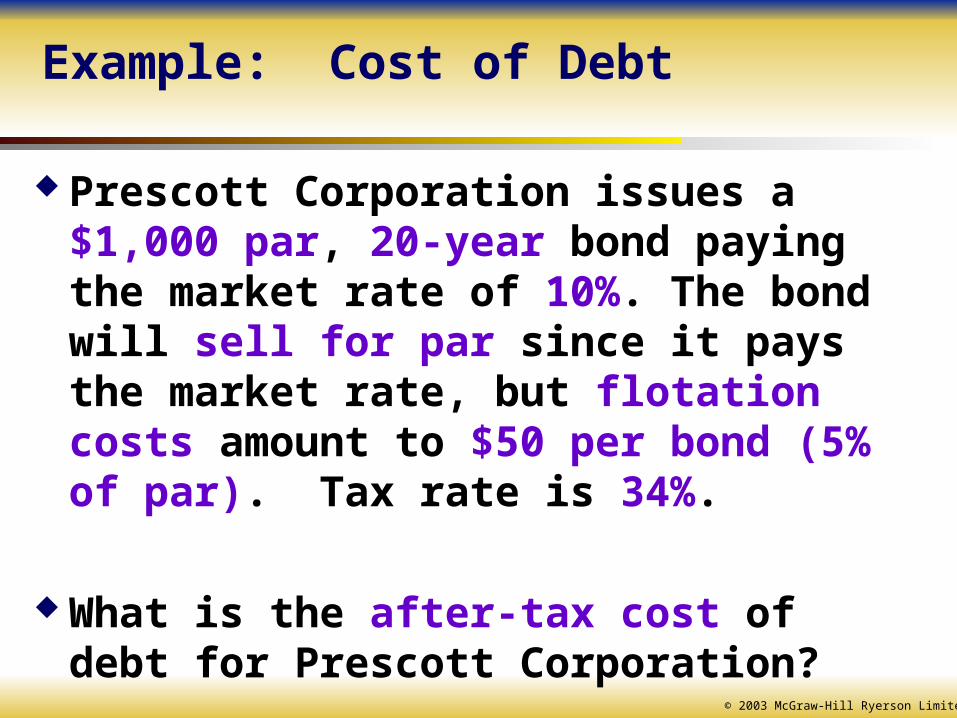
Example: Cost of Debt
Prescott Corporation issues a $1,000 par, 20-year bond paying the market rate of 10%. The bond will sell for par since it pays the market rate, but flotation costs amount to $50 per bond (5% of par). Tax rate is 34%.
What is the after-tax cost of debt for Prescott Corporation?
© 2003 McGraw-Hill Ryerson Limited
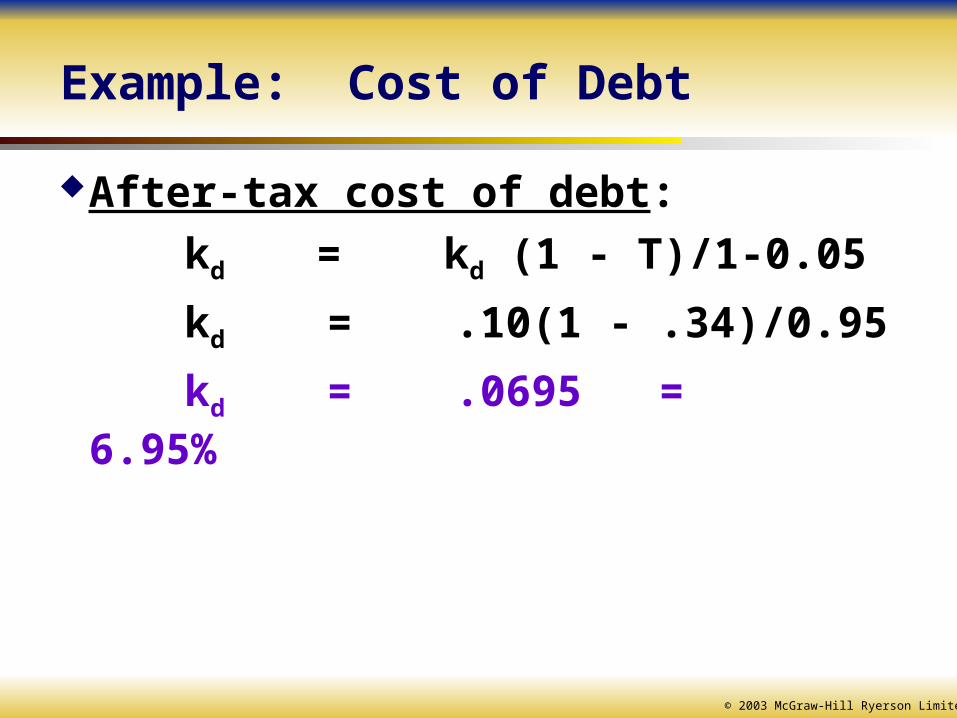
Example: Cost of Debt
After-tax cost of debt:
kd = kd (1 - T)/1-0.05
kd = .10(1 - .34)/0.95
kd = .0695 = 6.95%
© 2003 McGraw-Hill Ryerson Limited
Cost Preferred Stock
We already know about preferred stock that: it has a fixed dividend (similar to debt) it has no maturity date its dividends are not tax deductible and are expected
to be perpetual or infinite
Finding the cost of preferred stock is similar to finding the rate of return, (from Chapter 10) except that we have to consider the flotation costs associated with issuing preferred stock.
© 2003 McGraw-Hill Ryerson Limited
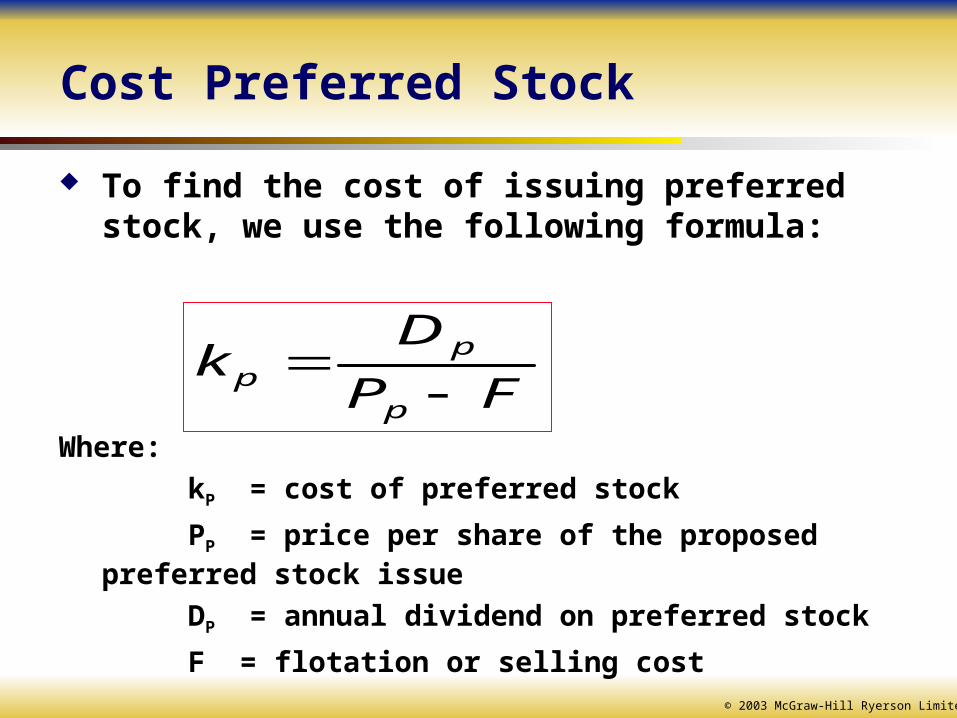
Cost Preferred Stock
To find the cost of issuing preferred stock, we use the following formula:
Where:
kP = cost of preferred stock
PP = price per share of the proposed preferred stock issue
DP = annual dividend on preferred stock
F = flotation or selling cost
FP
Dk
p
pp
© 2003 McGraw-Hill Ryerson Limited
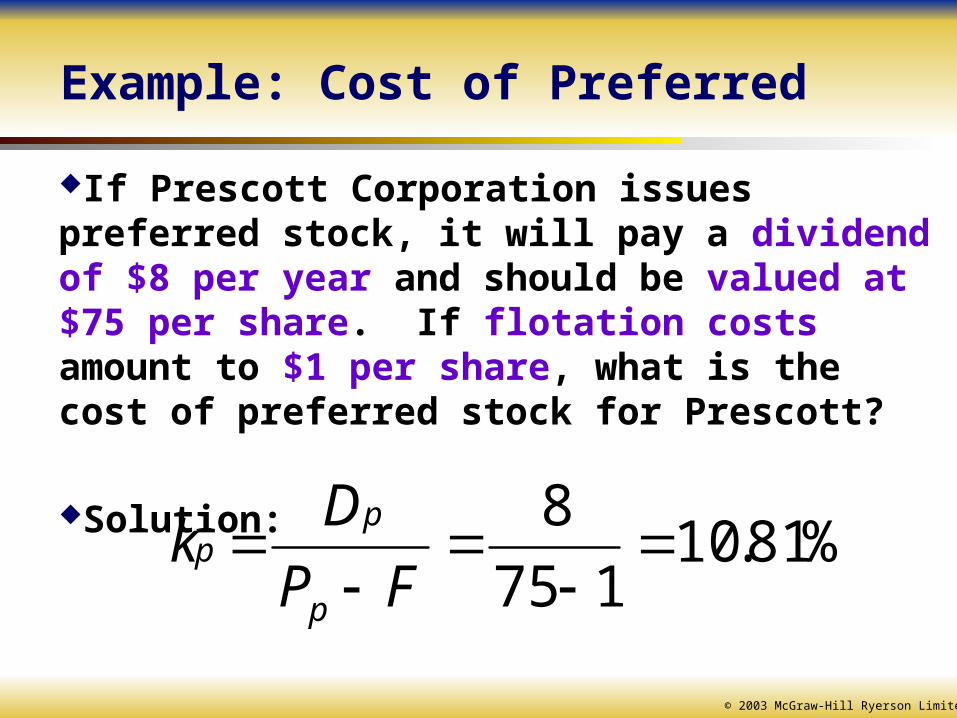
Example: Cost of Preferred
If Prescott Corporation issues preferred stock, it will pay a dividend of $8 per year and should be valued at $75 per share. If flotation costs amount to $1 per share, what is the cost of preferred stock for Prescott?
Solution:
%81.10175
8
FP
Dk
p
pp
© 2003 McGraw-Hill Ryerson Limited
Cost of Common Stock
There are two forms of common equity financing:
1. Reinvested profits (retained earnings); and
2. New issues of common shares.The Cost of Common Equity, ke, is the
required rate of return on common stock and, as such, represents the minimum acceptable rate of return on the equity-financed portion of new projects.
© 2003 McGraw-Hill Ryerson Limited
Cost of Common Stock
By retaining earnings, the company is using common shareholders’ funds.
The Cost of Retained Earnings (Reinvested Profits), kr, is equal to the cost of common equity, ke, as follows:
kr = ke
Therefore, Cost of Retained Earnings is equivalent to the Cost of Common Stock. These two are popularly measured using the following methods:
1. Constant-Growth Dividend Valuation Model (DVM) or Gordon Model
2. The Capital Asset Pricing Model (CAPM)
© 2003 McGraw-Hill Ryerson Limited
Cost of Common Stock
Unlike Cost of New Common Stock, it is not necessary to adjust the Cost of reinvested profits for flotation costs, because these costs are not incurred.
Cost of New Common Stock also uses the DVM Model but takes into account Flotation Costs and other selling costs.
Since dividends are paid from after-tax income, no tax adjustment is required.
© 2003 McGraw-Hill Ryerson Limited
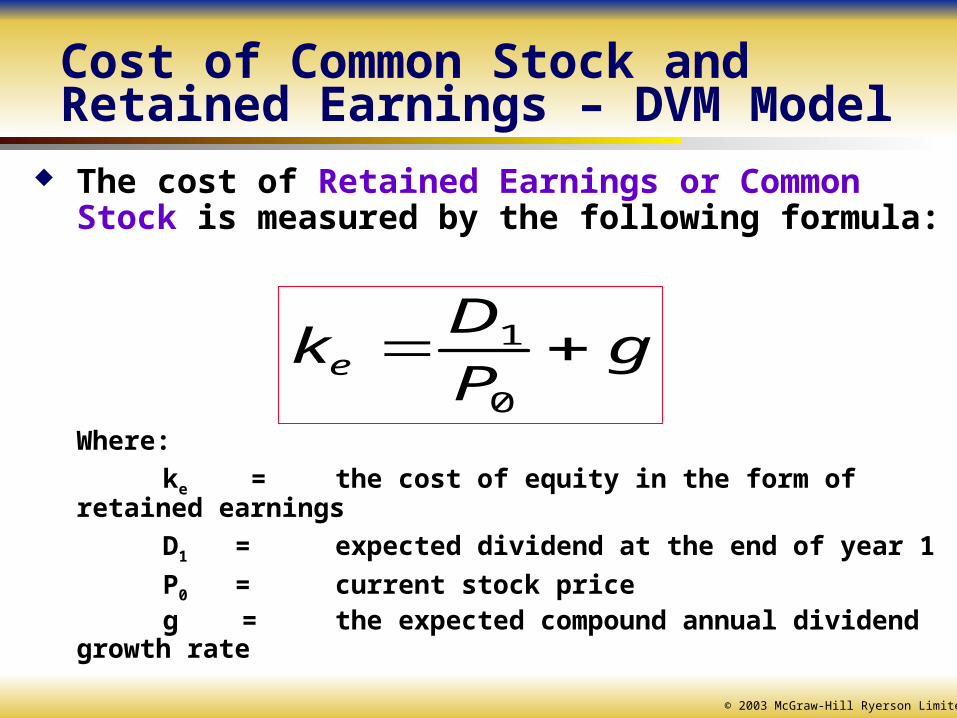
Cost of Common Stock and Retained Earnings – DVM Model
The cost of Retained Earnings or Common Stock is measured by the following formula:
Where:
ke = the cost of equity in the form of retained earnings
D1 = expected dividend at the end of year 1
P0 = current stock priceg = the expected compound annual dividend growth rate
gP
Dke
0
1
© 2003 McGraw-Hill Ryerson Limited
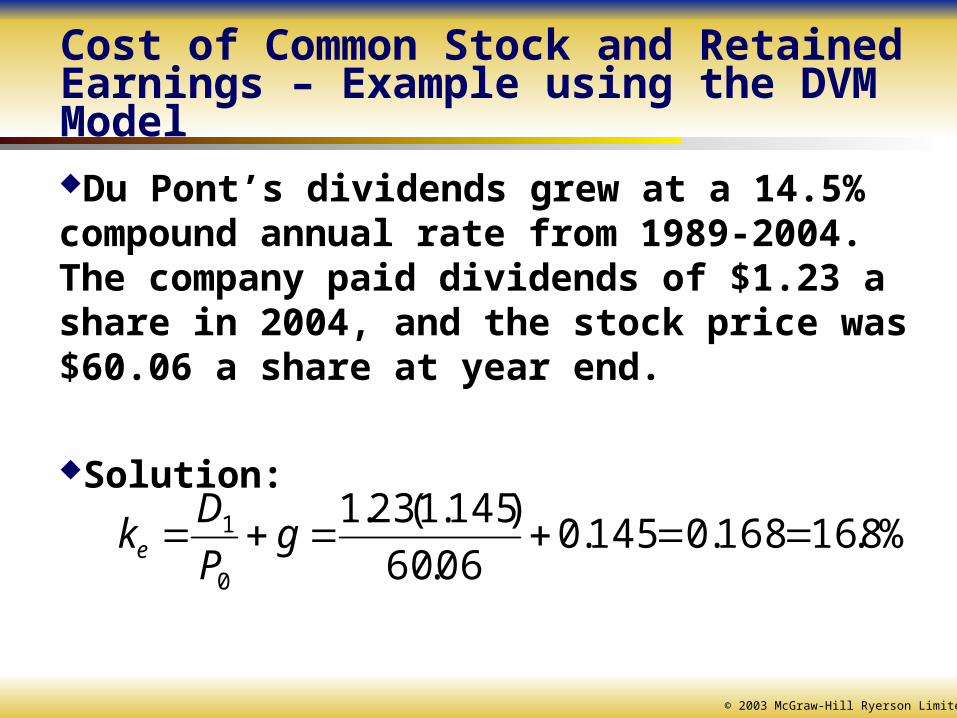
Cost of Common Stock and Retained Earnings – Example using the DVM ModelDu Pont’s dividends grew at a 14.5% compound annual rate from 1989-2004. The company paid dividends of $1.23 a share in 2004, and the stock price was $60.06 a share at year end.
Solution:
%8.16168.0145.006.60
)145.1(23.1
0
1 gP
Dke
© 2003 McGraw-Hill Ryerson Limited
Cost of Common Stock and Retained Earnings – Limitations of the DVM Model
Inappropriate for those firms that either pay no dividends or have erratic dividend payments.
Past dividend growth rates may not be a good predictor of future dividends.
© 2003 McGraw-Hill Ryerson Limited
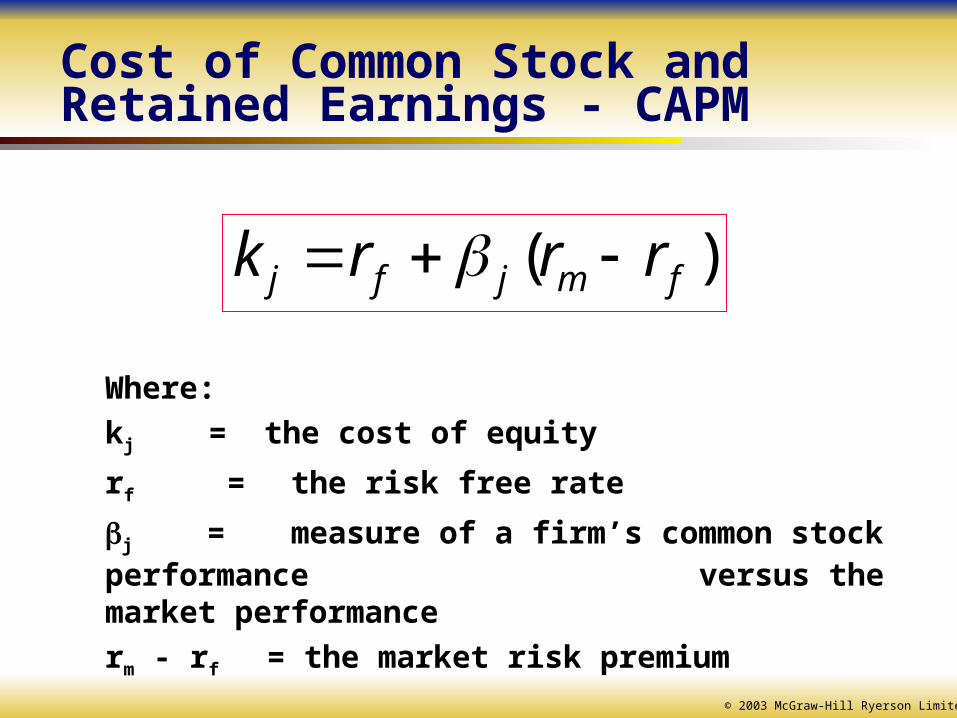
Cost of Common Stock and Retained Earnings - CAPM
Where:
kj = the cost of equity
rf = the risk free rate
j = measure of a firm’s common stock performance versus the market performance
rm - rf = the market risk premium
)( fmjfj rrrk
© 2003 McGraw-Hill Ryerson Limited
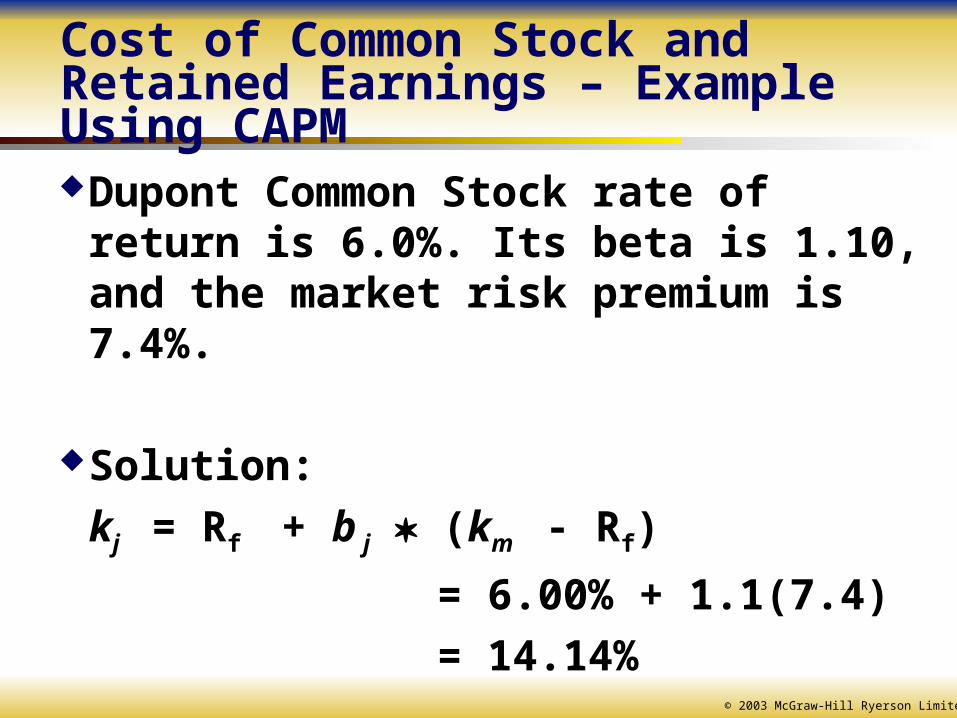
Cost of Common Stock and Retained Earnings – Example Using CAPMDupont Common Stock rate of return is
6.0%. Its beta is 1.10, and the market risk premium is 7.4%.
Solution:
kj = Rf + b j (km - Rf)
= 6.00% + 1.1(7.4)
= 14.14%
© 2003 McGraw-Hill Ryerson Limited
Cost of Common Stock and Retained Earnings- Comparing CAPM and DVM
CAPM directly considers risk, as reflected by beta, in determining the cost of capital.
DVM does not look at risk directly, but uses the market price, P0, as a reflection of the expected risk-return preference of investors.
DVM approach more often used as required data is more readily available.
© 2003 McGraw-Hill Ryerson Limited
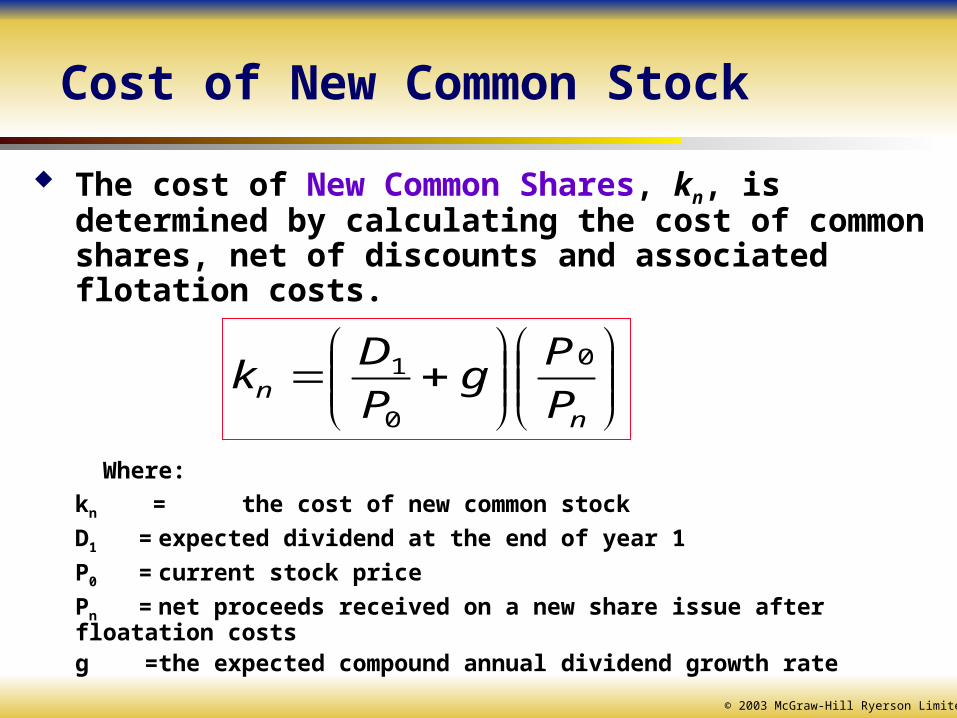
Cost of New Common Stock
The cost of New Common Shares, kn, is determined by calculating the cost of common shares, net of discounts and associated flotation costs.
Where:
kn = the cost of new common stock
D1 = expected dividend at the end of year 1
P0 = current stock price
Pn = net proceeds received on a new share issue after floatation costs
g = the expected compound annual dividend growth rate
nn P
Pg
P
Dk
0
0
1
© 2003 McGraw-Hill Ryerson Limited
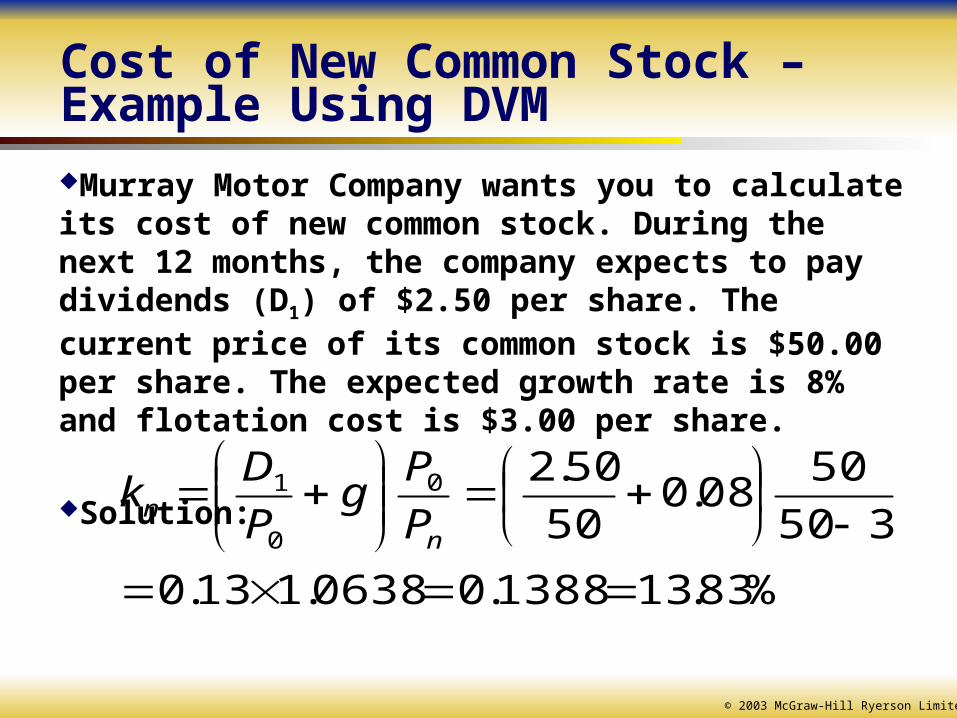
Cost of New Common Stock – Example Using DVMMurray Motor Company wants you to calculate its cost of new common stock. During the next 12 months, the company expects to pay dividends (D1) of $2.50 per share. The current price of its common stock is $50.00 per share. The expected growth rate is 8% and flotation cost is $3.00 per share.
Solution:
%83.131388.00638.113.0
350
5008.0
50
50.20
0
1
nn P
Pg
P
Dk
© 2003 McGraw-Hill Ryerson Limited
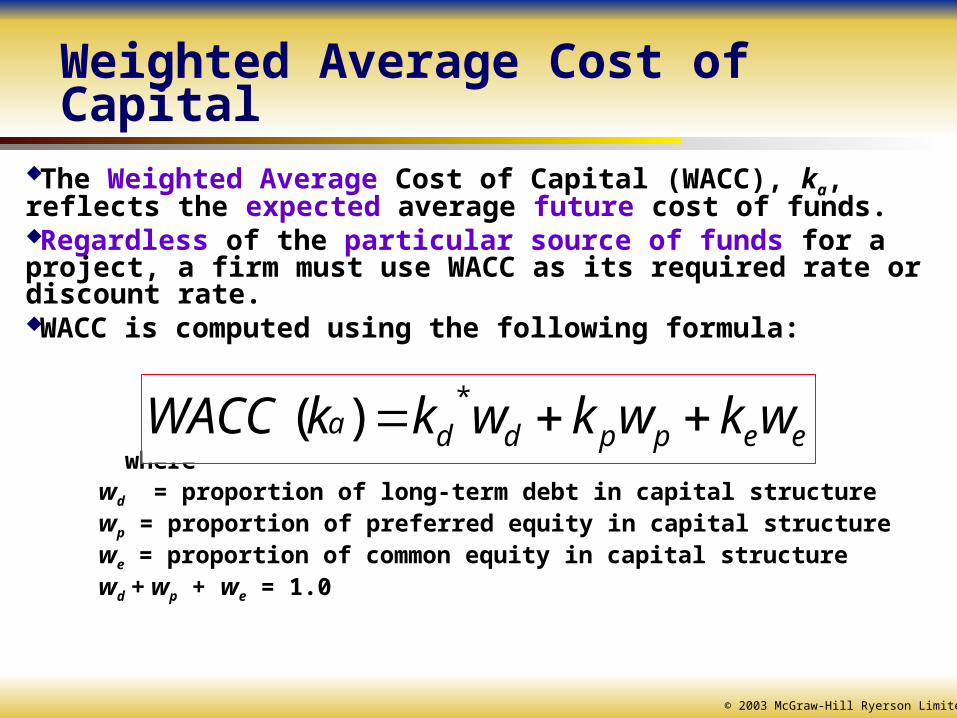
Weighted Average Cost of Capital
The Weighted Average Cost of Capital (WACC), ka, reflects the expected average future cost of funds.Regardless of the particular source of funds for a project, a firm must use WACC as its required rate or discount rate.WACC is computed using the following formula:
where wd = proportion of long-term debt in capital structure wp = proportion of preferred equity in capital structure we = proportion of common equity in capital structure wd + wp + we = 1.0
eeppdda wkwkwkkWACC *)(
© 2003 McGraw-Hill Ryerson Limited
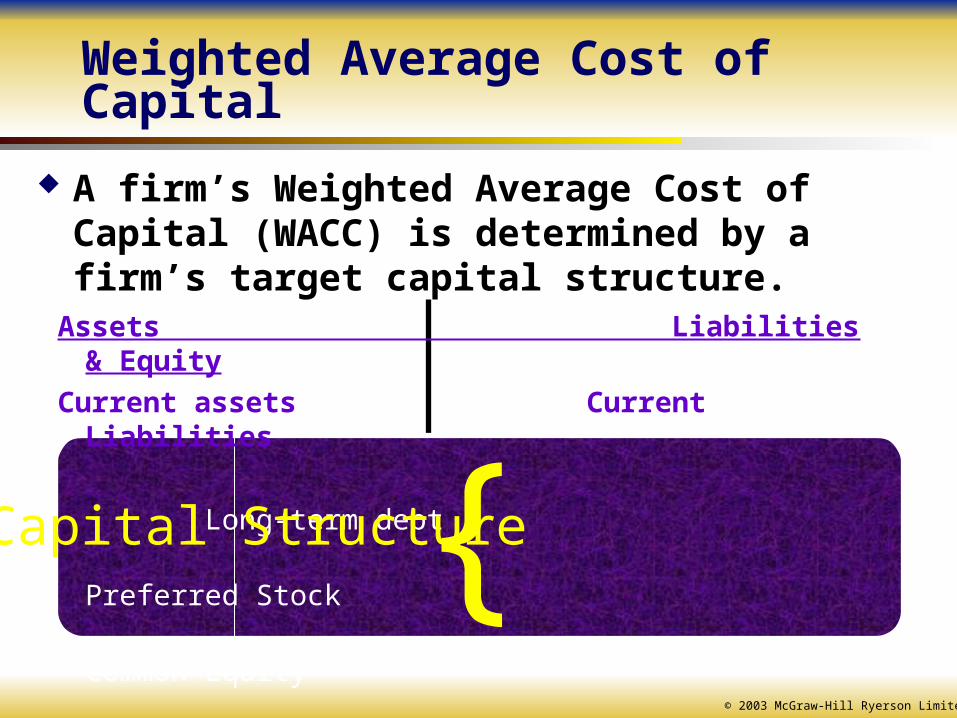
Weighted Average Cost of Capital
A firm’s Weighted Average Cost of Capital (WACC) is determined by a firm’s target capital structure.
Assets Liabilities & Equity
Current assets Current Liabilities
Long-term debt
Preferred Stock
Common Equity
}
Capital Structure
© 2003 McGraw-Hill Ryerson Limited
Weighted Average Cost of Capital
Capital structure is the firm’s mix of debt and equity financing.We measure the cost of capital using the market value of the financing, not the book value.
© 2003 McGraw-Hill Ryerson Limited
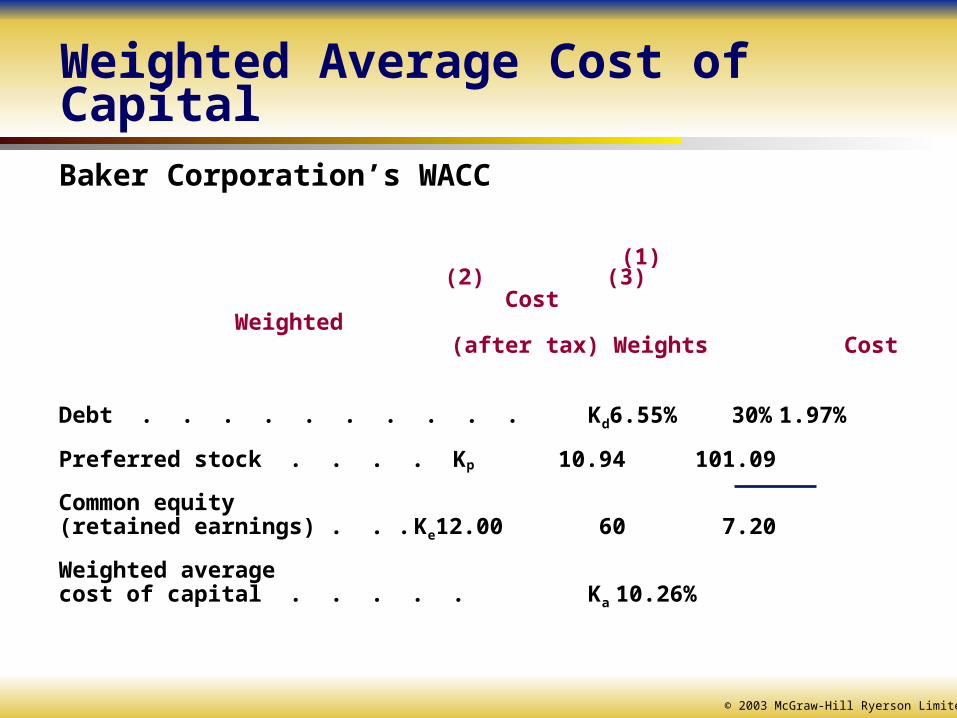
Weighted Average Cost of CapitalBaker Corporation’s WACC
(1) (2) (3) Cost Weighted (after tax) Weights Cost
Debt . . . . . . . . . . Kd 6.55% 30% 1.97%
Preferred stock . . . . Kp 10.94 10 1.09
Common equity(retained earnings) . . . Ke 12.00 60 7.20
Weighted averagecost of capital . . . . . Ka 10.26%
© 2003 McGraw-Hill Ryerson Limited
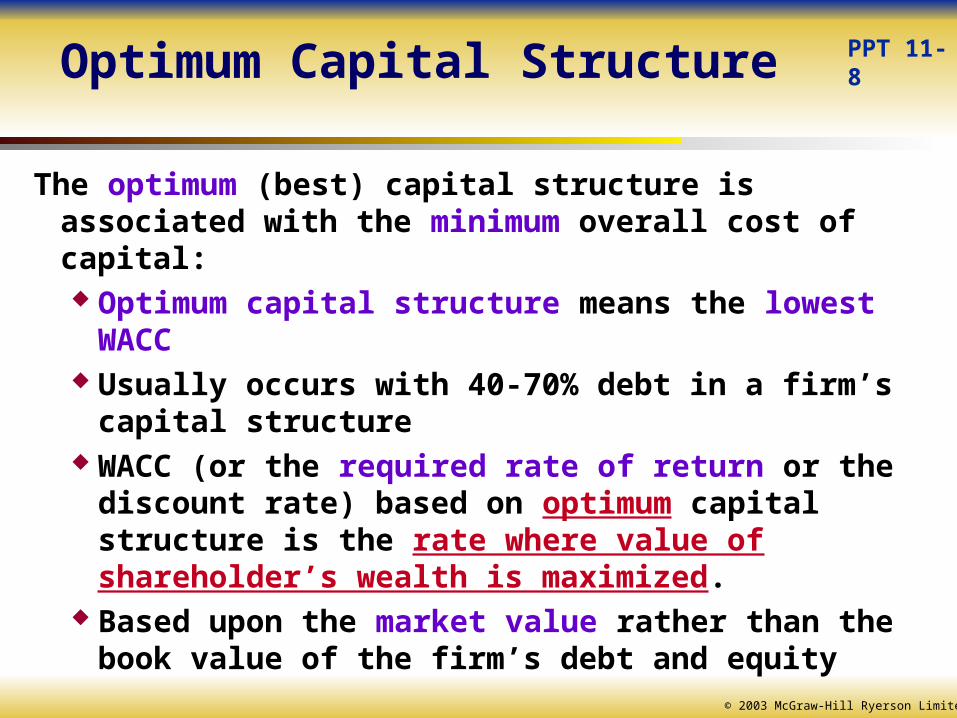
Optimum Capital Structure
The optimum (best) capital structure is associated with the minimum overall cost of capital: Optimum capital structure means the lowest WACC Usually occurs with 40-70% debt in a firm’s capital
structure WACC (or the required rate of return or the discount
rate) based on optimum capital structure is the rate where value of shareholder’s wealth is maximized.
Based upon the market value rather than the book value of the firm’s debt and equity
PPT 11-8
© 2003 McGraw-Hill Ryerson Limited
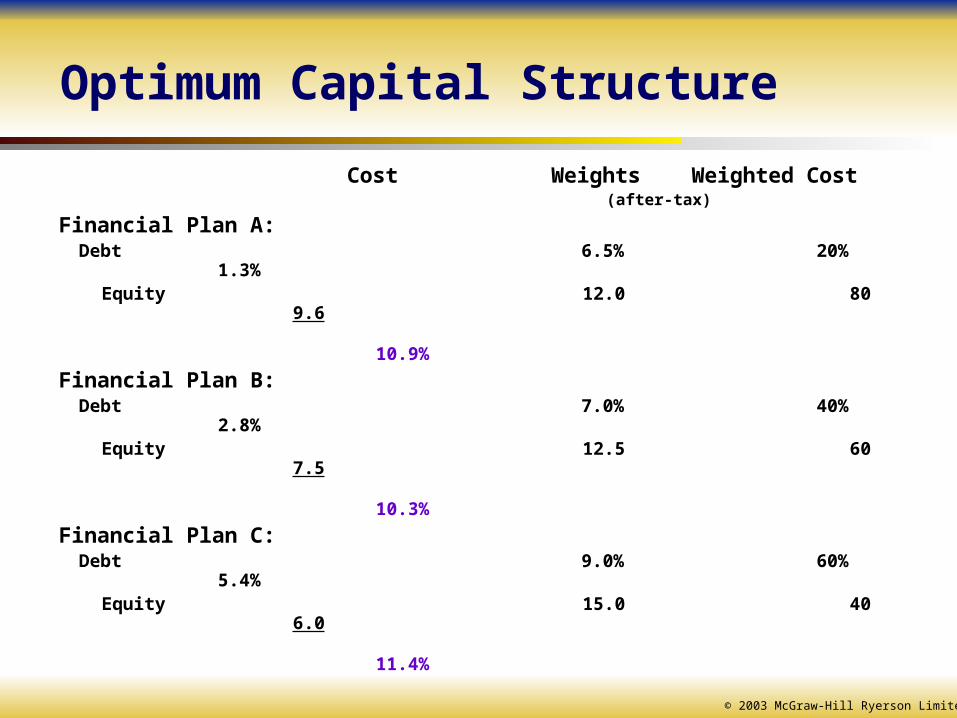
Optimum Capital Structure
Cost Weights Weighted Cost
(after-tax)
Financial Plan A:Debt 6.5% 20% 1.3%
Equity 12.0 80 9.6 10.9%
Financial Plan B:Debt 7.0% 40% 2.8%
Equity 12.5 60 7.5 10.3%
Financial Plan C:Debt 9.0% 60% 5.4%
Equity 15.0 40 6.0 11.4%
© 2003 McGraw-Hill Ryerson Limited
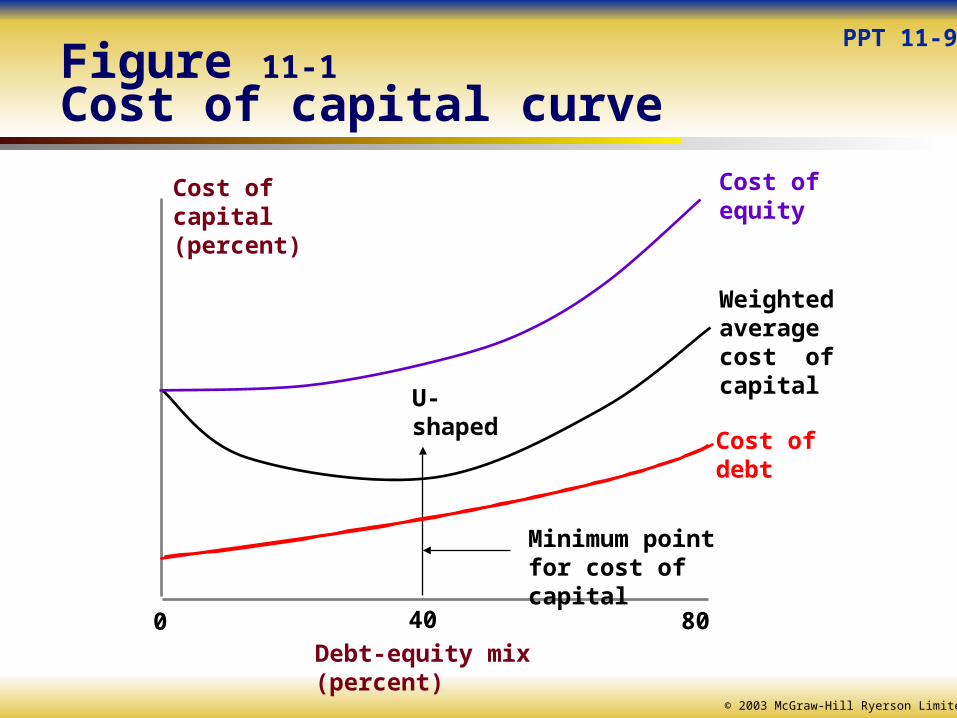
Figure 11-1Cost of capital curve
Cost of capital (percent)
0 40
Debt-equity mix (percent)
U-shaped
Cost of debt
80
Cost of equity
Weighted average cost of capital
Minimum point for cost of capital
PPT 11-9
© 2003 McGraw-Hill Ryerson Limited
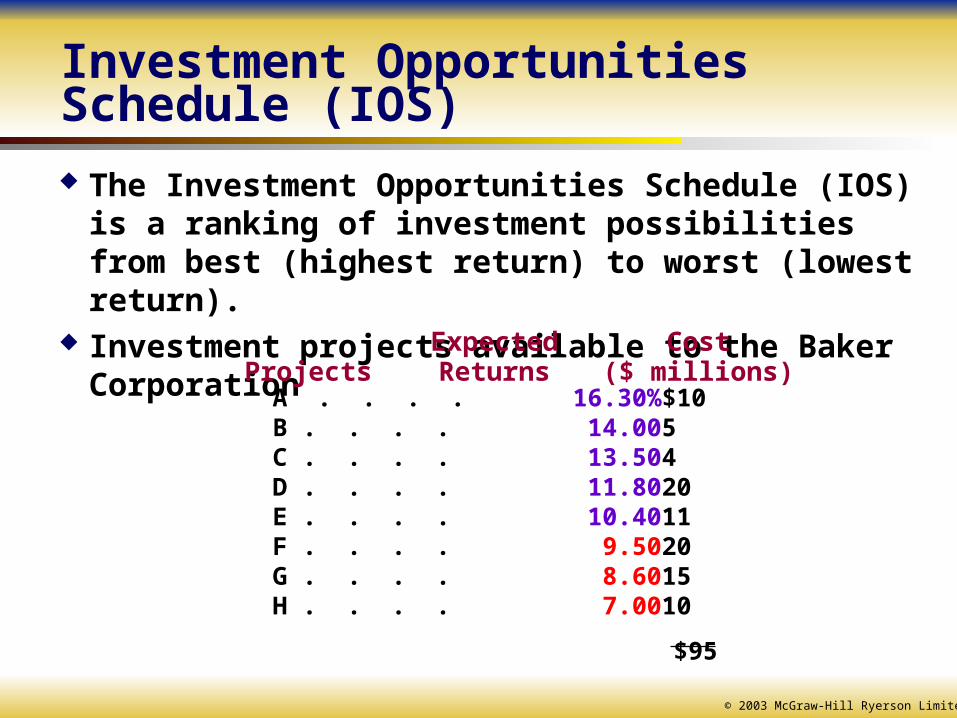
Investment Opportunities Schedule (IOS) The Investment Opportunities Schedule (IOS) is a ranking of
investment possibilities from best (highest return) to worst (lowest return).
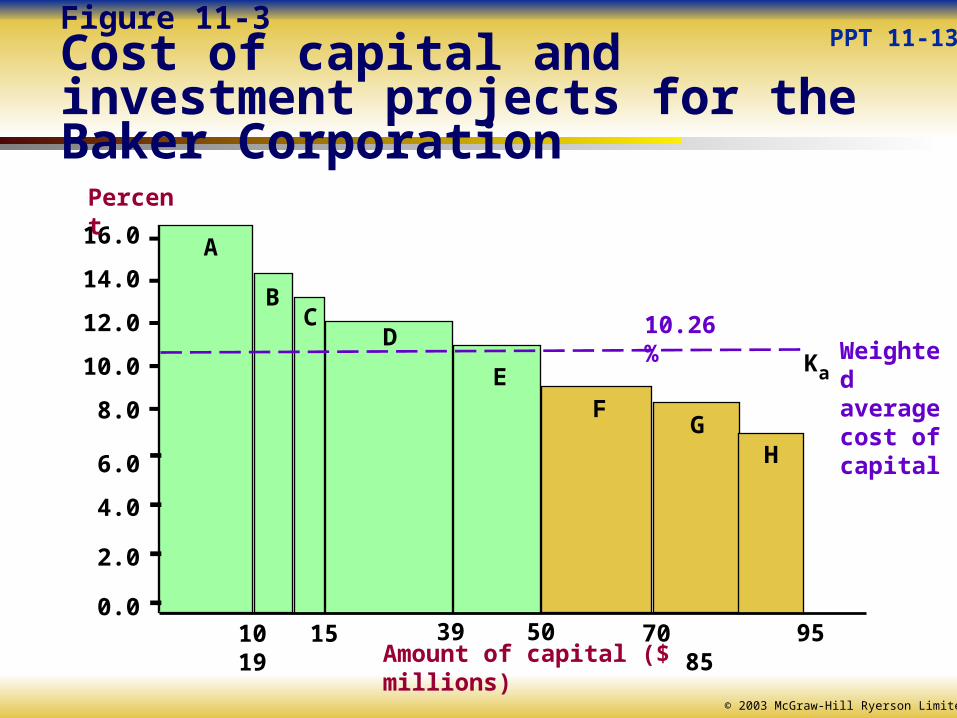
Investment projects available to the Baker CorporationExpected Cost
Projects Returns ($ millions) A . . . . 16.30% $10B . . . . 14.00 5C . . . . 13.50 4D . . . . 11.80 20E . . . . 10.40 11F . . . . 9.50 20G . . . . 8.60 15H . . . . 7.00 10
$95
© 2003 McGraw-Hill Ryerson Limited
PPT 11-13Figure 11-3Cost of capital and investment projects for the Baker Corporation
16.0
14.0
12.0
10.0
8.0
6.0
4.0
2.0
0.0
Percent
10 15 19 5039Amount of capital ($ millions)
10.26%
70 85 95
Weighted average cost of capital
Ka
A
BC
D
EF
GH
-----
----
© 2003 McGraw-Hill Ryerson Limited
Baker Corp has $23.4 M in retained earnings. After $23.4 of RE is exhausted, in order to maintain its
capital structure, the firm must resort to new common equity financing, raising cost of equity financing.
This new WACC is known as the Marginal Cost of Capital, kmc.
The Marginal Cost of Capital (MCC) is the firm’s average cost of capital associated with its next dollar of total new financing.
This happens because as the volume of financing increases, the costs of various types of financing will increase, raising the firm’s weighted average cost of capital.
PPT 11-14
Marginal Cost of Capital
© 2003 McGraw-Hill Ryerson Limited
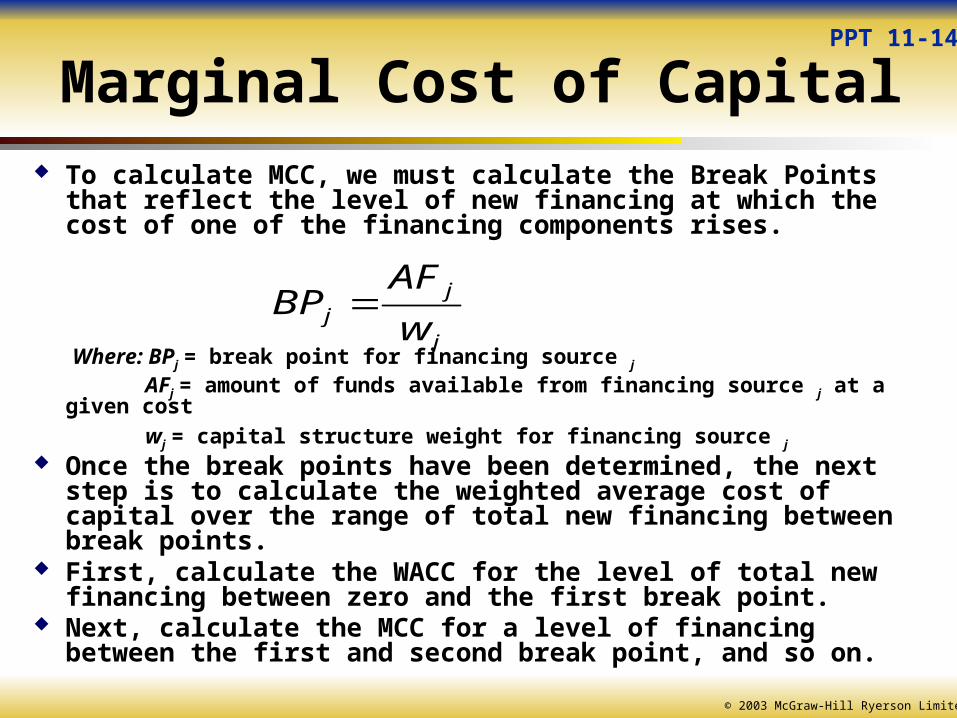
Marginal Cost of Capital To calculate MCC, we must calculate the Break Points that reflect
the level of new financing at which the cost of one of the financing components rises.
Where: BPj = break point for financing source j
AFj = amount of funds available from financing source j at a given cost
wj = capital structure weight for financing source j
Once the break points have been determined, the next step is to calculate the weighted average cost of capital over the range of total new financing between break points.
First, calculate the WACC for the level of total new financing between zero and the first break point.
Next, calculate the MCC for a level of financing between the first and second break point, and so on.
PPT 11-14
j
jj w
AFBP
© 2003 McGraw-Hill Ryerson Limited
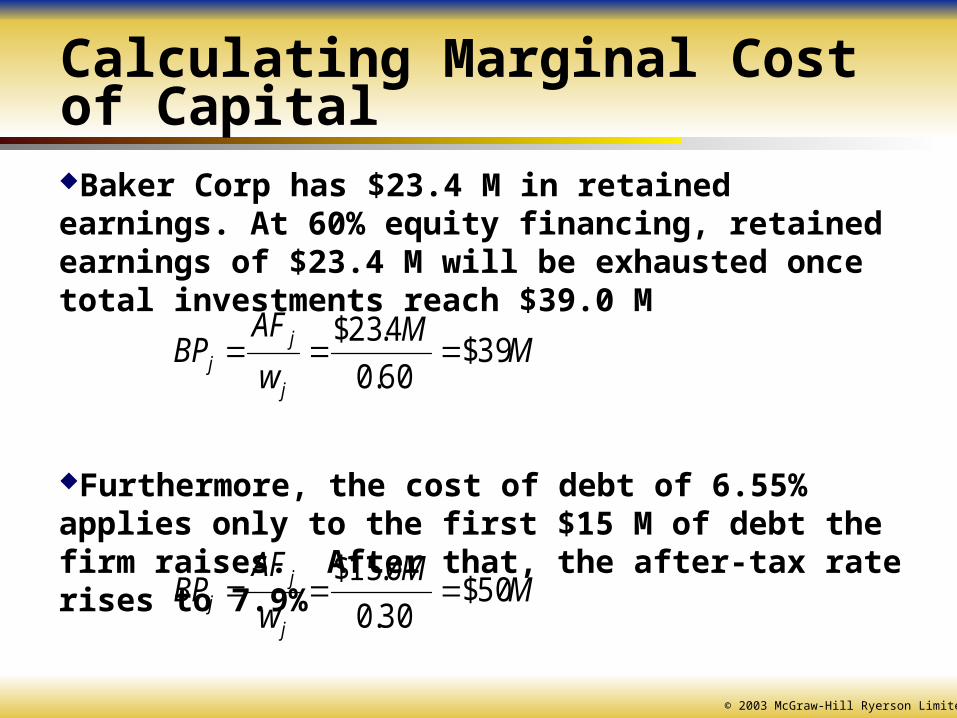
Calculating Marginal Cost of CapitalBaker Corp has $23.4 M in retained earnings. At 60% equity financing, retained earnings of $23.4 M will be exhausted once total investments reach $39.0 M
Furthermore, the cost of debt of 6.55% applies only to the first $15 M of debt the firm raises. After that, the after-tax rate rises to 7.9%
MM
w
AFBP
j
jj 39$
60.0
4.23$
MM
w
AFBP
j
jj 50$
30.0
0.15$
© 2003 McGraw-Hill Ryerson Limited
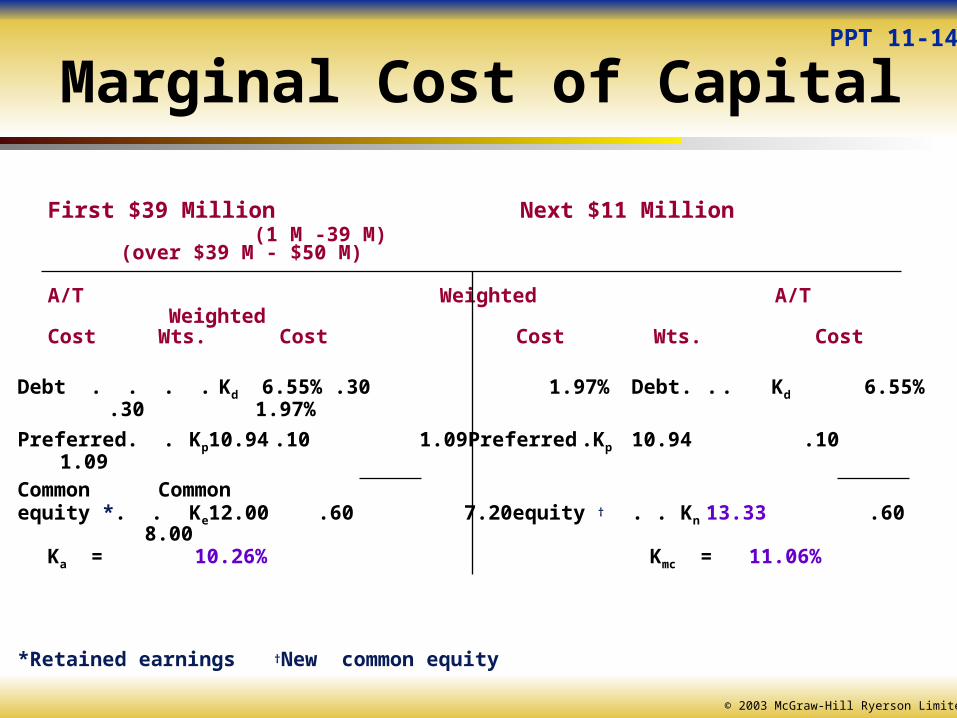
First $39 Million Next $11 Million (1 M -39 M) (over $39 M - $50 M)
A/T Weighted A/T Weighted
Cost Wts. Cost Cost Wts. Cost
Debt . . . . Kd 6.55% .30 1.97% Debt . . . Kd 6.55% .30 1.97%
Preferred. . Kp 10.94 .10 1.09 Preferred . Kp 10.94 .10 1.09
Common Commonequity *. . Ke 12.00 .60 7.20 equity † . . Kn 13.33 .60 8.00
Ka = 10.26% Kmc = 11.06%
*Retained earnings †New common equity
PPT 11-14
Marginal Cost of Capital
© 2003 McGraw-Hill Ryerson Limited
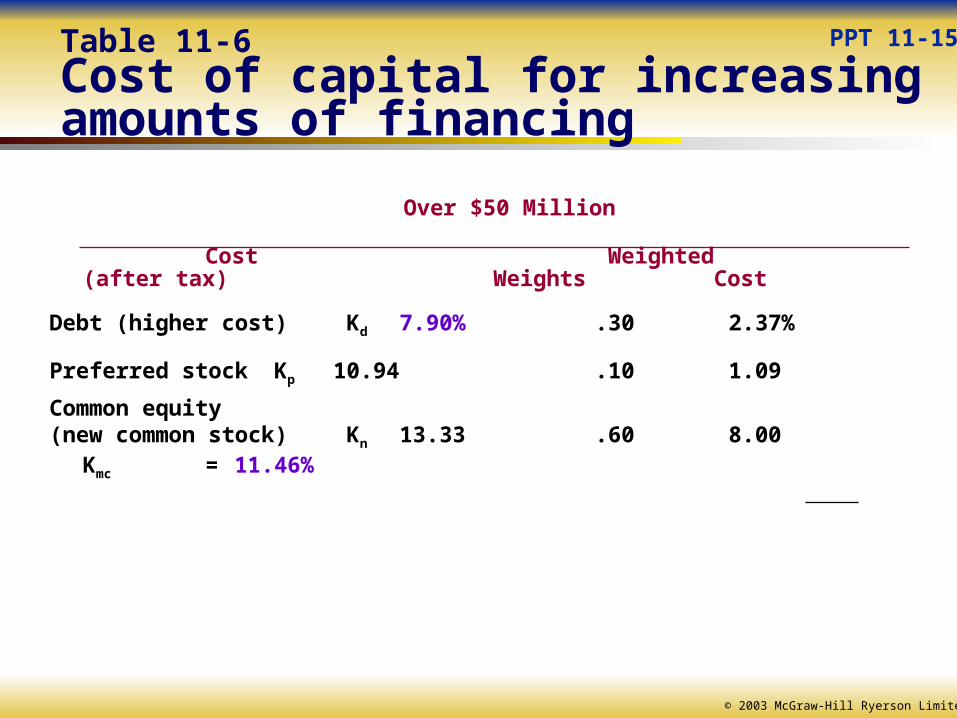
Over $50 Million
Cost Weighted(after tax) Weights Cost
Debt (higher cost) Kd 7.90% .30 2.37%
Preferred stock Kp 10.94 .10 1.09
Common equity (new common stock) Kn 13.33 .60 8.00
Kmc = 11.46%
PPT 11-15Table 11-6Cost of capital for increasing amounts of financing

© 2003 McGraw-Hill Ryerson Limited
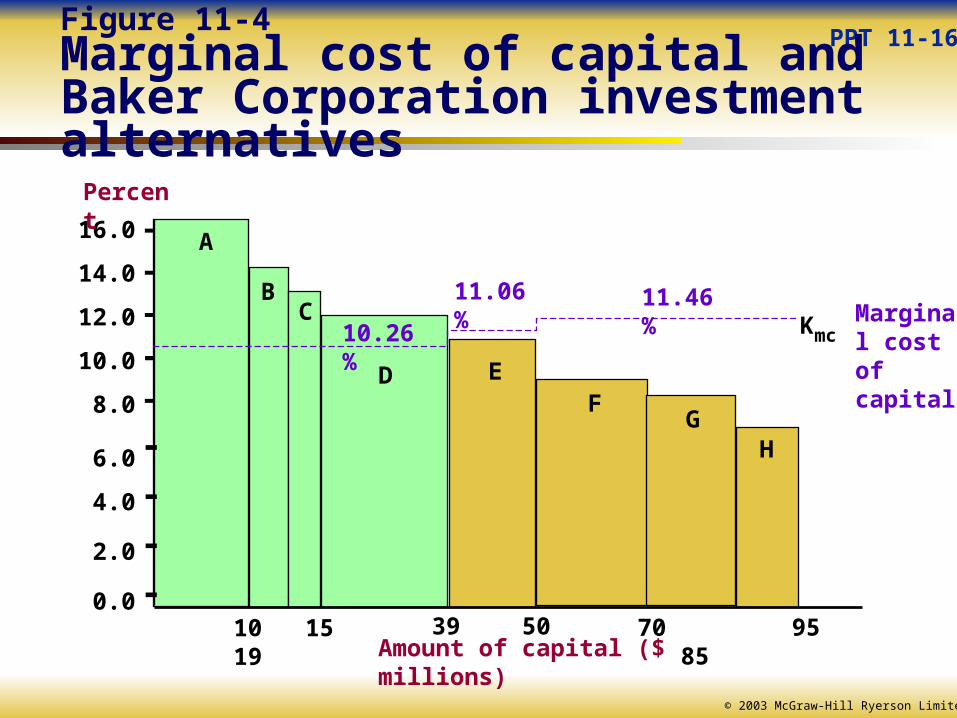
Using MMC and IOS in Decision-Making
When a project’s expected return (internal rate of return) is greater than the marginal cost of new financing, the project should be accepted.
Firms may accept projects up to the point at which the marginal return on its investment equals its marginal cost of capital.
© 2003 McGraw-Hill Ryerson Limited
PPT 11-16Figure 11-4Marginal cost of capital and Baker Corporation investment alternatives
16.0
14.0
12.0
10.0
8.0
6.0
4.0
2.0
0.0
Percent
10 15 19 5039Amount of capital ($ millions)
11.46%
70 85 95
Marginal cost of capital
Kmc
A
BC
D EF
GH
11.06%
10.26%
-----
----
© 2003 McGraw-Hill Ryerson Limited
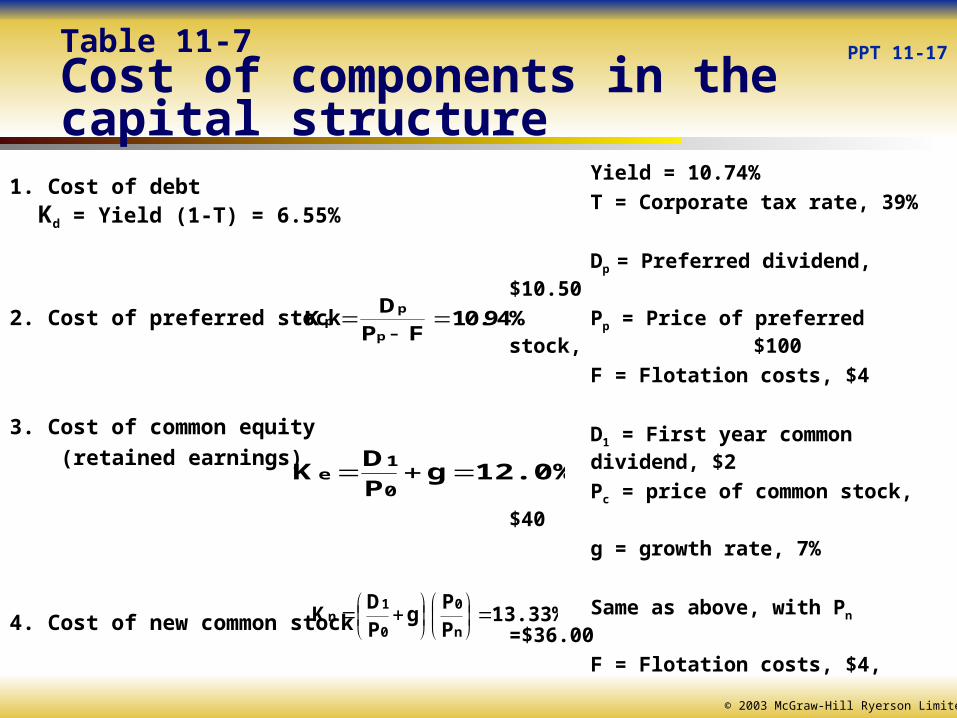
Table 11-7Cost of components in the capital structure
1. Cost of debt Kd = Yield (1-T) = 6.55%
2. Cost of preferred stock
3. Cost of common equity
(retained earnings)
4. Cost of new common stock
KD
P F10.94%p
p
p
Yield = 10.74%
T = Corporate tax rate, 39%
Dp = Preferred dividend, $10.50
Pp = Price of preferred stock, $100
F = Flotation costs, $4
D1 = First year common dividend, $2
Pc = price of common stock, $40
g = growth rate, 7%
Same as above, with Pn =$36.00
F = Flotation costs, $4,
12.0%gPD
K0
1e
13.33%PP
gPD
Kn
0
0
1n
PPT 11-17
© 2003 McGraw-Hill Ryerson Limited
Summary and Conclusions
The cost of debt is the effective interest rate (yield to maturity) the cost of preferred stock is the dividend rate (yield) that must be paid to investorsThe cost of common shares is the current dividend rate (yield) plus the anticipated future rate of growthThe cost of capital from retained earnings is the required rate of return on the common stock The marginal cost of capital is the cost of the next dollar of financing required
PPT 11-31
The cost of capital represents the overall cost of future financing to the firmIt is a weighted average of the costs of the various source of funds availableIt represents the minimum acceptable return from an investment