Embed Size (px)
Citation preview

Sustainable Agriculture Research; Vol. 3, No. 2; 2014 ISSN 1927-050X E-ISSN 1927-0518
Published by Canadian Center of Science and Education
56
X-Ray Fluorescence-Analyzed Mineral Micronutrient DensityVariation Among Kenyan Local Vegetables
Akundabweni Shadeya Levi. M.1, Munene Regina W.2 & Maina David3 1 Department of Crop Science, Faculty of Agriculture and Natural Resources-University of Namibia, Namibia 2 World Food Programme, Kenya 3 Institute of Nuclear Science & Technology, University of Nairobi, Nairobi, Kenya
Correspondence: Akundabweni Shadeya Levi. M., Department of Crop Science, Faculty of Agriculture and Natural Resources-University of Namibia, Namibia. E-mail: [email protected]
Received: July 17, 2013 Accepted: February 18, 2014 Online Published: March 25, 2014
doi:10.5539/sar.v2n3p56 URL: http://dx.doi.org/10.5539/sar.v3n2p56
Abstract
In Africa staple cereal foods are often eaten along with the African Leafy Vegetables (ALVs) rendering meals rich in micronutrients. To increase the mineral micronutrient value, it is imperative to intensify their cultivation given their under-utilized diversity, neglect until needed, slow rate of incorporation into crop value chains for lack clear micronutrient nutrition driven agenda. As a way of focusing on their ionomic nutraceutic attribute potential, the first objective was to investigate accession ionome differentials on the basis a soil mineral criterion.The second objective was to determine a method for variation assessment of ionomic micronutrient dense variants in key Kenyan local vegetables. Four ALVs species constituting 25 accessions were collected in short season rains of 2003 from north and souther stretch of western Kenyaand in early Long rains of 2004 from south eastern Kenya. A stratified sampling design organized had three collection points per farm; on three farms per site; and at three sites per phyto-region. ALV samples together with accompanying soils were Energy Dispersive X-ray fluorescence (XRF) analysed. The data were used, first, for ionomically differentiating populations by way of singling out respective element influenced accession differentials (SELIACDs). Second, elements were jointly resolved into multi-element influenced accession differentials (MELIACDs). Agro-edaphic effects on population ionome niching were assessed using analysis of variance and graphical aids. Geometric means were generated and awarded nutrametric merit scores to allow for nutrametric grading of accessions. Results suggest a great deal of ionomic phenotypic plasticity among the local vegetable accessions as a function at scale of farm, site and/or region soils. The SELIACD method was useful for piecemeal separation of accession on a single element basis but which method would require the development of a selection index with a certainty of a significant genetic gain at the onset. The joint MELIACD and the nutrametric grading methods are proposed as a promising basis for prebreeding tool prioritization given the XRF-analytic novelty and the emerging interest in ALV nutraceutical cropping.
Keywords: ionome differential, eco-ionomes, Energy Dispersive X-ray Fluorescence (XRF), single & multi-element influenced accession differentials, nutrametric quality grades
1. Introduction
1.1 The Distribution and Importance of African Leafy Vegetables in Sub-Saharan Africa
Maize, sorghum and/or millet staple food cereals cooked into African breads are regularly consumed at table together the African Leafy Vegetable (ALV) sauces of which species are reported to be not only diverse (Smith & Eyzaguirre, 2007; FAO, 1988) but also phyto-chemically rich in antioxidants besides vitamins and minerals (van het Hof et al., 1999; Johns & Sthapit, 2004a, 2004b). Most importantly, both minerals and phytochemicals as micronutrients mitigate hidden hunger (IFPRI, 1996; CGIAR, 2002). Indeed, there are over 50 or so known ALVs popularly utilized across the continent with differential regional preferences. It is speculated that the ALV diversity in Africa being that diverse and micronutrient-dense could also address hidden hunger challenge given the emerging facts on their nutraceutical promise.
The distribution may be conceptualized as a sub-Saharan horizontal bar running in west-central-east direction supported by two vertical pillars, one as the left leg (or west) as the reader faces the page and the other as the

www.ccsenet.org/sar Sustainable Agriculture Research Vol. 3, No. 2; 2014
57
right leg (or east) that lies within the southward sub-region part of the continent. The notable diversity spectrum on the horizontal bar includes:
Abelmoschus esculentus, Amaranthus cruentus, Corchorus olitorius, Cucurbita maxima, Vigna unguiculata (cowpea) and Solanum macrocarpon. Others on the ‘bar’ are: Basella alba, Citrullus lanatus, Colocasia esculenta, Hibiscus sabdariffa, Ipomea batatas (leafy types), Manihot esculenta (‘sweet’ cassava leafy cultivars), Solanum aethiopicum, Solanum scarbrum, Talinium triangulare, Vernonia amygdalina and Moringa oleifera. They are most markedly niched across a wide West-Central-Eastern Africatransect. The right ‘leg’ of diversity is niched (although not exclusively) mostly tothe West-Southern Africa transect and includes: Amaranthus caudatus, Amaranthus hybridus and Portulaca oleracea. The left ‘leg’, on the other hand, includes Solanum nigrum, Bidens pilosa and Cleome gynandra (Spider plant) which are more niched to Eastern-Southern Africa transect (Smith & Eyzaguirre, 2007).
Globally, much still remains unknown about the African Leafy Vegetable (ALVs) species. It is in part due to the pre-independent legacy that relegated them as African for Africans. There are efforts to address the impression and which must focus on re-branding them as well as leveraging their marketability within a value chain policy by promoting awareness to the urban upmarket consumers as is taking place in Kenya. Particularly, theirappeal is likely to bear fruit if their micronutrient value for reducing hidden hunger can be demonstrated (see for example Bongiwe & Masuku, 2013; Gackowski et al., 2003; Juma, 2002).
1.2 Soil Minerals and Plant Uptake
Up to 20 or so soil minerals for plant nutrition are categorized as macro- and micro elements. Of the macro, primary ones include N, P, K while secondary macroelements are Mg, Ca and S. Microelements (also called trace minerals) include Mo, Bo, Co, Mn, Fe, Cl, Zn besides Cu, Io and Se. Generally, most plants grow by absorbing the minerals from the soil. The ability depends on the soil pH and also on a plant’s morpho-physiological mineral uptake ability which according to Morgan and Connolly (2013) is a function of: (i) root architecture induction of transport root-based transport systems; (ii) adaptation to changes in the climate and atmosphere; and (iii) enhanced absorption associated with beneficial soil microorganisms. Mineral density in given plant species or variants are expected to vary from place to place (niche adaptation). Such phyto-polymorphic micronutrient mineral density adjustments call for concomitantly obtaining both plant and soil samples under similar growing conditions in order to deal with the nature of the associated genotype-environment interactions.
1.3 Mineral Uptake Niching Across the Eco-Edaphic Differentiation
Generally, macronutrients tend to be less available on acidic soils (low pH). As noted by Chapin III (1989) plants growing on such soils tend to respond in a qualitatively similar way to low availability of macro-elements by reduced acquisition, lower tissue nutrient concentrations (i.e. high efficiency of nutrient use), reduced growth, and effective re-translocation of nutrients from senescing leaves. In effect, such plants may compensate for soil nutrient shortage by increasing their physiological potential to acquire the limiting nutrients. It is to the extent that those adapted to low-nutrient habitats have a high capacity to acquire those nutrients that are mobile in the soil (e.g. potassium. nitrate). On the other hand, they show low capacity to acquire less mobile ions (phosphate, ammonium).
Micronutrients, on the other hand, tend to be less available on relatively alkaline soils (of high in pH). Neumann and Romheld (2001) reported that mobilization of micronutrients (including Mn) into the rhizosphere is due mainly by its acidification and complexation with the organic acids (citrate) in various plant species.
However, as Chapin III (1989) cautioned, there is currently little evidence that those plants adapted to infertile soils have a genetic potential for high rates of carbon or nutrient gain per unit nutrient despite the fact that under conditions of nutrient stress they typically have high efficiency of nutrient use in producing biomass.
In terms of mineral density in plants, variation across the field in soil composition, hydrology and topology can have large effects on the elements that are available for uptake and hence the plants’ inherent tissue concentrations. In effect, with regard to identifying the genetic factors controlling the elemental composition (the ionome) of plants growing in situ, the nature of the soil can create differences likely to mask genetic, variation. For instance according to Tag EI-Din et al.’s Egyptian’s study (1994), there were pronounced distribution influences of rangeland plant communities at varying degrees which were reported to be due to edaphic differences in soil texture, EC, cations of calcium, magnesium, sodium, chloride, bicarbonate anions and surface layer organic matter on vegetation cover and the very low vegetation cover had a soil with high Mg cation in one or more of their profile layers. The pH was low. In particular and to some extent, K cation was none-the-less

www.ccsenet.org/sar Sustainable Agriculture Research Vol. 3, No. 2; 2014
58
proposed as an indicator for distribution.
Soil differences as presented above can, in fact, increase both the false positive rate and false negative rates for mutant identification (Ziegler, 2012) in the likely niching across some eco-edaphic differentiations.
1.4 Health Equity Potential of ALVs Within the Emerging Dimension Nutriceutical Cropping
In terms of a nutraceutical cropping in retrospect to nutrition and health benefits of mineral micronutrients, ALVs also possess significant amounts of phytochemicals such as beta carotene among others (Akundabweni et al., 2008). The term nutraceutical is defined as a food-or part of food- that provides some medical or health benefit(s); including the prevention and/or treatment of a disease (Hardy, 2000; Kalra, 2003). The foregoing has thus triggered a commercial exploration interest among some notable firms in the USA, for instance, in search of new crops in a nutraceutical context. The firms have included Monsanto, American Home Products, DuPont, Abbot Laboratories, Johnson and Johnson, Novartis, Genzyme Transgenic, Interneuron, Warner-Lambert among others (Wildman & Robert, 2001).
Under the Kenyan cuisine culture, where the local ugali bread as a staple food is the norm, ALVs are rapidly gaining ground as an accompanying sauce at table and thus creating a high demand for the greens. Some of the large supermarkets are responding to the demand by engaging some local producers (especially women groups) for contract supply at an incentive pricing. The craze to eat more ALVs in some cases seems to be founded more on a non-scientific heterodoxy than the nutraceutical facts of science which are to date scantly published (Juma, 2000; Smith & Eyzaguirre, 2007; FAO, 1988).
1.5 Energy Dispersive X-Ray Fluorescence (XRF) Analysis as a Tool for ALV Ionomics Study
Extending the ionomics (high through put elemental profiling) approach beyond model systems to field-grown crop plants presents several challenges, one of which at the onset involves devising ways to characterizing multi-element phenotypic variation. Among the techniques for doing this is the use of the XRF technique (Akundabweni et al., 2011a, b). It is possible to capture such variation with the use of X-ray Fluorescence (XRF) spectroscopy. The latter is an analytical tool by which concentrations of certain metal elements can be simultaneously quantified in both organic and inorganic matter without the piecemeal elemental analyses which by ‘wet’ chemistry procedures require skill, money, an assortment of laboratory confined apparatus and time. The XRF technique works on the following principle: Since each element in the analysed material tends to possess a unique set of energy levels, it produces x-ray photons at a unique set of energies, allowing one to non-destructively measure the elemental composition of a given sample (Tertian & Claisee, 1982; Bertin, 1975). In most cases, no expensive reagents or time-consuming procedures are required.
1.6 Problem Statement
Despite what is known about the ALVs in retrospect to their place as the inevitable sauces for African breads, many are still perceived in importance mostly in times of dismal need.In crop value chains terms, limited windows exist for their sustainability by way of conservation for use and the vice versa. Thus, ALVs warrant further research given that: (a) the diversity as distributed in the region to date remains underutilized; (b) hardly as a priority few if any of the ALVs are a research-driven subject for tangible crop improvement programming and (c) Agro-economic investments into their upgrading by value adding strategies are still in their infancy as is the case in Kenya.
1.7 Objectives of the Study
With the above in mind, the first objective was to separate accession ionome differentials on the basis a soil mineral criterion. The second objective was to develop an omnibus phenotype characterization criterion by way of accession allocation to a nutrametric merit grading novelty.
2. Methodology
2.1 Data Collection
The study involved accession collection from the Northwest–Southeast transect in Kenya. Phyto-region I was north Western Kenya (Bungoma). Region II closest to Lake Victoria (around Kisumu) was considered as the south Western Kenya. Both I and II lie in the moist mid-latitude agroclimatic zone (Figure 1). Sites of Region I (in Bungoma County) were Nalondo, Kanduyi and Chwele, Bungoma. They were identified on the basis of the observation that the area represents one of the richest ALV diversity in Kenya (Juma, 2002). Region II designated Neewa, Esivalu and Maseno as the sites typically found within the Lake Basin.Region III was the south- eastern part of Kenya (in Kibwezi County) which typically falls within the Kenyan semi-arid lands within a dry transitional agroclimate zone to which three collection sites belonged; namely: Kaseme, Lukenya and Masongoleni (Figure 1).
www.ccsenet.org/sar Sustainable Agriculture Research Vol. 3, No. 2; 2014
59
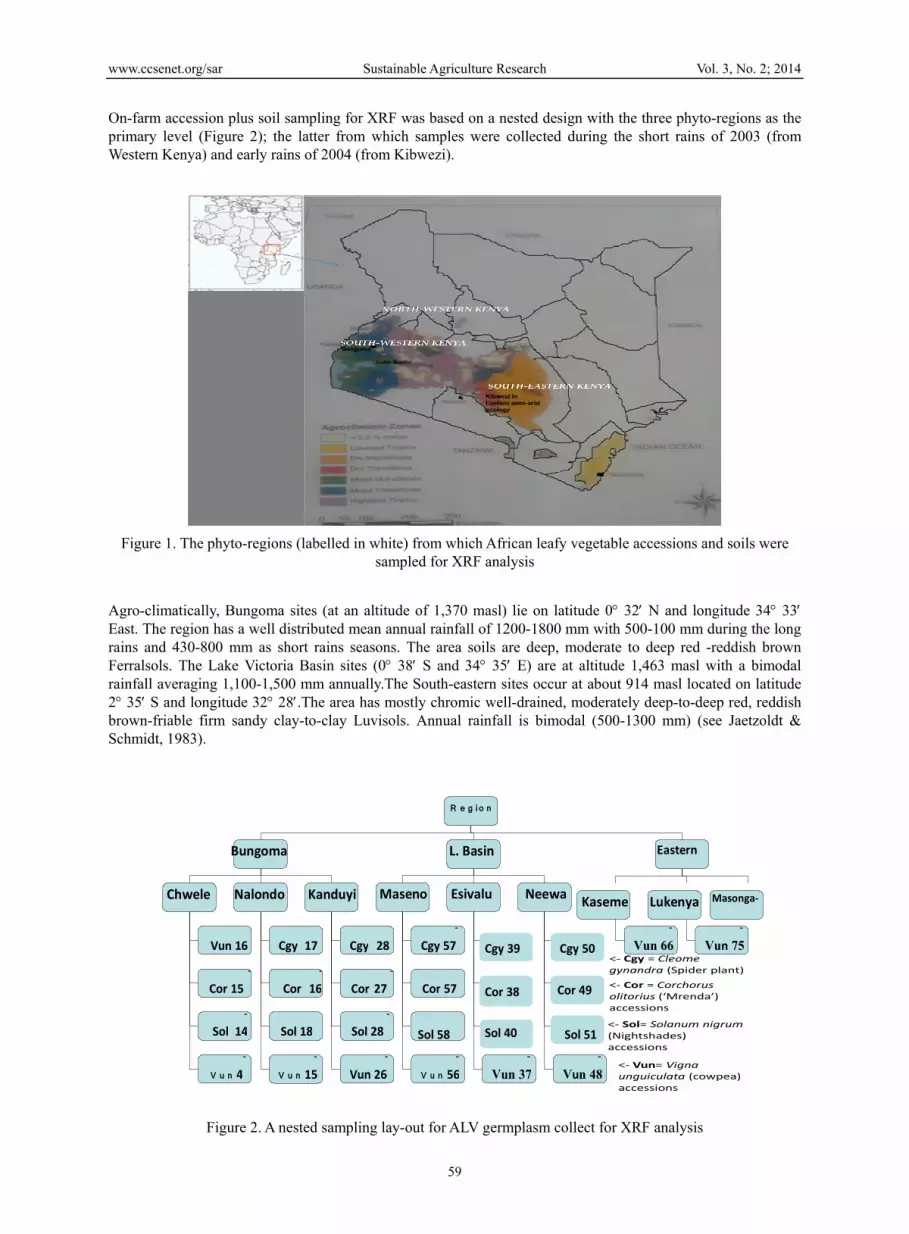
On-farm accession plus soil sampling for XRF was based on a nested design with the three phyto-regions as the primary level (Figure 2); the latter from which samples were collected during the short rains of 2003 (from Western Kenya) and early rains of 2004 (from Kibwezi).
Figure 1. The phyto-regions (labelled in white) from which African leafy vegetable accessions and soils were sampled for XRF analysis
Agro-climatically, Bungoma sites (at an altitude of 1,370 masl) lie on latitude 0 32 N and longitude 34 33 East. The region has a well distributed mean annual rainfall of 1200-1800 mm with 500-100 mm during the long rains and 430-800 mm as short rains seasons. The area soils are deep, moderate to deep red -reddish brown Ferralsols. The Lake Victoria Basin sites (0 38 S and 34 35 E) are at altitude 1,463 masl with a bimodal rainfall averaging 1,100-1,500 mm annually.The South-eastern sites occur at about 914 masl located on latitude 2 35 S and longitude 32 28.The area has mostly chromic well-drained, moderately deep-to-deep red, reddish brown-friable firm sandy clay-to-clay Luvisols. Annual rainfall is bimodal (500-1300 mm) (see Jaetzoldt & Schmidt, 1983).
-
Vun 66
-
Vun 75
-
V u n 15
-
Vun 26
-
V u n 56
-
Vun 37
-
Vun 48
-
V u n 4
R e g i o n
Bungoma L. Basin Eastern
Chwele Nalondo Kanduyi
Vun 16
-
Cor 15
-
Sol 14
Cgy 17
-
Cor 16
Sol 18
Cgy 28
-
Cor 27
-
Sol 28
Maseno Esivalu Neewa
-
Cgy 57
Cor 57
Sol 58
Cgy 39
Cor 38
Sol 40
Cgy 50
Cor 49
Sol 51
Kaseme Lukenya
Masonga‐
<‐ Vun= Vignaunguiculata (cowpea) accessions
<‐ Sol= Solanum nigrum(Nightshades) accessions
<‐ Cor = Corchorusolitorius (‘Mrenda’) accessions
<‐ Cgy = Cleome gynandra (Spider plant)
Figure 2. A nested sampling lay-out for ALV germplasm collect for XRF analysis

www.ccsenet.org/sar Sustainable Agriculture Research Vol. 3, No. 2; 2014
60
2.2 XRF as the Analytic Technique
An accession and its adjoining soil for each of the three species was collected from three spots (3 reps) per farms of three farms randomly picked for sampling within a site. The collections were subsequently prepared according to the established analytic procedures at the University of Nairobi X-ray Fluorescence (XRF) spectroscopy station. Samples were oven-dried at 80 C for 18-20 hours. Each sample was repeatedly fine-ground to less than 50 m sieve-size, weighed to between 100 - 200 mg cm2 from which three pellets of 2.5 cm diameter were made in a pellet-pressing machine under 10-15 ton of pressure. The pellets were subjected to XRF spectroscopic analysis according to the protocols described in Sparks (1975). Each pellet was irradiated with a primary radiation from a Cd-109 radioactive source for a period of 2500 seconds.
For each pellet, two irradiations were done; sample alone and sample with a molybdenum target on top. These two measurements were then used to calculate the absorption corrections.
The characteristic x-rays emitted by the elements in the sample were detected by a liquid nitrogen cooled Si (Li) detector. The resolution of the Si (Li) detector used was 195 eV for manganese (Mn) K line at 5.9 keV.A computer based multichannel analyser was used for spectral data collection and storage while the Quantitative X-ray Analysis System (XQAS/AXIL), a software programme supplied by the International Atomic Energy Agency (IAEA), was used for data deconvolution (the latter being analgorithm-basedprocess used to reverse the effects of convolution on recorded data). The concept of deconvolution is widely used in the techniques of signal processing and image processing.
2.3 Data Analysis
Following the generation of XRF data, Analysis of Variance (ANOVA) was conducted within each variation-picking element treated as an independent variable upon which the vegetable cultivar (accession) mineral micronutrient density differences were identified.
Element means and standard deviations of mineral concentrations for each sample accession and the accompanying soil minerals were computed to discern differences across regions/sites using both the SELIACID and MELIACD methods (Figure 3).
Figure 3. Data processing stages for determining single element-influenced accession differentials (SELIACDs) and multi-element influenced accession differentials (MELIACDs)
Legand: Lines broken vertically by two dots represent element influenced accession identification; e.g. Accession A, B, C, D, E; Horizontal continuous lines represent multi-element influenced accession identifications leading to grading them nurtrametrically by way of the various data assessment stage (DAS) 1, 2, 2 and 4.

www.ccsenet.org/sar Sustainable Agriculture Research Vol. 3, No. 2; 2014
61
The ubiquitous K (primary macro-nutrient) and Ca (the secondary macronutrient) together with the highly XRF expressed Fe, Mn, Zn Se and Cu peaks of concentrations were used as the variation sensing minerals (see Figure 3). Agro-edaphic effects on population ionome niching were assessed in terms of Farm Level Soil Context Referencing (FL-SCORE) analysis of variance. Additionally, data were also subjected to analysis of variance for site (SL-SCORE) and for region (RL-SCORE) levels.
Subsequently geometric mean computations were undertaken according to the association principle described by Cooper and Schindler (2005) for the discernment of multi-element micronutrient contextualized density grades. Use of the geometric mean was intended to take into account differences in macro- and microelements across accessions densities as it was reasoned as thus: a trace mineral dimension might not, for example, be anymore linearly compensated for by high mineral concentration in a macro-element dimension. In which case, the geometric mean (GM) was consequently chosen as a way of reducing the level of substitutability between macro- and micro elemental densities while at the same time ensuring that a certain magnitude of concentration in one elemental dimension of the same accession had the same impact on the magnitude of the other dimension.
Table 1. A subjective method used to allocate nutrametric merits and mineral density grades among the accessions of the African leafy vegetables from the XRF derived geometric mean values
GM values pre-arranged at following intervals:
No. of nutrametric merits assigned as thus:
Multi-element contextualized density grades
< 1.00 -
1.0 -1.4 9 High Density Grade (HDG 9)
1.5-1.9 8 HDG 8
2.0-2.4 7 HDG 7
2.5-2.9 6 Mid Density Grade (MDG 6)
3.0-3.4 5 MDG 5
3.5-3.9 4 MDG4
4.0-4.4 3 Low Density Grade (LDG 3)
4.5-4.9 2 LDG 2
>5.0- 1 LDG 1
Thus, as a basis for comparisons of differential densities, the geometric mean method was perceived as being more respectful of the intrinsic differences across the macro and micro-elemental (MELIACD) dimensions than a simple SELIACD average.
3. Results and Discussion
3.1 Niching Across the Eco-edaphic Differentiation as Indicated by Farm-. Site- and Region Crop Level Mineral Specific Indicator(s)
Farm level soil (by element-specific indicator) context referencing (FL-SCORE) revealed significant (p< .0001) farm level edaphic influences due to K, Ca, Mn, Fe, Zn and Cu on populations (i.e. accessions) (Table 1). On the other hand, site level soil context referencing (SL-SCORE) due to soil Ca and/or Cuindicators did not reveal any significant (p< .0001) site level edaphic influences on populations. Similarly, based on RS-SCORE, there were no significant differences due to soil Zn implications at accessions.

www.ccsenet.org/sar Sustainable Agriculture Research Vol. 3, No. 2; 2014
62
Table 2. A six mineral 1-way analyses of variance (ANOVAs) for assessing soil mineral eco-edaphic implications at farm, site or region levels
Eco-ionomes as dependent Variables (Y)
Source of variation (X) (in mean ppm)
Soil K (30,134.6)
Soil Ca
(14,378.5)
Soil Mn
(1,736.3)
Soil Fe
(859.3)
Soil Zn
(64.1)
Soi Cu
(9.2)
FL-SCORE *** *** *** *** *** ***
SL-SCORE * ns *** *** *** ns
RL-SCORE *** * *** ** ns *
CV % 17. 2 32.5 13.1 19.7 21.1 23.7
* refers to statisticalsigficance at p < 0.5; ** at p < 0.01; *** at p < 0.0001; FL-SCORE= Farm level soil context referencing; SL-SCORE= Site level soil context referencing; RL-SCORE Region level soil context referencing.
Higher CVs in Table 1 as given for Ca (32.5%) and Cu (23.7%) suggest greater variable dispersion around their respective means.
In light of the Table 2 leaf mean concentrations according to various eco-levels are as presented in Table 3.
Table 3. Accession niching across the eco-edaphic differentiation as indicated by farm- site- and region crop level mineral specific indicator(s)
4(a): Accession ionome differentials
Bungoma sites (in ppm)
Lake basin sites (in ppm)
1. Solanum Chwele farms
Nalondo farms
Kanduyi farms
Maseno
farms
Neewa farms Esivalu farms
by K 24,400 (6) 89,567 (1) 40,933 (3) 29,667(4) 42,900 (2) 25,600 (5)
by Ca 5,967 (6) 25,633 (1) 22,070 (3) 10,307(5) 10,967 (4) 23,633 (2)
by Mn 145 (4) 137 (5) 198 (3) 205 (2) 247 (1) 52 (6)
by Fe 787 (4) 1,513 (1) 111 (6) 886 (3) 1,036 (2) 310 (5)
by Cu 7(4) 14 (1) 8 (3) 8 (3) 6 (5) 10 (2)
By Zn 70 (3) 63(5) 73 (1) 71 (2) 65(4) 34(6)
Statistical Mode
4 1 3 Variable Variable Variable
4(b): Accession ionome differentials
Bungoma sites (in ppm)
Lake basin sites (in ppm)
2. Corchorus Chwele farms
Nalondo farms
Kanduyi farms
Maseno
farms
Neewa farms Esivalu farms
by K 21,467(4) 21,067 (5) 21,800 (3) 39,233(1) 22,100 (2) 19,367 (6)
by Ca 7,543 (6) 11,633 (4) 15,017 (1) 12,733(2) 12,300 (2) 8,500 (5)
by Mn 55 (3) 40 (5) 48 (4) 91 (1) 77 (2) 48 (4)
by Fe 739 (2) 271 (4) 268 (5) 695 (3) 777 (1) 268 (5)
by Cu 11 (1) 10 (1) 11 (1) 9 (3) 7 (4) 11 (1)
By Zn 48 (2) 29 (4) 87 (10) 24 (5) 35 (3) 86 (1)
Statistical Mode
Variable
Variable Variable Variable 2
Variable

www.ccsenet.org/sar Sustainable Agriculture Research Vol. 3, No. 2; 2014
63
4(c): Accession ionome differentials
Bungoma sites (in ppm)
Lake basin sites (in ppm)
3. Cleome Chwele farms
Nalondo farms
Kanduyi farms
Maseno
farms
Neewa farms Esivalu farms
by K 30,633 (5) 37,933 (1) 37,800 (2) 30,833(4) 30,867 (3) 24,533 (6)
by Ca 13,843 (4) 16,100 (2) 15,267 (3) 10,633(6) 12,157 (5) 21,300 (1)
by Mn 200 (2) 154 (5) 154 (5) 231 (1) 199 (3) 17 (4)
by Fe 1009 (6) 1,160 (3) 1,160 (3) 1,817 (1) 1,113 (5) 1,557 (2)
by Cu 7 (3) 9 (1) 9 (1) 8 (2) 8 (2) 7 (3)
By Zn 87 (1) 82 (3) 35 (4) 86 (2) 29 (5) 24 (6)
Statistical Mode
Variable
Variable Variable Variable Variable
Variable
4(d): Accession ionome differentials
Bungoma sites (in ppm)
Lake basin sites (in ppm)
South Eastern (Kibwezi)
4. Cowpea Chwele farms
Nalondo farms
Kanduyi farms
Maseno
farms
Neewa farms
Esivalu farms
Kaseme
farms
Lukenya
farms
by K 36,267 (2)
37,733 (1)
13,033(7)
26,600(4)
28,333(3)
19,533(6)
19,533 (5)
11,766(8)
by Ca 12,413 (5)
12,000 (6)
10,373(7)
13,857(4)
25,400(1)
21,167(2)
19,667 (3)
3,363 (8)
by Mn 278 (5) 113 (7) 93 (8) 1,027 (1) 491 (2) 286 (4) 174 (6) 313 (3)
by Fe 333(7) 518 (4) 392 (6) 835 (2) 1690 (1) 534 (3) 422 (5) 202 (8)
by Cu 12 (4) 9 (5) 11 (3) 13 (2) 14 (1) 7 (6) 6 (7) 7 (6)
By Zn 84 (5) 153 (1) 110 (2) 104 (3) 55 (3) 82 (6) 92 (4) 16 (8)
Statistical Mode variable Variable Variable Variable Variable Variable Variable Variable
Soil-ALV element concentration (p < 0.0001) associations.
As shown by their r values in Figure 4 Pearson correlations were highly significant between soil elements.

www.ccsenet.org/sar Sustainable Agriculture Research Vol. 3, No. 2; 2014
64
Figure 4. Soil- soil element content correlations in retrospect to all highly significant (p < .0001) leaf-leaf correlations
According to Figure 5, soil Fe (> 30,000 ppm) was 30 times more than that of the leaf Fe. Soil Mn (1,800 ppm) compared to leaf Mn was at least 20 times more in the soil than in leaf concentration. K and Ca were three and four times, respectively more in the leafy portion than in the soil.
Figure 5. The dual purpose (SELIACD-cum-MELIACD) method employed in delimiting accessions

www.ccsenet.org/sar Sustainable Agriculture Research Vol. 3, No. 2; 2014
65
Both significant and non-significant correlations between high leaf element density and soil mineral content are presented in Table 2. It is shown that soil K and Ca which tended to occur in the leaf many times more than in the soil were generally not correlated with other soil elements. On the other hand, soil Mn and Fe shown to be higher than in the leaf were highly significantly correlated between the two and the other trace elements.
Table 4. Correlation coefficients (N=78) of soils categorized as showing less than and more content thanleaf
Content Status Soil Ca Soil Mn Soil Fe Soil Cu Soil Zn
Soil K exceeded by uptaken K group
0.47698*
P<.0001
-0.15198
P< 0.1841
0.01504
P<0.8961
-0.02886
P<0.802
-9311
P<0.4175
Soil Ca exceeded by uptaken Ca group
-
0.1019
P<0.3747
0.20868
P<0.0667
0.17273
P<0.1305
0.08146
P<0.4783
Although weakly associated, leaf element densities were significantly (p < 0.01) correlated (Table 4) once they got into the plants from their respective channels from the soil.
Table 5. Inter-element Pearson Correlation Coefficients, N=78, among leaf densities
Leaf Concentration Leaf Ca Leaf Fe Leaf Cu Leaf Zn
Leaf K r = 0.41(p < 0.0002) r = 0.51(p<.0001) r= 0.34 (p<.002) r = 0.23 (p <.04)
Leaf Ca r = 0.36(p<0.001) r = 0.29 (p<.009) r = 0.24 (p<.03)
Leaf Mn r= 0.28 (p < 0.01) r= 0.79 (p<.001)
Leaf Fe r = 0.57 (p<.0001)
Table 6. A demonstration of how intraspecifically the eco-ionomes (accessions) were assigned nutrametric merit gradesin the cowpea leafy vegetable accessions on a MELIACD criterion of screening/characterization
Geometric Mean Merit range
No. of merits on a 10-point scorecard basis
Accession label of Vignaunguiculata
Eco-edaphic source of collection
< 1.00
1.0 -1.4 9 = HDG Un-detected
1.5-1.9 8= HDG Neewa G48-Cp (1.6) Lake Basin eco-region
Maseno G55-Cp (1.9)
2.0-2,4 7= HDG ChweleG4-cp (2.23)
25-2.9 6= MDG Nalondo- G15-Cp (2.8) Bungoma eco-region
3.0-3.4 5= MDG Esivalu G37Cp (3.3) Lake Basin &Kibwezi respectively Kaseme G66-Cp (3.4)
3.5-3.9 4=MDG Un-detected
4.0-4.4 3= LDG Kanduyi G26-Cp (4.4) Bungoma eco-region
4.5-4.9 2= LDG Lukenya G75-Cp (4.8) Kibwezi eco-region
>5.0- 1= LDG Un-detected
HDG= High density grades; MDG = Mid density; and LDG = Low Density Grades.

www.ccsenet.org/sar Sustainable Agriculture Research Vol. 3, No. 2; 2014
66
3.2 When the Environmental Component as an Influence on Accession Differentiation Is Overlooked
3.2.1 Singling Out Respective Element Influenced Accession Differentials (Seliacds) as the Attributes of Interest
The within row rankings by element within farms across sites and/or regions do lack a consistent mode suggestive of high intra- as well as inter-element variability or when the farm or site or eco-region environmental dimension disregarded, Figure 4 demonstrates the inter-specific ranking of the ALV accessions along each element density criterion which shows the position change in rank across elements. The figure confirms that although the leaf mineral density is somewhat correlated, the individual elements did not exist in the leaf organ as one package, hence the context of SELIACD as one way of piecemeal element-based ionomic phenotyping.
3.2.2 Resolving Test Elements Into Multi-Element Influenced Accession Delimitations (MELIACDs)
Figure 6. A proposed prebreeding tool development decision quadrant deriving from the potential value of the
MELIACD and the nutrametric grading methods
Figure legend: CWP = Cowpes; CORC = Corchorus; SOL = Solanum; CLM = Cleome; LUK = Lukenya-Kibwezi; KDY = Kanduyi, NLD = Nalondo-& CHW = Chwele in Bungoma; MSN = Maseno, NEW = Neewa and ESV = Esivalu (in Maseno).
3.2.3 Implications
Results suggest a great deal of ionomic phenotypic plasticity among the local vegetable accessions as a function at scale of farm, site and/or region soils. The SELIACD method was useful for piecemeal separation of accession on a single element basis but which method would require the development of a selection index as expected, the leaf ionomes neither enter plant organs as a package nor in a ‘henpecking’ order as each element possesses its unique differential mobility and site localization. For instance, Ca and Cu are found in cytoplasm at very low concentrations as well as being relatively immobile in the phloem. Over 50% Cu is, in fact, localized in chloroplasts bound to the blue protein and more of a role in vegetative growth than in any other organ. Fe, Zn, Cu and Mn micro-elements uptake are likely to be commonly affected by an alkaline pH which if it goes beyond a certain threshold may impart to a soil a higher unavailable concentration than the bioavailable density in plant organs. It is the elements rather than the pH with its own independent edaphic and/or phytic action thatmay lead the course to possible niche differentiations among plant communities or species. To an extent, therefore, SELIACD’s usefulness as a precedent to developing a prebreeding tool may be limited to single ionomic focus since it is apparent that no single element can be regarded as adominant criterion to which the others are significantly corrected so that it can pig-bag with the rest of the elements. In retrospect, it is a method which to be practical would require the development of a selection index with a certainty of a significant genetic gain at the onset.
4. Conclusions
The joint MELIACD and the nutrametric grading methods are proposed as a more promising basis relative to SELIACD for prebreeding tool prioritization given the desire for the novel XRF-analysis to do more than simply determining ionomic concentrations. The proposed MELIACD and the nutrametric grading methods could be used

www.ccsenet.org/sar Sustainable Agriculture Research Vol. 3, No. 2; 2014
67
to bulk the rest of low nutrametric grades for conservation while keeping the high grades as core collections with a view to using in ALV crop improvement programmes for nutraceutical ALV cropping. Figure 6 appears to shed prudence on four pre-breeding tool (pre-pbT prioritization decisions as thus as: (i) Collection and conservation of those populations identified as low nutrametric grades to receive low (pre-PbT) prioritization; (ii) those identified as somewhat high grades but agronomically wanting (for example) to receive low pre-PbT prioritization; (iii)those identified as low nutrametric grades but already receiving high prepb T priority for one reason or another; and finally (iv) those identified as superior nutrametric grades grades worth matching with high prepbT prioritization.
5. Recommendations
Given that there is a surge of interest in mineral micronutrient density in selecting and developing crop plants that are efficient in the uptake and utilization of mineral elements, the findings in this study provide only preliminary in-roads.Recommendations around the study with the leads it has provided are that we engage the powerful tools of genetics and biotechnology to focus on ALVs so as to speed the efforts in searching for understanding and implementation of practical uses of the information found.
Acknowledgements
We acknowledge the financial support from International Plant Genetic Resources Institute (IPGRI) to our student Ms Regina MuneneWanjiru for her M.Sc. field work that immensely contributed to this project. We are grateful to the technical support staff the at the Institute of Nuclear Science and Technology laboratory at the University of Nairobi for all help and interest in this work. The direct interest by the Director of the Institute, David Maina, for his personal participation and assigning an agriculture bench at the Institute and even an office is gratefully appreciated.
References
Akundabweni, L. S. M., Mulokozi, G., & Maina, D. M. (2010). Ionomic Variation Characterizationin African Leafy Vegetables for Micronutrients Using XRF and HPLC. AJFAND, 10(11), 4320-4339.
Bertin, E. P. (1975). Principles and Practice of X-ray Spectrometric Analysis (2nd ed.), New York, NY: Plenum Press. http://dx.doi.org/10.1007/978-1-4613-4416-2
Bongiwe, G. X., & Masuku, M. B. (2013). An Analysis of the Vegetables Supply Chain in Swaziland. Sustainable Agriculture Research, 2(2), 1-10. http://dx.doi.org/10.5539/sar.v2n2p1
Chapin III, F. Stuart. (1987). Genetic Aspects of Plant Mineral NutritionDevelopments in Plant and Soil Sciences, 27, 15-25. http://dx.doi.org/10.1007/978-94-009-3581-5_2
Cooper, D. R., & Schindler, P. S. (2005). Instruments for Participant Communication In Sources and Collection of Data (p. 354). Business Research Methods. Tata McGraw-Hill Publishing Co.
CGIAR. (2002). New Delhi Biofortified crops for improved human Nutrition: A challenge Program proposal presented by International Center for Tropical agriculture (CIAT), International Food Policy Research Institute (IFPRI) on behalf of an International Consortium of Collaborative Partners.
Food and Agriculture Organization of United Nations. (FAO). (1988). Traditional food plants. A resource book for promoting the exploitation and consumption of food plants in arid, semi-arid and sub-humid lands of Eastern Africa (pp. 458-466). FAO Food and Nutrition paper 42. FAO, Rome.
Gackowski, J., Mbazo, J., Mbah, G., & Moulende, T. (2003). African traditional leafy vegetables and the urban and peri-urban poor. Food Policy, 28, 221-235. http://dx.doi.org/10.1016/S0306-9192(03)00029-0
Hardy, G. (2000). Nutraceuticals and functional foods: introduction and meaning. Nutrition, 16(7-8), 688-9. http://dx.doi.org/10.1016/S0899-9007(00) 00332-4
IFPRI. (1996). CGAIR Micronutrient Project Update NO. 1. International Food Policy Institute, Washington, D.C.
International Atomic Energy Agency (IAEA). (1997). Sampling, storage and sample preparation for X-ray fluorescence analysis of environmental material, IAEA Tech Doc-950 pp. 5-10.
International Food Policy Institute (IFPRI). (1996). CGAIR Micronutrient Project Update NO 1. Washington, DC.
Jaetzoldt, R., Schmidt, H., Schmidt, H., & Hornetz, B. (1983). Farm Management Handbook of Kenya: II, Part A: West Kenya, Nairobi Ministry of Agriculture; Kenya.
Johns, T., & Sthapit, B. (2004a). Bio-cultural diversity in the sustainability of developing country food systems.

www.ccsenet.org/sar Sustainable Agriculture Research Vol. 3, No. 2; 2014
68
Food and Nutrition Bulletin, 25, 143-155.
Johns, T. (2004b). Plant Bio-diversity and malnutrition: Simple solutions to complex problems: Theoretical Basis for the Development and Implementation of a Global Strategy Linking Plant Genetic Resource Conservation and Human Nutrition. African Journal of Food, Agriculture, Nutrition and Development.
Juma, C. (2002). Sustaining tropical agriculture. Nature, 415, 960-961. http://dx.doi.org/10.1038/415960a
Morgan, J. B., & Connolly, E. L. (2013). Plant-Soil Interactions: Nutrient Uptake. Nature Education Knowledge, 4(8), 2.
Neumann, G., & Romheld, V. (2001). The release of root exudates as affected by the plants physiological status. In R. Pinto, Z. Varanini & P. Nannipieri (Eds.). The rhizosphere: Biochemistry and organic substances at the soil-plant interface (pp. 41-93). Marcel Dekker. New York.
Kalra, E. K. (2003). Nutraceutical-definition and introduction. AAPS pharmSci, 5(3), E25. http://dx.doi.org/10.1208/ps050325
Tag EI-Din, Salah, S., Abdulaziz, M. A., & Abdulmalik A. Al. (1994). Distribution of Range Plant Communities as Influenced by Edaphic Factors in RaudhatKhuraim. Egypt J. Appl. Sci., 9(10), 69-82.
Tertian, R., & Claisse, F. (1982). Principles of Quantitative X-Ray Fluorescence Analysis. London, UK: Heyden & Son Ltd.
Van het Hof, K. H., Brouwer, I. A, & West, C. E. (1999). Bioavailability of lutein from vegetables is 5 times higher than that of beta-carotene. Am J ClinNutr., 70, 261-268.
Wildman, R. E. C. (2001). Handbook of Nutraceuticals and Functional Foods (1st ed.). CRC Series in Modern Nutrition.
Ziegler, G., Terauchi, A., Becker, A., Hudson, K., & Baxter, I. (2012). Ionomic Screening of Field-Grown Soybeans Identifies Mutants with Altered Seed Elemental Composition. The Plant Genome: Published ahead of print 9 Aug. 2012. http://dx.doi.org/10.3835/plantgenome2012.07.0012
Copyrights
Copyright for this article is retained by the author(s), with first publication rights granted to the journal.
This is an open-access article distributed under the terms and conditions of the Creative Commons Attribution license (http://creativecommons.org/licenses/by/3.0/).


