Embed Size (px)
Citation preview
182 Am J C/in Nzilr 1993;57:182-9. Printed in USA. © 1993 American Society for Clinical Nutrition
Comparison of micronutrient intake measured by a dietaryquestionnaire and biochemical indicators ofmicronutrient status13
Paul F Jacques, Sandra I 514/sky, James A Sadowski, Judy CC Phillips,
David Rush, and Walter C Willett
ABSTRACT We compared the intake of 12 micronutrients
as reported on a semiquantitative food frequency questionnaire
with corresponding biochemical indicators of nutrient status in
a sample of 57 males and 82 females aged 40-83 y. Age-, sex-
and energy-adjusted correlation coefficients ranged from near
zero for thiamin, vitamin A, and zinc to 0.63 for folate. Cor-
relation coefficients between intake and the biochemical mea-
sures were > 0.30 for carotenoids, vitamin D, vitamin E, vitamin
B- 12, folate, and vitamin C. Differences of 50% or more were
observed between extreme quartiles of intake for mean plasma
concentrations offolate, vitamin B-12, and vitamin C. Excluding
nutrient supplement users generally reduced the correlations.
These data demonstrate that food frequency questionnaires can
provide valid information on intake for a number of
micronutrients. Am J C/in Nutr 1993;57: 182-9.
KEY WORDS Blood, carotenoids, diet, minerals, nutrition
surveys, vitamins
Introduction
Micronutrient intake may play an important role in the etiol-
ogy of major diseases such as cancer and heart disease (1-7).
The large-scale studies that have suggested such relationships
rely on either reported dietary intake or simple biochemical
measures to assess nutrient intake or status. Because of the cx-
pense and difficulty of collecting and analyzing either blood
samples or multiple-day diet records in large numbers of free-
living subjects, investigators have come to depend more heavily
on food frequency questionnaires as a measure of nutrient intake
( 1 , 8- 1 2). Food frequency questionnaires are inexpensive and
fairly easy to administer but cost and ease of use are inconse-
quential if the method is not valid.
The validation of food frequency questionnaires is complicated
by the lack of an ideal standard. Diet records obtained over
many days are typically considered to be the referent standard
for many nutrients (9-12), but diet records may substantially
underestimate usual intake (1 3, 14) and recording diet may cause
individuals to alter intake (1 5). In spite of these shortcomings,
nutrient data derived from diet records and food frequency
questionnaires are usually reasonably correlated (9- 1 2), but
comparison of different methods of measuring dietary intake
may be complicated by correlated errors. For example, a ten-
dency to misreport food intake may be similar for different
methods of dietary assessment. Also, nutrient intake calculated
from different dietary methods are still based on similar under-
lying food composition data.
In contrast to the potential for correlated errors associated
with the different dietary assessment methods, errors in the es-
timation of nutrient status from dietary and biochemical mea-
sures are much more likely to be independent. Comparing such
dissimilar methods does not allow for direct validation: one
method measures intake: the other measures circulating con-
centrations that are influenced not only by intake but also by a
number of physiological and environmental factors. However,
for nutrients with biochemical markers that are responsive to
intake, a correlation between a reported dietary intake and an
objective biochemical measure can be interpreted as the lower
bound ofthe true questionnaire validity. Data relating nutrient
intake assessed by food frequency questionnaires to biochemical
measures of nutrient status are presently limited (1).
In this report, we compare the intakes of 1 2 micronutrients
estimated by a semiquantitative food frequency questionnaire
(9) with single measures of corresponding biochemical indicators
of nutrient status in 1 39 adults.
Methods
Subjects
Subjects were participants in a case-control study of nutritional
status and age-related cataracts ( 1 6). Blood samples and food
frequency questionnaires were available for 1 39 subjects. The
Human Investigations Review Committee at the New England
I From the US Department ofAgriculture Human Nutrition Centeron Aging at Tufts University, Boston.
2 Supported in part by federal funds from the US Department of Agri-
culture Agricultural Research Service under contract number 53-3K06-
5-10 and a grant from Hoffmann-LaRoche, Inc. The contents of this
publication do not necessarily reflect the views or policies of the USDepartment of Agriculture.
3 Address reprint requests to PF Jacques, USDA Human Nutrition
Research Center on Aging, Tufts University, 7 1 1 Washington Street,
Boston, MA 02111.
Received April 17, 1992.
Accepted for publication September 22, 1992.
by guest on July 13, 2011w
ww
.ajcn.orgD
ownloaded from
0 TE, cs-tocopherol equivalents.
t RBC, red blood cell: AC, activity coefficient.
NUTRIENT INTAKE AND BIOCHEMICAL MARKERS I 83
Medical Center and the Committee for the Protection of Human
Subjects from Research Risk at the Brigham and Women’s Hos-
pital approved all study procedures.
Nutritional asscssineizt
We used a 1 16-item semiquantitative food frequency ques-
tionnaire developed by Willett et al (9, 17) to assess usual dietary
intake for the previous year. Although it was designed to be self-
administered, a registered dietitian administered the food fre-
quency questionnaire in our study. A detailed history of nutrient
supplement use replaced the supplement information from the
food frequency questionnaire and included product name, fre-
quency and duration of use, dosage, and time since last use.
From this information we estimated average daily intake for the
year before the interview. In this report, we defined nutrient
intake as the sum of dietary and supplemental intake. We des-
ignated subjects as supplement users for a specific nutrient if,
over the past year, their average daily intake from supplements
was equal to or greater than one-third ofthe recommended di-
etary allowances ( 1 8) for that nutrient and the supplement was
taken within the past 2 wk. The food frequency questionnaire
estimated carotene intake as the total vitamin A activity from
plant sources and one-third the total vitamin A activity in dairy
fat ( 19), thus representing primarily fl-carotene and cs-carotene
intake.
Biochemical indicators ofnutrient status included plasma total
carotenoids (19), vitamin A (retinol) (20), vitamin E (a-tocoph-
erol) (20), vitamin D (25-hydroxycholecalciferol) (2 1 ), vitamin
C (total ascorbic acid) (22, 23), folate (Ciba-Corning Magnetic
Immunochemistries. Inc Medfield, MA), and vitamin B-12
(Ciba-Corning Magnetic Immunochemistries, Inc); red blood
cell (RBC) thiamin, riboflavin, and vitamin B-6 based on en-
zyme-activation tests (24); and serum magnesium (25) and
zinc (26).
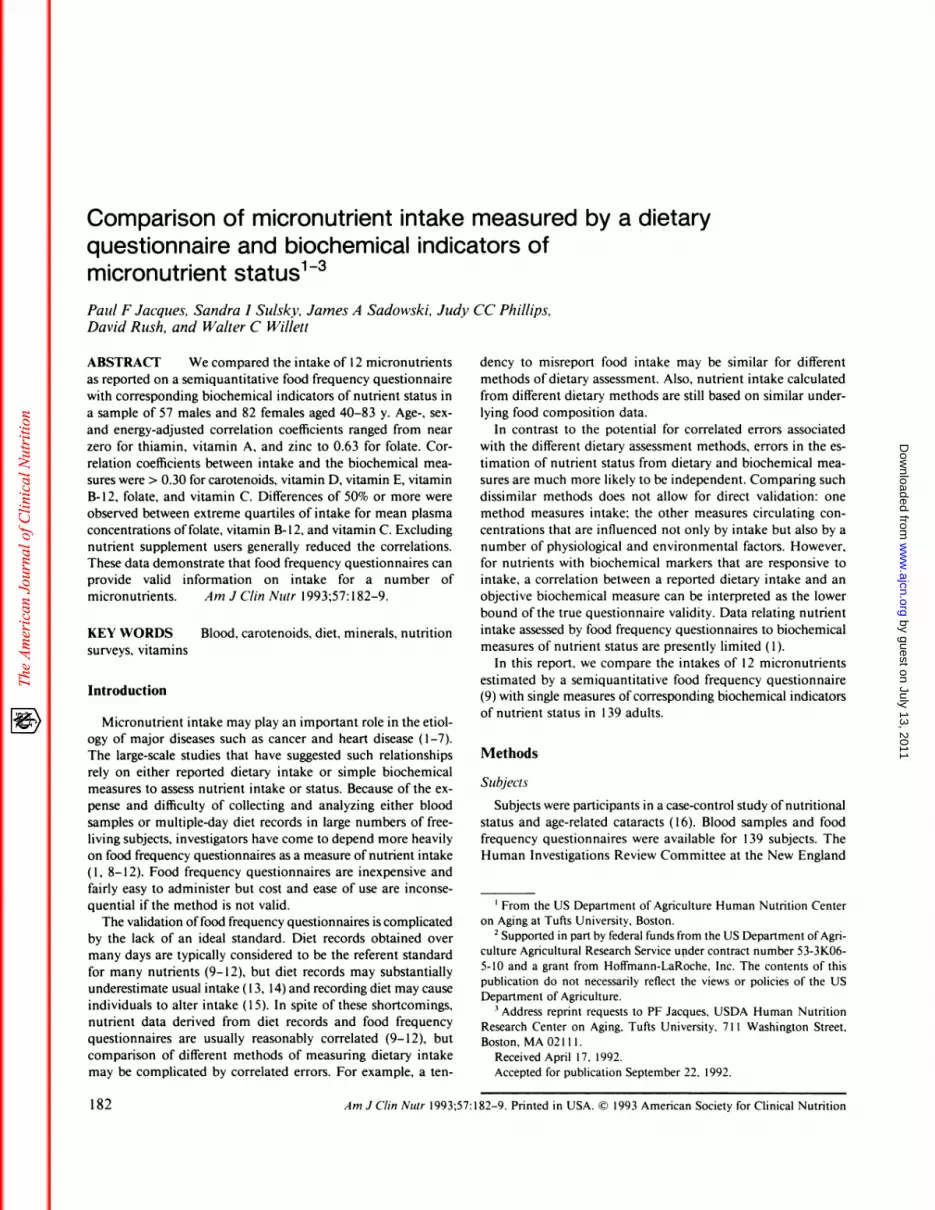
Table 1 lists the nutrients measured in this study with the
corresponding biochemical indicators. Plasma concentrations
of the fat-soluble nutrients are adjusted for total cholesterol by
using residuals calculated by regressing plasma nutrients on
cholesterol concentrations to account for extraneous variation
in the measurement of fat-soluble nutrients ( 1 ). Cholesterol was
measured enzymatically by spectrophotometric determination
(27). Based on the observations ofKrall et al (28), we examined
the relationship between vitamin D intake and plasma vitamin
D concentrations in a subset ofindividuals who were seen during
the late winter and early spring (March to May) to adjust for
the effect of sunlight exposure on plasma vitamin D concentra-
tions.
Statistical anal vses
We classified values ofnutrient intakes and biochemical mea-
sures lying more than three interquartile ranges above the 95th
percentile (or below the fifth percentile) as extreme and poten-
tially influential outliers, which were not used in any analyses
(Tables 4 and 5). All nutrient intakes and the following bio-
chemical measures were extremely positively skewed, requiring
a logarithmic transformation: retinol, riboflavin, folate, and zinc.
Plasma carotenoids, vitamin E (for the entire sample), and vi-
tamin B-l2 displayed moderate positive skewing that was nor-
malized by a square root transformation. Plasma vitamin E con-
centrations were not skewed after exclusion of vitamin E sup-
TABLE 1Measures of nutrient intake and corresponding biochemical indicators
of nutrient status
Measures ofnutrient intake
Biochemical indicatorsof nutrient status
Carotene (IU) Plasma total carotenoids (�imol/L)Vitamin A (IU) Plasma retinol (zmol/L)Vitamin E (mg TE0) Plasma cs-tocopherol (jmol/L)Vitamin D (IU) Plasma 25-OH vitamin D (nmol/L)
Thiamin (mg) RBC thiamin (AC)tRiboflavin (mg) RBC riboflavin (AC)t
Vitamin B-6 (mg) RBC vitamin B-6 (AC)t
Vitamin B-12 (pg) Plasma vitamin B-12 (pmol/L)
Folate (/)g) Plasma folate (nmol/L)Vitamin C (mg) Plasma total vitamin C (�mol/L)
Magnesium (mg) Serum magnesium (mmol/L)Zinc (mg) Serum zinc (�mol/L)
plement users; thus, plasma vitamin E concentrations were not
transformed for analyses excluding supplement users.
For each nutrient, we estimated the crude correlation coeffi-
cients and correlation coefficients adjusted for age, sex, and en-
ergy intake. We tested each relationship for age and sex inter-
actions, and examined the appropriateness of the assumption
of linear association by using second-order polynomial (qua-
dratic) models. When interactions were identified, we calculated
the correlation coefficients separately by sex or age group. If a
quadratic term significantly improved the fit of the model (P< 0.05), we considered nonlinear models. Age-, sex-, and energy-
adjusted mean biochemical nutrient concentrations and tests of
linear trend are also presented across quartiles of nutrient intake.
When interactions with age or sex were significant (P < 0.05),
we calculated means by subgroup. We performed analyses with
the SPSS REGRESSION and MANOVA procedures (29). Un-
less otherwise noted, statistical significance refers to P < 0.05.
Results
Subjects ranged in age from 40 to 83 y, and mean age was 61
y. Seventeen percent of the subjects were nonwhite. Reported
mean (SD) energy intakes for the males and females were 12.8
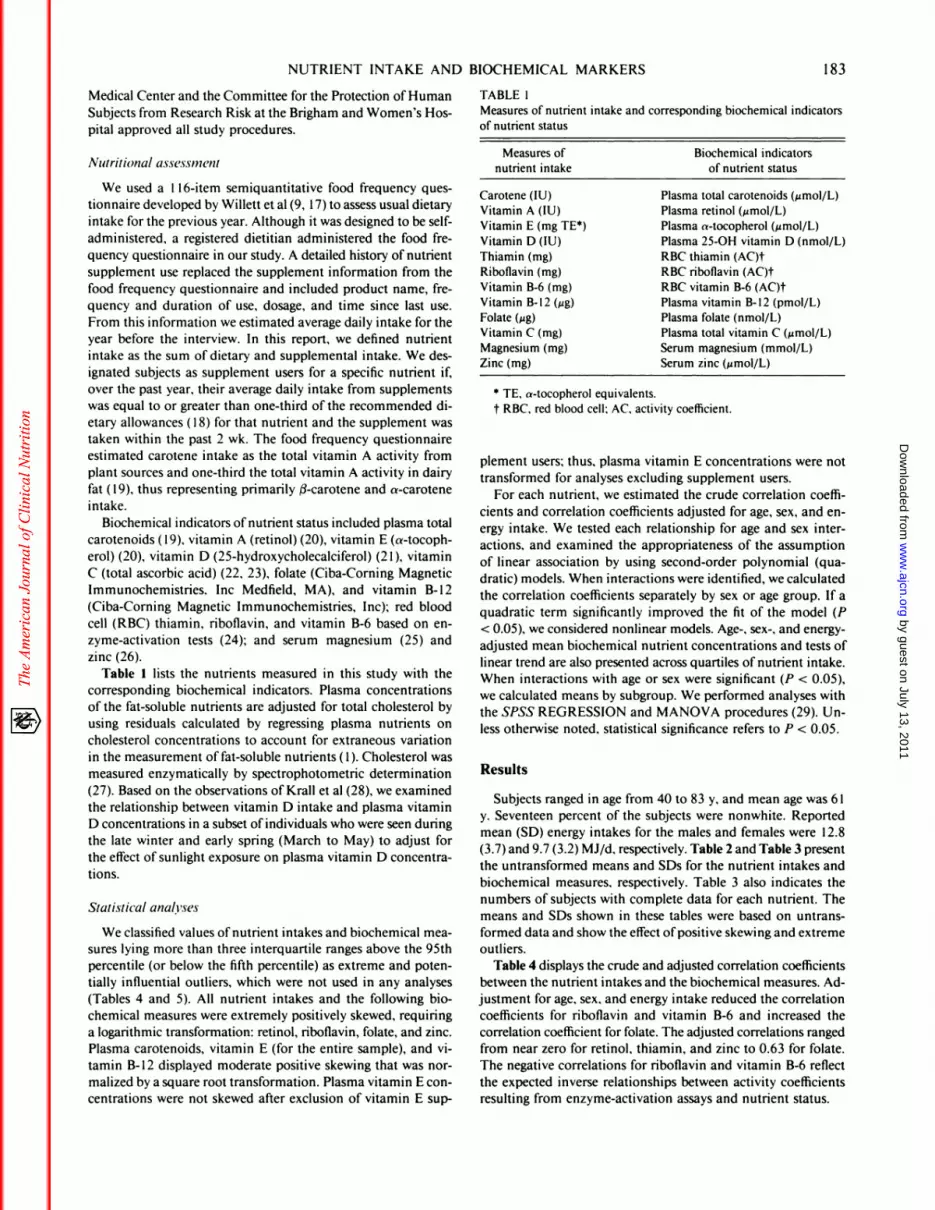
(3.7) and 9.7 (3.2) MJ/d, respectively. Table 2 and Table 3 present
the untransformed means and SDs for the nutrient intakes and
biochemical measures, respectively. Table 3 also indicates the
numbers of subjects with complete data for each nutrient. The
means and SDs shown in these tables were based on untrans-
formed data and show the effect ofpositive skewing and extreme
outliers.
Table 4 displays the crude and adjusted correlation coefficients
between the nutrient intakes and the biochemical measures. Ad-
justment for age, sex, and energy intake reduced the correlation
coefficients for riboflavin and vitamin B-6 and increased the
correlation coefficient for folate. The adjusted correlations ranged
from near zero for retinol, thiamin, and zinc to 0.63 for folate.
The negative correlations for riboflavin and vitamin B-6 reflect
the expected inverse relationships between activity coefficients
resulting from enzyme-activation assays and nutrient status.
by guest on July 13, 2011w
ww
.ajcn.orgD
ownloaded from

184 JACQUES ET AL
The correlations for all nutrients were generally weaker when
supplement users were excluded. This was most striking for vi-
tamin E, vitamin B-l2, and magnesium. Riboflavin did not fol-
low this pattern because the association between riboflavin intake
and the RBC riboflavin-activity coefficient for the entire sample
was nonlinear: the correlation coefficient for riboflavin intakes
< 5 mg/d was -0.29 (P < 0.01), whereas > S mg/d the corre-
lation was 0.01.
A significant sex interaction was observed for the carotene
intake-plasma carotenoid association. Carotene intake was sig-
nificantly associated with carotenoid concentrations in females,
but there was little or no association in males. The correlation
coefficients were 0.49 (P < 0.001) and 0. 19 (not significant) for
females and males, respectively. Season appeared to influence
the correlation between intake and plasma concentrations of
vitamin D. The correlation among subjects (10 males and 15
females) who were seen during late winter and early spring was
0.58 (P < 0.001); the correlation for subjects seen during the
remainder of the year was 0.28 (P < 0.01).
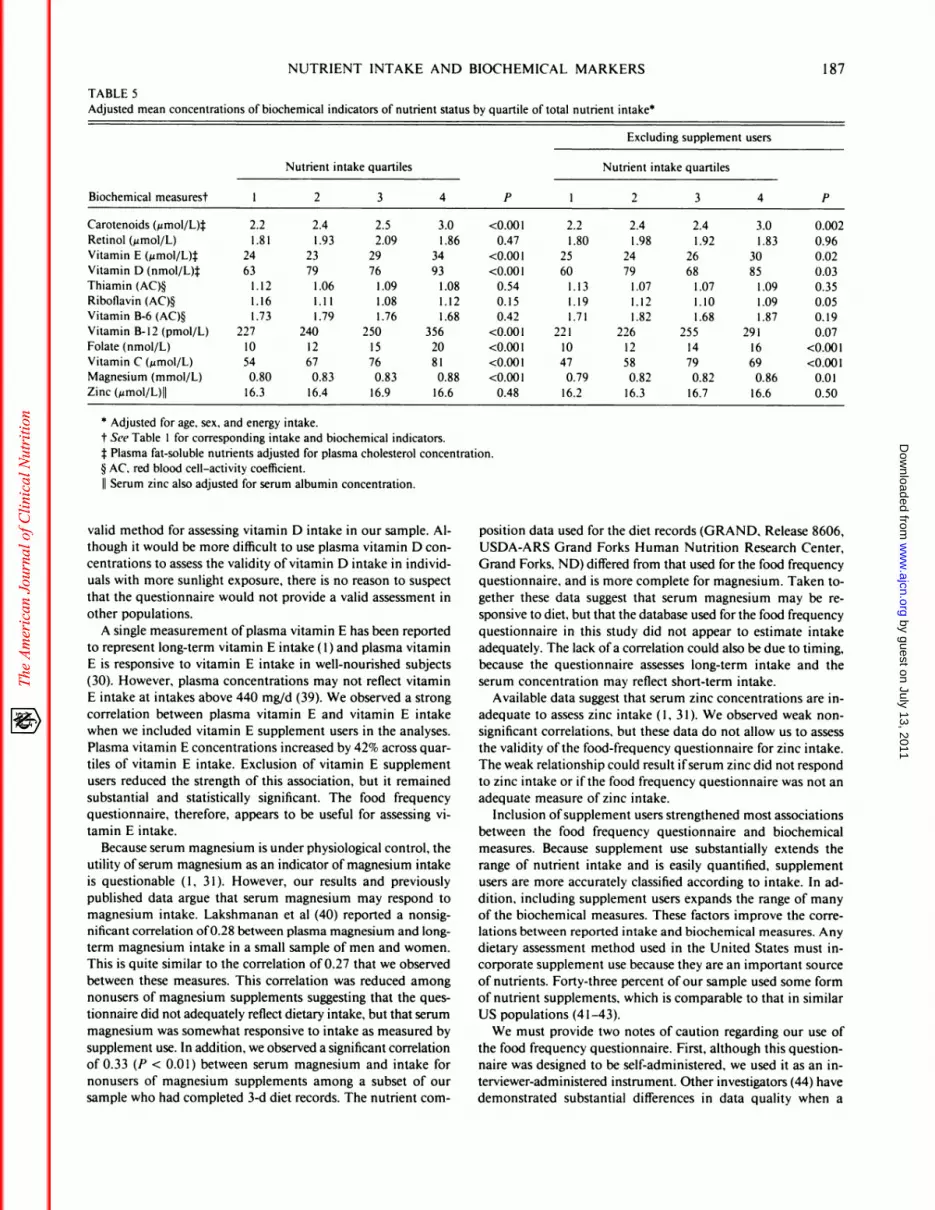
Table 5 shows the age-. sex-, and energy-adjusted mean bio-
chemical indicators by quartile ofintake. The differences in the
mean biochemical indicator concentrations across quartiles of
intake correspond closely to the correlation analyses. Mean con-
centrations of plasma retinol, RBC thiamin, and serum zinc
changed little across intake quartiles. Among all subjects, plasma
folate was twice as high in the highest quartile of folate intake
than in the lowest quartile ofintake. Vitamins B-12 and C showed
differences � 50% between extreme quartiles; vitamins D and
E exhibited interquartile differences of 48% and 42%, respec-
tively. Although the magnitude ofthe differences were generally
reduced, results were comparable when supplement users were
excluded: folate had the largest relative difference (60%) across
quartiles of intake; the vitamin C and vitamin D differences
were 47% and 44%, respectively. Exclusion ofsupplement users
reduced the vitamin B- 12 and E differences across quartiles to
32% and 20%, respectively. This analysis again demonstrated
that riboflavin-activity coefficient levels were nonlinearly related
to riboflavin intake with the P value for quadratic trend equal
to 0.04 for all subjects and 0.28 after excluding users of riboflavin
supplements.
The sex difference observed for the carotene intake-plasma
carotenoid correlation was also seen for mean plasma carotenoid
concentrations across carotene-intake quartiles. The relative dif-
ferences in plasma carotenoids across quartiles was 65% (2.0 vs
3.3 j�smol/L)) for females (P < 0.0.01) and 17% (2.3 vs 2.7) for
males (not significant). Excluding supplement users had little
influence on this association. We did not present the mean
plasma vitamin D concentrations by quartile ofvitamin D intake
for the subjects seen during late winter and early spring because
of the small numbers of subjects within quartiles.
Discussion
The purpose of this study was to validate the food frequency
questionnaire for assessing nutrient intake by using biochemical
indicators of nutrient status. Although this study was not a direct
validation ofthe food frequency questionnaire, the true validity
of the questionnaire must be stronger than observed because
the errors in reporting nutrient intake from this questionnaire
and errors in determining nutrient status by biochemical mdi-
cators are unlikely to be correlated. Thus, the observation of a
correlation between these independent methods of assessment
argues for the validity of the food frequency questionnaire as a
measure ofnutrient intake. A number ofthe nutrients examined
in this report displayed such correlations, supporting the validity
of this dietary assessment method for these nutrients.
The use of biochemical indicators to validate a measure of
intake is based on the assumption that the biochemical indicators
are responsive to intake in a dose-dependent manner ( 1 ). No
biochemical indicator will provide a perfect measure of intake
because many factors other than diet influence circulating nu-
trient concentrations ( 1 ). Complex mechanisms that regulate or
enhance absorption may affect circulating concentrations for
certain nutrients, whereas circulating concentrations of some
nutrients are under direct homeostatic control. Age, sex, smok-
ing, or disease status may also alter circulating concentrations
of some nutrients. Control of circulating nutrient concentrations
by factors other than diet tends to reduce correlations between
intake and the biochemical indicators of nutrient status. The
observed associations, therefore, reflect the lower bound of
questionnaire validity. The assumption that biochemical mdi-
cators are responsive to intake is considered below for each nu-
trient examined in this report.
Plasma carotenoids are responsive to intake (30-32) and
clearly discriminate over a wide range ofintakes (33). The mag-
nitude of the correlation coefficient we observed is similar to
that previously reported by Willett et al (34) using the same
nutrient assessment methods in a mixed sample of men and
women. We observed a 36% increase in mean carotenoid con-
centrations across the quintiles of intake. By the nature of our
comparison (provitamin A intake vs total plasma carotenoids),
we have probably substantially underestimated the true rela-
tionship between specific carotenoid intake and plasma concen-
trations ofspecific carotenoids. Published data on concentrations
of carotenoids other than carotenes are not yet available for
incorporation into food composition data, and plasma fl-carotene
constitutes on average < 20% of the total plasma carotenoids
(32). Thus, carotene intake is likely to be a much better indicator
of carotene status than was indicated by our analyses. The fact
that fl-carotene constitutes a higher percentage of plasma ca-
rotenoids for females than for males (35, 36) is the most rca-
sonable explanation for the sex interaction observed for dietary
carotene-plasma carotenoid association. The association between
carotene intake and plasma carotenoids in females was one of
the strongest that we observed. Plasma carotenoid concentration
increased 65% across carotene intake quartiles for females.
Plasma retinol concentrations are only responsive to vitamin
A intake in individuals with inadequate vitamin A status (30,
3 1). We observed no correlation between retinol and vitamin A
intake. The food frequency questionnaire measured vitamin A
intake in international units rather than retinol equivalents, al-
though retinol equivalents provide a better measure of vitamin
A activity. The use ofinternational units could potentially reduce
the correlation between plasma retinol and vitamin A intake,
but this is an unlikely explanation for the absence ofa correlation.
The more likely explanation is that our subjects were reasonably
well-nourished and we would expect no correlation.
We estimated thiamin, riboflavin, and vitamin B-6 status by
using enzyme-activation (stimulation) tests. Depletion studies
provide much of the information relating vitamin intake to ac-
tivity coefficients, and few data exist on the relationships between
activation tests and intakes within the range of the general US
by guest on July 13, 2011w
ww
.ajcn.orgD
ownloaded from
NUTRIENT INTAKE AND BIOCHEMICAL MARKERS 185
TABLE 2Nutrient intake
Nutrient
All males o r females Excluding supp lement users
Supplement
users0 (n)Absolute intake Intake/4.2 MI Absolute intake lntake/4.2 MI
Males (n = 57)
Carotenes(IU) 13668± 12530t 4682±4572 12276± 10326 4311 ±4202 2
VitaminA(IU) 18270± 12 185 6258±4665 17334± 12027 5994±4800 13
Vitamin E (mg TEf) 71.9 ± 164.9 28.8 ± 72.4 15.8 ± 16.6 4.8 ± 3.1 14
VitaminD(ILJ) 374±268 125±85 283± 164 94±46 13
Thiamin (mg) 6.5 ± 1 1.6 2.2 ± 4.2 2.1 ± 1.3 0.7 ± 0.2 14
Riboflavin (mg) 7.6 ± 1 1.9 2.6 ± 4.2 3.1 ± 2.0 1.0 ± 0.4 14
Vitamin B-6 (mg) 9.3 ± 23.9 3.2 ± 13.8 2.9 ± 1.7 0.9 ± 0.4 14
Vitamin B-12 (;2g) 15.8 ± 20.4 5.2 ± 5.9 9.5 ± 6.4 3.2 ± 1.6 14Folate (;zg) 557 ± 412 181 ± 103 481 ± 338 154 ± 77 1 1
VitaminC(mg) 352±278 119±97 256± 154 86±50 16Magnesium(mg) 426±214 146±94 358± 142 118±34 17
Zinc (mg) 18.8 ± 13.3 6.2 ± 4.0 15.3 ± 7.7 4.9 ± 1.9 12Females (n = 82)
Carotenes(IU) 15309± 17220 7239± 10435 13677±8899 6164±3797 1
VitaminA(IU) 18644±11258 8279±4427 17189±9240 7669±3799 11
Vitamin E (mg TE�) 26.2 ± 51.2 10.9 ± 18.6 14.2 ± 17.8 5.8 ± 5.8 12Vitamin D (IU) 354 ± 297 152 ± 107 296 ± 227 125 ± 70 14
Thiamin (mg) 4.2 ± 10.6 1.8 ± 5.1 1.7 ± 1.8 0.7 ± 0.4 15Riboflavin (mg) 4.9 ± 10.6 2.2 ± 5.1 2.5 ± 1.7 1.1 ± 0.5 16
Vitamin B-6 (mg) 5.4 ± 14.1 2.3 ± 5.8 2.3 ± 1.2 1.0 ± 0.4 16Vitamin B-l2 (;.Lg) 1 1.9 ± 13.3 5.1 ± 5.8 9.2 ± 8.3 3.9 ± 2.8 14Folate(�og) 446±297 196± 109 380± 189 166±69 11
VitaminC(mg) 322±347 139± 132 221 ± 154 95±52 20
Magnesium (mg) 330 ± 199 144 ± 64 289 ± 146 128 ± 44 12
Zinc (mg) 12.4 ± 6.9 5.4 ± 2.5 1 1.7 ± 6.4 5.1 ± 2.2 6
0 Supplement use is defined individually for each nutrient.
t I ± SD.:1:TE, cs-tocopherol equivalents.
population (1). Bayoumi and Rosalki (37) demonstrated signif-
icant reduction in all three activity coefficients when subjects
with apparently normal concentrations of these nutrients were
supplemented with amounts substantially greater than the rec-
ommended dietary allowances (18).
We observed no correlation between thiamin intake and the
thiamin-activation test. Because of the limited data on the sen-
sitivity of this test to thiamin intake in normal individuals, we
cannot evaluate the usefulness ofthe food-frequency assessment
for thiamin. The nonlinear relationship between riboflavin intake
and riboflavin activity coefficients suggests that the activation
test fails to reflect riboflavin intake over the entire range of in-
takes. The activation test does appear to reflect reported intake
at nonsupplemental amounts. Although we observed a crude
association between vitamin B-6 intake and the vitamin B-6-
activation test, it disappeared after adjustment for energy intake.
Prior analyses demonstrated a correlation between vitamin B-6
intake based on the same food frequency questionnaire and
plasma pyridoxal phosphate (1). Again, the enzyme-activation
test employed in the present analyses will not reflect vitamin B-
6 intake if the enzyme is saturated over most of the range of
intake in our sample.
We could not identify any experimental data that assessed
the relationship between vitamin B-12 intake and plasma vitamin
B-12 in individuals with apparently adequate intake. The cor-
relation we observed between intake and plasma concentrations
for the sample as a whole suggests a responsiveness of plasma
concentrations to intake, but the association appears to result
largely, although not entirely, from the inclusion of supplement
users in the analyses. We observed a 57% increase in plasma
vitamin B- 12 concentrations across quartiles of intake for the
entire sample, but only a marginally significant 29% increase
among subjects who did not consume vitamin B- 12 supplements.
The limited data relating folate intake with plasma folate con-
centrations suggest that plasma folate is sensitive to recent folate
intake, but may not reflect body stores of folate (1, 31). Of the
nutrients we considered, folate displayed the highest correlation
and the highest relative difference across quartiles. Plasma folate
concentrations doubled across the quartiles of folate intake for the
entire sample. The association remained strong after excluding users
of folate supplements. Our data suggest that the food frequency
questionnaire provides a valid measure of folate intake.
Plasma vitamin C concentrations are known to respond to
vitamin C intake (1), even in well-nourished subjects (38). The
moderate correlations and relatively large differences across
quartiles that we observed suggest that vitamin C assessment
using the food frequency questionnaire is valid. Plasma vitamin
C concentrations increased �50% across quartiles ofvitamin C
intake for the entire sample and for subjects not consuming
vitamin C supplements.
by guest on July 13, 2011w
ww
.ajcn.orgD
ownloaded from
186 JACQUES ET AL
TABLE 3
Biochemical indicators of nutrient status
Males Females
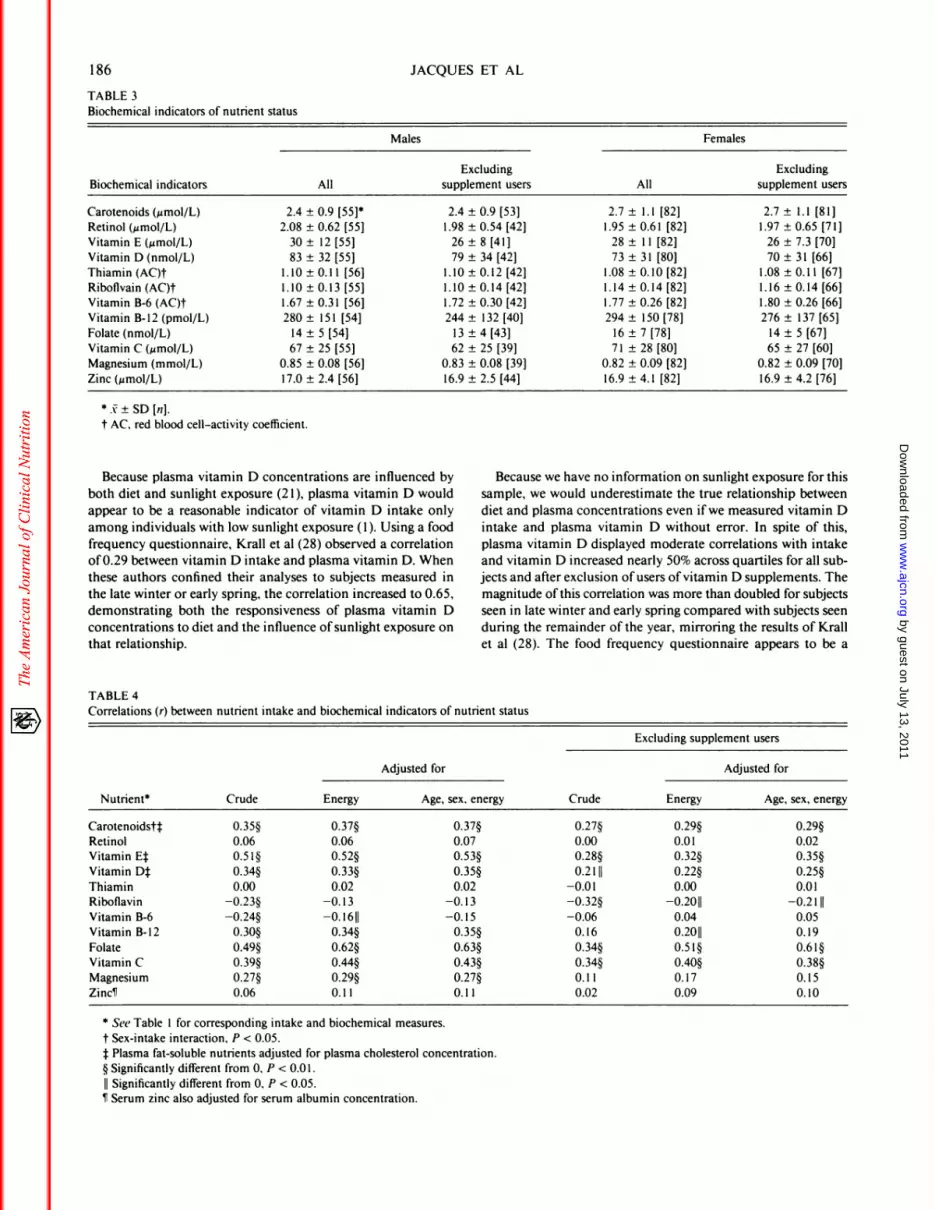
Excluding ExcludingBiochemical indicators All supplement users All supplement users
Carotenoids (�mol/L) 2.4 ± 0.9 [55]0 2.4 ± 0.9 [53] 2.7 ± 1.1 [82] 2.7 ± 1.1 [81]
Retinol (�zmol/L) 2.08 ± 0.62 [55] 1.98 ± 0.54 [42] 1.95 ± 0.61 [82] 1.97 ± 0.65 [71]
Vitamin E (�mol/L) 30 ± 12 [55] 26 ± 8 [41] 28 ± I 1 [82] 26 ± 7.3 [70]Vitamin D (nmol/L) 83 ± 32 [55] 79 ± 34 [42] 73 ± 31 [80] 70 ± 31 [66]
Thiamin (AC)t 1.10 ± 0.1 1 [56] 1.10 ± 0.12 [42] 1.08 ± 0.10 [82] 1.08 ± 0.1 1 [67]
Ribofivain (AC)t 1.10 ± 0.13 [55] 1.10 ± 0.14 [42] 1.14 ± 0.14 [82] 1.16 ± 0.14 [66]
Vitamin B-6 (AC)t 1.67 ± 0.31 [56] 1.72 ± 0.30 [42] 1.77 ± 0.26 [82] 1.80 ± 0.26 [66]
Vitamin B-12 (pmol/L) 280 ± 151 [54] 244 ± 132 [40] 294 ± 150 [78] 276 ± 137 [65]
Folate (nmol/L) 14 ± 5 [54] 13 ± 4 [43] 16 ± 7 [78] 14 ± 5 [67]
Vitamin C (�.smol/L) 67 ± 25 [55] 62 ± 25 [39] 7 1 ± 28 [80] 65 ± 27 [60]
Magnesium (mmol/L) 0.85 ± 0.08 [56] 0.83 ± 0.08 [39] 0.82 ± 0.09 [82] 0.82 ± 0.09 [70]
Zinc (�smol/L) 17.0 ± 2.4 [56] 16.9 ± 2.5 [44] 16.9 ± 4.1 [82] 16.9 ± 4.2 [76]
0 j: � SD En].
t AC, red blood cell-activity coefficient.
Because plasma vitamin D concentrations are influenced by Because we have no information on sunlight exposure for this
both diet and sunlight exposure (2 1), plasma vitamin D would sample, we would underestimate the true relationship between
appear to be a reasonable indicator of vitamin D intake only diet and plasma concentrations even ifwe measured vitamin D
among individuals with low sunlight exposure (1). Using a food intake and plasma vitamin D without error. In spite of this,
frequency questionnaire, Krall et al (28) observed a correlation plasma vitamin D displayed moderate correlations with intake
of0.29 between vitamin D intake and plasma vitamin D. When and vitamin D increased nearly 50% across quartiles for all sub-
these authors confined their analyses to subjects measured in jects and after exclusion ofusers ofvitamin D supplements. The
the late winter or early spring, the correlation increased to 0.65, magnitude ofthis correlation was more than doubled for subjects
demonstrating both the responsiveness of plasma vitamin D seen in late winter and early spring compared with subjects seen
concentrations to diet and the influence ofsunlight exposure on during the remainder of the year, mirroring the results of Krall
that relationship. et al (28). The food frequency questionnaire appears to be a
TABLE 4
Correlations (r) between nutrient intake and biochemical indicators of nutrient status
Excluding supplement users
Adjusted for Adjusted for
Nutrient0 Crude Energy Age, sex, energy Crude Energy Age, sex, energy
Carotenoidstt 0.35� 0.37� 0.37� 0.27� 0.29� 0.29�Retinol 0.06 0.06 0.07 0.00 0.01 0.02Vitamin Ej 0.5l� 0.52� 0.53� 0.28� 0.32� 0.35�Vitamin D� 0.34� 0.33� 0.35� 0.2111 0.22� 0.25�
Thiamin 0.00 0.02 0.02 -0.01 0.00 0.01
Riboflavin -0.23� -0.13 -0.13 -0.32� -0.2011 -0.2111
Vitamin B-6 -0.24� -0.1611 -0.15 -0.06 0.04 0.05
Vitamin B-12 0.30� 0.34� 0.35� 0.16 0.2011 0.19
Folate 0.49� 0.62� 0.63� 0.34� 0.5l� 0.6l�Vitamin C 0.39� 0.44� 0.43� 0.34� 0.40� 0.38�Magnesium 0.27� 0.29� 0.27� 0.1 1 0.17 0.15ZinciT 0.06 0.1 1 0.1 1 0.02 0.09 0.10
0 See Table 1 for corresponding intake and biochemical measures.
t Sex-intake interaction, P < 0.05.f Plasma fat-soluble nutrients adjusted for plasma cholesterol concentration.§ Significantly different from 0, P < 0.01.
II Significantly different from 0, P < 0.05.#{182}Serum zinc also adjusted for serum albumin concentration.
by guest on July 13, 2011w
ww
.ajcn.orgD
ownloaded from
NUTRIENT INTAKE AND BIOCHEMICAL MARKERS 187
TABLE 5Adjusted mean concentrations of biochemical indicators of nutrient status by quartile of total nutrient intake0
Biochemical measurest
Nutrient intake quartiles
P
Excluding supplemen t users
Nutrient intake quartiles
1 2 3 4 1 2 3 4 P
Carotenoids (Mmol/L4
Retinol (�moI/L)
Vitamin E (j.smol/L)�
Vitamin D (nmol/L%Thiamin (AC)�
Riboflavin (AC)�Vitamin B-6 (AC)�
Vitamin B-12 (pmol/L)
Folate (nmol/L)Vitamin C (�mol/L)Magnesium (mmol/L)
Zinc (�zmol/L)II
2.2
1.81
24
631.12
1.161.73
227
1054
0.80
16.3
2.4 2.5
1.93 2.09
23 29
79 76
1.06 1.09
1.1 1 1.081.79 1.76
240 250
12 1567 76
0.83 0.83
16.4 16.9
3.0
1.86
34
93
1.08
1.121.68
3562081
0.88
16.6
<0.001
0.47
<0.001
<0.001
0.54
0.150.42
<0.001
<0.001<0.001
<0.0010.48
2.2
1.80
25
60
1.13
1.191.71
2211047
0.7916.2
2.4 2.4
1.98 1.92
24 26
79 681.07 1.07
1.12 1.101.82 1.68
226 25512 1458 79
0.82 0.82
16.3 16.7
3.0
1.83
30
851.09
1.091.87
291
1669
0.86
16.6
0.002
0.96
0.02
0.03
0.35
0.050.19
0.07
<0.001<0.001
0.01
0.50
0 Adjusted for age, sex, and energy intake.
t See Table I for corresponding intake and biochemical indicators.
1:Plasma fat-soluble nutrients adjusted for plasma cholesterol concentration.§ AC, red blood cell-activity coefficient.
II Serum zinc also adjusted for serum albumin concentration.
valid method for assessing vitamin D intake in our sample. Al-
though it would be more difficult to use plasma vitamin D con-
centrations to assess the validity ofvitamin D intake in individ-
uals with more sunlight exposure, there is no reason to suspect
that the questionnaire would not provide a valid assessment in
other populations.
A single measurement ofplasma vitamin E has been reported
to represent long-term vitamin E intake ( 1) and plasma vitamin
E is responsive to vitamin E intake in well-nourished subjects
(30). However, plasma concentrations may not reflect vitamin
E intake at intakes above 440 mg/d (39). We observed a strong
correlation between plasma vitamin E and vitamin E intake
when we included vitamin E supplement users in the analyses.
Plasma vitamin E concentrations increased by 42% across quar-
tiles of vitamin E intake. Exclusion of vitamin E supplement
users reduced the strength of this association, but it remained
substantial and statistically significant. The food frequency
questionnaire, therefore, appears to be useful for assessing vi-
tamin E intake.
Because serum magnesium is under physiological control, the
utility of serum magnesium as an indicator of magnesium intake
is questionable ( 1 , 3 1 ). However, our results and previously
published data argue that serum magnesium may respond to
magnesium intake. Lakshmanan et al (40) reported a nonsig-
nificant correlation of0.28 between plasma magnesium and long-
term magnesium intake in a small sample of men and women.
This is quite similar to the correlation of0.27 that we observed
between these measures. This correlation was reduced among
nonusers of magnesium supplements suggesting that the ques-
tionnaire did not adequately reflect dietary intake, but that serum
magnesium was somewhat responsive to intake as measured by
supplement use. In addition, we observed a significant correlation
of 0.33 (P < 0.0 1) between serum magnesium and intake for
nonusers of magnesium supplements among a subset of our
sample who had completed 3-d diet records. The nutrient com-
position data used for the diet records (GRAND, Release 8606,
USDA-ARS Grand Forks Human Nutrition Research Center,
Grand Forks, ND) differed from that used for the food frequency
questionnaire, and is more complete for magnesium. Taken to-
gether these data suggest that serum magnesium may be re-
sponsive to diet, but that the database used for the food frequency
questionnaire in this study did not appear to estimate intake
adequately. The lack ofa correlation could also be due to timing,
because the questionnaire assesses long-term intake and the
serum concentration may reflect short-term intake.
Available data suggest that serum zinc concentrations are in-
adequate to assess zinc intake ( 1 , 3 1 ). We observed weak non-
significant correlations, but these data do not allow us to assess
the validity ofthe food-frequency questionnaire for zinc intake.
The weak relationship could result ifserum zinc did not respond
to zinc intake or ifthe food frequency questionnaire was not an
adequate measure ofzinc intake.
Inclusion of supplement users strengthened most associations
between the food frequency questionnaire and biochemical
measures. Because supplement use substantially extends the
range of nutrient intake and is easily quantified, supplement
users are more accurately classified according to intake. In ad-
dition, including supplement users expands the range of many
of the biochemical measures. These factors improve the corre-
lations between reported intake and biochemical measures. Any
dietary assessment method used in the United States must in-
corporate supplement use because they are an important source
of nutrients. Forty-three percent of our sample used some form
of nutrient supplements, which is comparable to that in similar
US populations (41-43).
We must provide two notes of caution regarding our use of
the food frequency questionnaire. First, although this question-
naire was designed to be self-administered, we used it as an in-
terviewer-administered instrument. Other investigators (44) have
demonstrated substantial differences in data quality when a
by guest on July 13, 2011w
ww
.ajcn.orgD
ownloaded from

188 JACQUES ET AL
questionnaire was self-administered or interviewer-administered.
We have no evidence that this occurs for the questionnaire that
we used. Second, even though the questionnaire is designed to
elicit information on nutrient supplement use, we obtained our
information on nutrient supplement use from a more detailed
supplement-use history. However, the nutrient-supplement data
that we used to determine usual intake for these analyses was
very similar to that usually provided by the food frequency
questionnaire. Thus, the fact that we derived nutrient-supple-
ment data from another source should have minimal impact on
the observed associations.
Our results indicate that the food frequency questionnaire
provides useful and valid information on micronutrient intake
for folate, vitamin C, vitamin D, vitamin B-l2, and vitamin E
for both sexes, and carotene intake for females. Reasons for the
low correlation between nonsupplemental magnesium intake
and serum concentrations, such as adequacy of the nutrient-
composition database, should be explored and could lead to
improved estimation of intakes. Although we were unable to
demonstrate meaningful linear relationships between the bio-
chemical and dietary assessment methods for thiamin, riboflavin,
and vitamin B-6, this is probably a limitation of the enzyme-
activation assays. Similarly, the lack ofcorrelation for zinc and
preformed vitamin A is probably because ofthe insensitivity of
plasma concentrations to intake of these nutrients. B
We thank Leo T Chylack, Jr. who was largely responsible for the studyfrom which we obtained these data. The authors gratefully acknowledge
the contributions of Frank Morrow, Saul Tannenbaum, Lorry Scura,and the entire staff of the Nutrition Evaluation Laboratory and the Di-vision of Scientific Computing at the US Department of AgricultureHuman Nutrition Research Center on Aging at Tufts University.
References
1. Willett W. Nutritional epidemiology. New York: Oxford University
Press, 1990.2. Ziegler RG. Vegetables. fruits and carotenoids and the risk of cancer.
Am I Clin Nutr 1991:53:2515-9.3. Comstock GW, Helzlsouer KJ, Bush TL. Prediagnostic serum levels
of carotenoids and vitamin E as related to subsequent cancer inWashington County. Maryland. Am I Clin Nutr 199 1:53:260S-4.
4. Block G. Vitamin C and cancer prevention: the epidemiologic ev-idence. Am I Clin Nutr 199 1:53:270S-82.
5. Knekt P, Aromaa A, Maatla I, et al. Vitamin E and cancer preven-tion. Am J Clin Nutr 199 1:53:2835-6.
6. Gey KF, Pusla P. Jordan P. Moser UK. Inverse correlation betweenplasma vitamin E and mortality from ischemic heart disease in cross-cultural epidemiology. Am I Clin Nutr 199 1:53:326S-34.
7. Kok FJ, Schrijver I, Hofman A, et al. Low vitamin B6 status inpatients with acute myocardial infarction. Am I Cardi#{244}l1989:63:5 13-6.
8. Block G, Hartman AM, Dresser CM, Carroll MD, Gannon I, Gard-
ncr L. A data-based approach to diet questionnaire design and testing.Am I Epidemiol 1986:124:453-69.
9. Willett WC, Sampson L, Stampfer MI, et al. Reproducibility andvalidity of a semiquantitative food frequency questionnaire. Am I
Epidemiol 1985:122:51-65.10. Pietenen P, Hartman AM, Haapa E, et al. Reproducibility and va-
lidity ofdietary assessment instruments. I. A self-administered fooduse questionnaire with a portion size picture booklet. Am J Epidemiol
1988; 128:655-66.1 1. Block 0, Woods M, Potosky A, Clifford C. Validation of a self-
administered diet history questionnaire using multiple diet records.I Clin Epidemiol 1990:43:1327-35.
12. lain M. Howe GR, Johnson KC, Miller AB. Evaluation of a diet
history questionnaire for epidemiologic studies. Am I Epidemiol
1980:111:212-9.I 3. Sahyoun NR, Rasmussen HM. Comparison ofreported calories from
food records to calorie needs for weight maintenance. I Am DietAssoc 1988:89:58(abstr)
14. Schoeller DA. How accurate is self-reported dietary energy intake?Nutr Rev 1990:48:373-9.
15. Barrett-Connor E. Nutritional epidemiology: how do we know what
they ate? Am I Clin Nutr 199 1;54:182S-7.
16. Jacques PF, Hartz SC, Chylack LT, McGandy RB, Sadowski JA.Nutritional status in persons with and without senile cataract: bloodvitamin and mineral levels. Am I Clin Nutr 1988:48:152-8.
17. Willett WC, Sampson L, Browne ML, et al. The use of a self-ad-ministered questionnaire to assess diet four years in the past. Am I
Epidemiol 1988:127:188-99.
18. National Research Council. Recommended dietary allowances, 10th
ed. Washington, DC: National Academy Press, 1989.
19. Rods OA, Trout M, Lui NST, Anderson OR. Vitamins and hor-mones: vitamin A and carotene. In: Cooper CR, ed. Standard meth-ods ofclinical chemistry. vol 7. New York: Academic Press, 1972:
2 15-30.20. Bieri IG, Tolliver TI, Catagnani GL. Simultaneous determination
of a-tocopherol and retinol in plasma or red cells by high pressure
liquid chromatography. Am I Clin Nutr 1979:32:2143-9.
21. Adams IS. Clemens TL, Parrish IA, Holick ME. Vitamin-D synthesisand metabolism after ultraviolet light irradiation of normal and vi-
tamin-D-deficient subjects. N Engl I Med 1982:306:722-5.
22. Roe JH, Keuther CA. The determination ofascorbic acid in wholeblood and urine through the 2,4-dinitrophenylhydrazine derivative
dehydro-ascorbic acid. I Biol Chem 1943:147:399-403.23. Gary P1, Owen GM, Lashley DW, Ford PC. Automated analyses
of plasma and whole blood ascorbic acid. Clin Biochem 1974:7:
13 1-45.
24. Williams DO. Methods for the estimation ofthree vitamin dependentred cell enzymes. Clin Biochem 1976;9:252-5.
25. Annino IS. Clinical chemistry: principles and procedures. 3rd ed.
Boston: Little, Brown and Co. 1964:206-10.26. Smith JC, Butrimovitz GP, Purdy WC. Direct measurement of zinc
in plasma by atomic absorption spectroscopy. Clin Chem 1979;25:
1487-91.
27. Allain CC, Poon LS, Chan CSG, Richmond W, Fu PC. Enzymatic
determination of total serum cholesterol. Clin Chem 1974;20:
470-5.
28. Krall EA, Sahyoun N. Tannenbaum 5, Dallal G,
B. Effect of vitamin D intake on seasonal variation in parathyroidhormone secretion in postmenopausal women. N Engl J Med
1989:321:1777-83.
29. SPSS reference guide. Chicago: SPSS Inc. 1990.
30. Willett WC, Stampfer MI, Underwood BA, Taylor JO, HennekensCH. Vitamins A, E and carotene: effects of supplementation ontheir plasma levels. Am I Clin Nutr 1983:38:559-66.
3 1 . Pi-Sunyer FX. Woo R. Laboratory measures of nutritional status.In: Simko MD, Lowell C, Gilbride IA, eds. Nutrition assessment.Rockville, MD: Aspen Systems Corp. 1984:139-74.
32. Brown ED, Micozzi MS. Craft NE, et al. Plasma carotenoids innormal men after a single ingestion of vegetables or purified fl-car-otene. Am I Clin Nutr 1989:49:1258-65.
33. Ringer TV, DeLoof MI, Winterrowd GE, et al. Beta-carotene’s effects
on serum lipoproteins and immunologic indices in humans. Am J
Clin Nutr 199 1:53:688-94.34. Willett WC, Stampfer MI, Underwood BA, Speizer FE, Rosner B,
Hennekens CH. Validation of a dietary questionnaire with plasma
carotenoid and a-tocopherol levels. Am I Clin Nutr 1983;38:63 1-9.
35. Stacewicz-Sanpuntzakis M, Bower PE, Kikendall 1W, Burgess M.Simultaneous determination of serum retinol and various carot-
by guest on July 13, 2011w
ww
.ajcn.orgD
ownloaded from
NUTRIENT INTAKE AND BIOCHEMICAL MARKERS
enoids: their distribution in middle-aged men and women. JournalMicronutrient Analysis l987;3:27-45.
36. Comstock GW, Menkes MS, Schober SE, Vuilleumier JP, Helsing
KI. Serum levels of retinol, beta-carotene, and alpha-tocopherol inolder adults. Am I Epidemiol 1988;l27:l 14-23.
37. Bayoumi RA, Rosalki SB. Evaluation of methods of coenzyme ac-
tivation oferythrocyte enzymes for detection ofdeficiency of vitaminsB, B2, and B6. Clin Chem 1976:22:327-35.
38. Taylor A, Jacques PF, Nadler D, Morrow F, Sulsky SI, Shepard D.
Relationship between ascorbic acid consumption and levels of total
and reduced ascorbic acid in lens, aqueous humor and plasma. CurrEye Res 1991:10:751-9.
39. Dimitrov NV, Meyer C, Gilliland D, Ruppenthal M, Chenoweth
W, Malone W. Plasma tocopherol concentrations in response to
supplemental vitamin E. Am J Clin Nutr 1991;53:723-9.
189
40. Lakshmanan FL, Rao RB, Kim WW, Kelsay IL. Magnesium intakes,
balances, and blood levels of adults consuming self-selected diets.
Am J Clin Nutr 1984;40: 1380-9.
4 1 . Subar AF, Block G. Use of vitamin and mineral supplements: de-
mographics and amounts of nutrients consumed. The 1987 Health
Interview Survey. Am I Epidemiol 1990;132:109l-l0l.
42. Hartz SC, Otradovec CL, McGandy RB, et al. Nutrient supplement
use by healthy elderly. J Am Coll Nutr 1988;7:l 19-28.
43. Stewart ML, McDonald IT, Levy AS, et al. 1985 vitamin and mineral
supplement use: a telephone survey of adults in the United States.
J Am Diet Assoc l985;1585-90.
44. Leighton I, Neugut Al, Block G. A comparison of face-to-face food
frequency interviews with telephone interview and self-administered
questionnaires. Am I Epidemiol 1988; 128:89 l(abstr).
by guest on July 13, 2011w
ww
.ajcn.orgD
ownloaded from