Embed Size (px)
Citation preview

Esmee L. DoetsLiesbeth S. de WitRosalie A.M. Dhonukshe-RuttenAdrienne E.J.M. CavelaarsMonique M. RaatsLada TimotijevicAnna BrzozowskaTrudy M.A. WijnhovenMirjana PavlovicTorunn Holm TotlandLene F. AndersenJiri RuprichLoek T.J. PijlsMargaret AshwellJanet P. LambertPieter van �t VeerLisette C.P.G.M. de Groot
Current micronutrient recommendationsin Europe: towards understandingtheir differences and similarities
j Abstract Background Nowa-days most countries in Europehave established their own nutri-ent recommendations to assess the
adequacy of dietary intakes and toplan desirable dietary intakes. Asyet there is no standard approachfor deriving nutrient recommen-
Eur J Nutr (2008) 47 (Suppl 1):17–40DOI 10.1007/s00394-008-1003-5
EJN
1003
This work was carried out within theframework of EURRECA, a Network ofExcellence funded by the European Com-mission, project no FP6 036196-2.
E.L. Doets (&) Æ L.S. de WitR.A.M. Dhonukshe-RuttenA.E.J.M. Cavelaars Æ P. van �t VeerL.C.P.G.M. de GrootDivision of Human NutritionWageningen University and ResearchCentreP.O. Box 81296700 EV Wageningen, The NetherlandsWebsite: http://www.hne.wur.nl/uk/E-Mail: [email protected]
M.M. Raats Æ L. TimotijevicFood, Consumer Behaviour and HealthUniversity of SurreyGuildford (Surrey)GU2 7XH, UKWebsite: http://www.surrey.ac.uk/SHS/fcbh.htm
A. BrzozowskaDept. of Human NutritionWarsaw Agricultural University (SGGW)159c Nowoursynowska Str.02-766 Warsaw, PolandWebsite: http://www.sqqw.pl
T.M.A. WijnhovenNon-communicable Diseases andEnvironmentWorld Health Organization RegionalOffice for EuropeScherfigsvej 82100 Copenhagen, DenmarkWebsite: http://www.euro.who.int
M. PavlovicInstitute for Medical ResearchDept. of Nutrition and MetabolismUniversity of BelgradeTadeusa Koscuskog 111000 Belgrade, SerbiaWebsite: http://www.srbnutrition.info
T.H. Totland Æ L.F. AndersenDept. of NutritionInstitute of Basic Medical Sciences (IMB)University of OsloP.O. Box 1046Blindern 0316 (Oslo), NorwayWebsite: http://www.med.uio.no/imb/nutri/index.html
J. RuprichNational Institute of Public Health (NIPH)Centre for the Hygiene of Food Chains inBrnoPalackeho Str. 1-361242 Brno, Czech Republic
L.T.J. PijlsInternational Life Sciences Institute (ILSI)EuropeAvenue E. Mounier 83, Box 6Brussels 1200, BelgiumWebsite: http://europe.ilsi.org/
M. AshwellAshwell Associates (Europe) Ltd.Ashwell StreetAshwell (Herts) SG7 5PZ, United KingdomWebsite: http://www.ashwell.uk.com
J.P. LambertLambert Nutrition Consultancy5 Britwell RoadWatlington (Oxon) OX49 5JSUnited Kingdom
Background
Most likely, the first true dietary recommendationswere proposed by Dr. Edward Smith in 1862 in re-sponse to a request from the British Privy Council.The council wanted to determine the least cost forwhich enough food could be purchased to preventstarvation and associated diseases among the popu-lation that was unemployed as the result of the eco-nomic depression of the time. Since then, many othernutrient recommendations have been proposed thatwere used for the planning of food supplies and rationscales during times of war and food shortages,
focussing merely on the prevention of deficiencies[23]. Due to the continuously increasing knowledgeon the physiological role of nutrients, and the healthconsequences of micronutrient deficient diets, theconcept of dietary and nutrient recommendations stillreceives much attention [37]. Nowadays most coun-tries in Europe have established their own nutrientrecommendations to assess the adequacy of dietaryintakes and to plan desirable dietary intakes both atthe individual and population level [1, 4–8, 11–16, 18,19, 22, 24–31, 34, 36, 39, 41–45, 50, 53]. These rec-ommendations serve as a basis for national or re-gional nutrition policies, nutritional educationprograms, food regulations and action programs.
dations, they may vary fromcountry to country. This results indifferent national recommenda-tions causing confusion for policy-makers, health professionals,industry, and consumers withinEurope. EURRECA (EURopeanmicronutrient RECommendationsAligned) is a network of excellencefunded by the European Commis-sion (EC), and established toidentify and address the problemof differences between countries inmicronutrient recommendations.The objective of this paper is togive an overview of the availablemicronutrient recommendationsin Europe, and to provide infor-mation on their origin, conceptsand definitions. Furthermore thispaper aims to illustrate the diver-sity in European recommenda-tions on vitamin A and vitamin D,and to explore differences andcommonalities in approaches thatcould possibly explain variationsobserved.Methods A questionnaire wasdeveloped to get information onthe process of establishing micro-nutrient recommendations. Thesequestionnaires were sent to keyinformants in the field of micro-nutrient recommendations tocover all European countries/re-gions. Also the latest reports onnutrient recommendations inEurope were collected. Standardi-sation procedures were defined to
enable comparison of the recom-mendations. Recommendationsfor vitamin A and vitamin D werecompared per sex at the ages 3,9 months and 5, 10, 15, 25, 50 and70 years. Information extractedfrom the questionnaires and re-ports was compared focusing on:(1) The concept of recommenda-tion (recommended daily allow-ance (RDA), adequate intake (AI)or acceptable range), (2) The yearof publication of the report (proxyfor available evidence), (3) Popu-lation groups defined, (4) Othermethodological issues such asselected criteria of adequacy, thetype of evidence used, andassumptions made.Results Twenty-two countries, theWorld Health Organization(WHO)/the Food and AgricultureOrganization of the United Na-tions (FAO) and the EC have theirown reports on nutrient recom-mendations. Thirteen countriesbased their micronutrient recom-mendations on those from othercountries or organisations. Fivecountries, WHO/FAO and the ECdefined their own recommenda-tions. The DACH-countries (Ger-many, Austria and Switzerland) aswell as the Nordic countries(Norway, Sweden, Finland, Den-mark and Iceland) cooperated insetting recommendations. Greeceand Portugal use the EC and theWHO/FAO recommendations,
respectively and Slovenia adoptedthe recommendations from theDACH-countries. Rather than byconcepts, definitions, and definedpopulation groups, variability ap-pears to emerge from differencesin criteria for adequacy, assump-tions made and type of evidenceused to establish micronutrientrecommendations.Discussion The large variation incurrent micronutrient recommen-dations for population groups asillustrated for vitamin A and vita-min D strengthens the need forguidance on setting evidence based,up-to-date European recommen-dations. Differences in endpoints,type of evidence used to set rec-ommendations, experts’ opinionsand assumptions are all likely tocontribute to the identified varia-tion. So far, background informa-tion was not sufficient transparentto disentangle the relative contri-bution of these different aspects.Conclusion EURRECA has anexcellent opportunity to developtools to improve transparency onthe approaches used in settingmicronutrient recommendations,including the selection of criteriafor adequacy, weighing of evidence,and interpretation of data.
j Key words micronutrients –recommendations –nutrient requirements –EURRECA
18 European Journal of Nutrition (2008) Vol. 47 Supplement 1� Steinkopff Verlag 2008

In 1993, the European Commission (EC) definedpopulation reference intakes (PRIs) to be used forfood labelling in Europe [6].
The approach to establish nutrient recommenda-tions has changed over the course of time. The clas-sical paradigm focused on an adequate intake ofnutrients via food to prevent deficiencies based onclinical trials. In 1994, the Food and Nutrition Boardof the Institute of Medicine (IOM) introduced dietaryreference intakes (DRIs) for the United States ofAmerica and Canada including many aspects of theconceptual framework from the report published inthe United Kingdom [36]. These DRIs represented aparadigm shift in the way nutrient recommendationswere established and used by practitioners, educators,and researchers. Besides the prevention of deficien-cies, DRIs were intended to help individuals optimizetheir health, prevent disease, and avoid consumingtoo much of a nutrient. Furthermore the IOM para-digm placed greater emphasis on the distribution ofnutrient requirements within a population, ratherthan on a single value and they quantified the rela-tionship between a nutrient and the risk of diseasebased on scientific evidence [35].
In Table 1 the classical paradigm and the newparadigm as presented by the IOM are shown.
The DRIs included four nutrient-based referencevalues: estimated average requirement (EAR), therecommended dietary allowance (RDA), the adequateintake (AI) and the tolerable upper intake level (UL).The EAR is defined as the average daily nutrient in-take level that is estimated to meet the requirementsof half of the healthy individuals in a particular life-stage and gender group. The RDA represents theaverage daily dietary nutrient intake level that issufficient to meet the nutrient requirements of nearly
all (97–98%) healthy individuals in a particular life-stage and gender group. When an RDA cannot bedetermined, an AI is estimated which is the recom-mended average daily intake level based on observedor experimentally determined approximations orestimates of nutrient intake by a group (or groups) ofapparently healthy people that are assumed to beadequate. The UL is outside the scope of this paper[35].
Pavlovic et al. [37], King et al. [21] and Prenticeet al. [38] compared a selection of European nutrientrecommendations to provide an overview of existingdifferences in terminologies and reference values. Thecountries/organisations included were: the Nordiccountries (Norway, Sweden, Denmark, Finland andIceland), the DACH-countries (Germany, Austria andSwitzerland), the United Kingdom, the Netherlands,Italy, World Health Organization (WHO)/Food andAgricultural Organization of the United Nations(FAO), and EC. From these comparisons, it appearedthat often nutrient recommendations have beenestablished involving small and select committees ofexperts. As yet there is no standard approach forderiving nutrient recommendations, they vary fromcountry to country. This occurs even for well-definedpopulation groups that are assumed to have the samephysiological requirements. Given the lack of stan-dardized methodologies, some nations/organisationsprovide, for example, one single recommendation forall adults grouped together, while others provide rec-ommendations separately for males and females [21].
Besides such differences in methodologies, na-tional recommendations are reviewed at differenttimes so they may not always be based on the samemost up-to-date scientific information. Furthermore,cultural and regional factors may affect the weighing
Table 1 Paradigm of nutrition science: classical and extensions of the twenty-first century
+ Classical Twenty-first century
Scientific domain • Essential nutrients (±50)• Biological effects• Adequate intake via food
• Essential nutrients and bio-active food components• Biological effects• Adequate intake via food, supplements
and ‘‘functional foods’’• Avoid toxic levels
Basis for nutrient recommendation(criteria for adequacy)
• Prevention of deficiency diseases • Prevention of deficiency diseases• Prevention of chronical diseases (optimal health)
Variables taken into account forrecommendation (assumptions)
• Age, sex, physical activity, body weight• Made up for groups
• Age, sex, physical activity, body weight• Ethnicity• Heredity• Genetic predisposition for disease• Made up for groups and individuals• Food patterns• Lifestyle and environment
Scientific Base (type of evidence) • Clinical ‘‘depletion-repletion’’ model • Epidemiology: Meta-analyses and RCT provide bestfunded evidence
Based on IOM [35] and van Staveren [46]
E. L. Doets et al. 19European micronutrient recommendations

of evidence and the decision process. This results indifferent national recommendations causing confu-sion for policy-makers, health professionals, industry,and consumers within Europe.
Harmonisation will improve the objectivity andtransparency of values that are derived by variousnational, regional and international groups. Whereharmonisation is not possible, transparency is neededon the approaches to establish recommendations.This will improve understanding and explanation ofpotential differences between recommendations andsimplifies their application in policy making.
j EURRECA Network of Excellence(www.eurreca.org)
EURRECA (EURopean micronutrient RECommenda-tions Aligned) is a network of excellence funded bythe EC and established to identify and address theproblem of differences between countries in micro-nutrient recommendations. It is originally made up of34 partners based in 17 countries, drawn not onlyfrom nutrition science but also from industry, con-sumer groups, national nutrition societies and healthprofessions. Based on previous experiences of theUniversity of the United Nations (UNU) [20] andthe International Life Sciences Institute (ILSI) in theWHO South-East Asia Region [17], EURRECA workstowards a general framework including harmonizedapproaches, methods and key terms to be used for thedevelopment of micronutrient recommendations.This general framework will supply a basis for the useof micronutrient recommendations across countries/regions for establishing public and clinical healthobjectives, food and nutrition policies, and foraddressing trade and regulatory issues [21].
Further details on the network can be found in thearticle by Ashwell et al. [2].
j Aims and objectives
One of the research activities within EURRECA (Re-search Activity 1.4: Current Recommendations forpopulation groups) aims to collate, compare andcritically evaluate existing micronutrient recommen-dations for all population groups set by Europeancountries/organisations. The objective of this paper isto give an overview of the availability of nutrient rec-ommendations in Europe and to provide informationon the origin, concepts and definitions used, andpopulation groups defined. Furthermore this papershows the diversity in European recommendations onvitamin A and vitamin D, and aims to explore differ-ences and commonalities in approaches that couldpossibly explain variations observed. These two
nutrients were selected because vitamin D already hadsome attention in earlier stages of the EURRECA net-work and vitamin A was selected because much workon this nutrient was already done by the authors. In thenear future other nutrients will be studied and more indepth comparisons will be made. The results of theseexplorations will be used to identify gaps and oppor-tunities on which subsequent activities within EUR-RECA can build.
Methods
j Data collation
To obtain a comprehensive overview of currentlyused concepts and methods in European countries, aquestionnaire was developed by the Division ofHuman Nutrition of Wageningen University and Re-search Centre (WUR) in the Netherlands in cooper-ation with the Food, Consumer Behaviour and HealthResearch Centre of the University of Surrey in theUnited Kingdom. Questions addressed three stages ofthe process of micronutrient policy development. Thefirst stage concerned the approach for setting micro-nutrient recommendations, while the other twoinvestigated the process from micronutrient recom-mendations to nutrition policies and options andapplications for public health policy. Only the firststage will be reported in this overview.
The questionnaire included open-ended questionson the process of setting up recommendations andclose-ended questions on the people involved in theprocess and the type of evidence used. Each of the 11questions addressed the nutrients considered to bemost relevant to public health: vitamins A, D, E, C,thiamin (B1), riboflavin (B2), niacin (B3), pyridoxine(B6), cobalamin (B12), folic acid (B11), sodium,potassium, calcium, magnesium, iron, zinc, copper,phosphorus, selenium, and iodine.
Questionnaires were distributed among sevenEURRECA partners, (University of Oslo (Norway),National Institute of Public Health (Czech Republic),Institute for Medical Research (Serbia), WarsawAgricultural University (Poland), University CollegeCork (Ireland), WHO Regional Office for Europe, andWUR, in August 2007. Subsequently, these partnerssent the questionnaires to key informants in the fieldof micronutrient recommendations to cover allEuropean countries/regions. Key-informants wereasked to fill out the questionnaire, if necessary withhelp of others, and return it in September 2007 alsoproviding the latest report(s) on nutrient recommen-dations. After the deadline had expired, the key-informants of the missing countries were followed upto increase response rate.
20 European Journal of Nutrition (2008) Vol. 47 Supplement 1� Steinkopff Verlag 2008

Table 2 List of European countries with published micronutrient recommendations and their recommendation report’s origin
Country/organisation Source Origin Remark
Year Ref no. Own Shared Adopted No info.provided
Albania 2005 [4] · Adopted from literature, especially from the Linus PaulingInstitute (http://lpi.oregonstate.edu/)
Austria 2000 [13] · Shared document with Germany and SwitzerlandBelgiuma 2006 [16] · · Based on WHO [48], EC (1990) [no ref. provided], European
countries that are geographically and culturally related toBelgium, e.g. UK [36], Netherlands [33] and France [25]
Federation of Bosniaand Herzegovinab
2000 [5] · Adopted from unknown source(s)
Republika of Srpskab 2005 [39] · · Based on WHO [40, 48–51], WHO/FAO [9] and IOM [10]Bulgaria 2005 [27] · · Based on IOM [10] and WHO [2]Croatia 2004 [7] · · Aligned with EU legislationCzech Republic Not published · Adopted from Nutrition Society [no ref. provided] and EC [6]Denmark 2004 [34] · Shared document with Finland, Iceland, Norway, SwedenEstonia 2006 [45] · · Based on Nordic Council of Ministers [34]Finland 2004
2005[34][31]
· · Shared document (Denmark, Iceland, Norway, Sweden) is trans-lated into own country specific document
France 2001 [25] ·Germany 2000 [13] · Shared document with Austria and SwitzerlandGreece 1993 [6] · Adopted from EC [6]Hungary 2005 [1] · · Based on EC [6] and IOM [10]Iceland 2004
2006[34][43]
· · Shared document (Denmark, Finland, Norway, Sweden) istranslated into own country specific document; Ownrecommendations for vitamin D and calcium
Ireland 1999 [12] · · Adopted from EC [6] and UK [36]; Own recommendations forfolate, iron, calcium, vitamin C
Italy 1996 [42] · · Based on NRC [32] and EC [6]Latvia 2001 [22] ·Lithuania 1999 [24] ·Netherlands 1992
20002003
[11][14][15]
·
Norway 20042005
[34][8]
· · Shared document (Denmark, Finland, Sweden, Iceland) istranslated into own country specific document
Poland 1996 [53] · · Based on NRC [10], UK [36] and EC [6]Portugal 2004 [50] · Adopted from WHO/FAO (2004) [50]Romania 1990 [18] ·Russian Federationa 1991 [29] · Valid from 1991, publication year 1992Serbia 1994 [41] · · Adopted from unknown source(s)Slovakia 1997 [19] · · Adopted from unknown source(s)Slovenia 2004 [26] · Adopted from Austria, Germany, Switzerland (2004) [13]Spaina 2007 [30] · · Adopted from unknown sources. Published as a book chapterSweden 2004
2005[34][44]
· · Shared document (Denmark, Finland, Iceland, Norway) istranslated into own country specific document
Switzerland 2000 [13] · Shared document with Austria and Germany; Ownrecommendations for Iodine
The former YR Macedonia 2001 [28] · · Based on recommendations of Former Republics of Yugoslavia(based on WHO) and UK [no ref. provided]
United Kingdom 1991 [36] ·ECa 1993 [6] ·WHO/FAOa 2004 [50] ·
Based on questionnaire primarily and recommendation report (when available) secondarily. Montenegro is excluded from the list because no questionnaire norrecommendation report was available for the authoraBased on recommendation report onlybEntities of Bosnia and HerzegovinaThe former YR Macedonia = The former Yugoslav Republic of Macedonia; EC European Commission, WHO/FAO World Health Organization/Food and AgriculturalOrganizationOwn country specific recommendations developedShared recommendations set by one collaborative committee representing different countriesAdopted recommendations borrowed from other nation/organization
E. L. Doets et al. 21European micronutrient recommendations

Table 3 Description of currently available recommendations across Europe*
Source Type/concept used Equivalent toDRI/RDA/AI/Acceptable range
Description Micronutrients
Country Year Ref no.
Albania 2005 [4] RDAQ Insufficient info provided Recommended Dietary Allowance,which is based on the biological needsfor the normal individual of 23 to55 years
All
Belgium 2006 [16] Recommended Die-tary Allowance
DRI General term for the set of recom-mendations
All
Recommended dailyamount of absorption
RDA AR + 2SD, covering at least 97.5% ofthe population
All, except for vitamin D, sodium,potassium, iodine, copper
Acceptable dailyamount of absorption
AI/Acceptable range Recommended daily absorption amountof adequate intake is the lowest level ofintake, estimated, and covers practicallythe entire population: the adequateintake. This figure will be higher thenthe RDA in most cases
Vitamin D, sodium, potassium,iodine, copper
Bulgaria 2005 [27] DRI DRI General term for the set of recom-mendations
All
RDA RDA Recommended Dietary Allowance is theAR + 2SD
All, except for calcium, sodium,potassium
AI AI Adequate Intake is the estimation ofthe lowest intake level that seemssufficient for almost all people in agroup
Calcium, sodium, potassium
DACH countries 2000 [13] Reference value fornutrient intake
DRI General term for the set of recom-mendations
All
Recommended Nutri-ent Intake (RNI)
RDA AR + 2SD. These amounts should coverthe needs of nearly 98% of the popu-lation and protect against deficiencyrelated damage to health
All, except for vitamin E, sodium,potassium, copper, selenium
Estimated value foradequate intake
AI/Acceptable range Estimated values for Adequate Intake,using data that, though supported byexperiment and mostly derived fromintakes of healthy, well nourishedgroups, have not been adequately val-idated
Vitamin E, sodium, potassium,copper, selenium
Estonia 2006 [45] Recommended Intake(RI)
Insufficient info provided Average daily intake over time, for usein planning diets for groups
All
France 2001 [25] ANC DRI General term for the set of recom-mendations
All
PRI RDA Recommended Dietary Intake is theAR + 2SD
All, except for vitamin D, vitamin E,folate, riboflavin, thiamin, selenium,iodine
AI AI The adequate intakes have been set onthe basis of the observed deficiencythresholds, from the state of the re-serves and sometimes from the quan-tities usually consumed with noapparent impact on health
Vitamin D, vitamin E, folate, ribo-flavin, thiamin, selenium, iodine
Hungary 2005 [1] safe intake na Recommendation for 100% of thepopulation, based on EAR
All, except for sodium
maximum intake na No information provided SodiumIreland 1999 [12] Recommended Die-
tary Allowance (RDA)DRI General term for the set of recom-
mendationsAll
Recommended DailyAllowance (RDA)
RDA AR + 2SD All
Italy 1996 [42] RDA (LARN) RDA Recommended Daily Intake is theAR + 2SD. This procedure guaranteesthe coverage of the basic nutritionalneeds of over 97% of the population
All, except for vitamin E, sodium,magnesium
Acceptable intakerangeQ
Acceptable range no information provided Vitamin E, sodium, magnesium
Latvia 2001 [22] Recommended aver-age Daily Intake
insufficient info provided no information provided All
22 European Journal of Nutrition (2008) Vol. 47 Supplement 1� Steinkopff Verlag 2008

Table 3 Continued*
Source Type/concept used Equivalent toDRI/RDA/AI/Acceptable range
Description Micronutrients
Country Year Ref no.
Lithuania 1999 [24] RDA RDA AR + 2SDQ AllNetherlands 1992
20002003
[11][14][15]
RDA (ADH) DRI General term for the set of recom-mendations
All
RDA RDA Recommended Amount is the EAR +2SD
Vitamin B6, vitaminB12, folate, thiamin,riboflavin, niacin
AI AI Adequate Intake is an estimation of thelowest intake level that seems sufficientfor almost all people in a group;defined in case the EAR is not known
All, except for magne-sium, zinc, copper,phosphorus, selenium
Adequate area ofIntake
Acceptable range Adequate Intake is an estimation of thelowest intake level that seems sufficientfor almost all people in a group;defined in case the EAR is not known
Magnesium, zinc,copper, phosphorus,selenium
Nordic countries 2004 [34] Recommended Intake(RI)
RDA The amount of a nutrient that accord-ing to present knowledge can meet theknown requirement and the maintaingood nutritional status among practi-cally all healthy individuals
All
Poland 1996 [53] Safe intake level (s.l.) RDA Safe intake level is the amount ofnutrient which is adequate to meetnutritional needs of 97.5% of all indi-vidual in a group: mean for group +2SD: used for assessment
All, except for copper,sodium, potassium
Recommended intake(r.i.)
na Recommended intake is the amount ofnutrient which is adequate to meetnutritional needs of 100% of all indi-vidual in a group and is dedicated toplanning diets for groups
All, except for copper,sodium, potassium
Recommended safelevel (r.s.l)
Acceptable range Range based on observations thatindividual consumption within thislimits appears satisfactory and neitherdeficiency nor signs of excess are seen,used when there is no data to establishrecommendation as one number
Copper
Minimal intake (m.i.) AI/Acceptable range ranges and values considering thenecessity of reducing salt consumption
Sodium, potassium
Romania 1990 [18] Recommendedamounts
DRI General term for the set of recom-mendations
All
RDAQ insufficient info provided Physiological needs / Recommendedamounts
All
Russian Federation 1991 [29] Recommended levelof intake
Insufficient info provided Criterion for assessment of nutritionaladequacy
All, except for copper
Safe level of intake AI Where a recommended level of intakeis not possible to establish
Copper
Serbia 1994 [41] Recommended dietaryallowance (DP)
RDApc DP = daily needs All
Slovakia 1997 [19] RDA (OVD) Insufficient info provided Recommended Dietary Allowance forpopulation groups, intended for pro-duction, consumption and as theground for diets and food based dietaryguidelines
All
Spain 2007 [30] no information pro-vided
Insufficient info provided no information provided No informationprovided
The former YR Macedonia 2001 [28] Recommended DailyAllowance (RDA)
Insufficient info provided insufficient info provided All (ranges for copper,selenium, sodium,potassium)
E. L. Doets et al. 23European micronutrient recommendations

j Data extraction
Both the completed questionnaires and the recom-mendation reports were used to extract micronutrientrecommendations, information on their origin, the ap-proach used for estimating them, definitions and con-cepts, scientific evidence used, and population groupsconsidered. Any unclear information given in the re-turned documents was re-checked with the key-infor-mants to be sure that correct information was extracted.
j Comparison of recommendations for vitamin A andvitamin D
As micronutrient recommendations usually consist ofvalues, ranges, multiple values applying to one popu-lation group, (for example values for different activitylevels), or additional amounts for sub groups (forexample pregnant females), standardisation proce-dures were defined to enable comparison of the rec-ommendations. In case of multiple recommendations
Table 3 Continued*
Source Type/concept used Equivalent toDRI/RDA/AI/Acceptable range
Description Micronutrients
Country Year Ref no.
United Kingdom 1991 [36] Dietary reference Va-lue (DRV)
DRI General term for the set of recom-mendations
All
Recommended Nutri-ent Intake (RNI)
RDA EAR + 2SD All, except for copper,iodine, potassium, sele-nium, sodium
Safe intake AI/acceptable range A level or range of intakes at whichthere is no risk on deficiency and belowa level where there is a risk of unde-sirable effects
Copper, iodine, potas-sium, selenium, so-dium
EC 1993 [6] PRI RDA Population Reference Intake is theAR + 2SD, covering at least 97.5% ofthe population
All, except for vitaminD, sodium, magne-sium
Acceptable range Acceptable range Acceptable Range of Intake is therewhere data are inadequate for makingrecommendations, and based onobservations that individual consump-tions within these limits appears satis-factory in that neither deficiency norsigns of excess are seen
Vitamin D, sodium,magnesium
WHO/FAO 2004 [50] Recommended Nutri-ent Intake (RNI)
RDA Recommended Nutrient Intake isEAR + 2SD, which meets the nutrientrequirements of almost all (97.5%)apparently healthy individuals in anage- and sex-specific population
All, except for vitaminE, vitamin A
Recommended safeintake level
AI level of intake that prevents clinicalsigns of deficiency and allows normalgrowth, but is doe not protect vitaminA status during prolonged periods ofinfection or other deceases
Vitamin A
Acceptable intake AI Best estimate of requirement, becausedata was not strong enough to for-mulate recommendations
Vitamin E
*Based on recommendation report. Croatia, Federation of Bosnia and Herzegovina and Republika of Srpska (entities of Bosnia and Herzegovina) and Montenegro areexcluded from the table because no recommendation report was available for the author and information could not be extracted from the questionnaire. The CzechRepublic was excluded due to lack of published sourceDACH countries = Austria, Germany, Switzerland; Nordic countries = Denmark, Finland, Iceland, Norway, Sweden; The former YR Macedonia = The former YugoslavRepublic of Macedonia, EC European Commission, WHO/FAO World Health Organization/Food and Agricultural OrganizationFootnotes in local language were not taken into accountQ based on questionnaire onlypc personal communicationDRI Dietary Reference Intake = General term for the set of recommendations [35]RDA Recommended Dietary Allowance = (Estimated) Average Requirement + 2 standard deviation [(E)AR + 2SD] = Daily dietary intake level of a nutrientconsidered sufficient to meet the requirements of 97–98% of healthy individuals in each life-stage and gender group [35]AI Adequate Intake = The derived intake by a defined population group that appears to sustain health, used when there are insufficient primary data to establish astatistical distribution of individual requirements [35]na not applicable = a concept derived from the RDAAll vitamins A, D, E, C, B1, B2, B3, B6, B12, folic acid, sodium, potassium, calcium, magnesium, iron, zinc, copper, phosphorus, selenium, iodine (if applicable)
24 European Journal of Nutrition (2008) Vol. 47 Supplement 1� Steinkopff Verlag 2008

Tab
le4
Char
acte
ristic
sof
popu
latio
ngr
oups
asob
serv
edin
Die
tary
Refe
renc
eIn
take
docu
men
tsof
diff
eren
tEu
rope
anco
untr
ies*
Sour
ceAg
eO
ther
char
acte
ristic
s
Coun
try
Year
Ref
no.
Age
span
Age
grou
ps0–
12m
onth
sAg
egr
oups
1–18
year
sAg
egr
oups
adul
ts(y
ears
)U
pper
age
grou
p(y
ears
)
Alba
niaa
2005
[4]
All
ages
0–6,
7–12
1–3,
4–8,
9–13
,14
–18
(m/f
)‡1
9(m
/f)
‡19
Pan
dL:
age
£18
year
s,‡1
9yea
rsBe
lgiu
mb
2006
[16]
All
ages
0–12
1–3,
4–6,
7–10
,11–
14,
15–
18(m
/f)
19–
59(m
/f),
‡60
(m/f
)‡6
0P,
L
Bulg
aria
c20
00[2
7]Al
lag
es0–
5,6–
121–
2,3–
6,7–
9,10
–13
(m/f
),14
–18
(m/f
)19
–29
(m/f
),30
–59
(m/f
),60
–75
(m/f
),‡7
6(m
/f)
‡76
Pan
dL:
age
£18
year
s,‡1
9ye
ars
DAC
Hco
untr
iesd
2000
[13]
All
ages
0–3,
4–12
1–3,
4–6,
7–9,
10–
12,
13–
14(m
/f),
15–
18(m
/f)
19–
24(m
/f),
25–
50(m
/f),
51–
64(m
/f),
‡65
(m/f
)‡6
5P:
‡4m
onth
s,L
Esto
nia
2006
[45]
‡6m
onth
s6–
121,
2–5,
6–9,
10–
13(m
/f),
14–
17(m
/f)
18–
30(m
/f),
31–
60(m
/f),
61–
74(m
/f),
‡75
(m/f
)‡7
5P,
L
Fran
cee
2001
[25]
All
ages
0–12
1–3,
4–6,
7–9,
10–
12,
13–
15(m
/f),
16–
19(m
/f)
20–
74(m
/f),
‡75
‡75
P,L
Hun
gary
2005
[1]
All
ages
0–6,
7–24
2–3,
4–6,
7–10
,11
–14
(m/f
),15
–18
(m/f
)19
–30
(m/f
),31
–60
(m/f
),‡6
1‡6
1P,
L
Irela
nd19
99[1
2]Al
lag
es0–
3,4–
6,7–
9,10
–12
1–3,
4–6,
7–10
,11
–14
(m/f
),15
–17
(m/f
)18
–64
(m/f
),‡6
5(m
/f)
‡65
P:se
cond
half,
L:fir
st6
mon
ths
Italy
f19
96[4
2]‡6
mon
ths
6–12
1–3,
4–6,
7–10
,11–
14,
15–
17(m
/f)
18–
29(m
/f),
30–
59(m
),30
–49
(f),
‡60
(m),
‡50
(f)
‡60
(m),
‡50
(f)
P,L
Latv
iag
2001
[22]
All
ages
0–6,
7–12
1–3,
4–6,
7–10
,11–
14,
15–
18‡1
9‡1
9P,
L
Lith
uani
a19
99[2
4]£6
4ye
ars
0–3,
4–6,
7–9,
10–
121–
3,4–
6,7–
10,
11–
14(m
/f),
15–
18(m
/f)
19–
34(m
/f),
35–
49(m
/f),
50–
64(m
/f)
50–
64P
and
L:4
PAle
vels
and
2bo
dyw
eigh
ts.
PA:
4le
vels
(m/f
)an
d2
body
wei
ghts
(m),
2bo
dyw
eigh
ts(f
)N
ethe
rland
sh19
9220
0020
03
[11]
[14]
[15]
All
ages
0–5,
6–12
1–3
(m/f
),4–
6(m
/f),
7–9
(m/f
),10
–12
(m/f
),13
–15
(m/f
),16
–18
(m/f
)
19–
21(m
/f),
22–
49(m
/f),
50–
64(m
/f),
‡65
(m/f
)‡6
5P,
L
Nor
dic
coun
trie
si20
04[3
4]Al
lag
es0–
5,6–
121,
2–5,
6–9,
10–
13(m
/f)
,14
–17
(m/f
)18
–30
(m/f
),31
–60
(m/f
),61
–74
(m/f
),‡7
5(m
/f)
‡75
P,L
Pola
nd19
96[5
3]Al
lag
es0–
5,6–
121–
3,4–
6,7–
9,10
–12
(m/f
),13
–15
(m/f
),16
–18
(m/f
)
19–
25(m
/f),
26–
59(m
/f),
‡60
(m/f
)‡6
0P,
L,PA
:3
leve
ls(a
ges
19–
59ye
ars)
Rom
ania
1990
[18]
All
ages
0–12
1–3,
4–6,
7–9,
10–
12,
13–
15(m
/f)
16–
19(m
/f),
20–
45(m
/f),
46–
62(m
),46
–60
(f),
‡63
(m),
‡61
(f)
‡63
(m),
‡61
(f)
PA:
3le
vels
(age
s20
–60
year
s)
Russ
ian
Fede
ratio
nj19
91[2
9]Al
lag
es0–
3,4–
6,7–
121–
3,4–
6,7–
10,
11–
13(m
/f),
14–
17(m
/f)
18–
29(m
/f),
30–
39(m
/f),
40–
59(m
/f),
60–
74(m
/f),
‡75
(m/f
)
‡75
P,L:
age
<7
m,
‡7m
,PA
:5
leve
ls(m
),4
leve
ls(f
)(a
ges
18–
59y)
Serb
iak
1994
[41]
1–14
year
sno
tse
t1,
2,3–
4,5–
6,7–
9,10
–11
(m/f
),12
–14
(m/f
)
not
set
12–
14da
ilyne
eds
grou
p,pr
e-sc
hool
-and
-sch
ool
inst
itu-
tion
grou
p
E. L. Doets et al. 25European micronutrient recommendations

Tab
le4
Cont
inue
d*
Sour
ceAg
eO
ther
char
acte
ristic
s
Coun
try
Year
Ref
no.
Age
span
Age
grou
ps0–
12m
onth
sAg
egr
oups
1–18
year
sAg
egr
oups
adul
ts(y
ears
)U
pper
age
grou
p(y
ears
)
Slov
akia
1997
[19]
All
ages
0–6,
7–12
1–3,
4–6,
7–10
,11
–14
(m/f
),15
–18
(m/f
)19
–34
(m/f
),35
–59
(m),
60–
74(m
),35
–54
(f),
55–
74(f
),‡7
5(m
/f)
‡75
P,L,
PA:
4le
vels
(age
s19
–59
year
s(m
)an
d19
–54
year
s(f
)),
2le
vels
(age
s15
–18
year
s)Sp
ainl
2007
[30]
All
ages
0–5,
6–12
1–3,
4–5,
6–9,
10–1
2(m
/f),
13–1
5(m
/f)
16–
19(m
/f),
20–
39(m
/f),
40–
49(m
/f),
50–
59(m
/f),
‡60
(m/f
)
‡60
P:se
cond
half,
L
The
form
erYR
Mac
edon
ia20
01[2
8]Al
lag
es0–
3,4–
6,7–
9,10
–12
1–3,
4–6,
7–10
,11
–14
(m/f
),11
–14
(m/f
),15
–18
(m/f
)
19–
24(m
/f),
25–
50(m
/f),
51–
64(m
/f),
‡65
(m/f
)‡6
5P,
L,pr
esch
ool-i
n-ki
nder
-ga
rten
and
scho
olin
stitu
-tio
ngr
oup
Uni
ted
King
dom
m19
91[3
6]Al
lag
es0–
3,4–
6,7–
9,10
–12
1–3,
4–6,
7–10
,11
–14
(m/f
),15
–18
(m/f
)19
–50
(m/f
),‡5
1(m
/f)
‡51
P,L:
>4
mon
ths,
<4
mon
ths
ECn
1993
[6]
‡6m
onth
s6–
121–
3,4–
6,7–
10,
11–
14(m
/f),
15–
17(m
/f)
‡18
(m/f
)‡1
8P,
L
WH
O/F
AOo
2004
[50]
All
ages
0–6,
7–12
1–3,
4–6,
7–9,
10–
18(m
/f)
19–
50(m
/f),
51–
65(m
/f),
‡66
‡66
P,L
*Bas
edon
reco
mm
enda
tion
repo
rt.
Croa
tia,
Fede
ratio
nof
Bosn
iaan
dH
erze
govi
naan
dRe
publ
ika
ofSr
pska
(ent
ities
ofBo
snia
and
Her
zego
vina
)an
dM
onte
negr
oar
eex
clud
edfr
omth
eta
ble
beca
use
nore
com
men
datio
nre
port
was
avai
labl
efo
rth
eau
thor
and
info
rmat
ion
coul
dno
tbe
extr
acte
dfr
omth
equ
estio
nnai
re.
The
Czec
hRe
publ
icw
asex
clud
eddu
eto
lack
ofpu
blis
hed
sour
ce.
Nor
dic
coun
trie
s=
Den
mar
k,Fi
nlan
d,Ic
elan
d,N
orw
ay,
Swed
en;
The
form
erYR
Mac
edon
ia=
The
form
erYu
gosl
avRe
publ
icof
Mac
edon
ia;
EC=
Euro
pean
Com
mis
sion
;W
HO
/FAO
Wor
ldH
ealth
Org
aniz
atio
n/Fo
odan
dAg
ricul
tura
lO
rgan
izat
ion
mm
ale,
ffe
mal
e ,m
/fRe
com
men
datio
nsde
fined
for
mal
esan
dfo
rfe
mal
esse
para
tely
;th
ese
reco
mm
enda
tions
dono
tha
veto
diff
erbe
twee
nm
ales
and
fem
ales
,
Ppr
egna
ncy,
Lla
ctat
ion,
PAph
ysic
alac
tivity
,Q
base
don
ques
tionn
aire
only
a Vit
D,
E,B1
2,fo
late
,so
dium
,po
tass
ium
,ca
lciu
m,
mag
nesi
um,
iron,
copp
er,
phos
phor
us,
sele
nium
,io
dine
:no
sepa
rate
reco
mm
enda
tion
for
mal
ean
dfe
mal
e.Vi
tC:
sepa
rate
reco
mm
enda
tions
for
mal
ean
dfe
mal
efo
ral
lage
grou
ps.V
itD
,E,B
6,B1
2,fo
late
,rib
ofla
vin,
thia
min
,nia
cin,
iron
(P),
sodi
um,p
otas
sium
,sel
eniu
m,c
oppe
r,io
dine
:no
sepa
rate
age
grou
psfo
rP
and
L.M
agne
sium
:£18
,19–
30ag
e,‡3
1ye
ars
for
Pan
dL.
Vit
D:1
9–50
,‡71
year
s.Vi
tB6
,B12
,cal
cium
:19–
50,‡
51ye
ars
(vit
B6(1
9–50
year
s),v
itB1
2,ca
lciu
m:n
ose
para
tere
com
men
datio
nsfo
rm
ale
and
fem
ale)
.Sod
ium
:19–
50,5
1–70
,‡71
year
san
dno
sepa
rate
reco
mm
enda
tions
for
mal
ean
dfe
mal
e.M
agne
sium
:19
–30
,‡3
1ye
ars
and
for
14–
18ye
ars
nose
para
tere
com
men
datio
nsfo
rm
ale
and
fem
ale
bM
iner
als:
0–5,
6–11
mon
ths.
Trac
eel
emen
ts:
0–3,
4–5,
6–11
mon
ths.
Iron
(11–
14,
15–
18an
d19
–59
year
s):
sepa
rate
reco
mm
enda
tion
for
men
stru
atin
g/no
n-m
enst
ruat
ing
wom
en.
Nat
rium
(0–
5,6–
11m
onth
s):
base
don
wei
ght
c Vit
C:se
para
tere
com
men
datio
nfo
rsm
oker
s.Fo
otno
tes
inlo
cal
lang
uage
wer
eno
tta
ken
into
acco
unt
dVi
tD
,C,B
12,f
olic
acid
,pho
spho
rus,
copp
er,s
elen
ium
and
Vit
B6(1
0–12
,13–
14ye
ars)
:no
sepa
rate
reco
mm
enda
tion
for
mal
e/fe
mal
e.Vi
tE,
Iodi
ne(1
–3,
4–6,
7–9
year
s):s
epar
ate
reco
mm
enda
tion
for
mal
e/fe
mal
e.Iro
n:se
para
tere
com
men
datio
nfo
rm
enst
ruat
ing/
non-
men
stru
atin
gw
omen
.Vit
C:se
para
tere
com
men
datio
nfo
rno
n-sm
oker
s/sm
oker
s.Ca
lciu
m,p
hosp
horu
s,m
agne
sium
:sep
arat
ere
com
men
datio
nfo
rP
and
Lfo
r<
19an
d‡1
9ye
ars
e Min
eral
s:1–
3,4–
6,7–
9,10
–12
,13–
19(m
/f),
20–
65(m
/f),
66–
74(m
),56
–74
(f),
‡75
year
s.Vi
tC:
sepa
rate
reco
mm
enda
tion
for
smok
ers
abov
ete
nci
gare
ttes
/day
and
for
preg
nant
wom
enin
the
third
trim
este
rf Iro
n:se
para
tere
com
men
datio
nfo
rm
enst
ruat
ing/
non-
men
stru
atin
gw
omen
.Ca
lciu
m(‡
50ye
ars)
:se
para
tere
com
men
datio
nfo
rpo
st-m
enop
ausa
lw
omen
with
/with
out
oest
roge
nth
erap
ygM
iner
als
(‡19
year
s):
sepa
rate
reco
mm
enda
tion
for
mal
esan
dfe
mal
eshCa
lciu
m,
vit
D,
thia
min
,rib
ofla
vin,
niac
in:
4–8,
9–13
,14
–18
,19
–50
,51
–70
,>
70ye
ars.
Vit
B6:
4–8,
9–13
,14
–18
,19
–50
,‡5
1ye
ars.
Vit
B12,
fola
te:
age
grou
ps:
4–8,
9–13
,14
–18
,‡1
9ye
ars.
Iron,
zinc
:fo
rpr
egna
ncy
sepa
rate
reco
mm
enda
tion
for
first
/sec
ond/
third
trim
este
r.Co
pper
:pre
gnan
cyth
irdtr
imes
ter.
Ribo
flavi
n,th
iam
in:s
epar
ate
reco
mm
enda
tion
for
mal
ean
dfe
mal
e.Ca
lciu
m,p
hosp
horu
s,zi
nc,V
itB6
(0–
5m
onth
s):
sepa
rate
reco
mm
enda
tion
for
brea
st-f
eedi
ng/b
ottle
feed
ing.
Vit
D:
sepa
rate
reco
mm
enda
tion
for
noex
posu
reto
sunl
ight
/lig
htco
lour
edsk
in/r
emai
nou
tdoo
rfo
rat
leas
t15
min
ada
yw
ithat
leas
tha
nds
and
face
unco
vere
d.Vi
tD
:se
para
tere
com
men
datio
nfo
r51
–60
and
61–
70ye
ars.
Vit
A:re
com
men
datio
npe
rgr
amPU
FA.
Zinc
(>3
mon
ths)
:se
para
tere
com
men
datio
n
26 European Journal of Nutrition (2008) Vol. 47 Supplement 1� Steinkopff Verlag 2008

for one population group, the mean of all given valueswas used. In case of a range, the mid value was used. Incases where recommendations were not given in themost common unit, values were converted into thatunit. Standardized recommendations for vitamin A andvitamin D were compared per sex at the ages 3,9 months and 5, 10, 15, 25, 50 and 70 years. These ageswere selected because they indicate points of time in thedifferent population groups as defined by countries.More population groups were defined for children andadolescents and therefore more ages between 0 and18 years were selected. Also comparisons of recom-mendations for pregnant and lactating females weremade. To depict the diversity between recommenda-tions for vitamin A and vitamin D, boxplots wereconstructed in SPSS version 12.0.
In exploring commonalities and differences be-tween micronutrient recommendations, backgroundinformation extracted from the questionnaires andrecommendation reports was compared focusing onthe following items that could help to explain thecommonalities and differences found:
1. The concept of recommendation (RDA, AI),2. The year of publication of the recommendations
(proxy for available evidence),3. Population groups for which recommendations
were defined,4. Other methodological issues from the paradigm
used to establish recommendations as selected cri-teria of adequacy or health endpoints (e.g. prevent-ing deficiencies, plasma concentration), the type ofevidence used (e.g. review of randomized controlledtrials (RCT), experts’ opinion), and assumptionsmade (e.g. physical activity, weight, sunlight).
Information on the first three items was extractedfrom the recommendation reports and informationon the last item came mainly from the questionnaires.
Results
j Data collation
Of the total 35 questionnaires sent out, 32 have beencompleted. No reaction after follow up was receivedfrom Montenegro and the Russian Federation. Noreaction from Iceland was received due to a delay insending the questionnaire.
From 31 European countries, WHO/FAO, and theEC the latest versions of reports on nutrient recom-mendations were collected, including varyingamounts of background documentation. At the timeof publication of this paper, reports from RepublikaSrpska (entity of Bosnia and Herzegovina) andCroatia had just become available and could thereforei Vi
tD
:sep
arat
ere
com
men
datio
nfo
rin
fant
s>
4w
eeks
and
elde
rlype
ople
with
little
orno
sun
expo
sure
.Fol
ate
(31–
60ye
ars)
:sep
arat
ere
com
men
datio
nfo
rw
omen
inre
prod
uctiv
eag
e/no
tin
repr
oduc
tive
age.
Iron:
reco
mm
enda
tion
acco
rdin
gto
mea
lcom
posi
tion,
and
sepa
rate
reco
mm
enda
tion
for
post
-men
opau
salw
omen
.Zin
c:se
para
tere
com
men
datio
nfo
rve
geta
rians
.Cal
cium
,pho
spho
rus
(18–
20ye
ars)
:sep
arat
ere
com
men
datio
nj Co
pper
:0–
5m
onth
s,7–
10,
11–
17,
‡18
year
sk M
iner
als:
nose
para
tere
com
men
datio
nfo
rm
ale
and
fem
ale
l Folic
acid
:re
com
men
datio
nfo
rfir
stan
dse
cond
half
ofpr
egna
ncy
mVi
tD
(‡51
year
s):
sepa
rate
reco
mm
enda
tion
for
£65/
>65
year
s.Th
iam
in:
reco
mm
enda
tions
for
last
trim
este
rof
preg
nanc
yon
lynTh
iam
in,n
iaci
n,vi
tB6
:rec
omm
enda
tion
acco
rdin
gto
body
wei
ght,
ener
gyor
prot
ein
inta
ke.T
hiam
in:r
ecom
men
datio
nfo
r>
10w
eeks
ofpr
egna
ncy.
Iron
(‡18
year
s):s
epar
ate
reco
mm
enda
tions
toco
ver
of96
and
90%
ofth
epo
pula
tion
and
post
men
opau
sal
wom
enoM
iner
als:
reco
mm
enda
tion
for
first
,se
cond
,th
irdtr
imes
ter
ofpr
egna
ncy,
and
0–3,
3–6,
7–12
mon
ths
ofla
ctat
ion.
Iodi
ne:
<5,
6–12
,13
–18
year
s(m
/f).
Zinc
:se
para
tere
com
men
datio
nfo
rth
ree
leve
lsof
bioa
vaila
bilit
y.Zi
nc(0
–12
mon
ths)
:se
para
tere
com
men
datio
nfo
rbr
east
feed
ing/
bott
lefe
edin
g.Iro
n:se
para
tere
com
men
datio
nfo
rfo
urle
vels
ofbi
oava
ilabi
lity.
Iron:
sepa
rate
reco
mm
enda
tion
for
pre-
men
arch
e/po
stm
enar
che.
Calc
ium
:sep
arat
ere
com
men
datio
nfo
rbr
east
feed
ing/
cow
milk
-fee
ding
.Mag
nesi
um:s
epar
ate
reco
mm
enda
tion
for
brea
stfe
edin
g/fo
rmul
afe
edin
g.Vi
tB6
(51–
65ye
ars,
m):
sepa
rate
reco
mm
enda
tion
for
19–
50/>
50ye
ars.
Vit
D(5
1–65
year
s,m
):se
para
tere
com
men
datio
nfo
r19
–50
/51–
65ye
ars
E. L. Doets et al. 27European micronutrient recommendations

not be included in this paper. Reports from Federa-tion of Bosnia and Herzegovina (entity of Bosnia andHerzegovina) and Montenegro were not received afterfollow up. No national report on nutrient recom-mendations has been published for the CzechRepublic, but among others they use the EC recom-mendations (J. Ruprich, Personal communication,January 2008).
j Available nutrient recommendations in Europe
Current publications on nutrient recommendations inEurope are listed in Table 2. Most of the reports (22out of 33) were published from the year 2000. Theoldest report dates from 1990 (Romania) and the mostrecent one is published in 2007 (Spain).
Table 2 also shows that 22 countries and WHO/FAO and the EC have their own reports on nutrientrecommendations (own, own + adopted and own +shared). Thirteen countries based their recommen-dations on those from other countries or organisa-tions (own + adopted). Five countries (France, Latvia,Lithuania, the Netherlands and the United Kingdom),WHO/FAO and the EC defined their own recom-
mendations (own). The DACH-countries as well asthe Nordic countries cooperated in setting recom-mendations, indicated by �shared’ in Table 2. Greeceand Portugal use the EC and the WHO/FAO recom-mendations respectively and Slovenia adopted therecommendations of the DACH-countries. The pub-lication from which Albania and Federation of Bosniaand Herzegovina adopted their recommendations wasnot clear. The origin of recommendations was un-known for 2 countries (Romania and the RussianFederation).
j Concepts and definitions used to definemicronutrient recommendations
Different terms have been used for the total set ofnutrient recommendations (DRIs, DRVs RDAs etc.).Within these sets, different terms have been used toexpress the levels of requirement and the certaintywith which they have been set. Though terminologydiffered substantially between countries (e.g. recom-mended nutrient intake, recommended daily amountof absorption, recommended intake, population ref-
Table 5 Overview of micronutrient recommendations on vitamin A (lg) for selected population groups in Europe*: males
Source Population group
Ref no. Year Country 3 months 9 months 5 years 10 years 15 years 25 years 50 years 70 years
[4] 2005 Albania 400 500 400 600 900 900 900 900[16] 2006 Belgium 350 350 400 500 700 700 700 700[27] 2005 Bulgaria 375 400 450 600 800 800 800 800[13] 2004 DACH countries 500 600 700 900 1,100 1,000 1,000 1,000[45] 2006 Estonia 300 350 600 900 900 900 900[25] 2001 France 350 350 450 550 700 800 800 800[1] 2005 Hungary 420 400 500 700 1,000 1,000 1,000 1,000[12] 1999 Ireland 350 350 400 500 700 700 700 700[42] 1996 Italy 350 400 500 700 700 700 700[22] 2001 Latvia 375 375 500 700 1,000 1,000 1,000 1,000[24] 1999 Lithuania 420 400 500 700 1000 800 800 800[11] 1992 Netherlands 450 400 500 1,000 1,000 1,000 1,000 1,000[34] 2004 Nordic countries 300 350 600 900 900 900 900[53] 1996 Poland 450 450 500 600 700 700 700 700[18] 1990 Romania 450 450 600 900 1,050 1087.5 1087.5 1,050[29] 1991 Russian Federation 400 400 500 700 1,000 1,000 1,000 1,000[41] 1994 Serbia 500 1000[19] 1997 Slovakia 400 400 500 700 1,000 950 950 850[30] 2007 Spain 450 450 300 1,000 1,000 1,000 1,000 1,000[28] 2001 The former YR Macedonia 375 375 400 700 1,000 1,000 1,000 1,000[36] 1991 United Kingdom 350 350 400 500 700 700 700 700[6] 1993 EC 350 400 500 700 700 700 700[50] 2004 WHO/FAO 375 400 450 600 600 600 600 600
*DACH countries = Austria, Germany, Switzerland; Nordic countries = Denmark, Finland, Iceland, Norway, Sweden; The former YR Macedonia = The formerYugoslav Republic of MacedoniaEC European Commission, WHO/FAO World Health Organization/Food and Agricultural OrganizationCroatia, Federation of Bosnia and Herzegovina and Republika of Srpska (entities of Bosnia and Herzegovina) and Montenegro are excluded from the table because norecommendation report was available for the author. The Czech Republic was excluded due to lack of published source
28 European Journal of Nutrition (2008) Vol. 47 Supplement 1� Steinkopff Verlag 2008

erence intake, acceptable range, recommended dailyallowance, acceptable intake range, recommendedaverage daily intake, safe intake level, minimal intake,recommended safe level), all these concepts could beconsidered as equivalent to three basic concepts: RDA,AI (as defined by IOM [35]) and the acceptable rangewhich is defined as a range of intakes high enough toavoid deficiency and low enough to avoid undesirabletoxic effects [6]. Only the Hungarian publication in-cluded a deviating term, safe intake, which is definedas the recommended level of intake that is sufficientfor 100% of the healthy population (Table 3). ForAlbania, Estonia, Latvia, Romania, Slovakia, Spain,and The former Yugoslav Republic of Macedonia, theconcept of the recommendation (RDA or AI) was notclear from the reports and questionnaires. For mostnutrients an RDA was defined, but for sodium,potassium, selenium, copper, vitamin D, vitamin E,and magnesium, an AI was often given instead. Be-sides a term considered equivalent to the RDA, thePolish recommendations also included the term rec-ommended intake, representing the intake that meetsthe nutritional needs of 100% individuals in a healthypopulation.
j Population groups
Age span
Table 4 lists the population groups encountered in thecollated reports on nutrient recommendations. Devi-ations from generally defined population groups percountry are given in foot notes. Table 4 shows thatexcept for a few countries, most recommendationscover all ages. Exceptions include Estonia, Italy, andthe EC, which do not give recommendations for in-fants under 6 months, and Serbia provides valuesonly for children ages 1–14 years. Lithuania coverspeople up to the age of 65 years.
Children and adolescents
The first year of life is split up in two to four agecategories. For the age span of 1–18 years, thegrouping of ages differs substantially: the number ofage categories varies between four and six and dif-ferent age cut-off points are used. All publications,except for the Netherlands, start to separate recom-mendations for males and females between the age of
Table 6 Overview of micronutrient recommendations on vitamin A (lg) for selected population groups in Europe*: females
Source Population group
Ref no. Year Country 3 months 9 months 5 years 10 years 15 years 25 years 50 years 70 years Pregnancy Lactation
[4] 2005 Albania 400 500 400 600 700 700 700 700 760 1250[16] 2006 Belgium 350 350 400 500 800 600 600 600 700 950[27] 2005 Bulgaria 375 400 450 600 700 700 700 700 775 1150[13] 2004 DACH countries 500 600 700 900 900 800 800 800 1,100 1500[45] 2006 Estonia 300 350 600 700 700 700 700 800 1,100[25] 2001 France 350 350 450 550 600 600 600 600 700 950[1] 2005 Hungary 420 400 500 700 800 800 800 800 1,000 1,200[12] 1999 Ireland 350 350 400 500 600 600 600 600 700 950[42] 1996 Italy 350 400 500 600 600 600 600 700 950[22] 2001 Latvia 375 375 500 700 1,000 1,000 1,000 1,000 1,100 1,300[24] 1999 Lithuania 420 400 500 700 800 800 800 800 1,000 1,200[11] 1992 Netherlands 450 400 500 800 800 800 800 800 1,000 1,250[34] 2004 Nordic countries 300 350 600 700 700 700 700 800 1,100[53] 1996 Poland 450 450 500 600 600 600 600 600 950 950[18] 1990 Romania 450 450 600 900 1,050 950 950 900 900 900[29] 1991 Russian Federation 400 400 500 700 800 900 900 800 1,100 1,300[41] 1994 Serbia 500 800[19] 1997 Slovakia 400 400 500 700 900 850 850 800 1,100 1,200[30] 2007 Spain 450 450 300 800 800 800 800 800 800 1,300[28] 2001 The former YR Macedonia 375 375 400 700 800 800 800 800 1,000 1,200[36] 1991 United Kingdom 350 350 400 500 600 600 600 600 700 950[6] 1993 EC 350 400 500 600 600 600 600 700 950[50] 2004 WHO/FAO 375 400 450 600 600 500 500 600 800 850
*DACH countries = Austria, Germany, Switzerland; Nordic countries = Denmark, Finland, Iceland, Norway, Sweden; The former YR Macedonia = The formerYugoslav Republic of Macedonia;EC European Commission, WHO/FAO World Health Organization/Food and Agricultural OrganizationCroatia, Federation of Bosnia and Herzegovina and Republika of Srpska (entities of Bosnia and Herzegovina) and Montenegro are excluded from the table because norecommendation report was available for the author. The Czech Republic was excluded due to lack of published source
E. L. Doets et al. 29European micronutrient recommendations

10–15 years. The report from the Netherlands pro-vides gender-specific separate recommendations fromthe age of 1 year, although the actual recommenda-tions for men and females do not differ for all agegroups and nutrients.
Adults
The number of age categories defined for adults variesfrom one to five but most reports include recom-mendations for four age categories. Discrepancies alsoemerge for the higher age levels. Most often thehighest age group is ‡60, ‡65, or ‡75 years of age. TheUnited Kingdom recommendations, however, have‡51 years as an upper age group, the Italian recom-mendations defined ‡51 years for females and‡60 years for males, both the Albanian and the Lat-vian recommendations defined the upper age groupas ‡19 years and the European recommendations as‡18 years. All countries, except Latvia, give recom-mendations separately for males and females, al-though Latvia does separate recommendations onminerals for the two sexes.
Other criteria considered in setting micronutrientrecommendations
All countries except Romania provide separatemicronutrient recommendations for pregnant andlactating females. The Albanian and the Bulgarianrecommendations for both pregnant and lactatingfemales are further split up in £18 years and‡19 years. The United Kingdom and the RussianFederation split up the group of lactating femalesaccording to the period of lactation (£4 months and>4 months for the United Kingdom and <7 months‡7 months for the Russian Federation).
Some countries distinguish physical activity levels(PAL) per age group. Lithuania provides micronu-trient recommendations for four PAL and two dif-ferent body weights per age category and sex. TheRussian Federation splits up the recommendations foradults in five PAL for males (1.4, 1.6, 1.9, 2.2, and 2.5).and four levels for females (1.4, 1.6, 1.9, and 2.2).Poland, Romania and Slovakia distinguish three PAL:low, moderate and high. In addition Slovakia alsogives recommendations for students with and withoutphysical workload. For specific nutrients other sub-
3m
age
200
400
600
800
1000
1200
ugRE
_VitA
600
900900
400 400
450
900900
DACH
Albania
DACH
Netherlands,Serbia, Spain
DACH,Romania
70y50y25y15y10y5y9m
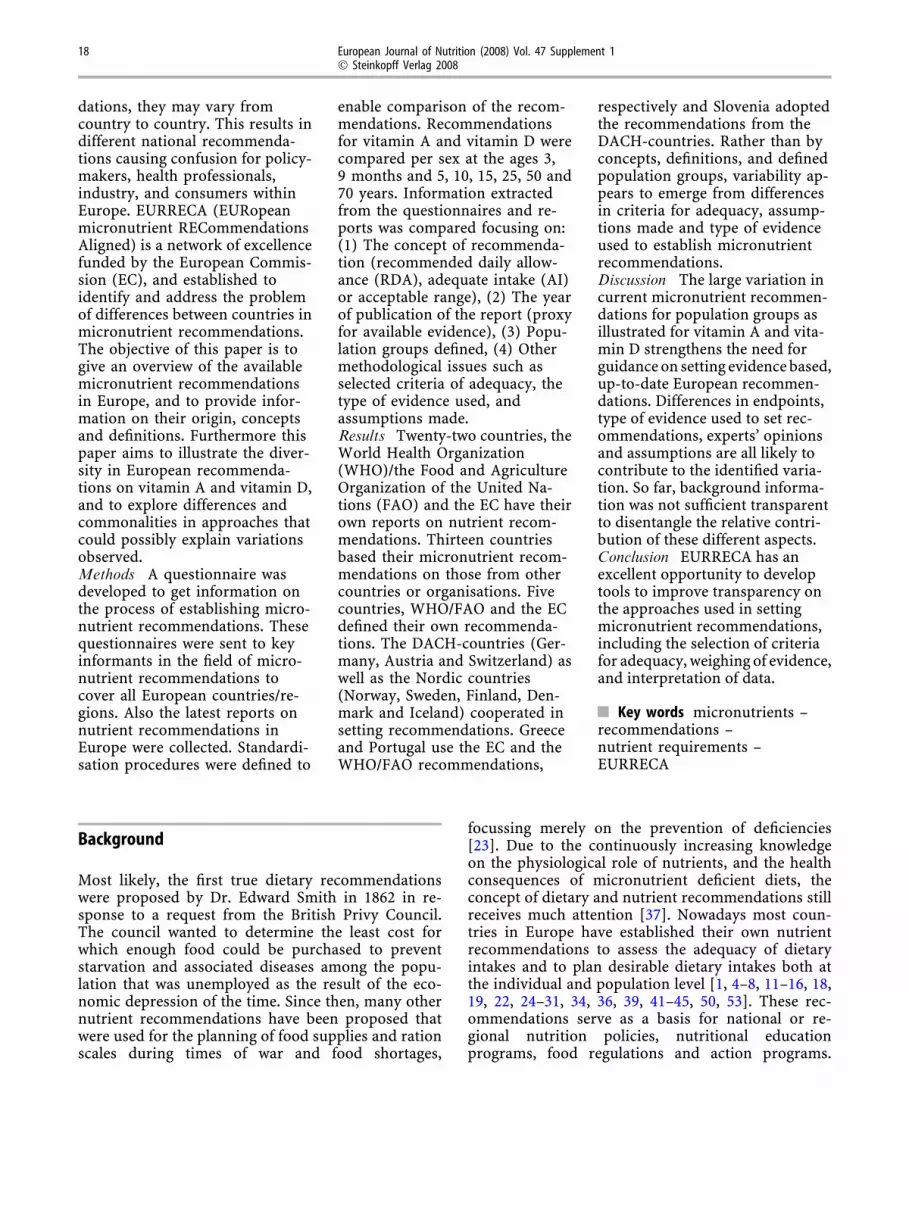
Fig. 1 Diversity of vitamin A recommendations formales in Europe expressed in lg retinol equivalents(RE) for selected ages. x-axis age = 3, 9 months and 5,10, 15, 25, 50 and 70 years. y-axis lg RE vitamin A.*DACH = Austria, Germany and Switzerland. Theboxes indicate the interquartile range (IQR = x75–x25)in which the median (x50) of all vitamin Arecommendations is indicated by a horizontal line.Vertical lines connected to the upper and lower side ofthe box indicate values less than 1.5 IQR below thefirst quartile or above the third quartile. Values notincluded in this range are considered as an outlier andare indicated by open dots (more than three times IQRabove x75 or below x25) and stars (more than 1.5 timesthe IQR above x75 or below x25)
30 European Journal of Nutrition (2008) Vol. 47 Supplement 1� Steinkopff Verlag 2008

groups are sometimes distinguished, for example forvitamin C, Bulgaria and the DACH-countries providea separate recommendation for smokers. Othercharacteristics influencing requirements that arementioned in recommendations for specific nutrientsare: sunlight exposure, skin colour, menstrual bloodloss, energy intake (especially for thiamin, riboflavin,niacin), protein intake (vitamin B6) or fat intake(vitamin E) and bioavailability for the nutrients ironand zinc.
j Diversity in recommendations on vitamin A andvitamin D
Vitamin A
Tables 5 and 6 present the current available stan-dardized recommendations for vitamin A (retinolequivalents, RE) by country and sex. Figures 1, 2 and3 show the variability in these recommendations inbox plots.
The median recommended intake of vitamin A formales is 400 lg for ages 3 and 9 months, 450 lg forage 5, 600 lg for age 10, and 900 for age 15, 25, 50 and70 years.
For females median recommendations are thesame to those for males of 3 and 9 months, and of 5and 10 years old. For the other ages the median rec-ommendation for females is 750 lg (15 years) and700 lg (>15 years), which is lower than for males, i.e.900 lg for ages ‡15 years . Vitamin A recommenda-tions from the EC, Ireland, Italy, and the UnitedKingdom are lower than the median for all ages forboth males and females and recommendations fromBelgium only for males. Recommendations higherthan the median for all ages are found in the DACH-countries, and Romania for both males and females.
For males the largest absolute difference in vitaminA recommendations between countries amounts to500 lg RE/day (range at 10 years: 500–1,000 lg; rangeat 15 years: 600–1,100 lg). The smallest range is ob-served at age 3 months, i.e. 150 lg (range: 350–500 lg). For females, the largest variation is found atthe ages 25 and 50 years, with a range of 500–1,000 ugRE/day. The smallest difference is similar to thatfound for males. For pregnant females the median forvitamin A recommendations is 800 lg and for lac-tating females 1,125 lg. The individual Europeanrecommendations range from 700 to 1,100 lg andfrom 850 to1,500 lg for pregnant and lactating fe-males, respectively.
3m
age
400
600
800
1000
ugRE
_VitA
600
700
750
400 400
450
700700
Albania
DACH
DACH
70y50y25y15y10y5y9m
Fig. 2 Diversity of vitamin A recommendations forfemales in Europe expressed in lg retinol equivalents(RE) for selected ages. x-axis: age = 3, 9 months and 5,10, 15, 25, 50 and 70 years. y-axis: lg RE vitamin A
E. L. Doets et al. 31European micronutrient recommendations

When comparing methodological approaches forEuropean vitamin A recommendations, all publica-tions provide an RDA, except the Netherlands rec-ommendations, which provide an AI (Table 2). Thedefined population groups in the different recom-mendations vary largely (Table 4). However, in eachpublication vitamin A recommendations are mostlythe same from the age of 15 up to 70 years. Com-paring publication dates, Spain and the DACH-countries that were published more recently providedhigh values, although the relatively high Netherlandsrecommendations were published in 1992 and the lowWHO/FAO recommendations in 2004.
The criteria for adequacy or the health endpointsused for defining vitamin A recommendations, werenot always reported in the questionnaire responses orbackground documents (data not shown). ‘Generalhealth’ and ‘preventing deficiencies’ were most fre-quently mentioned. In the Netherlands (high values)Belgium (values just below the median) and theDACH-countries (high values) ‘an adequate reserve inthe liver’ was the main functional criteria of nutri-tional adequacy. Most vitamin A recommendationsare based on data from observational cohort studies,or expert committees. Information on the type ofevidence on which recommendations were based was,however, not always clear from the questionnaire re-
sponses and the type of evidence was unknown forsome countries (Lithuania, Serbia, The formerYugoslav Republic of Macedonia) (data not shown).If, and what, assumptions were made when definingvitamin A recommendations was not clear from theinformation provided in the questionnaires responseor from the reports.
Vitamin D
Table 7 and 8 and Figures 4, 5 and 6 present anoverview of the available standardized recommenda-tions on vitamin D. The median of recommendedintake for males is 10 lg for age 3 and 9 months,6.25 lg for age 5 years, 5 lg for age 10, 25 and50 years and 7.5 lg for age 15 and 70 years. For fe-males the medians of vitamin D recommendations arethe same as for men, except for the median at age70 years which is 10 lg for females and 7.5 lg formales.
No publication includes values that are below themedian for all ages. In the Netherlands (except formen at age 70 years), the Russian Federation(>1 year) and the United Kingdom (£64 years) vita-min D recommendations are below the median. Thedifferences between countries are largest for infants inthe age of 3 and 9 months, with values ranging from
pregnancy lactation
600
800
1000
1200
1400
1600
ugRE
_VitA
800
1.125
Fig. 3 Diversity of vitamin A recommendations forpregnant and lactating females in Europe expressed inlg retinol equivalents (RE) for pregnant and lactatingwomen. x-axis; pregnancy, lactation. y-axis; lg REvitamin A
32 European Journal of Nutrition (2008) Vol. 47 Supplement 1� Steinkopff Verlag 2008

5 lg (Albania, Bulgaria, Netherlands and WHO/FAO)to 22.5 lg (France) and smallest for the ages of 5, 10,15, 25 and 50 years with values ranging from 2.5 lg(the Russian Federation, the Netherlands) to 10 lg aday.
Similar recommendations for vitamin D are givenfor pregnant and lactating females, varying from 5 to11.3 lg, with a median of 10 lg. The former YugoslavRepublic of Macedonia gives the highest recommen-dation and Albania, Bulgaria, the DACH countries,Romania, and the WHO/FAO (5 lg) the lowest.
Most countries provide an RDA for vitamin D,except for Belgium (acceptable range and AI), the EC(acceptable range), France (AI), and the Netherlands(AI). These AIs and acceptable ranges are not higherover all ages than the other recommendations. Thelowest recommendations were published by the Rus-sian Federation and the United Kingdom in 1991 butalso by the Netherlands in 2000.
In general, criteria for adequacy on which recom-mendations are based are �health’ and �prevention ofdeficiency as measured by the serum level of 25–hy-droxy vitamin D3’. �Appropriate bone formation’ is
mentioned as a criterion for adequacy in the ques-tionnaire from Belgium, Italy, and the Netherlands(data not shown). Vitamin D recommendations ap-pear to be based most often on expert’s opinion or onvalues that are borrowed from another country. Sev-eral countries reported that some assumptions weremade when setting up vitamin D recommendations:the Italian recommendations are based on theassumption that in the Italian environment sunexposure guarantees adequate physiological vitaminD production. They provide a range starting from0 lg for people with an adequate sun exposure. Theupper level of the range applies to people withoutsunlight exposure (10 or 25 lg depending on the age).Also the United Kingdom recommendations foradults are 0 lg a day, based on the assumption thatsun exposure will provide the amount sufficient for anadequate vitamin D status during summer and allowfor stores to be laid down to support vitamin D statusin winter. The Netherlands recommendations definenormal exposure to sunlight as daily 15 min with atleast hands and face uncovered, whereas the Nordiccountries assume that exposure of the face, arms,
Table 7 Overview of micronutrient recommendations on vitamin D (lg) for selected population groups in Europe*: males
Source Population groups
Ref no. Year Country 3 months 9 months 5 years 10 years 15 years 25 years 50 years 70 years
[4] 2005 Albania 5 5 5 5 5 10 10[16] 2006 Belgium 12.5 12.5 7.5 6.3 6.3 6.3 6.3 10[27] 2005 Bulgaria 5 5 5 5 5 5 5 10[13] 2004 DACH countries 10 10 5 5 5 5 5 5[45] 2006 Estonia 10 7.5 7.5 7.5 7.5 7.5 10[25] 2001 France 22.5 22.5 5 5 5 5 5 5[1] 2005 Hungary 10 10 10 10 10 5 5 5[43] 2006 Iceland 10 10 10 10 10 10 15[12] 1999 Ireland 8.5 7 5 5 7.5 5 5 10[18] 1996 Italy 17.5 5 5 7.5 5 5 10[19] 2001 Latvia 10 10 10 10 10 5 5 5[20] 1999 Lithuania 10 10 5 5 5 5 5 5[22] 2000 Netherlands 5 5 2.5 2.5 2.5 2.5 2.5 7.5[10] 2004 Nordic countries 10 7.5 7.5 7.5 7.5 7.5 10[25] 1996 Poland 10 10 10 10 10 5[27] 1990 Romania 10 10 10 10 7.5 5 5 5[29] 1991 Russian Federation 10 10 2.5 2.5 2.5 2.5 2.5 2.5[41] 1994 Serbia 10 10[19] 1997 Slovakia 7.5 10 7.5 7.5 10 7.5 5.8 5[30] 2007 Spain 10 10 10 5 5 5 10 15[28] 2001 The former YR Macedonia 7.5 10 10 10 10 5 5 5[36] 1991 United Kingdom 8.5 7 0 0 0 0 0 10[6] 1993 EC 17.5 5 5 7.5 5 5 10[50] 2004 WHO/FAO 5 5 5 5 5 5 5 15
*DACH countries = Austria, Germany, Switzerland; Nordic countries = Denmark, Finland, Norway, Sweden; The former YR Macedonia = The former YugoslavRepublic of Macedonia;EC European Commission, WHO/FAO World Health Organization/Food and Agricultural OrganizationCroatia, Federation of Bosnia and Herzegovina and Republika of Srpska (entities of Bosnia and Herzegovina) and Montenegro are excluded from the table because norecommendation report was available for the author. The Czech Republic was excluded due to lack of published source
E. L. Doets et al. 33European micronutrient recommendations

hands, and legs to sunshine for 6–8 min, 2 to 3 times aweek is more than adequate to satisfy the vitamin Drequirements. However, they indicate that dietaryvitamin D is essential to ensure satisfactory vitamin Dat northern latitudes. In setting vitamin D recom-mendations for the Polish population sunlight expo-sure was considered to be too diverse between adultsand therefore no recommendation for adults was set(data not shown).
Discussion
The results from this comparison of micronutrientrecommendations show similarity in concepts anddefinitions used to establish recommendations onmicronutrient intake in European countries, but alsoconsiderable diversity in defined population groupsand levels of current recommendations was observedas illustrated by two vitamins. In exploring elementsof the paradigm, differences between publications incriteria of adequacy, type of evidence used, andassumptions made, were recognized that could ex-plain disparities in recommendations between coun-tries.
j Availability of current micronutrientrecommendations
Many countries (13 out of 33) adopted recommen-dations from other publications, most frequently fromthe EC, WHO/FAO and IOM [6, 10, 50]. The EC report[6] was meant to provide practical advice and rec-ommendations for a number of purposes includingnutrition labelling and Community programmes onresearch and nutrition. The Scientific Committee forFood of the EC tried to harmonize existing nationalreports and also to include the most recent data. TheWHO/FAO and the IOM publications both containdietary reference values based on extensive scientificevidence evaluated by a large number of experts fromall over the world or the United States/Canadarespectively. They constituted an important source ofinformation for all who work in the areas of nutrition,agriculture, food production and distribution, andhealth promotion [10, 50].
Due to the continuous changes in scientificknowledge, revisions of recommendations should beplanned for every 5 to 10 years in order to keep themupdated in the light of the most up-to-date scientificevidence [21, 52]. In view of this, the present overview
Table 8 Overview of micronutrient recommendations on vitamin D (lg) for selected population groups in Europe: females
Source Populations groups
Ref no. Year Country 3 months 9 months 5 years 10 years 15 years 25 years 50 years 70 years Pregnancy Lactation
[4] 2005 Albania 5 5 5 5 5 10 10 5 5[16] 2006 Belgium 12.5 12.5 7.5 6.3 6.3 6.3 6.3 10 10 10[27] 2005 Bulgaria 5 5 5 5 5 5 5 10 5 5[13] 2004 DACH countries 10 10 5 5 5 5 5 10 5 5[45] 2006 Estonia 10 7.5 7 7.5 7.5 7.5 10 10 10[25] 2001 France 22.5 22.5 5 5 5 5 5 5 10 10[1] 2005 Hungary 10 10 10 10 10 5 6 6 10 10[43] 2006 Iceland 10 10 10 10 10 10 10 15 10 10[12] 1999 Ireland 8.5 7 5 5 7.5 5 5 10 10 10[42] 1996 Italy 17.5 5 5 7.5 5 10 10 10 10[22] 2001 Latvia 10 10 10 10 10 5 5 5 10 10[24] 1999 Lithuania 10 10 5 5 5 5 5 5 10 10[14] 2000 Netherlands 5 5 2.5 2.5 2.5 2.5 2.5 7.5 7.5 7.5[34] 2004 Nordic countries 10 7.5 7.5 7.5 7.5 7.5 10 10 10[53] 1996 Poland 10 10 10 10 10 5[18] 1990 Romania 10 10 10 10 7.5 5 5 5 5 5[29] 1991 Russian Federation 10 10 2.5 2.5 2.5 2.5 2.5 2.5 10 10[41] 1994 Serbia 10 10[19] 1997 Slovakia 7.5 10 7.5 7.5 10 7.5 5.8 5 10 10[30] 2007 Spain 10 10 10 5 5 5 10 15 10 10[28] 2001 The former YR Macedonia 7.5 10 10 10 10 5 5 5 11.3 11.3[36] 1991 United Kingdom 8.5 7 0 0 0 0 0 0 10 10[6] 1993 EC 17.5 5 5 7.5 5 5 10 10 10[50] 2004 WHO/FAO 5 5 5 5 5 5 5 15 5 5
DACH countries = Austria, Germany, Switzerland; Nordic countries = Denmark, Finland, Norway, Sweden; The former YR Macedonia = The former YugoslavRepublic of Macedonia;EC European Commission, WHO/FAO World Health Organization/Food and Agricultural OrganizationCroatia, Federation of Bosnia and Herzegovina and Republika of Srpska (entities of Bosnia and Herzegovina) and Montenegro are excluded from the table because norecommendation report was available for the author. The Czech Republic was excluded due to lack of published source
34 European Journal of Nutrition (2008) Vol. 47 Supplement 1� Steinkopff Verlag 2008

of recommendations is time bound, as some countrieshave already planned to revise their recommendationssoon. Belgium, the Republika Srpska (entity in Bosniaand Herzegovina), the Czech Republic, Italy, Lithua-nia, Poland, Slovakia, the Netherlands and the UnitedKingdom will have some or all of their recommen-dations revised or set before 2010. The EC publicationdates from 1993 and one of the tasks of the EuropeanFood Safety Authority (EFSA) is to update this advicefrom the Scientific Committee on Food on PRIs. TheEFSA Panel on Dietetic Products, Nutrition andAllergies (NDA) intends to start revising the micro-nutrients PRIs in 2008. EURRECA on the other handworks towards a general framework including har-monized approaches, methods and key terms to beused for the development of micronutrient recom-mendations. Therefore EURRECA will work in closecollaboration with EFSA, to improve the process andscientific basis on which micronutrient recommen-dations for European populations can be developed.
j Concepts and definitions
One of the factors that could explain differences be-tween countries are the concepts and definitionswhich were used. However, all countries or regions
included in this paper used recommendations thatwere based on an EAR with the recommended valueusually defined as 2 SD above the average. In thecomparison of vitamin A recommendations it appearsthat all publications provide an RDA, except for theNetherlands recommendations that provide an AI(Table 2). By definition an AI is higher than the RDAand therefore could explain the relatively higher val-ues of the Netherlands recommendations. Mostcountries provide an RDA for vitamin D, but therecommendations of countries that provide an AI oran acceptable range for vitamin D were not higherover all ages than the others.
j Population groups in the current availablemicronutrient recommendations
To estimate the nutrient requirement of a specificpopulation, first one needs data on requirements of apopulation with similar characteristics [21]. The def-initions of age groups, each considered as relativelyhomogenous with regard to nutrient requirement,differ between countries, especially during childhood,puberty and at older age. This may be due to differ-ences in reasoning in defining population groups;however in most publications these arguments are not
3m
age
0
5
10
15
20
25
ug_V
itD
5
7,57,5
10 10
6,25
55
France
EC,Italy
Belgium
Albania,Bulgaria,
Netherlands,WHO/FAO
Albania,Iceland
Albania,Iceland
Netherlands,Russian F
Netherlands,Russian F
UnitedKingdom
UnitedKingdom
France
70y50y25y15y10y5y9m
Fig. 4 Diversity in vitamin D recommendations formales in Europe expressed in lg for selected ages.x-axis age = 3, 9 months and 5, 10, 15, 25, 50 and70 years. y-axis lg vitamin D. *The former YRMacedonia = The former Yugoslav Republic ofMacedonia; DACH = Austria, Germany andSwitzerland. The boxes indicate the interquartile range(IQR = x75–x25) in which the median (x50) of allvitamin D recommendations is indicated by ahorizontal line. Vertical lines connected to the upperand lower side of the box indicate values less than 1.5IQR below the first quartile or above the third quartile.Values not included in this range are considered as anoutlier and are indicated by open dots (more thanthree times IQR above x75 or below x25) and stars(more than 1.5 times the IQR above x75 or below x25)
E. L. Doets et al. 35European micronutrient recommendations

clearly described. An extreme example are the PRIs aspublished by the EC, that provide only one age groupfor adults (‡18 years) [6]. The report states that al-though elderly are prone to suffer from deficienciesdue to a reduced food intake, inability to care forthemselves or illness causing malnutrition, there is noevidence that micronutrient requirements of the el-derly differ from those of middle-aged adults. Exceptfor vitamin D the EC provide no different values forelderly. On the contrary, the Netherlands [14, 15],defined four age groups in adulthood, 19–21, 22–49,50–64, and ‡65 years, using reference weights andheights from a representative sample of the popula-tion, and in doing so they follow the IOM [10]. Theseexamples illustrate the differences in underpinningthe definition of population groups.
In general, when data specific to physiological stateare not available to estimate nutrient requirements,extrapolation from other growth states or a factorialapproach, which estimates nutrient requirementbased on the expected nutrient losses via e.g. urine,feces, and skin and accounting for differences in as-sumed bioavailability, are used instead [3, 52]. Forsome population groups, especially infants, children,adolescents, elderly, post-menopausal females, preg-nant and lactating females, nutrient requirements are
often extrapolated from the adult RDA. For the rec-ommendations included in this overview it is notclear whether values are originally based on averagerequirements of the population group, or if they arebased on requirements estimated by the factorial ap-proach or extrapolation. Only for infants (0 to1 years) it is often indicated that nutrient values areextrapolated from the composition of breast milk.Prentice et al. [38] showed that the wide differences inperceived nutrient requirements between countriesmight be partly attributed to real physiological andenvironmental differences, but were mostly due to thedifferences in judgements about the best methodo-logical approach to use and in the way theoreticalapproaches were applied. Unless sufficient data onnutrient requirements will be available for all life-stage groups some time, extrapolation from onegroup to another is necessary. The scientific basis forthe method chosen should be completely transparentand thoroughly described for each nutrient and lifestage group [3]. Atkinson and Koletzko [3] recom-mend that for the harmonization of dietary referencevalues, standardisation of age groups should be bio-logically based (growth and pubertal stages) withconsideration of relevant developmental milestonesthroughout childhood. This requires agreement and
3mage
0
5
10
15
20
25
ug_V
itD
5
10
7,5
10 10
6,25
55
France
EC,Italy
Belgium
Albania,Bulgaria,
Netherlands,WHO/FAO
Albania, Iceland
Netherlands,Russian F
UnitedKingdom
UnitedKingdom
France
70y50y25y15y10y5y9m
Fig. 5 Diversity in vitamin D recommendations forfemales in Europe expressed in lg for selected ages.x-axis age = 3, 9 months and 5, 10, 15, 25, 50 and70 years. y-axis lg vitamin D
36 European Journal of Nutrition (2008) Vol. 47 Supplement 1� Steinkopff Verlag 2008

transparency on which data to use concerning growthstandards, body sizes and composition, fetal andmaternal accretion in pregnancy and milk composi-tion, and on inclusion of appropriate adjustments(metabolic efficiency, weight change or physicalactivity).
In the comparison of vitamin A and vitamin Drecommendations in this paper, values were mostlythe same for the age of 15 up to 70 years withinpublications. Therefore it seems unlikely that differ-ences in population groups are a key issue for dis-parities between publications. The definition ofpopulation groups might be an issue for other nutri-ents, but this needs to be studied further.
A few countries, Lithuania, Latvia, Poland, Roma-nia and Slovakia, provide recommendations for dif-ferent PAL. An explanation could be that thesecountries are all from eastern Europe where lifestylesmight be less sedentary than in western Europe [47].
j Criteria for adequacy, assumptions and type ofevidence
As they may explain differences between recommen-dations, questions on the criteria/endpoint(s) used todetermine adequate intake per nutrient were included
in the questionnaire. This information was, unfortu-nately, often not included in the received reports.However, the answers were often formulated in a verygeneral manner, for example �health’ or �prevention ofdeficiencies’. This limited the comparison of criteriafor adequacy. In all probability the question as in-cluded in the questionnaire was not clearly enoughformulated, resulting in answers that were too lessinformative.
It is obvious that estimated requirements mayvary with the endpoint or criteria for adequacychosen. Nutrients have multiple sites of action inhuman metabolism and therefore it is possible todemonstrate abnormal function in one parametermeasured or observed as a result of inadequate in-take of a nutrient, while other parameters requiringthe same nutrient intake appear adequate. Forexample a nutrient requirement based on theamount that prevents the clinical symptoms of anutrient deficiency will be lower than one based onthe amount that sustains nutrient stores or reserves[21]. Nutrient adequacy is a matter of definition, andmay be a policy decision. Thus it is possible to havemultiple requirements, each corresponding to a dif-ferent indicator or criterion of adequacy. It is thenup to nutrition and public health policy planners todetermine which level of adequacy is desirable or
pregnancy lactation
5
6
7
8
9
10
11
12
ug_V
itD
10 10
The former YRMacedonia
The former YRMacedonia
Netherlands Netherlands
Albania,Bulgaria,
DACH,Romania, WHO/FAO
Albania,Bulgaria,
DACH,Romania,
WHO/FAO
Fig. 6 Diversity in vitamin D recommendations forpregnant and lactating females in Europe expressedin lg for pregnant and lactating women.x-axis pregnancy, lactation. y-axis lg vitamin D
E. L. Doets et al. 37European micronutrient recommendations

possibly attainable in the population group ofinterest [52].
Besides criteria for adequacy, the type of evidenceused when establishing recommendations could ex-plain differences between recommendations. In thequestionnaire informants were asked to indicate thetype of evidence that was used for each nutrientagainst a list with different possibilities (includingRCT’s, observational studies, mechanistic studies,experts’ opinion, and borrowed from another coun-try). Experts’ opinion was the most frequently givenanswer, which unfortunately does not reveal on whichtypes of evidence the experts have based their opin-ion, and how. Although some reports list all the ex-perts that were included in the working groups, forthe countries without clear background reports, thisinformation was often missing.
The year of publication was used as a proxy for theage of the available scientific evidence. Even thoughpublication years varied between 1990 and 2007, wecannot conclude that the year of publication was re-lated to the level of the recommendation: For bothvitamin A and vitamin D high intakes were recom-mended in both relatively old and recent publications,and the same was true for low values.
j Opportunities: what can EURRECA do with thisinformation on the status quo?
From the results of this comparison of micronutrientrecommendations across Europe, it became clear thatthe concepts and definition used for setting them isquite similar throughout Europe. But even thoughmany countries adopt and adapt recommendationsfrom other publications, disparities remain. In oursearch for possible explanations for these disparities,we aimed at comparing different aspects of underlyingapproaches for setting up micronutrient values, butunfortunately there was a lack of transparency andcompleteness of the available information. An impor-tant opportunity for EURRECA is to develop tools toshow how micronutrient recommendations can bedevised for different population groups in a transpar-ent manner. These tools should provide guidance onhow to interpret data, how to take into account differentcriteria for adequacy and how to weigh different typesof evidence in defining requirements. Expert commit-tees throughout Europe can then use these tools tomake decisions in a harmonized way and providetransparently based micronutrient recommendations.
In the EC call which led to the commissioning ofEURRECA, vulnerable groups were identified as pop-ulation groups that are prone to extremes of intake andthose identified were: infants, children, adolescents,adults, pregnant and lactating females, post-meno-
pausal females, elderly, immigrants and low incomegroups. Our overview shows that immigrants, low-in-come, post-menopausal females were never a specifiedtarget groups in any recommendation report. The onlyexception is iron recommendations for post meno-pausal females. Within EURRECA variation in micro-nutrient needs based on micronutrient status,functional status and especially health and physiolog-ical status will be identified and parameters (bio-markers) for vulnerability will be explored. Based onthis information population groups to be consideredvulnerable will be identified. Guidance can then begiven on whether and in what way micronutrient rec-ommendations should be extended to these groups.
Conclusion
This paper provides an overview of the availability ofmicronutrient recommendations in Europe and pro-vides information on the origin, concepts and defi-nitions used, and population groups defined used forthe setting of current available micronutrient recom-mendations in Europe. A comparison of vitamin Aand vitamin D values is included in order to explorepossible explanations for disparities between publi-cations. The large variation in current recommenda-tions for population groups as illustrated for vitaminA and vitamin D strengthens the need for guidance onsetting evidence based, up-to-date European recom-mendations. Differences in criteria for adequacy orhealth endpoints, studies used to set recommenda-tions, experts’ opinions and assumptions are all likelyto contribute to the identified variation, but thebackground information we collated does not allow usto disentangle the relative contribution of these dif-ferent aspects due to lack of transparency. EURRECAhas an excellent opportunity to develop tools to im-prove transparency on the approaches used, includingthe selection of criteria for adequacy. Weighing ofevidence, and interpretation of data to support thosewho develop quality assured, evidence-based harmo-nized micronutrient recommendations across Europeand elsewhere.
j Acknowledgments This work was carried out within the frame-work of EURRECA, a Network of Excellence, project no FP6036196-2, funded by the European Commission. The authors of thispaper would like to thank all key informants that contributed toour data collection by completing questionnaires. The authors aregrateful to all partners from EURRECA that contributed to thispublication by their input in the data collection and discussionsduring the expert meeting in December 2007.
j Conflict of Interest none.
38 European Journal of Nutrition (2008) Vol. 47 Supplement 1� Steinkopff Verlag 2008

References
1. Antal M (2005) Tapanyagtablazat (NewFood Composition Tables). Rodler I,Medicina Konyvkiado Rt. MedicinaPublishing Comp., Budapest
2. Ashwell M, Lambert JP, Alles MS,Branca F, Bucchini L, Brzozowska A, deGroot LCPGM, Dhonukshe-RuttenRAM, Dwyer JT, Fairweather-Tait S,Koletzko B, Pavlovic M, Raats MM,Serra-Majem L, Smith R, van OmmenB, van �t Veer P, von Rosen J, Pijls LTJ(2008) How we will produce the evi-dence-based EURRECA toolkit to sup-port nutrition and food policy. Eur JNutr Vol 47(Suppl):2–16
3. Atkinson S, Koletzko B (2007) Deter-mining life stage groups and extrapo-lating nutrient intake values (NIVs).Food Nutr Bull 28:S61–S76
4. Berisha A, Bader E. Deligia C, ClaudeDop M (2005) Nutrition country profileRepublic of Albania
5. Catovic S, Kendic S, Catovic A (2000)Higijena ishrane sa dijetetikom. Saraj-evo
6. Commission of the European Commu-nities (1993) Nutrient and energy in-takes for the European Community.Reports of the Scientific Committee forFood. Thirty first series
7. Croatian National Official Gazzette 81(2004)
8. Directorate of Health and Social Affairs(2005) Norwegian recommendations ofnutrition and physical activity. Oslo
9. Food and Agriculture Organization ofthe United Nations, World HealthOrganization (2002) Human vitaminand mineral requirements. Report of ajoint FAO/WHO expert consultation.Rome, Food and Agriculture Organi-zation of the United Nations and Gen-eva, World Health Organization (http://www.fao.org/DOCREP/004/Y2809E/Y2809E00.HTM. Accessed 19 February2008)
10. Food and Nutrition Board, Institute ofMedicine, National Academies (1997,1998, 2000, 2001, 2003) Dietary refer-ence intakes (DRIs) Estimated averageRequirements. (www.nap.edu)
11. Food, Nutrition Council (1992) Dutchdietary reference values 1989 (in Dutch:Nederlandse normen 1989), 2nd edn.Food and Nutrition Council, Den Ha-gue
12. Food Safety Authority of Ireland (1999)Recommended Dietary Allowances forIreland, Dublin
13. German Nutrition Society (DGE),Austrian Nutrition Society (OGE),Swiss Society for Nutrition Research(SGE), Swiss Nutrition Association(SVE) (2000) Referenzwerte fur dieNahrstoffzufuhr/Reference values forNutrient Intake, 1st edition in German-Frankfurt/Main
14. Health Council of the Netherlands(2000) Dietary reference values: cal-cium, vitamin D, thiamin, riboflavin,niacin, pantothenic acid, and biotin.The Hague: Health Council of theNetherlands; publication no. 2000/12
15. Health Council of the Netherlands(2003) Dietary Reference Intakes: vita-min B6, folic acid, and vitamin B12.The Hague: Health Council of theNetherlands; publication no. 2003/04
16. Hoge Gezondheidsraad (2006) Vo-edingsaanbevelingen voor Belgie, her-ziening
17. ILSI SEAR region (2005) Recom-mended dietary allowances (RDA)Harmonization in South East Asia.Monograph series, Singapore
18. Institute of Public Health (1990). Rec-ommended amounts. Romania
19. Kajaba I, Simoncic R, Ginter E, Ond-rejka J, Truskova I, Kalac J, Bzduch V(1997) Odporucane vyzivove davky preobyvatelstvo Slovenska (8. revıziaOVD). Vyz. Zdravie, 4, 2:25–29. OfficialJournal of Ministry of Health, 28, part7–8
20. King JC, Garza C (2007) Internationalharmonization of approaches fordeveloping nutrient-based dietarystandards. Food and Nutrition Bulletin,vol 28. The United Nations University,United Nations University Press, p 1
21. King JC, Vorster HH, Tome DG (2007)Nutrient intake values (NIVs): A rec-ommended terminology and frame-work for the derivation of values. FoodNutr Bull 28:S16–S26
22. Latvian Food Center (2001) Leteicam�asener‘gijas un uzturvielu devas Latvijasiedz�ivot�ajiem/recommended intake ofenergy and nutrients for Latvians
23. Leitch I (1942) The evolution of dietarystandards. Nutr Abstr Rev 11:509–521
24. Lithuanian Ministry of Health, Na-tional Nutrition Center (order No 510)(1999) Recommended dietary allow-ances for Lithuanian population (en-ergy, protein, fat, carbohydrate,vitamins and minerals). Valstyb _es zin-ios/Official Gazette, 1999, No. 102–2936
25. Martin A (Guest Editor-in-Chief)(2001). Nutritional recommendationsfor the French population. Sciences desaliments. Int J Food Sci Tech21(4):309–458
26. Ministry of Health (2004) Referencedietary values (DACH), Ljubljana
27. Ministry of Health (2005) OrdinanceNo23 from 19 July 2005 for physiolog-ical normative requirement (DRI) fornutrition of the population (State Gaz-ete 63/02.08.2005)
28. Ministry of Health and Republic Insti-tute of Health Protection (2001)Nutrient recommendations as additionto Guidelines for Healthy nutrition ofthe population in Republic of Mace-donia
29. Ministry of Health of Soviet Union(1992) Recommended dietary allow-ances for nutrients and energy forseveral population groups, VoprosyPitanija 1992, no 2, p 6–15
30. Moreiras O, Carbajal A, L Cabrera,Cuadrado C (2007) Tablas de compos-icion de alimentos. Ediciones Piramide(Grupo Anaya, SA). 11ª edicion revis-ada y ampliada. (278pp) (ISBN: 978-84-2133-8). Book chapter: Ingestas reco-mendadas de energıa y nutrientes parala poblacion espanola, pp 227–230
31. National Nutrition Council of Finland(2005) Dietary guidelines of Fin-land—nutrition and physical activity inbalance. Helsinki
32. National Research Council, NationalAcademy of Sciences (1989) Recom-mended dietary allowances, 10th edn
33. Nederlandse voedingsnormen, 200134. Nordic Council of Ministers (2004)
Nordic Nutrition Recommendations2004: Integrating nutrition and physi-cal activity, 4th edition
35. Otten JJ, Hellwig JP, Meyers LD (2006)Dietary reference intakes (DRI) Theessential guide to nutrient require-ments. Institute Of Medicine. The Na-tional Academy Press, Washington
36. Panel on DRVs of the Committee onMedical Aspects of Food Policy(COMA) (1991) Dietary reference val-ues (DRVs) for food energy andnutrients for the UK, Report on Healthand Social Subjects 41
37. Pavlovic M, Prentice A, Thorsdottir I,Wolfram G, Branca F (2007) Challengesin harmonizing energy and nutrientrecommendations in Europe. Ann NutrMetab 51:108–114
38. Prentice A, Branca F, Decsi T, FleisherMichaelsen K, Fletcher RJ, Guesry P,Manz F, Vidailhet M, Pannemas D,Samartin S (2004) Energy and nutrientdietary reference values for children inEurope: methodological approachesand current nutritional recommenda-tions. Br J Nutr 92:S83–S146
E. L. Doets et al. 39European micronutrient recommendations

39. Public Health Institute of the Republicof Srpska (2005) Dietary qiudeline withreference values all micronutrients.Dragana Stojisavljevic, MD, DusankaDanojevic, MD, Msc Janja Bojanic, MD,Ljubica Jandric, MD; publication 2005/No 1
40. Robertson A et al., eds (2004) Food andhealth in Europe: a new basis for action.Copenhagen, WHO Regional Office forEurope (http://www.euro.who.int/InformationSources/Publications/Cata-logue/20040130_8. Accessed 19February 2008)
41. Sluzbeni Glasnik Srbije (1994) Pravil-nik o normativima drustvene ishranedece u ustanovama za decu. 50/94(State Gazette RS (1994) Recommen-dations for collective nutrition of chil-dren 50/94)
42. Societa Italiana di Nutrizione Umana(1996) Livelli di Assunzione Racco-mandati di Energia e Nutrienti per laPopolazione Italiana (LARN) Revision
43. The Public Health Institute of Iceland(2006) Raðleggingar um mataræði ognæringarefni fyrir fullorðna og born fratveggja ara aldri. Reykjavık
44. The National Food Administration(2005) Swedish Nutrition Recommen-dations (SNR), website: http://www.slv.se/upload/dokument/mat/rad_rek/SNR2005
45. Vaask, Sirje; Liebert, Tiiu; Maser, Mai;Pappel, Kaie; Pitsi, Tagli, Saava, Meri-leid; Sooba, Eve; Vihalemm, Tiiu, Villa,Inga (2006) Tervise Arengu Instituut.Eesti toitumis- ja toidusoovitused
46. Van Staveren WA (2004) Voeding, Le-vensloop en Loopbaan. Farewellspeech, Wageningen University
47. Varo JJ, Martınez-Gonzalez MA, de Ir-ala-Estevez J, Kearney J, Gibney M,Alfredo Martınez J (2003) Distributionand determinants of sedentary life-styles in the European Union. Int J Epi32:138–146
48. World Health Organization (2003)Diet, nutrition and the prevention ofchronic diseases. Report of a jointWHO/FAO Expert Consultation. Gene-va, World Health Organization (WHOTechnical Report Series, No. 916;http://whqlibdoc.who.int/trs/WHO_TRS_916.pdf. Accessed 19 Feb-ruary 2008)
49. World Health Organization (2003)Integrated prevention of noncommu-nicable diseases. Global strategy ondiet, physical activity and health: pro-cess of development and draft resolu-tion. Report by the Secretariat. Geneva,World Health Organization, (http://www.who.int/gb/ebwha/pdf_files/EB113/eeb11344.pdf. Accessed 19 Feb-ruary 2008)
50. World Health Organization, Food andAgriculture Organization of the UnitedNations (2004) Vitamin and mineralrequirements in human nutrition, Sec-ond edition. Geneva, World HealthOrganization and Rome, Food andAgriculture Organization of the UnitedNations (http://whqlibdoc.who.int/publications/2004/9241546123.pdf. Ac-cessed 19 February 2008)
51. World Health Organization RegionalOffice for Europe (2000) CINDI dietaryguide. Copenhagen, World HealthOrganization Regional Office for Eur-ope (http://www.euro.who.int/docu-ment/e70041.pdf. Accessed 19 February2008)
52. Yates AA (2007) Using criteria toestablish nutrient intake values (NIVs).Food Nutr Bull 28:S38–S50
53. Ziemlanski S, Bulhak-Jachymczyk B,Budzynska-Topolowska J, Panczenko-Kresowska B, Wartanowicz M (1996)Recommended dietary allowances forpolish population (energy, protein, fat,vitamins and minerals)
40 European Journal of Nutrition (2008) Vol. 47 Supplement 1� Steinkopff Verlag 2008


