Embed Size (px)
Citation preview
Micronutrient malnutrition and the impact of modern plant breeding on public health in India: How cost-effective is biofortification?
Alexander J. Stein
Micronutrient malnutrition and the impact of modern plant breeding on public health in India:
How cost-effective is biofortification?
Alexander J. Stein

This document is identical to the following book: Bibliografische Information Der Deutschen Bibliothek Die Deutsche Bibliothek verzeichnet diese Publikation in der Deutschen Nationalbibliografie; detaillierte bibliografische Daten sind im Internet über http://dnb.ddb.de abrufbar. 1. Aufl. - Göttingen : Cuvillier, 2006 Zugl.: Hohenheim, Univ., Diss., 2006 ISBN 3-86537-947-8 D 100
Suggested citation: Stein, A.J. (2006). Micronutrient malnutrition and the impact of modern plant breeding on public health in India: How cost-effective is biofortification? Göttingen: Cuvillier Verlag. ISBN: 3865379478 Photographs and illustrations on the cover: Photocase (wheat field), Tracy Olson (dollar bills), Karl Harrison (carotene molecule), Kroma Kromalski (pills), Golden Rice Humanitarian Board (Golden Rice), Hagit Berkovich (Indian girl), University of Texas Libraries (map of India), Photocase (iron), all other Alexander Stein. Design and Layout: Alexander Stein.
Copyright notice: All parts of this publication are protected by copyright. You are free to read this work online. You are free to link to this work. You are free to quote this work in other academic work. You are free to download this work for private and non-commercial use in its electronic form. You may not print, reproduce, translate, distribute, display or process this work. You may not use this work for non-private and commercial purposes in its electronic form. Different copyrights may apply to the printed version of this work.
The exclusive copyrights of the work in printed form are with Cuvillier Verlag, Göttingen: CUVILLIER VERLAG, Göttingen 2006 Nonnenstieg 8, 37075 Göttingen (Germany) Phone: +49-551-54 724-0 Fax: +49-551-54 724-21 [email protected] http://www.cuvillier.de
The printed version of this work may also be available through your local bookseller, through online booksellers or through their respective German subsidiaries.
i
Table of contents
Foreword ..........................................................................................................................iii Acknowledgements ......................................................................................................... iv Summary .......................................................................................................................... v Zusammenfassung..........................................................................................................vii Abbreviations and acronyms ............................................................................................ x List of tables.....................................................................................................................xii List of figures ..................................................................................................................xiii List of boxes....................................................................................................................xiii 1 Introduction ...............................................................................................................1 2 Background...............................................................................................................7
2.1 Micronutrient malnutrition worldwide.................................................................7 2.2 Micronutrient interventions ................................................................................8
2.2.1 Current micronutrient interventions ...........................................................8 2.2.2 Micronutrient interventions in India..........................................................11 2.2.3 A novel micronutrient intervention: biofortification...................................12
2.3 Micronutrient malnutrition and the Green Revolution......................................14 2.4 Micronutrient malnutrition and the �Gene Revolution� ....................................16
2.4.1 Plant biotechnology and the Gene Revolution ........................................16 2.4.2 The second generation of the Gene Revolution: Golden Rice................21
2.5 Micronutrient malnutrition and why to bother ..................................................22 2.5.1 Micronutrient malnutrition and its economic dimension...........................22 2.5.2 Micronutrient malnutrition and human rights ...........................................27
3 Methods and data ...................................................................................................29 3.1 The disability-adjusted life years framework ...................................................29
3.1.1 The DALYs formula .................................................................................31 3.1.2 Criticism of the DALYs methodology.......................................................32
3.2 Data used for the calculation of DALYs ..........................................................36 3.2.1 Adverse functional outcomes of ID, ZnD and VAD .................................36 3.2.2 Target groups and their size....................................................................38 3.2.3 Mortality rates and average remaining life expectancy ...........................38 3.2.4 Incidence rates and duration of health outcomes....................................40 3.2.5 Disability weights .....................................................................................43
3.3 Assessing the impact of biofortification ...........................................................43 3.3.1 Data and methods used for computing micronutrient intakes .................44 3.3.2 Simulating the consumption of biofortified crops.....................................46 3.3.3 Relating micronutrient intakes to health outcomes..................................50 3.3.4 Determining the reduction in the burden of IDA, ZnD and VAD..............55
ii
3.4 The cost-effectiveness of biofortification .........................................................56 3.4.1 Quantification of the costs of biofortification............................................57 3.4.2 Carrying out a cost-effectiveness analysis ..............................................59 3.4.3 Extending the economic analysis to a cost-benefit analysis ...................61 3.4.4 Assessing the relevance of biofortification for economic productivity .....65
4 Results ....................................................................................................................67 4.1 Case 1: iron-rich rice and iron-rich wheat in India...........................................67
4.1.1 The disease burden of iron deficiency anaemia in India .........................67 4.1.2 The potential impact of iron biofortification of rice and wheat .................68 4.1.3 The cost-effectiveness of iron biofortification in India..............................70 4.1.4 An evaluation of the overall economic impact of iron biofortification.......74
4.2 Case 2: zinc-rich rice and zinc-rich wheat in India..........................................75 4.2.1 The disease burden of zinc deficiency in India........................................75 4.2.2 The potential impact of zinc biofortification of rice and wheat .................76 4.2.3 The cost-effectiveness of zinc biofortification in India .............................78 4.2.4 An evaluation of the overall economic impact of zinc biofortification ......80
4.3 Case 3: Golden Rice in India ..........................................................................81 4.3.1 The disease burden of vitamin A deficiency in India ...............................81 4.3.2 The potential impact of Golden Rice .......................................................82 4.3.3 The cost-effectiveness of Golden Rice in India .......................................85 4.3.4 An evaluation of the overall economic impact of Golden Rice ................89
5 Discussion...............................................................................................................90 5.1 The disease burden of micronutrient malnutrition in India ..............................90 5.2 The potential impact of biofortification in India ................................................96 5.3 The cost-effectiveness of biofortification in India ..........................................100 5.4 An evaluation of the overall economic impact of biofortification in India.......104 5.5 In the spotlight: Golden Rice .........................................................................105
5.5.1 Shiva�s hoax ..........................................................................................105 5.5.2 Is red the more nutritious colour? Red rice and red palm oil.................109 5.5.3 Other food-based interventions to improve VA status...........................111 5.5.4 Intellectual property rights: is Golden Rice only a showcase? ..............112 5.5.5 Analysing Golden Rice by critics� criteria ..............................................114
6 Conclusions ..........................................................................................................115 References ...................................................................................................................119 Annexe 1: Data and assumptions used to calculate the burden of IDA in India ..........142 Annexe 2: Data and assumptions used to calculate the burden of ZnD in India..........143 Annexe 3: Data and assumptions used to calculate the burden of VAD in India .........144 Annexe 4: Exchange rates (Rs./US$) ..........................................................................145
iii
Foreword It is generally acknowledged that malnutrition imposes a heavy burden on society, with far reaching consequences for the well-being, health and productivity of the individuals at-risk. This is true for overweight and obesity in industrialised countries and, increasingly, in emerg-ing economies, and it is true for undernutrition in low income countries. However, there is a particular form of undernutrition, known as micronutrient malnutrition, that largely goes un-noticed by the general public, by many decision makers and even by the affected individuals themselves, because its � often severe � health consequences are not attributed to poor nu-trition. This is why this form of malnutrition is also called �hidden hunger�. For the same rea-son as micronutrient malnutrition, the search for potential remedies and their respective as-sessments have for a long time attracted relatively little attention among academics outside the more obvious fields of nutrition and public health. Yet, more recently a new, agriculture-based approach to help control micronutrient malnutrition has emerged: �biofortification� � breeding staple food crops for higher levels of essential minerals and vitamins. Information on biofortified crops and their potential impact and cost-effectiveness is scarce. As such, bioforti-fied crops are not yet grown at a larger scale. Nonetheless, given the novelty of the approach, thorough, policy-relevant information is needed to evaluate this proposition relative to more common micronutrient interventions to be able to design strategies to address the problem of hidden hunger effectively and efficiently. This is the more indispensable if a crop is biofortified through genetic engineering, a technology that is often met with considerable � and emotional � resistance, irrespective of the purpose it is used for.
In this analysis Alexander Stein puts micronutrient malnutrition and biofortification into a wider context and he develops a framework for ex ante evaluation of biofortification, both re-garding its potential impact on public health and its cost-effectiveness. He applies this meth-odology to three case studies for India, of biofortified rice and wheat that are to address defi-ciencies in iron, zinc and vitamin A. As such, his study is the first detailed and comprehensive assessment of several biofortified staple crops within one consistent framework. Moreover, paying particular attention to the more contentious �Golden Rice�, he seeks to clarify common misconceptions about this genetically modified crop, with an attempt to rationalise the ongo-ing debate.
The results of this work indicate that biofortification may prove to be an effective and very efficient intervention to reduce the overall burden of micronutrient malnutrition, both for soci-ety and at the individual level. As biofortified crops follow the normal food chain, biofortifica-tion may also reach those consumers and subsistence farmers that are not regularly covered by other interventions. Therefore biofortification may become a valuable intervention to com-plement existing strategies. However, as Alexander Stein also points out, for biofortification to have the maximum impact, it will be necessary to achieve sufficiently high levels of minerals and vitamins in the crops, which consumers and farmers alike will have to accept and adopt at a larger scale. He therefore suggests that, for this to happen, current research and breed-ing efforts should continue and appropriate agricultural extension and social marketing strate-gies will have to be devised.
The findings of this study provide a sound and important basis for decision makers in the fields of human nutrition, public health, agricultural policy and economic development; they also point other researchers to as of yet unresolved issues and open questions, thus hope-fully furthering the academic debate and generally sparking broader interest in the important topic of agricultural technology, nutrition and public health.
Dr. Howarth Bouis, Director, HarvestPlus International Food Policy Research Institute, Washington, DC
iv
Acknowledgements The research for this study was carried out at the Centre for Development Research (ZEF) of the University of Bonn and, later, in the context of the Institute for Agricultural Economics and Social Sciences in the Tropics and Subtropics of the University of Hohenheim. My work was funded by the German Research Foundation (DFG); additional financial support came from the Golden Rice Humanitarian Board. I am grateful for both.
Although the work presented here is my own, I have benefited from the contributions and the support of many. Most of all, I am obliged to my tutor and supervisor, Prof. Dr. Matin Qaim, for always being receptive to my questions and concerns. Being both ever demanding and just as constantly and reliably supportive, he has probably driven me further than I would have ventured without such a stimulating environment. I am very grateful for the time he took to comment my work in great detail and for giving many valuable suggestions.
Next, I also received considerable support from Dr. J.V. Meenakshi. She facilitated my first stay in Delhi and provided valuable help and practical advice on my calculations and on ex-tensive parts of this work. Likewise, the contributions of Prof. H.P.S. Sachdev were of great help. His gentle intervention opened many doors during my second stay in Delhi and his pru-dent professional judgement was an important resource. The input of Dr. Penelope Nestel was just as important. Her pointed nutrition knowledge and her detailed comments on various related drafts helped to improve my work considerably. In the same way, the expert insights of Prof. Zulfiqar A. Bhutta proved to be very valuable for the development of the methodologi-cal framework and thereafter.
My sincere gratitude also goes to Dr. Gerard Barry, who has been extremely hospitable and helpful when I visited the International Rice Research Institute and attentive ever after. I am indebted to Prof. Umesh Kapil as well, who was so kind to repeatedly share his wealth of information and knowledge with me. Further, Dr. A.K. Singh aided me readily during my sec-ond stay in Delhi and provided valuable insights and information. Similarly, Dr. S.R. Rao took the time to receive me cordially and he has been so kind to provide me with the to-the-point information that I needed. Moreover, my heartfelt thanks are due to Dr. Rekha Sharma for having given me her pre-processed data, which probably saved me weeks of repetitive work. I also want to extend my gratitude to Dr. Adrian Dubock for having shown an interest in my work and for his quick and pertinent replies. Similar support came from Dr. Jorge E. Mayer, to whom I am just as grateful. Moreover, I feel obliged to Dr. Howarth E. Bouis and the other experts and staff at the International Food Policy Research Institute; my various stays in Washington and other encounters were always very productive, but also set apart by the friendly atmosphere. It is equally important to me to thank Dr. Erika Meng and Dr. Ivan Ortiz Monasterio of the International Maize and Wheat Improvement Centre for their essential con-tributions. Dr. Nancy Johnson of the International Centre for Tropical Agriculture has provided valuable inputs as well.
Thanks also go to my colleague Holger Seebens, who was not only an enjoyable office mate but also a reliable resort for many questions and concerns I had, whether relating to Stata, economics or anything else. My genuine thanks are also due to Margret Karras, who helped me comply with the administrative requirements that were a less enjoyable part of my travels. And last, but not least, I am deeply indebted to my colleague Ira Matuschke, who has been of immeasurable help as interested reader and reviewer of the complete draft of this work and of many others, and who always knew the important details.
Finally, I want to express my gratitude to all those whom I failed to mention personally but who have also contributed to my work or who simply made these last years an enjoyable experience. This includes numerous experts whom I have interviewed in the Philippines and in India, but it also includes workshop participants, reviewers and many colleagues, seniors and staff at ZEF and its doctoral programme as well as at the University of Hohenheim. Of course, I also want to include those people close to me in private, who bore with me during the more challenging and exhausting periods of this work.

v
Summary
Worldwide, one out of seven people suffers from hunger. Yet, there is a stealthier form of hunger than lack of food: micronutrient malnutrition or �hidden hunger�. While often providing enough calories, monotonous diets (of the poor) frequently fail to deliver sufficient quantities of essential minerals and vitamins. Estimates indicate that over two-thirds of the world popu-lation � for the most part women and children � are deficient in at least one micronutrient. This can have devastating consequences for the life, health and well-being of the individuals concerned (like premature death, blindness, cretinism or weakened immune systems). In many countries these deficiencies are public health problems of primary concern. When mal-nutrition is widespread, it also reduces overall productivity and a country�s economic growth, hence affecting an important element of social welfare.
In the long run, economic development can be expected to address the problem of malnu-trition, but relying on income growth alone will not help controlling micronutrient deficiencies in the near future. Conventional approaches to solve this issue more directly (like supplementa-tion, fortification and dietary diversification) have weaknesses that limit the overall progress in controlling micronutrient deficiencies. Therefore, the recent emergence of �biofortification� � a complementary approach to address micronutrient malnutrition � may be promising. The underlying idea is to breed food crops for higher micronutrient content. By focusing on staple crops, which form the mainstay in the diets of the poor, this intervention is expected to be self-targeting and to circumvent some of the drawbacks of alternative interventions. Yet, the major reason put forward in support of biofortification is an economic one: because an essentially one-time investment into the development of a biofortified crop may benefit countries around the world, and farmers everywhere can grow and reproduce the crops year on year, a con-tinuous stream of widespread benefits could result. Thus, accumulating over time and space, the investments in the development of biofortified crops could reap huge returns in terms of improved health, overall welfare and economic growth. Therefore, given the recurring costs of the alternative interventions, biofortification promises to be very cost-effective. In a world of scarcity such an argument weighs heavily: making better use of resources in developing countries� health sectors literally saves lives.
Currently, biofortified crops are at an advanced stage of research and development. But, apart from a few sporadic and crop-specific studies with often more exemplary character, a more rigorous and comprehensive assessment of this approach is lacking. To offer a sound basis for future research and policy decisions, economic analyses are needed to assess this novel approach. The provision of such an ex ante evaluation of biofortification is the contribu-tion of this study, in which five different biofortified crops (iron-rich rice, iron-rich wheat, zinc-rich rice, zinc-rich wheat and beta-carotene-rich rice) are analysed. These crops are intended to address three different micronutrient deficiencies (iron, zinc and vitamin A). Empirically, this study focuses on India, a country where these micronutrient deficiencies are prevalent and where rice and wheat are consumed widely. Moreover, the first biofortified varieties might be released within the next few years.
Before entering the analysis of the biofortified crops, this study provides an overview of the problem of micronutrient malnutrition and the related interventions. Furthermore, the eco-nomic and legal justification for taking steps to solve this problem is presented and biofortifi-cation is put into the wider context of historical and technological developments in agriculture, namely the Green Revolution and plant biotechnology. (One of the crops analysed, the beta-carotene-rich rice, is genetically engineered. While the rationale of developing this �Golden
vi
Rice� � as it is known because of its yellow hue � is no different from that of the other crops, the fact that it is genetically modified singles it out in the controversy about transgenic crops.)
In the main body of the study an analytical framework is developed to quantify the amount of ill health that is caused by the three micronutrient deficiencies. After discussing the concept critically, this framework builds on the �disability-adjusted life years� (DALYs) method. Yet, it models the adverse functional health outcomes of the three deficiencies more explicitly and it integrates more nutritional and epidemiological details than previous studies. The application of this framework to India shows that � without biofortification � each year 4 million healthy life years (or DALYs) are lost due to iron deficiency, 2.8 million are lost due to zinc deficiency and 2.3 million due to vitamin A deficiency. Taken together, these deficiencies may reduce gross national income by 0.8-2.5 percent.
Using detailed food consumption data from a nationally representative household survey, the distributions of iron, zinc and vitamin A intakes are computed for the status quo and pro-jected for different �with biofortification� scenarios. (The scenario approach takes account of the uncertainty inherent in ex ante analyses.) The shifts in the intake distributions of these micronutrients in the �with� scenarios are then explicitly translated into reductions of the inci-dence of the different health outcomes of each deficiency. Again, this has not been done before in such detail and, for iron, a new method has been devised to take account of the particularities of this deficiency. The results of this exercise indicate that the biofortified crops may reduce the burden of each of the three deficiencies by more than 50 percent. The pro-jected reductions in the burden of the respective deficiencies are, in particular, 19-58 percent for iron-rich rice and wheat, 16-55 percent for zinc-rich rice and wheat and 5-54 percent for Golden Rice.
Based on these estimated health benefits, a cost-effectiveness analysis (CEA) is carried out. The resulting costs per DALY saved amount to US$ 0.46-5.39 for biofortification of rice and wheat with iron, US$ 0.68-8.80 for zinc biofortification and US$ 3.40-35.47 for Golden Rice. As such, biofortification is more cost-effective than alternative interventions (whose costs are US$ 6-16 for iron interventions, US$ 5-18 for zinc interventions and US$ 84-599 for vitamin A interventions) and it outperforms the benchmarks of US$ 217-620 that are sug-gested by international organisations. While the study underlines the merits of the DALYs-based CEA, the options for transforming DALYs into monetary values are also discussed. Once having converted the health benefits into dollar terms, conventional cost-benefit analy-ses are carried out for the various biofortified crops: the internal rate of return (IRR) for devel-oping iron-rich rice and wheat is 61-168 percent, the IRR for developing the zinc-rich cereals is 53-153 percent and the IRR for Golden Rice is 30-76 percent. (The benefit-cost ratios are 186-2,180, 114-1,472 and 28-295, respectively.) These results are contrasted with the returns of other agricultural projects, which fall into the range of 17-81 percent. They are also set against a common selection criterion of 10 percent. In a rejoinder to the discussion of biotech-nology, the validity of common arguments against Golden Rice is discussed.
Finally, given the necessary caution in interpreting the results of ex ante analyses, the fa-vourable findings of this evaluation are highlighted. Given the variation in the results for differ-ent projections, the importance of the commitment and the support of key stakeholders to realise the full potential of biofortification is stressed. Likewise, the importance of a compre-hensive strategy to eliminate micronutrient deficiencies as public health problem, which in-cludes a mix of different interventions, is underlined. While the present findings are deemed to justify the ongoing biofortification efforts, future research may corroborate these results and confirm that biofortification is a very cost-effective intervention that can help to better control micronutrient deficiencies and reduce hidden hunger.
vii
Zusammenfassung
Weltweit leidet jeder siebte Mensch an Hunger. Es gibt jedoch eine unauffälligere Form von Hunger als der Mangel an Nahrung: Mikronährstoffmangel oder �verdeckter Hunger�. Eintö-nige Kost (der Armen) vermag oftmals genügend Kalorien zu liefern, sie kann jedoch häufig keine ausreichende Versorgung mit wichtigen Mineralstoffen und Vitaminen sicherstellen. Schätzungen zufolge mangelt es über zwei Dritteln der Weltbevölkerung � zum größten Teil Frauen und Kindern � an einem oder mehr Mikronährstoffen. Das kann verheerende Folgen für das Leben, die Gesundheit und das Wohlbefinden der betroffenen Individuen haben (wie vorzeitiger Tod, Blindheit, Kretinismus oder ein geschwächtes Immunsystem). In vielen Län-dern stellen diese Mangelerscheinungen ein Problem ersten Ranges für die öffentliche Ge-sundheit dar. Sind solche Mangelerscheinungen weitverbreitet, so schränken sie die allge-meine Produktivität und das Wirtschaftswachstum eines Landes ein, was wiederum das Ge-meinwohl beeinflusst.
Langfristig gesehen kann wirtschaftliche Entwicklung dazu beitragen, das Problem der Mangelernährung zu lösen. Nur auf Einkommenszuwächse zu vertrauen wird jedoch nicht ausreichen, um Mikronährstoffmangel in der näheren Zukunft unter Kontrolle zu bringen. Her-kömmliche Ansätze zur direkten Behebung des Problems (durch Mikronährstoffpräparate, an-gereicherte Lebensmittel und Bemühungen um eine ausgewogene Ernährung) haben Schwächen, die Fortschritte bei der Beseitigung der Mangelerscheinungen erschweren. Daher könnten die jüngsten Entwicklungen in Bezug auf natürliche Anreicherung (engl. �Bio-fortification�) vielversprechend sein, da dieser Ansatz existierende Alternativen ergänzen könnte. Die zugrundeliegende Idee ist hierbei, Nahrungsmittelpflanzen mit erhöhtem Mikro-nährstoffgehalt zu züchten. Geschieht diese natürliche Anreicherung bei Grundnahrungs-mitteln, welche in der Ernährung der Armen überwiegen, so kann man davon ausgehen, dass diese Maßnahme ihre Zielgruppe automatisch erreicht und einige der Nachteile von alternati-ven Eingriffen umgeht. Allerdings ist das Hauptargument, das für diese Maßnahme vorge-bracht wird ein ökonomisches: Da eine weitestgehend einmalige Investition in die Entwick-lung dieser angereicherten Feldfrüchte verschiedenen Ländern nutzen kann, und da diese Pflanzen von Bauern überall nachgebaut und vervielfältigt werden können, könnte daraus fortgesetzt und weit gestreut Nutzen gezogen werden. Diese Investition verspricht daher ak-kumulierende Gewinne in Form von besserer Gesundheit, gesteigertem Gemeinwohl und Wirtschaftswachstum abzuwerfen. In Anbetracht der wiederkehrenden Kosten der alternati-ven Maßnahmen, könnte sich natürliche Anreicherung als sehr kosteneffizient erweisen. In einer Welt des Mangels wiegt ein solches Argument schwer: Ressourcen im Gesundheitswe-sen von Entwicklungsländern besser zu nutzen, bedeutet Leben zu retten.
Gegenwärtig befindet sich die Entwicklung von natürlich angereicherten Feldfrüchten in ei-nem fortgeschrittenen Stadium. Von vereinzelten Studien bestimmter Pflanzen abgesehen, die oftmals eher Beispielcharakter haben, fehlt es jedoch an einer gründlichen und umfassen-den Einschätzung dieses Ansatzes. Um für zukünftige Forschungs- und Politikentscheidung-en eine solide Basis zu schaffen, ist eine Reihe konsistenter Analysen dieses neuartigen An-satzes notwendig. Eine solche ex ante Bewertung natürlicher Anreicherung durchzuführen ist der Beitrag dieser Studie. Hierzu werden fünf verschiedene, angereicherte Feldfrüchte (eisen-reicher Reis, eisenreicher Weizen, zinkreicher Reis, zinkreicher Weizen und betakarotinrei-cher Reis) analysiert, die drei Mikronährstoffdefizite (Eisen-, Zink- und Vitamin A-Mangel) decken sollen. Empirische ist diese Studie auf Indien ausgerichtet, einem Land in dem alle
viii
drei Mangelerscheinungen weitverbreitet sind. Darüber hinaus werden dort sowohl Reis als auch Weizen in größerem Ausmaß gegessen und die ersten angereicherten Pflanzenarten könnten innerhalb der nächsten Jahre in Umlauf gebracht werden.
Vor der eigentlichen Analyse der angereicherten Pflanzen, gibt diese Studie einen Über-blick über das Problem des Mikronährstoffmangels und möglicher Gegenmaßnahmen. Über-dies werden wirtschaftliche und rechtliche Begründungen für die Lösung dieses Problems vorgestellt und natürliche Anreicherung wird in den größeren historischen und technologi-schen Zusammenhang der Grünen Revolution und der grünen Gentechnik gestellt. (Eine der Pflanzen, der betakarotinreiche Reis, ist gentechnisch verändert. Obwohl sich die Motivation für die Entwicklung des �Goldenen Reis� � wie er aufgrund seiner gelben Färbung auch ge-nannt wird � nicht von der der anderen Pflanzen unterscheidet, so hebt ihn dies in der Kontro-verse um gentechnisch veränderte Pflanzen hervor.)
Im Hauptteil der Studie wird der analytische Ansatz für die Quantifizierung des durch Ei-sen-, Zink- und Vitamin A-Mangel verursachten Gesundheitsschadens entwickelt. Nach einer kritischen Erörterung baut dieser Ansatz auf der Methode der �gesunden Lebensjahre� auf (engl. �disability-adjusted life years� bzw. DALYs). Gegenüber früheren Studien werden hier allerdings die Gesundheitsfolgen der drei Mangelerscheinungen deutlicher herausgearbeitet und es werden mehr Ernährungs- und Krankheitsdaten verwendet. Die Anwendung dieses Modells auf Indien zeigt, dass durch Eisenmangel jährlich 4 Mio. gesunde Lebensjahre verlo-ren gehen, durch Zinkmangel 2,8 Mio. und durch Vitamin A-Mangel 2,3 Mio. Zusammen kön-nen diese Defizite die indische Wirtschaft 0,8-2,5 Prozent kosten.
Gestützt auf ausführliche Nahrungsmittel-Konsumdaten einer landesweiten, repräsentati-ven Haushaltsbefragung in Indien, wird in der Studie die Verteilung der Eisen, Zink- und Vita-min A-Aufnahme berechnet, sowohl für den Status quo, wie auch für verschiedene Szenarien in denen die angereicherten Feldfrüchte konsumiert werden. (Die Szenarien berücksichtigen die Unsicherheit, die ex ante Analysen innewohnt.) Die Verschiebungen dieser Verteilungs-kurven in den Szenarien werden dazu genutzt, das verminderte Auftreten der verschiedenen Gesundheitsfolgen der jeweiligen Mangelerscheinungen explizit zu berechnen. Auch dieses wurde zuvor noch nicht in solcher Ausführlichkeit getan, und für Eisen wurde eine neue Methode entwickelt um den Besonderheiten der Eisenversorgung Rechnung zu tragen. Die Ergebnisse dieser Übung zeigen, dass die angereicherten Getreidearten die Krankheitslast der drei Mangelerscheinungen über 50 Prozent reduzieren können. Insbesondere werden Verringerungen von 19-58 Prozent für das eisenreiche Getreide, 16-55 Prozent für das zink-reiche Getreide und 5-54 Prozent für Goldenen Reis projeziert.
Aufbauend auf die geschätzten Gesundheitsnutzen wird eine Analyse der Kosteneffizienz durchgeführt. Die Kosten für die Bewahrung eines gesunden Lebensjahrs belaufen sich auf 0,46-5,39 US$ bei der Anreicherung von Reis und Weizen mit Eisen, auf 0,68-8,80 US$ bei der Anreicherung des Getreides mit Zink und auf 3,40-35,47 US$ bei Goldenem Reis. Somit ist natürliche Anreicherung kosteneffizienter als alternativen Eingriffe. (Maßnahmen gegen Ei-senmangel kosten 6-16 US$, gegen Zinkmangel 5-18 US$ und gegen Vitamin A-Mangel 84-599 US$). Natürliche Anreicherung erfüllt auch die von internationalen Organisationen vorge-schlagenen Kriterien von 217-620 US$ mit Leichtigkeit. Obwohl in der Studie die Vorzüge der durchgeführten Analyse der Kosteneffizienz hervorgehoben werden, werden auch Möglich-keiten diskutiert, wie gesunde Lebensjahre in Geldeinheiten bewertet werden können. Nach-dem die Gesundheitsgewinne in Dollars umgerechnet wurden, wird auch eine herkömmliche Kosten-Nutzen-Analyse für die verschiedenen angereicherten Feldfrüchte durchgeführt: der
ix
interne Zinsfuß für die Entwicklung von eisenreichem Reis und Weizen beläuft sich auf 61-168 Prozent, für die Entwicklung des zinkreichen Getreides beträgt er 53-153 Prozent und bei Goldenem Reis 30-76 Prozent. (Die entsprechenden Nutzen-Kosten-Koeffizienten sind 186-2.180, 114-1.472 und 28-295). Diese Ergebnisse werden den Renditen anderer landwirt-schaftlicher Projekte gegenübergestellt, die zwischen 17-81 Prozent fallen. In Bezug auf die Diskussion um Gentechnik wird die Stichhaltigkeit verbreiteter Argumente gegen Goldenen Reis erörtert.
Unter Beachtung der Einschränkungen von ex ante Analysen wird schließlich das günstige Ergebnis der Bewertung hervorgehoben. In Anbetracht der Schwankungen der Ergebnisse bei unterschiedlichen Projektionen, wird jedoch auch auf die Bedeutung des Engagements und der Unterstützung durch alle Akteure und Beteiligten hingewiesen, um das volle Potential natürlicher Anreicherung ausschöpfen zu können. Ebenso wird die Wichtigkeit einer umfas-senden Strategie zur Bekämpfung von Mikronährstoffmangel als Problem der öffentlichen Gesundheit unterstrichen, welche eine Kombination verschiedener Eingriffe beinhaltet. Die derzeitigen Ergebnisse werden dahingehend bewertet, dass sie die laufenden Bemühungen um natürliche Anreicherung rechtfertigen. Zukünftige Forschung mag diese Ergebnisse be-kräftigen und bestätigen, dass natürliche Anreicherung eine sehr kosteneffizienten Maßnah-me ist die dazu beitragen kann Mikronährstoffmangel zu kontrollieren und verdeckten Hunger zu verringern.
x
Abbreviations and acronyms
µg microgram ¢ US cents βC beta-carotene BCR benefit-cost ratio calc. calculation CBA cost-benefit analysis CEA cost-effectiveness analysis CGIAR Consultative Group on International Agricultural Research CHOICE Choosing Interventions that are Cost Effective (WHO project) CIMMYT Centro Internacional de Mejoramiento de Maíz y Trigo (International Maize and Wheat Improvement Centre) DALYs disability-adjusted life years EAR estimated average requirement FAO Food and Agriculture Organization of the United Nations Fe iron GBD Global Burden of Disease GDP gross domestic product GM genetically modified GMO genetically modified organism GNI gross national income GoI government of India I$ international dollars (exhange rate at PPP) ICDS Integrated Child Development Services ID iron deficiency IDA iron deficiency anaemia IFPRI International Food Policy Research Institute IPR intellectual property right IRR internal rate of return IRRI International Rice Research Institute LSMS Living Standard Measurement Study m million (1 m = 1,000,000; 1 billion = 1,000,000,000) mIDA moderate iron deficiency anaemia MN micronutrient n.d. no date (of publication) N/A not applicable
xi
NPV net present value optim. optimistic PDS Public Distribution System PE protein-energy pessim. pessimistic ppm parts per million PPP purchasing power parity R&D research and development RDA recommended dietary allowance Rs. current Indian rupees (see Annexe 4 for exchange rates Rs./US$) SD standard deviation SEAR-D �South-East Asia Region� where both child and adult mortality are high1 sIDA severe iron deficiency anaemia TRIPS Trade-Related Aspects on Intellectual Property Rights (WTO agreement) UNDP United Nations Development Programme US$ US dollars USAID US Agency for International Development VA vitamin A, retinol VAD vitamin A deficiency VSL value of a statistical life WHO World Health Organization WTO World Trade Organization WTP willingness-to-pay YLD years lived with disability YLL years of life lost ZEF Centre for Development Research (Zentrum für Entwicklungsforschung) Zn zinc ZnD zinc deficiency
1 Construct of the WHO (2002) that comprises Bangladesh, Bhutan, India, Maldives, Myanmar, Nepal and North Korea. India accounts for 81% of the population in this region (World Bank 2005).
xii
List of tables
Table 1. Prevalence rates of iron deficiency anaemia in India (percent) .......................................41 Table 2. Assumptions used to simulate the consumption of biofortified crops ..............................47 Table 3. Assumptions about the consumption of Golden Rice ......................................................49 Table 4. Costs and time frame of biofortification with either iron or zinc........................................59 Table 5. Costs and time frame of Golden Rice ..............................................................................60 Table 6. Benchmarks for assessing the cost-effectiveness of DALYs saved in India....................61 Table 7. Possible monetary valuations of one DALY gained in India ............................................64 Table 8. Prevalence of IDA with and without iron biofortification of rice and wheat.......................69 Table 9. The disaggregated impact of biofortification on the burden of IDA in India......................70 Table 10. The cost-effectiveness and the cost per capita of iron-rich cereals in India...................71 Table 11: Cost of the tablets for India�s Nutritional Anaemia Prophylaxis Programme..................72 Table 12. The results of a cost-benefit analysis of iron biofortification...........................................73 Table 13. Ranges of benefit-cost ratios of different studies of iron interventions...........................74 Table 14. IDA in India and the potential economic impact of biofortification..................................74 Table 15. Incidence rates of health outcomes of zinc deficiency for different scenarios ...............76 Table 16. The impact of biofortification on the burden of ZnD in India...........................................77 Table 17. The cost-effectiveness and the cost per capita of zinc-rich cereals in India ..................78 Table 18: Cost-effectiveness of zinc fortification and zinc supplementation ..................................79 Table 19. The results of a cost-benefit analysis of zinc biofortification ..........................................80 Table 20. ZnD in India and the potential economic impact of biofortification.................................81 Table 21. Incidence rates of health outcomes of VAD for different scenarios ...............................82 Table 22. The impact of Golden Rice on the burden of VAD in India ............................................83 Table 23. Sensitivity scenarios for analysing the impact of Golden Rice.......................................84 Table 24. The efficacy of Golden Rice in closing the intake gap of vitamin A (percent) ................85 Table 25. The cost-effectiveness and the cost per capita of Golden Rice in India ........................85 Table 26: Cost-effectiveness of VA fortification and VA supplementation .....................................86 Table 27. The results of a cost-benefit analysis of Golden Rice....................................................88 Table 28. VAD in India and the potential economic impact of biofortification ................................89 Table 29: Width and depth of IDA, ZnD and VAD in India .............................................................91 Table 30. A comparison of burdens of IDA and VAD in India (DALYs lost)...................................93 Table 31. The potential impact of biofortification (percent reduction of burden) ............................96 Table 32. The marginal gain of biofortifying wheat with iron or zinc ..............................................97 Table 33. Effective beta-carotene content vs. coverage of Golden Rice .......................................98 Table 34. The overall cost-effectiveness of biofortification in India (US$/DALY saved) ..............100 Table 35. Ranges of DALY costs of different interventions (US$/DALY saved) ..........................101 Table 36. The marginal cost-effectiveness of biofortification (US$/DALY saved)........................101 Table 37. The cost-effectiveness of biofortification based on national costs ...............................102 Table 38. Results of analysing costs and benefits of biofortification in a wider context...............103 Table 39. Annual costs of biofortification and current programmes in India (US$)......................103 Table 40: Shiva�s selection of Indian foods and their VA and fat contents ..................................108 Table 41. Average annual exchange rates Rs./US$....................................................................145
xiii
List of figures
Figure 1. Number of people suffering from malnutrition worldwide..................................................2 Figure 2. Estimated prevalence of stunting among children under 5 years of age..........................7 Figure 3. The WHO�s burden of disease in the SEAR-D-region in 2000 (DALYs lost) ....................8 Figure 4. Iron and zinc concentrations in wheat cultivars released by CIMMYT ...........................15 Figure 5. Biofortification as breeding objective for different breeding techniques..........................16 Figure 6: Potential benefits of GM food crops and their underlying rationale ................................19 Figure 7. Adoption of GM crops worldwide (number of farmers) ...................................................20 Figure 8. A possible dimension in the rejection of Golden Rice and other GM crops....................22 Figure 9. The individual malnutrition-poverty trap..........................................................................23 Figure 10. The social malnutrition trap...........................................................................................24 Figure 11. The effect of discounting: the present value of 100 over time ......................................34 Figure 12. Under-five mortality due to vitamin A deficiency...........................................................39 Figure 13. Average remaining life expectancies for India ..............................................................40 Figure 14. Relationship between micronutrient intake and health outcome ..................................51 Figure 15. The concept of EARs and RDAs and an exemplary intake distribution........................52 Figure 16. Consumption of cereals in rural areas (kg/capita/month, 1999/2000) ..........................53 Figure 17. Cumulative distribution of iron intakes and the prevalence of IDA................................55 Figure 18. Layout for calculating the impact of iron biofortification ................................................56 Figure 19. Layout for calculating the impact of zinc biofortification and Golden Rice ....................57 Figure 20. The burden of IDA by gender groups (DALYs lost) ......................................................67 Figure 21. The burden of IDA by health outcomes (DALYs lost) ...................................................67 Figure 22. The burden of IDA by severity and in relation to the number of cases .........................68 Figure 23. The burden of IDA by target groups and in relation to the number of cases ................68 Figure 24. DALYs gained and lost in different scenarios with biofortified crops ............................69 Figure 25. The burden of ZnD by age groups (DALYs lost)...........................................................75 Figure 26. The burden of ZnD by health outcomes (DALYs lost) ..................................................75 Figure 27. DALYs gained and lost in different scenarios with biofortified crops ............................76 Figure 28. The reduction of the burden of ZnD through biofortification by age group....................77 Figure 29. The burden of VAD by target groups (DALYs lost).......................................................81 Figure 30. The burden of VAD by health outcomes (DALYs lost)..................................................82 Figure 31. DALYs gained and lost in different scenarios with Golden Rice...................................83 Figure 32. IDA, ZnD and VAD in India, ranked by the number of DALYs lost ...............................90 Figure 33. The annual loss of life and health due to IDA, ZnD and VAD in India ..........................92 Figure 34. The WHO�s �attributable� burden of IDA and ZnD (DALYs lost)...................................94 Figure 35. The burden of selected disease in SEAR-D in 2000 (DALYs lost) ...............................95 Figure 36. Economic growth and the loss through micronutrient malnutrition .............................104 Figure 37. Daily exchange rates Rs./US$....................................................................................145
List of boxes
Box 1: Illustration of changing perceptions of technologies over time ....................................... 17 Box 2: Explaining DALYs by means of a comparison ............................................................... 30 Box 3: Deriving a yardstick for the cost-effectiveness of VA interventions in India.................... 87
1
1 Introduction
�Men and women have the right to live their lives and raise their children ... free from hunger.� (United Nations Millennium Declaration)
Hunger is a scourge of humanity since times immemorial � and until our present days. At the dawn of the new millennium (2000-2002) more than 850 million people worldwide were undernourished (FAO 2004a). Given a total population of 6 billion2 people this means that one out of seven people is suffering from hunger. While this situation is appalling and while only episodes of acute hunger and not the more prevalent chronic hunger receive broader attention, the problem is generally acknowledged and the task is now rather to move from political commitment and the setting of goals to action and the achievement of actual out-comes (Sanchez and Swaminathan 2005; von Braun et al. 2004). And action is indeed im-perative, because the unacceptability of hunger is also underlined in numerous human rights declarations, international conventions and resolutions (c.f. section 2.5.2). Still, since Malthus (1798) established the connection between the level of the means of subsistence (like food) and the preventive and positive checks on population growth (like early marriages and fam-ines, respectively), human ingenuity in increasing the means of subsistence has so far mostly succeeded in avoiding the deadly mechanism of outright famines that Malthus envisioned otherwise. In our times, science has brought about great progress in ensuring food security for millions of people: the Green Revolution, with the introduction of high-yielding crop varie-ties and the more intense use of inputs like irrigation and agro-chemicals, has helped to avoid widespread starvation and impede famines, especially in Asia.
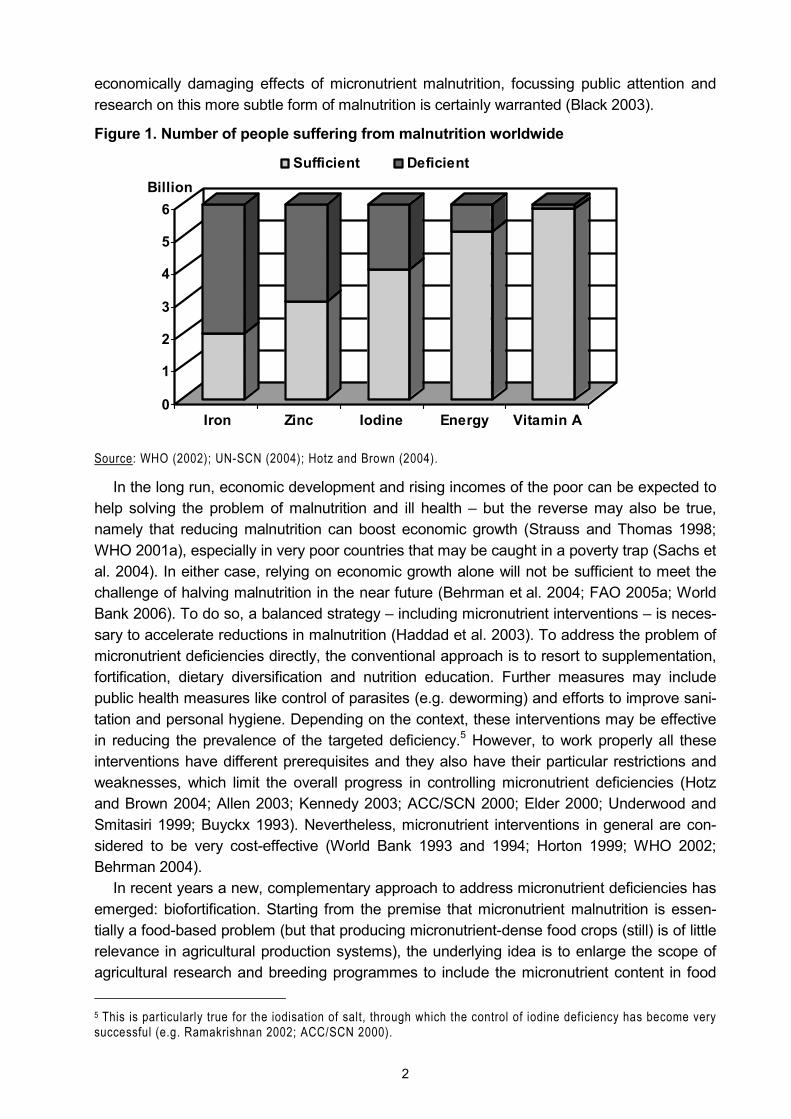
However, much larger numbers of people suffer from a different, stealthier form of hunger than simple lack of sufficient quantities of foodstuffs: micronutrient malnutrition, or �hidden hunger�, is caused by a lack of food of sufficient dietary quality (Kennedy et al. 2003). While often providing enough calories, monotonous diets based on cereals and other starchy staple foods frequently fail to deliver sufficient quantities of essential minerals and vitamins like io-dine, iron, zinc and vitamin A (Demment et al. 2003).3 The resulting micronutrient deficiencies can have devastating consequences for the life, health and well-being of the affected indi-viduals: premature death, blindness, cretinism, weakened immune system, stunting, reduced productivity, fatigue and lack of drive.4 In many countries the dimension of these deficiencies attains proportions that make micronutrient malnutrition to a public health problem of primary concern � with concomitant effects on productivity and overall welfare of the affected socie-ties (FAO 2004a; MI/UNICEF 2004; UN-SCN 2004; WHO 2002, World Bank 1994). In total, more than two-thirds of the world population � for the most part women and children � suffer from at least one micronutrient deficiency: 4-5 billion people are iron deficient (WHO 2003a), 2 billion are iodine deficient, about 150 million are vitamin A deficient (UN-SCN 2004) and as many as 3 billion people are at risk of zinc deficiency (Hotz and Brown 2004) (Figure 1). Given these large figures and the general agreement on the individually debilitating and
2 To avoid misunderstandings, in this study �billion� is used in its US notation, i.e. 1 billion = 1,000,000,000. 3 Incidentally, the Green Revolution is partly blamed for this situation as its primary focus was increasing the quantity of food but not its quality or diversity (Demment et al. 2003; Welch and Ross 2000). 4 While above I have stated that humankind has mostly succeeded in preventing general and widespread famines, I should perhaps add that Malthus (1798) has also counted �unwholesome� food as a secondary cause of other positive checks on population growth (like poor health and epidemics).
2
economically damaging effects of micronutrient malnutrition, focussing public attention and research on this more subtle form of malnutrition is certainly warranted (Black 2003).
Figure 1. Number of people suffering from malnutrition worldwide
0
1
2
3
4
5
6Billion
Iron Zinc Iodine Energy Vitamin A
Sufficient Deficient
Source: WHO (2002); UN-SCN (2004); Hotz and Brown (2004).
In the long run, economic development and rising incomes of the poor can be expected to help solving the problem of malnutrition and ill health � but the reverse may also be true, namely that reducing malnutrition can boost economic growth (Strauss and Thomas 1998; WHO 2001a), especially in very poor countries that may be caught in a poverty trap (Sachs et al. 2004). In either case, relying on economic growth alone will not be sufficient to meet the challenge of halving malnutrition in the near future (Behrman et al. 2004; FAO 2005a; World Bank 2006). To do so, a balanced strategy � including micronutrient interventions � is neces-sary to accelerate reductions in malnutrition (Haddad et al. 2003). To address the problem of micronutrient deficiencies directly, the conventional approach is to resort to supplementation, fortification, dietary diversification and nutrition education. Further measures may include public health measures like control of parasites (e.g. deworming) and efforts to improve sani-tation and personal hygiene. Depending on the context, these interventions may be effective in reducing the prevalence of the targeted deficiency.5 However, to work properly all these interventions have different prerequisites and they also have their particular restrictions and weaknesses, which limit the overall progress in controlling micronutrient deficiencies (Hotz and Brown 2004; Allen 2003; Kennedy 2003; ACC/SCN 2000; Elder 2000; Underwood and Smitasiri 1999; Buyckx 1993). Nevertheless, micronutrient interventions in general are con-sidered to be very cost-effective (World Bank 1993 and 1994; Horton 1999; WHO 2002; Behrman 2004).
In recent years a new, complementary approach to address micronutrient deficiencies has emerged: biofortification. Starting from the premise that micronutrient malnutrition is essen-tially a food-based problem (but that producing micronutrient-dense food crops (still) is of little relevance in agricultural production systems), the underlying idea is to enlarge the scope of agricultural research and breeding programmes to include the micronutrient content in food 5 This is particularly true for the iodisation of salt, through which the control of iodine deficiency has become very successful (e.g. Ramakrishnan 2002; ACC/SCN 2000).
3
crops as an explicit goal. In this case, plants could be bred to fortify themselves (Bouis et al. 2000). Moreover, focusing this approach on staple crops could increase the micronutrient in-take of the poor, who are most at risk of suffering from vitamin and mineral deficiencies be-cause they cannot afford a diet adequate in better sources of micronutrients like fruits, vege-tables and livestock products. Hence, biofortification is expected to be self-targeting (Welch and Ross 2000; Bouis 2002a). Consumer acceptance of biofortified crops is not expected to be an issue, because � at least in the case of iron and zinc � micronutrient density is largely an unnoticeable trait. However, these traits have to be bred into agronomically superior varie-ties to ensure adoption among farmers. In this context, one welcome side effect is that biofor-tified crops may perform better on micronutrient-poor soils (Welch 2002). Apart from these more technical arguments, the major reason that is put forward in support of biofortification is an economic one: because a largely one-time investment into the development of a bioforti-fied crop may benefit various countries around the world, and farmers everywhere can grow and reproduce the crops year on year, the result could be a continuous stream of widespread benefits. With the benefits thus accumulating over time and space, the investment in research and development (R&D) of biofortified crops has the potential to reap huge returns in terms of improved public health, overall welfare and economic growth. Given the annually recurring costs of the major current alternatives (fortification and supplementation), biofortification holds the promise to be a more cost-effective intervention (Bouis 2002b).
To promote the development and dissemination of biofortified food crops, the International Food Policy Research Institute (IFPRI) and the International Maize and Wheat Improvement Centre (CIMMYT) of the Consultative Group on International Agricultural Research (CGIAR) have initiated the HarvestPlus programme (Bouis et al. 2000; HarvestPlus 2006); the more narrow aim of promoting beta-carotene-rich �Golden Rice� is pursued by the Golden Rice Humanitarian Board, which is formed by members of the University of Freiburg, the Swiss Federal Institute of Technology, the Swiss Agency for Development and Cooperation, the Rockefeller Foundation, the US Agency for International Development (USAID), Syngenta, the International Rice Research Institute (IRRI) and Tufts University (Golden Rice 2005).
Biofortified crops are still at an � albeit advanced � stage of R&D. Their actual effective-ness in terms of agronomic and health outcomes remains unknown. However, to compare this new approach with existing interventions, information on the cost-effectiveness of bioforti-fication is sorely needed, whether it is carried out through conventional breeding or genetic engineering. Filling this knowledge gap regarding the possible impact of biofortification is both vital and urgent: neglecting a potentially effective intervention and any delays in its imple-mentation may literally cost lives.
One contribution of my work is to narrow this knowledge gap, i.e. I determine the effective-ness of biofortification for five biofortified crops (iron-rich rice, iron-rich wheat, zinc-rich rice, zinc-rich wheat and Golden Rice)6 that address three different micronutrient deficiencies (iron deficiency, zinc deficiency and vitamin A deficiency). Yet, to assess such health interventions, determining their effectiveness is necessary but not sufficient: in a world of scarcity (relative) costs matter. Indeed, as the World Bank (1993, p. 61) puts it: �Because interventions can dif- 6 While research is also being carried out to increase the levels of bioavailable micronutrients in various staple crops through transgenic approaches (Goto et al. 1999; Holm et al. 2002; Lucca et al. 2001 and 2002; Murray-Kolb et al. 2002; Vasconcelos et al. 2003; Shivaprakash 2004; Lakshmikumaran 2004; Ducreux et al. 2005; Dra-kakaki et al. 2005), my analyses of mineral-rich cereals are based on ongoing R&D efforts to increase the iron and zinc content through conventional breeding. In my analysis Golden Rice is the only transgenic crop.
4
fer so much in cost-effectiveness, making allocative decisions badly in either the public or the private sector costs lives. [...] Insisting on value for money is not only fully consistent with compassion for the victims of disease, it is the only way to avert needless suffering.� And in a more recent assessment of strategies to achieve the millennium development goals, the World Health Organization�s CHOICE Team (Evans et al. 2005a, p. 1133) finds that �making best use of resources is vital in developing countries that are struggling to improve public health with limited funds.� Hence, a further contribution of my work is the establishment of the cost-effectiveness of biofortification with regard to potential alternatives (and other suitable benchmarks).
Prior to analysing the effectiveness of an intervention it is necessary to quantify the under-lying problem, though. While the cause of micronutrient deficiencies is essentially poor nutri-tion, the outcome is poor health. Therefore, the methodological challenge when analysing and comparing these deficiencies is to measure �health� in a consistent manner. Once the differ-ent health outcomes of micronutrient deficiencies are combined in a single index, they can be aggregated to determine the underlying �burden� of each deficiency. One method that avoids the rather inegalitarian results of cost-of-illness or willingness-to-pay (WTP) approaches are �disability-adjusted life years� (DALYs). DALYs weight different health states according to their respective severity before adding up their durations to obtain the burden of a disease expressed in �healthy life years� that are lost. This method was introduced by the World Bank (1993) and subsequently popularised by Murray and Lopez (1996a). The method has be-come widely adopted and accepted (for a literature review see Fox-Rushby 2002). It has been used by other international organisations (WHO 2001a and 2002; UN-SCN 2004; FAO 2004a) and for analyses in the context of developing countries (Gwatkin 1999); it is now used to quantify health-related costs in such diverging areas as the global incidence of civil war (Collier and Hoeffler 2004), poor water and sanitation infrastructures (Rijsberman 2004) or communicable diseases (Mills and Shillcutt 2004). Hence, DALYs are not only methodologi-cally adequate to measure the health burden of micronutrient malnutrition, results expressed in DALYs are also widely comparable.
More recently, DALYs have been used to carry out a cost-benefit analysis (CBA) for a sin-gle biofortified crop (Zimmermann and Qaim 2004). In other economic analyses of biofortified crops, assessments have been based on potential improvements in micronutrient intake or on expected reductions in the prevalence rates of the respective deficiency (Bouis 2002a; Dawe et al. 2002; Albrecht 2002), i.e. the actual adverse functional outcomes of the underlying mi-cronutrient deficiencies were ignored. And all these studies either rely on limited, regional food intake data from small-scale surveys, on highly aggregated national food consumption data or on assumptions on the food intake of a representative adult only.
In this study I discuss and refine the DALYs methodology to analyse iron deficiency anae-mia (IDA), zinc deficiency (ZnD) and vitamin A deficiency (VAD) within a single, systematic and consistent framework. To do so, I model the individual health outcomes of these micro-nutrient deficiencies more explicitly and consider more nutritional and epidemiological details than previous studies. I then use this improved framework to compare and assess the poten-tial impact of the five different biofortified crops mentioned above on the burden of IDA, ZnD and VAD, respectively. (So far burdens of ZnD had not been calculated explicitly.) Because all these crops are still at the R&D stage I resort to an ex ante analysis and simulate their consumption for different scenarios. In an improvement over previous work, these simulations are based on detailed food consumption data from a nationally representative household
5
survey, which � although more demanding in terms of data, computing power, programming and time � adds further accuracy and robustness to the result of the analysis. The shift in the whole intake distribution of the different micronutrients, which occurs when biofortified crops are consumed, is then explicitly translated into a reduction of the incidence of the different health outcomes of each of the three micronutrient deficiencies. (In this context I develop a new approach to link iron intakes to the incidence of health outcomes of IDA.) Hence, my re-sults represent a more precise and more detailed estimation of the burden of the micronutri-ent deficiencies and of the potential impact of biofortification on public health.
Based on the estimated health benefits, I proceed to carry out a cost-effectiveness analy-sis (CEA) of biofortification. Given that DALYs are a standardised unit of �health�, the potential health benefits of the biofortified crops � which are expressed in the number of DALYs that may be saved � are comparable across different interventions. Juxtaposing these health benefits and the costs of biofortification (for R&D, dissemination, social marketing, extension and maintenance) over a suitable period of time yields a cost-effectiveness indicator in the form of the �cost per DALY saved�. These relative costs of the different biofortified crops are ranked and compared with other micronutrient interventions and benchmarks set by interna-tional organisations. Yet, focusing on DALYs has its limits because not all scientists and pol-icy-makers are familiar with this concept and not all interventions can or will be assessed using this method. Therefore, in an additional step, a monetary value is attached to DALYs to transform the health benefits into monetary benefits. (In this context, where previous work has resorted to more ad hoc valuations, I discuss in more depths the different approaches that are possible to value one DALY.) Having expressed both costs and benefits in monetary terms, a CBA is carried out and economic indicators like the internal rate of return and benefit-cost ratios are produced for the different biofortified crops. These results are then compared with average returns of agricultural R&D projects and recommended cut-off levels for health pro-grammes, which allows for assessing the relative profitability of biofortification. The conver-sion of DALYs into monetary terms is also used to estimate the impact of micronutrient mal-nutrition on overall economic growth in India, which has not been done this way before. In an extension to the main discussion of the results, I enter the controversy about plant biotech-nology and Golden Rice, challenge the validity of often quoted arguments of critics of Golden Rice and discuss the corresponding background as well as the implications of my findings in greater detail.
The regional focus of this economic analysis of biofortification is India. In a nutrition index of 106 countries, India ranked 77th and its nutrition situation was defined as �bad� (Wiesmann 2004). In India about half of the women and three quarters of the children are anaemic (NFHS 2000),7 the risk of ZnD is estimated to be high (Hotz and Brown 2004) and almost one-third of all preschool children are vitamin A (VA) deficient (UN-SCN 2004). Moreover, the efficacy and coverage levels of India�s existing iron and VA supplementation programmes are low (Kapil 2003; GoI 2002) and for zinc there are no significant interventions at all (MI 2005).8 At the same time rice and wheat are consumed widely � for example, in rural India the average
7 IDA is only a subgroup of anaemia, but because it is the most important one it is often used as proxy for IDA. Yet, individuals can also suffer from ID without being anaemic (Nestel and Davidsson 2002). 8 While ZnD in humans is known since over 40 years (Prasad 2003), the extent and severity of this deficiency has only become apparent more recently (Hotz and Brown 2004; UN-SCN 2004), largely because of the difficulty in measuring zinc status.
6
monthly per capita consumption of rice is 6.8 kg and of wheat 4.6 kg (NSSO 2001).9 And for India data is available of a nationally representative survey of 120,000 households. The sur-vey was carried out by the National Sample Survey Organisation (NSSO 2000) and com-prises the households� consumption of over 140 different foodstuffs. This background makes India an ideal test case for the purpose of my analyses.
Apart from this introduction, the study comprises five more chapters. The next chapter pro-vides some background information to put this study into its wider context. This includes an overview of the problem of micronutrient malnutrition, of possible interventions in general and of biofortification in particular; biofortification and genetic engineering are put in perspective to the technological developments in agriculture and society; and economic as well as legal reasons for addressing micronutrient deficiencies are offered. In chapter 3 the actual analysis begins with an explanation and justification of the DALYs method, which is used for quantify-ing the amount of ill health that is caused by IDA, ZnD and VAD in India. In this chapter the data that is used in the analyses is presented, too, and the concepts that are used for linking micronutrient intakes to health outcomes are described and developed. In the last section of chapter 3 the different approaches that are used in the economic analyses are clarified. In chapter 4 the results of the analyses of the three case studies of (i) iron-rich rice and wheat, (ii) zinc-rich rice and wheat and (iii) Golden Rice are reported, before they are condensed, compared and discussed in chapter 5. In a separate section of chapter 5 popular criticisms of Golden Rice are examined. Finally, in the last chapter, conclusions are drawn and policy implications of the findings are pointed out.
9 Of course such aggregate figures mask regional and socioeconomic differences: while in the south of India rice is the predominant staple crop, in the north wheat is more important. Moreover, there are also inter-household differences. In my analysis this is taken care of through the use of household data.
7
2 Background
2.1 Micronutrient malnutrition worldwide
As already described in the introduction, billions of people are deficient in iron, iodine, zinc and/or VA (Figure 1). Yet, while micronutrient deficiencies, in particular iron deficiency, may also be a health problem for sub-groups within the societies in industrialised countries � like low income populations (Ramakrishnan and Yip 2002), children (Marx 1997; Moy and Early 1999; Ramakrishnan 2002; Ganji et al. 2003), women (Marx 1997; Ramakrishnan 2002; Bie-salski et al. 2003; Cogswell et al. 2003), the elderly (Marx 1997; Wakimoto and Block 2001; Mukhopadhyay and Mohanaruban 2002; Biesalski et al. 2003), migrants and minorities (Marx 1997; Looker et al. 2002; Ramakrishnan and Yip 2002; Ganji et al. 2003), blood donors (Marx 1997), vegetarians, some groups of athletes (Marx 1997; Biesalski et al. 2003), indigenous populations (Ramakrishnan and Yip 2002), people on a weight reduction diet, hospitalised and institutionalised people, subjects with a chronic inflammatory disorder, subjects with chronic administration of certain drugs and clinically defined groups of patients (Biesalski et al. 2003) �, micronutrient deficiencies as public health problem are largely under control in industrialised countries since the first half of the 20th century. Although, poor eating habits around the world contribute to increasing consumption of processed, energy-dense but mi-cronutrient-poor foods (DellaPenna 1999; WHO 2003b). Where micronutrient deficiencies are controlled, this is generally attributed to successful food fortification efforts (Mannar 2001; Clugston and Smith 2002; Beinner and Lamounier 2003), even if the respective policies may differ between industrialised countries (Nugent and McKevith 2004).
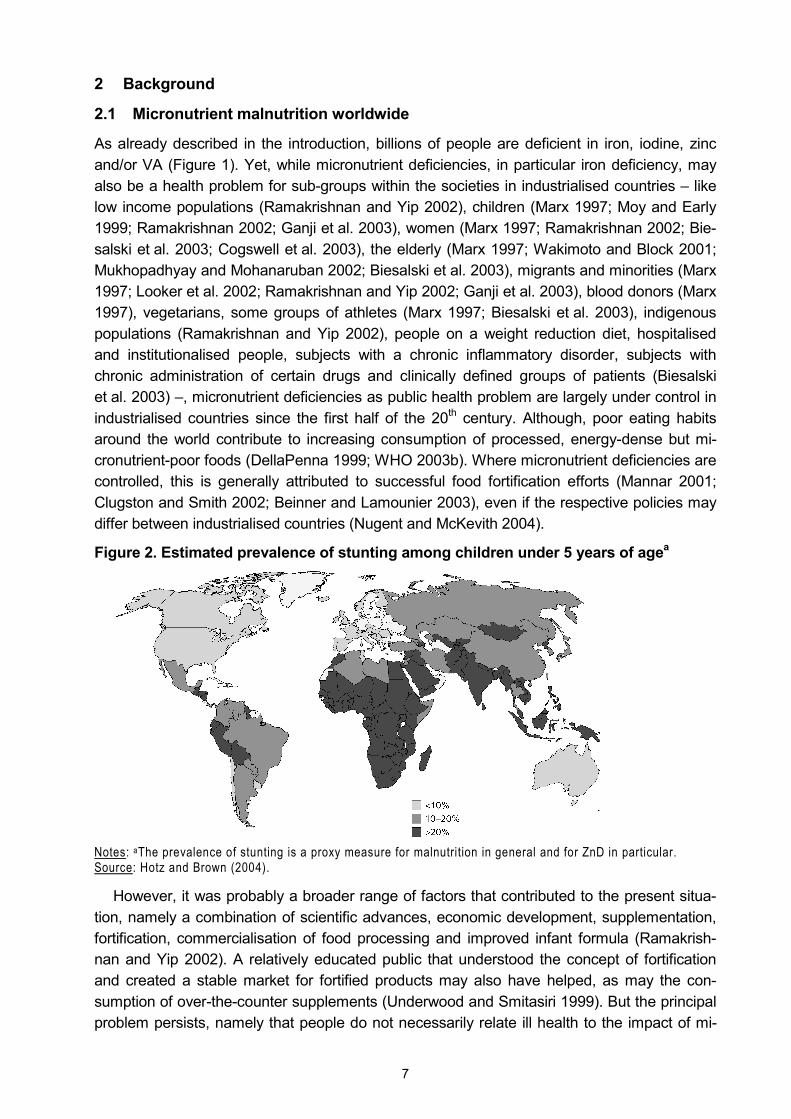
Figure 2. Estimated prevalence of stunting among children under 5 years of agea
Notes: aThe prevalence of stunting is a proxy measure for malnutrition in general and for ZnD in particular. Source: Hotz and Brown (2004).
However, it was probably a broader range of factors that contributed to the present situa-tion, namely a combination of scientific advances, economic development, supplementation, fortification, commercialisation of food processing and improved infant formula (Ramakrish-nan and Yip 2002). A relatively educated public that understood the concept of fortification and created a stable market for fortified products may also have helped, as may the con-sumption of over-the-counter supplements (Underwood and Smitasiri 1999). But the principal problem persists, namely that people do not necessarily relate ill health to the impact of mi-

8
cronutrient deficiencies and are frequently unable to reconcile their food preferences with nutritional requirements, i.e. they may change their consumption choices only partially (Behr-man 1995; Smith 2002). Hence, some control mechanisms for micronutrient deficiencies are necessary both in industrialised and in developing countries.10 Because in the developing world the income level is low and fortification and supplementation have only limited success (c.f. section 2.2), the biggest burden of micronutrient malnutrition is carried by Africa, large parts of Asia and some regions in Latin America (for example see Figure 2). Looking more particularly at Asia, Figure 3 gives an overview of the relative importance of micronutrient deficiencies in a region where, in total, more than 300 million DALYs are lost due to diseases and injuries.
Figure 3. The WHO�s burden of disease in the SEAR-D-region in 2000 (DALYs lost)
10 m
9 m
36 m
30 m
83 m145 m
NoncommunicableconditionsInfectious andparasitic diseasesRespiratoryinfectionsMaternalconditionsPerinatalconditionsNutritionaldeficiencies
Notes: �Nutritional deficiencies� include protein-energy malnutrition, iodine deficiency, IDA and VA-related visual problems; for more details c.f. section 5.1. �SEAR-D� corresponds to South Asia (c.f. list of acronyms). Source: WHO (2002).
2.2 Micronutrient interventions
2.2.1 Current micronutrient interventions
There are three broad concepts of interventions to control micronutrient deficiencies. First, efforts that are aimed at increasing the micronutrient content in the food that people usually eat are called fortification. This can be (i) �industrial fortification�, i.e. the addition of (synthetic) vitamin or mineral compounds during the processing of foodstuffs, whether commercially motivated, as part of public-private partnerships or required by law, (ii) �home fortification�, e.g. the voluntary application of sprinkles, or (iii) fortification by distributors somewhere along the food chain, e.g. the blending of grains or flour with micronutrient premixes.
Second, efforts that are aimed at supplying micronutrients in addition to the usual food (in the form of tablets or syrups) are called supplementation. This can be (i) �medical supple-mentation�, e.g. VA mega doses that are administered by health personnel, (ii) �pharmaceuti-cal supplementation�, e.g. iron pills that are prescribed but taken at home, or (iii) dietary sup-plements of safe dosages that are taken voluntarily.
Third, dietary diversification refers to strategies that seek to (i) increase the production of micronutrient-rich foods (e.g. through appropriate agricultural policies or the promotion of
10 The reliance on fortification in richer countries has, for instance, become apparent during the �Humana baby food scandal� in Israel, where several infants were hospitalised and two have died � possibly because the forti-fied baby formula they were fed accidentally lacked vitamin B1 (Siegel-Itzkovich 2003; BBC 2003).
9
home gardens), (ii) directly increase the micronutrient content in people�s diets through pro-moting the consumption of micronutrient-rich foods (which requires a change in people�s usual diets) and (iii) improve the bioavailability of the micronutrients that are consumed in the everyday food (e.g. through the joint consumption of food rich in potential promoters or the promotion of new food preparation techniques); dietary diversification usually requires nutri-tion education and communication for behaviour change. Biofortification, the subject of this study, could be seen as a combination of fortification and dietary diversification.
These distinctions do not necessarily follow common definitions but are made here to structure the different approaches, because each of the interventions has several dimensions. For example, fortification and dietary diversification are preventive measures, while supple-mentation can also be used for treatment of micronutrient deficiencies; supplementation and dietary diversification programmes are usually funded by governments or by donors, while the costs of fortification may be handed down to the consumers; with legislated fortification con-sumers do not need to do anything, while they need to be more active for dietary diversifica-tion or in the case of supplementation (i.e. take the tablets). These approaches are well es-tablished and discussed in the literature to varying degrees and for different micronutrients (e.g. World Bank 1994; Underwood and Smitasiri 1999; ACC/SCN 2000; Kennedy et al. 2003; Allen 2003; Hotz and Brown 2004). Yet, while it is generally acknowledged that iodisa-tion of salt is an effective solution that contributes successfully to the elimination of iodine deficiency, and while VA supplementation programmes are given some credit for reducing the prevalence of VAD, the overall success of micronutrient interventions in developing countries has been mixed (ACC/SCN 2000; Underwood 2000; Ramakrishnan 2002; Dalmiya and Schultink 2003; Allen 2003; Adamson 2004). An overview of successful programmes is given in Mason et al. (2004).
Supplementation Supplementation may be an effective strategy to reach specific target groups that require larger doses of micronutrients in a short period of time (Hotz and Brown 2004; Allen 2003; Mora 2002; Underwood 2000). However, the success of supplementation efforts is often lim-ited due to economic constraints and the intense requirements in terms of health personnel, which is also why it is considered to be unsustainable in the long run (Cook et al. 1994; Un-derwood and Smitasiri 1999; Underwood 2000; Beinner and Lamounier 2003; Hotz and Brown 2004). Another weakness is seen in bad delivery and poor health systems, ineffec-tively implemented programmes, inadequate supply of supplements and, hence, poor cover-age (Cook et al. 1994; Gillespie 1998; Underwood and Smitasiri 1999; Dillon 2000; ACC/SCN 2000; Hotz and Brown 2004). On the side of the potential beneficiaries, poor compliance and adherence (because of side effects and forgetfulness, respectively) are often mentioned as factors limiting the success of supplementation programmes (Cook et al. 1994; Gillespie 1998; Underwood and Smitasiri 1999; ACC/SCN 2000; Dillon 2000; Allen 2003; Beinner and Lamounier 2003; Hotz and Brown 2004).11 Pangaribuan et al. (2003) report for samples of rural and suburban households in Indonesia that limited knowledge of caretakers about the health benefits of VA reduces the likelihood of regular participation in VA supplementation
11 Evidence from the US and the UK indicates moreover that groups who could benefit most from supplements are often least likely to use them (Cogswell et al. 2003; Conner et al. 2003; Jasti et al. 2003). This is also reflected in the statement of Adamson (2004, p. 6) that �the children least likely to receive VA supplements are those most at risk from VAD.�
10
programmes. Shortcomings are also seen in poorly designed information and communication messages (Cook et al. 1994; Dillon 2000; Hotz and Brown 2004), the absence of commitment at the national and community levels (Hotz and Brown 2004) or the �top-down� approaches of supplementation programmes that divert attention from more sustainable food-based inter-ventions (Allen 2003). In the case of India, reports of child deaths that may have been caused by VA overdosing due to supplementation efforts in the state of Assam have stirred a contro-versy about the appropriateness of routine supplementation with VA mega doses � versus fortification efforts that use lower doses or interventions that rely on beta-carotene (Mudur 2001; West and Sommer 2002; Desai 2002; Kapil 2002; Solomons and Schümann 2002; Reddy 2002; Bhaumik 2003; Kapil 2004a; Solomons and Schümann 2004).
Fortification Fortification is generally seen as a non-obtrusive, cost-effective long-term strategy for defi-cient populations that regularly purchase and consume centrally processed foods (Under-wood and Smitasiri 1999; Underwood 2000; Mannar 200; Hotz and Brown 2004). Moreover, fortification may increase the intake of multiple micronutrients at once (Allen 2003; Mehansho et al. 2003; regarding simultaneous micronutrient interventions also c.f. section 5.1). How-ever, especially the poor and undernourished purchase fewer processed products and, in rural areas, are often self-subsistent (Mannar 2001), i.e. poverty and geography are obstacles for the targeting of fortification efforts. In the case of young children the portions that are con-sumed may be insufficient to supply adequate amounts of the micronutrient in question (Mora 2002). Hence, the lack of appropriate vehicles, i.e. processed food that is eaten in larger quantities by target populations, may limit the success of fortification efforts (Cook et al. 1994; Dillon 2000; Mannar 2001; Allen 2003). Similarly, it may be difficult to find a suitable fortifi-cant, i.e. a micronutrient compound that is bioavailable, does not react with the vehicle or affect the sensory qualities of the food and is functional throughout storage and when heated (Dillon 2000; Mannar 2001; Allen 2003; for a more practical guide c.f. Merx et al. 1996).
If fortification is legislated the government needs to regulate, monitor and enforce this de-cision � and if fortification is subsidised, the government needs the political will and the finan-cial capacity to fund these activities (Underwood and Smitasiri 1999).12 Otherwise, if food processors can be convinced to fortify their products voluntarily, social marketing and public education strategies are necessary to create demand for the � more expensive � fortified products (Underwood and Smitasiri 1999; Kennedy 2003; Hotz and Brown 2004). However, in many developing countries the lack of centralised processing facilities and weak mecha-nisms for quality control may impede implementation of fortification in the first place (Cook et al. 1994; Dillon 2000; Underwood 2000; Kennedy 2003).
Dietary diversification and nutrition education Dietary diversification, which is closely connected to nutrient adequacy and the nutritional status of children (Ruel 2002) and which may be used as an indicator for food security (Hod-dinott and Yohannes 2002), is commonly considered to be an ideal and sustainable approach to control micronutrient deficiencies in the long run (Ruel 2001; Allen 2003; Pangaribuan et al. 2003). Hotz and Brown (2004, p. S171) summarise this approach when writing:
12 In the case of economic crises fortification efforts � whether voluntary or legislated � may suffer setbacks. This was, e.g., the case in Guatemala where VA fortification of sugar was temporarily suspended because of an eco-nomic downturn and an increase in international VA prices (Underwood and Smitasiri 1999).
11
�Dietary diversification/modification represents a sustainable, economically feasible, and culturally acceptable approach that may be used to improve the adequacy of dietary intakes of several mi-cronutrients simultaneously with limited risk of antagonistic interactions. Because the process empowers individuals and households to take ultimate responsibility over the quality of their diet through self-production or acquisition of nutrient-rich foods and informed consumption choices. Once the expected behavior changes are achieved, it is also expected that inputs will be minimal as the practices become self-perpetuating through the natural mechanisms of information sharing.�
Unlike supplementation programmes that target certain individuals, dietary diversification could benefit all household members (Allen 2003). Yet, achieving the necessary sustainable behaviour change may be difficult (Gillespie 1998). Dietary diversification involves changes in production, processing and consumption of food; therefore the proposed changes must be practical, economically feasible and culturally acceptable for the target groups (Hotz and Brown 2004). A final verdict on these food-based approaches is difficult, though, because their real potential has not been explored adequately (Ruel 2001). Evaluations of nutrition education and related social marketing programmes, which are closely linked to dietary diver-sification efforts, as well as analyses of the influence of formal schooling, commonly find some sort of positive impact on nutritional status in target populations. Yet, the period during which the information is heeded may differ depending on the source of the information (Webb and Block 2004); additional sources of nutrition information � like access to village health centres � may also play a role in improving nutrition knowledge (Block 2004).
2.2.2 Micronutrient interventions in India
The main micronutrient interventions currently implemented in India are iodisation of salt and supplementation with VA and iron (GoI 2002). The �Nutritional Anaemia Control Programme� is in place since 1970. It is generally acknowledged that this iron programme has little real impact, though: it is considered to be insufficiently administered and monitored, underfunded and suffering from logistic and infrastructure problems as well as poor compliance (Kapil et al. 1996; Kumar 1998; Nair et al. 1998; Nair 2001; Vijayaraghavan 2002; Gautam et al. 2002; Kapil 2003; MI 2005). The effectiveness and coverage of India�s VA programme � the �Na-tional Prophylaxis Programme Against Nutritional Blindness�, which also dates back to 1970 � are assessed in a similar way (Kapil et al. 1996; GoI 2002; Kapil 2003).
To provide concrete figures, 30 percent of pregnant women consume at least 60 iron-folate tablets and 10 percent of adolescent girls receive weekly iron-folate supplements. Thirty-four percent of children under 5 years of age receive two doses of VA per year and 37 percent of all households use iodised salt. But trends differ over time: while the coverage of the VA pro-gramme has doubled between 2001 and 2004, the use of iodised salt went down by 16 per-cent between 1995 and 2003 (MI 2005). And there are regional differences. For example, while in Lakshadweep and on the Andaman and Nicobar Islands 95 and 90 percent of preg-nant women receive iron-folate tablets, respectively, in Uttar Pradesh and Bihar the numbers are 28 and 17 percent only. Similar differences exist in the coverage of children with iron-folic supplements. In Daman and Diu and in Mizoram the coverage is 28 and 27 percent, respec-tively, but in Rajasthan and Bihar it is only 2.5 and 1.4 percent (Reproductive and Child Health Survey 1998-99, taken from Kapil 2004b). For VA supplementation the picture looks similar: in Goa and Mizoram 52 and 42 percent of children aged 12-35 months, respectively, have received at least one dose of VA within the past 6 month; in Bihar and Nagaland it were only 7 and 4 percent (NFHS 2000).
12
Yet, there are more than only regional differences: 21 percent of urban children have re-ceived at least one dose of VA within the past 6 month, but only 16 percent of children living in rural areas have; 27 percent of children whose mothers have completed high school re-ceived the VA doses but only 13 percent of children whose mothers are illiterate. Similarly, while 24 percent of children of the better off households received VA supplements, only 13 percent of the poorer children were covered. And there is also a small gender difference: 18 percent of boys have received at least one dose of VA within the past 6 month, but only 16 percent of girls. For iron-folate tablets and iodised salt similar patterns apply (c.f. NFHS 2000). Hence, in addition to the negative overall assessment and the strong regional differ-ences, micronutrient interventions in India seem to be rather pro-urban, pro-educated and pro-rich.
Apart from iodised salt, only VA fortification of �vanaspati� (shortening made from hydroge-nated vegetable oil) and � in some locations � milk are mandatory (Chakravarty 2000a). According to Chakravarty (2000a), the mandated VA level in vanaspati is very low and the rural population consumes very little of it; she also questions the effectiveness of the fortifica-tion of milk because of its low consumption among target groups. Government plans are to extend the VA fortification to all vegetable oils, though (Gupta 2004). Voluntary fortification is taking place for branded wheat flour and fruit juice (Chikhalikar 2004). Yet, this only benefits consumers who can afford to buy these products.
2.2.3 A novel micronutrient intervention: biofortification
As has been shown so far, micronutrient deficiencies are a serious problem, but there are limitations to the interventions that are currently used for their control. Therefore, biofortifica-tion may be a complementary approach to help addressing the issue of micronutrient malnu-trition more efficiently and sustainably.
The development of crop varieties with high micronutrient concentration and superior agro-nomic traits is, above all, pursued by the HarvestPlus programme of the CGIAR. This pro-gramme is supported by the Bill and Melinda Gates Foundation, the World Bank, USAID, the Danish International Development Assistance, the Asian Development Bank, the UK Depart-ment for International Development, the Canadian International Development Agency and the Austrian Ministry of Finance. Biofortification efforts focus on staple crops identified as foods consumed by the poor: beans (for iron and zinc), rice (primarily for iron and zinc), maize (for beta-carotene), wheat (primarily for iron and zinc), cassava (primarily for beta-carotene), and sweet potatoes (for beta-carotene). In a future step more crops like banana/plantains, barley, cowpeas, groundnuts, lentils, millet, pigeon peas, potatoes, sorghum and yams are to be biofortified (HarvestPlus 2006).
The cost-effectiveness of biofortification is put forward as its major advantage (Bouis 2002a), because after a one-time investment in the development of the germplasm, multiplier effects may be realised if it is shared internationally; and farmers can reproduce the seeds themselves year on year, which requires only minimal recurrent costs. Hence, once the crops are released, biofortification may be highly sustainable (Nestel et al. 2006). The cost-effec-tiveness is the main topic of my work and will, therefore, be discussed and analysed in more detail in the remainder of this study; this section covers the other potential strengths and weaknesses of biofortification.
13
The idea of breeding crops for higher micronutrient content to improve human nutrition dates back to 1993, when this subject was brought up within the CGIAR, where it overlapped with ongoing breeding efforts to increase the uptake of minerals from the soil for improved plant nutrition (Bouis 1994a). According to Bouis (1994a), this coincidence between human and plant nutrition was crucial for the initiation of biofortification efforts, since the previous experience with high-quality protein maize had underlined the importance of reconciling agro-nomic performance with consumer attributes (Vasal 2000). Breeding for mineral content may improve disease resistance in plants, contribute to better developed root systems and boost seedling vigour, thus resulting in a win-win situation for both farmers and consumers (Bouis 1994a, Welch 2002). The agronomic aspect of biofortification is described in more detail by Ascher-Ellis et al. (2001) and the feasibility of biofortification � sufficient genetic variation, suitable selection methods and markers, workable heritabilities and the fact that desirable traits can be combined with high yield � has been reviewed by Graham et al. (1999). For rice, sufficient genetic variation for iron and zinc concentrations has been found (Gregorio et al. 2000). The same is true for wheat (Monasterio and Graham 2000; Cakmak et al. 2000). And for iron-rich rice the effectiveness of biofortification could already be demonstrated in a trial setting (Haas et al. 2005).13
Apart from its cost-effectiveness and the potential synergies in the field of human and plant nutrition, another main advantage of biofortification is the self-targeting of the approach: it is above all the poor who suffer from micronutrient malnutrition � and it is also the poor who usually consume large amounts of food staples. And relying on staple crops has a further advantage: people�s vulnerability regarding micronutrient malnutrition is reduced if micronutri-ents are provided through the food items that also supply the bulk of calories. For example, Block et al. (2004) report in their study of rural households in Central Java that Indonesia�s crisis of 1997/98 had a significant negative impact on the micronutrient status of children, while their overall nutritional status was less affected. Block et al. (2004) explain this with the food price shocks that may have lead poor households to change their food consumption pattern: protein-energy intake � especially from rice � was maintained at the expense of overall dietary quality. At the same time the economic crisis also lead to a reversal of the previous success of supplementation efforts (Underwood 2000). In such a context biofortified staple crops could help to safeguard people�s micronutrient status.
A further advantage is that biofortification not only covers individual family members (like supplementation); food staples are eaten by everyone (Bouis et al. 2000; Nestel et al. 2006). In addition, biofortification may reach urban populations and the undernourished in remote rural areas that may not be reached with fortified processed food products (Nestel et al. 2006). As such, biofortification promises to be a more general, pro-poor and pro-rural inter-vention that, at least in the case of India, could complement existing interventions (c.f. section 2.2.2). Indeed, biofortification is considered a complement to fortification (Nestel et al. 2006)
13 To what extent these results can be applied to the real world is less certain. For instance, the authors write that �careful control of the milling process ensured less iron loss than might be expected from commercial mills� (p. 2825, my emphasis). It is also odd that the acceptability test for the iron-rich rice and the control rice were carried out with the iron-rich rice and �a commercially available rice variety similar to the one chosen as the con-trol rice� (p. 2825, my emphasis). Yet, R&D efforts are stil l ongoing and the study could answer a central ques-tion, namely that simply increasing the iron content in cereals (without reducing the content of inhibitors or in-creasing the level of promoters) may be effective in reducing ID.
14
and an intermediate intervention between short-term supplementation efforts and long-term dietary diversification:
�We all envision a future when nutrition education and increased incomes of the poor will be com-bined with greater availability and lower food prices to improve dietary quality. However, this will require the eventual investment of many billions of dollars by small farmers, the business sector, and governments over several decades to increase the production and availability of these nutri-ent-rich, nonstaple foods. In the meantime, specific agricultural strategies can be implemented to improve nutritional status. One of these is �biofortification� � breeding for micronutrient-dense sta-ple food crops, a strategy of getting plants to fortify themselves� (Bouis 2002b, p. 352).
One potential shortcoming of biofortification could be sensory changes in the crops. This argument may not be true for mineral biofortification, because it is not expected that the small additional amounts of iron or zinc alter the appearance, taste, texture or cooking quality of the crops (Bouis et al. 2000). However, in the case of beta-carotene a visible trait is introduced, namely a deeper yellow or orange colour. In this case, biofortification may not rely on existing consumer behaviour alone. Therefore, the HarvestPlus strategy is to create demand for these varieties by linking producers and consumers through product and market development, i.e. HarvestPlus addresses users (producers and consumers) and institutional diffusers and en-ablers alike (Nestel et al. 2006). Then, if it can be marketed as a quality trait, the distinct col-our of crops rich in beta-carotene could be turned into an advantage (Bouis et al. 2000).
2.3 Micronutrient malnutrition and the Green Revolution
In the previous section I explained that the feasibility of biofortification hinges on the possibil-ity of reconciling agronomic breeding targets with the requirements of human nutrition. It is this � understandable � preoccupation with the agronomic characteristics of crops that may have contributed to the current state of affairs. For example, Monasterio and Graham (2000) describe how the grain yield in a historical set of wheat cultivars released by CIMMYT has increased between 1950 and 1992. This is what may have been expected of the Green Revolution. However, Monasterio and Graham (2000, p. 395, my emphasis) also find �a small but statistically significant negative trend in iron and zinc concentrations� in this set (Figure 4). Similarly, Cakmak et al. (2000) found higher iron and zinc concentrations in primitive wheat cultivars than in modern varieties and Frei and Becker (2004) affirm that the genetic diversity in rice landraces reflects their favourable nutritional characteristics compared to most high-yielding varieties. This is the very reason that Welch and Graham (2000, p. 15) put forward in favour of biofortification in their call for a paradigm change in agriculture:
�The path set down for world agriculture into the twenty-first century was defined barely a decade ago, but we already need new thinking to avert global food system failures. This has much to do with the impact of the Green Revolution and its perceived inadequacies: we have begun to ad-dress the environmental concerns about modern, technological agriculture, but evidence is grow-ing that our global food systems are failing to deliver adequate quantities of healthy, nutritionally balanced food, especially to underprivileged people.�
Hence, micronutrient malnutrition seems to be another shortcoming that is partly blamed on the Green Revolution � next to its focus on irrigated areas, environmental damage, soil degradation, chemical pollution, aquifer depletion and soil salinity (Evenson and Gollin 2003; IRRI 2002), adverse health consequences for farmer who apply the necessary pesticides (Huang et al. 2002), the neglect of root crops, traditional legumes and African staples (Chris-peels 2000; Timmer 2003; Conway 2003), or an increase in inequality between well-endowed
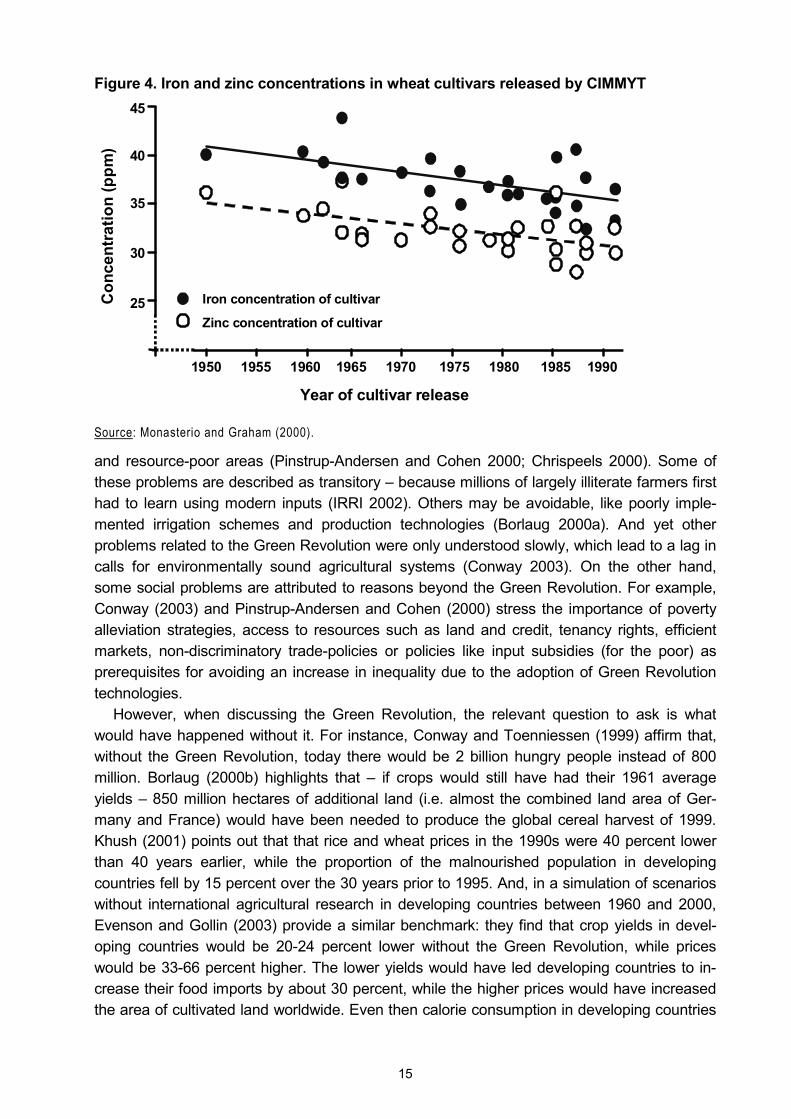
15
Figure 4. Iron and zinc concentrations in wheat cultivars released by CIMMYT
Source: Monasterio and Graham (2000).
and resource-poor areas (Pinstrup-Andersen and Cohen 2000; Chrispeels 2000). Some of these problems are described as transitory � because millions of largely illiterate farmers first had to learn using modern inputs (IRRI 2002). Others may be avoidable, like poorly imple-mented irrigation schemes and production technologies (Borlaug 2000a). And yet other problems related to the Green Revolution were only understood slowly, which lead to a lag in calls for environmentally sound agricultural systems (Conway 2003). On the other hand, some social problems are attributed to reasons beyond the Green Revolution. For example, Conway (2003) and Pinstrup-Andersen and Cohen (2000) stress the importance of poverty alleviation strategies, access to resources such as land and credit, tenancy rights, efficient markets, non-discriminatory trade-policies or policies like input subsidies (for the poor) as prerequisites for avoiding an increase in inequality due to the adoption of Green Revolution technologies.
However, when discussing the Green Revolution, the relevant question to ask is what would have happened without it. For instance, Conway and Toenniessen (1999) affirm that, without the Green Revolution, today there would be 2 billion hungry people instead of 800 million. Borlaug (2000b) highlights that � if crops would still have had their 1961 average yields � 850 million hectares of additional land (i.e. almost the combined land area of Ger-many and France) would have been needed to produce the global cereal harvest of 1999. Khush (2001) points out that that rice and wheat prices in the 1990s were 40 percent lower than 40 years earlier, while the proportion of the malnourished population in developing countries fell by 15 percent over the 30 years prior to 1995. And, in a simulation of scenarios without international agricultural research in developing countries between 1960 and 2000, Evenson and Gollin (2003) provide a similar benchmark: they find that crop yields in devel-oping countries would be 20-24 percent lower without the Green Revolution, while prices would be 33-66 percent higher. The lower yields would have led developing countries to in-crease their food imports by about 30 percent, while the higher prices would have increased the area of cultivated land worldwide. Even then calorie consumption in developing countries
1950 1955 1960 1965 1970 1975 1980 1985 1990
Year of cultivar release
Con
cent
ratio
n (p
pm)
45
40
35
30
25 Iron concentration of cultivar
Zinc concentration of cultivar
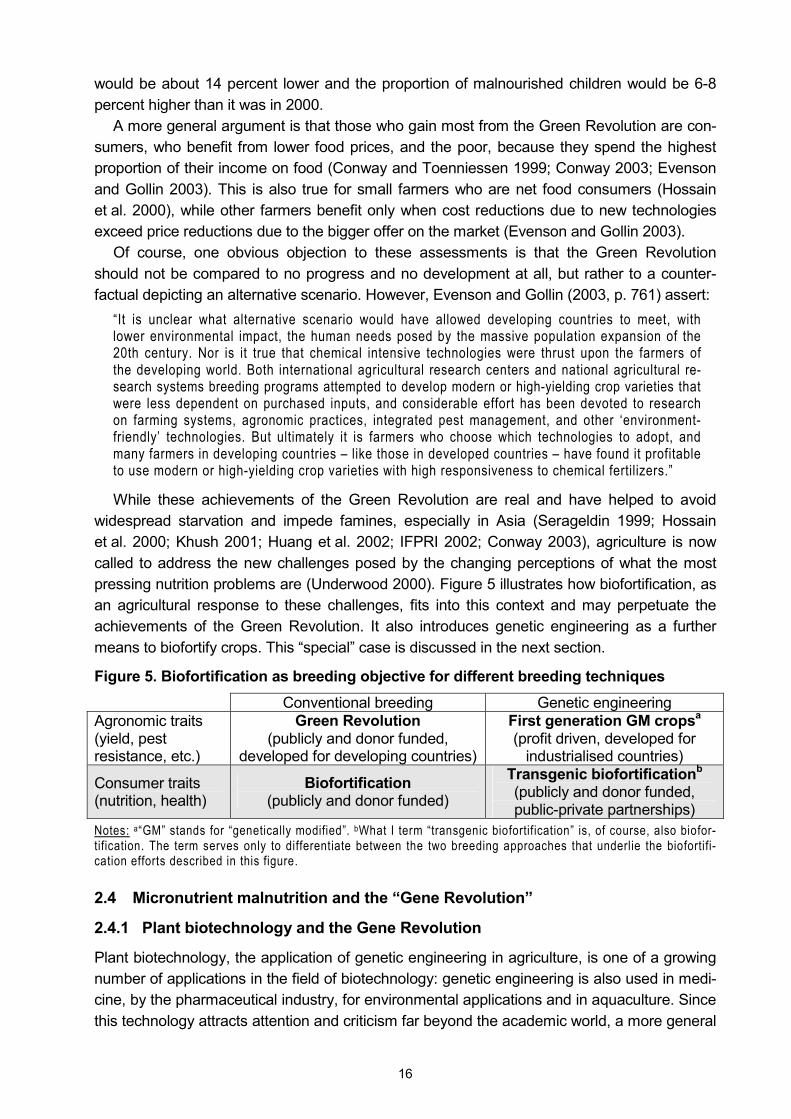
16
would be about 14 percent lower and the proportion of malnourished children would be 6-8 percent higher than it was in 2000.
A more general argument is that those who gain most from the Green Revolution are con-sumers, who benefit from lower food prices, and the poor, because they spend the highest proportion of their income on food (Conway and Toenniessen 1999; Conway 2003; Evenson and Gollin 2003). This is also true for small farmers who are net food consumers (Hossain et al. 2000), while other farmers benefit only when cost reductions due to new technologies exceed price reductions due to the bigger offer on the market (Evenson and Gollin 2003).
Of course, one obvious objection to these assessments is that the Green Revolution should not be compared to no progress and no development at all, but rather to a counter-factual depicting an alternative scenario. However, Evenson and Gollin (2003, p. 761) assert:
�It is unclear what alternative scenario would have allowed developing countries to meet, with lower environmental impact, the human needs posed by the massive population expansion of the 20th century. Nor is it true that chemical intensive technologies were thrust upon the farmers of the developing world. Both international agricultural research centers and national agricultural re-search systems breeding programs attempted to develop modern or high-yielding crop varieties that were less dependent on purchased inputs, and considerable effort has been devoted to research on farming systems, agronomic practices, integrated pest management, and other �environment-friendly� technologies. But ultimately it is farmers who choose which technologies to adopt, and many farmers in developing countries � like those in developed countries � have found it profitable to use modern or high-yielding crop varieties with high responsiveness to chemical fertilizers.�
While these achievements of the Green Revolution are real and have helped to avoid widespread starvation and impede famines, especially in Asia (Serageldin 1999; Hossain et al. 2000; Khush 2001; Huang et al. 2002; IFPRI 2002; Conway 2003), agriculture is now called to address the new challenges posed by the changing perceptions of what the most pressing nutrition problems are (Underwood 2000). Figure 5 illustrates how biofortification, as an agricultural response to these challenges, fits into this context and may perpetuate the achievements of the Green Revolution. It also introduces genetic engineering as a further means to biofortify crops. This �special� case is discussed in the next section.
Figure 5. Biofortification as breeding objective for different breeding techniques Conventional breeding Genetic engineering Agronomic traits (yield, pest resistance, etc.)
Green Revolution (publicly and donor funded,
developed for developing countries)
First generation GM cropsa (profit driven, developed for
industrialised countries)
Consumer traits (nutrition, health)
Biofortification (publicly and donor funded)
Transgenic biofortificationb (publicly and donor funded, public-private partnerships)
Notes: a�GM� stands for �genetically modified�. bWhat I term �transgenic biofortification� is, of course, also biofor-tification. The term serves only to differentiate between the two breeding approaches that underlie the biofortifi-cation efforts described in this figure.
2.4 Micronutrient malnutrition and the �Gene Revolution�
2.4.1 Plant biotechnology and the Gene Revolution
Plant biotechnology, the application of genetic engineering in agriculture, is one of a growing number of applications in the field of biotechnology: genetic engineering is also used in medi-cine, by the pharmaceutical industry, for environmental applications and in aquaculture. Since this technology attracts attention and criticism far beyond the academic world, a more general
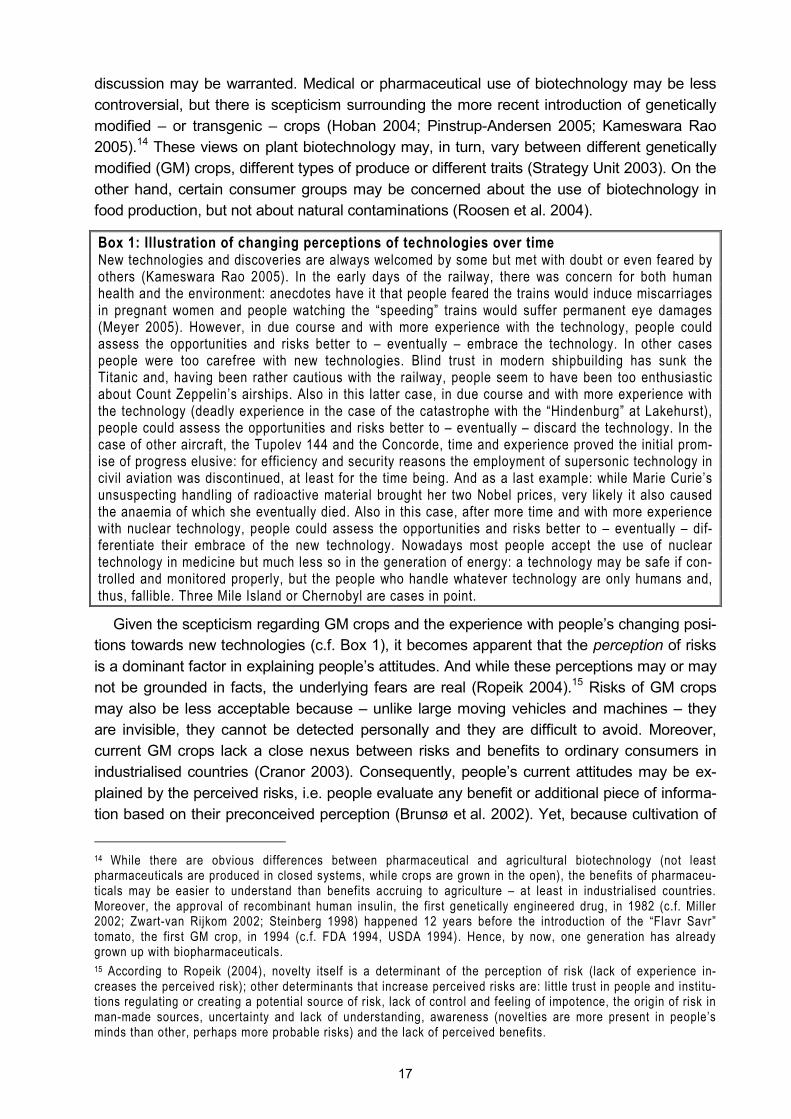
17
discussion may be warranted. Medical or pharmaceutical use of biotechnology may be less controversial, but there is scepticism surrounding the more recent introduction of genetically modified � or transgenic � crops (Hoban 2004; Pinstrup-Andersen 2005; Kameswara Rao 2005).14 These views on plant biotechnology may, in turn, vary between different genetically modified (GM) crops, different types of produce or different traits (Strategy Unit 2003). On the other hand, certain consumer groups may be concerned about the use of biotechnology in food production, but not about natural contaminations (Roosen et al. 2004).
Box 1: Illustration of changing perceptions of technologies over time New technologies and discoveries are always welcomed by some but met with doubt or even feared by others (Kameswara Rao 2005). In the early days of the railway, there was concern for both human health and the environment: anecdotes have it that people feared the trains would induce miscarriages in pregnant women and people watching the �speeding� trains would suffer permanent eye damages (Meyer 2005). However, in due course and with more experience with the technology, people could assess the opportunities and risks better to � eventually � embrace the technology. In other cases people were too carefree with new technologies. Blind trust in modern shipbuilding has sunk the Titanic and, having been rather cautious with the railway, people seem to have been too enthusiastic about Count Zeppelin�s airships. Also in this latter case, in due course and with more experience with the technology (deadly experience in the case of the catastrophe with the �Hindenburg� at Lakehurst), people could assess the opportunities and risks better to � eventually � discard the technology. In the case of other aircraft, the Tupolev 144 and the Concorde, time and experience proved the initial prom-ise of progress elusive: for efficiency and security reasons the employment of supersonic technology in civil aviation was discontinued, at least for the time being. And as a last example: while Marie Curie�s unsuspecting handling of radioactive material brought her two Nobel prices, very likely it also caused the anaemia of which she eventually died. Also in this case, after more time and with more experience with nuclear technology, people could assess the opportunities and risks better to � eventually � dif-ferentiate their embrace of the new technology. Nowadays most people accept the use of nuclear technology in medicine but much less so in the generation of energy: a technology may be safe if con-trolled and monitored properly, but the people who handle whatever technology are only humans and, thus, fallible. Three Mile Island or Chernobyl are cases in point.
Given the scepticism regarding GM crops and the experience with people�s changing posi-tions towards new technologies (c.f. Box 1), it becomes apparent that the perception of risks is a dominant factor in explaining people�s attitudes. And while these perceptions may or may not be grounded in facts, the underlying fears are real (Ropeik 2004).15 Risks of GM crops may also be less acceptable because � unlike large moving vehicles and machines � they are invisible, they cannot be detected personally and they are difficult to avoid. Moreover, current GM crops lack a close nexus between risks and benefits to ordinary consumers in industrialised countries (Cranor 2003). Consequently, people�s current attitudes may be ex-plained by the perceived risks, i.e. people evaluate any benefit or additional piece of informa-tion based on their preconceived perception (Brunsø et al. 2002). Yet, because cultivation of
14 While there are obvious differences between pharmaceutical and agricultural biotechnology (not least pharmaceuticals are produced in closed systems, while crops are grown in the open), the benefits of pharmaceu-ticals may be easier to understand than benefits accruing to agriculture � at least in industrialised countries. Moreover, the approval of recombinant human insulin, the first genetically engineered drug, in 1982 (c.f. Miller 2002; Zwart-van Rijkom 2002; Steinberg 1998) happened 12 years before the introduction of the �Flavr Savr� tomato, the first GM crop, in 1994 (c.f. FDA 1994, USDA 1994). Hence, by now, one generation has already grown up with biopharmaceuticals. 15 According to Ropeik (2004), novelty itself is a determinant of the perception of risk (lack of experience in-creases the perceived risk); other determinants that increase perceived risks are: litt le trust in people and institu-tions regulating or creating a potential source of risk, lack of control and feeling of impotence, the origin of risk in man-made sources, uncertainty and lack of understanding, awareness (novelties are more present in people�s minds than other, perhaps more probable risks) and the lack of perceived benefits.
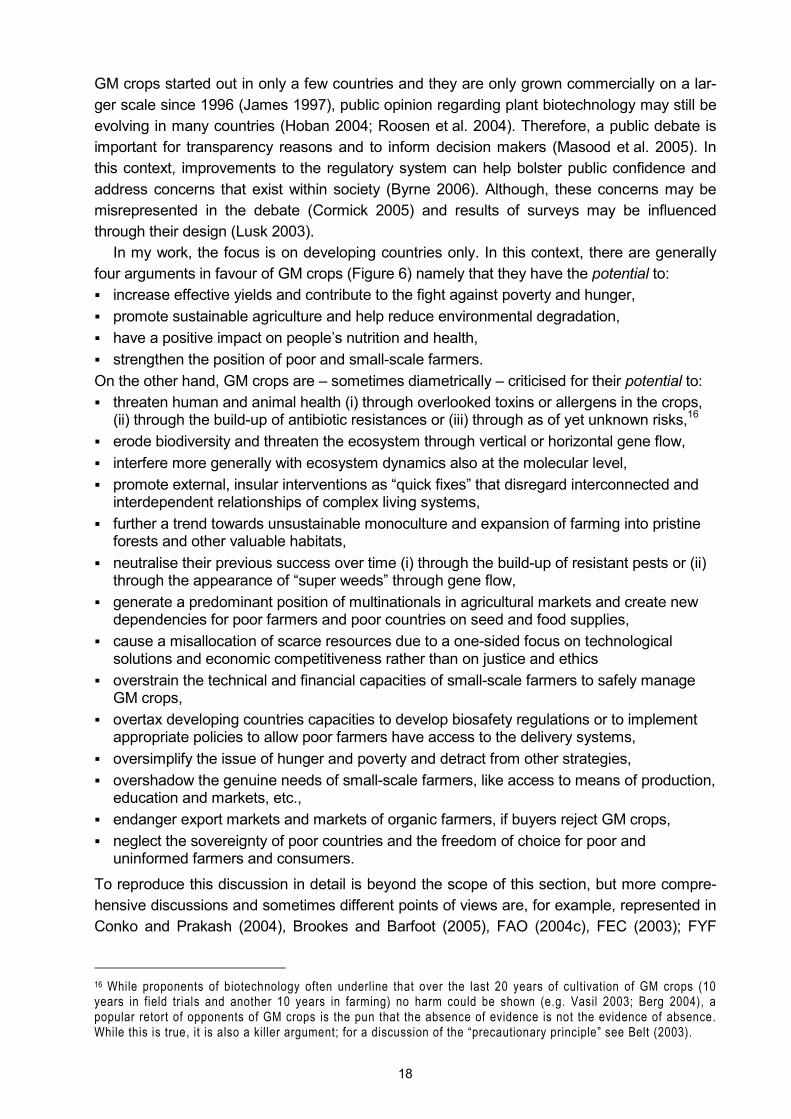
18
GM crops started out in only a few countries and they are only grown commercially on a lar-ger scale since 1996 (James 1997), public opinion regarding plant biotechnology may still be evolving in many countries (Hoban 2004; Roosen et al. 2004). Therefore, a public debate is important for transparency reasons and to inform decision makers (Masood et al. 2005). In this context, improvements to the regulatory system can help bolster public confidence and address concerns that exist within society (Byrne 2006). Although, these concerns may be misrepresented in the debate (Cormick 2005) and results of surveys may be influenced through their design (Lusk 2003).
In my work, the focus is on developing countries only. In this context, there are generally four arguments in favour of GM crops (Figure 6) namely that they have the potential to: ! increase effective yields and contribute to the fight against poverty and hunger, ! promote sustainable agriculture and help reduce environmental degradation, ! have a positive impact on people�s nutrition and health, ! strengthen the position of poor and small-scale farmers. On the other hand, GM crops are � sometimes diametrically � criticised for their potential to: ! threaten human and animal health (i) through overlooked toxins or allergens in the crops,
(ii) through the build-up of antibiotic resistances or (iii) through as of yet unknown risks,16 ! erode biodiversity and threaten the ecosystem through vertical or horizontal gene flow, ! interfere more generally with ecosystem dynamics also at the molecular level, ! promote external, insular interventions as �quick fixes� that disregard interconnected and
interdependent relationships of complex living systems, ! further a trend towards unsustainable monoculture and expansion of farming into pristine
forests and other valuable habitats, ! neutralise their previous success over time (i) through the build-up of resistant pests or (ii)
through the appearance of �super weeds� through gene flow, ! generate a predominant position of multinationals in agricultural markets and create new
dependencies for poor farmers and poor countries on seed and food supplies, ! cause a misallocation of scarce resources due to a one-sided focus on technological
solutions and economic competitiveness rather than on justice and ethics ! overstrain the technical and financial capacities of small-scale farmers to safely manage
GM crops, ! overtax developing countries capacities to develop biosafety regulations or to implement
appropriate policies to allow poor farmers have access to the delivery systems, ! oversimplify the issue of hunger and poverty and detract from other strategies, ! overshadow the genuine needs of small-scale farmers, like access to means of production,
education and markets, etc., ! endanger export markets and markets of organic farmers, if buyers reject GM crops, ! neglect the sovereignty of poor countries and the freedom of choice for poor and
uninformed farmers and consumers.
To reproduce this discussion in detail is beyond the scope of this section, but more compre-hensive discussions and sometimes different points of views are, for example, represented in Conko and Prakash (2004), Brookes and Barfoot (2005), FAO (2004c), FEC (2003); FYF
16 While proponents of biotechnology often underline that over the last 20 years of cultivation of GM crops (10 years in field trials and another 10 years in farming) no harm could be shown (e.g. Vasil 2003; Berg 2004), a popular retort of opponents of GM crops is the pun that the absence of evidence is not the evidence of absence. While this is true, it is also a killer argument; for a discussion of the �precautionary principle� see Belt (2003).
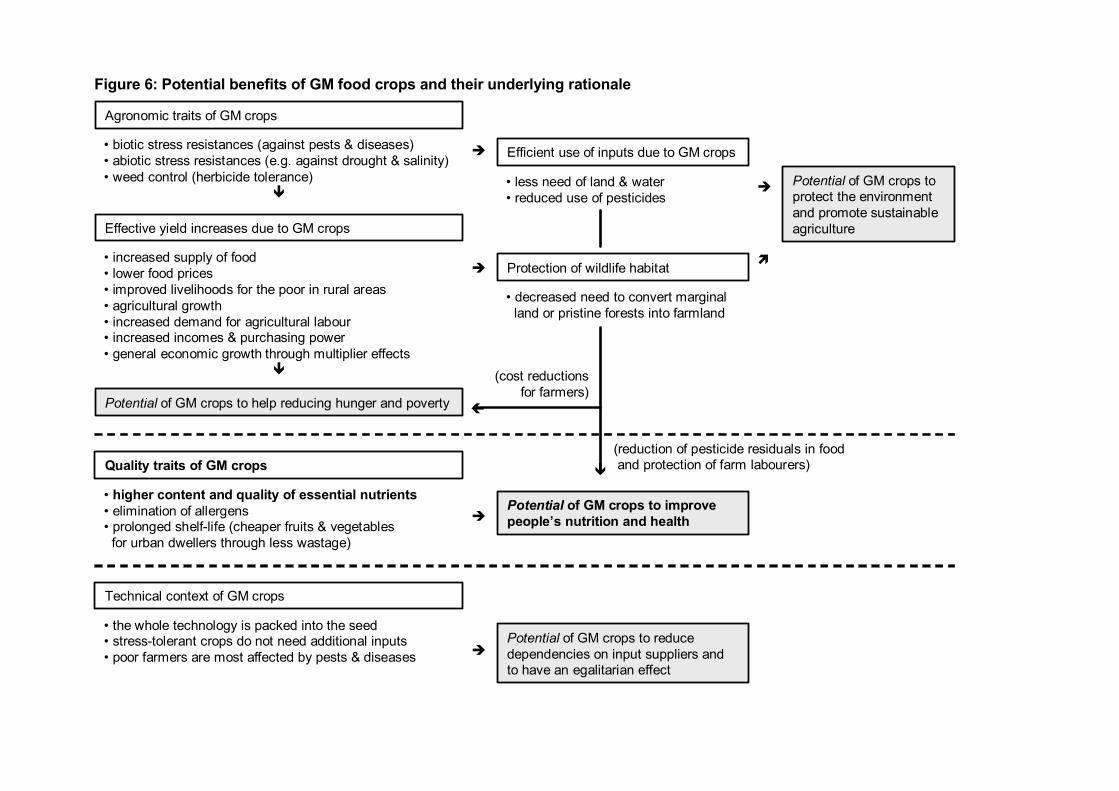
Figure 6: Potential benefits of GM food crops and their underlying rationale
Agronomic traits of GM crops
� biotic stress resistances (against pests & diseases)� abiotic stress resistances (e.g. against drought & salinity)� weed control (herbicide tolerance)
"
Effective yield increases due to GM crops
� increased supply of food� lower food prices� improved livelihoods for the poor in rural areas� agricultural growth� increased demand for agricultural labour � increased incomes & purchasing power� general economic growth through multiplier effects
"
Potential of GM crops to help reducing hunger and poverty
# Efficient use of inputs due to GM crops
� less need of land & water� reduced use of pesticides
# Protection of wildlife habitat
� decreased need to convert marginalland or pristine forests into farmland
# Potential of GM crops to protect the environment and promote sustainable agriculture
Quality traits of GM crops
� higher content and quality of essential nutrients� elimination of allergens � prolonged shelf-life (cheaper fruits & vegetables
for urban dwellers through less wastage)
#Potential of GM crops to improve people�s nutrition and health
Technical context of GM crops
� the whole technology is packed into the seed� stress-tolerant crops do not need additional inputs� poor farmers are most affected by pests & diseases #
Potential of GM crops to reduce dependencies on input suppliers and to have an egalitarian effect
$
%
(reduction of pesticide residuals in foodand protection of farm labourers)
(cost reductionsfor farmers)
"
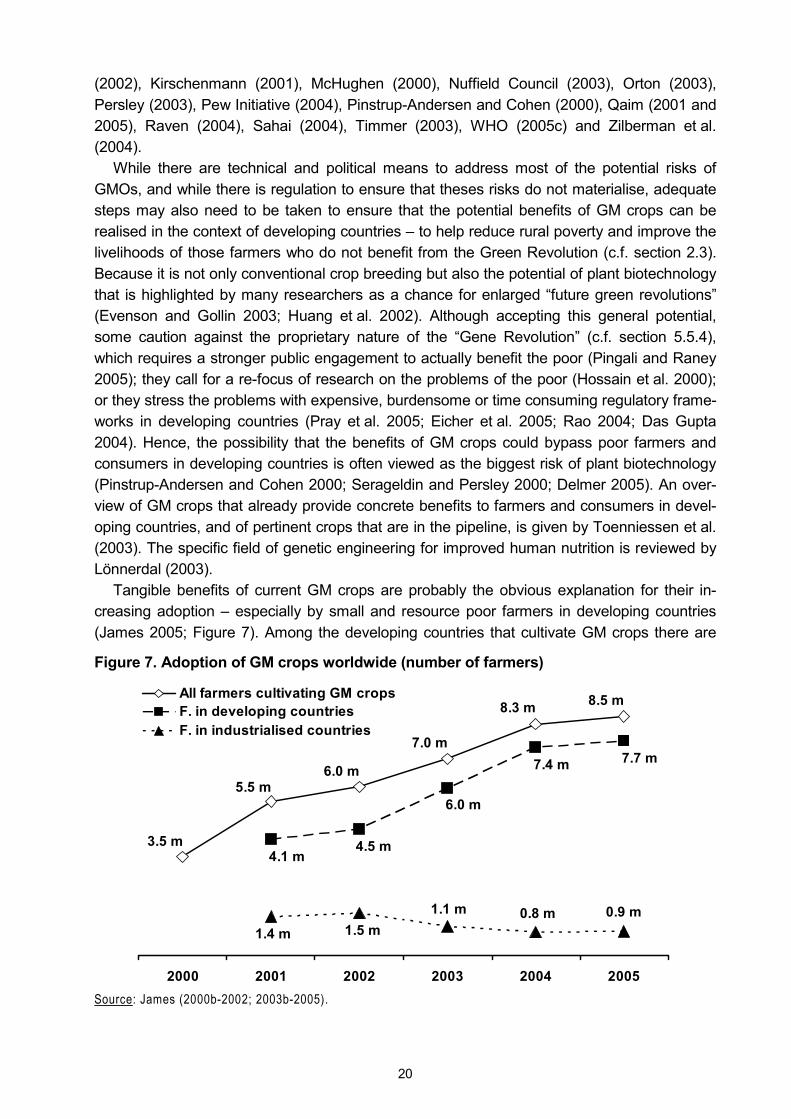
20
(2002), Kirschenmann (2001), McHughen (2000), Nuffield Council (2003), Orton (2003), Persley (2003), Pew Initiative (2004), Pinstrup-Andersen and Cohen (2000), Qaim (2001 and 2005), Raven (2004), Sahai (2004), Timmer (2003), WHO (2005c) and Zilberman et al. (2004).
While there are technical and political means to address most of the potential risks of GMOs, and while there is regulation to ensure that theses risks do not materialise, adequate steps may also need to be taken to ensure that the potential benefits of GM crops can be realised in the context of developing countries � to help reduce rural poverty and improve the livelihoods of those farmers who do not benefit from the Green Revolution (c.f. section 2.3). Because it is not only conventional crop breeding but also the potential of plant biotechnology that is highlighted by many researchers as a chance for enlarged �future green revolutions� (Evenson and Gollin 2003; Huang et al. 2002). Although accepting this general potential, some caution against the proprietary nature of the �Gene Revolution� (c.f. section 5.5.4), which requires a stronger public engagement to actually benefit the poor (Pingali and Raney 2005); they call for a re-focus of research on the problems of the poor (Hossain et al. 2000); or they stress the problems with expensive, burdensome or time consuming regulatory frame-works in developing countries (Pray et al. 2005; Eicher et al. 2005; Rao 2004; Das Gupta 2004). Hence, the possibility that the benefits of GM crops could bypass poor farmers and consumers in developing countries is often viewed as the biggest risk of plant biotechnology (Pinstrup-Andersen and Cohen 2000; Serageldin and Persley 2000; Delmer 2005). An over-view of GM crops that already provide concrete benefits to farmers and consumers in devel-oping countries, and of pertinent crops that are in the pipeline, is given by Toenniessen et al. (2003). The specific field of genetic engineering for improved human nutrition is reviewed by Lönnerdal (2003).
Tangible benefits of current GM crops are probably the obvious explanation for their in-creasing adoption � especially by small and resource poor farmers in developing countries (James 2005; Figure 7). Among the developing countries that cultivate GM crops there are
Figure 7. Adoption of GM crops worldwide (number of farmers)
8.5 m8.3 m
7.0 m
6.0 m5.5 m
3.5 m
7.7 m7.4 m
6.0 m
4.5 m4.1 m
0.9 m0.8 m1.1 m1.5 m1.4 m
2000 2001 2002 2003 2004 2005
All farmers cultivating GM cropsF. in developing countriesF. in industrialised countries
Source: James (2000b-2002; 2003b-2005).
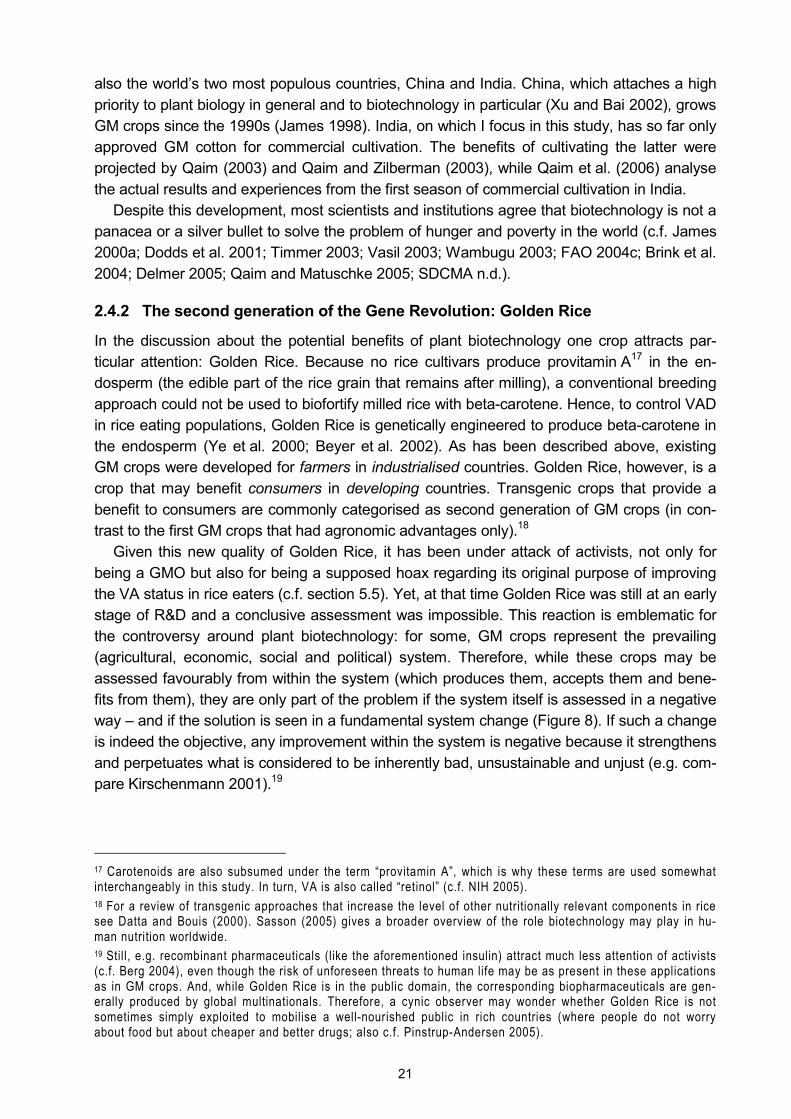
21
also the world�s two most populous countries, China and India. China, which attaches a high priority to plant biology in general and to biotechnology in particular (Xu and Bai 2002), grows GM crops since the 1990s (James 1998). India, on which I focus in this study, has so far only approved GM cotton for commercial cultivation. The benefits of cultivating the latter were projected by Qaim (2003) and Qaim and Zilberman (2003), while Qaim et al. (2006) analyse the actual results and experiences from the first season of commercial cultivation in India.
Despite this development, most scientists and institutions agree that biotechnology is not a panacea or a silver bullet to solve the problem of hunger and poverty in the world (c.f. James 2000a; Dodds et al. 2001; Timmer 2003; Vasil 2003; Wambugu 2003; FAO 2004c; Brink et al. 2004; Delmer 2005; Qaim and Matuschke 2005; SDCMA n.d.).
2.4.2 The second generation of the Gene Revolution: Golden Rice
In the discussion about the potential benefits of plant biotechnology one crop attracts par-ticular attention: Golden Rice. Because no rice cultivars produce provitamin A17 in the en-dosperm (the edible part of the rice grain that remains after milling), a conventional breeding approach could not be used to biofortify milled rice with beta-carotene. Hence, to control VAD in rice eating populations, Golden Rice is genetically engineered to produce beta-carotene in the endosperm (Ye et al. 2000; Beyer et al. 2002). As has been described above, existing GM crops were developed for farmers in industrialised countries. Golden Rice, however, is a crop that may benefit consumers in developing countries. Transgenic crops that provide a benefit to consumers are commonly categorised as second generation of GM crops (in con-trast to the first GM crops that had agronomic advantages only).18
Given this new quality of Golden Rice, it has been under attack of activists, not only for being a GMO but also for being a supposed hoax regarding its original purpose of improving the VA status in rice eaters (c.f. section 5.5). Yet, at that time Golden Rice was still at an early stage of R&D and a conclusive assessment was impossible. This reaction is emblematic for the controversy around plant biotechnology: for some, GM crops represent the prevailing (agricultural, economic, social and political) system. Therefore, while these crops may be assessed favourably from within the system (which produces them, accepts them and bene-fits from them), they are only part of the problem if the system itself is assessed in a negative way � and if the solution is seen in a fundamental system change (Figure 8). If such a change is indeed the objective, any improvement within the system is negative because it strengthens and perpetuates what is considered to be inherently bad, unsustainable and unjust (e.g. com-pare Kirschenmann 2001).19
17 Carotenoids are also subsumed under the term �provitamin A�, which is why these terms are used somewhat interchangeably in this study. In turn, VA is also called �retinol� (c.f. NIH 2005). 18 For a review of transgenic approaches that increase the level of other nutritionally relevant components in rice see Datta and Bouis (2000). Sasson (2005) gives a broader overview of the role biotechnology may play in hu-man nutrition worldwide. 19 Still, e.g. recombinant pharmaceuticals (like the aforementioned insulin) attract much less attention of activists (c.f. Berg 2004), even though the risk of unforeseen threats to human life may be as present in these applications as in GM crops. And, while Golden Rice is in the public domain, the corresponding biopharmaceuticals are gen-erally produced by global multinationals. Therefore, a cynic observer may wonder whether Golden Rice is not sometimes simply exploited to mobilise a well-nourished public in rich countries (where people do not worry about food but about cheaper and better drugs; also c.f. Pinstrup-Andersen 2005).

22
Figure 8. A possible dimension in the rejection of Golden Rice and other GM crops
rejected byPrevailing agricultural, economic,
social and political system
Proponents of fundamentally different
systems
Plant biotechnology
accepts benefits
In contrast to such fundamental reflections, scientific studies have indicated that Golden Rice can contribute � in a cost-effective manner � to the alleviation of VAD, save children�s eyesights and lives, provide considerable welfare gains and boost the productivity of unskilled workers (Dawe et al. 2002; Zimmermann and Qaim 2004, Anderson et al. 2004). In the meantime Golden Rice has been improved continuously: after initial transformations in Ja-ponica rice, elite Indica varieties were transformed (these varieties are predominantly con-sumed by populations where VAD is prevalent); to facilitate the future regulation of Golden Rice, antibiotic markers were abandoned for the transformation; and free licences were ob-tained from third parties for patents that were used to develop Golden Rice (Hoa et al. 2003). Further research has resulted in another success when the beta-carotene level in new lines of Golden Rice (the second generation) could be increased up to 20 times compared to the level in the first lines (Paine et al. 2005). Hence, the basis for assessing Golden Rice has changed substantially over the last couple of years. Moreover, germplasm of Golden Rice has already been transferred to India, where its country-specific adaptation to a selection of local rice varieties is taking place (Barry 2005; Singh 2005; Dubock 2005b) � and where attitudes to-wards GM crops tend to be more positive than in other countries (Hoban 2004).
2.5 Micronutrient malnutrition and why to bother
So far in this chapter I have described the situation regarding micronutrient malnutrition, the interventions that are available to control the respective micronutrient deficiencies and related technological developments. In this section I present reasons why measures have to be taken to address micronutrient malnutrition � beyond the perhaps obvious moral reasons in the face of (hidden) hunger and ill health. The following sub-section provides an economic rationale for controlling micronutrient deficiencies, then some limitations of economic concepts are dis-cussed and, finally, the legal background that forms the basis for an obligation to help those suffering from hunger and micronutrient malnutrition is lined out.
2.5.1 Micronutrient malnutrition and its economic dimension
Malnutrition traps: Are the poor hungry or are the hungry poor? The first notion when thinking about poverty and hunger is most likely that the poor are hun-gry because they are poor, i.e. because they lack the economic means to buy proper food. (Or, following Sen (1981), they lack entitlements to sufficient food, i.e. the failure of entitle-ments is the cause of hunger.) On a second thought, one may ponder the possibility that the
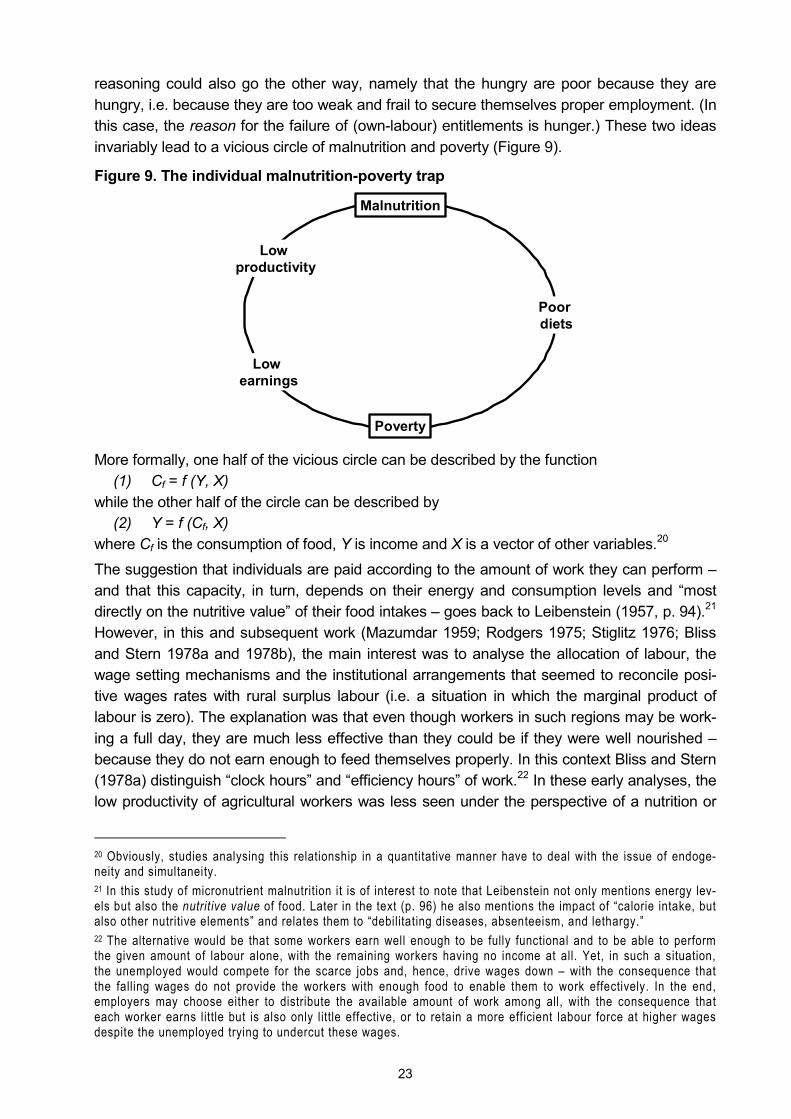
23
reasoning could also go the other way, namely that the hungry are poor because they are hungry, i.e. because they are too weak and frail to secure themselves proper employment. (In this case, the reason for the failure of (own-labour) entitlements is hunger.) These two ideas invariably lead to a vicious circle of malnutrition and poverty (Figure 9).
Figure 9. The individual malnutrition-poverty trap
More formally, one half of the vicious circle can be described by the function (1) Cf = f (Y, X)
while the other half of the circle can be described by (2) Y = f (Cf, X)
where Cf is the consumption of food, Y is income and X is a vector of other variables.20 The suggestion that individuals are paid according to the amount of work they can perform � and that this capacity, in turn, depends on their energy and consumption levels and �most directly on the nutritive value� of their food intakes � goes back to Leibenstein (1957, p. 94).21 However, in this and subsequent work (Mazumdar 1959; Rodgers 1975; Stiglitz 1976; Bliss and Stern 1978a and 1978b), the main interest was to analyse the allocation of labour, the wage setting mechanisms and the institutional arrangements that seemed to reconcile posi-tive wages rates with rural surplus labour (i.e. a situation in which the marginal product of labour is zero). The explanation was that even though workers in such regions may be work-ing a full day, they are much less effective than they could be if they were well nourished � because they do not earn enough to feed themselves properly. In this context Bliss and Stern (1978a) distinguish �clock hours� and �efficiency hours� of work.22 In these early analyses, the low productivity of agricultural workers was less seen under the perspective of a nutrition or
20 Obviously, studies analysing this relationship in a quantitative manner have to deal with the issue of endoge-neity and simultaneity. 21 In this study of micronutrient malnutrition it is of interest to note that Leibenstein not only mentions energy lev-els but also the nutritive value of food. Later in the text (p. 96) he also mentions the impact of �calorie intake, but also other nutritive elements� and relates them to �debilitating diseases, absenteeism, and lethargy.� 22 The alternative would be that some workers earn well enough to be fully functional and to be able to perform the given amount of labour alone, with the remaining workers having no income at all. Yet, in such a situation, the unemployed would compete for the scarce jobs and, hence, drive wages down � with the consequence that the falling wages do not provide the workers with enough food to enable them to work effectively. In the end, employers may choose either to distribute the available amount of work among all, with the consequence that each worker earns little but is also only little effective, or to retain a more efficient labour force at higher wages despite the unemployed trying to undercut these wages.
Poverty
Poor diets
Malnutrition
Low productivity
Low earnings
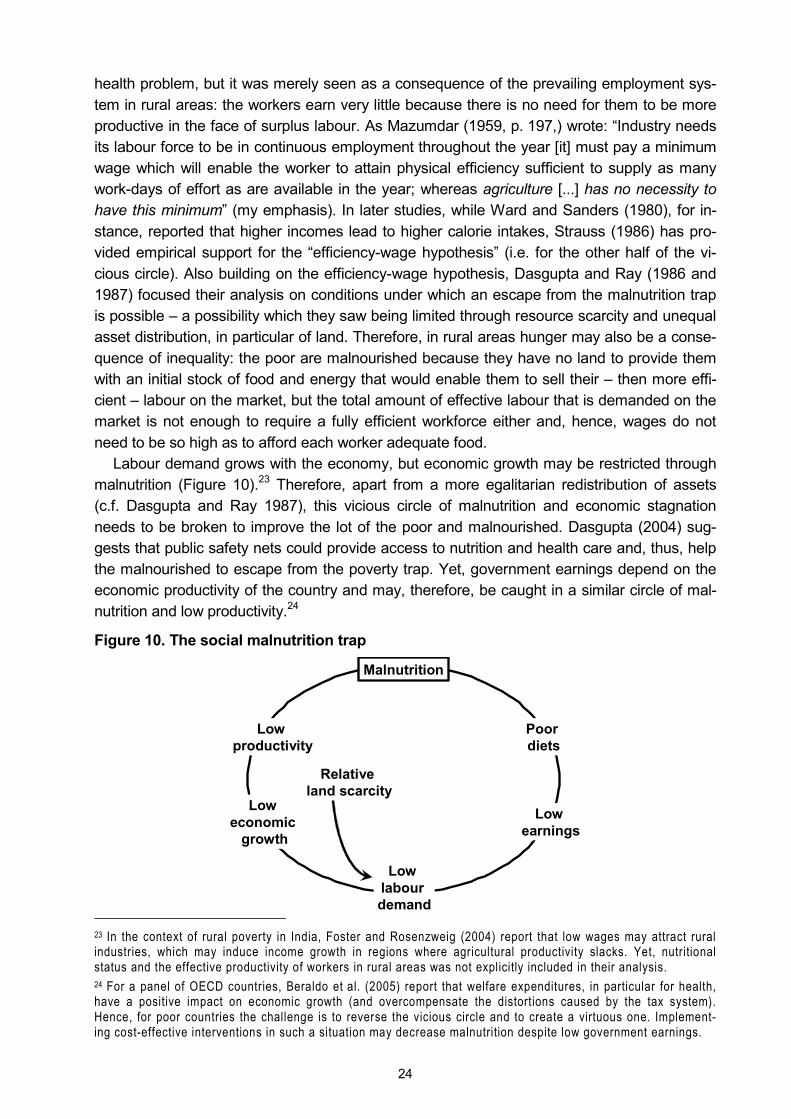
24
health problem, but it was merely seen as a consequence of the prevailing employment sys-tem in rural areas: the workers earn very little because there is no need for them to be more productive in the face of surplus labour. As Mazumdar (1959, p. 197,) wrote: �Industry needs its labour force to be in continuous employment throughout the year [it] must pay a minimum wage which will enable the worker to attain physical efficiency sufficient to supply as many work-days of effort as are available in the year; whereas agriculture [...] has no necessity to have this minimum� (my emphasis). In later studies, while Ward and Sanders (1980), for in-stance, reported that higher incomes lead to higher calorie intakes, Strauss (1986) has pro-vided empirical support for the �efficiency-wage hypothesis� (i.e. for the other half of the vi-cious circle). Also building on the efficiency-wage hypothesis, Dasgupta and Ray (1986 and 1987) focused their analysis on conditions under which an escape from the malnutrition trap is possible � a possibility which they saw being limited through resource scarcity and unequal asset distribution, in particular of land. Therefore, in rural areas hunger may also be a conse-quence of inequality: the poor are malnourished because they have no land to provide them with an initial stock of food and energy that would enable them to sell their � then more effi-cient � labour on the market, but the total amount of effective labour that is demanded on the market is not enough to require a fully efficient workforce either and, hence, wages do not need to be so high as to afford each worker adequate food.
Labour demand grows with the economy, but economic growth may be restricted through malnutrition (Figure 10).23 Therefore, apart from a more egalitarian redistribution of assets (c.f. Dasgupta and Ray 1987), this vicious circle of malnutrition and economic stagnation needs to be broken to improve the lot of the poor and malnourished. Dasgupta (2004) sug-gests that public safety nets could provide access to nutrition and health care and, thus, help the malnourished to escape from the poverty trap. Yet, government earnings depend on the economic productivity of the country and may, therefore, be caught in a similar circle of mal-nutrition and low productivity.24
Figure 10. The social malnutrition trap
23 In the context of rural poverty in India, Foster and Rosenzweig (2004) report that low wages may attract rural industries, which may induce income growth in regions where agricultural productivity slacks. Yet, nutritional status and the effective productivity of workers in rural areas was not explicitly included in their analysis. 24 For a panel of OECD countries, Beraldo et al. (2005) report that welfare expenditures, in particular for health, have a positive impact on economic growth (and overcompensate the distortions caused by the tax system). Hence, for poor countries the challenge is to reverse the vicious circle and to create a virtuous one. Implement-ing cost-effective interventions in such a situation may decrease malnutrition despite low government earnings.
Malnutrition
Low productivity
Low economic
growth
Low labour demand
Low earnings
Poor diets
Relative land scarcity
25
Another dimension of the malnutrition trap is the negative impact of malnutrition on educa-tion and human capital formation (Demment et al. 2003; Hunt 2002; ACC/SCN 2000; Miller Del Rosso 1999). This long-term effect also shows how the vicious circle of malnutrition can perpetuate into the future. A similar mechanism is at work when children of malnourished mothers are themselves smaller and more prone to suffer from diseases later on in life, which makes them less productive... (Fogel 2004a; Horton 1999). Related vicious circles are also discussed by the World Bank (2006).
The potential impact of malnutrition on productivity and economic growth Having described potential malnutrition traps in general, here I look at the impact of malnutri-tion on productivity and economic growth. In the literature the impact of micronutrient malnu-trition � especially IDA � on productivity has been measured using different methods (inter-vention studies, regression analyses), at different levels (society, individuals) and over differ-ent time horizons (short-term, inter-generational). Intervention studies to ascertain the nega-tive impact of ID and anaemia (and the positive impact of iron supplementation) on work ca-pacity and physical performance of individuals were not only carried out with the often quoted rubber tappers (Basta et al. 1979) and tea pickers (Husaini et al. 1981), but in numerous other settings (Davies et al. 1973; Davies and Haaren 1973; Viteri and Torun 1974; Gardner et al. 1977; Wolgemuth et al. 1982; Vijayalakshmi et al. 1987; Rowland et al. 1988). A more comprehensive overview is given by Haas and Brownlie (2001). Using wages as a proxy for productivity, regression analyses were used to establish the negative impact of stunting on productivity (Haddad and Bouis 1991; Alderman et al. 1996) and of insufficient iron intakes on productivity (Weinberger 2003).
Beyond such direct productivity losses through the poor physical condition of those affect-ed by malnutrition, economic losses occur also due to increased health care costs and, in particular, through reduced cognitive capacities and deficits in schooling (World Bank 2006; FAO 2004a; Behrman et al. 2004; Hunt 2002; WHO 2001a). The literature on the nutrition-productivity link at the level of the economy has been reviewed by Strauss and Thomas (1998) and Broca and Stamoulis (2003), who affirm that better nutrition and health has a positive impact on economic growth. More recently, the negative impact of malnutrition on overall economic growth has been estimated by Arcand (2001) and Wang and Taniguchi (2003). In as far as malnutrition affects adult mortality, Lorentzen et al. (2005) show that this has a negative impact on overall productivity, too. And in a historic analysis Fogel (2004b) found that 30 percent of the growth in British per capita income over the last two centuries was due to better nutrition.25 Other authors directly estimated the loss of national income through micronutrient malnutrition � for different combinations of micronutrient deficiencies and for developing countries in general or for India in particular (c.f. section 5.4).26
25 In his study Fogel (2004b) also mentions iodine, iron and folate, and he relates dietary diversity and dietary supplements to micronutrient status. But, because his historic analysis does not allow for a more disaggregated analysis, the quoted impact covers the impact a better food supply in general. 26 Obviously, the main interest here is the impact of malnutrition on economic growth and general welfare. This is not to say that other issues � like health in general, education, infrastructures, markets, political stability, good governance, the rule of law, monetary stability, liquidity constraints, etc. � may not have an important role to play for economic development and overall well-being. Quite to the contrary, these other factors may still impose lim-its on development, even if the problem of malnutrition is addressed.
26
The potential impact of higher incomes on micronutrient malnutrition Above I highlighted studies showing that better nutrition increases productivity � and that micronutrient malnutrition reduces economic growth. Given the previously described poverty traps, a related question is to what extent higher incomes reduce micronutrient malnutrition? With higher incomes people can afford to purchase more and better food, i.e. rising incomes should lead to improved nutritional status. Yet, micronutrient malnutrition is termed �hidden hunger� for a reason, namely that people are often unaware of a lack of essential nutrients in their diets; the micronutrient content in food is by and large an unnoticeable attribute (World Bank 2006). Hence, because people do not perceive the potential benefits of changing their food consumption patterns, it is by no means guaranteed that they use higher incomes to improve their overall nutritional status (beyond filling their stomachs when they feel hungry). Studies indicate that even the income elasticity of calorie intake may be low (Wolfe and Behrman 1983; Behrman and Deolalikar 1989 and 1990; Subramanian 2001), although the interpretation of these results may differ (c.f. Ravallion 1990). In the case of micronutrients, income elasticities are even less predictable and may be both high and low, depending on whether the principal source of the micronutrient is staple food or more expensive or seasonal food (Bouis and Novenario-Reese 1997; Abdulai and Aubert 2004). Because the utility people derive from food is not influenced by any explicit preference for micronutrients, the resulting consumption of micronutrients is incidental, i.e. it depends on whether the food people prefer happens to be rich in micronutrients or not. This general food preference, in turn, may be dominated by non-nutritive attributes like appearance, taste, odour, diversity or the status value of the food (Behrman and Deolalikar 1987, 1989 and 1990).27
Limits of the concept of productivity and economic growth In the preceding sub-sections it was shown that malnutrition and economic productivity influ-ence each other � but that relying on the market or rising incomes alone may not be sufficient to address the issue of micronutrient malnutrition. It was also pointed out that economic growth is but one determinant of malnutrition. Similarly, the potential benefits of controlling micronutrient deficiencies extend beyond the economic sphere and may contribute to human development in a more comprehensive manner.
The limits of using national per capita income as indicator for the development of a country have long been recognised and, therefore, in 1990, the United Nations Development Pro-gramme (UNDP) has developed the �Human Development Index� that captures basic aspects of human development, namely (i) longevity, (ii) knowledge and (iii) a decent standard of living (UNDP 2005).28 By reducing morbidity and mortality, micronutrient interventions are liable to increase longevity; by reducing morbidity and enhancing mental development, they
27 Apart from the impact of household income on micronutrient consumption, this consumption may also be deter-mined by various other household characteristics (Wolfe and Behrman 1983; Bouis and Novenario-Reese 1997; Abdulai and Aubert 2004). Hence, this consumption can be explained more formally as:
Cmn = f (I, P, F, H, R) where Cmn is the consumption of micronutrients, I is household income, P are food prices, F are food characteristics, H are household characteristics and R are regional determinants.
In an analysis of determinants of iron consumption � based on household survey data from a Living Standard Measurement Study (LSMS) in Nicaragua � I found that household income, household size, dietary diversity, the price of iron-rich staple crops, receipt of iron-rich food in kind, the social background of the wife, involvement of the household in agricultural activities and the region are all significant (Stein 2003). 28 A perhaps more intuitive version of this reasoning, which complements the concept of Gross National Income, is Bhutan�s �Gross National Happiness� (c.f. Thinley 1998; Priesner 1999; Tashi Phuntshi et al. 1999).
27
are likely to improve schooling and by breaking the vicious circles of micronutrient malnutri-tion and low productivity, they may raise standards of living.
More recently, the multiple dimensions that contribute to human development and well-being have also been underlined in the �Millennium Development Goals� of the United Na-tions (UN 2000) that are expressed in the intent of the heads of state and government to
1. halve extreme poverty and hunger, 2. achieve universal primary education, 3. achieve gender equality, 4. reduce child mortality by two-thirds, 5. reduce maternal mortality by three quarter, 6. reverse the spread of major diseases, 7. ensure environmental sustainability and 8. create a global partnership for development.
Controlling micronutrient deficiencies may � to some extent � contribute to the fulfilment of the first six of these eight goals. (The least obvious relation exists perhaps between gender equality and micronutrient malnutrition. But apart from children, it is usually adolescent girls and women of reproductive age who suffer most from the consequences of micronutrient malnutrition.) In these goals the concept of productivity is only implicit, i.e. productivity is not an end but a means to achieving the other, fundamental ends.
2.5.2 Micronutrient malnutrition and human rights
In the previous sub-section I drew attention to the potential impact of micronutrient malnutri-tion on overall economic and human development, which represents an important motivation to control micronutrient deficiencies. Yet, fighting �hidden hunger� is an end in itself � not only because of a moral or philanthropic impetus to help those in need, but also because of con-crete legal obligations. As Scherr (2003, p. 42) writes in a background paper of the Millen-nium Project Task Force �tackling hunger is not about charity or food aid, but about fulfilling obligations to protect and promote rights to adequate and safe food.� Such a right to food can be deducted from the Universal Declaration of Human Rights (OHCHR 1948), the Interna-tional Covenant on Economic, Social and Cultural Rights (OHCHR 1966), the Convention on the Elimination of All Forms of Discrimination against Women (OHCHR 1979) and the Con-vention on the Rights of the Child (OHCHR 1989). Moreover, the right to food has been fur-ther elaborated by the Committee on Economic, Social and Cultural Rights (OHCHR 1999) and underlined in political pledges like the World Food Summit Plan of Action (FAO 1996), the United Nations Millennium Declaration (UN 2000) or more recently �The Right to Food Resolution� of the General Assembly of the United Nations (UN 2003).
While the Universal Declaration of Human Rights (Art. 25) states more generally that �eve-ryone has the right to a standard of living adequate for the health and well-being of himself and of his family, including food,� the Right to Food Resolution explicitly affirms �the right of everyone to have access to safe and nutritious food, consistent with the right to adequate food and the fundamental right of everyone to be free from hunger so as to be able fully to develop and maintain their physical and mental capacities� (UN 2003, point 2, my emphasis). As far as micronutrient malnutrition is a consequence of inadequate and little nutritious food that results in physical and mental impairments or even death (c.f. section 3.2.1), the realisa-tion of the right to food requires the adoption of appropriate economic, environmental and social policies to control micronutrient deficiencies, both at the national and international level
28
(c.f. Robinson 1999). Because the right to food is a positive right, it obliges government to take active steps for its fulfilment (Ziegler and Way 2001).
In India, the Supreme Court has affirmed the State and Union Governments� obligation to provide for people who are unable to feed themselves adequately. In particular, the Court has ruled that beneficiaries of the official food security programmes enjoy legal entitlements to the programmes and that these have to be implemented effectively (Jaishankar and Drèze 2005; UN-SCN 2004; OHCHR 2004; OHCHR 2003). In this ruling the Supreme Court interpreted the right to food to include the obligation of the state not only to respect, protect and facilitate the right to food (which are the primary, secondary and tertiary levels of the state�s obligations in the framework of the International Covenant on Economic, Social and Cultural Rights (OHCR 1966), respectively), but also to fulfil this right (Eide 1998; Eide and Kracht 1999; OHCR 1999; Ziegler and Way 2001; FAO 2005b).
29
3 Methods and data
In agricultural economics the usual approach to evaluate new technologies or investments in agricultural research is to quantify the economic benefits arising from yield increases (or the cost reductions resulting from lower input requirements) that follow the adoption of the tech-nology. Any such change in agricultural production causes a shift in the supply curve of the produce concerned and, from this, changes in the producer and consumer surplus can be calculated. The overall economic impact of the technology is the aggregated net surplus and, if juxtaposed to research costs, economic indicators like the net present value or the internal rate of return can be determined. However, this economic surplus approach relies on a change in agricultural productivity and on the related shift in the supply curve. While in section 2.2.3 I described that biofortification may be compatible with higher yields, this is not the main focus. Above all, biofortification is intended to improve the nutritional status of consumers of the biofortified crops, i.e. it introduces a consumer trait into the crops and not an agronomic trait (c.f. Figure 5). Hence, a shift in the demand curve could come about � if consumers were aware of the nutritional benefits of the crops and could afford to pay a higher price (which results from an increase in demand). In such a situation it would still be possible to calculate the change in producer and consumer surplus and proceed as described above. Yet, one reason of micronutrient malnutrition is lack of nutritional awareness (c.f. section 2.2.1) and another is lack of entitlements to adequate food (c.f. section 2.5.1).
Relying on market mechanisms in such a context is of little avail. Instead of capturing the productivity effect, it is necessary to quantify the health impact of the biofortified crops: this is the purpose of biofortification, to improve human health and well-being by reducing the bur-den of disease caused by micronutrient malnutrition. To analyse and compare the effect of different biofortified crops it is necessary to quantify their health impact in a consistent man-ner. Once the different health outcomes of a micronutrient deficiency are measured in a sin-gle index, the health loss in the status quo can be determined as well as any health gain through an intervention.29
3.1 The disability-adjusted life years framework
�Quantification requires a unit of measure.� (C.J.L. Murray)
To address the issue of how to measure �health�, the World Bank (1993) introduced the con-cept of �disability-adjusted life years� or DALYs. In recent years, DALYs have become in-creasingly popular through the Global Burden of Disease (GBD) project and the seminal book by Murray and Lopez (1996a), which were supported by the World Health Organization (WHO) and the World Bank. DALYs have been used by other international organisations (FAO 2004a; UN-SCN 2004; WHO 2001a and 2002), for studying health in the context of developing countries more specifically (Gwatkin 1999) and in other, very different analyses � e.g. of the global incidence of civil war (Collier and Hoeffler 2004) or poor water and sanitation 29 While in section 2.5.1 the relevance of malnutrition for economic productivity, for human capital formation and for physiological development are discussed, potential positive ramifications of biofortification in these regards are only captured implicitly if the analysis focuses on health alone. To quantify economy-wide and interrelated effects, multisectoral or general equilibrium models would be necessary. However, anticipating the linkages in the economy in an ex ante analysis over longer periods is difficult and a more global model would also necessitate a higher level of aggregation at each level (c.f. Qaim and von Braun 1998). By explicitly focusing on the health impact of biofortification, its overall effect on the economy may be underestimated. Later in this chapter possible approximations will be discussed.
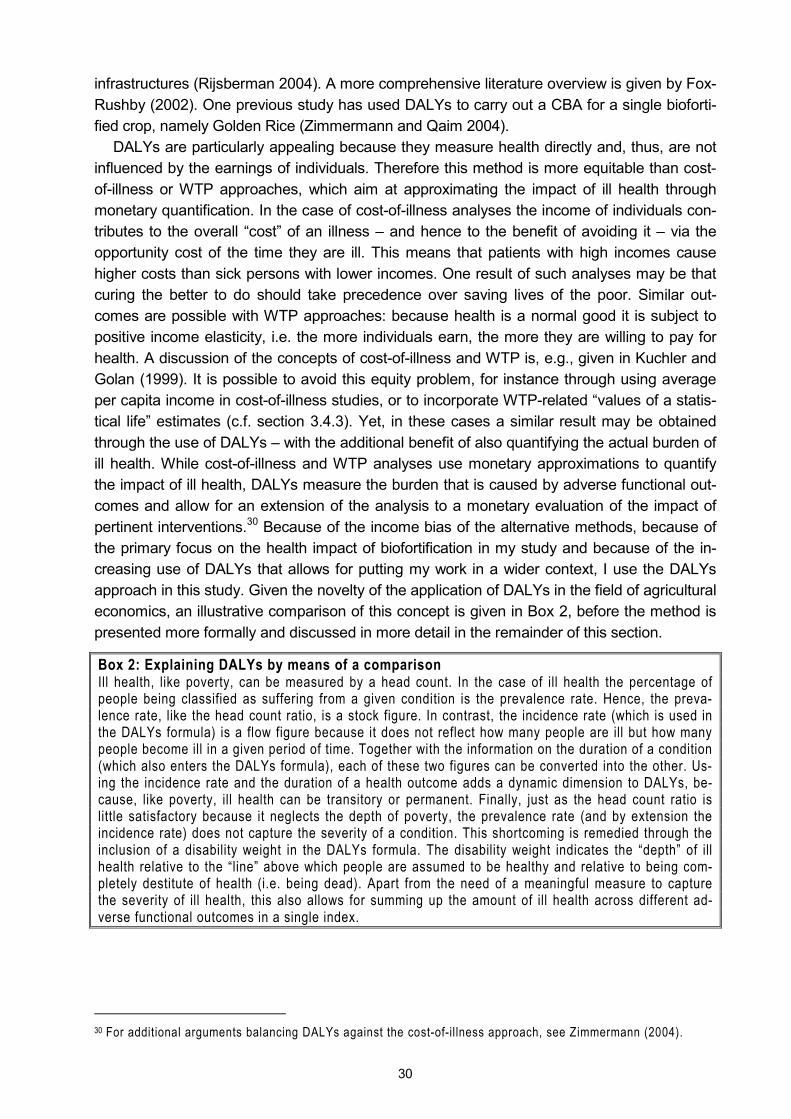
30
infrastructures (Rijsberman 2004). A more comprehensive literature overview is given by Fox-Rushby (2002). One previous study has used DALYs to carry out a CBA for a single bioforti-fied crop, namely Golden Rice (Zimmermann and Qaim 2004).
DALYs are particularly appealing because they measure health directly and, thus, are not influenced by the earnings of individuals. Therefore this method is more equitable than cost-of-illness or WTP approaches, which aim at approximating the impact of ill health through monetary quantification. In the case of cost-of-illness analyses the income of individuals con-tributes to the overall �cost� of an illness � and hence to the benefit of avoiding it � via the opportunity cost of the time they are ill. This means that patients with high incomes cause higher costs than sick persons with lower incomes. One result of such analyses may be that curing the better to do should take precedence over saving lives of the poor. Similar out-comes are possible with WTP approaches: because health is a normal good it is subject to positive income elasticity, i.e. the more individuals earn, the more they are willing to pay for health. A discussion of the concepts of cost-of-illness and WTP is, e.g., given in Kuchler and Golan (1999). It is possible to avoid this equity problem, for instance through using average per capita income in cost-of-illness studies, or to incorporate WTP-related �values of a statis-tical life� estimates (c.f. section 3.4.3). Yet, in these cases a similar result may be obtained through the use of DALYs � with the additional benefit of also quantifying the actual burden of ill health. While cost-of-illness and WTP analyses use monetary approximations to quantify the impact of ill health, DALYs measure the burden that is caused by adverse functional out-comes and allow for an extension of the analysis to a monetary evaluation of the impact of pertinent interventions.30 Because of the income bias of the alternative methods, because of the primary focus on the health impact of biofortification in my study and because of the in-creasing use of DALYs that allows for putting my work in a wider context, I use the DALYs approach in this study. Given the novelty of the application of DALYs in the field of agricultural economics, an illustrative comparison of this concept is given in Box 2, before the method is presented more formally and discussed in more detail in the remainder of this section.
Box 2: Explaining DALYs by means of a comparison Ill health, like poverty, can be measured by a head count. In the case of ill health the percentage of people being classified as suffering from a given condition is the prevalence rate. Hence, the preva-lence rate, like the head count ratio, is a stock figure. In contrast, the incidence rate (which is used in the DALYs formula) is a flow figure because it does not reflect how many people are ill but how many people become ill in a given period of time. Together with the information on the duration of a condition (which also enters the DALYs formula), each of these two figures can be converted into the other. Us-ing the incidence rate and the duration of a health outcome adds a dynamic dimension to DALYs, be-cause, like poverty, ill health can be transitory or permanent. Finally, just as the head count ratio is little satisfactory because it neglects the depth of poverty, the prevalence rate (and by extension the incidence rate) does not capture the severity of a condition. This shortcoming is remedied through the inclusion of a disability weight in the DALYs formula. The disability weight indicates the �depth� of ill health relative to the �line� above which people are assumed to be healthy and relative to being com-pletely destitute of health (i.e. being dead). Apart from the need of a meaningful measure to capture the severity of ill health, this also allows for summing up the amount of ill health across different ad-verse functional outcomes in a single index.
30 For additional arguments balancing DALYs against the cost-of-il lness approach, see Zimmermann (2004).
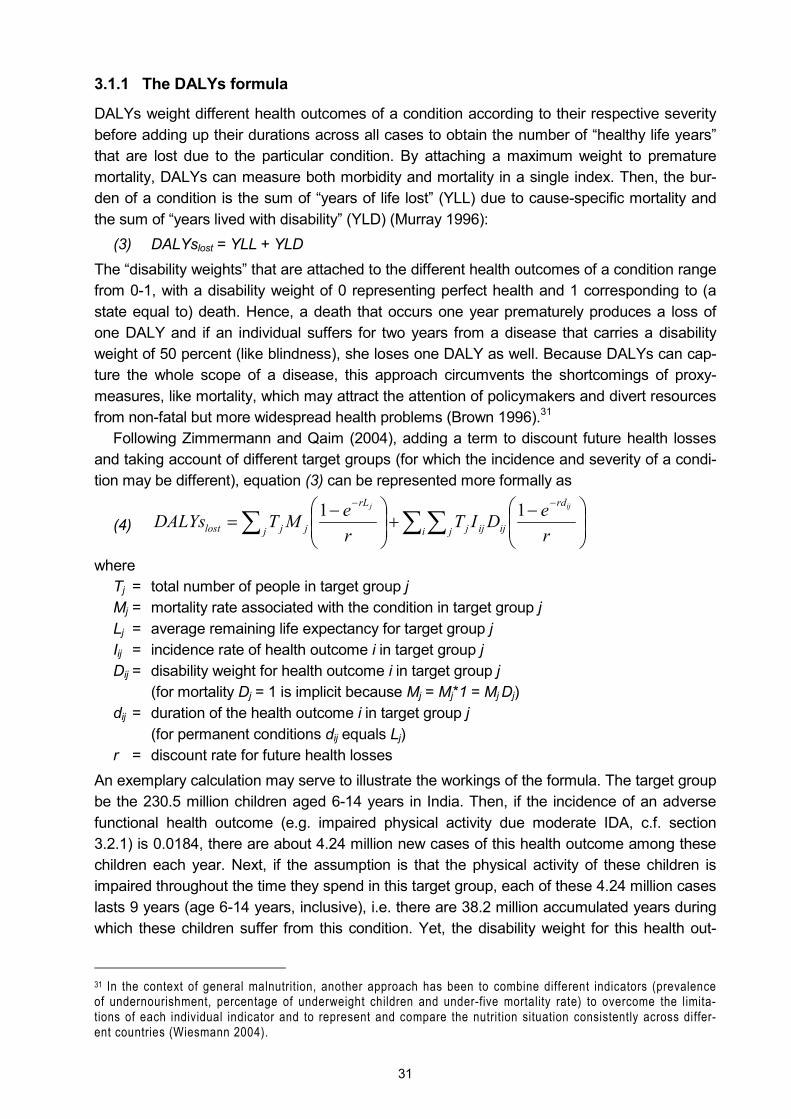
31
3.1.1 The DALYs formula
DALYs weight different health outcomes of a condition according to their respective severity before adding up their durations across all cases to obtain the number of �healthy life years� that are lost due to the particular condition. By attaching a maximum weight to premature mortality, DALYs can measure both morbidity and mortality in a single index. Then, the bur-den of a condition is the sum of �years of life lost� (YLL) due to cause-specific mortality and the sum of �years lived with disability� (YLD) (Murray 1996):
(3) DALYslost = YLL + YLD The �disability weights� that are attached to the different health outcomes of a condition range from 0-1, with a disability weight of 0 representing perfect health and 1 corresponding to (a state equal to) death. Hence, a death that occurs one year prematurely produces a loss of one DALY and if an individual suffers for two years from a disease that carries a disability weight of 50 percent (like blindness), she loses one DALY as well. Because DALYs can cap-ture the whole scope of a disease, this approach circumvents the shortcomings of proxy-measures, like mortality, which may attract the attention of policymakers and divert resources from non-fatal but more widespread health problems (Brown 1996).31
Following Zimmermann and Qaim (2004), adding a term to discount future health losses and taking account of different target groups (for which the incidence and severity of a condi-tion may be different), equation (3) can be represented more formally as
(4) ∑ ∑∑
−+
−=
−−
j i j
rd
ijijj
rL
jjlost reDIT
reMTDALYs
ijj 11
where Tj = total number of people in target group j Mj = mortality rate associated with the condition in target group j Lj = average remaining life expectancy for target group j Iij = incidence rate of health outcome i in target group j Dij = disability weight for health outcome i in target group j (for mortality Dj = 1 is implicit because Mj = Mj*1 = Mj Dj) dij = duration of the health outcome i in target group j (for permanent conditions dij equals Lj) r = discount rate for future health losses
An exemplary calculation may serve to illustrate the workings of the formula. The target group be the 230.5 million children aged 6-14 years in India. Then, if the incidence of an adverse functional health outcome (e.g. impaired physical activity due moderate IDA, c.f. section 3.2.1) is 0.0184, there are about 4.24 million new cases of this health outcome among these children each year. Next, if the assumption is that the physical activity of these children is impaired throughout the time they spend in this target group, each of these 4.24 million cases lasts 9 years (age 6-14 years, inclusive), i.e. there are 38.2 million accumulated years during which these children suffer from this condition. Yet, the disability weight for this health out-
31 In the context of general malnutrition, another approach has been to combine different indicators (prevalence of undernourishment, percentage of underweight children and under-five mortality rate) to overcome the limita-tions of each individual indicator and to represent and compare the nutrition situation consistently across differ-ent countries (Wiesmann 2004).
32
come is �only� 0.011 (section 3.2.5), i.e. the health and functioning of the affected children is only reduced by about 1 percent. Consequently only about 420,000 accumulated healthy life years are lost and, after discounting, this translates into about 370,000 DALYs lost annually due to this health outcome in this target group.
In departure from Murray (1996), I did not include an age weighting term in the DALYs formula because of ethical considerations. A discussion of this and other ethical and theoreti-cal aspects of the DALYs approach is given in the following sub-section.
3.1.2 Criticism of the DALYs methodology
During and after the development of the original DALYs method, this concept has attracted criticism on numerous theoretical and ethical grounds. A very detailed and informative dis-cussion of the underlying issues is given by Murray (1994 and 1996) and Fox-Rushby (2002). Therefore I limit my discussion to those issues that are relevant to the present study.
Age weighting One component of the DALYs formula that was used in the calculation for the GBD was an age weighting term (Murray 1996). Using these age weights means that, ceteris paribus, more DALYs are lost if a disease of the same duration is suffered by, say, a 34 year old per-son than if it is suffered by a 43 year old person. But it also means that prolonging the life of a 25 year old person by 5 years saves more DALYs than prolonging the life of a 75 year old person by as many years. This has been criticised by various authors, either on practical and empirical grounds (Williams 1999; Richardson 1999a) or on ethical grounds because it is deemed inequitable (Anand and Hanson 1998; Lyttkens 2003). The need for including age weighting in the DALYs formula has also been qualified by some of its developers (Musgrove 2000). Yet, even if age weighting is not meant to capture variations in the economic produc-tivity of individuals over their lifetime but rather their emotional and social importance to others (e.g. of young adults who have to look after both their children and elderly parents), using age weights could be compared to �opening Pandora�s Box� (Lyttkens 2003). Doctors and nurses also have more important social roles than other people (Anand and Hanson 1998) and many Hollywood stars (or Bollywood stars, for that matter) may cause considerable emotional tur-moil.32 Therefore, ignoring data constraints, where should this �socio-emotional weighting� end? Should the premature death of an orphan teenager or of an unmarried adult count dif-ferently than that of their peers who have families? While Musgrove (2000) rightly points out that treating all ages equally is not a value-free judgement either, the ethical ramifications of admitting socio-emotional weighting go very far and therefore I omitted age weights in the DALYs formula used here (which corresponds to using age weights of 1). In doing so, I also follow the call of Williams (1999) for more simplicity and for separation of moral judgements from factual estimates. And Murray and Lopez (1996b) have renounced age weights in their sensitivity analysis, too.
32 While this is only an anecdote, the idea that patients should have access to medical care depending on the relevance of their profession, skills or accomplishments seemed to be controversial and outlandish enough for the (US American) producers of the television series �Star Trek� to create an episode about an alien society in which health treatment is solely determined based on a �treatment coefficient�, which, in turn, is calculated from the patient�s value to society (c.f. Windell 2000).
33
Average remaining life expectancies Another deviation from the DALYs approach of the GBD studies is the average remaining life expectancies that are used here. The GBD measures the burden of all diseases and injuries at one given point in time � and if all diseases and accidents would be eliminated, people would live much longer. Therefore, as an approximation, Murray (1996) bases the calcula-tions of the GBD on the standard life expectancy of Japanese women (82.5 years) because they live longest.33 For men he assumes a slightly lower standard life expectancy (80 years) because of a �biological� difference in survival potential. Leaving the gender differentiation aside, this approach ensures inter-regional equality: the same number of DALYs is lost whether a person in a rich country dies (where people live longer) or in a poor country (where people often have shorter actual life expectancies). While this part of the explanation for using standard life tables is accepted, the gender differentiation has been met with criticism be-cause of its inherent inequality and the potential ethical ramifications if biological (i.e. also genetic) factors form the basis for decisions in health policy (Lyttkens 2003).
While I share the ethical concerns, the reason for using actual national life tables in this study instead of international standard life tables is pragmatic: my work focuses on one par-ticular condition at a time (ID, ZnD or VAD). Reducing the prevalence of a single condition is not expected to change overall average life expectancy significantly and, thus, national life tables remain valid. Using higher standard life expectancies would not only increase the bur-den of micronutrient deficiencies beyond actual life experience, it would also increase the (absolute) impact of any micronutrient intervention. Hence, using national life tables sepa-rates �fiction� and �factual� matter (Williams 1999) and it is also the more conservative ap-proach, i.e. the results are more acceptable and relevant to scientists and policy makers alike.
Discounting The discounting of DALYs is a further, contentious issue that is discussed in the literature and reviewed extensively by Murray (1996) as well as Tan-Torres Edejer et al. (2003). The latter also provide a concise explanation of the rationales for discounting (p. 67):
�The logic for discounting costs is that the value of a unit of consumption to individuals and society decreases over time, for three possible reasons. First, individuals take into account the fact that they might not be alive to benefit from future consumption, and society takes into account the pos-sibility of catastrophe � the possibility that any or all interventions might at some point in the future become valueless due to the technology becoming obsolete, climate change or social chaos, for example. Second, people and society might simply prefer consumption now to consumption in the future � called the pure rate of time preference or, sometimes, myopia. Third, if it is expected that incomes will increase, the marginal welfare gain from an additional unit of consumption will be lower in the future, when people are richer, meaning that any given increase in consumption is more valuable now than in the future. Accordingly it is standard practice to discount future costs to their present values to allow for differences in the value of one extra unit of consumption over time.�
The main reproach to discounting is that it is inequitable because it benefits the present gen-eration at the expense of future generations: all other things equal, with discounting saving one life today is worth more than saving one life next year and much more than saving one life 50 years from now (c.f. Figure 11). However, discounting avoids other theoretical prob-lems like the �time paradox�: if funds can be invested to yield a higher return in the future, it
33 This does not mean the life expectancy of a 80 year old women is assumed to be zero. Murray (1996) uses �standard life tables�, which provide the average remaining life expectancy at each age group: a 80 year old women can expect to live another 9 years and a 100 year old women can still expect to live 2 more years.
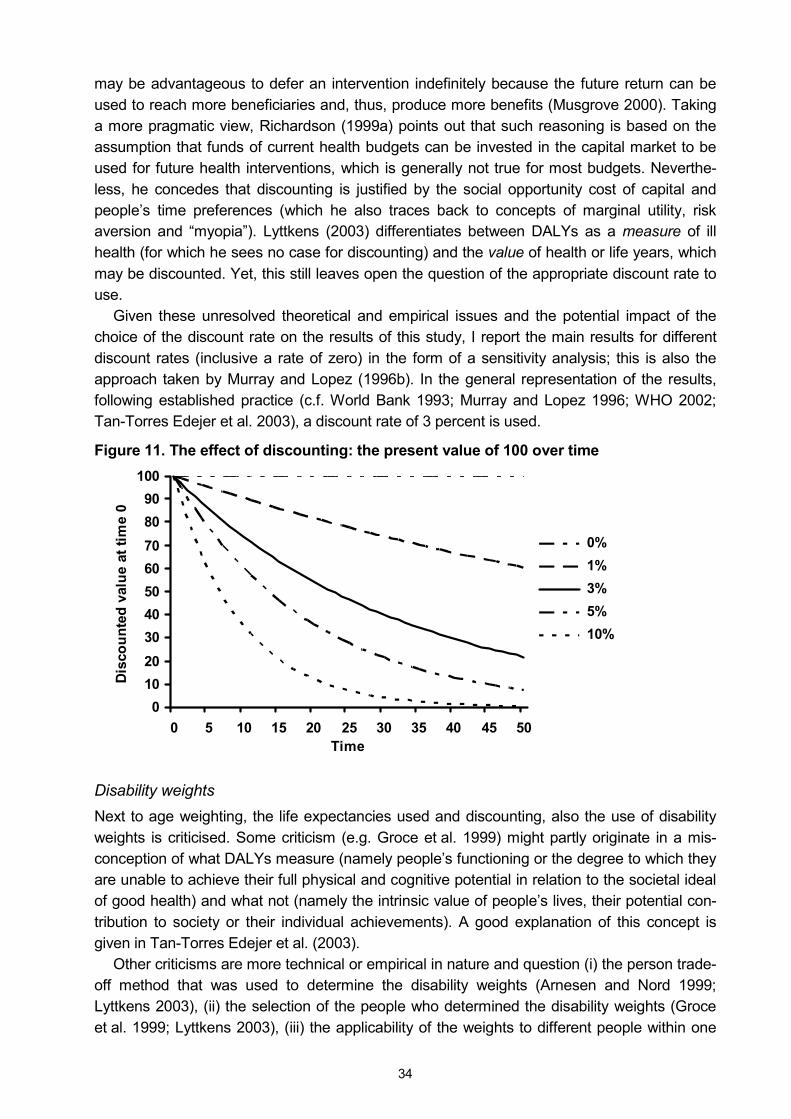
34
may be advantageous to defer an intervention indefinitely because the future return can be used to reach more beneficiaries and, thus, produce more benefits (Musgrove 2000). Taking a more pragmatic view, Richardson (1999a) points out that such reasoning is based on the assumption that funds of current health budgets can be invested in the capital market to be used for future health interventions, which is generally not true for most budgets. Neverthe-less, he concedes that discounting is justified by the social opportunity cost of capital and people�s time preferences (which he also traces back to concepts of marginal utility, risk aversion and �myopia�). Lyttkens (2003) differentiates between DALYs as a measure of ill health (for which he sees no case for discounting) and the value of health or life years, which may be discounted. Yet, this still leaves open the question of the appropriate discount rate to use.
Given these unresolved theoretical and empirical issues and the potential impact of the choice of the discount rate on the results of this study, I report the main results for different discount rates (inclusive a rate of zero) in the form of a sensitivity analysis; this is also the approach taken by Murray and Lopez (1996b). In the general representation of the results, following established practice (c.f. World Bank 1993; Murray and Lopez 1996; WHO 2002; Tan-Torres Edejer et al. 2003), a discount rate of 3 percent is used.
Figure 11. The effect of discounting: the present value of 100 over time
0102030405060708090
100
0 5 10 15 20 25 30 35 40 45 50Time
Dis
coun
ted
valu
e at
tim
e 0
0% 1% 3% 5% 10%
Disability weights Next to age weighting, the life expectancies used and discounting, also the use of disability weights is criticised. Some criticism (e.g. Groce et al. 1999) might partly originate in a mis-conception of what DALYs measure (namely people�s functioning or the degree to which they are unable to achieve their full physical and cognitive potential in relation to the societal ideal of good health) and what not (namely the intrinsic value of people�s lives, their potential con-tribution to society or their individual achievements). A good explanation of this concept is given in Tan-Torres Edejer et al. (2003).
Other criticisms are more technical or empirical in nature and question (i) the person trade-off method that was used to determine the disability weights (Arnesen and Nord 1999; Lyttkens 2003), (ii) the selection of the people who determined the disability weights (Groce et al. 1999; Lyttkens 2003), (iii) the applicability of the weights to different people within one
35
setting (Olsen et al. 2003), or (iv) their uniform application in different social, cultural and envi-ronmental contexts (Allotey et al. 2003; Reidpath et al. 2001; Groce et al. 1999; Anand and Hanson 1998).34 This last criticism may also be combined with a call for the development of an independent weighting system for poorer developing countries (Jayasinghe et al. 2002).
Analysing the robustness of disability weights, Baltussen et al. (2000) introduce a different way of determining these weights, a culturally-adapted visual analogue scale that is suitable for eliciting community values. In a comparison of their results with expert estimates they conclude that the judgement of experts � as in the GBD studies � may be used as a proxy for lay people�s preferences. Stouthard et al. (2000) confirm as well that the GBD�s person trade-off method can yield comprehensive and coherent disability weights. Moreover, Richardson (1999b) points out that in other contexts the taxpayers, i.e. the general public, do not always specify how their funds should be spent (on the composition of the armed forces, the location of roads, etc.). Therefore, decision makers in the health sector may spend funds based on expert judgement (in this case on the definition and weighting of disabilities) and need not always elicit the opinion of the general public. Finally, most decisions in the field of health policy imply a valuation; with the DALYs method this valuation at least becomes transparent.
The disability weights I use in this study are the outcome of a workshop that was held at the CIMMYT office in Kathmandu on March 13-15, 2004.35 For the deliberations of this work-shop the disability weights given in Murray and Lopez (1996) served as benchmarks and the health experts, mainly from the Indian subcontinent themselves, were told to set the disability weights for a developing country context. 36
As a last rejoinder to the reproach that DALYs discriminate against the disabled because one of the person trade-off questions (PTO1) used in the GBD studies implies that saving the lives of disabled individuals saves less DALYs than saving the lives of fully functional indi-viduals (Anand and Hanson 1998; Arnesen and Nord 1999): when computing the DALYs that are lost due to premature mortality the existing health state of the individuals (disabled or not) did not enter my calculations. Discrimination of the disabled can be ruled out; a life lost counts the same for all individuals.
Concluding remarks about the DALYs method In discussing the various criticisms of the DALYs method, technical, empirical and especially ethical issues have repeatedly come to the fore, which is not surprising given the sensitive field of its application. To respond to some of the criticisms I adapted the DALYs formula where appropriate and, in other cases, explained my understanding of the issues. While DALYs are used for various purposes and criticised for different reasons, I presented the rationale for choosing this method for the particular purpose of this study. At some point in
34 Reidpath et al. (2001) and Allotey et al. (2003) give a very illustrative account of this criticism, comparing the lives of individuals suffering from paraplegia or epilepsy in rural Cameroon and urban Australia. 35 This workshop was one of several workshops in the framework of HarvestPlus in which I participated. Others were held at IFPRI, Washington, D.C. (2-3 September 2003 and 19-21 October 2004) and at ZEF, Bonn (16-17 December 2003). Other participants of the workshop in Kathmandu were Prof. Z.A. Bhutta (Aga Khan University, Karachi), Dr. J.V. Meenakshi (HarvestPlus, Washington, DC), Dr. E. Meng (CIMMYT, Mexico), Dr. P. Nestel (Har-vestPlus, Wageningen), Prof. M. Qaim (University of Hohenheim, Stuttgart) and Prof H.P.S. Sachdev (University of Southampton and Maulana Azad Medical College, New Delhi). 36 The disability weights used in the GBD were the result of a special meeting convened at the WHO and spon-sored by the World Bank, in which a rigorous, consultative protocol was followed; these results also matched closely with the pooled results of previous exercises (Murray 1996).
36
time, decisions about biofortification will have to be made, so an appropriate study is needed. By building on and improving upon the DALYs approach, this work not only represents a methodological contribution to the application of DALYs and to their use in agricultural eco-nomics, it also has a relevant policy background.
3.2 Data used for the calculation of DALYs
In section 3.1, I described the DALYs method in theory. However, to establish the burden of ID, ZnD and VAD, the DALYs formula needs to be filled with content and real data. This fac-tual basis for each of the components is described in the following. For many of the sources and references used here, and especially for their evaluation, I am particularly indebted to the nutrition and health experts at the Kathmandu workshop (c.f. footnote 35), both for the inputs obtained during the workshop and in subsequent communications. Tables with an overview of all the data and assumptions described in the following can be found in the annexe (Annexe 1 shows the data used for the analysis of IDA, Annexe 2 shows the data used for the analysis of ZnD and Annexe 3 shows the data used for the analysis of VAD).
3.2.1 Adverse functional outcomes of ID, ZnD and VAD
The subject of this study is micronutrient deficiencies and their disease burden. Yet, micro-nutrient deficiencies as such are only the cause of the burden: the burden itself is the result of the adverse functional outcomes of the deficiencies. Therefore, to determine the burden of each of the three micronutrient deficiencies considered here, it is necessary to clarify what health outcomes are caused by which micronutrient deficiency. This was discussed at the Kathmandu workshop and the ultimate decisions were � where appropriate and possible � based on randomised controlled trials and meta-analyses that clearly indicate the causality and that were deemed to reflect what the general scientific consensus is. Given this very cautious approach, it is probably warranted to underline that the results are bound to be an underestimate of the true burden of the micronutrient deficiencies.
Health outcomes of iron deficiency In the human body, iron is principally found in haemoglobin (in red blood cells), as storage iron, in myoglobin and in several enzymes that are necessary for the oxidative metabolism. Haemoglobin is needed to deliver oxygen to tissues throughout the body, while myoglobin facilitates the diffusion of oxygen to mitochondria in muscle cells (IOM 2000). ID results from an inadequate intake of bioavailable dietary iron and its existence is based on measurements of haemoglobin concentrations and body iron stores (Nestel and Davidsson 2002). Severe ID results in iron deficiency anaemia (IDA). Other factors such as malaria and hookworm can also cause anaemia, thus it is important to stress that IDA is a subgroup of anaemia. Anae-mia in turn is classified as mild, moderate and severe. At the Kathmandu workshop, three adverse functional outcomes were attributed to IDA:37
1. impaired physical activity (Hallberg and Scrimshaw 1981), 2. impaired mental development (Nokes and Bundy 1997),
37 Although certain studies suggest that stunting might also be a consequence of ID, a recent meta-analysis could not establish a significant cause-effect relationship (Ramakrishnan et al. 2004); similarly, a relationship between IDA and perinatal mortality has been suggested but was not considered in the present analysis.
37
3. maternal mortality (Rush 2000), which leads to further negative outcomes such as stillbirths and child deaths due to the absence of breastfeeding and care.
In specifying these functional outcomes, this approach goes beyond the GBD studies, in which DALYs are calculated for IDA only. In other words, the GBD treats anaemia as a �dis-ease� without considering its multiple health consequences. Nevertheless, like in the GBD, the assumption is that ID has no quantifiable impact on functional outcomes as long as it does not result in anaemia. Because the scientific evidence that mild IDA is linked with ad-verse functional outcomes is not conclusive (Rush 2000; Stoltzfus 2001), it is excluded from the model as well. Thus, adverse functional consequence are only considered for moderate and severe IDA. For moderate IDA, a link exists with impaired physical activity and with mental development. For severe IDA, links exist with maternal mortality as well as with more severe expressions of impaired physical activity and mental development. In all cases, except for maternal mortality, it is assumed that each moderately or severely anaemic individual is at risk of enduring the adverse functional outcomes stated.
Health outcomes of zinc deficiency Zinc is present throughout all biologic systems, where it participates in catalytic, structural, and regulatory functions. As a component of many enzymes, it has a part in the maintenance of the structural integrity of proteins, in the regulation of gene expression and ultimately in cellular division. As such, it is the most ubiquitous of all trace elements involved in metabolic processes (Hotz and Brown 2004; IOM 2000). Regarding ZnD, four specific health outcomes were identified at the Kathmandu workshop:
1. diarrhoea (Bahl et al. 200; Bhutta et al. 2000), 2. pneumonia (i.e. severe acute respiratory infection) (Bhutta et al. 1999), 3. stunting (Brown et al. 2002) and 4. mortality (due to diarrhoea as well as pneumonia).
Health outcomes of vitamin A deficiency VA is an essential micronutrient for normal vision, gene expression, reproduction, growth and development, immune function and the integrity of epithelial cells. More specifically, it is re-quired in the eye for the transduction of light into neural signals, for the maintenance of the cornea and for the photoreceptors of the retina; it promotes the regulatory role of surface linings of the respiratory, urinary and intestinal tracts; it regulates the expression of various genes that encode for proteins and enzymes; and it is involved in the development of the limbs and organs as well as in the production of white blood cells, which fight harmful viruses and bacteria (IOM 2000; NIH 2005).
While individual studies suggest that diarrhoea, acute respiratory infection, maternal mor-tality or stunting may also be associated with VAD, causality has not been shown (Vijayara-ghavan 1999; Sachdev 1999; Ronsmans et al. 1999; West et al. 1999; Caulfield et al. 2004). Therefore, at the Kathmandu workshop only five health outcomes were attributed to VAD:
1. night blindness, 2. corneal scars, 3. blindness, 4. measles and 5. child mortality.
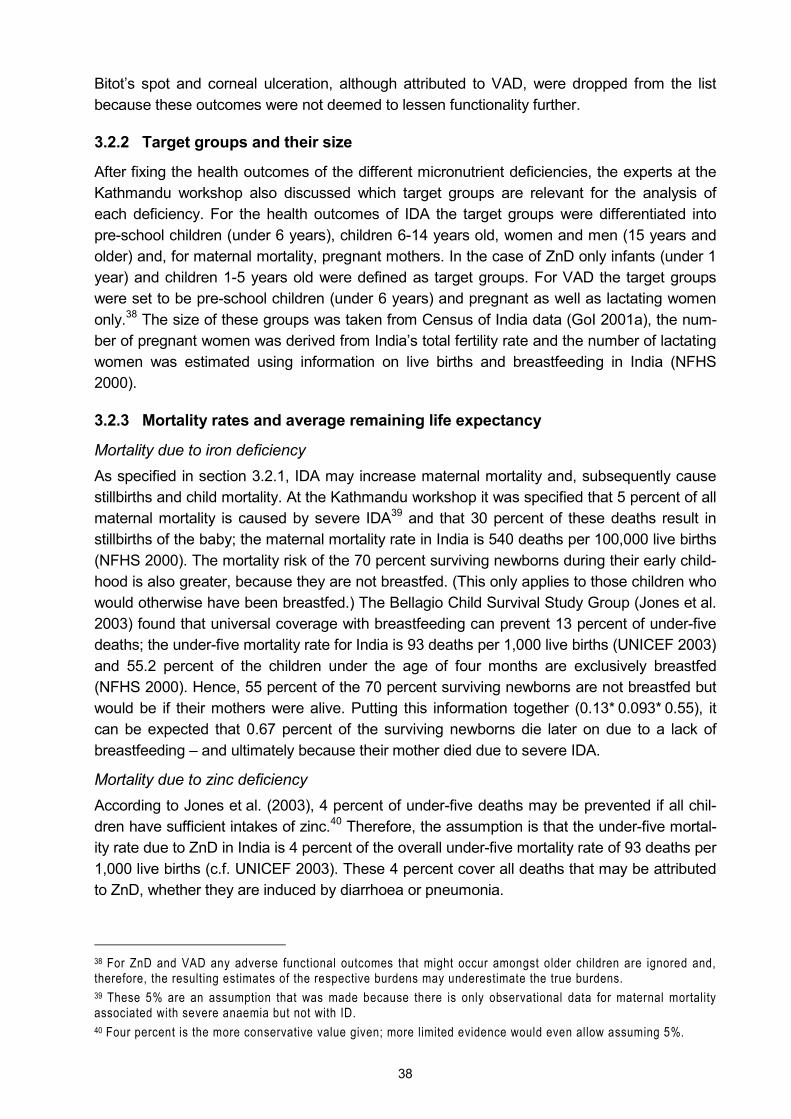
38
Bitot�s spot and corneal ulceration, although attributed to VAD, were dropped from the list because these outcomes were not deemed to lessen functionality further.
3.2.2 Target groups and their size
After fixing the health outcomes of the different micronutrient deficiencies, the experts at the Kathmandu workshop also discussed which target groups are relevant for the analysis of each deficiency. For the health outcomes of IDA the target groups were differentiated into pre-school children (under 6 years), children 6-14 years old, women and men (15 years and older) and, for maternal mortality, pregnant mothers. In the case of ZnD only infants (under 1 year) and children 1-5 years old were defined as target groups. For VAD the target groups were set to be pre-school children (under 6 years) and pregnant as well as lactating women only.38 The size of these groups was taken from Census of India data (GoI 2001a), the num-ber of pregnant women was derived from India�s total fertility rate and the number of lactating women was estimated using information on live births and breastfeeding in India (NFHS 2000).
3.2.3 Mortality rates and average remaining life expectancy
Mortality due to iron deficiency As specified in section 3.2.1, IDA may increase maternal mortality and, subsequently cause stillbirths and child mortality. At the Kathmandu workshop it was specified that 5 percent of all maternal mortality is caused by severe IDA39 and that 30 percent of these deaths result in stillbirths of the baby; the maternal mortality rate in India is 540 deaths per 100,000 live births (NFHS 2000). The mortality risk of the 70 percent surviving newborns during their early child-hood is also greater, because they are not breastfed. (This only applies to those children who would otherwise have been breastfed.) The Bellagio Child Survival Study Group (Jones et al. 2003) found that universal coverage with breastfeeding can prevent 13 percent of under-five deaths; the under-five mortality rate for India is 93 deaths per 1,000 live births (UNICEF 2003) and 55.2 percent of the children under the age of four months are exclusively breastfed (NFHS 2000). Hence, 55 percent of the 70 percent surviving newborns are not breastfed but would be if their mothers were alive. Putting this information together (0.13* 0.093* 0.55), it can be expected that 0.67 percent of the surviving newborns die later on due to a lack of breastfeeding � and ultimately because their mother died due to severe IDA.
Mortality due to zinc deficiency According to Jones et al. (2003), 4 percent of under-five deaths may be prevented if all chil-dren have sufficient intakes of zinc.40 Therefore, the assumption is that the under-five mortal-ity rate due to ZnD in India is 4 percent of the overall under-five mortality rate of 93 deaths per 1,000 live births (c.f. UNICEF 2003). These 4 percent cover all deaths that may be attributed to ZnD, whether they are induced by diarrhoea or pneumonia.
38 For ZnD and VAD any adverse functional outcomes that might occur amongst older children are ignored and, therefore, the resulting estimates of the respective burdens may underestimate the true burdens. 39 These 5% are an assumption that was made because there is only observational data for maternal mortality associated with severe anaemia but not with ID. 40 Four percent is the more conservative value given; more limited evidence would even allow assuming 5%.
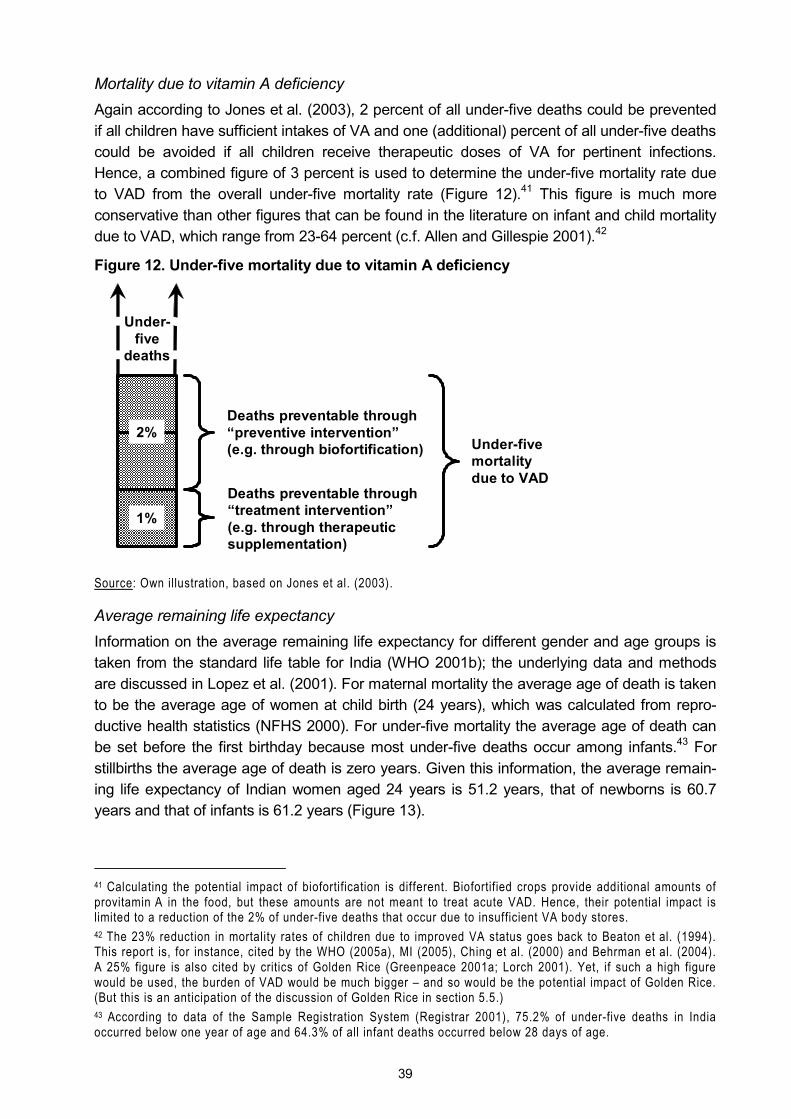
39
Mortality due to vitamin A deficiency Again according to Jones et al. (2003), 2 percent of all under-five deaths could be prevented if all children have sufficient intakes of VA and one (additional) percent of all under-five deaths could be avoided if all children receive therapeutic doses of VA for pertinent infections. Hence, a combined figure of 3 percent is used to determine the under-five mortality rate due to VAD from the overall under-five mortality rate (Figure 12).41 This figure is much more conservative than other figures that can be found in the literature on infant and child mortality due to VAD, which range from 23-64 percent (c.f. Allen and Gillespie 2001).42
Figure 12. Under-five mortality due to vitamin A deficiency
Source: Own illustration, based on Jones et al. (2003).
Average remaining life expectancy Information on the average remaining life expectancy for different gender and age groups is taken from the standard life table for India (WHO 2001b); the underlying data and methods are discussed in Lopez et al. (2001). For maternal mortality the average age of death is taken to be the average age of women at child birth (24 years), which was calculated from repro-ductive health statistics (NFHS 2000). For under-five mortality the average age of death can be set before the first birthday because most under-five deaths occur among infants.43 For stillbirths the average age of death is zero years. Given this information, the average remain-ing life expectancy of Indian women aged 24 years is 51.2 years, that of newborns is 60.7 years and that of infants is 61.2 years (Figure 13).
41 Calculating the potential impact of biofortification is different. Biofortified crops provide additional amounts of provitamin A in the food, but these amounts are not meant to treat acute VAD. Hence, their potential impact is limited to a reduction of the 2% of under-five deaths that occur due to insufficient VA body stores. 42 The 23% reduction in mortality rates of children due to improved VA status goes back to Beaton et al. (1994). This report is, for instance, cited by the WHO (2005a), MI (2005), Ching et al. (2000) and Behrman et al. (2004). A 25% figure is also cited by critics of Golden Rice (Greenpeace 2001a; Lorch 2001). Yet, if such a high figure would be used, the burden of VAD would be much bigger � and so would be the potential impact of Golden Rice. (But this is an anticipation of the discussion of Golden Rice in section 5.5.) 43 According to data of the Sample Registration System (Registrar 2001), 75.2% of under-five deaths in India occurred below one year of age and 64.3% of all infant deaths occurred below 28 days of age.
Under-five
deaths
2%
1%
Deaths preventable through �preventive intervention� (e.g. through biofortification)
Deaths preventable through �treatment intervention� (e.g. through therapeutic supplementation)
Under-five mortality due to VAD

40
Figure 13. Average remaining life expectancies for India
0
10
20
30
40
50
60
70
Age 0 1 5 10 15 20 25 30 35 40 45 50 55 60 65 70 75 80 85 90 95
Ave
rage
rem
aini
ng li
fe e
xpec
tanc
yWomen Men
Source: Own illustration, based on WHO (2001b).
3.2.4 Incidence rates and duration of health outcomes
The incidence of adverse functional outcomes of iron deficiency As explained in section 3.2.1, all adverse functional outcomes of ID may be attributed to ei-ther moderate or severe IDA and it is assumed that the health outcomes manifest themselves in each case. Hence, what are needed are the incidence rates of moderate and severe IDA. However, for India only information on anaemia and only in the form of prevalence rates is available. Anaemia has several causes, but the experts of the Kathmandu workshop agreed that it is reasonable to attribute 50 percent of anaemia to ID; for infants this figure increases to 60 percent (INACG 2003). The National Family and Health Survey (NFHS 2000), which is deemed to be the more reliable source, only collected data for children under 5 years and their mothers, thus I had to combine this data with that from the National Institute of Nutrition (NIN 2003) to get more comprehensive data on the prevalence of anaemia.44 The combined data still lacked anaemia prevalence rates for adult men. In such cases the experts of the Kathmandu workshop had judged that prevalence rates for men could be approximated by taking 50 percent of the corresponding prevalence rates for women. The set of prevalence rates that I obtained based on these data and assumptions is given in Table 1.
To convert prevalence rates into incidence rates it is necessary to convert a �stock� figure into a �flow� figure. Assuming, in accordance with the discussions at the Kathmandu work-shop, that moderate and severe IDA (or their long-term effects) are permanent conditions in each target group, the prevalence rates are the same across all age cohorts within one group.45 Then the prevalence rates can be applied to the first age cohort in each target group
44 Choosing the data sources carefully is essential to obtain correct estimates, because as Brown (1996, p. 13) notes: �The accuracy of the underlying basic epidemiological data from which [the] disease burden is calculated will influence the final results much more than the discount rate [...] or the disability weighting method. [...] The GBD researchers conclude that researchers� efforts should be invested in improving the basic data rather than in spending excessive energy on analysing the effects of small adjustments to the measure itself.� 45 However, if 27.5% of children below 5 years of age suffer from the consequences of moderate IDA, there is obviously no immediate recovery of 11.9% of the children on their 6th birthday to achieve the prevalence rate of

41
Table 1. Prevalence rates of iron deficiency anaemia in India (percent)
Children ≤ 5 years Children aged 6-14 years
Women over 14 years
Men over 14 years
Moderate IDA 27.5 15.6 7.4 3.7
Severe IDA 3.2 0.8 1.0 0.5
Source: Own calculations, based on NFHS (2000) and NIN (2003).
to calculate the number of new cases of moderate and severe IDA in this target group. And the number of new cases divided by the size of the target group yields the respective inci-dence rates:
(5) Iij = Pij * Cj / Tj where
Iij = incidence rate of health outcome i in target group j Pij = prevalence rate of health outcome i in target group j Cj = number of people in the first age cohort of target group j Tj = total number of people in target group j
The incidence of adverse functional outcomes of zinc deficiency To derive incidence rates for IDA it was possible to revert to prevalence data on anaemia. For ZnD such representative prevalence data is not available. Therefore a different approach proved to be more workable, namely to look at the general incidence rates of the health out-comes of ZnD and to attribute a share of them to the deficiency.
Based on Kosek et al. (2003), the average incidence rate for diarrhoea is assumed to be 2.6 episodes per infant and 1.3 episodes per child per year.46 And of all cases of diarrhoea 18 percent can be attributed to zinc deficiency (Bhutta et al. 1999). Hence, the incidence rate for diarrhoea due to ZnD is 47 percent for infants and 23 percent for children. The duration of one case of infantile diarrhoea is assumed to be three days, for children it is assumed to be four days (c.f. Kosek et al. 2003; Bhandari et al. 1994).
According to Rudan et al. (2004), the median incidence of acute lower respiratory infec-tions in developing countries is 0.29 episodes per child (and infant) per year. Of all cases of pneumonia, 41 percent can be attributed to ZnD (Bhutta et al. 1999).47 Therefore, the inci-dence rate for pneumonia related to ZnD is 12 percent. For pneumonia the average duration for one case is assumed to be four days for both infants and children.48
To consider the impact of stunting due to ZnD, the experts at the Kathmandu workshop assumed that with adequate zinc intakes all stunted children would be on average one centi-metre taller. For this approach the basis for the DALYs calculation is the incidence of stunting
15.6% moderate IDA among children aged 6-14 years. It may be that the incidence rate of moderate IDA in the former target group is higher while the duration of the condition is shorter (which results in the same prevalence rate). Yet, the experts at the Kathmandu workshop were more at ease with the simplification made here than with making other assumptions about the �true� incidence rates and the corresponding duration of the conditions for each target group. 46 Here �child� relates to the target group of children aged 1-5 years, in contrast to the target group �infants� who are younger than 1 year of age. 47 Also see Brooks et al. (2004) for the effect of zinc on pneumonia outcomes. 48 Due to a lack of pertinent data, this is based on the expert opinion of the participants of the Kathmandu work-shop and on Bhutta (2005).
42
(height-for-age below -2 SD). However, for India only the prevalence rate of stunting among children under the age of 3 years (45.5 percent) is available (NFHS 2000). Therefore the same conversion of prevalence rates to incidence rates as for IDA is necessary (c.f. equation (5)). This is possible because stunting is considered to be permanent from 6 months of age onward (Shrimpton et al. 2001).
The incidence of adverse functional outcomes of vitamin A deficiency To calculate the burden of VAD, the related incidence rates for night blindness, corneal scars and measles are needed. Such cause-specific statistics are not available. However, accord-ing to the experts at the Kathmandu workshop it is safe to assume that all cases of night blindness are due to VAD, for corneal scars 20 percent of all cases can be attributed to VAD, and half of these are assumed to lead to blindness; hence half of these cases of corneal scars will be a permanent but non debilitating condition (visual impairment), while the other half of the affected individuals will suffer from blindness. For measles it is assumed that 20 percent of all cases of measles are due to VAD, and complications can be expected in 50 percent of these cases.
Night blindness during pregnancy is expected to continue through the first months of lacta-tion; its duration is assumed to be 5 months for pregnant and 6 months for lactating women. For children night blindness is assumed to appear one year after birth and to last for one year. Children are assumed to acquire corneal scars at the age of one year; for the 50 per-cent who are assumed to go blind, this is assumed to happen after a period of another 1.5 years during which they suffered from corneal scars. Both corneal scars and blindness are permanent conditions, i.e. the duration of these functional outcomes corresponds to the re-maining life expectancy of the age group 1-4 years, which is 64.4 years. Measles is a tempo-rary disease and its duration is assumed to be 10 days. When complications set in, the dura-tion is assumed to be 20 days. Again, these are estimates and assumptions made at the workshop in Kathmandu.
For night blindness and corneal scars only prevalence data are available. The prevalence of night blindness among children in India is 1.03 percent; among pregnant and lactating women it is 2.76 percent. The prevalence rate of corneal scars among children is 0.12 per-cent (Toteja et al. 2001). For corneal scars as permanent condition, incidence rates can be derived following the approach that is used for IDA (c.f. equation (5)). For night blindness, which is defined as a short-term condition, prevalence rates can be converted into incidence rates by using the simplified formula
(6) Iij = Pij / dij where
Iij = incidence rate of health outcome i in target group j Pij = prevalence rate of health outcome i in target group j dij = duration of the health outcome i in target group j
In the case of measles the incidence rate of 5.4 percent for the group of �children� in India was obtained from Sachdev (2005).49
49 Sachdev assumed a higher incidence rate for measles than the one that is given in the official data of the Cen-tral Bureau of Health Intelligence (CBHI) because for some states no data is available and it is known that there is substantial under-reporting of the morbidities reported by the CBHI.
43
3.2.5 Disability weights
As already outlined in section 3.1.2, the disability weights I used in the DALYs calculations are an output of the Kathmandu workshop and build on the disability weights used in the GBD. For the adverse functional outcomes of IDA the disability weights for the respective target groups are:
! 0.011 for all target groups for impaired physical activity due to moderate IDA, ! 0.087 for all children and 0.09 for adults for impaired physical activity
due to severe IDA, ! 0.006 for children under six for impaired mental development due to moderate IDA, ! 0.024 for children under six for impaired mental development due to severe IDA.
For the health outcomes of ZnD the disability weights are: ! 0.2 and 0.15 for infants and children, respectively, for diarrhoea, ! 0.3 and 0.2 for infants and children, respectively, for pneumonia and ! 0.0001 for infants, for stunting, if it is assumed that adequate zinc intakes
reduce stunting by one centimetre. Finally, for the health outcomes of VAD the disability weights are:
! 0.1 and 0.05 for women and children, respectively, for night blindness, ! 0.2 for children for corneal scars, ! 0.5 for children for blindness and ! 0.35 and 0.7 for children for measles and for measles with complications, respectively.
This data enters the DALYs calculations to determine the burden of ill health of IDA, ZnD and VAD, respectively. Yet, because biofortification addresses insufficient micronutrient intakes and not the health consequences per se, in the following section I explain how intakes can be related to the adverse functional outcomes specified in this section.
3.3 Assessing the impact of biofortification
To measure the economic impact of biofortified staple crops on public health, both the num-ber of DALYs lost under the status quo and the number of DALYs lost under a hypothetical scenario, in which people consume biofortified crops, need to be calculated. The underlying reasoning is that the consumption of biofortified crops reduces the prevalence of the respec-tive micronutrient deficiency. This, in turn, reduces the incidence of the associated health outcomes, which translates into less DALYs lost to the deficiency. If less DALYs are lost, the disease burden of the deficiency in a �with biofortification� scenario is smaller. Then the differ-ence to the status quo is the impact of the biofortified crop. Ultimately, the benefit to public health is given as the number of DALYs saved through the technology.
In addition to the information needed to calculate DALYs under the status quo, developing a hypothetical scenario where people consume biofortified crops requires further information. The potential impact of biofortified crops on public health depends primarily on four factors: 1. The current intake of the micronutrient in question, i.e. the baseline. (Given the causality of
the micronutrient deficiencies for the health outcomes described in section 3.2.1, their inci-dence rates can be associated with this baseline.)
2. The number of people who are expected to consume biofortified crops, i.e. the coverage rate. (This depends on producers� and consumers� accessibility to and their acceptance of the new technology.)
44
3. The additional amount of the micronutrient that consumers of a biofortified crop consume and actually absorb, i.e. the �bioefficacy�. (This depends on the quantity of the crop con-sumed, on the additional amount of the micronutrient in the crop and on its bioavailability to the human body.)
4. The size of the effect of the additionally absorbed micronutrient on the adverse functional outcomes of the respective micronutrient deficiency, i.e. the dose-response. (This de-pends on the body�s efficiency in using the absorbed micronutrient.)
In section 3.3.1 the calculation of micronutrient intakes is described, factors 2 and 3 are dis-cussed and quantified in section 3.3.2, factor 4 is discussed in section 3.3.3 and in section 3.3.4 the calculation of the actual impact of the biofortified crops is described
3.3.1 Data and methods used for computing micronutrient intakes
There are several ways to determine food intakes. Nutritionists generally use food-frequency questionnaires or food record and food recall instruments like 24-hour recalls, 4-day-weighed food records or 7-day diaries. Economists also resort to household food expenditure surveys. All of these methods have shortcomings and potential biases, though (e.g. Kipnis et al. 2002; Bouis 1994b). However, as Bouis (1994b, p. 223) points out: �policy decisions will continue to be made irrespective of the quality of existing food consumption data; but it can only help to be aware of these potential biases�. Therefore, while acknowledging that more detailed data may be desirable, I also accept the need to carry out analyses to obtain preliminary results and to be able to identify potential future improvements regarding methods and data. For the analysis of biofortified crops in India a nationally representative data set is needed to take account of the different dietary patterns and eating habits across this country of one billion people (c.f. Meenakshi and Ray 1999). Given this dimension, the data is necessarily survey-based secondary data.
For this study I used the 55th survey on household consumption of the National Sample Survey Organisation (NSSO 2000). This survey was carried out between July 1, 1999 and June 30, 2000 and covered 119,554 households. It recorded the quantities of over 140 differ-ent foodstuffs consumed by the household over a 30-day recall period. The corresponding instructions of the codebook of the survey are the following (schedule 1.0, p. D-17, paragraph 4.5.6):
�Here, consumption includes all consumption of monetary and non-monetary purchases and goods received as gift, loan etc. However, the consumption data should be strictly confined to the do-mestic consumption of the household. The expenditure incurred on account of pet animals will be excluded. [...] consumption by livestock belonging to the household will not be included in house-hold consumption. Accounting should, however, be made of the livestock products like milk, meat, egg, etc., obtained from such livestock and consumed by the household. While making entries on household consumption care should be taken not to include any transfer payment in kind, like loans, advances, charities, gifts and other payments in kind, if any. But consumption from transfer receipts will be included. Consumption of the household will consist of consumption made out of: (i) commodities purchased in cash; (ii) commodities received in exchange of goods and services; (iii) home-grown/home-produced stock; (iv) transfer receipts such as gifts, loans, charities, etc., and (v) free collection.�
While following established praxis when using such a household survey, this survey is more precise than food expenditure surveys because � apart from its high level of disaggregation � it also contains quantitative and not only monetary information on the foodstuffs consumed. Moreover, the big sample size of nearly 120,000 households contributes to the robustness of
45
the results derived thereof. Finally, for the purposes of my analysis, cardinal values are less relevant than both the ordinal ranking of the individual micronutrient intakes and the relative changes in these intakes that occur due to biofortification, i.e. demands on data quality are less stringent. Hence, the NSSO data set is appropriate for the purpose of my analyses and the results are expected to be robust.
Based on the survey�s unit record data on household food consumption, I used food com-position tables to translate the food quantities consumed by each household into micronutri-ent consumption. For India the standard food composition reference is Gopalan et al. (1989), which was supplemented with food conversion factors of the USDA (2004) and Erhardt (2005).50 To convert the VA intake of animal source foods into beta-carotene intake, a conver-sion factor of 1:12 was used (IOM 2002; Erhardt 2005). Having thus computed the micronu-trient consumption at the household level, adult equivalent weights were used to attribute this consumption to the individual family members. This is necessary because it is highly unlikely that the food in a household is (incidentally) distributed according to each member�s micronu-trient requirements (IOM 2000). The assumption is rather that the food is distributed accord-ing to the energy requirements of each household member. In this case, because their en-ergy requirements are higher, men generally get a bigger share of the food than women. Yet, for example, women�s iron requirements are higher than those of men � which they have to cover with a smaller share of food. Therefore, in the same household men may exceed their iron requirements while women are still deficient. In an analysis at the household level, such important details would get lost (i.e. the household�s iron consumption could be considered sufficient) and the burden of ID would be underestimated. Disaggregating the NSSO house-hold data by means of adult equivalent weights to the level of individual household members increases the size of the data set to over 0.5 million observations, complicates the program-ming and puts a strain on the computing power, but this approach also represents a major improvement over looking at the aggregated micronutrient consumption of households. In previous work on biofortification either detailed but only regional data was used (Dawe et al. 2002), or highly aggregated national food consumption data (Zimmermann and Qaim 2004), or assumptions on the food intake of a representative adult in a hypothetical setting (Bouis 2002a; Albrecht 2002).
To determine the adult equivalent weights, I used the energy requirements of the different target groups: the energy requirements of adult men were set equal to one and the energy requirements of all other age and gender groups were then defined as fractions thereof.51 For this approach the underlying assumption is that the distribution of food within the household is unbiased. Regarding this issue the literature is not conclusive. Haddad et al. (1996) quote a number of studies that indicate a preference for boys in the distribution of food, but only in richer families (where micronutrient malnutrition is less of an issue); in other studies regional differences are stronger. The conclusions of these studies regarding a gender bias in the anthropometric outcomes for India are also weak. In a series of publications Behrman (1988a; 1988b; with Deolalikar 1990) found no significant differences in the distribution of nutrients 50 In the case of iron and zinc intakes I obtained the raw intake data at the household level from J.V. Meenakshi and Rekha Sharma, Department of Economics, Delhi School of Economics. I modified these data to take account of the possibility of contamination iron in the food composition values used. In the case of milled rice, while Gopalan et al (1989) report a value of 7-10 ppm iron, it is believed that the content is only about 3 ppm (Barry 2005; Nestel 2005). This lower figure was used to determine the baseline iron intake. 51 This approach follows the logic of estimating the required nutrient density of the household diet (IOM 2000).
46
and �little or no support� for the existence of gender discrimination, except for differences in the variability of nutrient intakes, which may translate into greater vulnerability of female members and younger children during lean seasons. And, as quoted by Haddad et al. (1996), Brahman et al. (1988) did not find a gender bias in the distribution of food within households either. Still, to verify the adult equivalent weights, I regressed the households� iron consump-tion on household composition (age and gender groups) and used the coefficients of the in-dependent variables to construct a different set of adult equivalent weights. For the minerals the resulting adult equivalent weights equalled the adult equivalent weights that I had derived from the energy requirements (presumably because both energy and mineral intakes are closely related to cereal intakes). However, in the case of VA there was a substantial differ-ence between the two sets of adult equivalent weights. An inspection of the results indicated that within the households VA-rich food (especially milk) is not distributed according to energy requirements. Therefore, for VA the adult equivalent weights from the regression were used for the subsequent analysis.
3.3.2 Simulating the consumption of biofortified crops
A starting point for the simulation of the consumption of biofortified crops is to establish a baseline for the current content of the micronutrients in the different crops and to determine how much more of the micronutrient in question plant breeders can breed into the respective target crop.52 In a next step the potential coverage rate of the biofortified crop needs to be estimated (in terms of the production share of the crop or of its share in consumption). Finally, the potential post-harvest loss and a potential change in the bioavailability of the added mi-cronutrient has to be determined. Given the multiple sources of uncertainty in such an ex ante analysis, I use an �extreme scenario analysis� (Briggs and Gray 1999), i.e. optimistic and pessimistic values of the different inputs are systematically combined at the same time and the effects on the outcome are studied. To this end I elicited or determined a pessimistic and an optimistic estimate for each statement (Table 2). Subsequently, throughout the whole analysis, sets of pessimistic and optimistic assumptions are used to calculate the upper and lower bounds of the likely results. This increases the reliability of the findings because, if the policy implications of the analysis do not change dramatically, the results can be considered robust (Walker and Fox-Rushby 2001; Tan-Torres Edejer et al. 2003).
To estimate the potential coverage rate of the iron-rich and zinc-rich cereals, the assump-tion is that the respective �iron trait� and �zinc trait� will be bred into more and more varieties. Furthermore, the estimates are based on the premise that the biofortification strategy explic-itly involves breeding nutrient-dense and agronomically-superior varieties to facilitate adoption among farmers, i.e. the assumption is that farmers adopt the new varieties for their other (agronomically advantageous) characteristics and not for their micronutrient density. For these cereals the main mechanism to achieve wide-spread consumption is, therefore, to rely on a supply-driven push through their adoption by farmers and the subsequent spreading through the food chain. As these varieties are expected to be developed in collaboration with national agricultural research systems as part of ongoing research efforts, seed prices should 52 For the iron-rich and zinc-rich cereals there is a positive probability that, given the complexities of the underly-ing genetics and the ex ante nature of the present exercise, plant breeders will be unable to achieve the esti-mated nutrient levels in these crops. This analysis does not take account of this source of uncertainty. (For Golden Rice, however, the beta-carotene levels used have already been shown in experimental lines of Golden Rice (c.f. Table 2)).
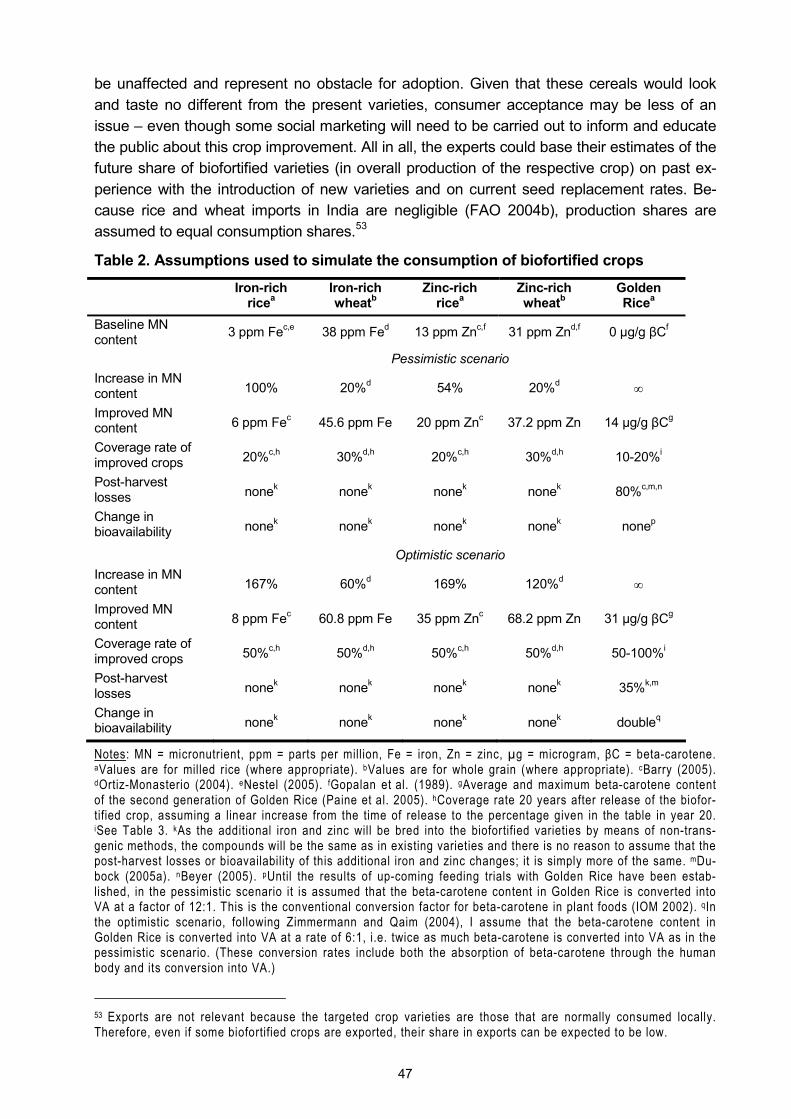
47
be unaffected and represent no obstacle for adoption. Given that these cereals would look and taste no different from the present varieties, consumer acceptance may be less of an issue � even though some social marketing will need to be carried out to inform and educate the public about this crop improvement. All in all, the experts could base their estimates of the future share of biofortified varieties (in overall production of the respective crop) on past ex-perience with the introduction of new varieties and on current seed replacement rates. Be-cause rice and wheat imports in India are negligible (FAO 2004b), production shares are assumed to equal consumption shares.53
Table 2. Assumptions used to simulate the consumption of biofortified crops
Iron-rich ricea
Iron-rich wheatb
Zinc-rich ricea
Zinc-rich wheatb
Golden Ricea
Baseline MN content 3 ppm Fec,e 38 ppm Fed 13 ppm Znc,f 31 ppm Znd,f 0 µg/g βCf
Pessimistic scenario Increase in MN content 100% 20%d 54% 20%d ∞
Improved MN content 6 ppm Fec 45.6 ppm Fe 20 ppm Znc 37.2 ppm Zn 14 µg/g βCg
Coverage rate of improved crops 20%c,h 30%d,h 20%c,h 30%d,h 10-20%i
Post-harvest losses nonek nonek nonek nonek 80%c,m,n
Change in bioavailability nonek nonek nonek nonek nonep
Optimistic scenario Increase in MN content 167% 60%d 169% 120%d ∞
Improved MN content 8 ppm Fec 60.8 ppm Fe 35 ppm Znc 68.2 ppm Zn 31 µg/g βCg
Coverage rate of improved crops 50%c,h 50%d,h 50%c,h 50%d,h 50-100%i
Post-harvest losses nonek nonek nonek nonek 35%k,m
Change in bioavailability nonek nonek nonek nonek doubleq
Notes: MN = micronutrient, ppm = parts per million, Fe = iron, Zn = zinc, µg = microgram, βC = beta-carotene.
aValues are for milled rice (where appropriate). bValues are for whole grain (where appropriate). cBarry (2005). dOrtiz-Monasterio (2004). eNestel (2005). fGopalan et al. (1989). gAverage and maximum beta-carotene content of the second generation of Golden Rice (Paine et al. 2005). hCoverage rate 20 years after release of the biofor-tified crop, assuming a linear increase from the time of release to the percentage given in the table in year 20. iSee Table 3. kAs the additional iron and zinc will be bred into the biofortified varieties by means of non-trans-genic methods, the compounds will be the same as in existing varieties and there is no reason to assume that the post-harvest losses or bioavailability of this additional iron and zinc changes; it is simply more of the same. mDu-bock (2005a). nBeyer (2005). pUntil the results of up-coming feeding trials with Golden Rice have been estab-lished, in the pessimistic scenario it is assumed that the beta-carotene content in Golden Rice is converted into VA at a factor of 12:1. This is the conventional conversion factor for beta-carotene in plant foods (IOM 2002). qIn the optimistic scenario, following Zimmermann and Qaim (2004), I assume that the beta-carotene content in Golden Rice is converted into VA at a rate of 6:1, i.e. twice as much beta-carotene is converted into VA as in the pessimistic scenario. (These conversion rates include both the absorption of beta-carotene through the human body and its conversion into VA.)
53 Exports are not relevant because the targeted crop varieties are those that are normally consumed locally. Therefore, even if some biofortified crops are exported, their share in exports can be expected to be low.
48
In the case of Golden Rice the beta-carotene content is easily recognisable through the yellow colour of the rice, i.e. Golden Rice is distinct from conventional rice. Therefore, the �golden� trait cannot simply be bundled with other desirable traits like higher yields or better disease resistance, as it is the plan for mineral-dense cereals. Hence, in addition to agro-nomic superiority, also demand-driven pull factors need to play a role in achieving the desired dissemination and coverage. This requires substantial large-scale social marketing efforts. Yet, the corresponding marketing strategies are not yet developed and the acceptance of Golden Rice remains an open question. This acceptance can be influenced through appropri-ate measures, though. Therefore, the task of an ex ante analysis cannot be to try to second-guess future developments, but to provide information that can help in the design of these very strategies and to support policy makers in their decisions (Qaim and von Braun 1998). Here I use scenarios with different coverage rates to demonstrate possible effects of different strategies.
Potential avenues for the dissemination and promotion of Golden Rice to the target groups in India are, in particular, the existing systems in place to ensure food security, like the Public Distribution System (PDS) and the Integrated Child Development Services (ICDS) (Rao 2004). In �fair price shops� essential commodities are sold at subsidised prices through the PDS. There is also a �Targeted Public Distribution System� in place, a delivery system that specifically targets the poor (GoI 2005a, GoI 2005b, GoI 2001b). In the framework of the ICDS, in community-based childcare centres (anganwadis), children from low-income families and from deprived sections of the society receive supplementary feeding. The anganwadis are also used as contact points to counsel mothers and pregnant women, to provide nutrition education and to distribute targeted supplementation (GoI 2005c).54 The Ministry of Human Resource Development, supported by the Ministry of Consumer Affairs, Food & Public Distri-bution, also implemented a mid-day meal scheme that covers children in primary schools, who are supplied with 100 grams of food grains (wheat or rice) per school day (GoI 2005a). Obviously, the success of using these channels depends on their effectiveness in fulfilling their purpose (which was doubted by some experts I interviewed during my field work, who suggested that corruption and misallocation of targeted food takes place in the PDS (c.f. Ramachandran 2003; Das Gupta et al. 2005; Chakravarty and Dand 2005)).
One advantage of using the public systems is that a market for Golden Rice will be created because public authorities generate demand for it � which gives an incentive to farmers to cultivate Golden Rice. Hence, the underlying assumption is that the cultivation of Golden Rice and any share it can gain in overall rice consumption will be rather demand-driven � demand that will be generated by both the government�s assumed role as a buyer and by any social marketing campaigns that promote Golden Rice. The initial demand that is built up if public systems starts sourcing Golden Rice may not only ensure a sales market for Golden Rice, it may feed through to the cultivation of rice in general, with more farmers learning of it and more consumers asking for it. This potential mechanism may also counteract a weakness of promoting Golden Rice through the public systems, namely that a market demand for Golden Rice will not persuade subsistence farmers to grow it, nor will rural labourers who receive their payment in kind be reached as long as Golden Rice is confined to the PDS. Therefore, the agricultural extension system will also have a role to play in the promotion of Golden Rice
54 According to GoI (2005c), the budgetary allocation to the ICDS for the year 1999-2000 was Rs. 8.6 billion, which is US$ 214.4 million in 2004 (annex 4; BLS 2005).
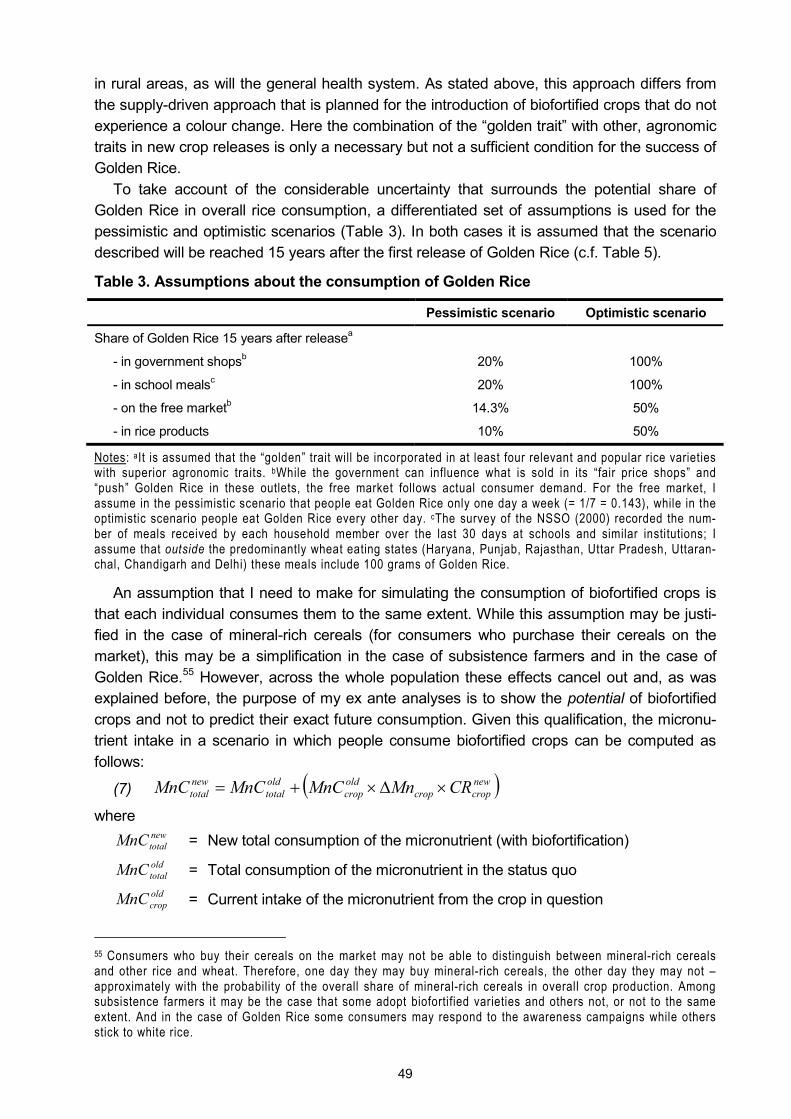
49
in rural areas, as will the general health system. As stated above, this approach differs from the supply-driven approach that is planned for the introduction of biofortified crops that do not experience a colour change. Here the combination of the �golden trait� with other, agronomic traits in new crop releases is only a necessary but not a sufficient condition for the success of Golden Rice.
To take account of the considerable uncertainty that surrounds the potential share of Golden Rice in overall rice consumption, a differentiated set of assumptions is used for the pessimistic and optimistic scenarios (Table 3). In both cases it is assumed that the scenario described will be reached 15 years after the first release of Golden Rice (c.f. Table 5).
Table 3. Assumptions about the consumption of Golden Rice
Pessimistic scenario Optimistic scenario
Share of Golden Rice 15 years after releasea
- in government shopsb 20% 100%
- in school mealsc 20% 100%
- on the free marketb 14.3% 50%
- in rice products 10% 50%
Notes: aIt is assumed that the �golden� trait will be incorporated in at least four relevant and popular rice varieties with superior agronomic traits. bWhile the government can influence what is sold in its �fair price shops� and �push� Golden Rice in these outlets, the free market follows actual consumer demand. For the free market, I assume in the pessimistic scenario that people eat Golden Rice only one day a week (= 1/7 = 0.143), while in the optimistic scenario people eat Golden Rice every other day. cThe survey of the NSSO (2000) recorded the num-ber of meals received by each household member over the last 30 days at schools and similar institutions; I assume that outside the predominantly wheat eating states (Haryana, Punjab, Rajasthan, Uttar Pradesh, Uttaran-chal, Chandigarh and Delhi) these meals include 100 grams of Golden Rice.
An assumption that I need to make for simulating the consumption of biofortified crops is that each individual consumes them to the same extent. While this assumption may be justi-fied in the case of mineral-rich cereals (for consumers who purchase their cereals on the market), this may be a simplification in the case of subsistence farmers and in the case of Golden Rice.55 However, across the whole population these effects cancel out and, as was explained before, the purpose of my ex ante analyses is to show the potential of biofortified crops and not to predict their exact future consumption. Given this qualification, the micronu-trient intake in a scenario in which people consume biofortified crops can be computed as follows:
(7) ( )newcropcrop
oldcrop
oldtotal
newtotal CRMnMnCMnCMnC ×∆×+=
where newtotalMnC = New total consumption of the micronutrient (with biofortification) oldtotalMnC = Total consumption of the micronutrient in the status quo oldcropMnC = Current intake of the micronutrient from the crop in question
55 Consumers who buy their cereals on the market may not be able to distinguish between mineral-rich cereals and other rice and wheat. Therefore, one day they may buy mineral-rich cereals, the other day they may not � approximately with the probability of the overall share of mineral-rich cereals in overall crop production. Among subsistence farmers it may be the case that some adopt biofortified varieties and others not, or not to the same extent. And in the case of Golden Rice some consumers may respond to the awareness campaigns while others stick to white rice.
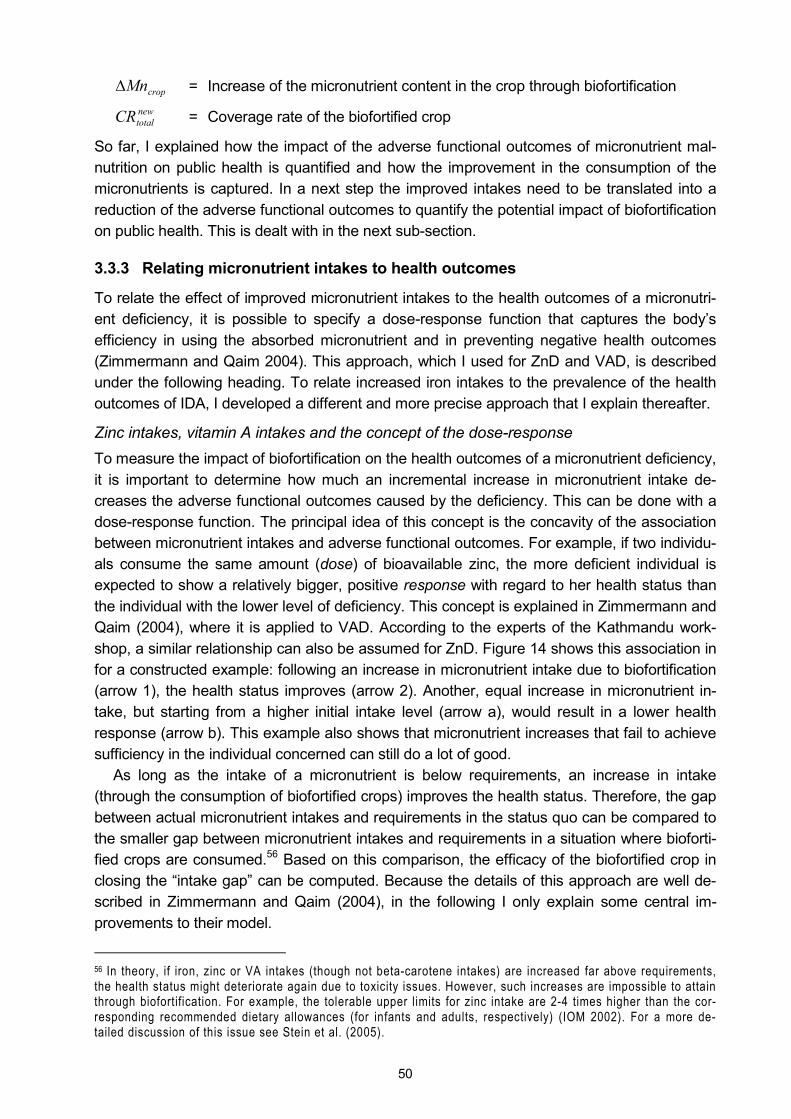
50
cropMn∆ = Increase of the micronutrient content in the crop through biofortification newtotalCR = Coverage rate of the biofortified crop
So far, I explained how the impact of the adverse functional outcomes of micronutrient mal-nutrition on public health is quantified and how the improvement in the consumption of the micronutrients is captured. In a next step the improved intakes need to be translated into a reduction of the adverse functional outcomes to quantify the potential impact of biofortification on public health. This is dealt with in the next sub-section.
3.3.3 Relating micronutrient intakes to health outcomes
To relate the effect of improved micronutrient intakes to the health outcomes of a micronutri-ent deficiency, it is possible to specify a dose-response function that captures the body�s efficiency in using the absorbed micronutrient and in preventing negative health outcomes (Zimmermann and Qaim 2004). This approach, which I used for ZnD and VAD, is described under the following heading. To relate increased iron intakes to the prevalence of the health outcomes of IDA, I developed a different and more precise approach that I explain thereafter.
Zinc intakes, vitamin A intakes and the concept of the dose-response To measure the impact of biofortification on the health outcomes of a micronutrient deficiency, it is important to determine how much an incremental increase in micronutrient intake de-creases the adverse functional outcomes caused by the deficiency. This can be done with a dose-response function. The principal idea of this concept is the concavity of the association between micronutrient intakes and adverse functional outcomes. For example, if two individu-als consume the same amount (dose) of bioavailable zinc, the more deficient individual is expected to show a relatively bigger, positive response with regard to her health status than the individual with the lower level of deficiency. This concept is explained in Zimmermann and Qaim (2004), where it is applied to VAD. According to the experts of the Kathmandu work-shop, a similar relationship can also be assumed for ZnD. Figure 14 shows this association in for a constructed example: following an increase in micronutrient intake due to biofortification (arrow 1), the health status improves (arrow 2). Another, equal increase in micronutrient in-take, but starting from a higher initial intake level (arrow a), would result in a lower health response (arrow b). This example also shows that micronutrient increases that fail to achieve sufficiency in the individual concerned can still do a lot of good.
As long as the intake of a micronutrient is below requirements, an increase in intake (through the consumption of biofortified crops) improves the health status. Therefore, the gap between actual micronutrient intakes and requirements in the status quo can be compared to the smaller gap between micronutrient intakes and requirements in a situation where bioforti-fied crops are consumed.56 Based on this comparison, the efficacy of the biofortified crop in closing the �intake gap� can be computed. Because the details of this approach are well de-scribed in Zimmermann and Qaim (2004), in the following I only explain some central im-provements to their model.
56 In theory, if iron, zinc or VA intakes (though not beta-carotene intakes) are increased far above requirements, the health status might deteriorate again due to toxicity issues. However, such increases are impossible to attain through biofortification. For example, the tolerable upper limits for zinc intake are 2-4 times higher than the cor-responding recommended dietary allowances (for infants and adults, respectively) (IOM 2002). For a more de-tailed discussion of this issue see Stein et al. (2005).
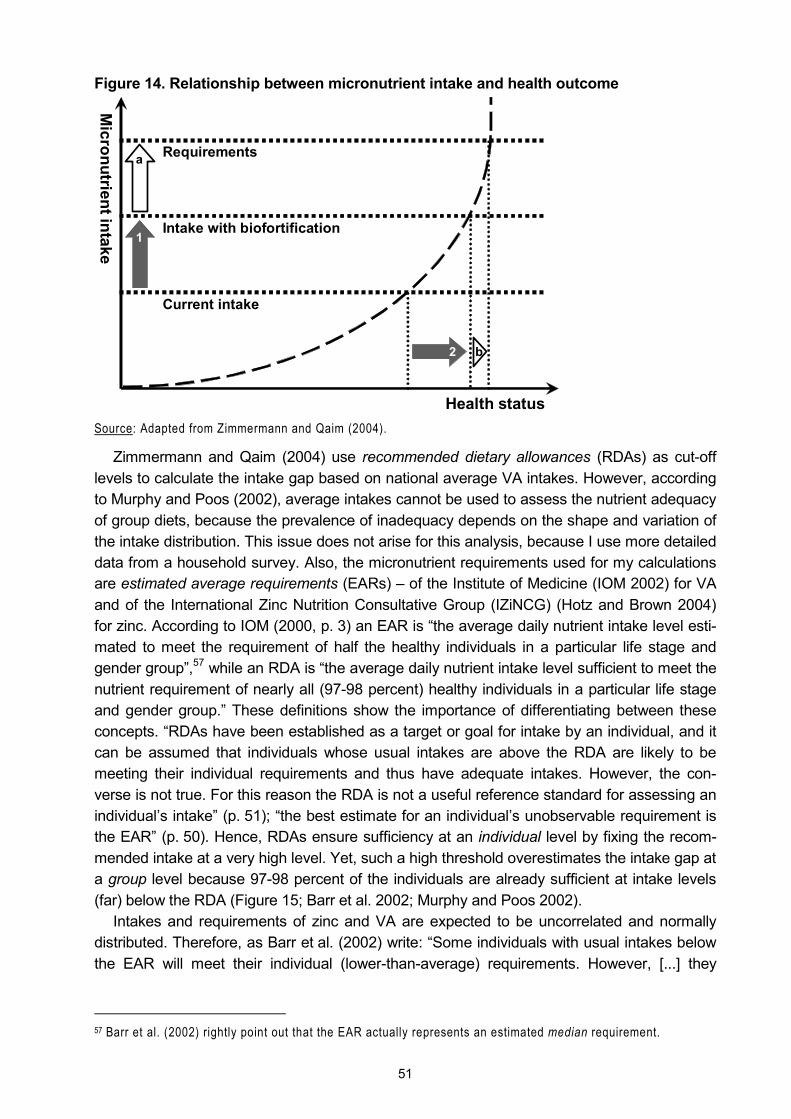
51
Figure 14. Relationship between micronutrient intake and health outcome
Source: Adapted from Zimmermann and Qaim (2004).
Zimmermann and Qaim (2004) use recommended dietary allowances (RDAs) as cut-off levels to calculate the intake gap based on national average VA intakes. However, according to Murphy and Poos (2002), average intakes cannot be used to assess the nutrient adequacy of group diets, because the prevalence of inadequacy depends on the shape and variation of the intake distribution. This issue does not arise for this analysis, because I use more detailed data from a household survey. Also, the micronutrient requirements used for my calculations are estimated average requirements (EARs) � of the Institute of Medicine (IOM 2002) for VA and of the International Zinc Nutrition Consultative Group (IZiNCG) (Hotz and Brown 2004) for zinc. According to IOM (2000, p. 3) an EAR is �the average daily nutrient intake level esti-mated to meet the requirement of half the healthy individuals in a particular life stage and gender group�,57 while an RDA is �the average daily nutrient intake level sufficient to meet the nutrient requirement of nearly all (97-98 percent) healthy individuals in a particular life stage and gender group.� These definitions show the importance of differentiating between these concepts. �RDAs have been established as a target or goal for intake by an individual, and it can be assumed that individuals whose usual intakes are above the RDA are likely to be meeting their individual requirements and thus have adequate intakes. However, the con-verse is not true. For this reason the RDA is not a useful reference standard for assessing an individual�s intake� (p. 51); �the best estimate for an individual�s unobservable requirement is the EAR� (p. 50). Hence, RDAs ensure sufficiency at an individual level by fixing the recom-mended intake at a very high level. Yet, such a high threshold overestimates the intake gap at a group level because 97-98 percent of the individuals are already sufficient at intake levels (far) below the RDA (Figure 15; Barr et al. 2002; Murphy and Poos 2002).
Intakes and requirements of zinc and VA are expected to be uncorrelated and normally distributed. Therefore, as Barr et al. (2002) write: �Some individuals with usual intakes below the EAR will meet their individual (lower-than-average) requirements. However, [...] they
57 Barr et al. (2002) rightly point out that the EAR actually represents an estimated median requirement.
Health status
Micronutrient intake
Requirements
Intake with biofortification
Current intake
1
2
a
b
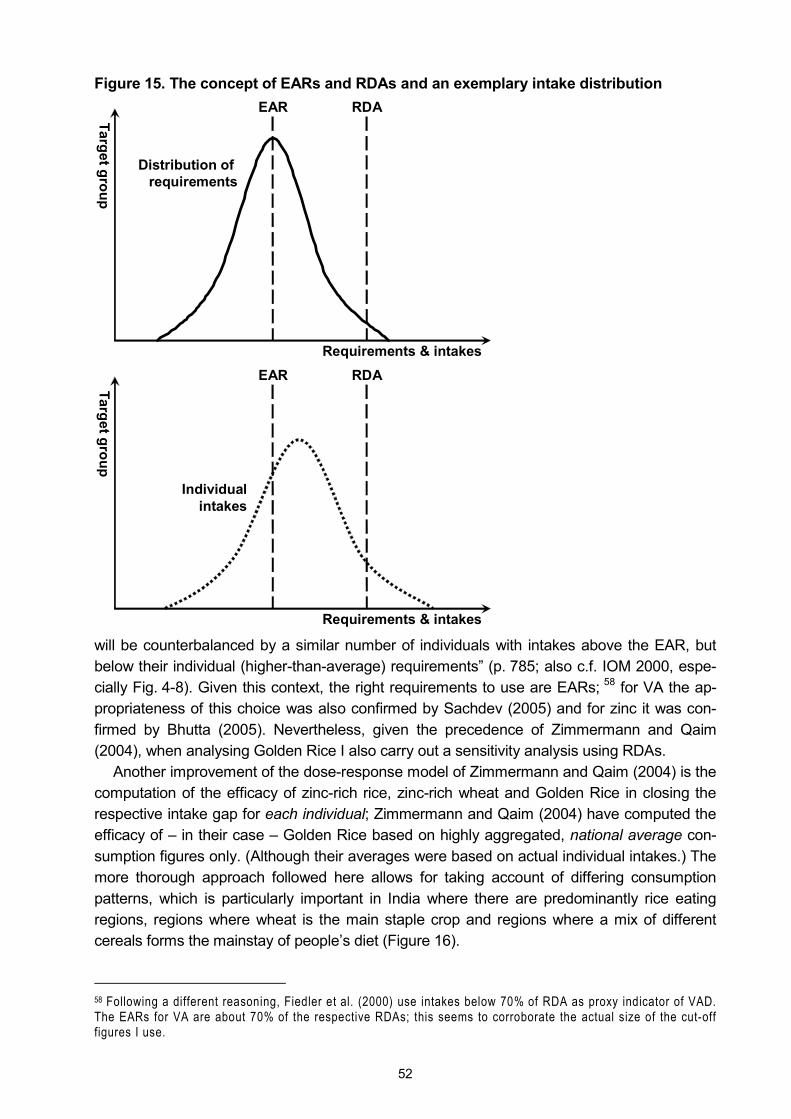
52
Figure 15. The concept of EARs and RDAs and an exemplary intake distribution
will be counterbalanced by a similar number of individuals with intakes above the EAR, but below their individual (higher-than-average) requirements� (p. 785; also c.f. IOM 2000, espe-cially Fig. 4-8). Given this context, the right requirements to use are EARs; 58 for VA the ap-propriateness of this choice was also confirmed by Sachdev (2005) and for zinc it was con-firmed by Bhutta (2005). Nevertheless, given the precedence of Zimmermann and Qaim (2004), when analysing Golden Rice I also carry out a sensitivity analysis using RDAs.
Another improvement of the dose-response model of Zimmermann and Qaim (2004) is the computation of the efficacy of zinc-rich rice, zinc-rich wheat and Golden Rice in closing the respective intake gap for each individual; Zimmermann and Qaim (2004) have computed the efficacy of � in their case � Golden Rice based on highly aggregated, national average con-sumption figures only. (Although their averages were based on actual individual intakes.) The more thorough approach followed here allows for taking account of differing consumption patterns, which is particularly important in India where there are predominantly rice eating regions, regions where wheat is the main staple crop and regions where a mix of different cereals forms the mainstay of people�s diet (Figure 16).
58 Following a different reasoning, Fiedler et al. (2000) use intakes below 70% of RDA as proxy indicator of VAD. The EARs for VA are about 70% of the respective RDAs; this seems to corroborate the actual size of the cut-off figures I use.
Target group
EAR RDA
Requirements & intakes
Distribution of requirements
Target group
EAR RDA
Requirements & intakes
Individualintakes
53
Figure 16. Consumption of cereals in rural areas (kg/capita/month, 1999/2000)
0
2
4
6
8
10
12
14
16
Raj
asth
anP
unja
bH
arya
naD
elhi
Guj
arat
Cha
ndig
arh
Mah
aras
htra
Him
acha
l P.
Utta
r P.
Kar
nata
kaM
adhy
a P
.D
& N
Hav
eli
J &
KBi
har
Goa
Dam
an &
Ker
ala
A &
NTa
mil
Nad
uS
ikki
mLa
kshd
wee
pP
ondi
cher
ryM
egha
laya
And
hra
P.
Ass
amM
izor
amW
est B
enga
lTr
ipur
aA
runa
chal
P.
Nag
alan
dO
rissa
Man
ipur
Rice Wheat Other cereals
Source: NSSO (2001).
Calculating the biofortified crops� efficacy for each individual also prevents variations in the micronutrient intake of individuals to cancel out in the average figure � for example, for a given target group the average consumption of a micronutrient may fulfil requirements, but the intake of one half of the target group may still be 50 percent below requirements while the intakes of the other half are 50 percent above requirements. However, if the overall efficacy is based on individual efficacy ratios, the efficacy of the biofortified crop in closing the intake gap will be zero for all individuals with intakes above requirements; the sufficiency of these indi-viduals cannot �compensate� the deficiency of other individuals in the group. To obtain the overall efficacy of each biofortified crop, I therefore calculated the weighted average of the efficacy ratios across each target group only at the end of the operation.
Once having obtained the global efficacy of a biofortified crop in reducing the intake gap of a target group, this reduction can be applied to the incidence rates of the adverse functional outcomes of the micronutrient deficiency in question. The result of this exercise is a set of incidence (and mortality) rates that can be used in the DALYs formula to calculate the new burden of the deficiency in a scenario in which the biofortified crop is consumed. While this approach might also be used to approximate the impact of iron-rich rice and iron-rich wheat, Murphy et al. (2002) highlight that the distribution of iron requirements is not normal and that iron intakes should not be categorised using RDAs or EARs the same way they can be used for other nutrients. Fortunately, the permanent nature of the health outcomes of IDA and the quality of the prevalence data that is available for anaemia allow for a more precise approach. This is developed and explained under the next heading.
The cumulative distribution of iron intakes The major health outcomes of ZnD and VAD are higher risks of experiencing short-term dis-eases (or mortality). When associating the health outcomes to the respective deficiency the starting points for the analyses are the incidence rates of the health outcomes � of which a certain share is then attributed to the deficiency. In the case of IDA, the major health out-comes are considered to be permanent and the starting point for associating health outcomes
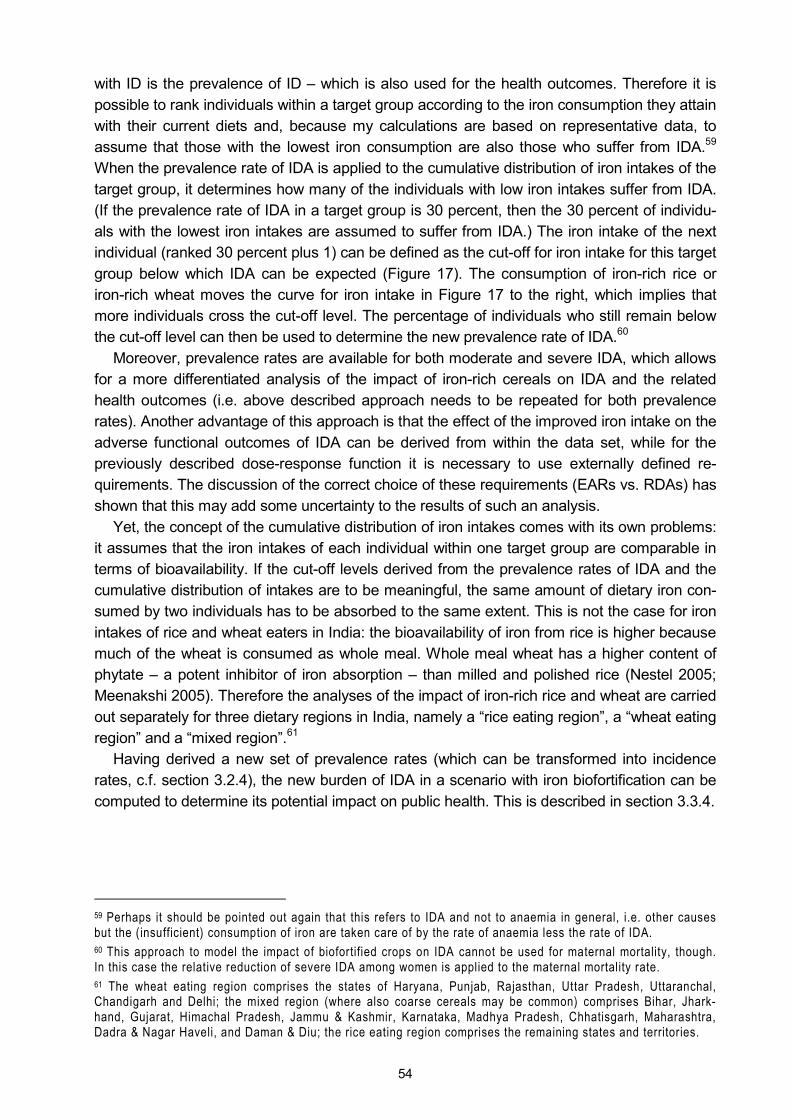
54
with ID is the prevalence of ID � which is also used for the health outcomes. Therefore it is possible to rank individuals within a target group according to the iron consumption they attain with their current diets and, because my calculations are based on representative data, to assume that those with the lowest iron consumption are also those who suffer from IDA.59 When the prevalence rate of IDA is applied to the cumulative distribution of iron intakes of the target group, it determines how many of the individuals with low iron intakes suffer from IDA. (If the prevalence rate of IDA in a target group is 30 percent, then the 30 percent of individu-als with the lowest iron intakes are assumed to suffer from IDA.) The iron intake of the next individual (ranked 30 percent plus 1) can be defined as the cut-off for iron intake for this target group below which IDA can be expected (Figure 17). The consumption of iron-rich rice or iron-rich wheat moves the curve for iron intake in Figure 17 to the right, which implies that more individuals cross the cut-off level. The percentage of individuals who still remain below the cut-off level can then be used to determine the new prevalence rate of IDA.60
Moreover, prevalence rates are available for both moderate and severe IDA, which allows for a more differentiated analysis of the impact of iron-rich cereals on IDA and the related health outcomes (i.e. above described approach needs to be repeated for both prevalence rates). Another advantage of this approach is that the effect of the improved iron intake on the adverse functional outcomes of IDA can be derived from within the data set, while for the previously described dose-response function it is necessary to use externally defined re-quirements. The discussion of the correct choice of these requirements (EARs vs. RDAs) has shown that this may add some uncertainty to the results of such an analysis.
Yet, the concept of the cumulative distribution of iron intakes comes with its own problems: it assumes that the iron intakes of each individual within one target group are comparable in terms of bioavailability. If the cut-off levels derived from the prevalence rates of IDA and the cumulative distribution of intakes are to be meaningful, the same amount of dietary iron con-sumed by two individuals has to be absorbed to the same extent. This is not the case for iron intakes of rice and wheat eaters in India: the bioavailability of iron from rice is higher because much of the wheat is consumed as whole meal. Whole meal wheat has a higher content of phytate � a potent inhibitor of iron absorption � than milled and polished rice (Nestel 2005; Meenakshi 2005). Therefore the analyses of the impact of iron-rich rice and wheat are carried out separately for three dietary regions in India, namely a �rice eating region�, a �wheat eating region� and a �mixed region�.61
Having derived a new set of prevalence rates (which can be transformed into incidence rates, c.f. section 3.2.4), the new burden of IDA in a scenario with iron biofortification can be computed to determine its potential impact on public health. This is described in section 3.3.4.
59 Perhaps it should be pointed out again that this refers to IDA and not to anaemia in general, i.e. other causes but the (insufficient) consumption of iron are taken care of by the rate of anaemia less the rate of IDA. 60 This approach to model the impact of biofortified crops on IDA cannot be used for maternal mortality, though. In this case the relative reduction of severe IDA among women is applied to the maternal mortality rate. 61 The wheat eating region comprises the states of Haryana, Punjab, Rajasthan, Uttar Pradesh, Uttaranchal, Chandigarh and Delhi; the mixed region (where also coarse cereals may be common) comprises Bihar, Jhark-hand, Gujarat, Himachal Pradesh, Jammu & Kashmir, Karnataka, Madhya Pradesh, Chhatisgarh, Maharashtra, Dadra & Nagar Haveli, and Daman & Diu; the rice eating region comprises the remaining states and territories.

55
Figure 17. Cumulative distribution of iron intakes and the prevalence of IDA
3.3.4 Determining the reduction in the burden of IDA, ZnD and VAD
Once having obtained new incidence rates for the different health outcomes of IDA, ZnD and VAD for the different �with biofortification� scenarios, these incidence rates can be used to calculate the number of DALYs lost in each scenario. The difference between the burden of a micronutrient deficiency in the status quo and the new burden represents the impact of the respective biofortified crop:
(8) newMnD
oldMnDcrop DALYsDALYsIM −=
where
cropIM = Impact of the biofortified crop oldMnDDALYs = DALYs lost in the status quo due to the MN deficiency newMnDDALYs = DALYs lost when the biofortified crop is consumed
Improved intakewith biofortification
Cut-off level
Reduced prevalence rate
Iron intake
Individualsin target group
100%
Individualsin target group
Current intake
Cut-off level
Current prevalence rate
Iron intake
100%
of IDA in target group
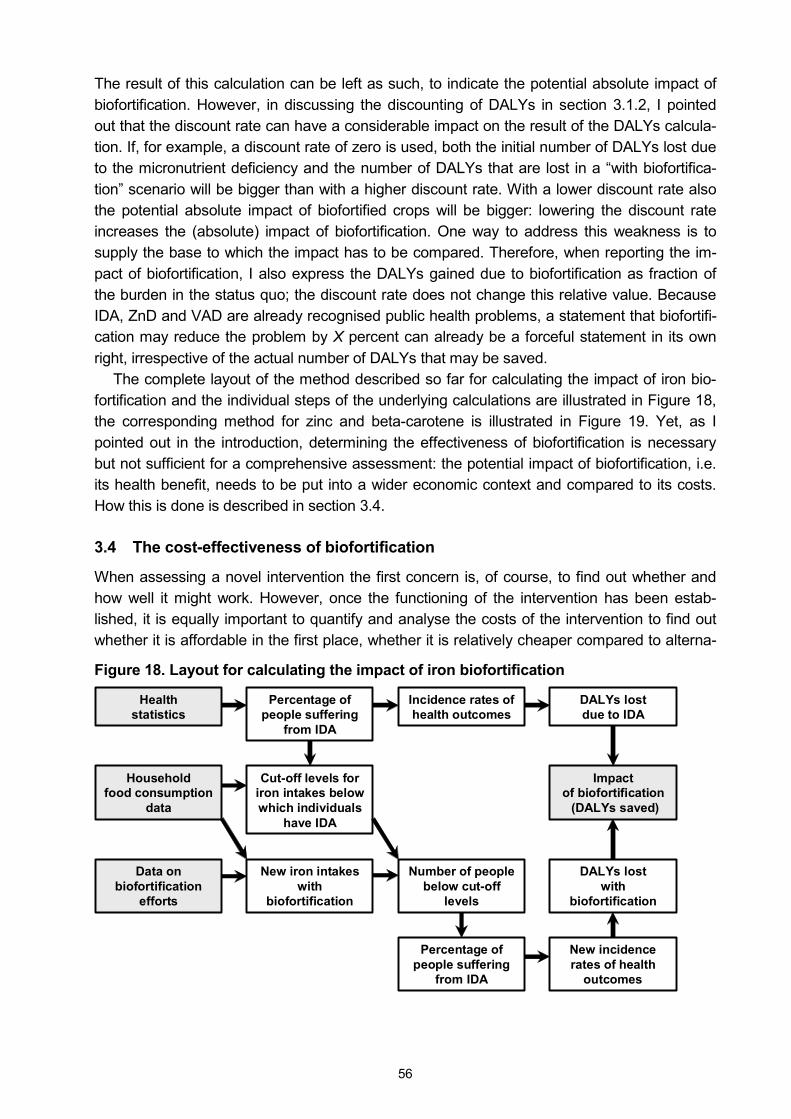
56
The result of this calculation can be left as such, to indicate the potential absolute impact of biofortification. However, in discussing the discounting of DALYs in section 3.1.2, I pointed out that the discount rate can have a considerable impact on the result of the DALYs calcula-tion. If, for example, a discount rate of zero is used, both the initial number of DALYs lost due to the micronutrient deficiency and the number of DALYs that are lost in a �with biofortifica-tion� scenario will be bigger than with a higher discount rate. With a lower discount rate also the potential absolute impact of biofortified crops will be bigger: lowering the discount rate increases the (absolute) impact of biofortification. One way to address this weakness is to supply the base to which the impact has to be compared. Therefore, when reporting the im-pact of biofortification, I also express the DALYs gained due to biofortification as fraction of the burden in the status quo; the discount rate does not change this relative value. Because IDA, ZnD and VAD are already recognised public health problems, a statement that biofortifi-cation may reduce the problem by X percent can already be a forceful statement in its own right, irrespective of the actual number of DALYs that may be saved.
The complete layout of the method described so far for calculating the impact of iron bio-fortification and the individual steps of the underlying calculations are illustrated in Figure 18, the corresponding method for zinc and beta-carotene is illustrated in Figure 19. Yet, as I pointed out in the introduction, determining the effectiveness of biofortification is necessary but not sufficient for a comprehensive assessment: the potential impact of biofortification, i.e. its health benefit, needs to be put into a wider economic context and compared to its costs. How this is done is described in section 3.4.
3.4 The cost-effectiveness of biofortification
When assessing a novel intervention the first concern is, of course, to find out whether and how well it might work. However, once the functioning of the intervention has been estab-lished, it is equally important to quantify and analyse the costs of the intervention to find out whether it is affordable in the first place, whether it is relatively cheaper compared to alterna-
Figure 18. Layout for calculating the impact of iron biofortification
Health statistics
Incidence rates of health outcomes
DALYs lost due to IDA
Household food consumption
data
Percentage of people suffering
from IDA
Cut-off levels for iron intakes below which individuals
have IDA
New iron intakes with
biofortification
Number of people below cut-off
levels
New incidence rates of health
outcomes
DALYs lost with
biofortification
Impact of biofortification
(DALYs saved)
Data on biofortification
efforts
Percentage of people suffering
from IDA
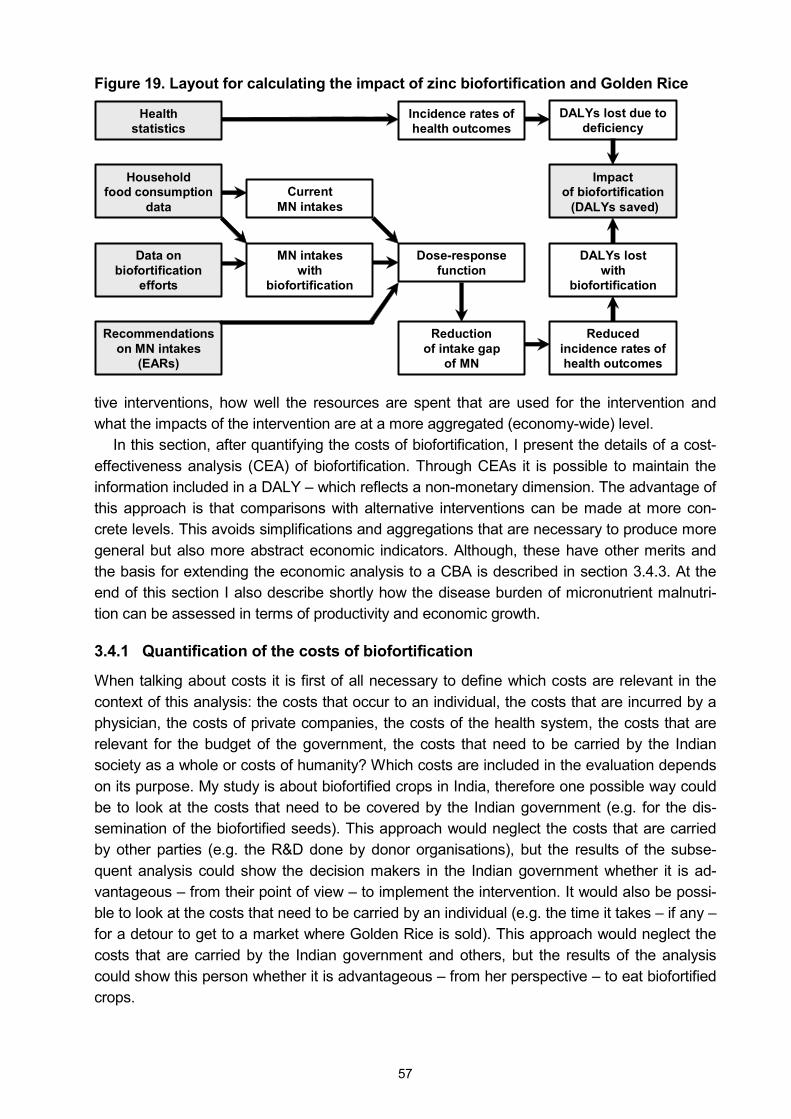
57
Figure 19. Layout for calculating the impact of zinc biofortification and Golden Rice
tive interventions, how well the resources are spent that are used for the intervention and what the impacts of the intervention are at a more aggregated (economy-wide) level.
In this section, after quantifying the costs of biofortification, I present the details of a cost-effectiveness analysis (CEA) of biofortification. Through CEAs it is possible to maintain the information included in a DALY � which reflects a non-monetary dimension. The advantage of this approach is that comparisons with alternative interventions can be made at more con-crete levels. This avoids simplifications and aggregations that are necessary to produce more general but also more abstract economic indicators. Although, these have other merits and the basis for extending the economic analysis to a CBA is described in section 3.4.3. At the end of this section I also describe shortly how the disease burden of micronutrient malnutri-tion can be assessed in terms of productivity and economic growth.
3.4.1 Quantification of the costs of biofortification
When talking about costs it is first of all necessary to define which costs are relevant in the context of this analysis: the costs that occur to an individual, the costs that are incurred by a physician, the costs of private companies, the costs of the health system, the costs that are relevant for the budget of the government, the costs that need to be carried by the Indian society as a whole or costs of humanity? Which costs are included in the evaluation depends on its purpose. My study is about biofortified crops in India, therefore one possible way could be to look at the costs that need to be covered by the Indian government (e.g. for the dis-semination of the biofortified seeds). This approach would neglect the costs that are carried by other parties (e.g. the R&D done by donor organisations), but the results of the subse-quent analysis could show the decision makers in the Indian government whether it is ad-vantageous � from their point of view � to implement the intervention. It would also be possi-ble to look at the costs that need to be carried by an individual (e.g. the time it takes � if any � for a detour to get to a market where Golden Rice is sold). This approach would neglect the costs that are carried by the Indian government and others, but the results of the analysis could show this person whether it is advantageous � from her perspective � to eat biofortified crops.
Health statistics
Incidence rates of health outcomes
DALYs lost due to deficiency
Household food consumption
dataCurrent
MN intakes
MN intakes with
biofortification
Dose-response function
Reduced incidence rates of health outcomes
DALYs lost with
biofortification
Impact of biofortification
(DALYs saved)
Data on biofortification
efforts
Reduction of intake gap
of MN
Recommendations on MN intakes
(EARs)
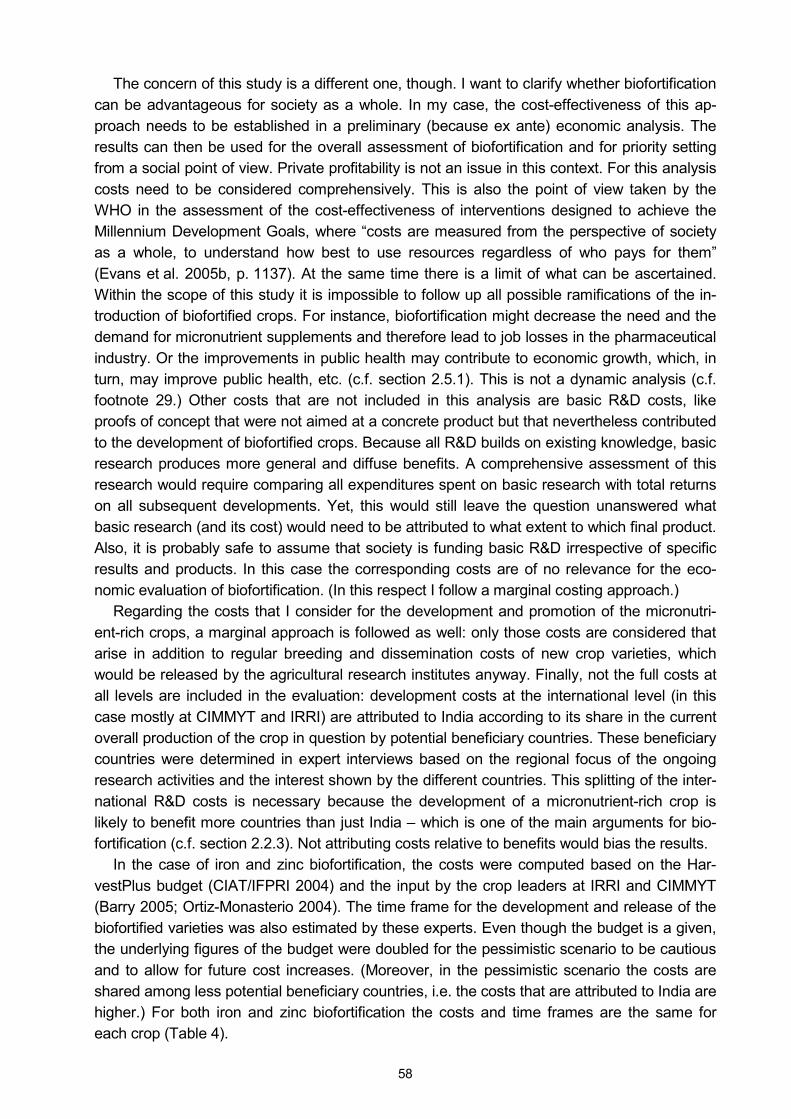
58
The concern of this study is a different one, though. I want to clarify whether biofortification can be advantageous for society as a whole. In my case, the cost-effectiveness of this ap-proach needs to be established in a preliminary (because ex ante) economic analysis. The results can then be used for the overall assessment of biofortification and for priority setting from a social point of view. Private profitability is not an issue in this context. For this analysis costs need to be considered comprehensively. This is also the point of view taken by the WHO in the assessment of the cost-effectiveness of interventions designed to achieve the Millennium Development Goals, where �costs are measured from the perspective of society as a whole, to understand how best to use resources regardless of who pays for them� (Evans et al. 2005b, p. 1137). At the same time there is a limit of what can be ascertained. Within the scope of this study it is impossible to follow up all possible ramifications of the in-troduction of biofortified crops. For instance, biofortification might decrease the need and the demand for micronutrient supplements and therefore lead to job losses in the pharmaceutical industry. Or the improvements in public health may contribute to economic growth, which, in turn, may improve public health, etc. (c.f. section 2.5.1). This is not a dynamic analysis (c.f. footnote 29.) Other costs that are not included in this analysis are basic R&D costs, like proofs of concept that were not aimed at a concrete product but that nevertheless contributed to the development of biofortified crops. Because all R&D builds on existing knowledge, basic research produces more general and diffuse benefits. A comprehensive assessment of this research would require comparing all expenditures spent on basic research with total returns on all subsequent developments. Yet, this would still leave the question unanswered what basic research (and its cost) would need to be attributed to what extent to which final product. Also, it is probably safe to assume that society is funding basic R&D irrespective of specific results and products. In this case the corresponding costs are of no relevance for the eco-nomic evaluation of biofortification. (In this respect I follow a marginal costing approach.)
Regarding the costs that I consider for the development and promotion of the micronutri-ent-rich crops, a marginal approach is followed as well: only those costs are considered that arise in addition to regular breeding and dissemination costs of new crop varieties, which would be released by the agricultural research institutes anyway. Finally, not the full costs at all levels are included in the evaluation: development costs at the international level (in this case mostly at CIMMYT and IRRI) are attributed to India according to its share in the current overall production of the crop in question by potential beneficiary countries. These beneficiary countries were determined in expert interviews based on the regional focus of the ongoing research activities and the interest shown by the different countries. This splitting of the inter-national R&D costs is necessary because the development of a micronutrient-rich crop is likely to benefit more countries than just India � which is one of the main arguments for bio-fortification (c.f. section 2.2.3). Not attributing costs relative to benefits would bias the results.
In the case of iron and zinc biofortification, the costs were computed based on the Har-vestPlus budget (CIAT/IFPRI 2004) and the input by the crop leaders at IRRI and CIMMYT (Barry 2005; Ortiz-Monasterio 2004). The time frame for the development and release of the biofortified varieties was also estimated by these experts. Even though the budget is a given, the underlying figures of the budget were doubled for the pessimistic scenario to be cautious and to allow for future cost increases. (Moreover, in the pessimistic scenario the costs are shared among less potential beneficiary countries, i.e. the costs that are attributed to India are higher.) For both iron and zinc biofortification the costs and time frames are the same for each crop (Table 4).

59
Table 4. Costs and time frame of biofortification with either iron or zinc
Crop Rice Wheat
Scenario Pessimistic Optimistic Pessimistic Optimistic
Average annual costs
India�s share of internat. R&Da,b US$ 1.1 m US$ 0.2 m US$ 1.1 m US$ 0.3 m
Country-specific activitiesc US$ 0.8 m US$ 0.5 m US$ 0.8 m US$ 0.5 m
Maintenance breeding US$ 0.2 m US$ 0.1 m US$ 0.2 m US$ 0.1 m
Duration
International R&Da 8 years 6 years 9 years 7 years
Country-specific activitiesc 5 years 3 years 7 years 5 years
Maintenance breeding Remainder of the 30 year periodd
Total cost for 30 years in base year (discounted at 3%) US$ 12.6 m US$ 3.5 m US$ 13.8 m US$ 4.5 m
Average annual cost US$ 0.42 m US$ 0.12 m US$ 0.46 m US$ 0.15 m
Average annual cost without international R&D costs US$ 0.16 m US$ 0.08 m US$ 0.18 m US$ 0.10 m
Notes: aInternational R&D comprises screening, breeding, testing and release of the advanced lines. bIndia�s share of international R&D for rice corresponds to its share in overall rice production of the target countries of biofortified rice: (i) for the pessimistic scenario Bangladesh, India and the Philippines (India�s share is 70.5 per-cent) and (ii) for the optimistic scenario Bangladesh, China, India Indonesia, the Philippines and Vietnam (India�s share is 27.5 percent). India�s share of international R&D for wheat corresponds to its share in overall wheat pro-duction of the target countries: (i) for the pessimistic scenario India and Pakistan (India�s share is 78.5 percent) and (ii) for the optimistic scenario China, India and Pakistan (India�s share is 39.3 percent). The production shares are based on FAO (2004b). cCountry-specific activities include adaptive breeding, dissemination and ex-tension activities. d30 years is the time period used for the analysis. Source: CIAT/IFPRI (2004), Barry (2005) and Ortiz-Monasterio (2004).
To establish the costs for Golden Rice is less straightforward because more research in-stitutes are involved and more (parallel) activities are necessary to get the rice to the con-sumers: because it is a GM crop Golden Rice has to pass regulation and because of its yel-low colour additional social marketing activities are necessary. At the same time Golden Rice is already at a more advanced stage than any of the other biofortified cereals. Therefore there is less uncertainty regarding costs and time frame, which is reflected in lower mark-ups for the pessimistic scenario. The costs that have to be incurred for Golden Rice can be divided into five categories: (i) R&D costs that are incurred at the international level, (ii) breeding costs within India, (iii) regulatory costs that need to be incurred prior to the release of Golden Rice, (iv) social marketing costs that need to be incurred to promote and popularise Golden Rice and (v) costs for maintenance breeding (Table 5). As for iron and zinc biofortification, the overall time horizon for the analysis is set at 30 years because this is deemed a sensible time frame for the life-cycle of such an agricultural intervention (and after 30 years the effects of discounting are diminishing both costs and potential benefits considerably anyway).
3.4.2 Carrying out a cost-effectiveness analysis
Having established total costs, they need to be discounted to a base year (c.f. Figure 11). Moreover, to become comparable to the costs of alternative interventions, the issue of infla-tionary adjustment becomes relevant prior to making any comparisons if results originate from different years (Kumaranayake 2000). For such inflationary adjustments I use BLS (2005).
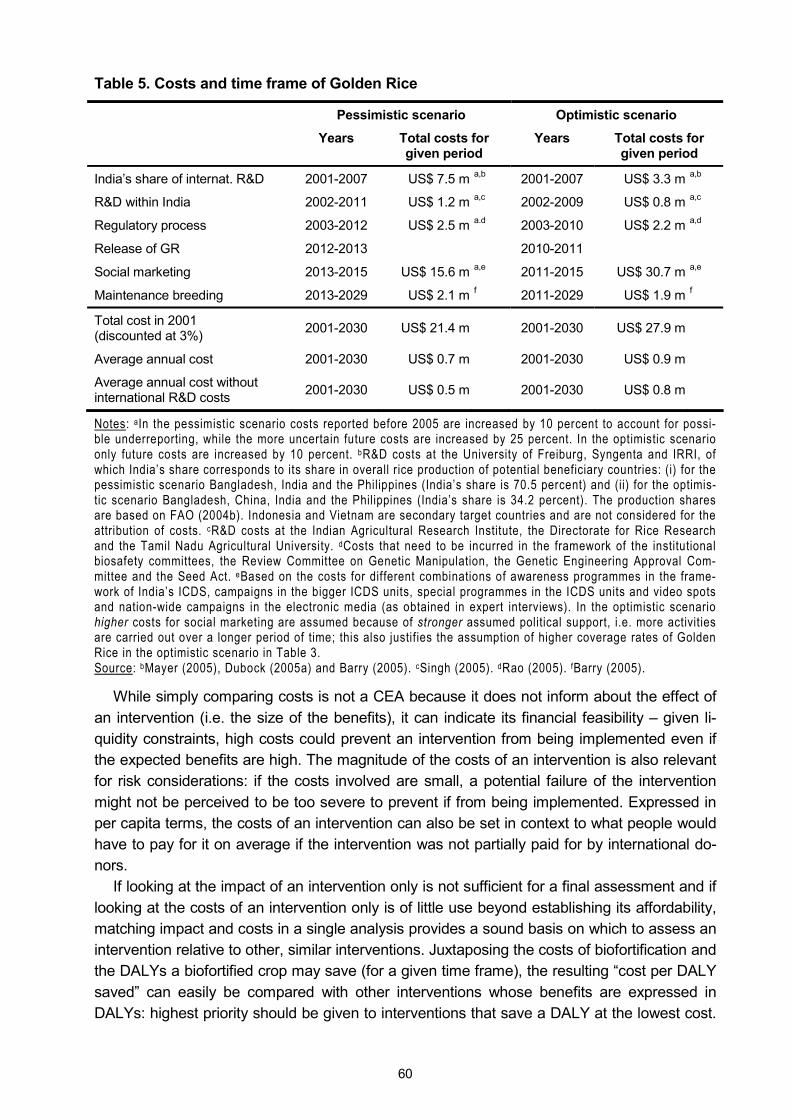
60
Table 5. Costs and time frame of Golden Rice
Pessimistic scenario Optimistic scenario
Years Total costs for given period
Years Total costs for given period
India�s share of internat. R&D 2001-2007 US$ 7.5 m a,b 2001-2007 US$ 3.3 m a,b
R&D within India 2002-2011 US$ 1.2 m a,c 2002-2009 US$ 0.8 m a,c
Regulatory process 2003-2012 US$ 2.5 m a.d 2003-2010 US$ 2.2 m a,d
Release of GR 2012-2013 2010-2011
Social marketing 2013-2015 US$ 15.6 m a,e 2011-2015 US$ 30.7 m a,e
Maintenance breeding 2013-2029 US$ 2.1 m f 2011-2029 US$ 1.9 m f
Total cost in 2001 (discounted at 3%) 2001-2030 US$ 21.4 m 2001-2030 US$ 27.9 m
Average annual cost 2001-2030 US$ 0.7 m 2001-2030 US$ 0.9 m
Average annual cost without international R&D costs 2001-2030 US$ 0.5 m 2001-2030 US$ 0.8 m
Notes: aIn the pessimistic scenario costs reported before 2005 are increased by 10 percent to account for possi-ble underreporting, while the more uncertain future costs are increased by 25 percent. In the optimistic scenario only future costs are increased by 10 percent. bR&D costs at the University of Freiburg, Syngenta and IRRI, of which India�s share corresponds to its share in overall rice production of potential beneficiary countries: (i) for the pessimistic scenario Bangladesh, India and the Philippines (India�s share is 70.5 percent) and (ii) for the optimis-tic scenario Bangladesh, China, India and the Philippines (India�s share is 34.2 percent). The production shares are based on FAO (2004b). Indonesia and Vietnam are secondary target countries and are not considered for the attribution of costs. cR&D costs at the Indian Agricultural Research Institute, the Directorate for Rice Research and the Tamil Nadu Agricultural University. dCosts that need to be incurred in the framework of the institutional biosafety committees, the Review Committee on Genetic Manipulation, the Genetic Engineering Approval Com-mittee and the Seed Act. eBased on the costs for different combinations of awareness programmes in the frame-work of India�s ICDS, campaigns in the bigger ICDS units, special programmes in the ICDS units and video spots and nation-wide campaigns in the electronic media (as obtained in expert interviews). In the optimistic scenario higher costs for social marketing are assumed because of stronger assumed political support, i.e. more activities are carried out over a longer period of time; this also justifies the assumption of higher coverage rates of Golden Rice in the optimistic scenario in Table 3. Source: bMayer (2005), Dubock (2005a) and Barry (2005). cSingh (2005). dRao (2005). fBarry (2005).
While simply comparing costs is not a CEA because it does not inform about the effect of an intervention (i.e. the size of the benefits), it can indicate its financial feasibility � given li-quidity constraints, high costs could prevent an intervention from being implemented even if the expected benefits are high. The magnitude of the costs of an intervention is also relevant for risk considerations: if the costs involved are small, a potential failure of the intervention might not be perceived to be too severe to prevent if from being implemented. Expressed in per capita terms, the costs of an intervention can also be set in context to what people would have to pay for it on average if the intervention was not partially paid for by international do-nors.
If looking at the impact of an intervention only is not sufficient for a final assessment and if looking at the costs of an intervention only is of little use beyond establishing its affordability, matching impact and costs in a single analysis provides a sound basis on which to assess an intervention relative to other, similar interventions. Juxtaposing the costs of biofortification and the DALYs a biofortified crop may save (for a given time frame), the resulting �cost per DALY saved� can easily be compared with other interventions whose benefits are expressed in DALYs: highest priority should be given to interventions that save a DALY at the lowest cost.
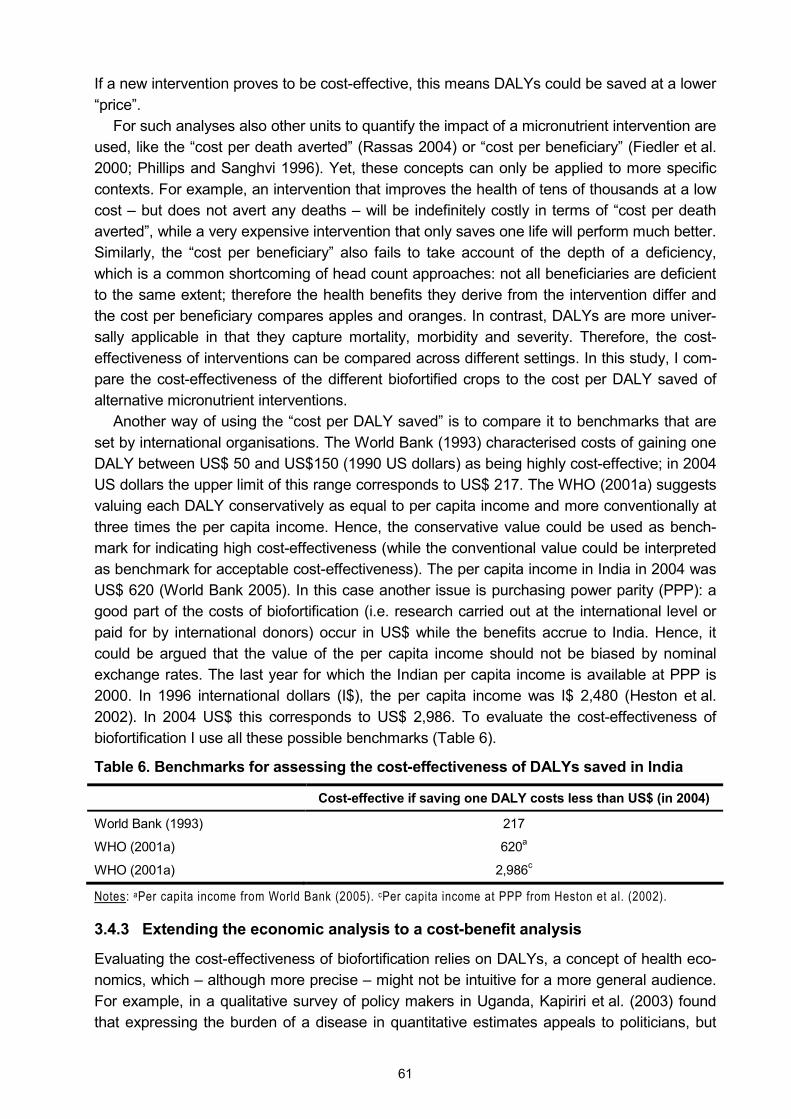
61
If a new intervention proves to be cost-effective, this means DALYs could be saved at a lower �price�.
For such analyses also other units to quantify the impact of a micronutrient intervention are used, like the �cost per death averted� (Rassas 2004) or �cost per beneficiary� (Fiedler et al. 2000; Phillips and Sanghvi 1996). Yet, these concepts can only be applied to more specific contexts. For example, an intervention that improves the health of tens of thousands at a low cost � but does not avert any deaths � will be indefinitely costly in terms of �cost per death averted�, while a very expensive intervention that only saves one life will perform much better. Similarly, the �cost per beneficiary� also fails to take account of the depth of a deficiency, which is a common shortcoming of head count approaches: not all beneficiaries are deficient to the same extent; therefore the health benefits they derive from the intervention differ and the cost per beneficiary compares apples and oranges. In contrast, DALYs are more univer-sally applicable in that they capture mortality, morbidity and severity. Therefore, the cost-effectiveness of interventions can be compared across different settings. In this study, I com-pare the cost-effectiveness of the different biofortified crops to the cost per DALY saved of alternative micronutrient interventions.
Another way of using the �cost per DALY saved� is to compare it to benchmarks that are set by international organisations. The World Bank (1993) characterised costs of gaining one DALY between US$ 50 and US$150 (1990 US dollars) as being highly cost-effective; in 2004 US dollars the upper limit of this range corresponds to US$ 217. The WHO (2001a) suggests valuing each DALY conservatively as equal to per capita income and more conventionally at three times the per capita income. Hence, the conservative value could be used as bench-mark for indicating high cost-effectiveness (while the conventional value could be interpreted as benchmark for acceptable cost-effectiveness). The per capita income in India in 2004 was US$ 620 (World Bank 2005). In this case another issue is purchasing power parity (PPP): a good part of the costs of biofortification (i.e. research carried out at the international level or paid for by international donors) occur in US$ while the benefits accrue to India. Hence, it could be argued that the value of the per capita income should not be biased by nominal exchange rates. The last year for which the Indian per capita income is available at PPP is 2000. In 1996 international dollars (I$), the per capita income was I$ 2,480 (Heston et al. 2002). In 2004 US$ this corresponds to US$ 2,986. To evaluate the cost-effectiveness of biofortification I use all these possible benchmarks (Table 6).
Table 6. Benchmarks for assessing the cost-effectiveness of DALYs saved in India
Cost-effective if saving one DALY costs less than US$ (in 2004)
World Bank (1993) 217
WHO (2001a) 620a
WHO (2001a) 2,986c
Notes: aPer capita income from World Bank (2005). cPer capita income at PPP from Heston et al. (2002).
3.4.3 Extending the economic analysis to a cost-benefit analysis
Evaluating the cost-effectiveness of biofortification relies on DALYs, a concept of health eco-nomics, which � although more precise � might not be intuitive for a more general audience. For example, in a qualitative survey of policy makers in Uganda, Kapiriri et al. (2003) found that expressing the burden of a disease in quantitative estimates appeals to politicians, but
62
the concept of DALYs itself was poorly understood. Similarly, Yip (2002, p. S804) notes: �Most policy makers who shape decisions on funding and commitment to health programs do not have nutrition or health backgrounds. More likely, these policy leaders are versed in eco-nomics. For this reason, putting the principle argument in economic terms, rather than health or nutritional terms, may prove to be more useful to this particular audience�. But putting health benefits into economic terms may also appeal to health professionals, as Rosenberg (2002, p. 371) relates: �I was stunned by these results [of estimations of the return on medical research investments]. I knew, of course, that research had given us longer and more pro-ductive lives. But I was always taught to consider these outcomes as incalculable. To have an economic value put on our national investment and to find that it was so large was surprising and exhilarating.� Hence, it seems to be expedient to include a purely economic analysis of biofortification in my study. This also enables comparing the investments that are necessary for the development and dissemination of the different biofortified crops with interventions that are not or cannot be measured in DALYs.
Popular indicators in CBAs are the internal rate of return (IRR) and the benefit-cost ratio (BCR). While money on the bank earns an annual interest rate, the IRR is the �interest rate� the money earns on average each year if it is invested in a project. The BCR reflects how many times the original investment in a project pays off in total. Gittinger (1982, p. 329-346) describes this more comprehensively:
�The discount rate that makes the net present worth of the incremental net benefit stream or incre-mental cash flow equal zero [...] is called the IRR. It is the maximum interest that a project could pay for the resources used if the project is to recover its investment and operating costs and still break even [...] The IRR is a very useful measure of project worth. It is the measure the World Bank uses for practically all its economic and financial analyses of projects and the measure used by most other international financing agencies [...] The formal selection criterion for the IRR measure of project worth is to accept all independent projects having an IRR equal to or greater than the opportunity cost of capital [...] The BCR [...] is the ratio obtained when the present worth of the benefit stream is divided by the present worth of the cost stream [...] Note that the absolute value of the BCR will vary depending on the interest rate chosen. The higher the interest rate, the smaller the resultant BCR, and, if a high enough rate is chosen, the BCR will be driven down to less than 1 [...] One convenience of the BCR is that it can be used directly to note how much costs could rise without making the project economically unattractive [...] Although in practice projects with higher BCR are often regarded as being preferable (other things being equal), ranking by BCR can lead to an erroneous investment choice. The BCR discriminates against projects with relatively high gross returns and operating costs, even though these may be shown to have a greater wealth-generating capacity that that of alternatives with a higher BCR.�
Gittinger (1982, p. 329) also indicates the limits of the net present value (NPV, or net present worth), another popular indicator, when he writes: �No ranking of acceptable, alternative inde-pendent projects is possible with the net present worth criterion because it is an absolute, not relative measure. A small, highly attractive project may have a smaller net present worth than a large, marginally acceptable project.�
Having recourse to such economic indicators overcomes a major limitation of CEAs, namely that all benefits in CEAs need to be quantified in a given, often context-specific unit. Economic indicators can be used for comparisons across a much wider spectrum. Also, CEAs are necessarily relative, i.e. the information that saving a DALY costs US$ X is not very useful without a reference value. When recipients of the information simply judge whether US$ X is a good �price� for one DALY, this is already a first step towards a CBA: in this kind of analyses the most crucial difference to CEAs is the necessary monetary valuation of

63
DALYs. (Costs and benefits can only be offset if they are expressed in monetary terms). Hence, a CEA may simply push the pricing problem on to the decision maker (Kuchler and Golan 1999).
While the very beauty of DALYs and CEAs resides in avoiding putting a monetary value to human life and health,62 the aforementioned reasons warrant a departure from these con-cepts. Yet, if carrying out a CBA requires attaching a monetary value to one DALY, this does not mean to value life as such; it is merely a pragmatic approach to be able to assess, com-pare and prioritise interventions that involve human life and health on the basis of (to some) more familiar economic indicators. The dilemma of accepting the need to value human life to be able to generate information that may be used to make more efficient investments in health is described by Harberger and Jenkins (2002, p. xlvii):
�From the dawn of modern cost-benefit analysis to the present day, professionals in this field have struggled with the ultimate imponderable � the value of human life � and its close relative, the value of improvements in human health. It is probably fair to say that most analysts have grasped at any plausible excuse to avoid dealing with this problem �in public�. However understandable this attitude may be, it remains demonstrably true that a wide variety of public actions (a) have the ef-fect of saving human lives and (b) also carry a cost (explicit or implicit) of doing so. [...] Standard economic thinking tends to drive one in the direction of saying, cut back on the expensive ways, and push forward on the cheaper ways of saving lives. This should end up saving more lives at the same cost, and getting the strongest life-saving results from any increment of costs society is willing to bear.�
However, as described above, one may argue that a CBA is only an extension of a CEA: while it would be desirable to save all DALYs that can potentially be saved worldwide, this misses reality as it exceeds the economic capacities of society. (As Viscusi (1993, p. 1912) writes: �Health and safety risks comprise one aspect of our lives that we would all like to eliminate. Even if we set out to provide a risk-free existence, however, our efforts would be constrained by our economic resources.�) Therefore, it seems reasonable to attach a value to one DALY that reflects the economic possibilities of the countries in question or the economic benefit that saving one DALY may generate subsequently. This is the approach suggested by the WHO (2001a) and described in section 3.4.2 to determine a benchmark for evaluating DALY-based CEAs. One shortcoming of this approach is limited international comparability: because each country has a different per capita income, ceteris paribus, interventions would always pay off more in richer countries where saving one DALY would bring a bigger mone-tary benefit. This may not be justifiable on ethical and equity grounds. One solution to this problem is to use standardised values for one DALY. In the context of developing countries� per capita incomes, values of US$ 500-1,000 per DALY look plausible and have been used more recently: Rijsberman (2004) used US$ 500 and Collier and Hoeffler (2004) used US$ 1,000. Mills and Shillcutt (2004) use the mean per capita income in low and middle income countries as standard to value one DALY.
A rather different approach is based on value of life estimates like �values of a statistical life� (VSL) and �values of a statistical injury�, which are ultimately founded in people�s WTP for incremental reductions in their risk of dying or of suffering a non-fatal injury. Often the esti-mates are also based on studies that investigate people�s willingness to accept a higher risk of having an accident or of dying if they earn higher wages. VSL, which focus on mortality 62 See chapter 3.1. Similarly, Garber and Phelps (1997, p. 2) write about CEAs using Quality Adjusted Life Years (a predecessor of DALYs): �Many physicians and others who perform CEA prefer it to CBA because it does not require placing a dollar value on a health outcome.�
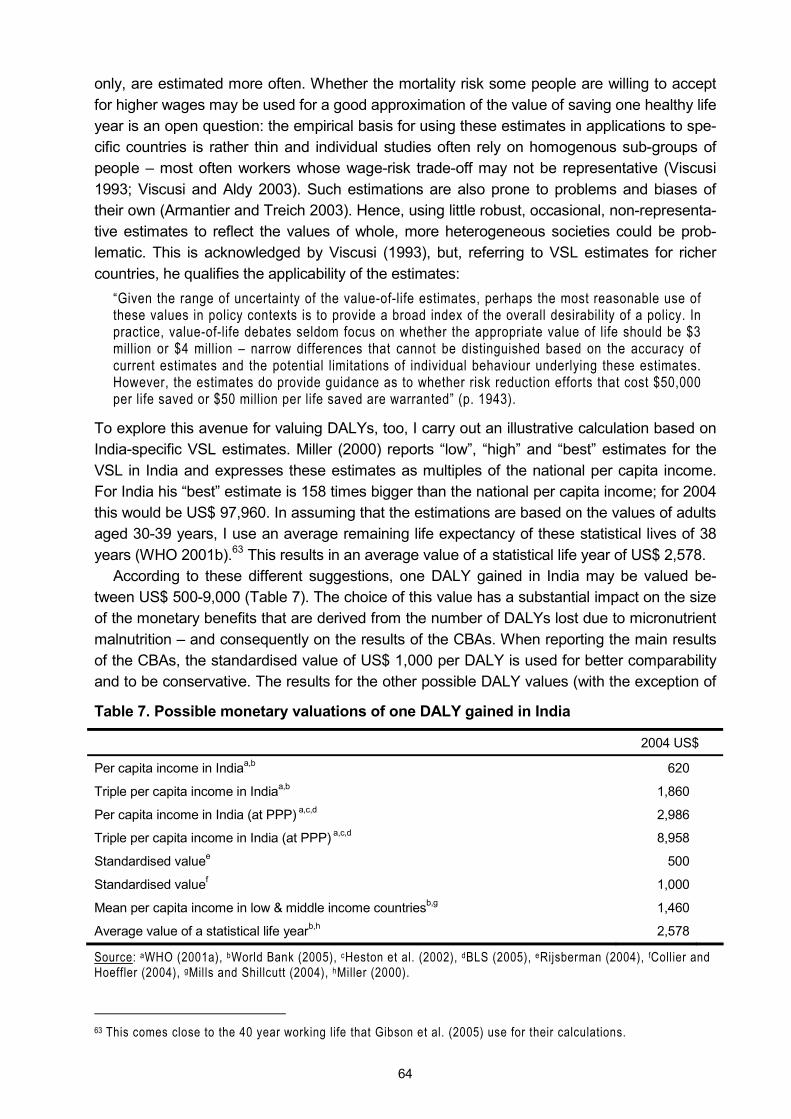
64
only, are estimated more often. Whether the mortality risk some people are willing to accept for higher wages may be used for a good approximation of the value of saving one healthy life year is an open question: the empirical basis for using these estimates in applications to spe-cific countries is rather thin and individual studies often rely on homogenous sub-groups of people � most often workers whose wage-risk trade-off may not be representative (Viscusi 1993; Viscusi and Aldy 2003). Such estimations are also prone to problems and biases of their own (Armantier and Treich 2003). Hence, using little robust, occasional, non-representa-tive estimates to reflect the values of whole, more heterogeneous societies could be prob-lematic. This is acknowledged by Viscusi (1993), but, referring to VSL estimates for richer countries, he qualifies the applicability of the estimates:
�Given the range of uncertainty of the value-of-life estimates, perhaps the most reasonable use of these values in policy contexts is to provide a broad index of the overall desirability of a policy. In practice, value-of-life debates seldom focus on whether the appropriate value of life should be $3 million or $4 million � narrow differences that cannot be distinguished based on the accuracy of current estimates and the potential limitations of individual behaviour underlying these estimates. However, the estimates do provide guidance as to whether risk reduction efforts that cost $50,000 per life saved or $50 million per life saved are warranted� (p. 1943).
To explore this avenue for valuing DALYs, too, I carry out an illustrative calculation based on India-specific VSL estimates. Miller (2000) reports �low�, �high� and �best� estimates for the VSL in India and expresses these estimates as multiples of the national per capita income. For India his �best� estimate is 158 times bigger than the national per capita income; for 2004 this would be US$ 97,960. In assuming that the estimations are based on the values of adults aged 30-39 years, I use an average remaining life expectancy of these statistical lives of 38 years (WHO 2001b).63 This results in an average value of a statistical life year of US$ 2,578.
According to these different suggestions, one DALY gained in India may be valued be-tween US$ 500-9,000 (Table 7). The choice of this value has a substantial impact on the size of the monetary benefits that are derived from the number of DALYs lost due to micronutrient malnutrition � and consequently on the results of the CBAs. When reporting the main results of the CBAs, the standardised value of US$ 1,000 per DALY is used for better comparability and to be conservative. The results for the other possible DALY values (with the exception of
Table 7. Possible monetary valuations of one DALY gained in India
2004 US$
Per capita income in Indiaa,b 620
Triple per capita income in Indiaa,b 1,860
Per capita income in India (at PPP) a,c,d 2,986
Triple per capita income in India (at PPP) a,c,d 8,958
Standardised valuee 500
Standardised valuef 1,000
Mean per capita income in low & middle income countriesb,g 1,460
Average value of a statistical life yearb,h 2,578
Source: aWHO (2001a), bWorld Bank (2005), cHeston et al. (2002), dBLS (2005), eRijsberman (2004), fCollier and Hoeffler (2004), gMills and Shillcutt (2004), hMiller (2000).
63 This comes close to the 40 year working life that Gibson et al. (2005) use for their calculations.

65
the two extremes) are provided in the tables to make the impact of the choice of the DALY value transparent.
As stated previously, the results of CEAs are relative because determining the desirability of the underlying interventions requires comparison with other interventions. In addition to such evaluations of the technical efficiency of interventions, CBAs allow for measuring their allocative efficiency in a context that goes beyond the health sector (Walker 2001). The re-sults of CBAs can be assessed on a more formalised basis: if IRR > ropp, BCR > 1 or NPV > 0 (where ropp is the opportunity cost of capital), then implementing an intervention would be a Kaldor-Hicks improvement, i.e. � through appropriate compensations and redistributions � a Pareto optimum could be achieved.64 In this case, if one DALY is valued at US$ 1,000 and if one of the efficiency criteria laid out above is fulfilled by an intervention, individuals who gain one healthy life year through this intervention would need to reimburse less than US$ 1,000 to society � for society at large to be no worse of than before. (And the individuals themselves gained one DALY for less than what was defined its maximum value.) This example also illustrates the reason for the range of DALY values given in Table 7. If an actual compensa-tion would take place, the VSL estimate would probably be the correct value to use because it is based on individuals� WTP. However, if no compensation takes place, society at large bears the costs of the intervention but � disregarding potential but more intangible motives like compassion or philanthropy � only benefits from the productivity gain that results from saving one healthy life year. In this case, society may only be willing to value one DALY at the average per capita income (or slightly more, assuming that a healthy individual is more pro-ductive than the average).
In the previous paragraph I discussed how the results of a CBA should be assessed, but important limitations in real life were neglected: resource and liquidity constraints. If there are not enough resources to implement all formally profitable interventions, also the results of CBAs need to be compared with the results of alternative interventions to ensure that the scarce resources are allocated efficiently and generate the biggest benefit possible. There-fore, at the end of this section, it seems warranted to underline again that the conversion of DALYs into monetary terms, which is necessary for a CBA, results in a certain aggregation and simplification: dimensions like well-being, health, compassion or other intangibles � which may still resonate in the concept of DALYs � get lost and cannot be taken into consideration when basing decisions on pure economic indicators.65 This is particularly relevant in the con-text of human life and health, where � even in theory � redistribution of benefits and compen-sation of costs between winners and losers is not always possible.
3.4.4 Assessing the relevance of biofortification for economic productivity
In the previous two sections, I argued that one DALY may be valued at simple to triple the national per capita income because this is the range of economic benefits that saving one DALY may generate. On this basis, one further step is to extend the focus of the analysis
64 Of course, this does not mean that the Pareto optimum reflects the socially optimal final distribution of goods and resources; this concept simply is a principle of efficiency (c.f. Rawls 1971). 65 The same reasoning resounds in the recommendation of Belli et al. (1996, p. 69) that: �Analysts should use the simplest technique possible to address the problem at hand: cost-effectiveness where possible and [...] cost-benefit analysis only where they are needed for intersectoral comparisons.�
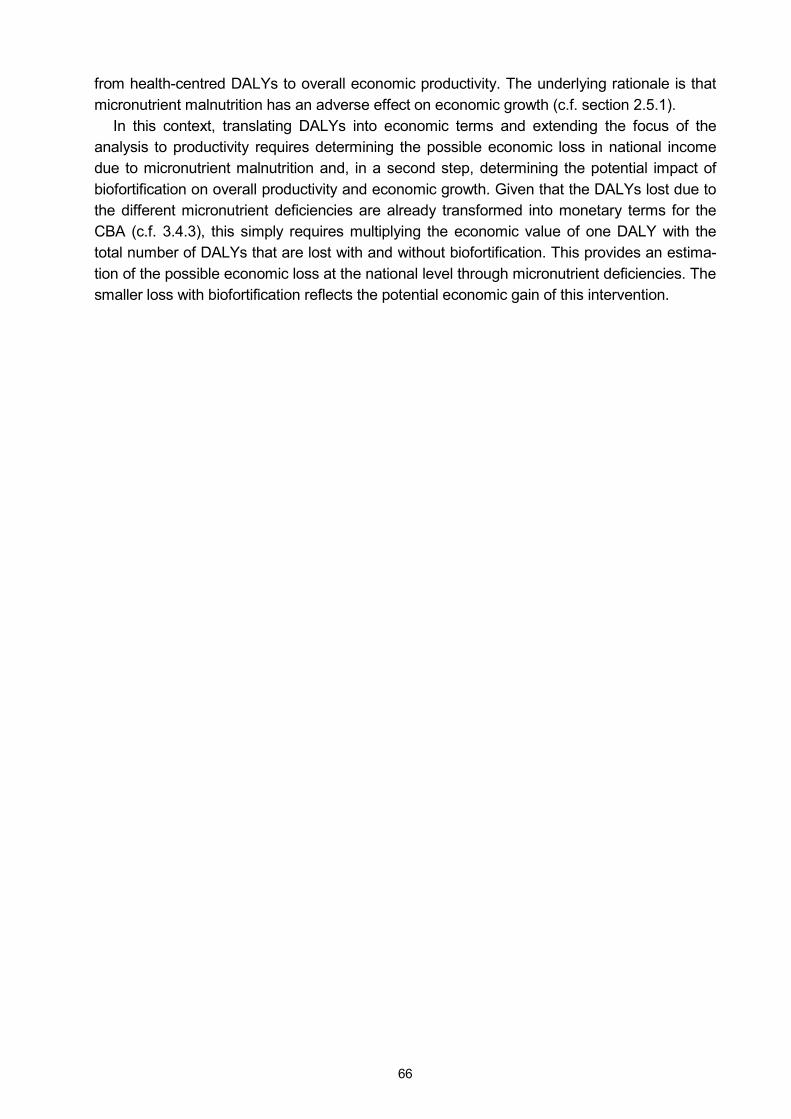
66
from health-centred DALYs to overall economic productivity. The underlying rationale is that micronutrient malnutrition has an adverse effect on economic growth (c.f. section 2.5.1).
In this context, translating DALYs into economic terms and extending the focus of the analysis to productivity requires determining the possible economic loss in national income due to micronutrient malnutrition and, in a second step, determining the potential impact of biofortification on overall productivity and economic growth. Given that the DALYs lost due to the different micronutrient deficiencies are already transformed into monetary terms for the CBA (c.f. 3.4.3), this simply requires multiplying the economic value of one DALY with the total number of DALYs that are lost with and without biofortification. This provides an estima-tion of the possible economic loss at the national level through micronutrient deficiencies. The smaller loss with biofortification reflects the potential economic gain of this intervention.
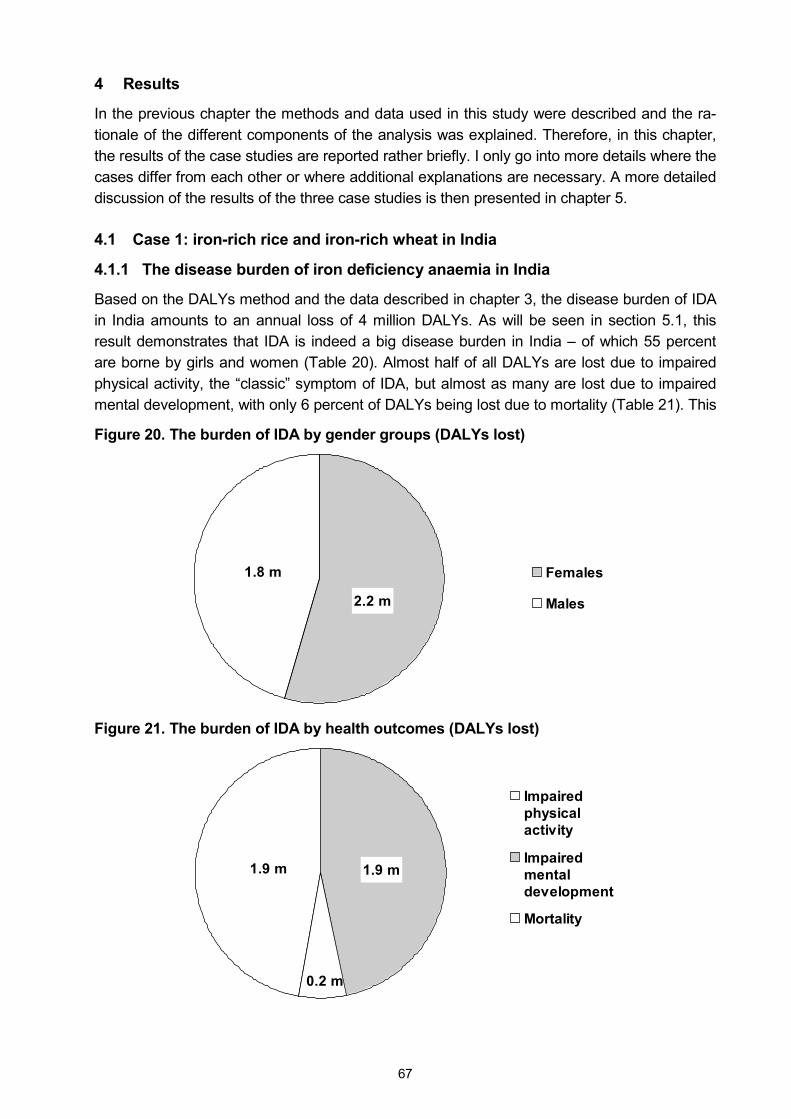
67
4 Results
In the previous chapter the methods and data used in this study were described and the ra-tionale of the different components of the analysis was explained. Therefore, in this chapter, the results of the case studies are reported rather briefly. I only go into more details where the cases differ from each other or where additional explanations are necessary. A more detailed discussion of the results of the three case studies is then presented in chapter 5.
4.1 Case 1: iron-rich rice and iron-rich wheat in India
4.1.1 The disease burden of iron deficiency anaemia in India
Based on the DALYs method and the data described in chapter 3, the disease burden of IDA in India amounts to an annual loss of 4 million DALYs. As will be seen in section 5.1, this result demonstrates that IDA is indeed a big disease burden in India � of which 55 percent are borne by girls and women (Table 20). Almost half of all DALYs are lost due to impaired physical activity, the �classic� symptom of IDA, but almost as many are lost due to impaired mental development, with only 6 percent of DALYs being lost due to mortality (Table 21). This
Figure 20. The burden of IDA by gender groups (DALYs lost)
1.8 m
2.2 m
Females
Males
Figure 21. The burden of IDA by health outcomes (DALYs lost)
1.9 m
0.2 m
1.9 m
Impairedphysicalactivity
Impairedmentaldevelopment
Mortality
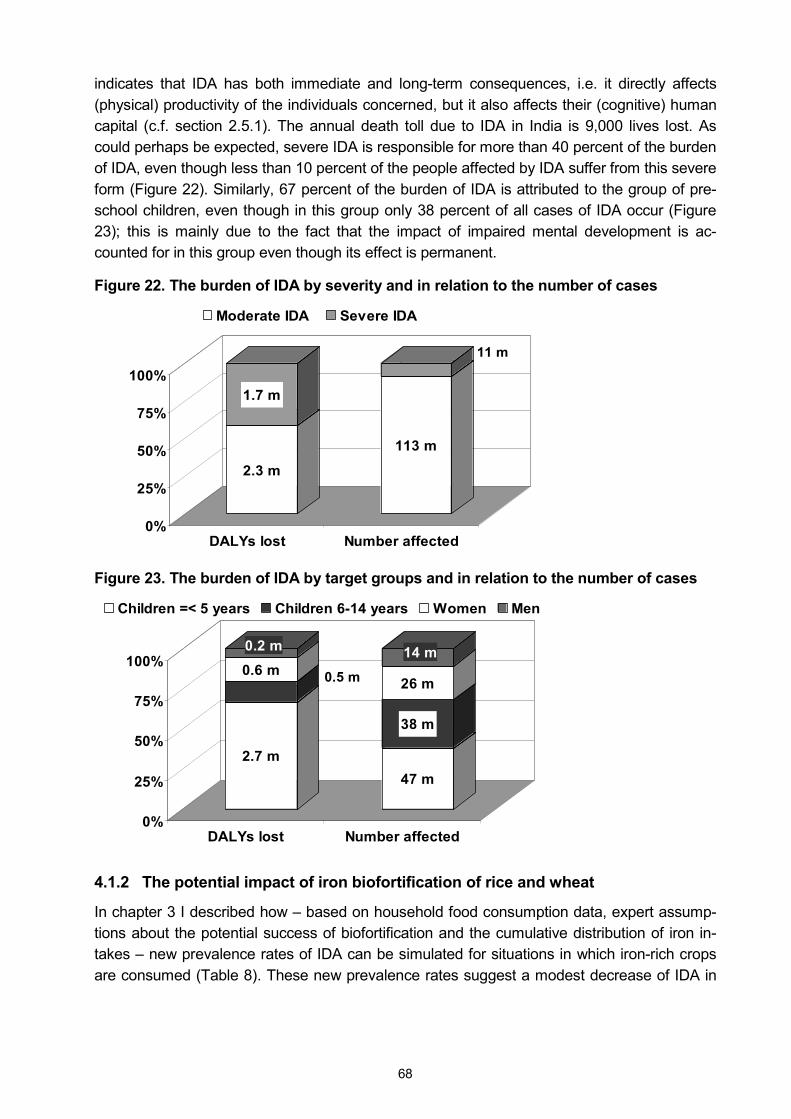
68
indicates that IDA has both immediate and long-term consequences, i.e. it directly affects (physical) productivity of the individuals concerned, but it also affects their (cognitive) human capital (c.f. section 2.5.1). The annual death toll due to IDA in India is 9,000 lives lost. As could perhaps be expected, severe IDA is responsible for more than 40 percent of the burden of IDA, even though less than 10 percent of the people affected by IDA suffer from this severe form (Figure 22). Similarly, 67 percent of the burden of IDA is attributed to the group of pre-school children, even though in this group only 38 percent of all cases of IDA occur (Figure 23); this is mainly due to the fact that the impact of impaired mental development is ac-counted for in this group even though its effect is permanent.
Figure 22. The burden of IDA by severity and in relation to the number of cases
2.3 m
1.7 m
113 m
11 m
0%
25%
50%
75%
100%
DALYs lost Number affected
Moderate IDA Severe IDA
Figure 23. The burden of IDA by target groups and in relation to the number of cases
2.7 m
0.5 m0.6 m0.2 m
47 m
38 m
26 m
14 m
0%
25%
50%
75%
100%
DALYs lost Number affected
Children =< 5 years Children 6-14 years Women Men
4.1.2 The potential impact of iron biofortification of rice and wheat
In chapter 3 I described how � based on household food consumption data, expert assump-tions about the potential success of biofortification and the cumulative distribution of iron in-takes � new prevalence rates of IDA can be simulated for situations in which iron-rich crops are consumed (Table 8). These new prevalence rates suggest a modest decrease of IDA in
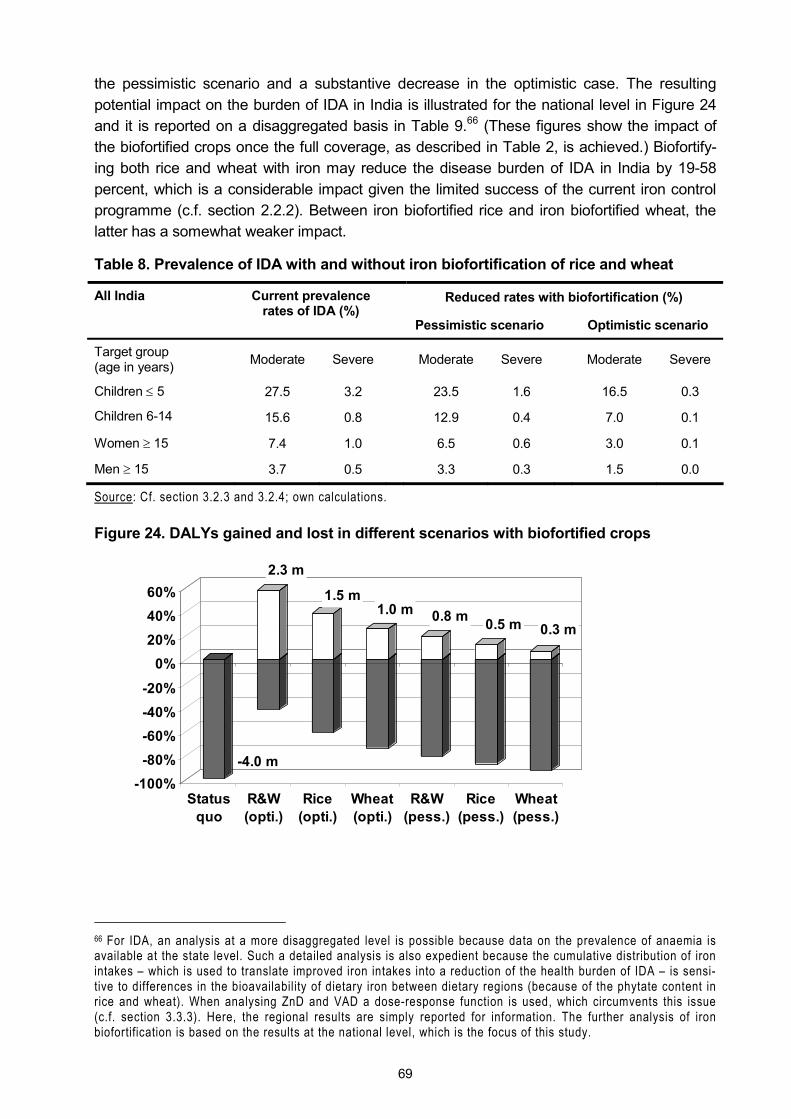
69
the pessimistic scenario and a substantive decrease in the optimistic case. The resulting potential impact on the burden of IDA in India is illustrated for the national level in Figure 24 and it is reported on a disaggregated basis in Table 9.66 (These figures show the impact of the biofortified crops once the full coverage, as described in Table 2, is achieved.) Biofortify-ing both rice and wheat with iron may reduce the disease burden of IDA in India by 19-58 percent, which is a considerable impact given the limited success of the current iron control programme (c.f. section 2.2.2). Between iron biofortified rice and iron biofortified wheat, the latter has a somewhat weaker impact.
Table 8. Prevalence of IDA with and without iron biofortification of rice and wheat
Reduced rates with biofortification (%) All India Current prevalence rates of IDA (%)
Pessimistic scenario Optimistic scenario
Target group (age in years) Moderate Severe Moderate Severe Moderate Severe
Children ≤ 5 27.5 3.2 23.5 1.6 16.5 0.3
Children 6-14 15.6 0.8 12.9 0.4 7.0 0.1
Women ≥ 15 7.4 1.0 6.5 0.6 3.0 0.1
Men ≥ 15 3.7 0.5 3.3 0.3 1.5 0.0
Source: Cf. section 3.2.3 and 3.2.4; own calculations.
Figure 24. DALYs gained and lost in different scenarios with biofortified crops
-4.0 m
2.3 m
1.5 m1.0 m 0.8 m 0.5 m 0.3 m
-100%-80%-60%-40%-20%
0%20%40%60%
Statusquo
R&W(opti.)
Rice(opti.)
Wheat(opti.)
R&W(pess.)
Rice(pess.)
Wheat(pess.)
66 For IDA, an analysis at a more disaggregated level is possible because data on the prevalence of anaemia is available at the state level. Such a detailed analysis is also expedient because the cumulative distribution of iron intakes � which is used to translate improved iron intakes into a reduction of the health burden of IDA � is sensi-tive to differences in the bioavailability of dietary iron between dietary regions (because of the phytate content in rice and wheat). When analysing ZnD and VAD a dose-response function is used, which circumvents this issue (c.f. section 3.3.3). Here, the regional results are simply reported for information. The further analysis of iron biofortification is based on the results at the national level, which is the focus of this study.
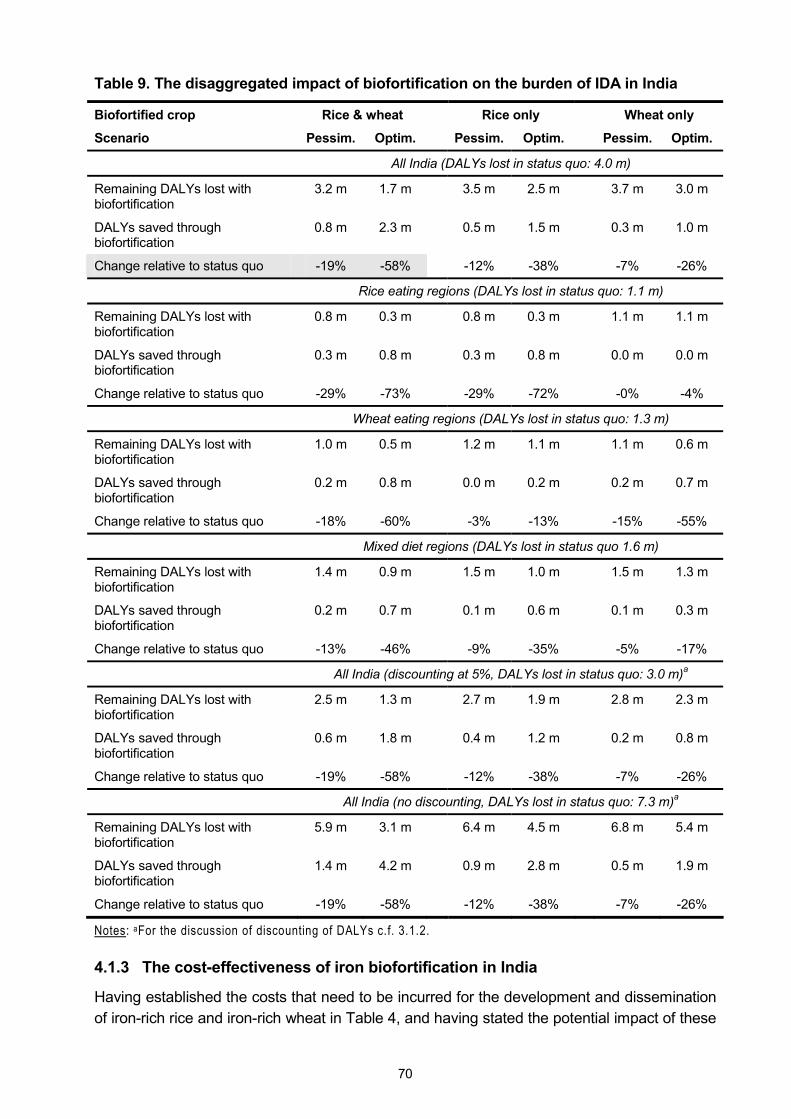
70
Table 9. The disaggregated impact of biofortification on the burden of IDA in India
Biofortified crop Rice & wheat Rice only Wheat only
Scenario Pessim. Optim. Pessim. Optim. Pessim. Optim.
All India (DALYs lost in status quo: 4.0 m)
Remaining DALYs lost with biofortification
3.2 m 1.7 m 3.5 m 2.5 m 3.7 m 3.0 m
DALYs saved through biofortification
0.8 m 2.3 m 0.5 m 1.5 m 0.3 m 1.0 m
Change relative to status quo -19% -58% -12% -38% -7% -26%
Rice eating regions (DALYs lost in status quo: 1.1 m)
Remaining DALYs lost with biofortification
0.8 m 0.3 m 0.8 m 0.3 m 1.1 m 1.1 m
DALYs saved through biofortification
0.3 m 0.8 m 0.3 m 0.8 m 0.0 m 0.0 m
Change relative to status quo -29% -73% -29% -72% -0% -4%
Wheat eating regions (DALYs lost in status quo: 1.3 m)
Remaining DALYs lost with biofortification
1.0 m 0.5 m 1.2 m 1.1 m 1.1 m 0.6 m
DALYs saved through biofortification
0.2 m 0.8 m 0.0 m 0.2 m 0.2 m 0.7 m
Change relative to status quo -18% -60% -3% -13% -15% -55%
Mixed diet regions (DALYs lost in status quo 1.6 m)
Remaining DALYs lost with biofortification
1.4 m 0.9 m 1.5 m 1.0 m 1.5 m 1.3 m
DALYs saved through biofortification
0.2 m 0.7 m 0.1 m 0.6 m 0.1 m 0.3 m
Change relative to status quo -13% -46% -9% -35% -5% -17%
All India (discounting at 5%, DALYs lost in status quo: 3.0 m)a
Remaining DALYs lost with biofortification
2.5 m 1.3 m 2.7 m 1.9 m 2.8 m 2.3 m
DALYs saved through biofortification
0.6 m 1.8 m 0.4 m 1.2 m 0.2 m 0.8 m
Change relative to status quo -19% -58% -12% -38% -7% -26%
All India (no discounting, DALYs lost in status quo: 7.3 m)a
Remaining DALYs lost with biofortification
5.9 m 3.1 m 6.4 m 4.5 m 6.8 m 5.4 m
DALYs saved through biofortification
1.4 m 4.2 m 0.9 m 2.8 m 0.5 m 1.9 m
Change relative to status quo -19% -58% -12% -38% -7% -26%
Notes: aFor the discussion of discounting of DALYs c.f. 3.1.2.
4.1.3 The cost-effectiveness of iron biofortification in India
Having established the costs that need to be incurred for the development and dissemination of iron-rich rice and iron-rich wheat in Table 4, and having stated the potential impact of these
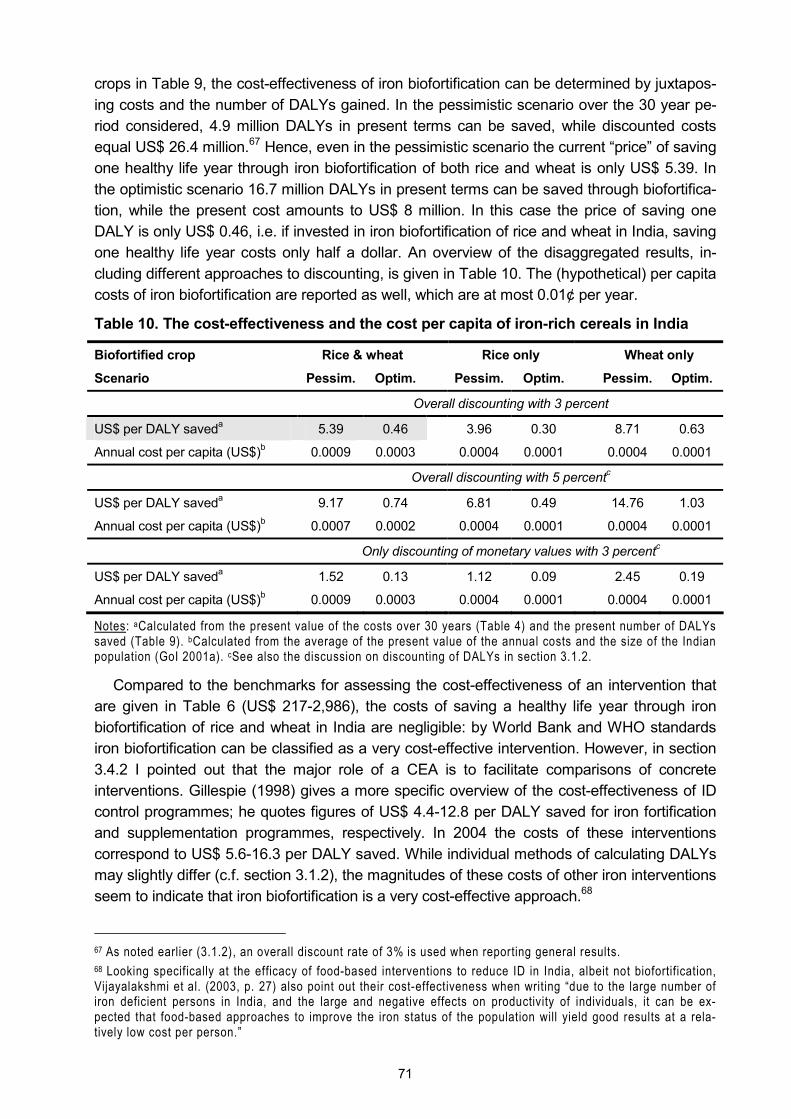
71
crops in Table 9, the cost-effectiveness of iron biofortification can be determined by juxtapos-ing costs and the number of DALYs gained. In the pessimistic scenario over the 30 year pe-riod considered, 4.9 million DALYs in present terms can be saved, while discounted costs equal US$ 26.4 million.67 Hence, even in the pessimistic scenario the current �price� of saving one healthy life year through iron biofortification of both rice and wheat is only US$ 5.39. In the optimistic scenario 16.7 million DALYs in present terms can be saved through biofortifica-tion, while the present cost amounts to US$ 8 million. In this case the price of saving one DALY is only US$ 0.46, i.e. if invested in iron biofortification of rice and wheat in India, saving one healthy life year costs only half a dollar. An overview of the disaggregated results, in-cluding different approaches to discounting, is given in Table 10. The (hypothetical) per capita costs of iron biofortification are reported as well, which are at most 0.01¢ per year.
Table 10. The cost-effectiveness and the cost per capita of iron-rich cereals in India
Biofortified crop Rice & wheat Rice only Wheat only
Scenario Pessim. Optim. Pessim. Optim. Pessim. Optim.
Overall discounting with 3 percent
US$ per DALY saveda 5.39 0.46 3.96 0.30 8.71 0.63
Annual cost per capita (US$)b 0.0009 0.0003 0.0004 0.0001 0.0004 0.0001
Overall discounting with 5 percentc
US$ per DALY saveda 9.17 0.74 6.81 0.49 14.76 1.03
Annual cost per capita (US$)b 0.0007 0.0002 0.0004 0.0001 0.0004 0.0001
Only discounting of monetary values with 3 percentc
US$ per DALY saveda 1.52 0.13 1.12 0.09 2.45 0.19
Annual cost per capita (US$)b 0.0009 0.0003 0.0004 0.0001 0.0004 0.0001
Notes: aCalculated from the present value of the costs over 30 years (Table 4) and the present number of DALYs saved (Table 9). bCalculated from the average of the present value of the annual costs and the size of the Indian population (GoI 2001a). cSee also the discussion on discounting of DALYs in section 3.1.2.
Compared to the benchmarks for assessing the cost-effectiveness of an intervention that are given in Table 6 (US$ 217-2,986), the costs of saving a healthy life year through iron biofortification of rice and wheat in India are negligible: by World Bank and WHO standards iron biofortification can be classified as a very cost-effective intervention. However, in section 3.4.2 I pointed out that the major role of a CEA is to facilitate comparisons of concrete interventions. Gillespie (1998) gives a more specific overview of the cost-effectiveness of ID control programmes; he quotes figures of US$ 4.4-12.8 per DALY saved for iron fortification and supplementation programmes, respectively. In 2004 the costs of these interventions correspond to US$ 5.6-16.3 per DALY saved. While individual methods of calculating DALYs may slightly differ (c.f. section 3.1.2), the magnitudes of these costs of other iron interventions seem to indicate that iron biofortification is a very cost-effective approach.68
67 As noted earlier (3.1.2), an overall discount rate of 3% is used when reporting general results. 68 Looking specifically at the efficacy of food-based interventions to reduce ID in India, albeit not biofortification, Vijayalakshmi et al. (2003, p. 27) also point out their cost-effectiveness when writing �due to the large number of iron deficient persons in India, and the large and negative effects on productivity of individuals, it can be ex-pected that food-based approaches to improve the iron status of the population will yield good results at a rela-tively low cost per person.�
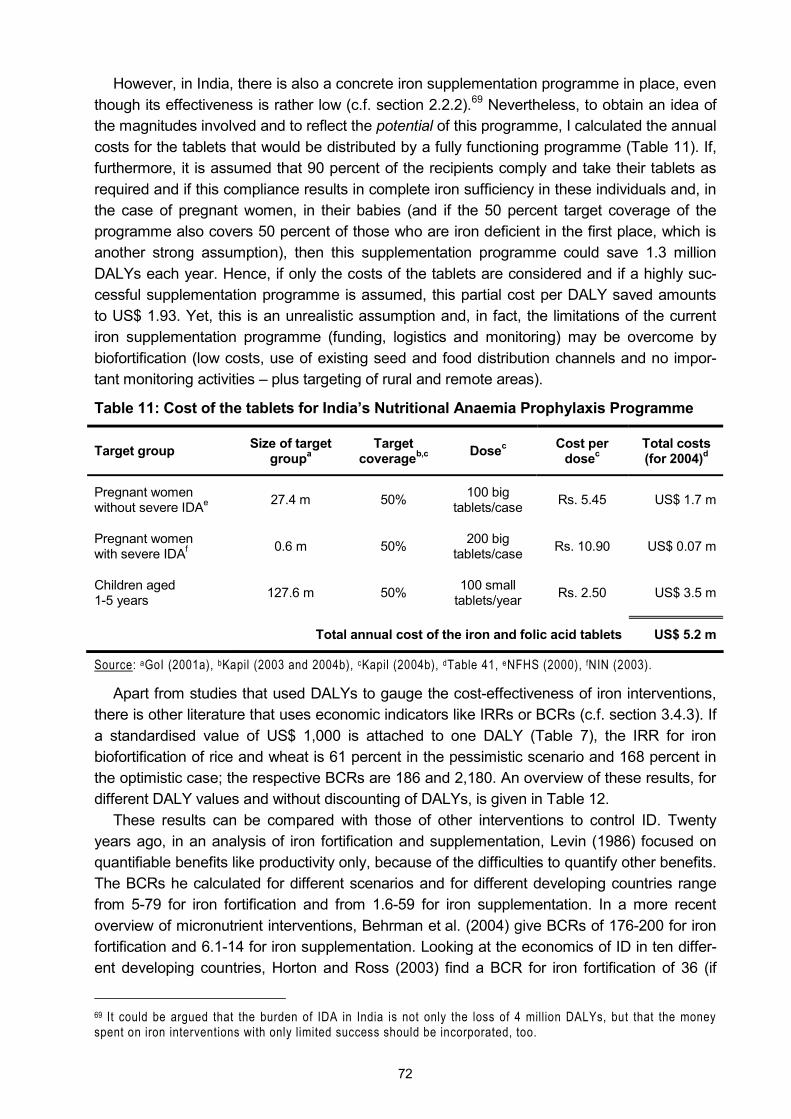
72
However, in India, there is also a concrete iron supplementation programme in place, even though its effectiveness is rather low (c.f. section 2.2.2).69 Nevertheless, to obtain an idea of the magnitudes involved and to reflect the potential of this programme, I calculated the annual costs for the tablets that would be distributed by a fully functioning programme (Table 11). If, furthermore, it is assumed that 90 percent of the recipients comply and take their tablets as required and if this compliance results in complete iron sufficiency in these individuals and, in the case of pregnant women, in their babies (and if the 50 percent target coverage of the programme also covers 50 percent of those who are iron deficient in the first place, which is another strong assumption), then this supplementation programme could save 1.3 million DALYs each year. Hence, if only the costs of the tablets are considered and if a highly suc-cessful supplementation programme is assumed, this partial cost per DALY saved amounts to US$ 1.93. Yet, this is an unrealistic assumption and, in fact, the limitations of the current iron supplementation programme (funding, logistics and monitoring) may be overcome by biofortification (low costs, use of existing seed and food distribution channels and no impor-tant monitoring activities � plus targeting of rural and remote areas).
Table 11: Cost of the tablets for India�s Nutritional Anaemia Prophylaxis Programme
Target group Size of target groupa
Target coverageb,c Dosec Cost per
dosec Total costs (for 2004)d
Pregnant women without severe IDAe 27.4 m 50% 100 big
tablets/case Rs. 5.45 US$ 1.7 m
Pregnant women with severe IDAf 0.6 m 50% 200 big
tablets/case Rs. 10.90 US$ 0.07 m
Children aged 1-5 years 127.6 m 50% 100 small
tablets/year Rs. 2.50 US$ 3.5 m
Total annual cost of the iron and folic acid tablets US$ 5.2 m
Source: aGoI (2001a), bKapil (2003 and 2004b), cKapil (2004b), dTable 41, eNFHS (2000), fNIN (2003).
Apart from studies that used DALYs to gauge the cost-effectiveness of iron interventions, there is other literature that uses economic indicators like IRRs or BCRs (c.f. section 3.4.3). If a standardised value of US$ 1,000 is attached to one DALY (Table 7), the IRR for iron biofortification of rice and wheat is 61 percent in the pessimistic scenario and 168 percent in the optimistic case; the respective BCRs are 186 and 2,180. An overview of these results, for different DALY values and without discounting of DALYs, is given in Table 12.
These results can be compared with those of other interventions to control ID. Twenty years ago, in an analysis of iron fortification and supplementation, Levin (1986) focused on quantifiable benefits like productivity only, because of the difficulties to quantify other benefits. The BCRs he calculated for different scenarios and for different developing countries range from 5-79 for iron fortification and from 1.6-59 for iron supplementation. In a more recent overview of micronutrient interventions, Behrman et al. (2004) give BCRs of 176-200 for iron fortification and 6.1-14 for iron supplementation. Looking at the economics of ID in ten differ-ent developing countries, Horton and Ross (2003) find a BCR for iron fortification of 36 (if
69 It could be argued that the burden of IDA in India is not only the loss of 4 million DALYs, but that the money spent on iron interventions with only limited success should be incorporated, too.
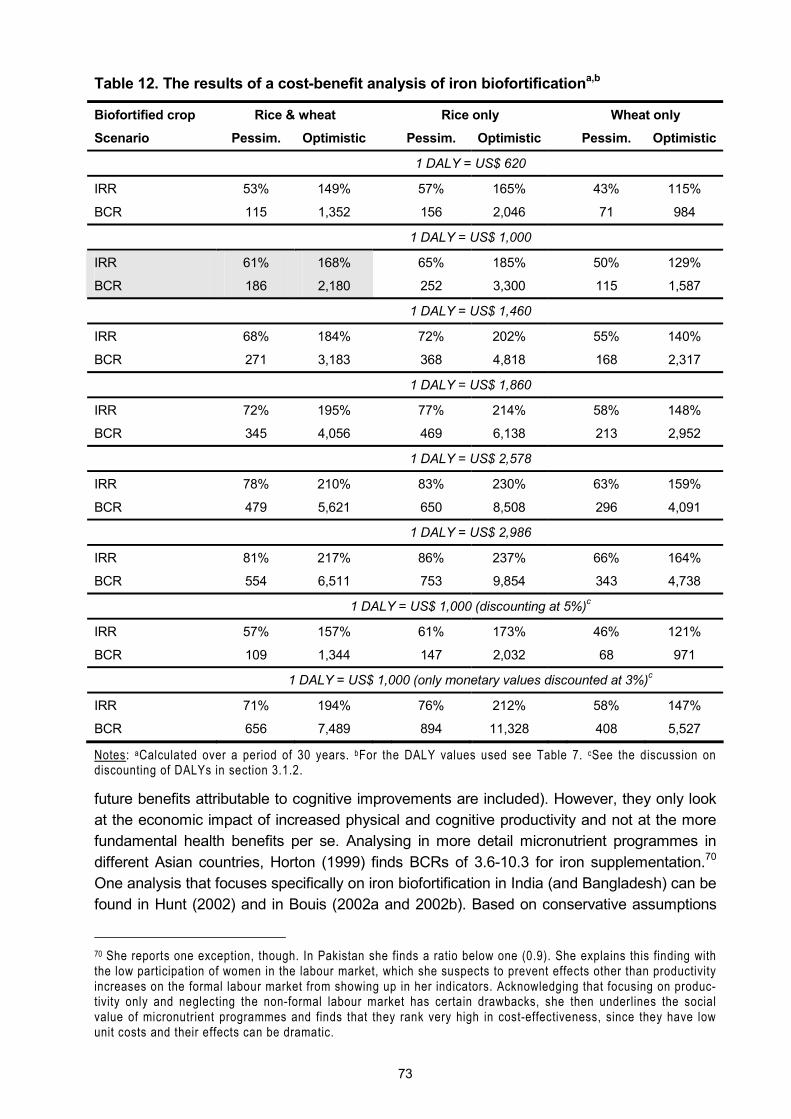
73
Table 12. The results of a cost-benefit analysis of iron biofortificationa,b
Biofortified crop Rice & wheat Rice only Wheat only
Scenario Pessim. Optimistic Pessim. Optimistic Pessim. Optimistic
1 DALY = US$ 620
IRR 53% 149% 57% 165% 43% 115%
BCR 115 1,352 156 2,046 71 984
1 DALY = US$ 1,000
IRR 61% 168% 65% 185% 50% 129%
BCR 186 2,180 252 3,300 115 1,587
1 DALY = US$ 1,460
IRR 68% 184% 72% 202% 55% 140%
BCR 271 3,183 368 4,818 168 2,317
1 DALY = US$ 1,860
IRR 72% 195% 77% 214% 58% 148%
BCR 345 4,056 469 6,138 213 2,952
1 DALY = US$ 2,578
IRR 78% 210% 83% 230% 63% 159%
BCR 479 5,621 650 8,508 296 4,091
1 DALY = US$ 2,986
IRR 81% 217% 86% 237% 66% 164%
BCR 554 6,511 753 9,854 343 4,738
1 DALY = US$ 1,000 (discounting at 5%)c
IRR 57% 157% 61% 173% 46% 121%
BCR 109 1,344 147 2,032 68 971
1 DALY = US$ 1,000 (only monetary values discounted at 3%)c
IRR 71% 194% 76% 212% 58% 147%
BCR 656 7,489 894 11,328 408 5,527
Notes: aCalculated over a period of 30 years. bFor the DALY values used see Table 7. cSee the discussion on discounting of DALYs in section 3.1.2.
future benefits attributable to cognitive improvements are included). However, they only look at the economic impact of increased physical and cognitive productivity and not at the more fundamental health benefits per se. Analysing in more detail micronutrient programmes in different Asian countries, Horton (1999) finds BCRs of 3.6-10.3 for iron supplementation.70 One analysis that focuses specifically on iron biofortification in India (and Bangladesh) can be found in Hunt (2002) and in Bouis (2002a and 2002b). Based on conservative assumptions
70 She reports one exception, though. In Pakistan she finds a ratio below one (0.9). She explains this finding with the low participation of women in the labour market, which she suspects to prevent effects other than productivity increases on the formal labour market from showing up in her indicators. Acknowledging that focusing on produc-tivity only and neglecting the non-formal labour market has certain drawbacks, she then underlines the social value of micronutrient programmes and finds that they rank very high in cost-effectiveness, since they have low unit costs and their effects can be dramatic.

74
about the increase in micronutrient content and the adoption of biofortified rice and wheat varieties, the authors attach a given monetary value per case of anaemia averted and juxta-pose these benefits and the expected costs for R&D and extension. The resulting BCRs are in the range of 19-85 and correspond to an IRR in the range of 29-45 percent. In their calcu-lation only nutritional benefits are considered but they expect that inclusion of agricultural benefits (i.e. expected yield gains due to better iron availability for the plant) increases these results considerably. Again, compared to these other studies, biofortification produces the most promising results (Table 13).
Table 13. Ranges of benefit-cost ratios of different studies of iron interventions
Source Iron intervention BCRs
Own calculations, c.f. Table 12 Biofortification 186 - 2,180
Behrman et al. (2004) Fortification 176 - 200
Horton and Ross (2003) Fortification 36
Hunt (2002) and Bouis (2002a and 2002b) Biofortification 19 - 85
Behrman et al. (2004) Supplementation 6 - 14
Levin (1986) Fortification 5 - 79
Horton (1999) Supplementation 3.6 - 10
Levin (1986) Supplementation 1.6 - 59
4.1.4 An evaluation of the overall economic impact of iron biofortification
As described in section 2.5.1, micronutrient malnutrition is closely linked to economic productivity and national income. Following section 3.4.4 and based on the recommendations of the WHO how to consider the economic potential of saving one DALY (WHO 2001a; Table 7), the annual loss of 4 million DALYs translates into a loss of US$ 2.5-7.4 billion for DALY values at the single or triple per capita income, respectively. In relation to India�s gross na-tional income (GNI) of US$ 674.6 billion in 2004 (World Bank 2005), this amounts to an an-nual loss of 0.37-1.10 percent of the national income.71 The corresponding potential producti-vity gains through iron biofortification are shown in Table 14. While the adverse effect of mi-cronutrient malnutrition on economic growth is discussed and illustrated in section 5.4, these results demonstrate the relevance of IDA as a problem that goes far beyond the sphere of public health. Losing one percent of national income growth due to a single reason is a matter of concern for any society.
Table 14. IDA in India and the potential economic impact of biofortification
1 DALY = single per capita incomea
1 DALY = triple per capita incomea
Loss in national productivity due to IDA (%)b -0.37 -1.10
Potential gain (pessimistic scenario %)a 0.07 0.21
Potential gain (optimistic scenario, %)a 0.21 0.64
Notes: aSee Table 7. bGNI for India for 2004 taken from World Bank (2005). aSee Table 9.
71 In 2004 India�s GNI was 97.5% of India�s gross domestic product (GDP) (World Bank 2005). Therefore, in the following when illustrating matters of magnitude, the terms GNI, GDP and national income are used inter-changeably.

75
4.2 Case 2: zinc-rich rice and zinc-rich wheat in India
4.2.1 The disease burden of zinc deficiency in India
Given the method and the data laid out in chapter 3, the calculation of the disease burden of ZnD in India yields an annual loss of 2.8 million healthy life years. This is less than the burden imposed by IDA, but still a public health problem of sizeable proportion, as the discussion in section 5.1 will show. More than two-thirds of this burden is borne by infants (Figure 25) and 95 percent of the burden of ZnD are lost due to mortality (Figure 26). This corresponds to an annual loss of 95,500 lives of infants and children.
Figure 25. The burden of ZnD by age groups (DALYs lost)
2.0 m
0.8 m
Infants < 1 year
Children 1-5 years
Figure 26. The burden of ZnD by health outcomes (DALYs lost)
0.07 m
2.7 m
MortalityDiarrhoeaPneumoniaStunting
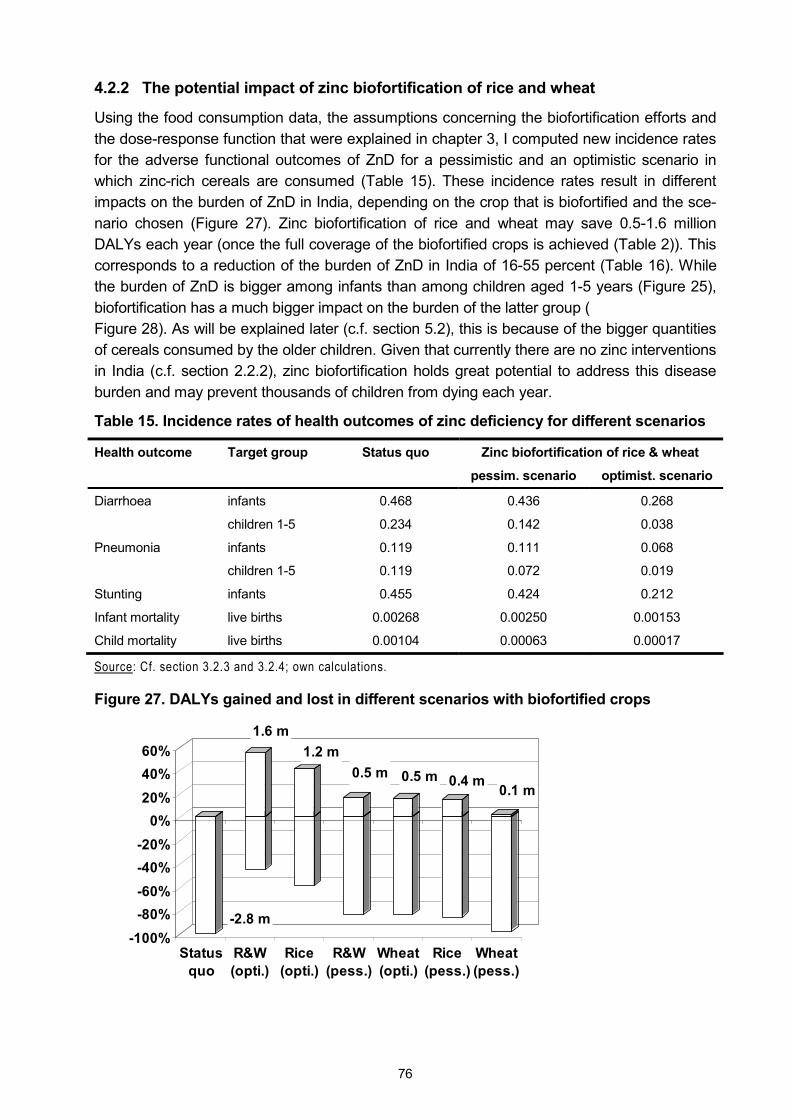
76
4.2.2 The potential impact of zinc biofortification of rice and wheat
Using the food consumption data, the assumptions concerning the biofortification efforts and the dose-response function that were explained in chapter 3, I computed new incidence rates for the adverse functional outcomes of ZnD for a pessimistic and an optimistic scenario in which zinc-rich cereals are consumed (Table 15). These incidence rates result in different impacts on the burden of ZnD in India, depending on the crop that is biofortified and the sce-nario chosen (Figure 27). Zinc biofortification of rice and wheat may save 0.5-1.6 million DALYs each year (once the full coverage of the biofortified crops is achieved (Table 2)). This corresponds to a reduction of the burden of ZnD in India of 16-55 percent (Table 16). While the burden of ZnD is bigger among infants than among children aged 1-5 years (Figure 25), biofortification has a much bigger impact on the burden of the latter group ( Figure 28). As will be explained later (c.f. section 5.2), this is because of the bigger quantities of cereals consumed by the older children. Given that currently there are no zinc interventions in India (c.f. section 2.2.2), zinc biofortification holds great potential to address this disease burden and may prevent thousands of children from dying each year.
Table 15. Incidence rates of health outcomes of zinc deficiency for different scenarios
Zinc biofortification of rice & wheat Health outcome Target group Status quo
pessim. scenario optimist. scenario
infants 0.468 0.436 0.268 Diarrhoea
children 1-5 0.234 0.142 0.038
infants 0.119 0.111 0.068 Pneumonia
children 1-5 0.119 0.072 0.019
Stunting infants 0.455 0.424 0.212
Infant mortality live births 0.00268 0.00250 0.00153
Child mortality live births 0.00104 0.00063 0.00017
Source: Cf. section 3.2.3 and 3.2.4; own calculations.
Figure 27. DALYs gained and lost in different scenarios with biofortified crops
-2.8 m
1.6 m1.2 m
0.5 m 0.5 m 0.4 m 0.1 m
-100%-80%-60%-40%-20%
0%20%40%60%
Statusquo
R&W(opti.)
Rice(opti.)
R&W(pess.)
Wheat(opti.)
Rice(pess.)
Wheat(pess.)
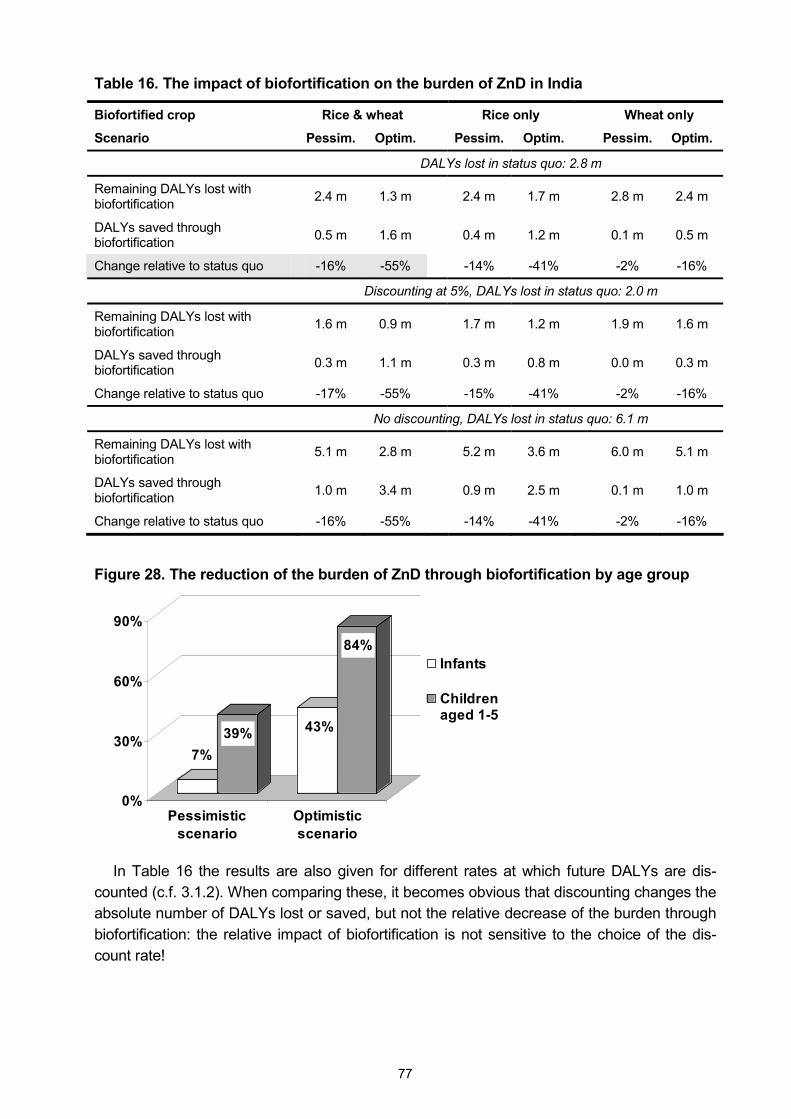
77
Table 16. The impact of biofortification on the burden of ZnD in India
Biofortified crop Rice & wheat Rice only Wheat only
Scenario Pessim. Optim. Pessim. Optim. Pessim. Optim.
DALYs lost in status quo: 2.8 m
Remaining DALYs lost with biofortification 2.4 m 1.3 m 2.4 m 1.7 m 2.8 m 2.4 m
DALYs saved through biofortification 0.5 m 1.6 m 0.4 m 1.2 m 0.1 m 0.5 m
Change relative to status quo -16% -55% -14% -41% -2% -16%
Discounting at 5%, DALYs lost in status quo: 2.0 m
Remaining DALYs lost with biofortification 1.6 m 0.9 m 1.7 m 1.2 m 1.9 m 1.6 m
DALYs saved through biofortification 0.3 m 1.1 m 0.3 m 0.8 m 0.0 m 0.3 m
Change relative to status quo -17% -55% -15% -41% -2% -16%
No discounting, DALYs lost in status quo: 6.1 m
Remaining DALYs lost with biofortification 5.1 m 2.8 m 5.2 m 3.6 m 6.0 m 5.1 m
DALYs saved through biofortification 1.0 m 3.4 m 0.9 m 2.5 m 0.1 m 1.0 m
Change relative to status quo -16% -55% -14% -41% -2% -16%
Figure 28. The reduction of the burden of ZnD through biofortification by age group
7%39% 43%
84%
0%
30%
60%
90%
Pessimisticscenario
Optimisticscenario
Infants
Childrenaged 1-5
In Table 16 the results are also given for different rates at which future DALYs are dis-counted (c.f. 3.1.2). When comparing these, it becomes obvious that discounting changes the absolute number of DALYs lost or saved, but not the relative decrease of the burden through biofortification: the relative impact of biofortification is not sensitive to the choice of the dis-count rate!
78
4.2.3 The cost-effectiveness of zinc biofortification in India
Given the expenditures that are necessary to develop and disseminate zinc-rich rice and zinc-rich wheat (Table 4), and given the potential impact of these biofortified cereals (Table 16), the cost-effectiveness of zinc biofortification can easily be derived following the approach described in chapter 3. Over the 30 year period considered in this analysis, 3.7-7.8 million DALYs in present terms may be saved in the pessimistic and optimistic scenario, respec-tively. These health benefits need to be contrasted with present costs of US$ 8.0-26.4 million in the optimistic and pessimistic scenario, respectively. Then, saving one healthy life year through zinc biofortification of rice and wheat in India may cost less than 70¢ (Table 17). The overall costs of zinc biofortification on a per capita basis are negligible.
Table 17. The cost-effectiveness and the cost per capita of zinc-rich cereals in India
Biofortified crop Rice & wheat Rice only Wheat only
Scenario Pessim. Optim. Pessim. Optim. Pessim. Optim.
Overall discounting with 3 percent
US$ per DALY saveda 8.80 0.68 4.81 0.40 39.45 1.42
Annual cost per capita (US$)b 0.0009 0.0003 0.0004 0.0001 0.0004 0.0001
Overall discounting with 5 percentc
US$ per DALY saveda 16.32 1.21 8.97 0.71 73.85 2.56
Annual cost per capita (US$)b 0.0007 0.0002 0.0004 0.0001 0.0004 0.0001
Only discounting of monetary values with 3 percentc
US$ per DALY saveda 2.11 0.17 1.15 0.10 9.32 0.34
Annual cost per capita (US$)b 0.0009 0.0003 0.0004 0.0001 0.0004 0.0001
Notes: aCalculated from the present value of the costs over 30 years (Table 4) and the present number of DALYs saved (Table 16). bCalculated from the average of the present value of the annual costs and the size of the Indian population (GoI 2001a). cSee also the discussion on discounting of DALYs in section 3.1.2.
When discussing the theoretical basis of CEAs, in Table 6 benchmarks of the World Bank and the WHO were reported that may be used to gauge the cost-effectiveness of interven-tions whose impact can be measured in DALYs: saving one DALY at a cost below US$ 217 is highly cost-effective. This holds true for all scenarios of zinc biofortification of rice and wheat. In section 3.4.2, the strength of CEAs for comparisons with other interventions was under-lined. Currently there are no significant interventions to control ZnD in India (MI 2005). How-ever, Tan-Torres Edejer et al. (2005) have estimated the cost-effectiveness of different hy-pothetical interventions to improve child health in the WHO region �SEAR-D�. Next to India (1,000 m inhabitants), this region comprises Bangladesh (136 m), Bhutan (0.9 m), Democratic People�s Republic of Korea (23 m), Maldives (0.3 m), Myanmar (49 m) and Nepal (24 m); hence India accounts for 81 percent of the population in this region (WHO 2002; population figures from World Bank 2005). Tan-Torres Edejer et al. (2005) focused on the expansion path for the most cost effective set of interventions (i.e. they started with the most-cost-effec-tive intervention and successively added the next best cost-effective intervention, reporting the costs per DALY for each bundle). But in their data supplement (online Table B) they also report the costs of saving one DALY for each individual intervention � amongst others also
79
zinc fortification (of wheat flour) and zinc supplementation (Table 18).72 While Tan-Torres Edejer et al. (2005) use a discount rate of 3 percent in their analysis, they also use age weighting, which is not done here. In this context they write: �Removal of age weighting and discounting for DALYs increases the health gains and makes the interventions more cost effective� (p. 1180). Moreover, they use international dollars (I$) with the year 2000 as base to eliminate the differences in price levels between the countries in their analysis. Hence, to become comparable, the international dollars need to be converted into US dollars, which then need to be inflated to the year 2004 (Table 18). The potential of zinc biofortification, i.e. the lower end of the range of US$ 0.7-9 per DALY saved, compares rather favourably with the potential of zinc fortification (with a range of US$ 5-7 per DALY saved). And zinc biofortifi-cation promises to be more cost-effective than zinc supplementation.
Table 18: Cost-effectiveness of zinc fortification and zinc supplementation
Coveragea 50% 80% 95%
I$/DALY (2000)
Zinc fortification 19 15 14
Zinc supplementation 50 48 48
US$/DALY (2004)b
Zinc fortification 6.8 5.3 5.0
Zinc supplementation 18 17 17
Notes: aThe coverage is explained in footnote 72. bTo convert I$ into rupees the table provided in WHO (2005b) was used, to converted these rupee figures into US$ the exchange rates provided in the Annexe in Table 41. Source: Tan-Torres Edejer et al. (2005).
Because 95 percent of all DALYs lost due to ZnD are lost due to mortality, it may also make sense to approximate the cost-effectiveness of zinc biofortification by looking at the cost of saving the life of a child: over the 30 year period considered, zinc biofortification of rice and wheat in India may save 190,000 lives in the pessimistic scenario and more than 750,000 lives in the optimistic scenario. If these figures are juxtaposed to the present costs of US$ 26.4 million and US$ 8.0 million in the pessimistic and optimistic scenario, respectively, sav-ing the life of a child may cost as little as US$ 11 and no more than US$ 139.
In addition to determining the cost-effectiveness of zinc biofortification, to make this inter-vention comparable on a broader basis it is also recommendable to carry out a CBA (c.f. sec-tion 3.4.3). To this end, the DALYs saved are converted into monetary benefits according to
72 In the online supplement Tan-Torres Edejer et al. (2005) provide the following explanation for zinc supplemen-tation: �During one of the first immunisations contacts in infancy, the health worker prescribes zinc gluconate or sulfate, 10 mg in solution as part of a routine. Thereafter, the zinc solution is administered by a caregiver at home daily to every child until the child reaches five years of age. Effectiveness of the intervention is adjusted by an assumed adherence of 60% for medications being taken daily.� And regarding zinc fortification they explain: �The intervention has the same characteristics as for VA fortification[*] except the nutrient added is zinc oxide and the food vehicle is wheat, not sugar. Note that in the absence of documented field experience, the effective-ness of zinc fortification was modelled relative to the effectiveness of supplementation at approximately the level of VA supplementation to fortification.� [* �The amount of VA required is calculated based on a consideration of the expected sources of VA and the average per capita intake of sugar in different settings. Intervention includes provision of guidelines for quality control of sugar fortification in the mills, regular visits to mills by inspectors, and regular sampling and testing of sugar taken from mills, markets and homes for VA content. Samples from homes are taken opportunistically during mass surveys carried out for other purposes. Effectiveness is adjusted using assumptions regarding access to processed food.�]
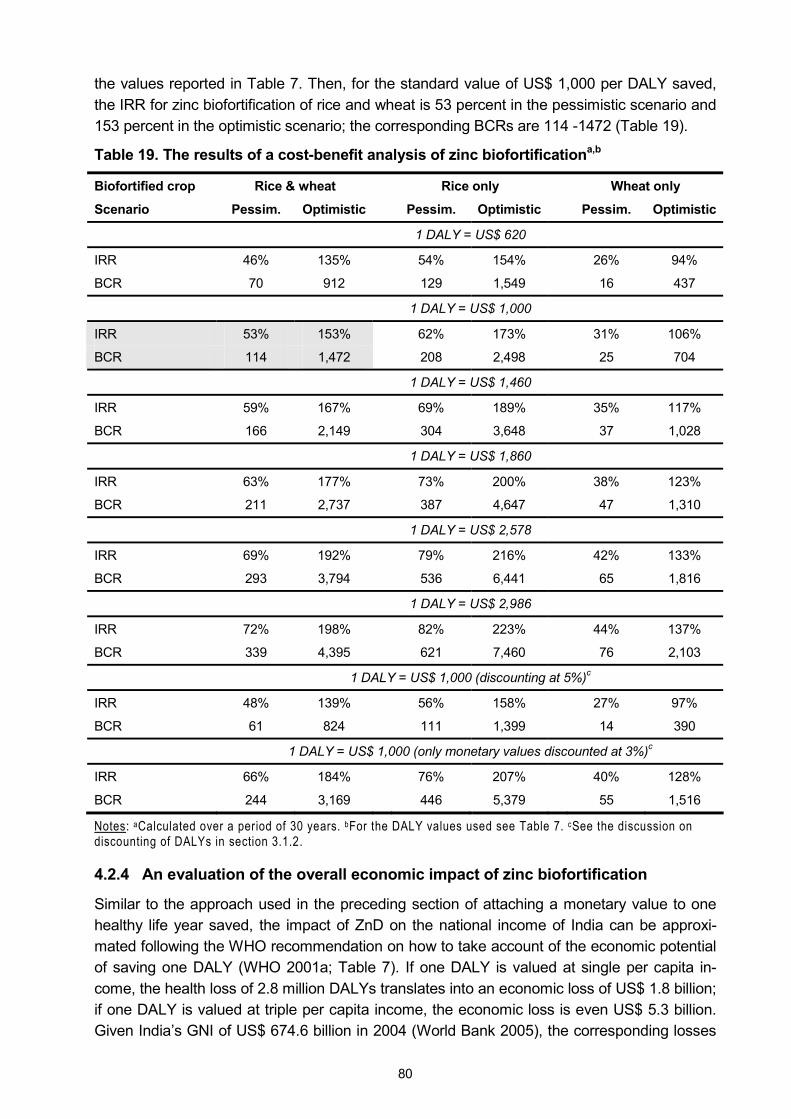
80
the values reported in Table 7. Then, for the standard value of US$ 1,000 per DALY saved, the IRR for zinc biofortification of rice and wheat is 53 percent in the pessimistic scenario and 153 percent in the optimistic scenario; the corresponding BCRs are 114 -1472 (Table 19).
Table 19. The results of a cost-benefit analysis of zinc biofortificationa,b
Biofortified crop Rice & wheat Rice only Wheat only
Scenario Pessim. Optimistic Pessim. Optimistic Pessim. Optimistic
1 DALY = US$ 620
IRR 46% 135% 54% 154% 26% 94%
BCR 70 912 129 1,549 16 437
1 DALY = US$ 1,000
IRR 53% 153% 62% 173% 31% 106%
BCR 114 1,472 208 2,498 25 704
1 DALY = US$ 1,460
IRR 59% 167% 69% 189% 35% 117%
BCR 166 2,149 304 3,648 37 1,028
1 DALY = US$ 1,860
IRR 63% 177% 73% 200% 38% 123%
BCR 211 2,737 387 4,647 47 1,310
1 DALY = US$ 2,578
IRR 69% 192% 79% 216% 42% 133%
BCR 293 3,794 536 6,441 65 1,816
1 DALY = US$ 2,986
IRR 72% 198% 82% 223% 44% 137%
BCR 339 4,395 621 7,460 76 2,103
1 DALY = US$ 1,000 (discounting at 5%)c
IRR 48% 139% 56% 158% 27% 97%
BCR 61 824 111 1,399 14 390
1 DALY = US$ 1,000 (only monetary values discounted at 3%)c
IRR 66% 184% 76% 207% 40% 128%
BCR 244 3,169 446 5,379 55 1,516
Notes: aCalculated over a period of 30 years. bFor the DALY values used see Table 7. cSee the discussion on discounting of DALYs in section 3.1.2.
4.2.4 An evaluation of the overall economic impact of zinc biofortification
Similar to the approach used in the preceding section of attaching a monetary value to one healthy life year saved, the impact of ZnD on the national income of India can be approxi-mated following the WHO recommendation on how to take account of the economic potential of saving one DALY (WHO 2001a; Table 7). If one DALY is valued at single per capita in-come, the health loss of 2.8 million DALYs translates into an economic loss of US$ 1.8 billion; if one DALY is valued at triple per capita income, the economic loss is even US$ 5.3 billion. Given India�s GNI of US$ 674.6 billion in 2004 (World Bank 2005), the corresponding losses
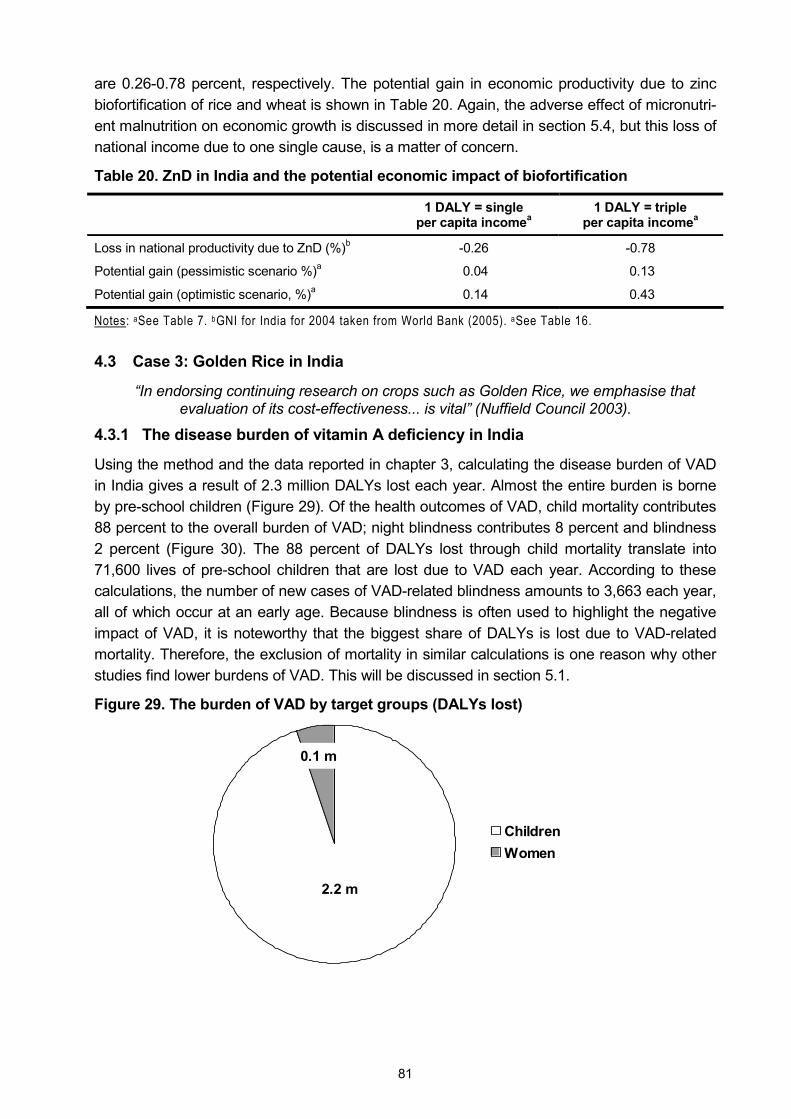
81
are 0.26-0.78 percent, respectively. The potential gain in economic productivity due to zinc biofortification of rice and wheat is shown in Table 20. Again, the adverse effect of micronutri-ent malnutrition on economic growth is discussed in more detail in section 5.4, but this loss of national income due to one single cause, is a matter of concern.
Table 20. ZnD in India and the potential economic impact of biofortification
1 DALY = single per capita incomea
1 DALY = triple per capita incomea
Loss in national productivity due to ZnD (%)b -0.26 -0.78
Potential gain (pessimistic scenario %)a 0.04 0.13
Potential gain (optimistic scenario, %)a 0.14 0.43
Notes: aSee Table 7. bGNI for India for 2004 taken from World Bank (2005). aSee Table 16.
4.3 Case 3: Golden Rice in India
�In endorsing continuing research on crops such as Golden Rice, we emphasise that evaluation of its cost-effectiveness... is vital� (Nuffield Council 2003).
4.3.1 The disease burden of vitamin A deficiency in India
Using the method and the data reported in chapter 3, calculating the disease burden of VAD in India gives a result of 2.3 million DALYs lost each year. Almost the entire burden is borne by pre-school children (Figure 29). Of the health outcomes of VAD, child mortality contributes 88 percent to the overall burden of VAD; night blindness contributes 8 percent and blindness 2 percent (Figure 30). The 88 percent of DALYs lost through child mortality translate into 71,600 lives of pre-school children that are lost due to VAD each year. According to these calculations, the number of new cases of VAD-related blindness amounts to 3,663 each year, all of which occur at an early age. Because blindness is often used to highlight the negative impact of VAD, it is noteworthy that the biggest share of DALYs is lost due to VAD-related mortality. Therefore, the exclusion of mortality in similar calculations is one reason why other studies find lower burdens of VAD. This will be discussed in section 5.1.
Figure 29. The burden of VAD by target groups (DALYs lost)
2.2 m
0.1 m
Children Women
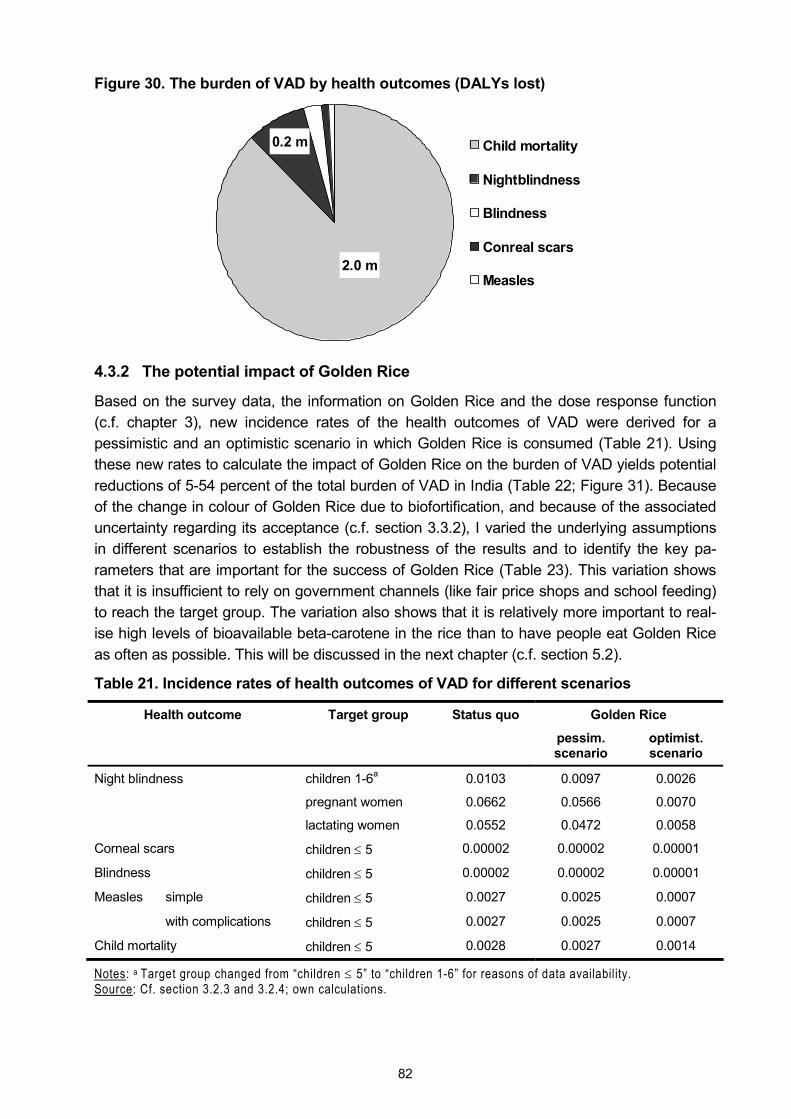
82
Figure 30. The burden of VAD by health outcomes (DALYs lost)
0.2 m
2.0 m
Child mortality
Nightblindness
Blindness
Conreal scars
Measles
4.3.2 The potential impact of Golden Rice
Based on the survey data, the information on Golden Rice and the dose response function (c.f. chapter 3), new incidence rates of the health outcomes of VAD were derived for a pessimistic and an optimistic scenario in which Golden Rice is consumed (Table 21). Using these new rates to calculate the impact of Golden Rice on the burden of VAD yields potential reductions of 5-54 percent of the total burden of VAD in India (Table 22; Figure 31). Because of the change in colour of Golden Rice due to biofortification, and because of the associated uncertainty regarding its acceptance (c.f. section 3.3.2), I varied the underlying assumptions in different scenarios to establish the robustness of the results and to identify the key pa-rameters that are important for the success of Golden Rice (Table 23). This variation shows that it is insufficient to rely on government channels (like fair price shops and school feeding) to reach the target group. The variation also shows that it is relatively more important to real-ise high levels of bioavailable beta-carotene in the rice than to have people eat Golden Rice as often as possible. This will be discussed in the next chapter (c.f. section 5.2).
Table 21. Incidence rates of health outcomes of VAD for different scenarios
Golden Rice Health outcome Target group Status quo
pessim. scenario
optimist. scenario
children 1-6a 0.0103 0.0097 0.0026
pregnant women 0.0662 0.0566 0.0070
Night blindness
lactating women 0.0552 0.0472 0.0058
Corneal scars children ≤ 5 0.00002 0.00002 0.00001
Blindness children ≤ 5 0.00002 0.00002 0.00001
simple children ≤ 5 0.0027 0.0025 0.0007 Measles
with complications children ≤ 5 0.0027 0.0025 0.0007
Child mortality children ≤ 5 0.0028 0.0027 0.0014
Notes: a Target group changed from �children ≤ 5� to �children 1-6� for reasons of data availability. Source: Cf. section 3.2.3 and 3.2.4; own calculations.

83
Table 22. The impact of Golden Rice on the burden of VAD in India
Scenario Pessim. Optim. a A b B
DALYs lost in status quo: 2.3 m
Remaining DALYs lost with biofortification 2.2 m 1.1 m 2.1 m 1.7 m 2.3 m 2.1 m
DALYs saved through biofortification 0.1 m 1.3 m 0.3 m 0.7 m 0.0 m 0.3 m
Change relative to status quo -4.8% -54% -11% -28% -0.5% -12%
Discounting at 5%, DALYs lost in status quo: 1.6 m
Remaining DALYs lost with biofortification 1.6 m 0.7 m 1.5 m 1.2 m 1.6 m 1.4 m
DALYs saved through biofortification 0.1 m 0.9 m 0.2 m 0.5 m 0.0 m 0.2 m
Change relative to status quo -5.0% -55% -11% -29% -0.6% -12%
No discounting, DALYs lost in status quo: 5.0 m
Remaining DALYs lost with biofortification 4.8 m 2.4 m 4.5 m 3.6 m 5.0 m 4.4 m
DALYs saved through biofortification 0.2 m 2.6 m 0.5 m 1.3 m 0.0 m 0.6 m
Change relative to status quo -4.5% -52% -10% -27% -0.5% -11%
Notes: a = pessimistic content, optimistic coverage; A = optimistic content, pessimistic coverage; b = pessimistic content, distribution only through government channels; B = optimistic content, distribution only through govern-ment channels; for a more detailed explanation of the scenarios see Table 23.
Figure 31. DALYs gained and lost in different scenarios with Golden Rice
-2.3 m
1.2 m
0.1 m
0.7 m
0.3 m 0.3 m0.0 m
-100%
-80%
-60%
-40%
-20%
0%
20%
40%
60%
Statusquo
Opti. Pess. A a B b
Notes: A = optimistic content, pessimistic coverage; a = pessimistic content, optimistic coverage; B = optimistic content, distribution only through government channels; b = pessimistic content, distribution only through gov-ernment channels; for a more detailed explanation of the scenarios see Table 23.
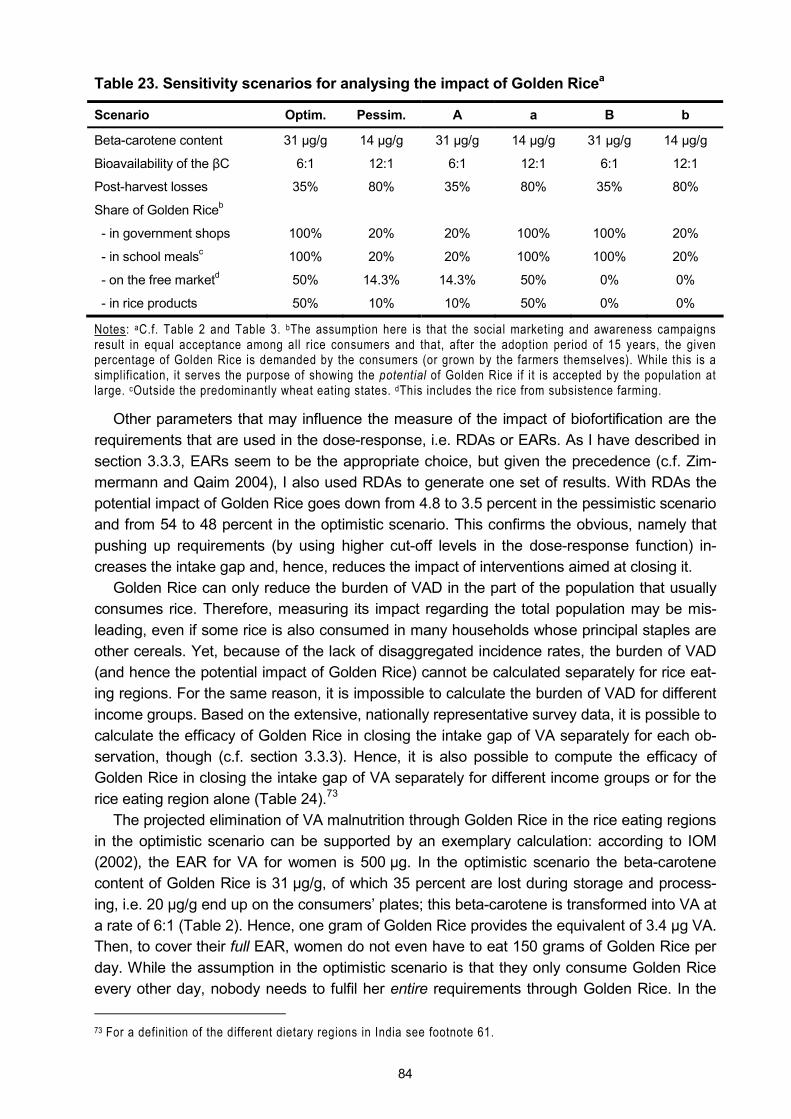
84
Table 23. Sensitivity scenarios for analysing the impact of Golden Ricea
Scenario Optim. Pessim. A a B b
Beta-carotene content 31 µg/g 14 µg/g 31 µg/g 14 µg/g 31 µg/g 14 µg/g
Bioavailability of the βC 6:1 12:1 6:1 12:1 6:1 12:1
Post-harvest losses 35% 80% 35% 80% 35% 80%
Share of Golden Riceb
- in government shops 100% 20% 20% 100% 100% 20%
- in school mealsc 100% 20% 20% 100% 100% 20%
- on the free marketd 50% 14.3% 14.3% 50% 0% 0%
- in rice products 50% 10% 10% 50% 0% 0%
Notes: aC.f. Table 2 and Table 3. bThe assumption here is that the social marketing and awareness campaigns result in equal acceptance among all rice consumers and that, after the adoption period of 15 years, the given percentage of Golden Rice is demanded by the consumers (or grown by the farmers themselves). While this is a simplification, it serves the purpose of showing the potential of Golden Rice if it is accepted by the population at large. cOutside the predominantly wheat eating states. dThis includes the rice from subsistence farming.
Other parameters that may influence the measure of the impact of biofortification are the requirements that are used in the dose-response, i.e. RDAs or EARs. As I have described in section 3.3.3, EARs seem to be the appropriate choice, but given the precedence (c.f. Zim-mermann and Qaim 2004), I also used RDAs to generate one set of results. With RDAs the potential impact of Golden Rice goes down from 4.8 to 3.5 percent in the pessimistic scenario and from 54 to 48 percent in the optimistic scenario. This confirms the obvious, namely that pushing up requirements (by using higher cut-off levels in the dose-response function) in-creases the intake gap and, hence, reduces the impact of interventions aimed at closing it.
Golden Rice can only reduce the burden of VAD in the part of the population that usually consumes rice. Therefore, measuring its impact regarding the total population may be mis-leading, even if some rice is also consumed in many households whose principal staples are other cereals. Yet, because of the lack of disaggregated incidence rates, the burden of VAD (and hence the potential impact of Golden Rice) cannot be calculated separately for rice eat-ing regions. For the same reason, it is impossible to calculate the burden of VAD for different income groups. Based on the extensive, nationally representative survey data, it is possible to calculate the efficacy of Golden Rice in closing the intake gap of VA separately for each ob-servation, though (c.f. section 3.3.3). Hence, it is also possible to compute the efficacy of Golden Rice in closing the intake gap of VA separately for different income groups or for the rice eating region alone (Table 24).73
The projected elimination of VA malnutrition through Golden Rice in the rice eating regions in the optimistic scenario can be supported by an exemplary calculation: according to IOM (2002), the EAR for VA for women is 500 µg. In the optimistic scenario the beta-carotene content of Golden Rice is 31 µg/g, of which 35 percent are lost during storage and process-ing, i.e. 20 µg/g end up on the consumers� plates; this beta-carotene is transformed into VA at a rate of 6:1 (Table 2). Hence, one gram of Golden Rice provides the equivalent of 3.4 µg VA. Then, to cover their full EAR, women do not even have to eat 150 grams of Golden Rice per day. While the assumption in the optimistic scenario is that they only consume Golden Rice every other day, nobody needs to fulfil her entire requirements through Golden Rice. In the 73 For a definition of the different dietary regions in India see footnote 61.
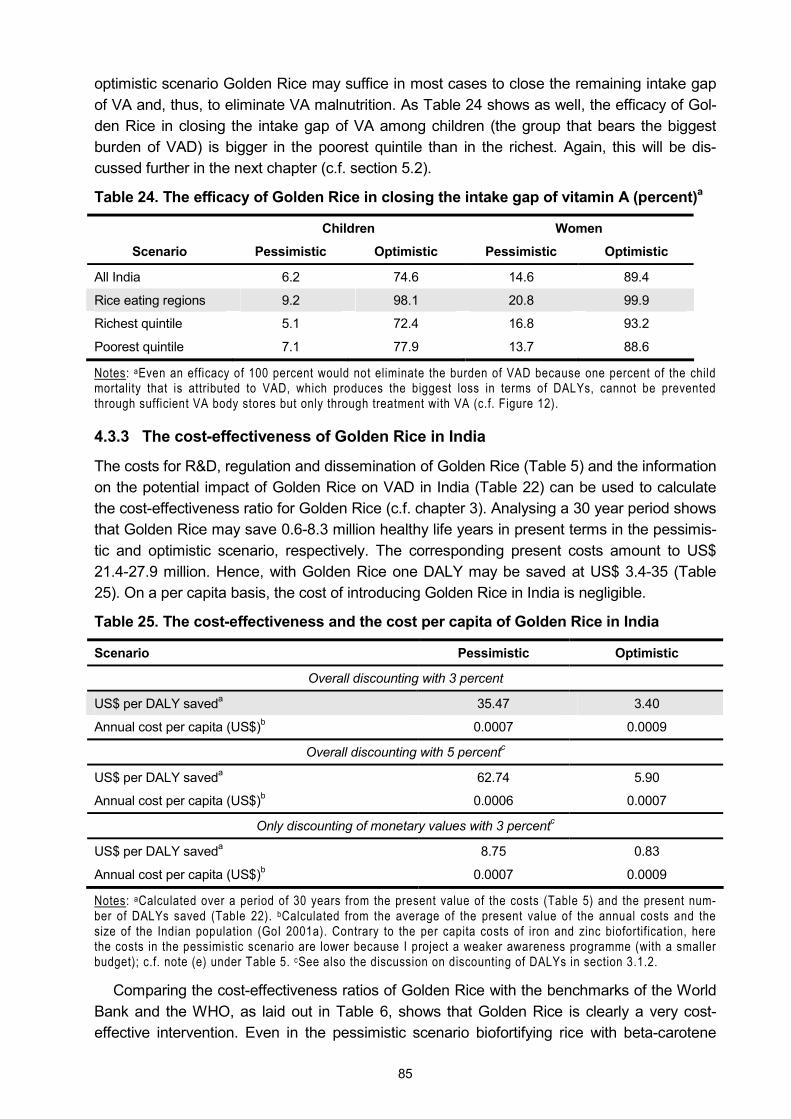
85
optimistic scenario Golden Rice may suffice in most cases to close the remaining intake gap of VA and, thus, to eliminate VA malnutrition. As Table 24 shows as well, the efficacy of Gol-den Rice in closing the intake gap of VA among children (the group that bears the biggest burden of VAD) is bigger in the poorest quintile than in the richest. Again, this will be dis-cussed further in the next chapter (c.f. section 5.2).
Table 24. The efficacy of Golden Rice in closing the intake gap of vitamin A (percent)a
Children Women
Scenario Pessimistic Optimistic Pessimistic Optimistic
All India 6.2 74.6 14.6 89.4
Rice eating regions 9.2 98.1 20.8 99.9
Richest quintile 5.1 72.4 16.8 93.2
Poorest quintile 7.1 77.9 13.7 88.6
Notes: aEven an efficacy of 100 percent would not eliminate the burden of VAD because one percent of the child mortality that is attributed to VAD, which produces the biggest loss in terms of DALYs, cannot be prevented through sufficient VA body stores but only through treatment with VA (c.f. Figure 12).
4.3.3 The cost-effectiveness of Golden Rice in India
The costs for R&D, regulation and dissemination of Golden Rice (Table 5) and the information on the potential impact of Golden Rice on VAD in India (Table 22) can be used to calculate the cost-effectiveness ratio for Golden Rice (c.f. chapter 3). Analysing a 30 year period shows that Golden Rice may save 0.6-8.3 million healthy life years in present terms in the pessimis-tic and optimistic scenario, respectively. The corresponding present costs amount to US$ 21.4-27.9 million. Hence, with Golden Rice one DALY may be saved at US$ 3.4-35 (Table 25). On a per capita basis, the cost of introducing Golden Rice in India is negligible.
Table 25. The cost-effectiveness and the cost per capita of Golden Rice in India
Scenario Pessimistic Optimistic
Overall discounting with 3 percent
US$ per DALY saveda 35.47 3.40
Annual cost per capita (US$)b 0.0007 0.0009
Overall discounting with 5 percentc
US$ per DALY saveda 62.74 5.90
Annual cost per capita (US$)b 0.0006 0.0007
Only discounting of monetary values with 3 percentc
US$ per DALY saveda 8.75 0.83
Annual cost per capita (US$)b 0.0007 0.0009
Notes: aCalculated over a period of 30 years from the present value of the costs (Table 5) and the present num-ber of DALYs saved (Table 22). bCalculated from the average of the present value of the annual costs and the size of the Indian population (GoI 2001a). Contrary to the per capita costs of iron and zinc biofortification, here the costs in the pessimistic scenario are lower because I project a weaker awareness programme (with a smaller budget); c.f. note (e) under Table 5. cSee also the discussion on discounting of DALYs in section 3.1.2.
Comparing the cost-effectiveness ratios of Golden Rice with the benchmarks of the World Bank and the WHO, as laid out in Table 6, shows that Golden Rice is clearly a very cost-effective intervention. Even in the pessimistic scenario biofortifying rice with beta-carotene
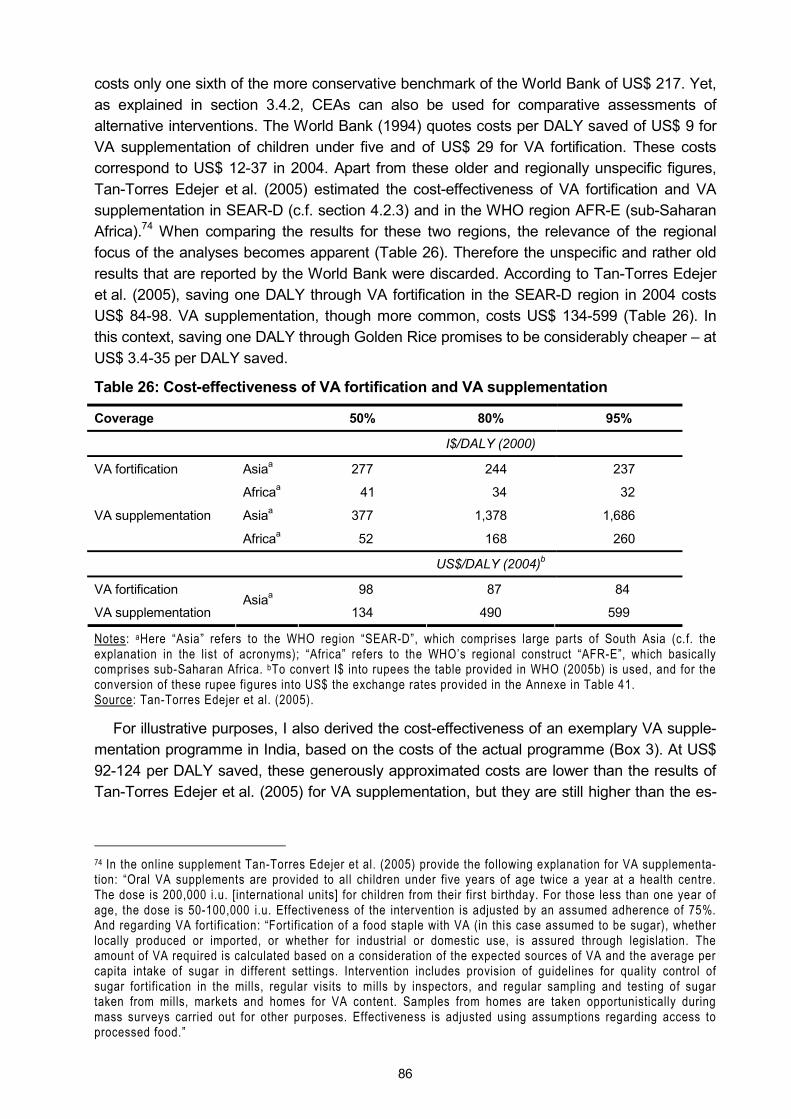
86
costs only one sixth of the more conservative benchmark of the World Bank of US$ 217. Yet, as explained in section 3.4.2, CEAs can also be used for comparative assessments of alternative interventions. The World Bank (1994) quotes costs per DALY saved of US$ 9 for VA supplementation of children under five and of US$ 29 for VA fortification. These costs correspond to US$ 12-37 in 2004. Apart from these older and regionally unspecific figures, Tan-Torres Edejer et al. (2005) estimated the cost-effectiveness of VA fortification and VA supplementation in SEAR-D (c.f. section 4.2.3) and in the WHO region AFR-E (sub-Saharan Africa).74 When comparing the results for these two regions, the relevance of the regional focus of the analyses becomes apparent (Table 26). Therefore the unspecific and rather old results that are reported by the World Bank were discarded. According to Tan-Torres Edejer et al. (2005), saving one DALY through VA fortification in the SEAR-D region in 2004 costs US$ 84-98. VA supplementation, though more common, costs US$ 134-599 (Table 26). In this context, saving one DALY through Golden Rice promises to be considerably cheaper � at US$ 3.4-35 per DALY saved.
Table 26: Cost-effectiveness of VA fortification and VA supplementation
Coverage 50% 80% 95%
I$/DALY (2000)
Asiaa 277 244 237 VA fortification
Africaa 41 34 32
Asiaa 377 1,378 1,686 VA supplementation
Africaa 52 168 260
US$/DALY (2004)b
VA fortification 98 87 84
VA supplementation Asiaa
134 490 599
Notes: aHere �Asia� refers to the WHO region �SEAR-D�, which comprises large parts of South Asia (c.f. the explanation in the list of acronyms); �Africa� refers to the WHO�s regional construct �AFR-E�, which basically comprises sub-Saharan Africa. bTo convert I$ into rupees the table provided in WHO (2005b) is used, and for the conversion of these rupee figures into US$ the exchange rates provided in the Annexe in Table 41. Source: Tan-Torres Edejer et al. (2005).
For illustrative purposes, I also derived the cost-effectiveness of an exemplary VA supple-mentation programme in India, based on the costs of the actual programme (Box 3). At US$ 92-124 per DALY saved, these generously approximated costs are lower than the results of Tan-Torres Edejer et al. (2005) for VA supplementation, but they are still higher than the es-
74 In the online supplement Tan-Torres Edejer et al. (2005) provide the following explanation for VA supplementa-tion: �Oral VA supplements are provided to all children under five years of age twice a year at a health centre. The dose is 200,000 i.u. [international units] for children from their first birthday. For those less than one year of age, the dose is 50-100,000 i.u. Effectiveness of the intervention is adjusted by an assumed adherence of 75%. And regarding VA fortification: �Fortification of a food staple with VA (in this case assumed to be sugar), whether locally produced or imported, or whether for industrial or domestic use, is assured through legislation. The amount of VA required is calculated based on a consideration of the expected sources of VA and the average per capita intake of sugar in different settings. Intervention includes provision of guidelines for quality control of sugar fortification in the mills, regular visits to mills by inspectors, and regular sampling and testing of sugar taken from mills, markets and homes for VA content. Samples from homes are taken opportunistically during mass surveys carried out for other purposes. Effectiveness is adjusted using assumptions regarding access to processed food.�
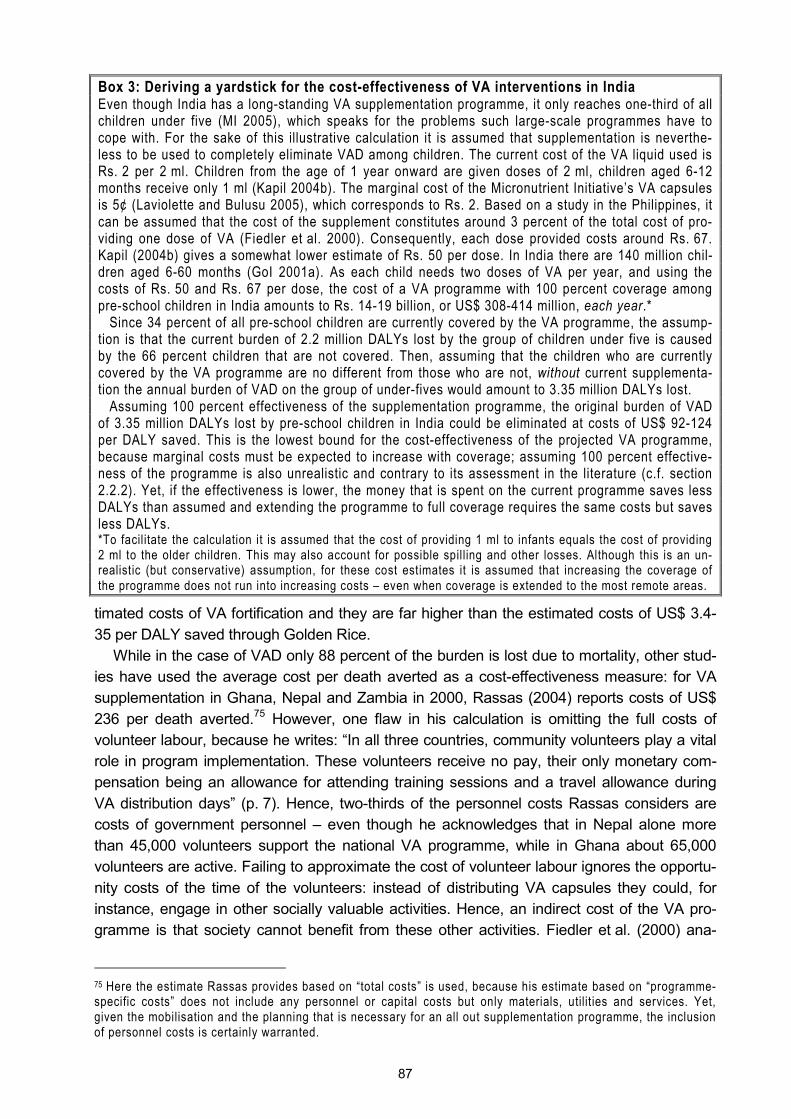
87
Box 3: Deriving a yardstick for the cost-effectiveness of VA interventions in India Even though India has a long-standing VA supplementation programme, it only reaches one-third of all children under five (MI 2005), which speaks for the problems such large-scale programmes have to cope with. For the sake of this illustrative calculation it is assumed that supplementation is neverthe-less to be used to completely eliminate VAD among children. The current cost of the VA liquid used is Rs. 2 per 2 ml. Children from the age of 1 year onward are given doses of 2 ml, children aged 6-12 months receive only 1 ml (Kapil 2004b). The marginal cost of the Micronutrient Initiative�s VA capsules is 5¢ (Laviolette and Bulusu 2005), which corresponds to Rs. 2. Based on a study in the Philippines, it can be assumed that the cost of the supplement constitutes around 3 percent of the total cost of pro-viding one dose of VA (Fiedler et al. 2000). Consequently, each dose provided costs around Rs. 67. Kapil (2004b) gives a somewhat lower estimate of Rs. 50 per dose. In India there are 140 million chil-dren aged 6-60 months (GoI 2001a). As each child needs two doses of VA per year, and using the costs of Rs. 50 and Rs. 67 per dose, the cost of a VA programme with 100 percent coverage among pre-school children in India amounts to Rs. 14-19 billion, or US$ 308-414 million, each year.*
Since 34 percent of all pre-school children are currently covered by the VA programme, the assump-tion is that the current burden of 2.2 million DALYs lost by the group of children under five is caused by the 66 percent children that are not covered. Then, assuming that the children who are currently covered by the VA programme are no different from those who are not, without current supplementa-tion the annual burden of VAD on the group of under-fives would amount to 3.35 million DALYs lost.
Assuming 100 percent effectiveness of the supplementation programme, the original burden of VAD of 3.35 million DALYs lost by pre-school children in India could be eliminated at costs of US$ 92-124 per DALY saved. This is the lowest bound for the cost-effectiveness of the projected VA programme, because marginal costs must be expected to increase with coverage; assuming 100 percent effective-ness of the programme is also unrealistic and contrary to its assessment in the literature (c.f. section 2.2.2). Yet, if the effectiveness is lower, the money that is spent on the current programme saves less DALYs than assumed and extending the programme to full coverage requires the same costs but saves less DALYs. *To facilitate the calculation it is assumed that the cost of providing 1 ml to infants equals the cost of providing 2 ml to the older children. This may also account for possible spilling and other losses. Although this is an un-realistic (but conservative) assumption, for these cost estimates it is assumed that increasing the coverage of the programme does not run into increasing costs � even when coverage is extended to the most remote areas.
timated costs of VA fortification and they are far higher than the estimated costs of US$ 3.4-35 per DALY saved through Golden Rice.
While in the case of VAD only 88 percent of the burden is lost due to mortality, other stud-ies have used the average cost per death averted as a cost-effectiveness measure: for VA supplementation in Ghana, Nepal and Zambia in 2000, Rassas (2004) reports costs of US$ 236 per death averted.75 However, one flaw in his calculation is omitting the full costs of volunteer labour, because he writes: �In all three countries, community volunteers play a vital role in program implementation. These volunteers receive no pay, their only monetary com-pensation being an allowance for attending training sessions and a travel allowance during VA distribution days� (p. 7). Hence, two-thirds of the personnel costs Rassas considers are costs of government personnel � even though he acknowledges that in Nepal alone more than 45,000 volunteers support the national VA programme, while in Ghana about 65,000 volunteers are active. Failing to approximate the cost of volunteer labour ignores the opportu-nity costs of the time of the volunteers: instead of distributing VA capsules they could, for instance, engage in other socially valuable activities. Hence, an indirect cost of the VA pro-gramme is that society cannot benefit from these other activities. Fiedler et al. (2000) ana-
75 Here the estimate Rassas provides based on �total costs� is used, because his estimate based on �programme-specific costs� does not include any personnel or capital costs but only materials, utilit ies and services. Yet, given the mobilisation and the planning that is necessary for an all out supplementation programme, the inclusion of personnel costs is certainly warranted.

88
lysed a VA programme on the Philippines, although not by means of DALYs. They report that 80 percent of the personnel who works for the VA programme are volunteers � whose labour time they value at the regional minimum wage. They also report that personnel costs account for 72 percent of the total costs of the VA programme and that the estimated opportunity costs of volunteer labour constitutes 41 percent of personnel costs and 30 percent of the total costs of the programme. If these proportions are applied to the costs reported by Rassas, it turns out that his overall costs need to be inflated by 85 percent, i.e. his cost per death averted of US$ 236 rises to US$ 436. In 2004 US dollars this corresponds to US$ 478.76 In another cross-country study, Ching et al. (2000) report average costs per death averted through routine VA supplementation of US$ 313-359 (converted to 2004 dollars). However, as they concede in the discussion of their results, their assumption of a 23 percent reduction in all-cause mortality among children receiving two doses of VA per year may be a limitation of their estimates: if the reduction is lower, the impact is smaller and the unit costs rise (also c.f. 3.2.3).
In the case of Golden Rice in India, over the given time frame of 30 years, biofortification may save 32,300-463,300 lives at present costs of US$ 21.4-27.9 million, respectively. Sav-ing the life of a child through Golden Rice may cost US$ 60 only � if the optimistic assump-tions are fulfilled. In the pessimistic case, saving the life of a child (i.e. potentially saving a whole productive working life) costs US$ 661. Hence, already a medium success of Golden Rice promises to be more cost-effective than the VA supplementation programmes analysed by Rassas (2004) and Ching et al. (2000). Yet, as was shown above, there can be substantial regional differences in the cost-effectiveness of VA interventions, with these interventions
Table 27. The results of a cost-benefit analysis of Golden Ricea,b
Scenario Pessimistic Optimistic Scenario Pessimistic Optimistic
1 DALY = US$ 620 1 DALY = US$ 1,000
IRR 26% 68% IRR 30% 76%
BCR 17 183 BCR 28 295
1 DALY = US$ 1,460 1 DALY = US$ 1,860
IRR 33% 82% IRR 35% 86%
BCR 41 430 BCR 52 548
1 DALY = US$ 2,578 1 DALY = US$ 2,986
IRR 39% 92% IRR 40% 94%
BCR 73 759 BCR 84 879
1 DALY = US$ 1,000 1 DALY = US$ 1,000
(discounting at 5%)c (only monetary values discounted at 3%)c
IRR 27% 71% IRR 36% 88%
BCR 16 170 BCR 114 1207
Notes: aCalculated over a period of 30 years. bFor the DALY values used see Table 7. cSee the discussion on discounting of DALYs in section 3.1.2.
76 In a somewhat older paper Horton (1999) reports a similar cost per death averted through VA supplementation (US$ 237), which in 2004 dollars corresponds to US$ 269. However the costs appear to only include the costs of the VA mega dose and, hence, suffer from the same limitation as Rassas� figures.
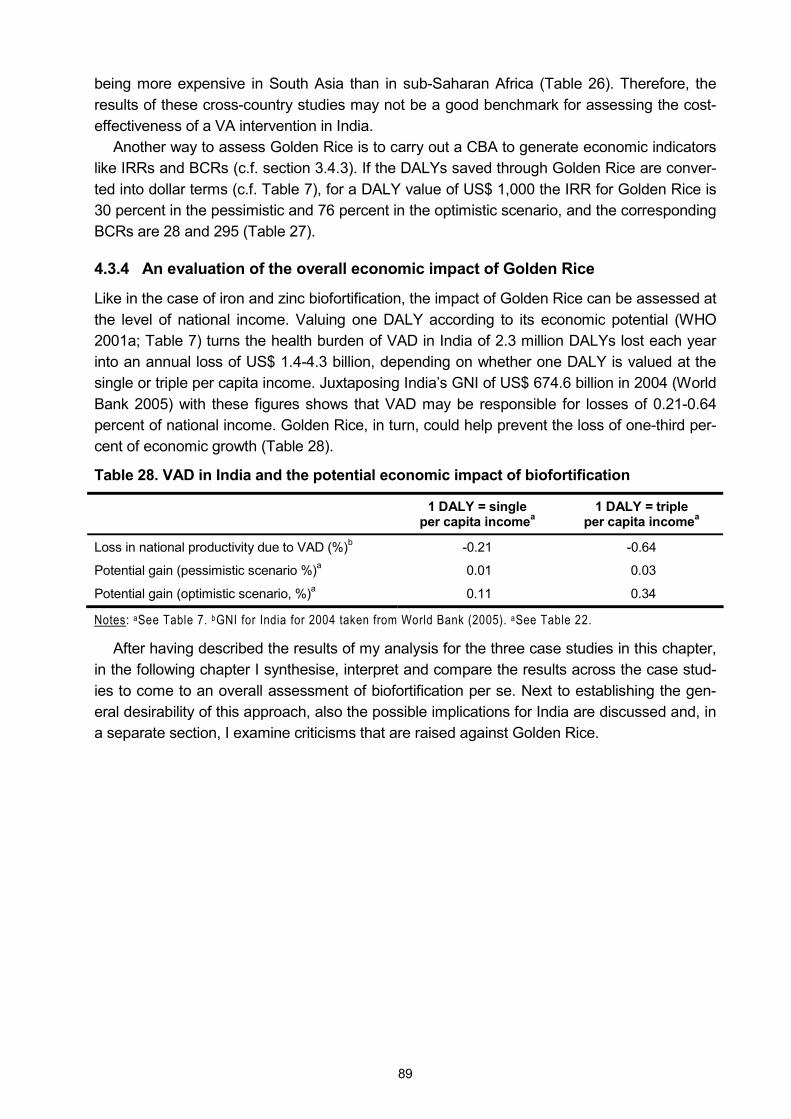
89
being more expensive in South Asia than in sub-Saharan Africa (Table 26). Therefore, the results of these cross-country studies may not be a good benchmark for assessing the cost-effectiveness of a VA intervention in India.
Another way to assess Golden Rice is to carry out a CBA to generate economic indicators like IRRs and BCRs (c.f. section 3.4.3). If the DALYs saved through Golden Rice are conver-ted into dollar terms (c.f. Table 7), for a DALY value of US$ 1,000 the IRR for Golden Rice is 30 percent in the pessimistic and 76 percent in the optimistic scenario, and the corresponding BCRs are 28 and 295 (Table 27).
4.3.4 An evaluation of the overall economic impact of Golden Rice
Like in the case of iron and zinc biofortification, the impact of Golden Rice can be assessed at the level of national income. Valuing one DALY according to its economic potential (WHO 2001a; Table 7) turns the health burden of VAD in India of 2.3 million DALYs lost each year into an annual loss of US$ 1.4-4.3 billion, depending on whether one DALY is valued at the single or triple per capita income. Juxtaposing India�s GNI of US$ 674.6 billion in 2004 (World Bank 2005) with these figures shows that VAD may be responsible for losses of 0.21-0.64 percent of national income. Golden Rice, in turn, could help prevent the loss of one-third per-cent of economic growth (Table 28).
Table 28. VAD in India and the potential economic impact of biofortification
1 DALY = single per capita incomea
1 DALY = triple per capita incomea
Loss in national productivity due to VAD (%)b -0.21 -0.64
Potential gain (pessimistic scenario %)a 0.01 0.03
Potential gain (optimistic scenario, %)a 0.11 0.34
Notes: aSee Table 7. bGNI for India for 2004 taken from World Bank (2005). aSee Table 22.
After having described the results of my analysis for the three case studies in this chapter, in the following chapter I synthesise, interpret and compare the results across the case stud-ies to come to an overall assessment of biofortification per se. Next to establishing the gen-eral desirability of this approach, also the possible implications for India are discussed and, in a separate section, I examine criticisms that are raised against Golden Rice.

90
5 Discussion
5.1 The disease burden of micronutrient malnutrition in India
In the introduction of this study I sketched the current situation in India regarding micronutrient malnutrition by referring to studies that report the prevalence rates of anaemia, ZnD and VAD. Only recently the Micronutrient Initiative published a report (MI 2005) that states that 60 per-cent of Indian women are anaemic. The corresponding results of the last National Family Health Survey (NFHS 2000) indicate that �only� 52 percent of ever-married women are anae-mic. And while Hotz and Brown (2004) report that 26 percent of the Indian population is at risk of inadequate zinc intakes, the Micronutrient Initiative writes of 26 percent of India�s popula-tion that is zinc deficient. The UN Standing Committee on Nutrition (UN-SCN 2004) quotes a figure of 31 percent of preschool children in India being VA deficient; the Micronutrient Initia-tive points out that �57 per cent of children under 6 years of age are at potential danger from sub-clinical Vitamin A deficiency� (p. 11). In this context, quantifying the actual burden of each deficiency contributes to more transparency and, because the burdens are measured in a single metric, their overall severities are made comparable.
According to my estimates, with 4.0 million DALYs lost each year, IDA imposes by far the biggest disease burden in India. With annual losses of 2.8 and 2.3 million DALYs due to ZnD and VAD, respectively, these two deficiencies still represent an important loss of health and life, too (Figure 32). This result shows also that VAD, which is popularly associated with se-vere health outcomes (blindness and child deaths), imposes the smallest burden of the three micronutrient deficiencies. IDA, however, which is commonly rather equated with less severe health consequences like fatigue and reduced productivity, is of much bigger concern. The reason for this is obvious: even though some health outcomes of VAD (and ZnD) are severe, only few people are afflicted with these severe outcomes. IDA, in contrast, affects many more people, but the consequences are less severe: the 4.0 million DALYs lost due to IDA each year are caused by 8.4 million new cases of one form of IDA or another. On the other hand, the 2.3 million DALYs lost due to VAD are caused by �only� 4.3 million new cases each year. ZnD causes the loss of 2.8 million DALYs each year, but this loss is caused by 11.5 million new cases of ZnD. Yet, most of these cases are cases of stunting, which only carry a very minor disability weight and, consequently do not contribute significantly to the burden of ZnD (Table 29). In this respect, each new case of IDA causes an average loss of 0.48 DALYs, each new case of VAD an average loss of 0.55 DALYs and each new case of ZnD of 0.25.
Figure 32. IDA, ZnD and VAD in India, ranked by the number of DALYs lost
2.3 m
2.8 m
4.0 m
0 m 1 m 2 m 3 m 4 m 5 m
IDA
ZnD
VAD

91
Table 29: Width and depth of IDA, ZnD and VAD in India
Health outcomes New cases per year DALYs lost per year
(problem width) (problem depth)
Impaired physical activity (mIDA) 1,061,245
Impaired mental development (mIDA) 7,489,502a
1,268,448
Impaired physical activity (sIDA) 820,951
Impaired mental development (sIDA) 592,511
Maternal mortality (sIDA)
874,615a
181,577
IDA
Stillbirths and child mortality 2,115 59,274
Sum for IDA 8,366,232 3,984,006
Average of DALYs lost per case 0.48
Stunting 11,401,923 31,953
Pneumonia 43,030
Diarrhoea 68,333
ZnD
Child mortality
95,500b
2,688,943
Sum for ZnD 11,497,423 2,832,259
Average of DALYs lost per case 0.25
Night blindness among pregnant and lactating women 1,850,402 114,513
Night blindness among children 78,576
Corneal scars 20,876
Blindness (preceded by corneal scars)
1,595,201c
53,264
Measles among children 3,949
Measles with complications 15,789
VAD
Child mortality
823,942d
2,041,145
Sum for VAD 4,269,545 2,327,448
Average of DALYs lost per case 0.55
Notes: a By definition all individuals who suffer from moderate or severe IDA suffer from both impaired physical activity and impaired mental development. Hence, these two outcomes only count as one case. The same is true for maternal mortality: only mothers with severe IDA are supposed to be at risk, hence their deaths are no new cases. bTo avoid double counting it is assumed that children who die due to ZnD-related causes suffered from either pneumonia or diarrhoea, i.e. these deaths are not counted as new cases. cTo avoid double counting it is assumed that children who suffer from corneal scars or blindness due to VAD previously also suffered from night blindness. dTo avoid double counting it is assumed that children who die due to VAD-related causes previously also suffered from measles.
Figure 33 shows a similar connection, namely the annual burden of each deficiency due to mortality and the corresponding health loss expressed in DALYs. This figure illustrates very well why using cause-specific mortality to approximate the burden of a disease may be mis-leading: ZnD is highest up on the scale of �lives lost�, i.e. more lives are lost due to ZnD than to either VAD or to IDA. But, when looking at the number of �DALYs lost�, IDA ranks highest. Hence, by only considering mortality all other health outcomes and their � sometimes severe � consequences for human well-being are ignored.

92
Figure 33. The annual loss of life and health due to IDA, ZnD and VAD in India
71,625
95,500
9,057
2.3 m
2.8 m
4.0 m
0
25,000
50,000
75,000
100,000
VAD ZnD IDA
Live
s lo
st
0 m
1 m
2 m
3 m
4 m
DA
LYs
lost
Lives lost DALYs lost
The issue of the width and the depth of each deficiency are also relevant when it comes to
controlling the respective micronutrient deficiencies. For example, to completely eliminate IDA, 8.4 million people would need to become iron sufficient. However, to reduce the burden of IDA by 42 percent, only 875,000 people need to become iron sufficient (namely those who suffer from severe IDA). In this case an appropriate strategy may be to choose an iron inter-vention that provides smaller amounts of additional iron to many people at a low cost (like fortification or biofortification) and to complement this intervention with supplementation ef-forts targeted at the relatively few individuals who suffer from severe IDA and for whom smaller amounts of additional iron may be inadequate to achieve sufficiency. On the other hand, in the case of VAD, an undifferentiated and global approach to control the deficiency may waste resources because the problem is a more focal one. In this case analysing more thoroughly in which regions and sub-groups of society VAD is a problem and targeting the VA interventions accordingly may be a reasonable approach � whether it is the targeting of sup-plementation efforts, of the food that is fortified or of the crops that are biofortified. Yet, the burdens of IDA, ZnD and VAD that I calculated here are based on conservative assumptions about the extent of the adverse functional outcomes they cause;77 the possible health effects of sub-clinical deficiencies are ignored altogether. Therefore, any micronutrient intervention may benefit many more people (albeit to a lesser extent) than is suggested here. This can also qualify the assessment of the appropriate VA intervention that I just made.
If the DALYs lost due to each deficiency are combined, the overall burden of IDA, ZnD and VAD amounts to an annual loss of 9.1 million DALYs. Given India�s population of one billion people, this represents a loss of about 0.01 DALYs � or 3.2 �disability-adjusted life days� � per person per year. Of these 9.1 million DALYs lost, 52.4 percent are lost due to infant and child mortality. Despite my cautioning against looking at mortality figures only, this neverthe-less shows the severity of the problem of micronutrient malnutrition and it also underlines who suffers most from micronutrient malnutrition: children. Apart from children, it is women who are affected the most by micronutrient deficiencies. Not only are women affected twice as
77 For example the Micronutrient Initiative (MI 2005, p. 11) claims that �vitamin a deficiency precipitates the death of 330,000 children every year in the country.� My own calculations indicate a loss of �only� 71,625 child lives due to VAD.
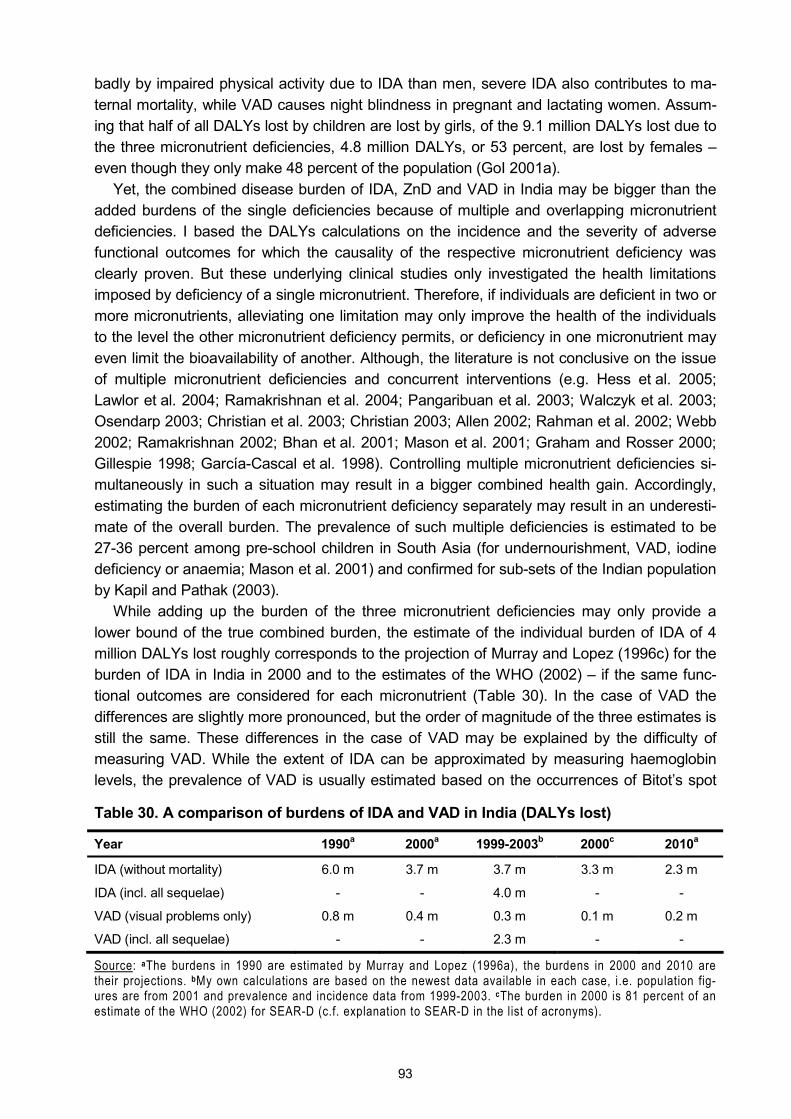
93
badly by impaired physical activity due to IDA than men, severe IDA also contributes to ma-ternal mortality, while VAD causes night blindness in pregnant and lactating women. Assum-ing that half of all DALYs lost by children are lost by girls, of the 9.1 million DALYs lost due to the three micronutrient deficiencies, 4.8 million DALYs, or 53 percent, are lost by females � even though they only make 48 percent of the population (GoI 2001a).
Yet, the combined disease burden of IDA, ZnD and VAD in India may be bigger than the added burdens of the single deficiencies because of multiple and overlapping micronutrient deficiencies. I based the DALYs calculations on the incidence and the severity of adverse functional outcomes for which the causality of the respective micronutrient deficiency was clearly proven. But these underlying clinical studies only investigated the health limitations imposed by deficiency of a single micronutrient. Therefore, if individuals are deficient in two or more micronutrients, alleviating one limitation may only improve the health of the individuals to the level the other micronutrient deficiency permits, or deficiency in one micronutrient may even limit the bioavailability of another. Although, the literature is not conclusive on the issue of multiple micronutrient deficiencies and concurrent interventions (e.g. Hess et al. 2005; Lawlor et al. 2004; Ramakrishnan et al. 2004; Pangaribuan et al. 2003; Walczyk et al. 2003; Osendarp 2003; Christian et al. 2003; Christian 2003; Allen 2002; Rahman et al. 2002; Webb 2002; Ramakrishnan 2002; Bhan et al. 2001; Mason et al. 2001; Graham and Rosser 2000; Gillespie 1998; García-Cascal et al. 1998). Controlling multiple micronutrient deficiencies si-multaneously in such a situation may result in a bigger combined health gain. Accordingly, estimating the burden of each micronutrient deficiency separately may result in an underesti-mate of the overall burden. The prevalence of such multiple deficiencies is estimated to be 27-36 percent among pre-school children in South Asia (for undernourishment, VAD, iodine deficiency or anaemia; Mason et al. 2001) and confirmed for sub-sets of the Indian population by Kapil and Pathak (2003).
While adding up the burden of the three micronutrient deficiencies may only provide a lower bound of the true combined burden, the estimate of the individual burden of IDA of 4 million DALYs lost roughly corresponds to the projection of Murray and Lopez (1996c) for the burden of IDA in India in 2000 and to the estimates of the WHO (2002) � if the same func-tional outcomes are considered for each micronutrient (Table 30). In the case of VAD the differences are slightly more pronounced, but the order of magnitude of the three estimates is still the same. These differences in the case of VAD may be explained by the difficulty of measuring VAD. While the extent of IDA can be approximated by measuring haemoglobin levels, the prevalence of VAD is usually estimated based on the occurrences of Bitot�s spot
Table 30. A comparison of burdens of IDA and VAD in India (DALYs lost)
Year 1990a 2000a 1999-2003b 2000c 2010a
IDA (without mortality) 6.0 m 3.7 m 3.7 m 3.3 m 2.3 m
IDA (incl. all sequelae) - - 4.0 m - -
VAD (visual problems only) 0.8 m 0.4 m 0.3 m 0.1 m 0.2 m
VAD (incl. all sequelae) - - 2.3 m - -
Source: aThe burdens in 1990 are estimated by Murray and Lopez (1996a), the burdens in 2000 and 2010 are their projections. bMy own calculations are based on the newest data available in each case, i.e. population fig-ures are from 2001 and prevalence and incidence data from 1999-2003. cThe burden in 2000 is 81 percent of an estimate of the WHO (2002) for SEAR-D (c.f. explanation to SEAR-D in the list of acronyms).
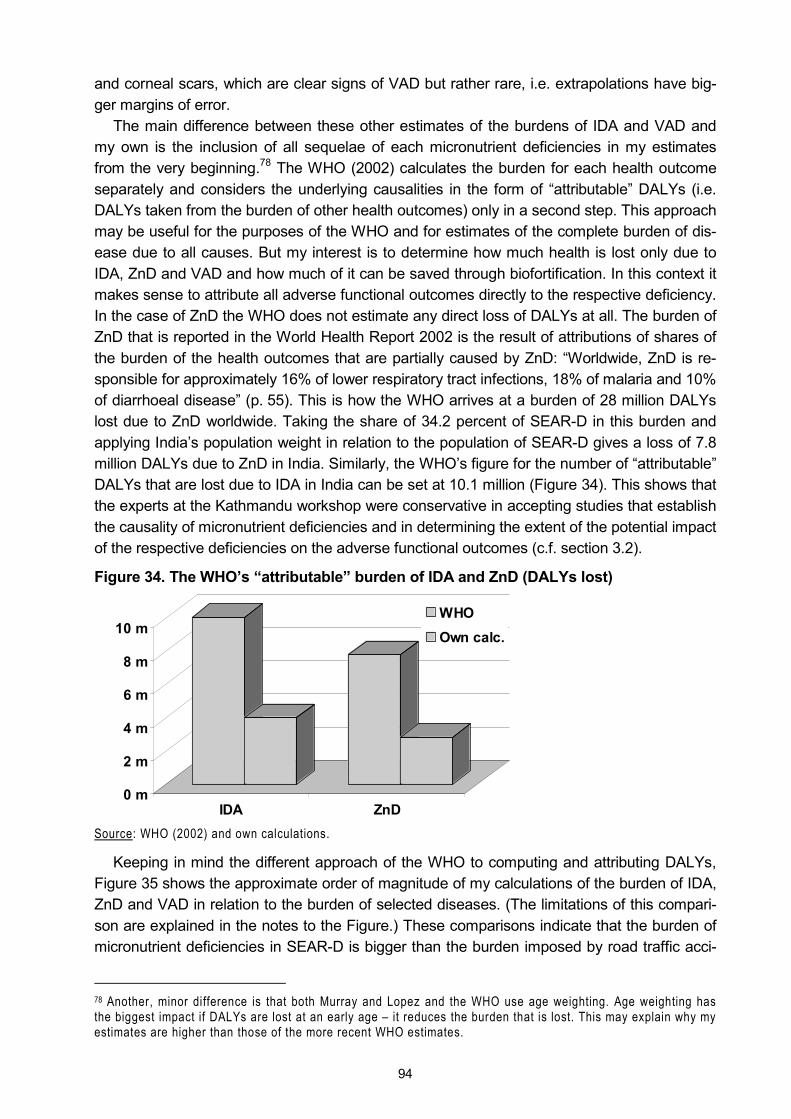
94
and corneal scars, which are clear signs of VAD but rather rare, i.e. extrapolations have big-ger margins of error.
The main difference between these other estimates of the burdens of IDA and VAD and my own is the inclusion of all sequelae of each micronutrient deficiencies in my estimates from the very beginning.78 The WHO (2002) calculates the burden for each health outcome separately and considers the underlying causalities in the form of �attributable� DALYs (i.e. DALYs taken from the burden of other health outcomes) only in a second step. This approach may be useful for the purposes of the WHO and for estimates of the complete burden of dis-ease due to all causes. But my interest is to determine how much health is lost only due to IDA, ZnD and VAD and how much of it can be saved through biofortification. In this context it makes sense to attribute all adverse functional outcomes directly to the respective deficiency. In the case of ZnD the WHO does not estimate any direct loss of DALYs at all. The burden of ZnD that is reported in the World Health Report 2002 is the result of attributions of shares of the burden of the health outcomes that are partially caused by ZnD: �Worldwide, ZnD is re-sponsible for approximately 16% of lower respiratory tract infections, 18% of malaria and 10% of diarrhoeal disease� (p. 55). This is how the WHO arrives at a burden of 28 million DALYs lost due to ZnD worldwide. Taking the share of 34.2 percent of SEAR-D in this burden and applying India�s population weight in relation to the population of SEAR-D gives a loss of 7.8 million DALYs due to ZnD in India. Similarly, the WHO�s figure for the number of �attributable� DALYs that are lost due to IDA in India can be set at 10.1 million (Figure 34). This shows that the experts at the Kathmandu workshop were conservative in accepting studies that establish the causality of micronutrient deficiencies and in determining the extent of the potential impact of the respective deficiencies on the adverse functional outcomes (c.f. section 3.2).
Figure 34. The WHO�s �attributable� burden of IDA and ZnD (DALYs lost)
0 m
2 m
4 m
6 m
8 m
10 m
IDA ZnD
WHOOwn calc.
Source: WHO (2002) and own calculations.
Keeping in mind the different approach of the WHO to computing and attributing DALYs, Figure 35 shows the approximate order of magnitude of my calculations of the burden of IDA, ZnD and VAD in relation to the burden of selected diseases. (The limitations of this compari-son are explained in the notes to the Figure.) These comparisons indicate that the burden of micronutrient deficiencies in SEAR-D is bigger than the burden imposed by road traffic acci-
78 Another, minor difference is that both Murray and Lopez and the WHO use age weighting. Age weighting has the biggest impact if DALYs are lost at an early age � it reduces the burden that is lost. This may explain why my estimates are higher than those of the more recent WHO estimates.
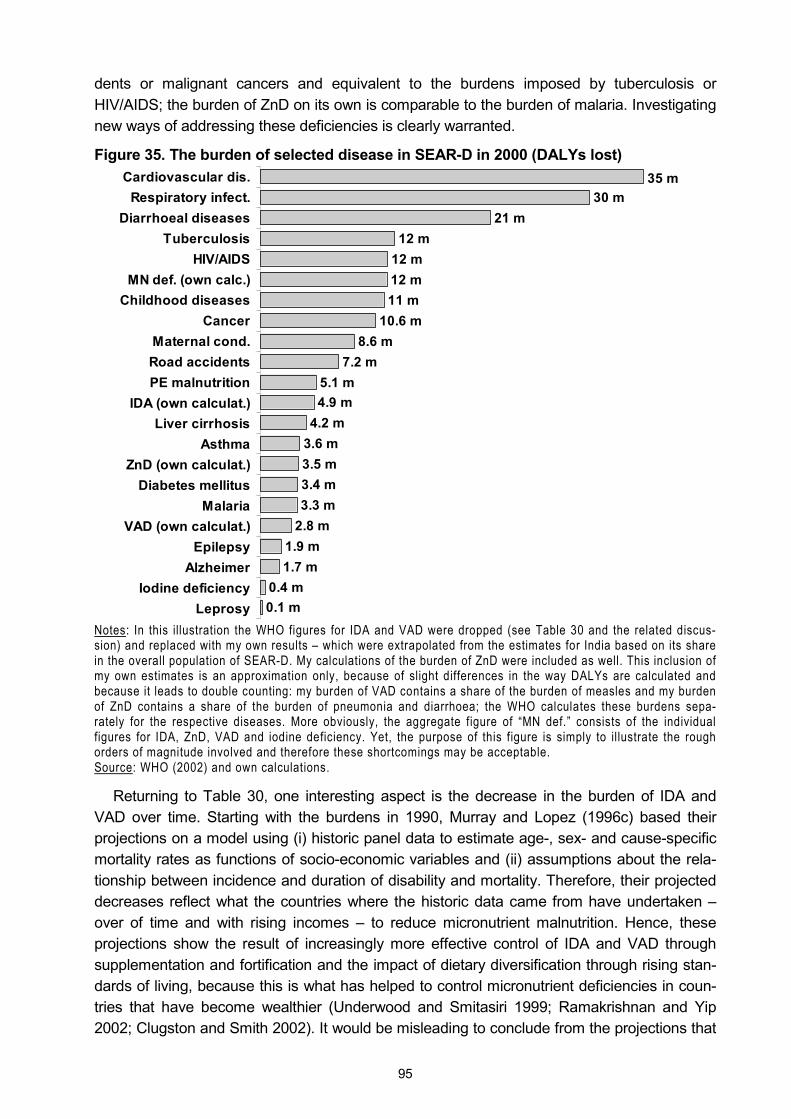
95
dents or malignant cancers and equivalent to the burdens imposed by tuberculosis or HIV/AIDS; the burden of ZnD on its own is comparable to the burden of malaria. Investigating new ways of addressing these deficiencies is clearly warranted.
Figure 35. The burden of selected disease in SEAR-D in 2000 (DALYs lost)
10.6 m8.6 m
7.2 m5.1 m4.9 m
4.2 m3.6 m3.5 m3.4 m3.3 m
2.8 m1.9 m1.7 m
0.4 m0.1 m
35 m30 m
21 m12 m
12 m12 m11 m
Cardiovascular dis.Respiratory infect.
Diarrhoeal diseasesTuberculosis
HIV/AIDSMN def. (own calc.)
Childhood diseasesCancer
Maternal cond.Road accidentsPE malnutrition
IDA (own calculat.)Liver cirrhosis
AsthmaZnD (own calculat.)
Diabetes mellitusMalaria
VAD (own calculat.)Epilepsy
AlzheimerIodine deficiency
Leprosy Notes: In this illustration the WHO figures for IDA and VAD were dropped (see Table 30 and the related discus-sion) and replaced with my own results � which were extrapolated from the estimates for India based on its share in the overall population of SEAR-D. My calculations of the burden of ZnD were included as well. This inclusion of my own estimates is an approximation only, because of slight differences in the way DALYs are calculated and because it leads to double counting: my burden of VAD contains a share of the burden of measles and my burden of ZnD contains a share of the burden of pneumonia and diarrhoea; the WHO calculates these burdens sepa-rately for the respective diseases. More obviously, the aggregate figure of �MN def.� consists of the individual figures for IDA, ZnD, VAD and iodine deficiency. Yet, the purpose of this figure is simply to il lustrate the rough orders of magnitude involved and therefore these shortcomings may be acceptable. Source: WHO (2002) and own calculations.
Returning to Table 30, one interesting aspect is the decrease in the burden of IDA and VAD over time. Starting with the burdens in 1990, Murray and Lopez (1996c) based their projections on a model using (i) historic panel data to estimate age-, sex- and cause-specific mortality rates as functions of socio-economic variables and (ii) assumptions about the rela-tionship between incidence and duration of disability and mortality. Therefore, their projected decreases reflect what the countries where the historic data came from have undertaken � over of time and with rising incomes � to reduce micronutrient malnutrition. Hence, these projections show the result of increasingly more effective control of IDA and VAD through supplementation and fortification and the impact of dietary diversification through rising stan-dards of living, because this is what has helped to control micronutrient deficiencies in coun-tries that have become wealthier (Underwood and Smitasiri 1999; Ramakrishnan and Yip 2002; Clugston and Smith 2002). It would be misleading to conclude from the projections that
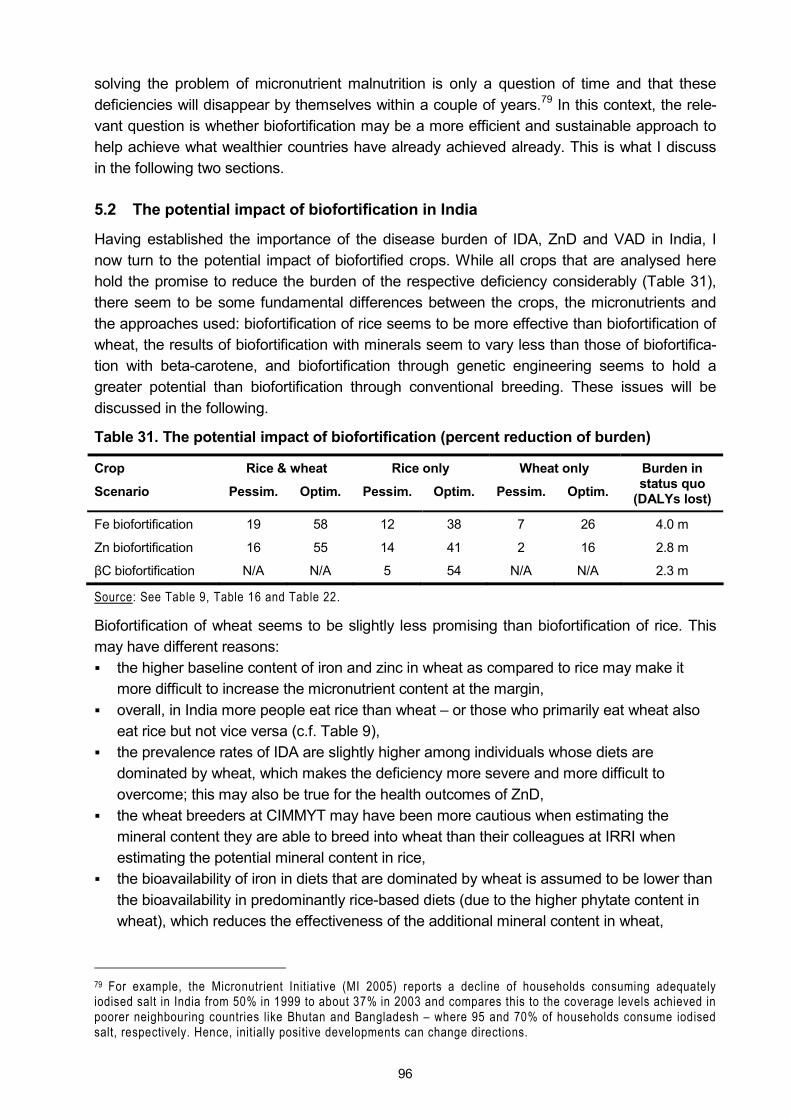
96
solving the problem of micronutrient malnutrition is only a question of time and that these deficiencies will disappear by themselves within a couple of years.79 In this context, the rele-vant question is whether biofortification may be a more efficient and sustainable approach to help achieve what wealthier countries have already achieved already. This is what I discuss in the following two sections.
5.2 The potential impact of biofortification in India
Having established the importance of the disease burden of IDA, ZnD and VAD in India, I now turn to the potential impact of biofortified crops. While all crops that are analysed here hold the promise to reduce the burden of the respective deficiency considerably (Table 31), there seem to be some fundamental differences between the crops, the micronutrients and the approaches used: biofortification of rice seems to be more effective than biofortification of wheat, the results of biofortification with minerals seem to vary less than those of biofortifica-tion with beta-carotene, and biofortification through genetic engineering seems to hold a greater potential than biofortification through conventional breeding. These issues will be discussed in the following.
Table 31. The potential impact of biofortification (percent reduction of burden)
Crop Rice & wheat Rice only Wheat only
Scenario Pessim. Optim. Pessim. Optim. Pessim. Optim.
Burden in status quo
(DALYs lost)
Fe biofortification 19 58 12 38 7 26 4.0 m
Zn biofortification 16 55 14 41 2 16 2.8 m
βC biofortification N/A N/A 5 54 N/A N/A 2.3 m
Source: See Table 9, Table 16 and Table 22.
Biofortification of wheat seems to be slightly less promising than biofortification of rice. This may have different reasons: ! the higher baseline content of iron and zinc in wheat as compared to rice may make it
more difficult to increase the micronutrient content at the margin, ! overall, in India more people eat rice than wheat � or those who primarily eat wheat also
eat rice but not vice versa (c.f. Table 9), ! the prevalence rates of IDA are slightly higher among individuals whose diets are
dominated by wheat, which makes the deficiency more severe and more difficult to overcome; this may also be true for the health outcomes of ZnD,
! the wheat breeders at CIMMYT may have been more cautious when estimating the mineral content they are able to breed into wheat than their colleagues at IRRI when estimating the potential mineral content in rice,
! the bioavailability of iron in diets that are dominated by wheat is assumed to be lower than the bioavailability in predominantly rice-based diets (due to the higher phytate content in wheat), which reduces the effectiveness of the additional mineral content in wheat,
79 For example, the Micronutrient Initiative (MI 2005) reports a decline of households consuming adequately iodised salt in India from 50% in 1999 to about 37% in 2003 and compares this to the coverage levels achieved in poorer neighbouring countries like Bhutan and Bangladesh � where 95 and 70% of households consume iodised salt, respectively. Hence, initially positive developments can change directions.
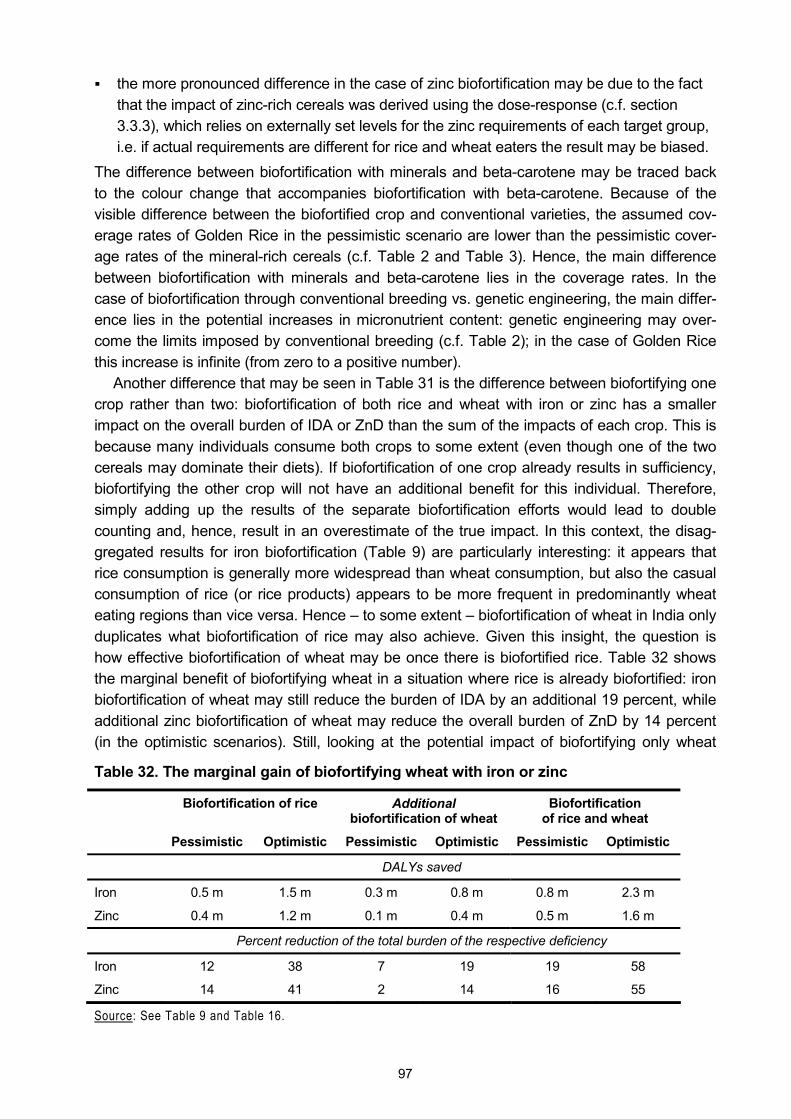
97
! the more pronounced difference in the case of zinc biofortification may be due to the fact that the impact of zinc-rich cereals was derived using the dose-response (c.f. section 3.3.3), which relies on externally set levels for the zinc requirements of each target group, i.e. if actual requirements are different for rice and wheat eaters the result may be biased.
The difference between biofortification with minerals and beta-carotene may be traced back to the colour change that accompanies biofortification with beta-carotene. Because of the visible difference between the biofortified crop and conventional varieties, the assumed cov-erage rates of Golden Rice in the pessimistic scenario are lower than the pessimistic cover-age rates of the mineral-rich cereals (c.f. Table 2 and Table 3). Hence, the main difference between biofortification with minerals and beta-carotene lies in the coverage rates. In the case of biofortification through conventional breeding vs. genetic engineering, the main differ-ence lies in the potential increases in micronutrient content: genetic engineering may over-come the limits imposed by conventional breeding (c.f. Table 2); in the case of Golden Rice this increase is infinite (from zero to a positive number).
Another difference that may be seen in Table 31 is the difference between biofortifying one crop rather than two: biofortification of both rice and wheat with iron or zinc has a smaller impact on the overall burden of IDA or ZnD than the sum of the impacts of each crop. This is because many individuals consume both crops to some extent (even though one of the two cereals may dominate their diets). If biofortification of one crop already results in sufficiency, biofortifying the other crop will not have an additional benefit for this individual. Therefore, simply adding up the results of the separate biofortification efforts would lead to double counting and, hence, result in an overestimate of the true impact. In this context, the disag-gregated results for iron biofortification (Table 9) are particularly interesting: it appears that rice consumption is generally more widespread than wheat consumption, but also the casual consumption of rice (or rice products) appears to be more frequent in predominantly wheat eating regions than vice versa. Hence � to some extent � biofortification of wheat in India only duplicates what biofortification of rice may also achieve. Given this insight, the question is how effective biofortification of wheat may be once there is biofortified rice. Table 32 shows the marginal benefit of biofortifying wheat in a situation where rice is already biofortified: iron biofortification of wheat may still reduce the burden of IDA by an additional 19 percent, while additional zinc biofortification of wheat may reduce the overall burden of ZnD by 14 percent (in the optimistic scenarios). Still, looking at the potential impact of biofortifying only wheat
Table 32. The marginal gain of biofortifying wheat with iron or zinc
Biofortification of rice Additional biofortification of wheat
Biofortification of rice and wheat
Pessimistic Optimistic Pessimistic Optimistic Pessimistic Optimistic
DALYs saved
Iron 0.5 m 1.5 m 0.3 m 0.8 m 0.8 m 2.3 m
Zinc 0.4 m 1.2 m 0.1 m 0.4 m 0.5 m 1.6 m
Percent reduction of the total burden of the respective deficiency
Iron 12 38 7 19 19 58
Zinc 14 41 2 14 16 55
Source: See Table 9 and Table 16.
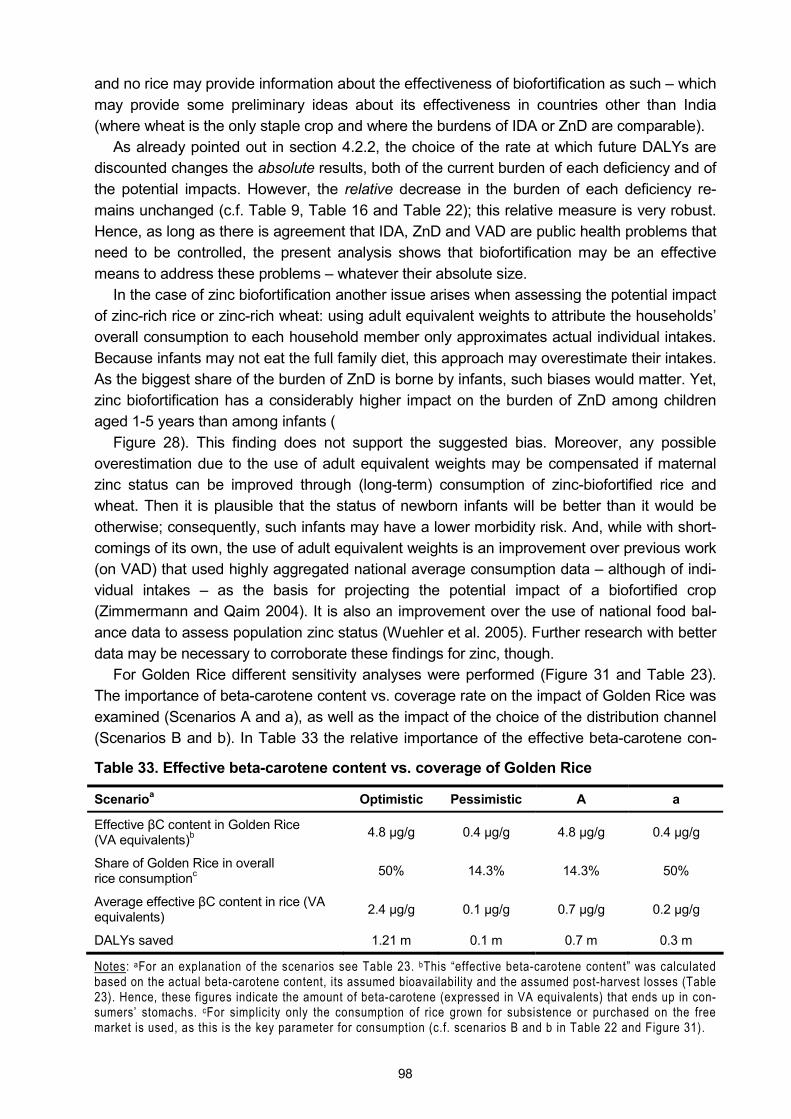
98
and no rice may provide information about the effectiveness of biofortification as such � which may provide some preliminary ideas about its effectiveness in countries other than India (where wheat is the only staple crop and where the burdens of IDA or ZnD are comparable).
As already pointed out in section 4.2.2, the choice of the rate at which future DALYs are discounted changes the absolute results, both of the current burden of each deficiency and of the potential impacts. However, the relative decrease in the burden of each deficiency re-mains unchanged (c.f. Table 9, Table 16 and Table 22); this relative measure is very robust. Hence, as long as there is agreement that IDA, ZnD and VAD are public health problems that need to be controlled, the present analysis shows that biofortification may be an effective means to address these problems � whatever their absolute size.
In the case of zinc biofortification another issue arises when assessing the potential impact of zinc-rich rice or zinc-rich wheat: using adult equivalent weights to attribute the households� overall consumption to each household member only approximates actual individual intakes. Because infants may not eat the full family diet, this approach may overestimate their intakes. As the biggest share of the burden of ZnD is borne by infants, such biases would matter. Yet, zinc biofortification has a considerably higher impact on the burden of ZnD among children aged 1-5 years than among infants (
Figure 28). This finding does not support the suggested bias. Moreover, any possible overestimation due to the use of adult equivalent weights may be compensated if maternal zinc status can be improved through (long-term) consumption of zinc-biofortified rice and wheat. Then it is plausible that the status of newborn infants will be better than it would be otherwise; consequently, such infants may have a lower morbidity risk. And, while with short-comings of its own, the use of adult equivalent weights is an improvement over previous work (on VAD) that used highly aggregated national average consumption data � although of indi-vidual intakes � as the basis for projecting the potential impact of a biofortified crop (Zimmermann and Qaim 2004). It is also an improvement over the use of national food bal-ance data to assess population zinc status (Wuehler et al. 2005). Further research with better data may be necessary to corroborate these findings for zinc, though.
For Golden Rice different sensitivity analyses were performed (Figure 31 and Table 23). The importance of beta-carotene content vs. coverage rate on the impact of Golden Rice was examined (Scenarios A and a), as well as the impact of the choice of the distribution channel (Scenarios B and b). In Table 33 the relative importance of the effective beta-carotene con-
Table 33. Effective beta-carotene content vs. coverage of Golden Rice
Scenarioa Optimistic Pessimistic A a
Effective βC content in Golden Rice (VA equivalents)b 4.8 µg/g 0.4 µg/g 4.8 µg/g 0.4 µg/g
Share of Golden Rice in overall rice consumptionc 50% 14.3% 14.3% 50%
Average effective βC content in rice (VA equivalents) 2.4 µg/g 0.1 µg/g 0.7 µg/g 0.2 µg/g
DALYs saved 1.21 m 0.1 m 0.7 m 0.3 m
Notes: aFor an explanation of the scenarios see Table 23. bThis �effective beta-carotene content� was calculated based on the actual beta-carotene content, its assumed bioavailability and the assumed post-harvest losses (Table 23). Hence, these figures indicate the amount of beta-carotene (expressed in VA equivalents) that ends up in con-sumers� stomachs. cFor simplicity only the consumption of rice grown for subsistence or purchased on the free market is used, as this is the key parameter for consumption (c.f. scenarios B and b in Table 22 and Figure 31).
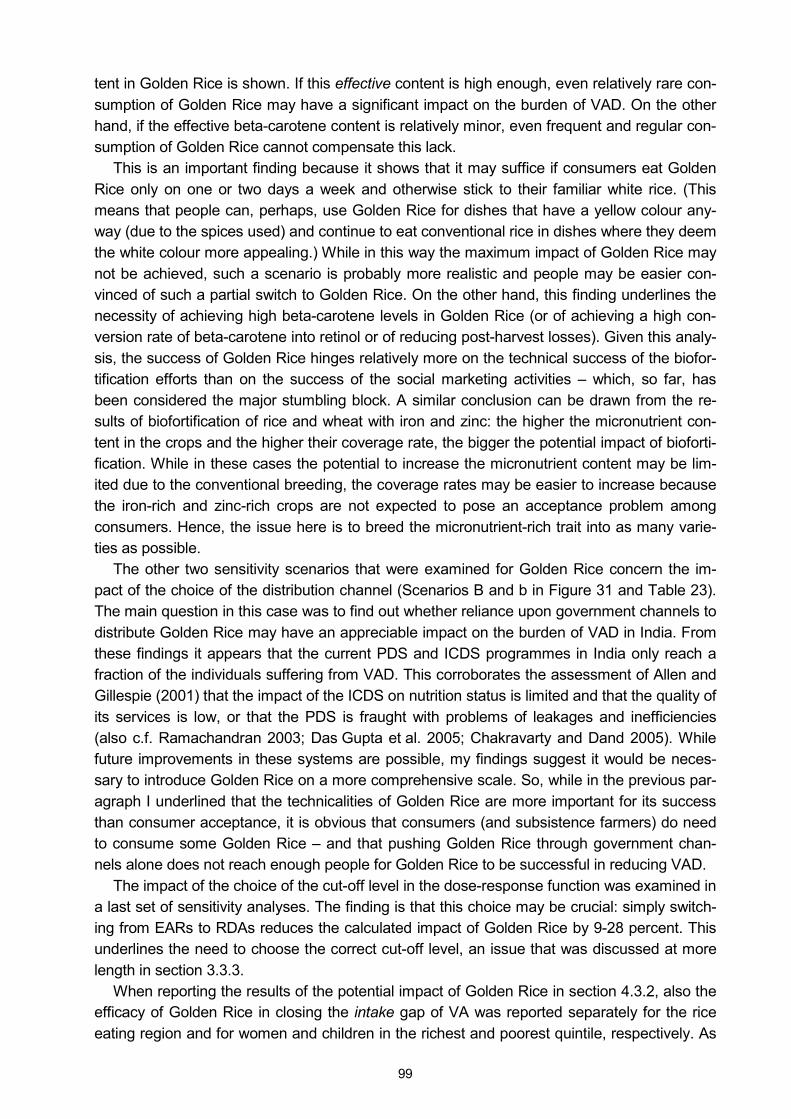
99
tent in Golden Rice is shown. If this effective content is high enough, even relatively rare con-sumption of Golden Rice may have a significant impact on the burden of VAD. On the other hand, if the effective beta-carotene content is relatively minor, even frequent and regular con-sumption of Golden Rice cannot compensate this lack.
This is an important finding because it shows that it may suffice if consumers eat Golden Rice only on one or two days a week and otherwise stick to their familiar white rice. (This means that people can, perhaps, use Golden Rice for dishes that have a yellow colour any-way (due to the spices used) and continue to eat conventional rice in dishes where they deem the white colour more appealing.) While in this way the maximum impact of Golden Rice may not be achieved, such a scenario is probably more realistic and people may be easier con-vinced of such a partial switch to Golden Rice. On the other hand, this finding underlines the necessity of achieving high beta-carotene levels in Golden Rice (or of achieving a high con-version rate of beta-carotene into retinol or of reducing post-harvest losses). Given this analy-sis, the success of Golden Rice hinges relatively more on the technical success of the biofor-tification efforts than on the success of the social marketing activities � which, so far, has been considered the major stumbling block. A similar conclusion can be drawn from the re-sults of biofortification of rice and wheat with iron and zinc: the higher the micronutrient con-tent in the crops and the higher their coverage rate, the bigger the potential impact of bioforti-fication. While in these cases the potential to increase the micronutrient content may be lim-ited due to the conventional breeding, the coverage rates may be easier to increase because the iron-rich and zinc-rich crops are not expected to pose an acceptance problem among consumers. Hence, the issue here is to breed the micronutrient-rich trait into as many varie-ties as possible.
The other two sensitivity scenarios that were examined for Golden Rice concern the im-pact of the choice of the distribution channel (Scenarios B and b in Figure 31 and Table 23). The main question in this case was to find out whether reliance upon government channels to distribute Golden Rice may have an appreciable impact on the burden of VAD in India. From these findings it appears that the current PDS and ICDS programmes in India only reach a fraction of the individuals suffering from VAD. This corroborates the assessment of Allen and Gillespie (2001) that the impact of the ICDS on nutrition status is limited and that the quality of its services is low, or that the PDS is fraught with problems of leakages and inefficiencies (also c.f. Ramachandran 2003; Das Gupta et al. 2005; Chakravarty and Dand 2005). While future improvements in these systems are possible, my findings suggest it would be neces-sary to introduce Golden Rice on a more comprehensive scale. So, while in the previous par-agraph I underlined that the technicalities of Golden Rice are more important for its success than consumer acceptance, it is obvious that consumers (and subsistence farmers) do need to consume some Golden Rice � and that pushing Golden Rice through government chan-nels alone does not reach enough people for Golden Rice to be successful in reducing VAD.
The impact of the choice of the cut-off level in the dose-response function was examined in a last set of sensitivity analyses. The finding is that this choice may be crucial: simply switch-ing from EARs to RDAs reduces the calculated impact of Golden Rice by 9-28 percent. This underlines the need to choose the correct cut-off level, an issue that was discussed at more length in section 3.3.3.
When reporting the results of the potential impact of Golden Rice in section 4.3.2, also the efficacy of Golden Rice in closing the intake gap of VA was reported separately for the rice eating region and for women and children in the richest and poorest quintile, respectively. As
100
can be seen from Table 24 and is explained in section 4.3.2, in the optimistic scenario Golden Rice can almost entirely close the VA intake gap in the rice eating region. When comparing the efficacy of Golden Rice in closing the intake gaps of the richest and the poorest quintile, it becomes evident that Golden Rice has a bigger impact on the VA intake of poor children � and 95 percent of all DALYs that are lost due to VAD are lost in the group of children. The generally higher efficacy of Golden Rice among women may simply be due to the fact that women consume more rice than children.
Having discussed the limitations of aggregating the burden of different micronutrient defi-ciencies in the previous section, it may nevertheless be warranted to point out a lower bound of the potential impact of biofortification on micronutrient malnutrition in India. If potential in-teractions and synergies of alleviating multiple micronutrient deficiencies simultaneously are ignored, the combined biofortification efforts analysed here may save up to 5.1 million healthy life years each year in the optimistic scenarios. To illustrate the magnitude of this impact dif-ferently: saving 5.1 million DALYs in India corresponds to saving the lives of about 220,000 adults in their early thirties (given their average remaining life expectancy of 40.3 years, which translates into 23.4 DALYs because of the discounting of future life years).
Having established the disease burden of micronutrient deficiencies in India in the pre-ceding section and the potential impact of biofortification in this section, the potential cost-effectiveness of biofortification is discussed in the next section.
5.3 The cost-effectiveness of biofortification in India
To decide whether biofortification is a worthwhile undertaking and to establish whether further investments in this technology may be justified, it has not only to be effective (which was shown in the previous section), it must also be no more expensive than other health interven-tions in general. Or, in a direct comparison between different micronutrient interventions, it has to be cheaper than the generally accepted alternative interventions.
Based on the results of my analyses in chapter 4, biofortification of individual crops costs US$ 0.30-39.45 per DALY saved (Table 34). Measured by yardsticks of the World Bank, even the most expensive biofortification intervention still proves to be extremely cost effective. These very favourable results for biofortification of different crops, with different micronutrients
Table 34. The overall cost-effectiveness of biofortification in India (US$/DALY saved)
Scenario Pessimistic Optimistic
Iron-rich rice 3.96 0.30
Zinc-rich rice 4.81 0.40
Iron-rich wheat 8.71 0.63
Zinc-rich wheat 39.45 1.42
Iron-rich rice and wheat 5.39 0.46
Zinc-rich rice and wheat 8.80 0.68
Golden Rice 35.47 3.40
World Bank threshold for cost-effectiveness 217.00
WHO threshold for cost-effectiveness 620.00
Source: See Table 6, Table 10, Table 17 and Table 25.
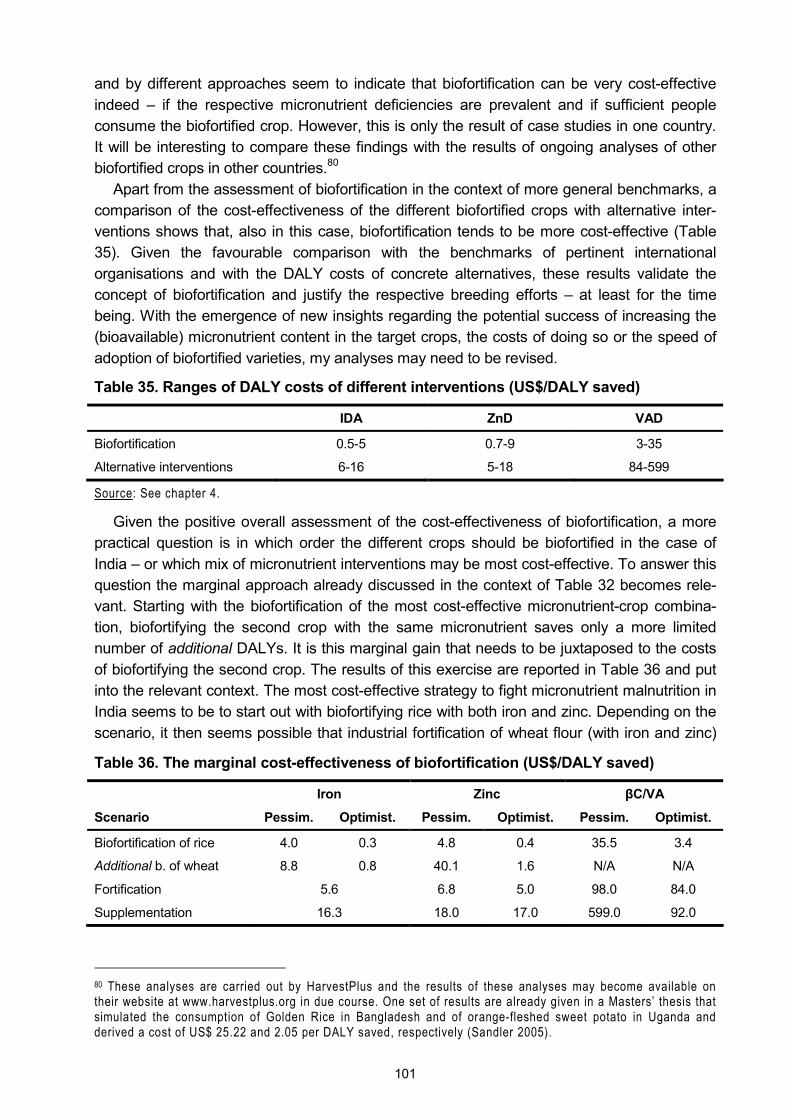
101
and by different approaches seem to indicate that biofortification can be very cost-effective indeed � if the respective micronutrient deficiencies are prevalent and if sufficient people consume the biofortified crop. However, this is only the result of case studies in one country. It will be interesting to compare these findings with the results of ongoing analyses of other biofortified crops in other countries.80
Apart from the assessment of biofortification in the context of more general benchmarks, a comparison of the cost-effectiveness of the different biofortified crops with alternative inter-ventions shows that, also in this case, biofortification tends to be more cost-effective (Table 35). Given the favourable comparison with the benchmarks of pertinent international organisations and with the DALY costs of concrete alternatives, these results validate the concept of biofortification and justify the respective breeding efforts � at least for the time being. With the emergence of new insights regarding the potential success of increasing the (bioavailable) micronutrient content in the target crops, the costs of doing so or the speed of adoption of biofortified varieties, my analyses may need to be revised.
Table 35. Ranges of DALY costs of different interventions (US$/DALY saved)
IDA ZnD VAD
Biofortification 0.5-5 0.7-9 3-35
Alternative interventions 6-16 5-18 84-599
Source: See chapter 4.
Given the positive overall assessment of the cost-effectiveness of biofortification, a more practical question is in which order the different crops should be biofortified in the case of India � or which mix of micronutrient interventions may be most cost-effective. To answer this question the marginal approach already discussed in the context of Table 32 becomes rele-vant. Starting with the biofortification of the most cost-effective micronutrient-crop combina-tion, biofortifying the second crop with the same micronutrient saves only a more limited number of additional DALYs. It is this marginal gain that needs to be juxtaposed to the costs of biofortifying the second crop. The results of this exercise are reported in Table 36 and put into the relevant context. The most cost-effective strategy to fight micronutrient malnutrition in India seems to be to start out with biofortifying rice with both iron and zinc. Depending on the scenario, it then seems possible that industrial fortification of wheat flour (with iron and zinc)
Table 36. The marginal cost-effectiveness of biofortification (US$/DALY saved)
Iron Zinc βC/VA
Scenario Pessim. Optimist. Pessim. Optimist. Pessim. Optimist.
Biofortification of rice 4.0 0.3 4.8 0.4 35.5 3.4
Additional b. of wheat 8.8 0.8 40.1 1.6 N/A N/A
Fortification 5.6 6.8 5.0 98.0 84.0
Supplementation 16.3 18.0 17.0 599.0 92.0
80 These analyses are carried out by HarvestPlus and the results of these analyses may become available on their website at www.harvestplus.org in due course. One set of results are already given in a Masters� thesis that simulated the consumption of Golden Rice in Bangladesh and of orange-fleshed sweet potato in Uganda and derived a cost of US$ 25.22 and 2.05 per DALY saved, respectively (Sandler 2005).
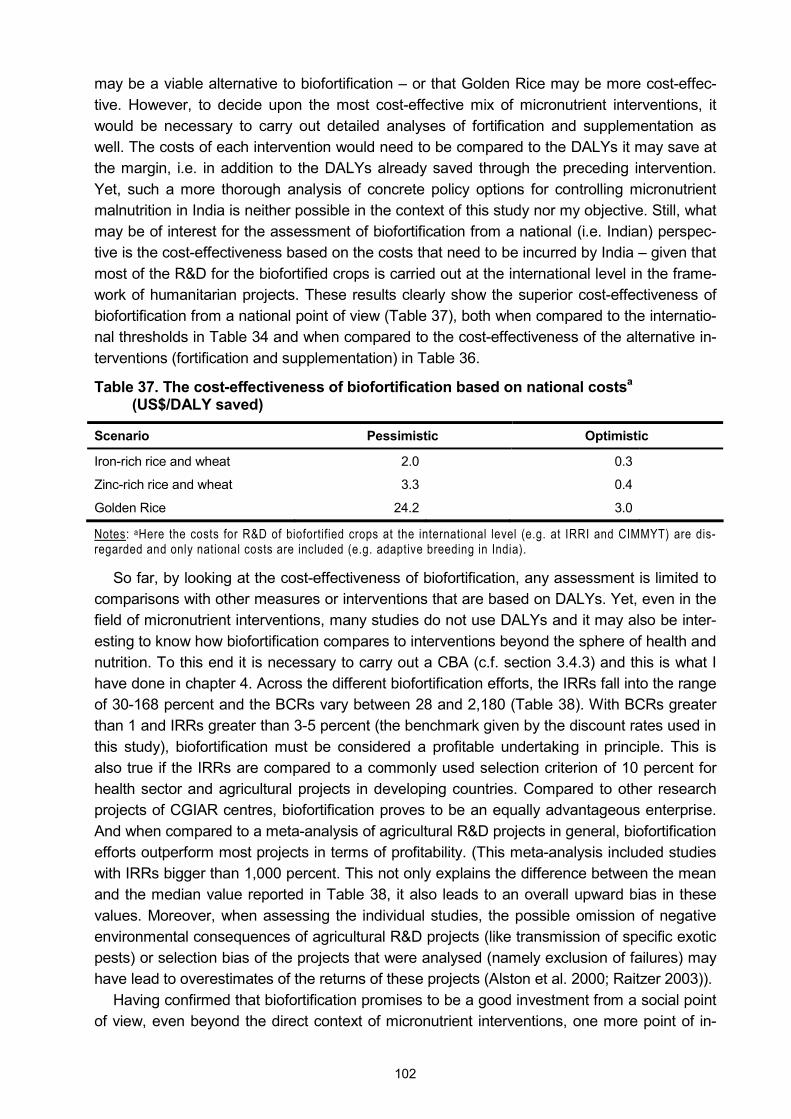
102
may be a viable alternative to biofortification � or that Golden Rice may be more cost-effec-tive. However, to decide upon the most cost-effective mix of micronutrient interventions, it would be necessary to carry out detailed analyses of fortification and supplementation as well. The costs of each intervention would need to be compared to the DALYs it may save at the margin, i.e. in addition to the DALYs already saved through the preceding intervention. Yet, such a more thorough analysis of concrete policy options for controlling micronutrient malnutrition in India is neither possible in the context of this study nor my objective. Still, what may be of interest for the assessment of biofortification from a national (i.e. Indian) perspec-tive is the cost-effectiveness based on the costs that need to be incurred by India � given that most of the R&D for the biofortified crops is carried out at the international level in the frame-work of humanitarian projects. These results clearly show the superior cost-effectiveness of biofortification from a national point of view (Table 37), both when compared to the internatio-nal thresholds in Table 34 and when compared to the cost-effectiveness of the alternative in-terventions (fortification and supplementation) in Table 36.
Table 37. The cost-effectiveness of biofortification based on national costsa (US$/DALY saved)
Scenario Pessimistic Optimistic
Iron-rich rice and wheat 2.0 0.3
Zinc-rich rice and wheat 3.3 0.4
Golden Rice 24.2 3.0
Notes: aHere the costs for R&D of biofortified crops at the international level (e.g. at IRRI and CIMMYT) are dis-regarded and only national costs are included (e.g. adaptive breeding in India).
So far, by looking at the cost-effectiveness of biofortification, any assessment is limited to comparisons with other measures or interventions that are based on DALYs. Yet, even in the field of micronutrient interventions, many studies do not use DALYs and it may also be inter-esting to know how biofortification compares to interventions beyond the sphere of health and nutrition. To this end it is necessary to carry out a CBA (c.f. section 3.4.3) and this is what I have done in chapter 4. Across the different biofortification efforts, the IRRs fall into the range of 30-168 percent and the BCRs vary between 28 and 2,180 (Table 38). With BCRs greater than 1 and IRRs greater than 3-5 percent (the benchmark given by the discount rates used in this study), biofortification must be considered a profitable undertaking in principle. This is also true if the IRRs are compared to a commonly used selection criterion of 10 percent for health sector and agricultural projects in developing countries. Compared to other research projects of CGIAR centres, biofortification proves to be an equally advantageous enterprise. And when compared to a meta-analysis of agricultural R&D projects in general, biofortification efforts outperform most projects in terms of profitability. (This meta-analysis included studies with IRRs bigger than 1,000 percent. This not only explains the difference between the mean and the median value reported in Table 38, it also leads to an overall upward bias in these values. Moreover, when assessing the individual studies, the possible omission of negative environmental consequences of agricultural R&D projects (like transmission of specific exotic pests) or selection bias of the projects that were analysed (namely exclusion of failures) may have lead to overestimates of the returns of these projects (Alston et al. 2000; Raitzer 2003)).
Having confirmed that biofortification promises to be a good investment from a social point of view, even beyond the direct context of micronutrient interventions, one more point of in-

103
Table 38. Results of analysing costs and benefits of biofortification in a wider context
IRR BCR
Scenario Pessimistic Optimistic Pessimistic Optimistic
Iron-rich rice 65% 185% 252 3,300
Zinc-rich rice 62% 173% 208 2,498
Iron-rich wheat 50% 129% 115 1,587
Zinc-rich wheat 31% 106% 25 704
Iron-rich rice & wheat 61% 168% 186 2,180
Zinc-rich rice & wheat 53% 153% 114 1,472
Golden Rice 30% 76% 28 295
Iron fortification - - 5 200
Iron supplementation - - 1.6 59
Agricultural R&Da 44%b 81%c - -
CGIAR researchd 17% 35% 2 17
Criterion for selection of health sector projectse 10% - - -
Cut-off point for agricultural R&D projectsf 10% - - -
Notes: aThe rates of return of the projects included in this meta-analysis range from -100 to 5,645 percent. bMedian of the rate of return estimates. cAverage of the rate of return estimates. Source: Chapter 4, aAlston et al. (2000), dRaitzer (2003) eAdhikari et al. (1999) and fQaim (2000).
Table 39. Annual costs of biofortification and current programmes in India (US$)
Scenario Pessimistic Optimistic
Iron-rich rice 420,000 120,000
Zinc-rich rice 420,000 120,000
Iron-rich wheat 460,000 150,000
Zinc-rich wheat 460,000 150,000
Golden Rice 710,000 930,000
2,470,000 1,470,000
Iron supplementation programme (tablets only) - 5,200,000
VA supplementation programme 414,000,000 308,000,000
Source: Table 4, Table 5, Table 11 and Box 2.
terest is the principal affordability of biofortification. In chapter 4, the annual costs of biofortifi-cation were already reported on a per capita basis: they range from 0.01-0.1¢ per crop. In Indian currency, this corresponds to no more than 1-5 Paise. Given that the smallest Indian coin in use is 10 Paise,81 this indicates that funding may not be a limiting factor for carrying out biofortification. This becomes the more apparent when the Micronutrient Initiative under-
81 100 Paise are Rs. 1. For the exchange rates of Rs. into US$ see Table 41 in the annexe.
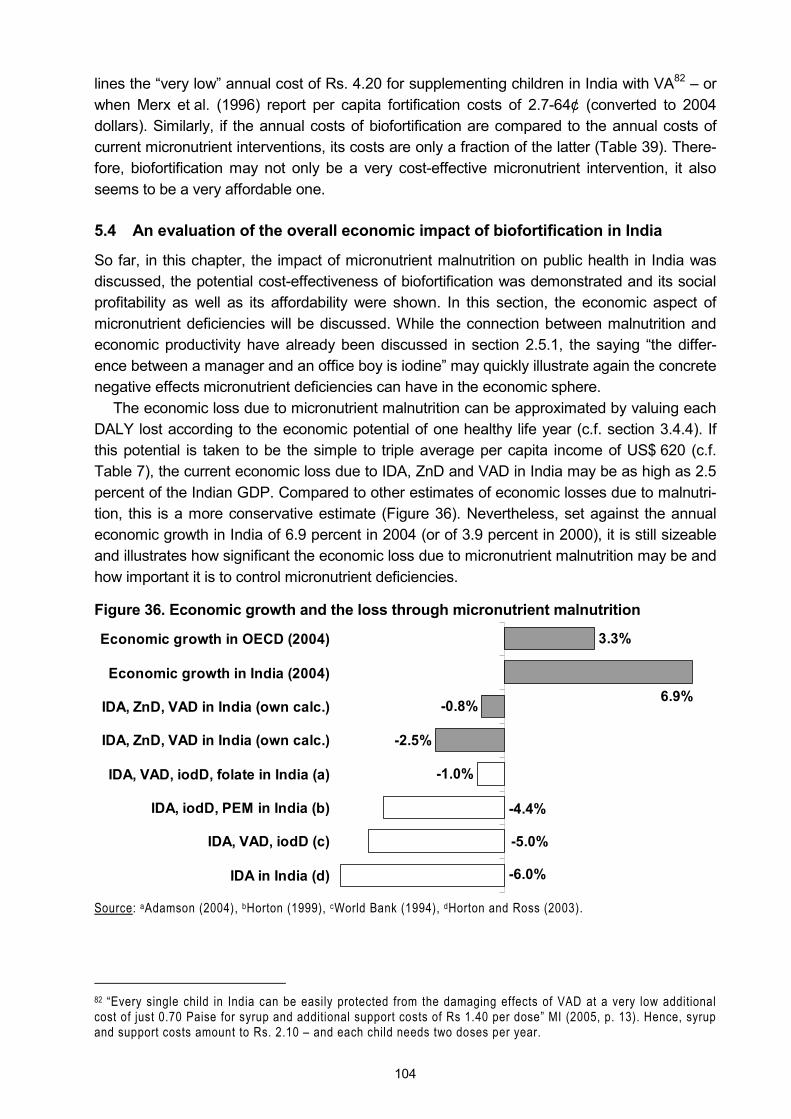
104
lines the �very low� annual cost of Rs. 4.20 for supplementing children in India with VA82 � or when Merx et al. (1996) report per capita fortification costs of 2.7-64¢ (converted to 2004 dollars). Similarly, if the annual costs of biofortification are compared to the annual costs of current micronutrient interventions, its costs are only a fraction of the latter (Table 39). There-fore, biofortification may not only be a very cost-effective micronutrient intervention, it also seems to be a very affordable one.
5.4 An evaluation of the overall economic impact of biofortification in India
So far, in this chapter, the impact of micronutrient malnutrition on public health in India was discussed, the potential cost-effectiveness of biofortification was demonstrated and its social profitability as well as its affordability were shown. In this section, the economic aspect of micronutrient deficiencies will be discussed. While the connection between malnutrition and economic productivity have already been discussed in section 2.5.1, the saying �the differ-ence between a manager and an office boy is iodine� may quickly illustrate again the concrete negative effects micronutrient deficiencies can have in the economic sphere.
The economic loss due to micronutrient malnutrition can be approximated by valuing each DALY lost according to the economic potential of one healthy life year (c.f. section 3.4.4). If this potential is taken to be the simple to triple average per capita income of US$ 620 (c.f. Table 7), the current economic loss due to IDA, ZnD and VAD in India may be as high as 2.5 percent of the Indian GDP. Compared to other estimates of economic losses due to malnutri-tion, this is a more conservative estimate (Figure 36). Nevertheless, set against the annual economic growth in India of 6.9 percent in 2004 (or of 3.9 percent in 2000), it is still sizeable and illustrates how significant the economic loss due to micronutrient malnutrition may be and how important it is to control micronutrient deficiencies.
Figure 36. Economic growth and the loss through micronutrient malnutrition
3.3%
-0.8%
-2.5%
-1.0%
-4.4%
-5.0%
-6.0%
6.9%
Economic growth in OECD (2004)
Economic growth in India (2004)
IDA, ZnD, VAD in India (own calc.)
IDA, ZnD, VAD in India (own calc.)
IDA, VAD, iodD, folate in India (a)
IDA, iodD, PEM in India (b)
IDA, VAD, iodD (c)
IDA in India (d)
Source: aAdamson (2004), bHorton (1999), cWorld Bank (1994), dHorton and Ross (2003).
82 �Every single child in India can be easily protected from the damaging effects of VAD at a very low additional cost of just 0.70 Paise for syrup and additional support costs of Rs 1.40 per dose� MI (2005, p. 13). Hence, syrup and support costs amount to Rs. 2.10 � and each child needs two doses per year.

105
5.5 In the spotlight: Golden Rice
In the general public biofortification is of little interest and in the literature there is less of a controversy around it � with one exception: Golden Rice (c.f. section 2.4.2). While few people take issue with mineral-rich rice or wheat because it is being developed through conventional breeding, the fact that Golden Rice has been developed through genetic engineering has caused some academic debate and mobilised numerous activist groups after first results were published (Shiva 2000; Schnapp and Schiermeier 2001; Greenpeace 2001a and 2001b; Lorch 2001; Pollan 2001; MASIPAG 2001; van Wijk 2002; Ho 2002; Egana 2003; Koechlin n.d.; ISIS n.d.).83 This debate was upheld � largely with the same and partially outdated argu-ments � after the second and more effective generation of Golden Rice has been introduced to the public in early 2005 (c.f. section 2.4.2; Greenpeace 2005; Gola 2005).84 Therefore, a separate discussion of this crop is warranted. As Shiva (2000) is frequently quoted, even if implicitly, as basis for arguments against Golden Rice, I analyse her paper in the following section, before looking at red rice and red palm oil and at other food-based interventions that are popularly suggested as alternatives to Golden Rice. To conclude this discussion of Golden Rice, it is assessed based on criteria that are supported by activist groups.
5.5.1 Shiva�s hoax
A notable first impression of Shiva�s article on �The �Golden Rice� Hoax.� (2000), which is only available online from an activists� website, is the frequent absence of proper references to support her more specific claims and numbers. This is dissatisfactory, as it makes it difficult to double-check the information she provides and opens the floor for inconsistencies. (For in-stance she writes �it is not even known how much VA the genetically engineered rice will produce� but yet she affirms confidently that �it will be totally ineffective in removing VAD.�) Yet, in the following, I will closely look at her arguments.
Shiva bases her argument on a �daily average requirement� of 750 µg of VA, which she seems to suggest would need to be fulfilled to 100 percent through the consumption of Golden Rice alone for the technology to be considered effective. This all-or-nothing definition of effectiveness implies that there is no difference between, say, an individual achieving 50 percent of her requirements and an individual achieving 99.9 percent of her requirements through the current diet: for both individuals, current intakes are not sufficient to prevent VAD. One consequence of this implicit definition of effectiveness is the statement that one has to eat more than 2 kg of Golden Rice to prevent VAD, which is clearly misleading. And, indeed, the more detailed analysis in this study has shown that, based on current consumption pat-terns and quantities, Golden Rice can have a substantial and beneficial impact if it replaces conventional rice in every other meal (Table 22).
After introducing the term of �daily average requirement�, Shiva uses the acronym �RDA� without defining it anywhere in her text. RDA commonly stands for �recommended dietary allowance�. Yet, it is unclear whether this is the same as a �daily average requirement�. There are �estimated average requirements� or EARs, though. According to IOM (2000, p. 3) an
83 See Conway (2001) for a direct reply to Shiva (2000) and Greenpeace (2001a and 2001b). 84 In this context I do not want to go into the false claims and rumours that can be read in poorly researched newspaper articles or purposeful communications of opponents, like the potential toxicity of Golden Rice due to its alleged VA content, the suggestion that Golden Rice is commercialised by Monsanto or that it is already culti-vated on a commercial basis.
106
EAR is �the average daily nutrient intake level estimated to meet the requirement of half the healthy individuals in a particular life stage and gender group�, while an RDA is �the average daily nutrient intake level sufficient to meet the nutrient requirement of nearly all (97-98 per-cent) healthy individuals in a particular life stage and gender group.� These definitions show that it is important to differentiate between these concepts (c.f. section 3.3.3), because �RDAs have been established as a target or goal for intake by an individual, and it can be assumed that individuals whose usual intakes are above the RDA are likely to be meeting their individ-ual requirements and thus have adequate intakes. However, the reverse is not true. For this reason the RDA is not a useful reference standard for assessing an individual�s intake� (p. 51); �the best estimate for an individual�s unobservable requirement is the EAR� (p. 50).
To validate Shiva�s �daily average requirement� of 750 µg, for which she has neither given a reference nor a target group to which the requirement is applicable, I compare this figure with a list of different requirements: Gopalan et al. (1989) give India-specific RDAs of 600 µg VA for men, women and children above the age of 6 years, 400 µg for children aged 1-6 years and 350 µg for infants below the age of 1 year. IOM (2002) gives more detailed RDAs of, for example, 900 µg retinol activity equivalents (RAEs) for men, 700 µg for women, 400 µg for children aged 4-6 years and 300 µg for children aged 1-3 years. IOM (2002) also gives EARs of 625 µg RAEs for men, 500 µg for women, 275 µg for children aged 4-6 years and 210 µg for children aged 1-3 years. (For brevity not all groups are reported here.) While it is unclear on which of these concepts Shiva based her figure of 750 µg (probably on RDA for men), the above quoted, published figures of different sets of requirements are generally smaller � and hence easier to fulfil. Therefore, by deliberately setting a very high requirement, it is easier for Shiva to suggest that Golden Rice would be ineffective (also c.f. section 4.3.2).
Having stated her understanding of effectiveness and declared Golden Rice to be totally ineffective in removing VAD, Shiva writes that �besides creating VAD, VA rice will also create deficiency in other micronutrients and nutrients.� The rationale for this statement remains unclear, though. Even if Golden Rice fails to improve the VA status of its consumers, being ineffective in reducing VAD is different from creating either VAD or other deficiencies. Ineffec-tive Golden Rice would simply maintain the status quo.85 However, if in the status quo the consumption of rice is responsible for VAD, then rice could be used as starting point to com-bat it. This was the very rationale of developing Golden Rice.
One valid point of Shiva (2000) is that �raw milled rice has a low content of fat� and that �fat is necessary for VA uptake�. However, for the necessary bioavailability of VA only 5 grams of fat per day need to be consumed in the food mix (IUNS 1992; Olson 1987), while in India the average fat intake per adult equivalent in the poorest quintile is 35 grams per day (NSSO 2000, own calculations).86 Moreover, Shiva proposes the �propagation of naturally VA rich
85 Potrykus (2005) shows that the genome of the popular conventional rice variety IR64 is less different from �golden� IR64 than from other rice varieties and that it only differs from �golden� IR64 in one recombination. Hence, even if Golden Rice would fail to improve the VA status of at-risk populations it is unclear how it should create VAD or other deficiencies on top of those associated with the normal consumption of rice. 86 And, for example, while low fat intake was identified as an important factor for the prevalence of malnutrition in Maldivian children, which may be responsible for many other problems, the average fat intake of children aged 1-3 years is still reported to be 22 (±11) grams per day (Golder et al. 2001). Hence, even in diets that are mani-festly deficient in fat, the amount of fat consumed does not seem to be a limiting factor for VA uptake.

107
plants87 in agriculture and diets� and she provides a list of �sources rich in VA used commonly in Indian foods� (Table 40). As before she has suggested that the low fat content in rice (she gives the figure of 0.5 g/100g) �will aggravate VAD�, one could probably expect that the fat content in these food items is much higher, so their consumption can alleviate VAD. Yet, the fat content in the plant foods Shiva proposes is on average 0.5 g/100g (with a range of 0.1-1.7 g/100g (Table 40), just like the fat content in rice. Therefore, following this logic, these foods also aggravate VAD. Otherwise, if fat is not a limiting factor, both these plants and Golden Rice could and should help in fighting VAD.
Another open question with her list of foods is the �content� she reports for them: in plant food there is no VA, i.e. she must have derived the VA content for all the plant foods she enlists as being VA-rich from the respective beta-carotene contents. Yet, she does not pro-vide a reference for either the conversion rates used or for the source of the original data on the beta-carotene and VA contents of the food items. Therefore I use published data on food composition and conversion (Gopalan et al. 1989; USDA 2004; Erhardt 2005) to derive the VA content of the food items she mentioned. To be sympathetic to her arguments, I use the highest beta-carotene or VA content for each food item whenever there was different infor-mation in the three sources used (Table 40). Following her own reasoning in judging Golden Rice, which is based on how much of it would need to be consumed to achieve a requirement of 750 µg, I also report how much of each of the food items she proposed would need to be consumed per day to achieve a requirement of 750 µg (Table 40). It turns out that people would need to eat as much as 8 kg cabbage, 5 kg jackfruit, 1.8 kg tomatoes, 0.8 kg oranges or 4 eggs per day to meet their supposed full daily needs. And while it might be possible to eat 328 g mango (i.e. approximately 1.5 fruits), the question of affordability and seasonality remains. So it becomes obvious that Shiva probably did not want to suggest that one of these food items alone should cover 100 percent of VA requirements, but rather that any food rich in VA or beta-carotene should contribute to the fulfilment of requirements. This is what Gol-den Rice is predicted to do as well, and it shows that Shiva applies double standards to dis-credit Golden Rice. Moreover, contrary to rice, the �sources rich in VA used commonly in Indian foods� that Shiva mentions do not seem to be that common after all. Otherwise, VAD would be less of a problem. Some of these plants may only be seasonally available, or people cannot afford the food items she mentioned, or they lack the awareness of their nutritive value, or they simply do not like them, i.e. they are not part of their dietary habits (Albrecht 2002; van Wijk 2002).88 Therefore, and as my study has shown, until purchasing power has risen amongst the poorest strata of Indian society and until nutrition education and behaviour change efforts have induced a higher consumption of such VA-rich foods, Golden Rice can play an intermediate role in combating VAD.
87 Plants do not contain VA directly, only food from animal sources does. Plants produce carotenoids that the human body can convert into VA (it is these carotenoids that give Golden Rice its golden hue). So Shiva probably means plants that are naturally rich in beta-carotene. 88 For example, a study of dietary intake and nutritional status of women and pre-school children in the Maldives has shown that the intake of vitamin C and carotenes is low, despite ready availability of appropriate vegetables and fruits (Golder et al. 2001).
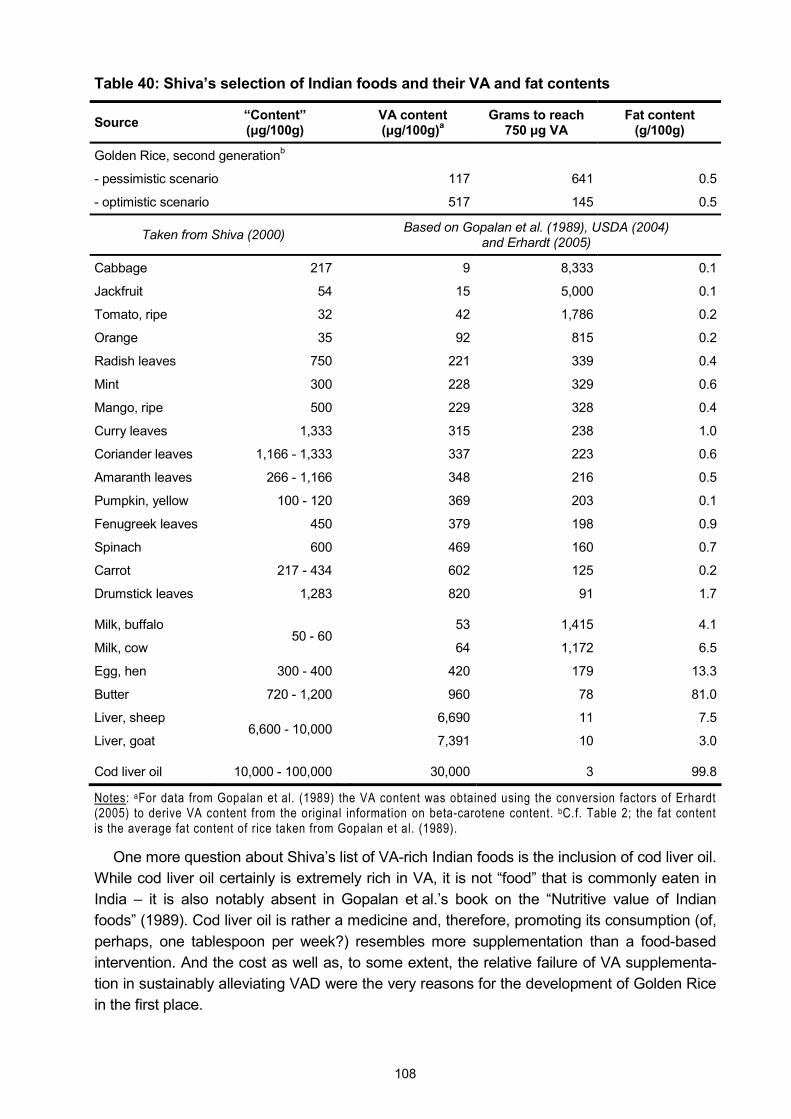
108
Table 40: Shiva�s selection of Indian foods and their VA and fat contents
Source �Content� (µg/100g) VA content
(µg/100g)a Grams to reach
750 µg VA Fat content
(g/100g)
Golden Rice, second generationb
- pessimistic scenario 117 641 0.5
- optimistic scenario 517 145 0.5
Taken from Shiva (2000) Based on Gopalan et al. (1989), USDA (2004) and Erhardt (2005)
Cabbage 217 9 8,333 0.1
Jackfruit 54 15 5,000 0.1
Tomato, ripe 32 42 1,786 0.2
Orange 35 92 815 0.2
Radish leaves 750 221 339 0.4
Mint 300 228 329 0.6
Mango, ripe 500 229 328 0.4
Curry leaves 1,333 315 238 1.0
Coriander leaves 1,166 - 1,333 337 223 0.6
Amaranth leaves 266 - 1,166 348 216 0.5
Pumpkin, yellow 100 - 120 369 203 0.1
Fenugreek leaves 450 379 198 0.9
Spinach 600 469 160 0.7
Carrot 217 - 434 602 125 0.2
Drumstick leaves 1,283 820 91 1.7
Milk, buffalo 53 1,415 4.1
Milk, cow 50 - 60
64 1,172 6.5
Egg, hen 300 - 400 420 179 13.3
Butter 720 - 1,200 960 78 81.0
Liver, sheep 6,690 11 7.5
Liver, goat 6,600 - 10,000
7,391 10 3.0
Cod liver oil 10,000 - 100,000 30,000 3 99.8
Notes: aFor data from Gopalan et al. (1989) the VA content was obtained using the conversion factors of Erhardt (2005) to derive VA content from the original information on beta-carotene content. bC.f. Table 2; the fat content is the average fat content of rice taken from Gopalan et al. (1989).
One more question about Shiva�s list of VA-rich Indian foods is the inclusion of cod liver oil. While cod liver oil certainly is extremely rich in VA, it is not �food� that is commonly eaten in India � it is also notably absent in Gopalan et al.�s book on the �Nutritive value of Indian foods� (1989). Cod liver oil is rather a medicine and, therefore, promoting its consumption (of, perhaps, one tablespoon per week?) resembles more supplementation than a food-based intervention. And the cost as well as, to some extent, the relative failure of VA supplementa-tion in sustainably alleviating VAD were the very reasons for the development of Golden Rice in the first place.
109
On the face of it, Shiva�s criticism of Golden Rice seems to build on soft ground and a more rigorous analysis would have been desirable. Yet, the actual reason for her criticism becomes clear in the last part of her paper where she criticises input-intensive industrial agri-culture, an oligopolistic and powerful biotech industry and its aspiration to exclusive owner-ship of IPRs related to rice research, as well as the assimilation of public sector research with corporate interests. It is in this context that Shiva considers Golden Rice to be a Trojan horse of big biotechnology companies to establish corporate control over rice production and to increase the acceptability of GM crops in general (c.f. Figure 8). Any economist probably agrees that oligopolistic tendencies and unequal market powers should be corrected as they induce market failures and lead to inefficiencies. The issue of IPRs and the patenting of plants, especially in the context of developing country agriculture, is also an acknowledged problem (Pinstrup-Andersen and Cohen 2000; Timmer 2003; Chrispeels and Mandoli 2003; also c.f. section 5.5.4). Unease about undue influence of agricultural businesses in politics and on regulators is understandable, too (c.f. Newell and Glover 2003; Beckwith et al. 2002; Williams 2001). And the need to counter-balance R&D efforts in and for the private sector in industrialised countries with the promotion of research for farmers and food consumers in developing countries has also been stated (Pinstrup-Andersen and Cohen 2000; Qaim 2001; Qaim and Matuschke 2005; also c.f. 2.4.1). Therefore, some of the underlying arguments in Shiva (2000) against the current situation and the developments in the agricultural sector merit attention and probably even intervention, indeed, but the debate about the introduction of Golden Rice and its potential to address VAD should not be absorbed by the much more fundamental one about which agricultural system should be preferred. In the current system, if and when it is regulated and approved by the respective national authorities, Golden Rice promises to do a lot of good compared to the status quo.89 Therefore, Golden Rice should be considered seriously by policy makers who have to decide about ways to combat VAD. This does not prevent any proponent of a different approach to agriculture, like Shiva, from arguing that doing agriculture differently in principle could also address problems in the related field of nutrition.
5.5.2 Is red the more nutritious colour? Red rice and red palm oil
An alternative to Golden Rice proposed by some opponents is the promotion of red and black landraces of rice � which contain some beta-carotene in their unmilled form � for consumption and further breeding (Frei and Becker 2004). In fact, this approach is the same that is also pursued with Golden Rice, only in this case the use of genetic engineering is avoided � but it requires consumers to accept rice of a different hue and to change their dietary and food preparation habits to eat and prepare unmilled rice.90 Despite this more profound change in
89 Interestingly enough, as has already been mentioned in the main body of this study, in the status quo the main intervention to combat VAD is supplementation. The concomitant dependency on and the influence of big inter-national chemicals and pharmaceuticals companies is probably not to the liking of many opponents of Golden Rice either. Indeed, in the 1990s there was a global vitamin cartel (Marshall et al. 2005) and companies produc-ing VA (foremost among them Hoffman-La Roche) were charged for collusion and price fixing in the EU, the USA, Canada and Australia (Guardian 2001, EU 2001, Joshua and Zane 2001). Iyer (1999) reports how India�s only major producer of VA is dependent on Hoffman-La Roche as a supplier of intermediate inputs. 90 That opponents of Golden Rice support the promotion of these landraces shows a certain inconsistency in their arguments: on the one hand they proclaim that Golden Rice is a failure because people would need to eat kilo-grams of it each day to combat VAD, but at the same time they suggest that people could simply eat red land-races of rice. Yet, even in their unmilled form these contain much less beta-carotene than Golden Rice, i.e. peo-
110
people�s daily lives, I examined the potential of this proposition in the setting of the optimistic scenario, i.e. with high coverage rates, low post-harvest losses and higher than average bioavailability of the beta-carotene. The modest result of this simulation is a reduction of the burden of VAD in India of 3.4 percent (compared to a reduction of 54 percent through Golden Rice under the same optimistic assumptions; c.f. Table 22).
Apart from coloured rice landraces there are a number of foodstuffs that are indeed rich in VA or beta-carotene (like meat, green leafy vegetables, orange-fleshed roots and tubers, orange fruits, red palm oil or cod liver oil). The desirability of dietary diversification in general and of the consumption of these foodstuffs in particular is without doubt and underlined in section 2.2.1. However, promoting this food encounters problems of its own: red palm oil or cod liver oil are not typically consumed in India and, as mentioned above, may better be con-sidered medical supplements. In the case of red palm oil, apart from its use as supplement rather than food, the oil cannot be consumed straight away, but has to be refined (Narasinga Rao 2000). And to cover all 140 million children in India aged 6-59 months with 5-8 grams of red palm oil each day (c.f. Narasinga Rao 2000), about 250,000-400,000 tons would be needed each year. However, in other countries the intensification of palm oil production threatens biodiversity (Buckland 2005), whereas Golden Rice can be cultivated on the same plots as conventional rice, i.e. no pristine land needs to be converted to new plantations. Also, while critics find fault with the duration of R&D for Golden Rice during which there were no real impacts (Greenpeace 2005), studies on the use of red palm oil as source of beta-caro-tene in India date as far back as 1936, but almost 70 years later the use of red palm oil in India is still not established (Narasinga Rao 2000). Similar double standards become obvious in a Greenpeace report by Lorch (2005, p. 6), when she writes regarding the control of VAD: �Research and breeding programmes can help by promoting conventionally-bred varieties with high provitamin A concentrations. For example, an estimated 10 million children at risk from VAD in Africa could meet their recommended dietary allowance (RDA) if they would eat orange sweet potatoes instead of white ones. Changing the sweet potato variety, without even changing the amount eaten, could contribute about 40% of their RDA.� This statement is certainly true, as I showed in my projections for conventionally-bred of iron-rich and zinc-rich rice and wheat. But why draw a sharp line between varieties that are genetically engineered and those that are �conventionally-bred�? Biofortified crops may prevent suffering and save lives irrespective of the breeding approach taken. As I have shown in this study, the first ap-proach to biofortify crops is to take recourse to conventional breeding. While for rice this seems promising in the case of iron and zinc, for beta-carotene this was not possible (c.f. section 2.4.2). Obviously, before Golden Rice is released to consumers it needs to be regu-lated, which includes establishing that it is save to eat and poses no threat to the environ-ment. Once this evident requirement is fulfilled, the situation is not much different from the orange sweet potatoes that Lorch mentions.91
ple would have to eat even more rice per day to combat VAD. (According to Frei and Becker (2004), unmilled coloured rice varieties may have a beta-carotene content of up to 0.38 µg/g; the beta-carotene content in milled Golden Rice of the second generation reaches 31 µg/g, i.e. the difference is about two orders of magnitude). It is probably safe to assume that Golden Rice is opposed because it is a GMO and not because the underlying ra-tionale of increasing the beta-carotene content in commonly eaten food is deemed wrong. 91 In fact, switching from conventional rice to Golden rice may be a smaller change because the �golden� trait may be introduced in popular rice varieties, whereas orange sweet potatoes are different from white ones (i.e. their appearance, taste and texture may change (Hagenimana et al. 1999)).
111
5.5.3 Other food-based interventions to improve VA status
Meat, another food rich in VA, is expensive and its promotion may be difficult in a society where there are many vegetarians. Fruits and vegetables can be relatively expensive, too, or some are only seasonally available. While these problems do not question the merits of a diverse diet (c.f. section 2.2.1), they indicate that achieving this goal in the short to medium term may be difficult. Home gardening, which is proposed as a means to ensure the ready availability of fruits and vegetables, may be possible in rural areas, but, for instance, it comes at the cost of the time needed to tend the garden and in some areas water scarcity may be an issue, too. And the efficacy of vegetable sources for micronutrient control is unclear (Under-wood and Smitasiri 1999; van Wijk 2002). Moreover, as one popularly cited study of home gardens in Bangladesh found, for home gardens to be effective in increasing vegetable con-sumption, technical assistance is required and households need a regular supply of quality seeds and other inputs � while poor soil fertility, inadequate fencing, poor irrigation and other aspects act as constraints to gardening. Furthermore, home gardening programmes need adequate management and human resources, the programmes need to be monitored, new gardening techniques need to be promoted and nutrition education is necessary to achieve sustainable behavioural changes (Talukder et al. 2000). Similarly, Dharmasena and Wijeratne (1996) have found for home gardens in two villages in Sri Lanka that insufficient fertilisation, lack of watering and absence of pest control limited the productivity of existing home gardens. Therefore, they recommended the launch of development programmes. Yet, technical assis-tance and extension programmes do not come for free. Neglecting the cost aspect is the major weakness of many of these propositions. For instance, the Bangladesh study mentions the costs of the programme that is analysed not at all;92 it remains completely unclear at what cost the increase of vegetable consumption is achieved. Moreover, the frequency of vegeta-ble consumption is the programme�s only measure of success, which is at best an approxi-mation of its potential effectiveness in reducing VAD. Given the more widespread benefits of more frequent vegetable consumption (through improving general nutritional status and not just beta-carotene intake), it is probably difficult to measure the overall success of such pro-grammes in a more tangible form. Yet, providing at least some cost estimates (in particular for the opportunity costs of, e.g., household labour and volunteer time) would facilitate the rela-tive assessment of different programmes. Because even if a programme works this is no guarantee that the resources spent on it are put to their best and most effective use. Of course, many alternatives to Golden Rice have their merit and their particular strengths; this short discussion is only meant to put the results of my analysis of Golden Rice in context. The lack of information on the cost-effectiveness of these interventions may point to possible in-formation gaps and potential future research needs, though.
92 Talukder et al. (2000, p. 170) mention costs only once when they write about Helen Keller International, �the gardening activities are integrated with other health and development services of the NGO, and this integration leads to cost-effective development.� In a subsequent summary report no reference to costs is made at all (HKI 2003). Similarly, for a pilot home gardening project in India, Chakravarty (2000b) only reports indicators that support the effectiveness of the intervention, but fails to give any information on the costs. Hence, it is impossi-ble to compare these interventions with alternatives.

112
5.5.4 Intellectual property rights: is Golden Rice only a showcase?
There is one important difference between the other biofortified crops and Golden Rice: IPRs. For the development of Golden Rice its inventors used proprietary material and know-how that is covered by IPRs. Hence, the first generation of Golden Rice was covered by nil to 44 patents (of a total of about 70) in any one country (Kryder et al. 2000). Yet, even if in a spe-cific country no patent applies, this does not mean the stakeholder has no leverage. This has been shown last year by Monsanto�s filling of lawsuits in Denmark over the import of Argen-tine soybean products � Monsanto does not hold patents that are relevant for the production of its herbicide-resistant soybeans in Argentina but it does so in Denmark (Reuters 2005; AP News 2005; Dow Jones 2005); this year Monsanto has asked customs officials in Spain to seize incoming soymeal shipments from Argentina (Reuters 2006) and another shipment (with a value of about US$ 1 million) has been seized in Liverpool (Mira 2006).93
In the case of Golden Rice the IPR issue seems to be solved, though, because the inven-tors succeeded to obtain free licenses for the humanitarian use of it (Potrykus 2001). And also in the case of the second generation of Golden Rice, Syngenta (the main IPR holder) has no commercial interest in Golden Rice and donated the transgenic events for humanitar-ian purposes � under certain conditions (Paine et al. 2005; Dubock 2005b). Syngenta be-lieves that these constructs do not need any licenses from third parties; necessary rights have been granted already not only by Syngenta, but also by Monsanto and Bayer (Dubock 2005a).
While it is difficult to believe that the rights holders would disturb the positive image Golden Rice may transfer to GM crops in general by insisting on narrow interpretations of the li-cences, the issue of IPRs has implications for further biofortification efforts (through genetic engineering). It is by no means guaranteed that rights holders will always co-operate so freely and in the spirit of corporate social responsibility.94 In fact, the role of IPRs in the �Gene Revolution� is often seen as one main difference to the Green Revolution, which was driven by public sector research (c.f. section 2.4.1). Therefore, one obvious answer is to call for revived and redirected public research in the field of genetic engineering to help tackle hunger (Lipton 2001). Cohen (2005) has found that the public sector in a number of developing countries is, indeed, competent and capable of developing GM crops � and has done so al-ready for over 200 combinations of different traits and various crops. However, he also re-ports that only few of these crops have been released from confined, scientific testing. Apart from the international controversy around GM crops, which perturbs trade in these crops, he explains this absence of dissemination and commercialisation of the crops with poor regula-tory frameworks and limited capacities to meet the existing national and international re-
93 In the meantime Argentina has sued Monsanto before a Dutch court for taking coercive measures and exercis-ing its IPRs abusively (Cronista 2006). 94 Next to the aforementioned quarrel of Monsanto with Argentina, another case in point is the recent formation of an alliance of biotechnology and pharmaceuticals firms to prevent amendments to the WTO Agreement on Trade-Related Aspects on Intellectual Property Rights (TRIPS) that would require the disclosure of the origin of genetic material or traditional knowledge related to patents � and to share benefits of the patents with the developing country in question (US Trade 2006). In such a context, close personal linkages between the biotech industry and pertinent departments in the US administration may be of little help to assuage critics (c.f. Philpott 2006; USTR 2005). Yet, to balance the view, Monsanto � for many the biotech company � pledges to �help create a path for successful humanitarian access� to its drought tolerant technology �for those subsistence farmers who have the most to lose� (Monsanto 2005, p. 7). Moreover, after having waived its IPRs on Golden Rice, Monsanto also col-laborates in the development of �golden mustard� in India (Rao 2004).
113
quirements. (He also points out the isolation of research institutes and their difficulties to de-velop and market a concrete product.) This kind of public research is what Kremer and Zwane (2005) call �push� research. While acknowledging the usefulness of funding more general research input, they highlight the potential of �pull� programmes, i.e. the funding of � public or private � research output (that meets pre-specified criteria).
Another possible approach to reconcile private IPRs and humanitarian designs is to think of some sort of �imaginative�, �innovative� or �visionary� new models of public-private sector collaborations or partnerships with legally binding agreements (Serageldin 1999, Qaim 2000; Dodds et al. 2001).95 There could be granting of free licences from companies holding the rights to key techniques and materials in exchange for licences to use crop varieties or crop traits of distinct national origin from developing countries (Gordon and Toenniessen 1999),96 or a more formalised and general �clearinghouse� for IPRs in the field of agricultural biotech-nology could be established (Chrispeels 2000; Graff and Zilberman 2001). Donors may help strengthening the IPR regime to improve the use of patents in the public sector and at public universities and they may help strengthening national regulatory frameworks (in developing countries) and support pertinent partnerships (Conway 2003; Delmer 2005).
A different possibility is to promote an open-source model in genetic engineering, in which scientists may use a process or product provided that their own subsequent improvements and innovations remain within the public domain (Hope 2004; Editorial 2005; Jefferson 2005; Stewart 2005). This latter approach is built on solid legal grounds (Feldmann 2004) and it has already been followed when an alternative to the Agrobacterium technology has been made available to the international community under an open-source license, which is characterised �by having no commercial restrictions other than covenants for sharing of improvements, relevant safety information and regulatory data and for preserving the opportunity for others to freely improve and use the technology� (Broothaerts et al. 2005, p. 632).
Yet, if such approaches prove to be unsatisfactory and fail to adequately consider the needs of the poor in developing countries, legal experts and policy makers may also recon-sider the regulation or interpretation of IPRs for applications in the humanitarian field because IPRs are a means and not an end in themselves: their purpose is to encourage private R&D, which, in the end, is expected to contribute to overall social welfare.97 Therefore, if in a particular context IPRs rather prevent welfare gains than creating them, they may be re-viewed and adapted to take the interests of different stakeholders in society into account (Louwaars et al. 2005; Liebig 2005). If public institutions use IPRs to biofortify and improve seeds for crops that are neglected by the private sector because the markets are too small or the potential buyers are too poor (so-called orphan crops), a legislated waiver of the specific IPRs in such contexts may be another option. Whether such steps may be more than only a theoretical option is a question for political economy research, because � obviously � neither the firms carrying out the R&D have an interest in lower levels of protection of IPRs (even if
95 But, as some point out, it is by no means guaranteed that the public interest is always safeguarded through public-private partnerships (Richter 2003; FEC 2003). 96 However, such dealings may be perceived as a sell-out of national wealth, especially if the transaction lacks transparency or if it smacks of corruption (Jayaraman 2002; Padma and Shanahan 2006). Hence, a �code of con-duct� for such sensitive deals may be needed. 97 Qaim and de Janvry (2003) have shown � for the example of GM cotton in Argentina � that companies may fail to adequately exploit the monopoly pricing power conferred to them through IPRs. In this case, lower prices would have benefited both farmers and the company and, thus, resulted in a Pareto improvement.
114
they can recover their investments in the industrialised countries� markets; also c.f. Pinstrup-Andersen 2005), nor do farmers in industrialised countries benefit from such differential treatment (c.f. Lence and Hayes 2005). Therefore, corresponding lobbying activities may be expected.
5.5.5 Analysing Golden Rice by critics� criteria
In a rather critical assessment of GM crops in a developing country context, which is cited by organisations that disapprove of GM crops, deGrassi (2003) has put forward six criteria that would need to be fulfilled by GM crops to alleviate poverty: the research and breeding efforts should be (i) demand-led, (ii) site-specific, (iii) have a poverty-focus, (iv) be cost-effective and (v) environmentally as well as (vi) institutionally sustainable. Here, these criteria are used to assess Golden Rice: i) The very problem of hidden hunger is that � in the short to medium term � it is not amena-
ble to exclusively demand-led solutions (c.f. section 2.5.1). So in this specific context this criterion may need to be qualified to encompass need-driven approaches like Golden Rice.
ii) The �golden� trait is planned to be introduced into popular and new rice varieties that are grown in regions where VAD is prevalent, hence Golden Rice will be site-specific.
iii) As it addresses a form of malnutrition, the poverty-focus of Golden Rice should not be in doubt (c.f. section 2.5.1).
iv) The cost-effectiveness of Golden Rice has been shown by my analysis. v) In its environmental impact the cultivation of Golden Rice will not be different from the culti-
vation of conventional rice because it does not contain novel agronomic traits (like, insect resistance), so Golden Rice is just as environmentally sustainable as rice that is currently grown.
Finally, (vi) once released Golden Rice can be reproduced year on year by the farmers them-selves, without the need of external funding, i.e. the institutional sustainability of Golden Rice should not be in doubt, either.
Hence, also according to these criteria, Golden Rice is appropriate for a developing country context and it can be classified as a GM crop that may contribute to sustainable poverty alle-viation.
115
6 Conclusions
In this study I quantified the burden of micronutrient malnutrition � in particular of IDA, ZnD and VAD � in India, to subsequently determine the potential reduction of this disease burden through the consumption of biofortified rice and wheat and, in another step, to evaluate the cost-effectiveness of these new crops. To this end, I laid out the background of micronutrient malnutrition, explained the rationale for combating this form of hunger, described existing micronutrient interventions and put biofortification into its wider context � not only as an inter-vention to control micronutrient deficiencies, but also as a modern agricultural technology. In a next step I explained the methods and the data that were used in the calculations and I described the theoretical contributions of my work.
Building on this foundation, I carried out the three case studies of biofortified crops, namely of iron-rich rice and wheat, of zinc-rich rice and wheat and of (beta-carotene-rich) Golden Rice. In each of these analyses a pessimistic and an optimistic scenario was simulated to take account of the uncertainty surrounding ex ante impact assessments; the results of these three studies were then condensed in a comparative analysis. (In a separate discussion, I challenged the validity of common claims about the lacking effectiveness of Golden Rice and showed some limitations of suggested alternatives.)
This study shows that a conservative estimate of the annual burden of micronutrient mal-nutrition in India is a loss of 9.1 million healthy life years, of which 4.0 million DALYs are lost due to IDA, 2.8 million DALYs are lost due to ZnD and 2.3 million are lost due to VAD. These losses differ in their width, i.e. the number of people that are affected, and in their depth, i.e. the amount of health that is lost in each case: IDA affects many people but mostly with rela-tively modest health consequences, while VAD is more focused in scope but most of its health consequences are much more severe and mostly lethal. Overall, it is particularly chil-dren and women that suffer from micronutrient malnutrition.
Under optimistic assumptions the potential impact of biofortification of rice and wheat in India is huge: iron-rich rice and wheat, zinc-rich rice and wheat and Golden Rice may reduce the respective burdens of IDA, ZnD and VAD by more than half and, hence, save millions of healthy life years. In the pessimistic scenario, i.e. if the biofortified crops are only adopted on a smaller scale and if the breeding efforts to increase the micronutrient content in the crops are less successful, these crops may still have a positive impact on the burden of micronutri-ent deficiencies, but the magnitude of the impact will be considerably smaller.
However, in both the optimistic and pessimistic scenarios, biofortification is extremely cost-effective, whether it is carried out through conventional breeding or through genetic engineer-ing. From an economic perspective, even in the pessimistic scenario biofortification proves to be a success: saving one health life year through this agricultural approach may cost less than US$ 0.5 for iron-rich rice and wheat in the optimistic scenario. And even the cost of US$ 35 for saving one DALY through Golden Rice in the pessimistic scenario is far below the World Bank threshold of about US$ 220 (and still further below the US$ 620 that may be derived from WHO studies). Also compared to the costs of saving one DALY through alter-native micronutrient interventions, biofortified crops are consistently considerably cheaper.
A similar picture emerges if the health benefits of biofortification in India are expressed in monetary terms and evaluated based on a CBA: the IRRs for the biofortified crops range from 30-168 percent and each dollar invested yields at least US$ 28 (and may yield more than US$ 2,000). These results are better than the results of most agricultural R&D projects and
116
they lie several times above the commonly used selection criterion of 10 percent for similar projects in developing countries. Hence, from such a societal perspective, biofortification seems a worthwhile investment.98 If the monetisation of DALYs is extended to the burden of micronutrient malnutrition in India, it can be shown that this form of hunger may reduce eco-nomic growth in India by 1-2 percent points each year � while the combined average annual cost of iron-rich rice and wheat, zinc-rich rice and wheat and Golden Rice falls in the range of only US$ 1.2-1.6 million. (On a per capita basis this amounts to 0.1-0.2¢.) Of these costs the Indian government would only need to carry the costs of the country-specific activities and of the maintenance breeding; the R&D at the international level is donor funded.
Having established the potential of biofortification to reduce the burden of micronutrient deficiencies in India considerably, the necessary rejoinder is that biofortification cannot elimi-nate micronutrient malnutrition on its own. Also in countries where micronutrient malnutrition is not a public health problem any longer this was not the achievement of single interventions but the result of a mix of different policies and developments (like supplementation, fortifica-tion, nutrition education and economic growth). Therefore, it would be asked too much of biofortification to achieve such a feat (and it would be presumptuous to claim that it could). But then, what is the advantage of biofortification? Apart from the characteristics of biofortifi-cation that were discussed in section 2.2.3 (and which show how the strengths of biofortifica-tion complement existing strategies like supplementation and fortification, or that it may re-duce people�s nutritional vulnerability), the overarching advantage of biofortification is its cost-effectiveness. As already highlighted in the introduction, in a world of scarcity the effective-ness of an intervention is a necessary but not a sufficient condition for its positive assess-ment. In this study I have shown that biofortification may be very effective, indeed. But, in any of the economic analysis carried out, biofortification also consistently outperformed alternative interventions.
The findings regarding the superior cost-effectiveness of biofortification are not opposed to the implementation of alternative interventions, though. Quite to the contrary, the concern of my research was to help implement efficient interventions to control micronutrient deficien-cies. As pointed out above, this concern cannot be resolved through biofortification alone. Eliminating micronutrient malnutrition requires a balanced mix of complementary interventions across time and space: biofortification may be very cost-effective in preventing and reducing micronutrient deficiencies in broader population groups, but in cases of severe micronutrient malnutrition and for treatment of clinical deficiencies, supplementation may be a more appro-priate intervention. Still, in this context biofortification may allow for a reduction of routine supplementation efforts, with the result that the released monetary, physical and human re-sources can be better targeted and, thus, employed to greater benefit. Similarly, it may serve the purpose of reducing micronutrient malnutrition if biofortified seeds are promoted in the countryside and, simultaneously, additional fortification efforts are carried carry out in urban food processing facilities � or in regions where there are no biofortified crops available (for example in India in regions where coarse cereals form the mainstay of the diet). Or, if Golden Rice is to be promoted in India, it may be sensible to integrate the message into broader nu-
98 Given these positive results, I would like to emphasise the conservative nature of the simulations. While assuming complete failure of a project provides little useful information, I still tr ied to err on the side of caution when simulating the benefits of biofortification in the pessimistic scenario, but also the projections of the benefits in the optimistic scenario were rather moderate.
117
trition education campaigns. However, giving precise instructions how to design national mi-cronutrient programmes certainly is beyond the scope of this study. My findings simply sup-port the recommendation that, being the most cost-effective intervention, biofortification should be implemented first (in the case of Golden Rice this includes the commitment to communicate the benefits of this crop effectively). More expensive alternative interventions should then be employed in a second step and in a more targeted manner, according to their particular strengths.
Finally, given this analysis, I concur with the WHO: �It is not much value to provide deci-sion-makers with information on the costs and effectiveness of interventions that are under-taken badly� (WHO 2002, p. 107). Still, because of the need to take account of the uncertain-ties surrounding ex ante analyses, this is what I have done in the pessimistic scenarios of the evaluation. Based on reasonable assumptions, in the optimistic scenarios I have demon-strated what the potential benefits of biofortification to the Indian society are � if the micronu-trient-rich crops reach as many farmers and consumers as soon as possible. However, for these benefits to materialise, the support and the collaboration of key players in the interna-tional donor community, in national agricultural research and extension agencies, along the food chain and in the national health system is needed, not only in India but in all countries where the discussed micronutrient deficiencies are a public health problem and where rice and wheat are eaten by large parts of the population. In this context, one more recommenda-tion seems to be granted, namely to support the ongoing biofortification efforts. And, given that my analysis is ex ante in nature, it may also be advisable to support further investigations into this novel concept to close remaining information gaps and to corroborate my findings.
This work contains a number of contributions in academic and empirical terms: some methodological improvements were introduced, better data than in previous studies was used and, thus, information gaps were narrowed. Nevertheless, there remains a lot to be done. First of all, as just pointed out, my findings need to be corroborated by future studies of the actual impacts of biofortification. Some central parameters that were used in the different scenarios of my analyses � like the micronutrient content in the grains that can be realised under field conditions, the actual agronomic performance of the crops, the magnitude of post-harvest losses or the bioavailability of the micronutrient � still need to be determined with more precision through future research. It will also be crucial to analyse the factors that de-termine the acceptability of the crops to farmers and consumers alike, especially in the case of Golden Rice; this knowledge is vital for the design of extension and social marketing strategies to achieve maximum adoption of the crops. For Golden Rice it is also essential to carry out the necessary tests to ensure that it is safe for both the environment and human consumption.
Naturally, the method that I refined and further developed in this work may be used to evaluate other micronutrient interventions or to assess different nutritional problems as well. Next to micronutrient malnutrition it is especially obesity-related problems that gain impor-tance around the world and, consequently, need to be examined more closely (Lipton 2001; Popkin et al. 2001a and 2001b; Sachdev 2004; Roux and Donaldson 2004; Schmid et al. 2005; Prentice 2006; Hillier et al. 2006).99 On the other hand, also the number of functional
99 Critics suggest that the problem of obesity is less alarming, though. According to their view, reasons for push-ing obesity on the agenda � at the cost of more pressing public health issues � are, among others, covert finan-cial interests (c.f. Campos et al. 2006 and the Commentaries in the same issue).

118
foods � i.e. foodstuffs that convey a health benefit beyond that of conventional foodstuffs (Milner 2000; Contor 2001; Shimizu 2003) � can be expected to increase. This is true for industrialised countries, where functional foods may also help address obesity-related prob-lems (Singletary and Morganosky 2004; Roberfroid 2000; Menrad et al. 2000). But, as I have shown, the number of functional foods � which is how biofortified crops could be defined as well � may also increase in the developing world. The method presented here may serve to analyse the potential impact and the economic sagacity of these new crops and products as well. Similarly, this approach may be used to assess the health dimension of other crops. For instance, it is suggested that insect resistant cereals may not only increase effective yields but also, as a welcome side effect, reduce the level of dangerous mycotoxins in people�s daily food (Ming High et al. 2004; Falk et al. 2002; James 2003a; Magg et al. 2003).100 Or, in the same context, the method presented here may be used to quantify the health benefit of im-proved practices, processes and methods in food cultivation, processing or monitoring (c.f. Williams et al. 2004; Cardwell 2000; Xu et al. 2006). Yet, as was shown in the chapter on the DALYs method, DALYs are very versatile and many applications based on this method are conceivable because it allows for the quantification of health in a rather elegant manner. Food and nutrition form the basis of human health and well-being � and related problems are probably permanent companions of humankind. Hence, suitable approaches to investigate nutrition questions will also be needed in future.
100 Incidentally, increased levels of mycotoxins in the diet may affect zinc nutrition and VA status (Williams et al. 2004).
119
References Abdulai, A. and D. Aubert (2004). �A Cross-Section Analysis of Household Demand for Food
and Nutrients in Tanzania.� Agricultural Economics 31: 67-79. ACC/SCN (2000). �Fourth Report on the World Nutrition Situation.� United Nations Administrative
Committee on Coordination, Sub-Committee on Nutrition, in collaboration with IFPRI, Geneva. Adamson, P. (2004). �Vitamin & Mineral Deficiency: a Global Progress Report.� Micronutrient Initiative,
Ottawa and UNICEF, New York. Adhikari, R., P. Gertler and A. Lagman (1999). �Economic Analysis of Health Sector Projects:
a Review of Issues, Methods, and Approaches.� Economic Staff Paper No. 58, Economics and Development Resource Center, Asian Development Bank, Manila.
Albrecht, J. (2002). �Biotechnology and Micronutrient Deficiencies in Developing Countries. A Comparative Economic Assessment of Golden Rice.� Paper presented at the 6th International Conference of the International Consortium on Agricultural Biotechnology Research on �New Avenues for Production, Consumption and Technology Transfer,� July 11-14, Ravello.
Alderman, H., J.R. Behrman, D.R. Ross and R. Sabot (1996). �The Returns to Endogenous Human Capital in Pakistan�s Rural Wage Labour Market.� Oxford Bulletin of Economics and Statistics 58: 30-55.
Allen, L.H. (2002). �Iron Supplements: Scientific Issues Concerning Efficacy and Implications for Research and Programs.� Journal of Nutrition 132: 813S-819S.
Allen, L.H. (2003). �Interventions for Micronutrient Deficiency Control in Developing Countries: Past, Present and Future.� Journal of Nutrition 133: 3875S-3878S.
Allen, L.H. and S.R. Gillespie (2001). What Works? A Review of the Efficacy and Effectiveness of Nutrition Interventions. United Nations Administrative Committee on Coordination, Sub-Committee on Nutrition in collaboration with the Asian Development Bank. Geneva: ACC/SCN.
Allotey, P., D. Reidpath, A. Kouamé and R. Cummin (2003). �The DALY, Context and the Determinants of the Severity of Disease: an Exploratory Comparison of Paraplegia in Australia and Cameroon.� Social Science and Medicine 57: 949-958.
Alston, J.M., C. Chan-Kang, M.C. Marra, P.G. Pardey and T.J. Wyatt (2000). �A Meta-Analysis of Rates of Return to Agricultural R&D � Ex Pede Herculem?� Research Report No. 113, International Food Policy Research Institute, Washington, DC.
Anand, S. and K. Hanson (1998). �DALYs: Efficiency versus Equity.� World Development 26: 307-310. Anderson, K., L.A. Jackson and C. Pohl Nielsen (2004). �Genetically Modified Rice Adoption:
Implications for Welfare and Poverty Alleviation.� World Bank Policy Research Working Paper No. 3380. World Bank, Washington, DC.
AP News (2005). �Argentina Suspends Talks with Monsanto,� July 1. From: Yahoo! Finance, Sunnyvale, CA.
Arcand, J.-L. (2001). �Undernourishment and Economic Growth: the Efficiency Cost of Hunger.� Economic and Social Development Paper No. 147. Food and Agriculture Organization of the United Nations, Rome.
Armantier, O. and N. Treich (2003). �Social Willingness to Pay, Mortality Risks and Contingent Valuation.� Department of Economics Working Papers, State Univ of New York at Stony Brook, NY.
Arnesen, T. and E. Nord (1999). �The Value of DALY Life: Problems with Ethics and Validity of Disability Adjusted Life Years.� British Medical Journal 319: 1423-1425.
Ascher-Ellis, J.S., R.D. Graham, G.J. Hollamby, J. Paull, P. Davies, C. Huang, M.A. Pallotta, N. Howes, H. Khabaz-Saberi, S.P. Jefferies and M. Moussavi-Nik (2001). �Micronutrients.� In: Reynolds, M.P., J.I. Ortiz-Monasterio and A. McNab (eds) (2001). Application of Physiology in Wheat Breeding. Mexico: CIMMYT, p. 219-240.
Bahl, R., A. Baqui, M.K. Bhan, S. Bhatnagar, R.E. Black, A. Brooks, L.E. Cuevas, P. Dutta, R. Frischer, S. Ghosh, P. Malhotra, M. Penny, S.K. Roy, H.P.S. Sachdev, D.A. Sack, S. Sazawal, T. Strand, O. Fontaine, A.K. Patwari, N. Raina and S. Khanum (2001). �Effect of Zinc Supplementation on Clinical Course of Acute Diarrhea.� Journal of Health, Population, and Nutrition 19: 338-346.
120
Baltussen, R.M.P.M., M. Sanon, J. Sommerfeld, and R. Würthwein (2002). �Obtaining Disability Weights in Rural Burkina Faso Using a Culturally Adapted Visual Analogue Scale.� Health Economics 11: 155-163.
Barr, S.I., S.P. Murphy and M.I. Poos (2002). �Interpreting and Using the Dietary Reference Intakes in Dietary Assessment of Individuals and Groups.� Journal of the American Dietetic Association 102: 780-788.
Barry, G. (2005). Personal communication. HarvestPlus Rice Crop Leader, Golden Rice Network Coordinator and Head Intellectual Property Management Unit, International Rice Research Institute, Los Baños.
Basta, S., S. Soekirman, D. Karyadi and N.S. Scrimshaw (1979). �Iron Deficiency Anemia and the Productivity of Adult Males in Indonesia.� American Journal of Clinical Nutrition 32: 916-925.
BBC (2003). �Germany Probes Israel Baby Food,� November 12. BBC News, London. Beaton, G.H., R. Martorell, K.A. Aronson, B. Edmonston, B. McCabe, A.C. Ross and B. Harvey (1994).
�Vitamin A Supplementation and Child Morbidity and Mortality in Developing Countries.� Food and Nutrition Bulletin 15: 282-289.
Beckwith, J.A., T. Hadlock and H. Suffron (2002). �Public Perceptions of Plant Biotechnology and Genetically Modified Foods.� Research Report No. 578. Michigan State Univ, East Lansing, MI.
Behrman, J. (1988a). �Nutrition, Health Birth Order, and Seasonality: Intrahousehold Allocation Among Children in Rural India. Journal of Development Economics 28: 43-62.
Behrman, J. (1988b). �Intrahousehold Allocation of Nutrients in Rural India: Are Boys Favored? Do Parents Exhibit Inequality?� Oxford Economic Papers 40: 32-54.
Behrman, J.R. (1995). �Household Behaviour and Micronutrients: What We Know and What We Don�t Know.� Working Papers on Agricultural Strategies for Micronutrients No. 2, International Food Policy Research Institute, Washington, DC.
Behrman, J.R. and A.B. Deolalikar (1987). �Will Developing Country Nutrition Improve with Income? A Case Study for Rural South India.� Journal of Political Economy 95: 492-507.
Behrman, J.R. and A.B. Deolalikar (1989). �Is Variety the Spice of Life? Implications for Calorie Intake.� Review of Economics and Statistics 71: 666-672.
Behrman, J.R. and A.B. Deolalikar (1990). �The Intrahousehold Demand for Nutrients in Rural South India: Individual Estimates, Fixed Effects, and Permanent Income.� Journal of Human Resources 25: 665-696
Behrman, J.R., H. Alderman, J. Hoddinott (2004). �Hunger and malnutrition.� Challenge Paper, Copenhagen Consensus, Copenhagen.
Beinner, M.A. and J.A. Lamounier (2003). �Recent Experience with Fortification of Foods and Beverages with Iron for the Control of Iron-Deficiency Anemia in Brazilian Children.� Food and Nutrition Bulletin 24: 268-274.
Belli, P., J. Anderson, H. Barnum, J. Dixon, and J. Tan (1996). Handbook on Economic Analysis of Investment Operations. Washington, DC: World Bank.
Belt, H.v.d. (2003). �Debating the Precautionary Principle: �Guilty until Proven Innocent� or �Innocent until Proven Guilty�?� Plant Physiology 132: 1122-1126.
Beraldo, S., D. Montolio, G. Turati (2005). �Healthy, Educated and Wealthy: Is the Welfare State Really Harmful for Growth?� Working Paper of the Faculty of Economic Sciences and Business Administration, Univ of Barcelona, Barcelona.
Berg, P. (2004). �Asilomar and Recombinant DNA.� The Nobel Foundation, Stockholm. Available online: http://nobelprize.org/chemistry/articles/berg/.
Beyer, P. (2005). Personal communication. Department of Cell Biology, Centre for Applied Biosciences, Univ of Freiburg.
Beyer, P., S. Al-Babili, X. Ye, P. Lucca, P. Schaub, R. Welsch and I. Potrykus (2002). �Golden Rice: Introducing the β-Carotene Biosynthesis Pathway into Rice Endosperm by Genetic Engineering to Defeat Vitamin A Deficiency.� Journal of Nutrition 132: 506S-510S.
Bhan, M.K., H. Sommerfelt and T. Strand (2001). �Micronutrient Deficiency in Children.� British Journal of Nutrition 85: S199-S203.
121
Bhandari, N., S. Sazawal, J.D. Clemens, D.K. Kashyap, U. Dhingra and M.K. Bhan (1994). �Association Between Diarrheal Duration and Nutritional Decline: Implications for an Empirically Validated Definition of Persistent Diarrhea.� Indian Journal of Pediatrics 61, pp. 559-566.
Bhaumik, S. (2003). �India Child Deaths Blamed on Unicef,� September 3. BBC News, London. Bhutta Z.A., R.E. Black, K.H. Brown, J.M. Gardner, S. Gore, A. Hidayat, F. Khatun, R. Martorell,
N.X. Ninh, M.E. Penny, J.L. Rosado, S.K. Roy, M. Ruel, S. Sazawal, A. Shankar (1999). �Prevention of Diarrhea and Pneumonia by Zinc Supplementation in Children in Developing Countries: Pooled Analysis of Randomized Controlled Trials.� Journal of Pediatrics 135: 689-697.
Bhutta, Z.A. (2005). Personal communication. Chair Department of Paediatrics & Child Health, Aga Khan Univ, Karachi.
Bhutta, Z.A., S.M. Bird, R.E. Black, K.H. Brown, J. Meeks Gardner, A. Hidayat, F. Khatun, R. Martorell, N.X. Ninh, M.E. Penny, J.L. Rosado, S.K. Roy, M. Ruel, S. Sazawal and A. Shankar (2000). �Therapeutic Effects of Oral Zinc in Acute and Persistent Diarrhea in Children in Developing Countries: Pooled Analysis of Randomized Controlled Trials.� American Journal of Clinical Nutrition 72: 1516-1522.
Biesalski, H.K., R.-J. Brummer, J. König, A.A.O�Connell, L. Ovesen, G. Rechkemmer, K. Stos and D.I. Thurnham (2003). �Micronutrient Deficiencies Hohenheim Consensus Conference.� European Journal of Nutrition 42: 353-363.
Black, R. (2003). �Micronutrient Deficiency: an Underlying Cause of Morbidity and Mortality.� Bulletin of the World Health Organization 81: 79.
Bliss, C. and Stern, N. (1978a). �Productivity, Wages and Nutrition, Part I: the Theory.� Journal of Development Economics 5: 331-362.
Bliss, C. and Stern, N. (1978b). �Productivity, Wages and Nutrition, Part II: Some observations.� Journal of Development Economics 5: 363-398.
Block, S.A. (2004). �Maternal Nutrition Knowledge and the Demand for Micronutrient-Rich Foods: Evidence from Indonesia.� Journal of Development Studies 40: 82-105.
Block, S.A., L. Keiss, P. Webb, S. Kosen, R. Moench-Pfanner, M.W. Bloem, C.P. Timmer (2004). �Macro Shocks and Micro Outcomes: Child Nutrition During Indonesia�s Crisis.� Economics & Human Biology 2: 21-44.
BLS (2005). �Inflation Calculator.� US Department of Labor, Bureau of Labor Statistics, Washington, DC. Available online: http://data.bls.gov/cgi-bin/cpicalc.pl
Borlaug, N.E. (2000a). �The Green Revolution Revisited and the Road Ahead.� Special 30th Anniversary Lecture, September 8. The Norwegian Nobel Institute, Oslo.
Borlaug, N.E. (2000b). �Ending World Hunger. The Promise of Biotechnology and the Threat of Antiscience Zealotry.� Plant Physiology 124: 487-490.
Bouis, H.E. (1994a). �Agricultural Technology and Food Policy to Combat Iron Deficiency in Developing Countries.� FCND Discussion Paper No. 1. International Food Policy Research Institute, Washington, DC.
Bouis, H.E. (1994b). �The Effect of Income on Demand for Food in Poor Countries: Are Our Food Consumption Databases Giving us Reliable Estimates?� Journal of Development Economics 44: 199-226.
Bouis, H.E. (2002a). �Plant Breeding: a New Tool for Fighting Micronutrient Malnutrition.� Journal of Nutrition 132: 491S-494S.
Bouis, H.E. (2002b). �Three Criteria for Establishing the Usefulness of Biotechnology for Reducing Micronutrient Malnutrition�. Food and Nutrition Bulletin 23: 351-353.
Bouis, H.E. and M.J.G. Novenario-Reese (1997). �The Determinants of Demand for Micronutrients: an Analysis of Rural Households in Bangladesh.� FCND Discussion Paper No. 32, International Food Policy Research Institute, Washington, DC.
Bouis, H.E., R.D. Graham and R.M. Welch (2000). �The Consultative Group on International Agricultural Research (CGIAR) Micronutrients Project: Justification and Objectives.� Food and Nutrition Bulletin 21: 374-381.

122
Brahman, G.N.V., J.G. Sastry and N.P. Rao (1988). �Intrafamily Distribution of Dietary Energy: An Indian Experience.� Ecology of Food and Nutrition 22: 125-130.
Briel, T.v.d. and P. Webb (2003). �Fighting World Hunger through Micronutrient Fortification Programs.� Food Technology 57: 44-47.
Briggs, A.H. and A.M. Gray (1999). �Handling Uncertainty when Performing Economic Evaluation of Healthcare Interventions.� Health Technology Assessment 3(2): 1-134.
Brink, J., K. Maredia, A. Johanson and C. Eicher (2004). �Challenges in Creating an Enabling Policy Environment for Adoption of Agricultural Biotechnology in Developing Countries.� In: Dhawan, V. (ed.) (2004). Biotechnology for Food and Nutritional Security. New Delhi: TERI Press, pp. 269-285.
Broca, S. and K. Stamoulis (2003). �Micro- and Macroevidence on the Impact of Undernourishment.� In: Taniguchi, K. and X. Wang (eds) (2003). Nutrition Intake and Economic Growth. Rome: Food and Agriculture Organization of the United Nations.
Brooks, W.A., M. Yunus, M. Santosham, M.A. Wahed, K. Nahar, S. Yeasmin and R.E. Black (2004). �Zinc for Severe Pneumonia in Very Young Children: Double-Blind Placebo-Controlled Trial.� Lancet 363, pp. 1683-1688.
Brown, K.H., J.M. Peerson, J. Rivera, L.H. Allen (2002). �Effect of Supplemental Zinc on the Growth and Serum Zinc Concentrations of Prepubertal Children: a Meta-Analysis of Randomised Controlled Trials.� American Journal of Clinical Nutrition 75: 1062-1071.
Brown, P. (1996). The Global Burden of Disease: Summary. Cambridge, MA: Harvard Univ. Brunsø, K., T.A. Fjord and K.G. Grunert (2002). �Consumers� Food Choice and Quality Perception.�
Working paper No. 77, The Aarhus School of Business, Aarhus. Buckland, H. (2005). �The Oil for Ape Scandal: How Palm Oil is Threatening Orang-Utan Survival.�
Friends of the Earth Trust, London. Buyckx, M. (1993). �The International Community�s Commitment to Combating
Micronutrient Deficiencies.� Food, Nutrition and Agriculture 7: 2-7. Byrne, P.F. (2006). �Safety and Public Acceptance of Transgenic Products.� Crop Science 46: 113-117. Cakmak, I. H. Ozkan, H.J. Braun, R.M. Welch and V. Romheld (2000). �Zinc and Iron Concentrations
in Seeds of Wild, Primitive, and Modern Wheats.� Food and Nutrition Bulletin 21: 401-403. Campos, P., A. Saguy, P. Ernsberger, E. Oliver and G. Gaesser (2006). �The Epidemiology of
Overweight and Obesity: Public Health Crisis or Moral Panic?� International Journal of Epidemiology 35: 55-60.
Cardwell, K.F. (2000). �Mycotoxin Contamination of Foods in Africa: Antinutritional Factors.� Food and Nutrition Bulletin 21: 488-492.
Caulfield L.E., S.A. Richard and R.E. Black (2004). �Undernutrition as an Underlying Cause of Malaria Morbidity and Mortality in Children less than Five Years Old.� American Journal of Tropical Medicine and Hygiene 71: S55-S63.
Chakravarty, I. (2000a). �The Story of Food Fortification with Micronutrients in India.� In: Bagchi, K. and S. Gujral (eds) (2000). Need for Food Fortification in India. New Delhi: Nutrition Syndicate, pp. 8-18.
Chakravarty, I. (2000b). �Food-Based Strategies to Control Vitamin A Deficiency.� Food and Nutrition Bulletin 21: 135-143.
Chakravarty, S. and S.A. Dand (2005). �Food Insecurity in India: Causes and Dimensions.� Working Paper, April. Indian Institute of Management, Ahmedabad.
Chikhalikar, N. (2004). �Supplementation and Food Fortification: Public-Private Linkages.� In: Dhawan, V. (ed.) (2004). Biotechnology for Food and Nutritional Security. New Delhi: TERI Press, pp. 83-87.
Ching, P., M. Birmingham, T. Goodman, R. Sutter and B. Loevinsohn (2000).�Childhood Mortality Impact and Costs of Integrating Vitamin A Supplementation into Immunization Campaigns.� American Journal of Public Health 90: 1526-1529.
Chrispeels, M. J. and D.F. Mandoli (2003). �Agricultural Ethics.� Plant Physiology 132: 4-9. Chrispeels, M.J. (2000). �Biotechnology and the Poor.� Plant Physiology 124: 3-6. Christian, P. (2003). �Micronutrients and Reproductive Health Issues: An International Perspective.�
Journal of Nutrition 133: 1969S-1973S.
123
Christian, P., J. Shrestha, S.C. LeClerq, S.K. Khatry, T. Jiang, T. Wagner, J. Katz and K.P. West, Jr. (2003). �Supplementation with Micronutrients in Addition to Iron and Folic Acid Does Not Further Improve the Hematologic Status of Pregnant Women in Rural Nepal.� Journal of Nutrition 133: 3492-3498.
CIAT/IFPRI (2004). �Biofortified Crops for Improved Human Nutrition.� Challenge Program Proposal, International Center for Tropical Agriculture and International Food Policy Research Institute, Washington, DC.
Clugston, G.A. and T.E. Smith (2002). �Global Nutrition Problems and Novel Foods.� Asia Pacific Journal of Clinical Nutrition 11: S100-S111.
Cogswell, M.E., L. Kettel-Khan and U. Ramakrishnan (2003). �Iron Supplement Use Among Women in the United States: Science, Policy and Practice.� Journal of Nutrition 133: 1974S-1977S.
Cohen, J.I. (2005). �Poorer Nations Turn to Publicly Developed Crops.� Nature Biotechnology 23: 27-33. Collier, P. and A. Hoeffler (2004). �The Challenge of Reducing the Global Incidence of Civil War.�
Challenge Paper, Copenhagen Consensus, Copenhagen. Conko, G. and C.S. Prakash (2004). �Can GM Crops Play a Role in Developing Countries?�
PBI Bulletin No. 2, National Research Council of Canada, Saskatoon, pp. 12-17. Conner, M., S.F.L. Kirk, J.E. Cade and J.H. Barrett (2003). �Environmental Influences:
Factors Influencing a Woman�s Decision to Use Dietary Supplements.� Journal of Nutrition 133: 1978S-1982S.
Contor, L. (2001). �Functional Food Science in Europe.� Nutrition, Metabolism and Cardiovascular Diseases 11: S20-S23.
Conway G. and G. Toenniessen (1999). �Feeding the World in the Twenty-First Century.� Nature 402: C55-C58.
Conway, G. (2001). �Letter to Greenpeace and Response to �The Golden Rice Hoax�.� Archive Stories, Greenpeace International, Amsterdam.
Conway, G. (2003). �From the Green Revolution to the Biotechnology Revolution: Food for Poor People in the 21st Century.� Paper presented at the Woodrow Wilson International Center for Scholars Director�s Forum, March 12.
Cook, J.D., B.S. Skikne and R.D. Baynes (1994). �Iron Deficiency: the Global Perspective.� Advances in Experimental Medicine and Biology 356: 219-228.
Cormick, C. (2005). �Lies, Deep Fries, and Statistics!! The Search for the Truth Between Public Attitudes and Public Behaviour Towards Genetically Modified Foods.� Choices 20: 227-231
Cranor, C.F. (2003). �How Should Society Approach the Real and Potential Risks Posed by New Technologies?� Plant Physiology 133: 3-9.
Cronista, EI (2006). �Argentina sued Monsanto,� February 7. From: Checkbiotech, Univ of Basel, Basel. Dalmiy, N. and W. Schultink (2003). �Combatting Hidden Hunger: The Role of International Agencies.�
Food and Nutrition Bulletin 24: S69-S77. Das Gupta, M., M. Lokshin, M. Gragnolati and O. Ivaschenko (2005). �Improving Child Nutrition
Outcomes in India: Can the Integrated Child Development Services Program Be More Effective?� Policy Research Working Paper No. 3647, World Bank, Washington, DC.
Das Gupta, P.R. (2004). �Regulation of Bio-Engineered Crops With Special Reference to Asia-Pacific.� In: Dhawan, V. (ed.) (2004). Biotechnology for Food and Nutritional Security. New Delhi: TERI Press, pp. 229-235.
Dasgupta, P. (2004). �World Poverty: Causes and Pathways.� In: Pleskovic, B. and N.H. Stern (eds) (2004). World Bank Conference on Development Economics, 2003. Washington, DC: World Bank.
Dasgupta, P. and D. Ray (1986). �Inequality as a Determinant of Malnutrition and Unemployment: Theory.� Economic Journal 96: 1011-1034.
Dasgupta, P. and D. Ray (1987). �Inequality as a Determinant of Malnutrition and Unemployment: Policy.� Economic Journal 97: 177-188.
Datta, S. and H.E. Bouis (2000). �Application of Biotechnology to Improving the Nutritional Quality of Rice.� Food and Nutrition Bulletin 21: 451-456.
124
Davies, C.T., A.C. Chukwuemeka, J.P.v. Haaren (1973). �Iron Deficiency Anaemia: Its Effect on Maximum Aerobic Power and Responses to Exercise in African Males Aged 17-40 Years.� Clinical Science 44: 555-562.
Davies, C.T., J.P.v. Haaren (1973). �Effect of Treatment on Physiological Responses to Exercise in East African Industrial Workers with Iron Deficiency Anaemia.� British Journal of Industrial Medicine 30: 335-340.
Dawe, D., R. Robertson and L. Unnevehr (2002). �Golden Rice: What Role Could It Play in Alleviation of Vitamin A Deficiency?� Food Policy 27: 541-560.
deGrassi, A. (2003). �Genetically Modified Crops and Sustainable Poverty Alleviation in Sub-Saharan Africa: An Assessment of Current Evidence.� Third World Network Africa, Accra.
DellaPenna, D. (1999). �Nutritional Genomics: Manipulating Plant Micronutrients to Improve Human Health.� Science 285: 375-379.
Delmer, D.P. (2005). �Agriculture in the Developing World: Connecting Innovations in Plant Research to Downstream Applications.� Proceedings of the National Academy of Sciences 102: 15739-15746.
Demment, M.W., M.M. Young and R.L. Sensenig (2003). �Providing Micronutrients through Food-Based Solutions: a Key to Human and National Development.� Journal of Nutrition 133: 3879S-3885S.
Desai, S. (2002). �Food Security, not Vitamin Supplements, is Vital for Public Health,� November. InfoChange News & Features. Available online: http://www.infochangeindia.org/features62.jsp.
Dexter, P.B. (1998). �Rice Fortification for Developing Countries.� Opportunities for Micronutrient Interventions (OMNI), The USAID Micronutrient Program (MOST), International Science & Technology Institute, Arlington, VA.
Dharmasena, K.H. and M. Wijeratne (1996). �Analysis of Nutritional Contribution of Homegardening.� Tropenlandwirt 97: 149-158.
Dillon, D.J. (2000). �Prévention de la Carence en Fer et des Anemies Ferriprivés en Milieu Tropical.� Médecine Tropicale 60: 83-91.
Dodds, J.H., R. Ortiz, J.H. Crouch, V. Mahalasksmi and K.K. Sharma (2001). �Biotechnology, the Gene Revolution, and Proprietary Technology in Agriculture: a Strategic Note for the World Bank.� IP Strategy Today No. 2-2001. BioDevelopments � International Institute, Ithaca, NY.
Dow Jones Newswires (2005). �Argentina to Fight Monsanto in Court, Suspend Soybean Talks,� July 1. From: CNN Money, Atlanta, GA.
Drakakaki, G., S. Marcel, R.P. Glahn, E.K. Lund, S. Pariagh, R. Fischer, P. Christou and E. Stoger (2005). �Endosperm-Specific Co-Expression of Recombinant Soybean Ferritin and Aspergillus Phytase in Maize Results in Significant Increases in the Levels of Bioavailable Iron.� Plant Molecular Biology 59: 869-880.
Dubock, A.C. (2005a). Personal communication. Biotechnology Collaborations and Humanitarian Donations of Technology, Syngenta AG, Basel.
Dubock, A.C. (2005b). �Golden Rice: the Partitioning of Influence.� Paper presented at the 9th International Conference of the International Consortium on Agricultural Biotechnology Research on �Agricultural Biotechnology: Ten Years After,� July 6-10, Ravello.
Ducreux, L.J.M., W.L. Morris, P.E. Hedley, T. Shepherd, H.V. Davies, S. Millam and M.A. Taylor (2005). �Metabolic Engineering of High Carotenoid Potato Tubers Containing Enhanced Levels of β-Carotene and Lutein.� Journal of Experimental Botany 56: 81-89.
Editorial (2005). �Open Sesame.� Nature Biotechnology 23: 633. Egana, N.E. (2003). �Vitamin A Deficiency and Golden Rice: a Literature Review.�
Journal of Nutritional & Environmental Medicine 13: 169-184. Eicher, C.K., K. Maredia and I. Sithole-Niang (2005). �Biotechnology and the African Farmer.�
Staff Paper No. 8, Michigan State Univ, East Lansing, MI. Eide, A. (1998). �The Human Right to Adequate Food and Freedom from Hunger.� In: FAO (1998).
The Right to Food in Theory and Practice. Rome: Food and Agriculture Organization of the United Nations, pp. 1-5.
125
Eide, W.B. and U. Kracht (1999). �Towards A Definition of The Right to Food and Nutrition: Reflections on General Comment No. 12.� In: ACC/SCN (1999). �Adequate Food: a Human Right.� SCN News No. 18. Administrative Committee on Coordination/Sub-Committee on Nutrition, Geneva, pp. 41-42.
Elder, L. (2000). Basic Facts: Nuts and Bolts, Nutrition Toolkit # 2. Washington, DC: Human Development Network, The World Bank.
Erhardt, J. (2005). �Sight and Life Vitamin A Intake Calculator.� Sight and Life, Basel. Available online: http://www.nutrisurvey.de/vac/vac.htm.
EU (2001). �Commission Imposes Fines on Vitamin Cartels.� Rapid Press Release No. IP/01/1625, European Commission, Brussels.
Evans, D.B., T. Adam, T. Tan-Torres Edejer, S.S. Lim, A. Cassels, T.G. Evans (2005a). �Time to Reassess Strategies for Improving Health in Developing Countries.� British Medical Journal 331: 1133-1136.
Evans, D.B., T. Tan-Torres Edejer, T. Adam, S.S. Lim (2005b). �Methods to Assess the Costs and Health Effects of Interventions for Improving Health in Developing Countries.� British Medical Journal 331: 1137-1140
Evenson, R.E. and D. Gollin (2003). �Assessing the Impact of the Green Revolution, 1960 to 2000.� Science 300: 758-762.
Falk, M.C., B.M. Chassy, S.K. Harlander, T.J. Hoban, IV, M.N. McGloughlin and A.R. Akhlaghi (2002). �Food Biotechnology: Benefits and Concerns.� Journal of Nutrition 132: 1384-1390.
FAO (1996). �World Food Summit Plan of Action.� World Food Summit, 13-17 November 1996. Food and Agriculture Organization of the United Nations, Rome.
FAO (2004a). �The State of Food Insecurity in the World 2004.� Report, Food and Agriculture Organization of the United Nations, Rome.
FAO (2004b). �FAOSTAT Data.� Food and Agriculture Organization of the United Nations, Rome. Available online: http://faostat.fao.org/faostat/collections?subset=agriculture.
FAO (2004c). The State of Food and Agriculture 2003-2004. Agricultural Biotechnology: Meeting the Needs of the Poor? FAO Agricultural Series No. 35. Rome: Food and Agriculture Organization of the United Nations.
FAO (2005a). �The State of Food Insecurity in the World 2005.� Report, Food and Agriculture Organization of the United Nations, Rome.
FAO (2005b). �Voluntary Guidelines to Support the Progressive Realization of the Right to Adequate Food in the Context of National Food Security,� adopted by the 127th Session of the FAO Council, November 22-27. Food and Agriculture Organization of the United Nations, Rome.
FDA (1994). �Biotechnology of Food.� Backgrounder No. 4, Center for Food Safety and Applied Nutrition, US Food and Drug Administration, Rockville, MD.
FEC (2003). �Engineering Nutrition: GM Crops for Global Justice?� Report No. 6, Food Ethics Council, Brighton.
Feldman, R.C. (2004). �The Open Source Biotechnology Movement: Is it Patent Misuse?� Minnesota Journal of Law, Science & Technology 6: 117-167.
Fiedler, J.L., D.R. Dado, H. Maglalang, N. Juban, M. Capistrano and M.V. Magpantay (2000). �Cost Analysis as a Vitamin A Program Design and Evaluation Tool: a Case Study of the Philippines.� Social Sciences and Medicine 51: 223-242.
Fogel, R.W. (2004a). The Escape from Hunger and Premature Death, 1700-2100: Europe, America, and the Third World. Cambridge, MA: Cambridge Univ Press.
Fogel, R.W. (2004b). �Health, Nutrition, and Economic Growth.� Economic Development and Cultural Change 52: 643-658.
Foster, A.D. and M.R. Rosenzweig (2004). �Agricultural Productivity Growth, Rural Economic Diversity, and Economic Reforms: India, 1970-2000.� Economic Development and Cultural Change 52: 509-542.
Fox-Rushby, J.A. (2002). Disability Adjusted Life Years (DALYs) for Decision-Making? An Overview of the Literature. London: Office of Health Economics.
126
Frei, M. and K. Becker (2004). �On Rice, Biodiversity & Nutrients.� Univ of Hohenheim, Stuttgart. Available online: http://www.greenpeaceweb.org/gmo/nutrients.pdf.
FYF (2002). �Feeding or Fooling the World? Can GM Really Feed the Hungry?� Five Year Freeze, Genetic Engineering Alliance, London.
Ganji, V., J.S. Hampl and N.M. Betts (2003). �Race-, Gender- and Age-Specific Differences in Dietary Micronutrient Intakes of US Children.� International Journal of Food Sciences and Nutrition 54: 485-490.
Garber, A.M. and C.E. Phelps (1997). �Economic Foundation of Cost-Effectiveness Analysis.� Journal of Health Economics 16: 1-31.
García-Cascal, M.N., M. Layrisse, L. Solano, M.A. Barón, F. Arguello, D. Llovera, J. Ramírez, I. Leets and E. Tropper (1998). �Vitamin A and β-Carotene Can Improve Nonheme Iron Absorption from Rice, Wheat and Corn by Humans.� Journal of Nutrition 128: 646-650.
Gardner, G.W., V.R. Edgerton, B. Senewiratne, R.J. Barnard, Y. Ohira (1977). �Physical Work Capacity and Metabolic Stress in Subjects with Iron Deficiency Anemia.� American Journal of Clinical Nutrition 30: 910-917.
Gautam, V.P., Y. Bansal, D.K. Taneja, R. Saha (2002). �Prevalence of Anaemia Amongst Pregnant Women and its Socio-Demographic Associates in a Rural Area of Delhi.� Indian Journal of Community Medicine 27: 157-160.
Gibson, J., S. Barns, M. Cameron, S. Lim, F. Scrimgeour, J. Tressler (2005). �The Value of Statistical Life and the Economics of Landmine Clearance in Developing Countries.� Working Papers in Economics No. 05/04, Department of Economics, Univ of Waikato, Hamilton.
Gillespie, S. (1998). Major Issues in the Control of Iron Deficiency. Ottawa: Micronutrient Initiative. Gittinger, J.P. (1982). Economic Analysis of Agricultural Projects. Baltimore, MD:
Johns Hopkins Univ Press. GoI (2001a). �Census of India.� Office of the Registrar General, New Delhi. Available online:
http://www.censusindia.net/. GoI (2001b). �Public Distribution System and Food Security.� TFYP Working Group Sr.No.65/2001,
Planning Commission, Government of India, New Delhi. GoI (2002). Tenth Five Year Plan (2002-2007), Vol. II, Chapter 3.3. New Delhi: Planning Commission,
Government of India. GoI (2005a). Website of the Department of Food & Public Distribution. Government of India, New Delhi.
Available online: http://fcamin.nic.in. GoI (2005b). �Performance Evaluation of Targeted Public Distribution System (TPDS).�
Programme Evaluation Organisation, Planning Commission, Government of India, New Delhi. GoI (2005c). Website of the Department of Women & Child Development. Government of India,
New Delhi. Available online: http://wcd.nic.in. Gola, S. (2005). �Golden Rice Solution to Vitamin A Deficiency: What Lies Beneath.�
Eldis Document Store, Brighton. Golden Rice (2005). �The Golden Rice Humanitarian Board.� Golden Rice Humanitarian Board, Freiburg.
Available online: http://www.goldenrice.org/Content1-Who/who1_humbo.html. Golder, A.M., J.G. Erhardt, V. Scherbaum, M. Saeed, H.K. Biesalski and P. Fürst (2001). �Dietary Intake
and Nutritional Status of Women and Pre-School Children in the Republic of the Maldives.� Public Health Nutrition 4: 773-780.
Gopalan, C., B.V. Rama Sastri and S.C. Balasubramanian (1989). Nutritive value of Indian foods, National Institute of Nutrition. Hyderabad: Indian Council of Medical Research.
Goto, F., T. Yoshihara, N. Shigemoto S. Toki and F. Takaiwa (1999). �Iron Fortification of Rice Seed by Soybean Ferritin Gene.� Nature Biotechnology 17: 282-286.
Graff, G. and D. Zilberman (2001). �An Intellectual Property Clearinghouse for Agricultural Biotechnology.� Nature Biotechnology 19: 1179-1180.
Graham, R.D. and J.M. Rosser (2000). �Carotenoids in Staple Foods: Their Potential to Improve Human Nutrition.� Food and Nutrition Bulletin 21: 404-409.

127
Graham, R.D., D. Senadhira, S.E. Beebe, C. Iglesias and I. Ortiz-Monasterio (1999). �Breeding for Micronutrient Density in Edible Portions of Staple Food Crops: Conventional Approaches.� Field Crop Research 60: 57-80.
Greenpeace (2001a). �The False Promise of Genetically Engineered Rice.� Background Information No. 02/2001. Greenpeace International Genetic Engineering Campaign, Berlin.
Greenpeace (2001b). �Vitamin A: Natural Sources vs �Golden Rice�.� Archive Stories, February. Greenpeace International, Amsterdam.
Greenpeace (2005). �All that Glitters is not Gold: the False Hope of �Golden Rice�.� Genetic Engineering Briefing Pack, May. Greenpeace International, Amsterdam.
Gregorio, G.B., D. Senadhira, H. Htut and R.D. Graham (2000). �Breeding for Trace Mineral Density in Rice.� Food and Nutrition Bulletin 21: 382-387.
Guardian (2001). �Vitamin Cartel Fined for Price Fixing,� November 21. Guardian Unlimited, London. Gupta, S.P. (2004). �National Nutrition Policy and Intervention Programmes.� In: Dhawan, V. (ed.)
(2004). Biotechnology for Food and Nutritional Security. New Delhi: TERI Press, pp. 51-66. Gwatkin, D.R., M. Guillot and P. Heuveline (1999). �The Burden of Disease Among the Global Poor.�
Lancet 354: 586-589. Haas, J.D. and T. Brownlie IV (2001). �Iron Deficiency and Reduced Work Capacity: a Critical Review
of the Research to Determine a Causal Relationship.� Journal of Nutrition 131: 676S-690S. Haas, J.D., J.L. Beard, L.E. Murray-Kolb, A.M. del Mundo, A.Felix and G.B. Gregorio (2005).
�Iron-Biofortified Rice Improves the Iron Stores of Nonanemic Filipino Women.� Journal of Nutrition 135: 2823-2830.
Haddad, L., C. Peña, C. Nishida, A.R. Quisumbing and A. Slack (1996). �Food Security and Nutrition Implications of Intrahousehold bias: A Review of Literature.� FCND Discussion Paper No. 19, International Food Policy Research Institute, Washington, DC.
Haddad, L., H. Alderman, S. Appleton, L. Song and Y. Yohannes (2003). �Reducing Child Malnutrition: How far Does Income Growth Take Us?� World Bank Economic Review 17: 107-131.
Haddad, L.J. and H.E. Bouis (1991). �The Impact of Nutritional Status on Agricultural Productivity: Wage Evidence from the Philippines.� Oxford Bulletin of Economics and Statistics 53: 45-68.
Hagenimana, V., M.A. Oyunga, J. Low, S.M. Njoroge, S.T. Gichuki, J. Kabira (1999). �The Effects of Women Farmers� Adoption of Orange-Fleshed Sweet Potatoes: Raising Vitamin A Intake in Kenya.� Research Report Series No. 3. International Center for Research on Women (ICRW), Washington, DC.
Hallberg,L. and N.S. Scrimshaw (eds) (1981). Iron Deficiency and Work Performance. Washington, DC: Nutrition Foundation.
Harberger, A.C. and G.P. Jenkins (eds) (2002). �Cost-Benefit Analysis,� International Library of Critical Writings in Economics No. 152. Glos: Edward Elgar Publishing.
HarvestPlus (2006). �About HarvestPlus.� International Food Policy Research Institute, Washington, DC. Available online: http://www.harvestplus.org/about.html.
Hess, S.Y., D.I. Thurnham, R.F. Hurrell (2005). �Influence of Provitamin A Carotenoids on Iron, Zinc, and Vitamin A Status.� HarvestPlus Technical Monograph No. 6. International Food Policy Research Institute, Washington, DC and International Center for Tropical Agriculture, Cali.
Heston, A., R. Summers and B. Aten (2002). �Penn World Table,� Version 6.1. Center for International Comparisons at the Univ of Pennsylvania (CICUP), Philadelphia, PA. Available online: http://pwt.econ.upenn.edu/.
Hillier, T.A., A. Fagot-Campagna, E. Eschwège, S. Vol, M. Cailleau, B. Balkau and the D.E.S.I.R. Study group (2006). �Weight Change and Changes in the Metabolic Syndrome as the French Population Moves towards Overweight: the D.E.S.I.R. Cohort.� International Journal of Epidemiology 35: 190-196.
HKI (2003). �Monitoring of Activities in Village Nurseries and Household Gardens: a Summary Report of Surveys 14-19.� Helen Keller International Bangladesh, Dhaka.
Ho, M.-W. (2002). ��Golden Rice�: An Exercise in How Not to Do Science.� Third World Network, Penang.
128
Hoa, T.T.C., S. Al-Babili, P. Schaub, I. Potrykus and P. Beyer (2003). �Golden Indica and Japonica Rice Lines Amenable to Deregulation.� Plant Physiology 133: 161-169.
Hoban, T. J. (2004). �Public Attitudes Towards Agricultural Biotechnology.� ESA Working Paper No. 9, Agricultural and Development Economics Division, Food and Agriculture Organization of the United Nations, Rome.
Hoddinott, J. and Y. Yohannes (2002). �Dietary Diversity as a Food Security Indicator.� FCND Discussion Paper No. 136, International Food Policy Research Institute, Washington, DC.
Holm, P.B., K.N. Kristiansen and H.B. Pedersen (2002). �Transgenic Approaches in Commonly Consumed Cereals to Improve Iron and Zinc Content and Bioavailability.� Journal of Nutrition 132: 514S-516S.
Hope, J.E. (2004). Open Source Biotechnology. Dissertation, Research School of Social Sciences and the Faculty of Law. Canberra: Australian National Univ.
Horton, S. (1999). �Opportunities for Investments in Nutrition in Low-Income Asia.� Asian Development Review 17: 246-273.
Horton, S. and J. Ross (2003). �The Economics of Iron Deficiency.� Food Policy 28: 51-75. Hossain, M., J. Bennett, S. Datta, H. Leung and G. Khush (2000). �Biotechnology Research in Rice for
Asia: Priorities, Focus and Direction�. In: Qaim, M., A.F. Krattiger and J.v. Braun (eds) (2000). Agricultural Biotechnology in Developing Countries. Boston, MA: Kluwer Academic Publishers, pp. 99-120.
Hotz, C. and K.H. Brown (eds) (2004). �Assessment of the Risk of Zinc Deficiency in Populations and Options for its Control.� International Zinc Nutrition Consultative Group Technical Document No. 1, Food and Nutrition Bulletin 25: S91-S204.
Huang, J., C. Pray and S. Rozelle (2002). �Enhancing the Crops to Feed the Poor.� Nature 418: 678-684.
Hunt, J.M. (2002). �Reversing Productivity Losses from Iron Deficiency: the Economic Case.� Journal of Nutrition 132: 794S-801S.
Husaini, M.A., H.D. Karyadi and H. Gunadi (1981). �Evaluation of Nutritional Anaemia Intervention Among Anemic Female Workers on a Tea Plantation.� In: Hallberg,L., N.S. Scrimshaw (eds) (1981). Iron Deficiency and Work Performance. Washington, DC: Nutrition Foundation, pp. 72-85.
IFPRI (2002). �Green Revolution: Curse or Blessing?� International Food Policy Research Institute, Washington, DC.
INACG (2003). �Integrating Programs to Move Iron Deficiency and Anemia Control Forward.� Report of the 2003 International Nutritional Anemia Consultative Group Symposium. INACG Secretariat, ILSI Human Nutrition Institute, Washington, DC.
IOM (2000). Dietary Reference Intakes: Applications in Dietary Assessment, Institute of Medicine. Washington, DC: National Academy Press.
IOM (2002). Dietary Reference Intakes for Vitamin A, Vitamin K, Arsenic, Boron, Chromium, Copper, Iodine, Iron, Manganese, Molybdenum, Nickel, Silicon, Vanadium, and Zinc. Washington, DC: National Academy Press.
ISIS (n.d.). �The �Golden Rice�: an Exercise in How Not to Do Science.� Sustainable Science Audit No. 1. Institute of Science in Society and Third World Network, London.
IUNS Committee II/6 (1992). �Statement on Natural Food Sources of Vitamin A and Provitamin A.� Food and Nutrition Bulletin 14: 34-35.
Iyer, A. (1999). �Nicholas Piramal Will Gain from Vitamin A Price Hike,� November 10. Domain-B, The Information Company, Mumbai.
Jaishankar, Y. and J. Drèze (2005). �Supreme Court Orders on the Right to Food: a Tool for Action.� Right to Food Campaign, Delhi.
James, C. (1997). �Global Status of Transgenic Crops in 1997.� ISAAA Brief No. 5, International Service for the Acquisition of Agri-biotech Applications, Ithaca, NY.
James, C. (1998). �Global Review of Commercialized Transgenic Crops: 1998.� ISAAA Brief No. 8. International Service for the Acquisition of Agri-biotech Applications, Ithaca, NY.
129
James, C. (2000a). �Transgenic Crops Worldwide: Current Situation and Future Outlook.� In: Qaim, M., A.F. Krattiger and J.v. Braun (eds) (2000). Agricultural Biotechnology in Developing Countries. Boston, MA: Kluwer Academic Publishers, pp. 11-24.
James, C. (2000b). �Global Review of Commercialized Transgenic Crops: 2000.� ISAAA Brief No. 21. International Service for the Acquisition of Agri-biotech Applications, Ithaca, NY.
James, C. (2001). �Global Review of Commercialized Transgenic Crops: 2001.� ISAAA Brief No. 24. International Service for the Acquisition of Agri-biotech Applications, Ithaca, NY.
James, C. (2002). �Global Status of Commercialized Transgenic Crops: 2002.� ISAAA Brief No. 27. International Service for the Acquisition of Agri-biotech Applications, Ithaca, NY.
James, C. (2003a). �Global Status of Commercialized Transgenic Crops: 2002. Feature: Bt Maize.� ISAAA Brief No. 29. International Service for the Acquisition of Agri-biotech Applications, Ithaca, NY.
James, C. (2003b). �Global Status of Commercialized Transgenic Crops: 2003.� ISAAA Brief No. 30. International Service for the Acquisition of Agri-biotech Applications, Ithaca, NY.
James, C. (2004). �Global Status of Commercialized Biotech/GM Crops: 2004.� ISAAA Brief No. 32. International Service for the Acquisition of Agri-biotech Applications, Ithaca, NY.
James, C. (2005). �Global Status of Commercialized Biotech/GM Crops: 2005.� ISAAA Brief No. 34. International Service for the Acquisition of Agri-biotech Applications, Ithaca, NY.
Jasti, S., A.M. Siega-Riz and M.E. Bentley (2003). �Dietary Supplement Use in the Context of Health Disparities: Cultural, Ethnic and Demographic Determinants of Use.� Journal of Nutrition 133: 2010S-2013S.
Jayaraman, K.S. (2002). �Syngenta Ready to Drop Plans for Indian Rice Venture.� Nature 420: 596. Jayasinghe, S., N. Mendis and R. Lie (2002). �Use of Disability Adjusted Life Years in Health Planning:
a Plea for Caution.� Ceylon Medical Journal 47: 61-63. Jefferson, R. (2005). �Open Source Biotech: Science as a Tool for Social Justice.�
GE3LS Newsletter No. 3(2). Genome Canada, Ottawa, p. 3. Jones, G., R.W. Steketee, R.E. Black, Z.A. Bhutta, S.S. Morris and the Bellagio Child Survival
Study Group (2003). �How Many Child Deaths Can We Prevent this Year?� Lancet 362: 65-71. Joshua, J. and P.C. Zane (2001). �The Vitamins Litigation in the United States: Case Study
of an Antitrust Class Action.� Morgan, Lewis & Bockius LLP, Philadelphia, PA. Kameswara Rao, C. (2005). �Building Public Confidence in Agricultural Biotechnology,� August 3.
News Clipping No. 4221, Truth About Trade and Technology, Des Moines, IA. Kapil, U. (2002). �Deaths in Assam During Vitamin A Pulse Distribution: the Needle of Suspicion
Is on the New Measuring Cup.� Indian Pediatrics 39: 114-115. Kapil, U. (2003). �Prevention and Control of Iron Deficiency Anemia Amongst Young Children.�
Indian Pediatrics 40: 293-295. Kapil, U. (2004a). �Update on Vitamin A-Related Deaths in Assam, India.�
American Journal of Clinical Nutrition 80: 1082-1083. Kapil, U. (2004b). Personal communication. Professor, Department of Gastroenterology
& Human Nutrition, All India Institute of Medical Sciences, New Delhi. Kapil, U. and P. Pathak (2003). �Concomitant Prevalence of Multiple Micronutrient Deficiencies among
Pregnant and Non-pregnant Women in a Rural Block of Haryana State, India.� Paper presented at the 10th Asian Conference on Diarrhoeal Diseases and Nutrition, December 7-9, Dhaka.
Kapil, U., N. Saxena, D. Nayar (1996). �Evaluation of National Programme for Prevention of Nutritional Blindness and National Nutritional Anaemia Prophylaxis Programme in Selected States of India.� Health Population: Perspectives & Issues 19: 19-28.
Kapiriri, L., O.F. Norheim and K. Heggenhougen (2003). �Using Burden of Disease Information for Health Planning in Developing Countries: the Experience from Uganda.� Social Science and Medicine 56: 2433-2441.
Kennedy, G., G. Natel and P. Shetty (2003). �The Scourge of �Hidden Hunger�: Global Dimensions of Micronutrient Deficiencies.� Food, Nutrition and Agriculture 32: 8-16.
Khush, G.S. (2001). �Challenges for Meeting the Global Food and Nutrition Needs in the New Millennium.� Proceedings of the Nutrition Society 60: 15-26.
130
Kipnis, V., D. Midthune, L. Freedman, S. Bingham, N.E. Day, E. Riboli, P. Ferrari and R.J. Carroll (2002). �Bias in Dietary-Report Instruments and its Implications for Nutritional Epidemiology.� Public Health Nutrition 5: 915-923.
Kirschenmann, F. (2001). �Questioning Biotechnology�s Claims and Imagining Alternatives.� Transactions of the Wisconsin Academy of Sciences, Arts and Letters 89: 35-61.
Koechlin, F. (n.d.). �The �Golden Rice�: a Big Illusion?� Third World Network, Penang. Kosek, M., C. Bern and R.L. Guerrant (2003). �The Global Burden of Diarrhoeal Disease, as Estimated
from Studies Published Between 1992 and 2000.� Bulletin of the World Health Organization 81, pp. 197-204.
Kremer, M. and A.P. Zwane (2005). �Encouraging Private Sector Research for Tropical Agriculture.� World Development 33: 87-105.
Kryder, R.D., S.P. Kowalski and A.F. Krattiger (2000). �The Intellectual and Technical Property Components of Pro-Vitamin A Rice (GoldenRice): a Preliminary Freedom-to-Operate Review.� ISAAA Briefs No. 20. International Service for the Acquisition of Agri-biotech Applications, Ithaca, NY.
Kuchler, F. and E. Golan (1999). �Assigning Values to Life: Comparing Methods for Valuing Health Risks.� Agricultural Economic Report No. 784. Economic Research Service, US Department of Agriculture, Washington, DC.
Kumar, S. (1998). �Perinatal Mortality a Human-Rights Issue in India.� Lancet 351: 1340. Kumaranayake L. (2000). �The Real and the Nominal? Making Inflationary Adjustments
to Cost and Other Economic Data.� Health Policy and Planning 15: 230-234. Lakshmikumaran, M. (2004). �Genetically modified mustard: Technique to Technology.� In: Dhawan, V.
(ed.) (2004). Biotechnology for Food and Nutritional Security. New Delhi: TERI Press, pp. 113-118. Laviolette, L. and S. Bulusu (2005). Personal communication. Regional Director of the Asia Region
and National Programme Manager, respectively. Micronutrient Initiative, New Delhi. Lawlor, D.A., G.D. Smith, K.R. Bruckdorfer, D. Kundu, S. Ebrahim (2004). �Those Confounded Vitamins:
What Can We Learn from the Differences Between Observational versus Randomised Trial Evidence?� Lancet 363: 1724-1727.
Leibenstein, H. (1957). �The Theory of Underemployment in Backward Economies.� Journal of Political Economy 65: 91-103.
Lence, S.H. and D.J. Hayes (2005). �Technology Fees versus GURTs in the Presence of Spillovers: World Welfare Impacts.� AgBioForum 8: 172-186.
Levin, H.M. (1986). �A Benefit-Cost Analysis of Nutritional Programs for Anaemia Reduction.� Research Observer 1: 219-245.
Liebig, K. (2005). Die internationale Regulierung geistiger Eigentumsrechte und ihr Einfluss auf den Wissenserwerb in Entwicklungsländern. (The Effects of the International Strengthening of Intellectual Property Rights on Technology Use in Developing Countries.) Dissertation, Faculty of Economic Sciences. Göttingen: Univ of Göttingen.
Lipton, M. (2001). �Challenges to Meet: Food and Nutrition Security in the New Millennium.� Proceedings of the Nutrition Society 60: 203-214.
Lönnerdal, B. (2003). �Genetically Modified Plants for Improved Trace Element Nutrition.� Journal of Nutrition 133: 1490S-1493S.
Looker, A.C., M.E. Cogswell and E.W. Gunter (2002). �Iron Deficiency: United States, 1999-2000.� Morbidity and Mortality Weekly Report 51: 897-920.
Lopez, A.D., O.B. Ahmad, M. Guillot, M. Inoue, B.D. Ferguson and J.A. Salomon (2001). �Life Tables for 191 Countries for 2000: Data, Methods, Results.� GPE Discussion Paper, World Health Organization, Geneva.
Lorch, A. (2001). �Is this the Way to Solve Malnutrituion?� Biotechnology and Development Monitor 44: 18-22.
Lorch, A. (2005). �Vitamin A Deficiency: Diverse Causes, Diverse Solutions.� Report, March 17. Greenpeace International, Amsterdam.
Lorentzen, P., J. McMillan, R. Wacziarg (2005). �Death and Development.� Working Paper No. 11620. National Bureau of Economic Research, Cambridge, MA.
131
Louwaars, N.P., R. Tripp, D. Eaton, V. Henson-Apollonio, R. Hu, M. Mendoza, F. Muhhuku, S. Pal and J. Wekundah (2005). �Impacts of Strengthened Intellectual Property Rights Regimes on the Plant Breeding Industry in Developing Countries.� Wageningen Univ and Research Centre, Wageningen.
Lucca, P., R. Hurrell and I. Potrykus (2001). �Genetic Engineering Approaches to Improve the Bioavailability and the Level of Iron in Rice Grains.� Theoretical and Applied Genetics 102: 392-397.
Lucca, P., R. Hurrell and I. Potrykus (2002). �Fighting Iron Deficiency Anemia with Iron-Rich Rice.� Journal of the American College of Nutrition 21: 184S-190S.
Lusk, J.L. (2003). �Effects of Cheap Talk on Consumer Willingness-to-Pay for Golden Rice.� American Journal of Agricultural Economics 85: 840-856.
Lyttkens, C.H. (2003). �Time to Disable DALYs? On the Use of Disability-Adjusted Life-Years in Health Policy.� European Journal of Health Economics 4: 195-202.
Magg, T., M. Bohn, D. Klein, V. Merditaj and A. E. Melchinger (2003). �Concentration of Moniliformin Produced by Fusarium Species in Grains of Transgenic Bt Maize Hybrids Compared to their Isogenic Counterparts and Commercial Varieties Under European Corn Borer Pressure.� Plant Breeding 122: 322-327.
Malthus, T.R. (1798). �An Essay on the Principle of Population, as it Affects the Future Improvement of Society.� J. Johnson, London.
Mannar, M.G.V. (2001). �Food Fortification as a Major Strategy to Address Micronutrient Malnutrition in Asia.� Nutrition and Development Series No. 2. Asian Development Bank, Manila, pp. 23-31.
Marshall, R.C., L.M. Marx and M.E. Raiff (2005). �Cartel Price Announcements: the Vitamins Industry.� Paper presented at the �Remedies and Sanctions in Competition Policy� Conference, February 17-18, Amsterdam.
Marx, J.J.M. (1997). �Iron Deficiency in Developed Countries: Prevalance, Influence of Lifestyle Factors and Hazards of Prevention.� European Journal of Clinical Nutrition 51: 491-494.
MASIPAG (2001). �Grains of Delusion: Golden Rice Seen from the Ground.� Briefing, February. MASIPAG, Los Baños and GRAIN, Barcelona.
Mason, J, M. Deitchler, Soekirman and R. Martorell (eds) (2004). �Successful Micronutrient Programs.� Food and Nutrition Bulletin 25(1).
Mason, J.B., M. Lotfi, N. Dalmiya, K. Sethuraman and M. Deitchler (2001). �The Micronutrient Report: Current Progress and Trends in the Control of Vitamin A, Iron, and Iodine Deficiencies.� Micronutrient Initiative, Ottawa.
Mayer, J. (2005). Personal communication. Golden Rice Project Manager, Campus Technologies Freiburg, Univ of Freiburg.
Mazumdar, D. (1959). �The Marginal Productivity Theory of Wages and Disguised Unemployment.� Review of Economic Studies 26: 190-197.
McHughen, A. (2000). �Biotechnology and Food.� American Council on Science and Health, New York. Meenakshi, J.V. (2005). Personal communication. HarvestPlus Impact and Policy Coordinator,
International Food Policy Research Institute, Washington, DC. Meenakshi, J.V. and R. Ray (1999). �Regional Differences in India�s Food Expenditure Pattern:
a Complete Demand Systems Approach.� Journal of International Development 11: 47-74. Mehansho, H., R.I. Mellican, D.L. Hughes, D.B. Compton and T. Walter (2003). �Multiple-Micronutrient
Fortification Technology Development and Evaluation: From Lab to Market.� Food and Nutrition Bulletin 24: S111-S119.
Menrad, M., B. Hüsing, K. Menrad, T. Reiß, S. Beer-Borst and C.A. Zenger (2000). Technology Assessment Functional Food. Bern: Zentrum für Technologiefolgen-Abschätzung.
Merx, R.J.H.M, M. Lotfi, P. Naber-v.d.Heuvel and M.G.V. Mannar (1996). Micronutrient Fortification of Foods: Current Practices, Research and Opportunities. Wageningen and Ottawa: International Agriculture Centre and the Micronutrient Initiative.
Meyer, O. (2005). �Wie Lautet der Englische Begriff für Eisenbahn?� Mobil: Das Magazin der Bahn 9: 46.
MI (2005). �Controlling Vitamin & Mineral Deficiencies in India: Meeting the Goal.� Micronutrient Initiative, New Delhi.
132
MI/UNICEF (2004). �Vitamin & Mineral Deficiency: a Global Damage Assessment Report.� Micronutrient Initiative, Ottawa and UNICEF, New York.
Miller Del Rosso, J. (1999). �School Feeding Programs: Improving Effectiveness and Increasing the Benefit to Education. A Guide for Program Managers.� Partnership for Child Development, Oxford.
Miller, H.I. (2002). �As Biotech Turns 20�� Nature Reviews Drug Discovery 1: 1007-1008. Miller, T. (2000). �Variations Between Countries in Values of Statistical Life.�
Journal of Transport Economics and Policy 34: 169-188. Mills, A. and S. Shillcutt (2004). �Communicable diseases.� Challenge Paper, Copenhagen Consensus,
Copenhagen. Milner, J.A. (2000). �Functional Foods: the US Perspective.� American Journal of Clinical Nutrition
71: 1654S-1659S. Ming High, S., M.B. Cohen, Q. Yao Shu and I. Altosaar (2004). �Achieving Successful Deployment
of Bt Rice.� TRENDS in Plant Science 9: 286-292. Mira, C. (2006). �Detienen un Embarque de Soja Argentina en Liverpool,� February 8.
La Nación, Buenos Aires, p. 3. Monasterio, I. and R.D. Graham (2000). �Breeding for Trace Minerals in Wheat.�
Food and Nutrition Bulletin 21: 392-396. Monsanto (2005). �Seeding Values: The Promise of Our Technology.� Pledge Report,
Monsanto Company, St. Louis, MO. Mora, J.O. (2002). �Iron Supplementation: Overcoming Technical and Practical Barriers.�
Journal of Nutrition 132: 853S-855S. Moy, R.J.D. and A.R. Early (1999). �Iron Deficiency in Childhood.� Journal of the Royal Society
of Medicine 92: 234-236. Mudur, G. (2001). �Deaths Trigger Fresh Controversy over Vitamin A Programme in India.�
British Medical Journal 323: 1206. Mukhopadhyay, D. and K. Mohanaruban (2002). �Iron Deficiency Anaemia in Older People:
Investigation, Management and Treatment.� Age and Ageing 31: 87-91. Murphy, S.P. and M.I. Poos (2002). �Dietary Reference Intakes: Summary of Applications
in Dietary Assessment.� Public Health Nutrition 5: 843-849. Murphy, S.P., S.I. Barr and M.I. Poos (2002). �Using the New Dietary Reference Intakes
to Assess Diets: a Map to the Maze.� Nutrition Reviews 60: 267-275. Murray, C.J.L. (1994). �Quantifying the Burden of Disease: the Technical Basis for Disability-Adjusted
Life Years.� Bulletin of the World Health Organization 72: 429-445. Murray, C.J.L. (1996). �Rethinking DALYs.� In: Murray and Lopez (1996a), pp. 1-98. Murray, C.J.L. and A.D. Lopez (eds) (1996a). The Global Burden of Disease, Global Burden of Disease
and Injury Series, Vol. 1. Cambridge, MA: Harvard Univ. Murray, C.J.L. and A.D. Lopez (1996b). �The Global Burden of Disease in 1990: final results and
their sensitivity to alternative epidemiological perspectives, discount rates, age-weights and disability weights.� In: Murray and Lopez (1996a), pp. 247-293.
Murray, C.J.L. and A.D. Lopez (1996c). �Alternative Visions of the Future: Projecting Mortality and Disability, 1990-2020�. In: Murray and Lopez (1996a), pp. 325-395.
Murray-Kolb, L.E., F. Takaiwa, F. Goto, T. Yoshihara, E.C. Theil and J.L. Beard (2002). �Transgenic Rice Is a Source of Iron for Iron-Depleted Rats.� Journal of Nutrition 132: 957-960.
Musgrove, P. (2000). �A Critical Review of �A Critical Review�: the Methodology of the 1993 World Development Report, �Investing in Health�.� Health Policy and Planning 15: 110-115.
Nair, K.M. (2001). �Alternate Strategies for Improving Iron Nutrition: Lessons From Recent Research.� British Journal of Nutrition 85: S187-S191.
Nair, K.M., G.N.V. Brahmam, S. Ranganathan, K. Vijayaraghvan, B. Sivakumar and K. Krishnaswamy (1998). �Impact Evaluation of Iron and Iodine Fortified Salt.� Indian Journal of Medical Research 108: 203-211.
133
Narasinga Rao, B.S. (2000). �Potential Use of Red Palm Oil in Combating Vitamin A Deficiency in India.� Food and Nutrition Bulletin 21: 202-211.
Nestel P., H.E. Bouis, J.V. Meenakshi, W. Pfeiffer (2006). �Biofortification of Staple Food Crops.� Journal of Nutrition 136: 1064-1067.
Nestel, P. (2005). Personal communication. HarvestPlus Nutrition Coordinator, Wageningen Univ. Nestel, P. and L. Davidsson (2002). Anemia, Iron Deficiency, and Iron Deficiency Anemia. Washington,
DC: International Nutritional Anemia Consultative Group (INACG). Newell, P. and D. Glover (2003). �Business and Biotechnology: Regulation and the Politics of Influence.�
Working Paper No. 192. Institute of Development Studies, Brighton. NFHS (2000). National Family Health Survey (NFHS-2), 1998-99: India. Mumbai:
International Institute for Population Sciences and ORC Macro. NIH (2005). �Dietary Supplement Fact Sheet: Vitamin A and Carotenoids.�
Office of Dietary Supplements, National Institutes of Health, Bethesda, MD. NIN (2003). �Prevalence of Micronutrient Deficiencies.� Technical Report No. 22,
National Institute of Nutrition, Hyderabad. Nokes, K. and D. Bundy (1997). Iron and Cognition. Washington, DC: ILSI Press. NSSO (2000). Consumer Expenditure Survey, 55th Round. National Sample Survey Organisation,
Kolkata and New Delhi. NSSO (2001). �Level and Pattern of Consumer Expenditure in India 1999-2000,� NSS 55th Round,
Report No. 457. National Sample Survey Organisation, New Delhi. Nuffield (2003). �The Use of Genetically Modified Crops in Developing Countries.� Discussion Paper,
Nuffield Council on Bioethics, London. Nugent, A.P. and B. McKevith (2004). �Fortified Foods: Friend or Foe?� Nutrition Bulletin 29: 295-297. OANDA (2005). �FXConverter.� OANDA Corporation, New York. Available online:
http://www.oanda.com/convert/. OHCHR (1948). �Universal Declaration of Human Rights.� General Assembly Resolution 217 A (III)
of December 10. Office of the United Nations High Commissioner for Human Rights, Geneva. OHCHR (1966). �International Covenant on Economic, Social and Cultural Rights.� General Assembly
Resolution 2200 A (XXI) of December 16. Office of the United Nations High Commissioner for Human Rights, Geneva.
OHCHR (1979). �Convention on the Elimination of All Forms of Discrimination against Women.� General Assembly Resolution 34/180 of December 18. Office of the United Nations High Commissioner for Human Rights, Geneva.
OHCHR (1989). �Convention on the Rights of the Child.� General Assembly Resolution 44/25 of November 20. Office of the United Nations High Commissioner for Human Rights, Geneva.
OHCHR (1999). �The Right to Adequate Food.� General Comment 12, No. E/C.12/1999/5 of May 12. Committee on Economic, Social and Cultural Rights, Office of the United Nations High Commissioner for Human Rights, Geneva.
OHCHR (2003). �Right to Food in India.� Written statement submitted by South Asian Human Rights Documentation Centre, a non-governmental organization in special consultative status, No. E/CN.4/2003/NGO/158 of March 15. Office of the United Nations High Commissioner for Human Rights, Geneva.
OHCHR (2004). �Selection of Case Law on Economic, Social and Cultural Rights.� Background paper prepared by the Secretariat, No. E/CN.4/2005/WG.23/CRP.1 of November 15. Office of the United Nations High Commissioner for Human Rights, Geneva.
Olsen, J.A., J. Richardson, P. Dolan and P. Menzel (2003). �The Moral Relevance of Personal Characteristics in Setting Health Care Priorities.� Social Science and Medicine 57: 1163-1172.
Olson, J.A. (1987). �Recommended Dietary Intakes (RDI) of Vitamin A in Humans.� American Journal of Clinical Nutrition 45: 704-716.
Ortiz-Monasterio, I. (2004). Personal communication. HarvestPlus Wheat Crop Leader and Agronomist, International Maize and Wheat Improvement Centre, México.
134
Orton, L. (2003). �GM Crops: Going Against the Grain.� ActionAid, London. Osendarp, S.J.M., C.E. West and R.E. Black (2003). �The Need for Maternal Zinc Supplementation
in Developing Countries: An Unresolved Issue.� Journal of Nutrition 133: 817S-827S. Padma, T.V. and M. Shanahan (2006). �Indian Scientist Denies Accusation of Biopiracy,� January 24.
Science and Development Network, London. Paine, J.A, C.A. Shipton, S. Chaggar, R.M. Howells, M.J. Kennedy, G. Vernon, S.Y. Wright,
E. Hinchliffe, J.L. Adams, A.L. Silverstone and R. Drake (2005). �Improving the Nutritional Value of Golden Rice through Increased Pro-Vitamin A Content.� Nature Biotechnology 23: 482-487.
Pangaribuan, R., J.G. Erhardt, V. Scherbaum and H.K. Biesalski (2003). �Vitamin A Capsule Distribution to Control Vitamin A Deficiency in Indonesia: Effect of Supplementation in Pre-School Children and Compliance with the Programme.� Public Health Nutrition 6: 209-216.
PATH (2000). Ultra Rice Technology. Program for Appropriate Technology in Health, Seattle, WA. Persley, G.J. (2003). New Genetics, Food and Agriculture: Scientific Discoveries � Societal Dilemmas.
Paris: International Council for Science. Pew Initiative (2004). �Feeding the World: a Look at Biotechnology & World Hunger.� Brief,
Pew Initiative on Food and Biotechnology, Washington, DC. Phillips, M. and T.G. Sanghvi (1996). The Economic Analysis of Nutrition Projects.
Human Development Department, World Bank, Washington, DC. Philpott, T. (2006). �Monsanto�s Man at the U.S. Trade Office,� January 9. Grist Magazine, Seattle, WA.
Available online: http://gristmill.grist.org/story/2006/1/9/13258/06199 Pingali, P. and T. Raney (2005). �From the Green Revolution to the Gene Revolution:
How will the Poor Fare?� ESA Working Paper No. 9, Agricultural and Development Economics Division, Food and Agriculture Organization of the United Nations, Rome.
Pinstrup-Andersen, P. (2005). �Ethics and Economic Policy for the Food System.� American Journal of Agricultural Economics 87: 1097-1112.
Pinstrup-Andersen, P. and M.J. Cohen (2000). �Modern Biotechnology for Food and Agriculture: Risks and Opportunities for the Poor.� In: Persley, G.J. and M.M. Lantin (eds) (2000). �Agricultural Biotechnology and the Poor: An International Conference on Biotechnology.� Consultative Group on International Agricultural Research, Washington, DC, pp. 159-169.
Pollan, M. (2001). �The Great Yellow Hype,� March 4. The New York Times, New York. Popkin, B.M, S. Horton, S. Kim, A. Mahal and J. Shuigao (2001b). �Trends in Diet, Nutritional Status,
and Diet-related Noncommunicable Diseases in China and India: The Economic Costs of the Nutrition Transition.� Nutrition Reviews 59: 379-390.
Popkin, B.M., S.H. Horton and S. Kim (eds) (2001a). �The Nutrition Transition and Prevention of Diet-related Diseases in Asia and the Pacific.� Food and Nutrition Bulletin 22(4), Supplement.
Potrykus, I. (2001). �Golden Rice and Beyond.� Plant Physiology 125: 1157-1161. Potrykus, I. (2005). �Golden Rice, Vitamin A and Blindness.� Presentation at the
Swiss Federal Institute of Technology, March 18, Zürich. Available online: http://www.goldenrice.org/PDFs/Potrykus_Zurich_2005.pdf.
Prasad, A.S. (2003). �Zinc Deficiency Has Been Known of for 40 Years but Ignored by Global Health Organisations.� British Medical Journal 326: 409-410.
Pray, C.E., P. Bengali and B. Ramaswami (2005). �The Cost of Biosafety Regulations: the Indian Experience.� Quarterly Journal of International Agriculture 44: 267-289.
Prentice, A.M. (2006). �The Emerging Epidemic of Obesity in Developing Countries.� International Journal of Epidemiology 35: 93-99.
Priesner, S. (1999). �Gross National Happiness: Bhutan�s Vision of Development and its Challenges.� The Centre for Bhutan Studies, Thimphu.
Qaim, M. (2000). Potential Impacts of Crop Biotechnology in Developing Countries. Development Economics and Policy Series No. 17. Frankfurt am Main: Peter Lang.
Qaim, M. (2001). �Transgenic Crops and Developing Countries.� Economic and Political Weekly 36: 3064-3070.
135
Qaim, M. (2003). �Bt Cotton in India: Field Trial Results and Economic Projections.� World Development 31: 2115-2127.
Qaim, M. (2005). �Agricultural Biotechnology Adoption in Developing Countries.� American Journal of Agricultural Economics 87 1317-1324.
Qaim, M. and A. de Janvry (2003). �Genetically Modified Crops, Corporate Pricing Strategies, and Farmers� Adoption: the Case of Bt Cotton in Argentina.� American Journal of Agricultural Economics 85: 814-828.
Qaim, M. and D. Zilberman (2003). �Yield Effects of Genetically Modified Crops in Developing Countries.� Science 299: 900-902.
Qaim, M. and I. Matuschke (2005). �Impacts of Genetically Modified Crops in Developing Countries: a Survey of the Evidence so far.� Quarterly Journal of International Agriculture 44: 207-227.
Qaim, M. and J. von Braun (1998). �Crop Biotechnology in Developing Countries: a Conceptual Framework for Ex Ante Economic Analyses.� Discussion Papers on Development Policy No. 3, Centre for Development Research (ZEF), Bonn.
Qaim, M., A. Subramanian, G. Naik and D. Zilberman (2006). �Adoption of Bt Cotton and Impact Variability: Insights from India.� Review of Agricultural Economics 28: 48-58.
Rahman, M.M., M.A. Wahed, G.J. Fuchs, A.H. Baqui and J.O. Alvarez (2002). �Synergistic Effect of Zinc and Vitamin A on the Biochemical Indexes of Vitamin A Nutrition in Children.� American Journal of Clinical Nutrition 75: 92-98.
Raitzer, D.A. (2003). �Benefit-Cost Meta-Analysis of Investment in the International Agricultural Research Centres of the CGIAR.� Science Council Secretariat, Food and Agriculture Organization of the United Nations, Rome.
Ramachandran, P. (2003). �Lessons Learnt from the National Programme for Food and Micronutrients Supplementation in India.� In: ACC/SCN (2003). �Mainstreaming Nutrition for Improved Development Outcomes.� SCN News No. 26. Administrative Committee on Coordination/ Sub-Committee on Nutrition, Geneva, pp. 18-20.
Ramakrishnan, U. (2002). �Prevalence of Micronutrient Malnutrition Worldwide.� Nutrition Reviews 60: S46-S52.
Ramakrishnan, U. and R. Yip (2002). �Experiences and Challenges in Industrialized Countries: Control of Iron Deficiency in Industrialized Countries.� Journal of Nutrition 132: 820S-824S.
Ramakrishnan, U., N. Aburto, G. McCabe and R. Martorell (2004). �Multimicronutrient Interventions but not Vitamin A or Iron Interventions Alone Improve Child Growth: Results of 3 Meta-Analyses.� Journal of Nutrition 134: 2592-2602.
Rao, S.R. (2004). �Delivering Genetically Modified Food with Enhanced Nutritive Value: from Lab to Land to Malnourished Populations.� In: Dhawan, V. (ed.) (2004). Biotechnology for Food and Nutritional Security. New Delhi: TERI Press, pp. 165-184.
Rao, S.R. (2005). Personal communication. Director, Indian Department of Biotechnology, Ministry of Science & Technology, New Delhi.
Rassas, B. (2004). �Cost Analysis of the National Vitamin A Supplementation Programs in Ghana, Nepal and Zambia.� MOST, International Science and Technology Institute, Arlington, VA.
Ravallion, M. (1990). �Income Effects on Undernutrition.� Economic Development and Cultural Change 38: 489-515.
Raven, P. (2004). �Feeding a Hungry World: the Moral Imperatives of Biotechnology.� AgBioView Newsletter, September 25, Tuskegee Institute, Auburn, AL.
Rawls, J. (1971). A Theory of Justice. Cambridge, MA: Harvard Univ Press. Reddy, V. (2002). �Vitamin A Program in India: why the Controversy?� Sight and Life 3: 55-62. Registrar (2001). �Sample Registration System, 1999.� Office of the Registrar General, New Delhi. Reidpath, D.., P. Allotey, A. Kouamé and R. Cummins (2001). Social, Cultural and Environmental
Contexts and the Measurement of Burden of Disease: an Exploratory Study in the Developed and Developing World. Melbourne: Key Centre for Women�s Health in Society, Univ of Melbourne.
Reuters (2005). �Argentina Vows to Fight Monsanto Suits in Europe,� update 2, July 1. Reuters, London.
136
Reuters (2006). �Monsanto Stops Soy Coming to Spain from Argentina,� January 27. From: AGBIOS, Merrickville, Ontario.
Richardson, J. (1999a). �Age Weighting and Discounting: What Are the Ethical Issues?� Working Paper No. 109. Centre for Health Program Evaluation, Monash Univ, West Heidelberg.
Richardson, J. (1999b). �The Conceptual Basis for SMPH: Qualifying DALYs Dallying with QALYs?� Working Paper No. 108. Centre for Health Program Evaluation, Monash Univ, West Heidelberg.
Richter, J. (2003). �Global Public-Private �Partnerships�: How Do We Ensure that They Are in the Public Interest?� In: ACC/SCN (2003). �Mainstreaming Nutrition for Improved Development Outcomes.� SCN News No. 26. Administrative Committee on Coordination/Sub-Committee on Nutrition, Geneva, pp. 8-11.
Rijsberman, F. (2004). �The Water Challenge.� Challenge Paper, Copenhagen Consensus, Copenhagen. Roberfroid, M.B. (2000). �Concepts and Strategy of Functional Food Science:
the European Perspective.� American Journal of Clinical Nutrition 71: 1660S-1664S. Robinson, M. (1999). �The Human Right to Food and Nutrition.� In: ACC/SCN (1999). �Adequate Food:
a Human Right.� SCN News No. 18. Administrative Committee on Coordination/Sub-Committee on Nutrition, Geneva, pp. 19-20.
Rodgers, G.B. (1975). �Nutritionally Based Wage Determination in the Low-Income Labour Market.� Oxford Economic Papers 27: 61-81.
Ronsmans, C., O. Campbell and M. Collumbien (1999). �Effect of Supplementation with Vitamin A or Carotene on Mortality Related to Pregnancy.� British Medical Journal 319: 1201.
Roosen, J., K. Hansen and S. Thiele (2004). �Food Safety and Risk Perception in a Changing World.� Paper presented at the 84th Seminar of the European Association of Agricultural Economists about �Food Safety in a Dynamic World�, February 8-11, Zeist.
Ropeik, D. (2004). �The Consequences of Fear.� EMBO reports 5: S56-S60. Rosenberg, L.E. (2002). Exceptional Economic Returns on Investments in Medical Research.
Medical Journal of Australia 177: 368-371. Ross, J.S. and S. Horton (1998). �Economic Consequences of Iron Deficiency.�
Micronutrient Initiative, Ottawa. Roux L. and C. Donaldson (2004). �Economics and Obesity: Costing the Problem
or Evaluating Solutions?� Obesity Research 12: 173-179. Rowland, T.W., M.B. Deisroth, G.M. Green, J.F. Kelleher (1988). �The Effect of Iron Therapy
on the Exercise Capacity of Non Anemic Iron-Deficient Adolescent Runners.� American Journal of Diseases of Children 142: 165-169.
Rudan, I., L. Tomaskovic, C. Boschi-Pinto and H. Campbell (2004). �Global Estimate of the Incidence of Clinical Pneumonia among Children under Five Years of Age.� Bulletin of the World Health Organization 82: pp. 895-903.
Ruel, M.T. (2001). �Can Food-Based Strategies Help Reduce Vitamin A and Iron Deficiencies?� International Food Policy Research Institute, Washington, DC.
Ruel, M.T. (2002). �Is Dietary Diversity an Indicator of Food Security or Dietary Quality? A Review of Measurement Issues and Research Needs.� FCND Discussion Paper No. 140, International Food Policy Research Institute, Washington, DC.
Rush, D. (2000). �Nutrition and Maternal Mortality in the Developing World.� American Journal of Clinical Nutrition 72: 212S-240S.
Sachdev, H.P.S. (1999). �No Magic Pills Exist for Reducing Mortality Related to Pregnancy.� British Medical Journal 319: 1201.
Sachdev, H.P.S. (2004). �Nutritional Transition in the Backdrop of Early Life Origin of Adult Diseases: A Challenge for the Future.� Indian Journal of Medical Research 119: iii-v.
Sachdev, H.P.S. (2005). Personal communication. Professor and Incharge, Division of Clinical Epidemiology, Department of Pediatrics, Maulana Azad Medical College, New Delhi and Visiting Professor, MRC Environmental Epidemiology Unit, Univ of Southampton.
Sachs, J.D., J.W. McArthur, G. Schmidt-Traub, M. Kruk, C. Bahadur, M. Faye and G. McCord (2004). �Ending Africa�s Poverty Trap.� Brookings Papers on Economic Activity 1: 117-240.
137
Sahai, S. (2004). �Bitter Harvest: Green Revolution Crops Better than GM Varieties.� The Times of India, December 14, Editorial.
Sanchez, P.A. and M.S. Swaminathan (2005). �Cutting World Hunger in Half.� Science 307: 357-359. Sandler, B.J. (2005). �Biofortification to Reduce Vitamin A Deficiency: a Comparative Cost-Benefit
Analysis of Golden Rice and Orange-Fleshed Sweet Potato.� Masters� thesis. Stanford Univ, CA. Sasson, A. (2005). �Food and Nutrition Biotechnology: Achievements, Prospects, and Perceptions.�
UNU-IAS Report, United Nations Univ Institute of Advanced Studies, Yokohama. Scherr, S. (2003). �Halving Global Hunger,� Background Paper of the Millennium Project Task Force
on Hunger. UN Millennium Project, New York. Schmid, A., H. Schneider, A. Golay and U. Keller (2005). �Economic Burden of Obesity
and its Comorbidities in Switzerland.� Social and Preventive Medicine 50: 87-94. Schnapp, N. and Q. Schiermeier (2001). �Critics Claim �Sight-Saving� Rice is Over-Rated.�
Nature 410: 503. SDCMA (n.d.). �Foods from Genetically Modified Crops.� San Diego Center for Molecular Agriculture,
San Diego, CA. http://www.sdcma.org/GMFoodsBrochure.pdf Sen, A. (1981). Poverty and Famines: an Essay on Entitlement and Deprivation. Oxford:
Oxford Univ Press. Serageldin, I. (1999). �Biotechnology and Food Security in the 21st Century.� Science 285: 387-389. Serageldin, I. and G.J. Persley (2000). �Promethean Science: Agricultural Biotechnology,
the Environment, and the Poor.� Consultative Group on International Agricultural Research, Washington, DC.
Shimizu, T. (2003). �Health Claims on Functional Foods: the Japanese Regulations and an International Comparison.� Nutrition Research Reviews 16: 241-252.
Shiva, V. (2000). �The �Golden Rice� Hoax.� Norfolk Genetic Information Network, Pottergate. Available online: http://ngin.tripod.com/11.htm.
Shivaprakash, N. (2004). �Development of β-Carotene-Enhanced Indian Mustard.� In: Dhawan, V. (ed.) (2004). Biotechnology for Food and Nutritional Security. New Delhi: TERI Press, pp. 107-111.
Shrimpton, R, C.G. Victora, M. de Onis, R.C. Lima, M. Blossner and G. Clugston (2001). �Worldwide Timing of Growth Faltering: Implications for Nutritional Interventions.� Pediatrics 107, p. e75.
Siegel-Itzkovich, J. (2003). �Police in Israel Launch Investigation into Deaths of Babies Given Formula Milk.� British Medical Journal 327: 1128.
Singh, A.K. (2005). Personal communication. Division of Genetics, Indian Agricultural Research Institute, New Delhi.
Singletary, K.W. and M.A. Morganosky (2004). �Functional Foods: Consumer Issues and Future Challenges.� Journal of Food Distribution Research 35: 1-5.
Smith, T.G. (2002). �The McDonald�s Equilibrium: Advertising, Empty Calories, and the Endogenous Determination of Dietary Preferences.� Departmental Working Paper No. 17-02, Univ of California, Santa Barbara, CA.
Solomons, N.W. and K. Schümann (2002). �Collateral Damage in the Battle Against Hypovitaminosis A?� American Journal of Clinical Nutrition 75: 659-661.
Solomons, N.W. and K. Schümann (2004). �Reply to U Kapil.� American Journal of Clinical Nutrition 80: 1083-1084.
Stein, A.J. (2003). �Determinants of Micronutrient Nutrition and the Potential Role of Novel, Food-Based Strategies in Diminishing Corresponding Malnutrition: an Economic Analysis.� Unpublished Research Proposal, Centre for Development Research (ZEF), Bonn.
Stein, A.J., J.V. Meenakshi, M. Qaim, P. Nestel, H.P.S. Sachdev and Z.A. Bhutta (2005). �Analyzing the Health Benefits of Biofortified Staple Crops by Means of the Disability-Adjusted Life Years Approach.� HarvestPlus Technical Monograph No. 4. International Food Policy Research Institute, Washington, DC and International Center for Tropical Agriculture, Cali.
Steinberg, F.M. (1998). �Biotech Pharmaceuticals and Biotherapy: An Overview.� Journal of Pharmacy & Pharmaceutical Sciences 1: 48-59.

138
Stewart Jr., C.N. (2005). �Open-Source Agriculture.� ISB News Report No. 12, Virginia Tech Univ, Blacksburg, VA, pp. 1-3.
Stiglitz, J.E. (1976). �The Efficiency Wage Hypothesis, Surplus Labour, and the Distribution of Income in L.D.C.s.� Oxford Economic Papers 28: 185-207.
Stoltzfus, R.J. (2001). �Iron-Deficiency Anemia: Reexamining the Nature and Magnitude of the Public Health Problem.� Journal of Nutrition 131: 697S-700S.
Stouthard, M.E.A., M.-L. Essink-Bot and G.J. Bonsel (2000). �Disability Weights for Diseases: a Modified Protocol and Results for a Western European Region.� European Journal of Public Health 10: 24-30.
Strategy Unit (2003). �Field Work: Weighing up the Costs and Benefits of GM crops.� Strategy Unit, Cabinet Office, London.
Strauss, J. (1986). �Does Better Nutrition Raise Farm Productivity?� The Journal of Political Economy 94: 297-320.
Strauss, J. and D. Thomas (1998). �Health, Nutrition, and Economic Development.� Journal of Economic Literature 36: 766-817.
Subramanian, A. (2001). �Are Income-Calorie Elasticities Really High in Developing Countries? Some Implications for Nutrition and Income.� Paper presented at the XXIV. General Conference of the International Union for the Scientific Study of Population, August 18-24, Salvador.
Talukder, A., L. Kiess, N. Huq, S. de Pee, I. Darnton-Hill and M.W. Bloem (2000). �Increasing the Production and Consumption of Vitamin A-Rich Fruits and Vegetables: Lessons Learned in Taking the Bangladesh Homestead Gardening Programme to a National Scale.� Food and Nutrition Bulletin 21: 165-172.
Tan-Torres Edejer, T., R. Baltussen, T. Adam, R. Hutubessy, A. Acharya, D.B. Evans and C.J.L. Murray (2003). Making Choices in Health: WHO Guide to Cost-Effectiveness Analysis. Geneva: World Health Organization.
Tan-Torres Edejer, T., M. Aikins, R. Black, L. Wolfson, R. Hutubessy and D.B. Evans (2005). �Cost Effectiveness Analysis of Strategies for Child Health in Developing Countries.� British Medical Journal, 331: e1177.
Tashi Phuntshi, K, D. Prakke and S. Chettri (1999). �Gross National Happiness: Concepts for the Debate.� The Centre for Bhutan Studies, Thimphu.
Thinley, L.J.Y. (1998). �Values and Development: �Gross National Happiness�.� Keynote speech delivered at the Millennium Meeting for Asia and the Pacific, Oct. 30 - Nov. 1, Seoul.
Timmer, C.P. (2003). �Biotechnology and Food Systems in Developing Countries.� Journal of Nutrition 133: 3319-3322.
Toenniessen, G.H., J.C. O�Toole and J. DeVries (2003). �Advances in Plant Biotechnology and its Adoption in Developing Countries.� Current Opinion in Plant Biology 6: 191-198.
Toteja, G.S., P. Singh, B.S. Dhillon, B.N. Saxena (2001). �Micronutrient Deficiency Disorders in 16 Districts of India,� Part I. Report of an ICMR Task Force Study. District Nutrition Project, Indian Council of Medical Research, New Delhi.
UN (2000). �United Nations Millennium Declaration.� General Assembly Resolution 55/2 of 8 September 2000. United Nations, New York.
UN (2003). �The Right to Food.� General Assembly Resolution 57/226 of 18 December 2002. United Nations, New York.
Underwood, B. (2000). �Overcoming Micronutrient Deficiencies in Developing Countries: Is there a Role for Agriculture?� Food and Nutrition Bulletin 21: 356-360.
Underwood, B.A. and S. Smitasiri (1999). �Micronutrient Malnutrition: Policies and Programs for Control and their Implications.� Annual Review of Nutrition 19: 303-324.
UNDP (2005). �Human Development Reports.� United Nations Development Programme, New York. Available online: http://hdr.undp.org/.
UNICEF (2003). �The State of the World�s Children 2004.� United Nations Children�s Fund, New York. UN-SCN (2004). �5th Report on the World Nutrition Situation.� United Nations System,
Standing Committee on Nutrition, Geneva.

139
US Trade (2006). �Biotech Firms Form Alliance to Fight off Possible TRIPS Amendments,� January 6, Inside US Trade, Inside Washington Publishers, Arlington, VA.
USDA (1994). �HHS News.� Agbiotech Federal News Releases, National Agricultural Library, US Department of Agriculture, Washington, DC.
USDA (2004). �USDA National Nutrient Database for Standard Reference,� Release 17. US Department of Agriculture, Agricultural Research Service, Washington, DC.
USTR (2005). �USTR Portman Thanks Senate for Swift Confirmation of Richard Crowder,� December 20. Office of the United States Trade Representative, Washington, DC.
van Wijk, J. (2002). �Food Insecurity: Prevalence, Causes, and the Potential of Transgenic �Golden Rice�.� Phytochemistry Reviews 1: 141-151.
Vasal, S.K. (2000). �The Quality Protein Maize Story.� Food and Nutrition Bulletin 21: 445-450. Vasconcelos, M., K. Datta, N. Oliva, M. Khalekuzzaman, L. Torrizo, S. Krishnan, M. Oliveira, F. Goto
and S.K. Datta (2003). �Enhanced Iron and Zinc Accumulation in Transgenic Rice with the Ferritin Gene.� Plant Science 164: 371-378.
Vasil, I.K. (2003). �The Science and Politics of Plant Biotechnology: a Personal Perspective.� Nature Biotechnology 21: 849-851.
Vijayalakshmi, P., S. Amirthaveni, R.P. Devadas, K. Weinberger, S.C.S. Tsou and S. Shanmuga-sundaram (2003). �Enhanced Bioavailability of Iron from Mungbeans and its Effects on Health of Schoolchildren.� Technical Bulletin No. 30, World Vegetable Center (AVRDC), Shanhua.
Vijayalakshmi, P., U. Kupputhai, V.U. Maheswari (1987). �Anaemia and Work Output of Farm Women.� Indian Journal of Nutrition and Dietetics. 24: 253-259.
Vijayaraghavan K. (2002). �Control of Micronutrient Deficiencies in India: Obstacles and Strategies.� Nutrition Reviews 60: 73-76.
Vijayaraghavan, K.K. (1999). �Effect of Supplementation with Vitamin A or Carotene on Mortality Related to Pregnancy.� British Medical Journal 319: 1201.
Viscusi, W.K. (1993). �The Value of Risks to Life and Health.� Journal of Economic Literature 31: 1912-1946.
Viscusi, W.K. and J.E. Aldy (2003). �The Value of a Statistical Life: A Critical Review of Market Estimates throughout the World.� NBER Working Paper No. 9487, National Bureau of Economic Research, Cambridge, MA.
Viteri, F.E. and B. Torun (1974). �Anaemia and Physical Work Capacity.� Clinics in Haematology 3: 609-626.
von Braun, J., M.S. Swaminathan and M.W. Rosegrant (2004). �Agriculture, Food Security, Nutrition and the Millennium Development Goals.� 2003-2004 IFPRI Annual Report, pp. 5-19. International Food Policy Research Institute, Washington, DC.
Wakimoto, P. and G. Block (2001). �Dietary Intake, Dietary Patterns, and Changes With Age: an Epidemiological Perspective.� The Journals of Gerontology Series A: Biological Sciences and Medical Sciences 56: 65-80.
Walczyk, T., L. Davidsson, L. Rossander-Hulthen, L. Hallberg and R.F. Hurrell (2003). �No Enhancing Effect of Vitamin A on Iron Absorption in Humans.� American Journal of Clinical Nutrition 77: 144-149.
Walker D. and J. Fox-Rushby (2001). �Allowing for Uncertainty in Economic Evaluations: Qualitative Sensitivity Analysis. Health Policy and Planning 16: 435-44.
Walker, D. (2001). Cost and Cost-Effectiveness Guidelines: Which Ones to Use?� Health Policy and Planning 16: 113-121.
Wambugu, F. (2003). �Review of Artificial Barriers to United States Agricultural Trade,� Statement Submitted to the Committee on Agriculture, United States House of Representatives. Available online: http://www.agbioworld.org/ newsletter_wm/index.php?caseid=archive&newsid=1626
Wang, X. and K. Taniguchi (2003). �Does Better Nutrition Enhance Economic Growth? The Economic Cost of Hunger.� In: Taniguchi, K. and X. Wang (eds) (2003). Nutrition Intake and Economic Growth. Rome: Food and Agriculture Organization of the United Nations.
140
Ward, J.O. and J.H. Sanders (1980). �Nutritional Determinants and Migration in the Brazilian Northeast: a Case Study of Rural and Urban Ceara.� Economic Development and Cultural Change 29: 141-163.
Webb, P. (2002). �Intrahousehold Dimensions of Micronutrient Deficiencies: a Review of the Evidence.� Discussion Paper No. 4. Friedman School of Nutrition Science and Policy, Tufts Univ, Boston, MA.
Webb, P. and S. Block (2004). �Nutrition Information and Formal Schooling as Inputs to Child Nutrition.� Economic Development and Cultural Change 52: 801-820.
Weinberger, K. (2003). �The Impact of Micronutrients on Labor Productivity: Evidence from Rural India.� Paper presented at the 25th International Conference of Agricultural Economists, August 16-22, Durban.
Welch, R. M. (2002). �Breeding Strategies for Biofortified Staple Plant Foods to Reduce Micronutrient Malnutrition Globally.� Journal of Nutrition 132: 495S-499S.
Welch, R.M. and R.D. Graham (2000). �A New Paradigm for World Agriculture: Productive, Sustainable, Nutritious, Healthful Food Systems.� Food and Nutrition Bulletin 21: 361-366.
West Jr., K.P. and A. Sommer (2002). �Vitamin A Programme in Assam Probably Caused Hysteria.� British Medical Journal 324: 791.
West Jr., K.P., J. Katz and S. Khatry (1999). �Effect of Supplementation with Vitamin A or Carotene on Mortality Related to Pregnancy.� British Medical Journal 319: 1201.
WHO (2001a). �Macroeconomics and Health: Investing in Health for Economic Development.� Report of the Commission on Macroeconomics and Health, World Health Organization, Geneva.
WHO (2001b). �Life Tables for 191 Countries � World Mortality 2000.� World Health Organization, Geneva. Available online: http://www3.who.int/whosis/life/.
WHO (2002). �The World Health Report 2002.� World Health Organization, Geneva. WHO (2003a). �Battling Iron Deficiency Anaemia,� updated 3 September. World Health Organization,
Geneva. Available online: http://www.who.int/nut/ida.htm. WHO (2003b). �Diet, Nutrition and the Prevention of Chronic Diseases.� Technical Report Series
No. 916. World Health Organisation, Geneva. WHO (2005a). �Vitamin A Supplementation.� World Health Organization, Geneva.
Available online: http://www.who.int/vaccines/en/vitamina.shtml. WHO (2005b). �Purchasing Power Parity 2000.� World Health Organization, Geneva.
Available online: http://www.who.int/choice/costs/ppp/. WHO (2005c). Modern Food Biotechnology, Human Health and Development:
an Evidence-Based Study. Geneva: World Health Organisation. Wiesmann, D. (2004). An International Nutrition Index: Concept and Analyses of Food Insecurity
and Undernutrition at Country Levels. Development Economics and Policy Series No. 39. Frankfurt am Main: Peter Lang.
Williams, A. (1999). �Calculating the Global Burden of Disease: Time for a Strategic Reappraisal?� Health Economics 8: 1-8.
Williams, J.H., T.D. Phillips, P.E. Jolly, J.K. Stiles, C.M. Jolly and D. Aggarwal (2004). �Human Aflatoxicosis in Developing Countries: a Review of Toxicology, Exposure, Potential Health Consequences, and Interventions.� American Journal of Clinical Nutrition 80: 1106-1122.
Williams, T. (2001). �The Corruption of American Agriculture.� Americans for Democratic Action Education Fund, Washington, DC.
Windell, T. (2000). �Critical Care.� StarTrek: Voyager, Episode 705. Paramount Pictures, Hollywood, CA. Wolfe, B.L. and J.R. Behrman (1983). �Is Income Overrated in Determining Adequate Nutrition?�
Economic Development and Cultural Change 31: 525-549. Wolgemuth, J.C., M.C. Latham, A. Hall, A. Chesher and D.W. Crompton (1982). �Worker Productivity
and the Nutritional Status of Kenyan Road Construction Laborers.� American Journal of Clinical Nutrition 36: 68-78.
World Bank (1993). �World Development Report 1993.� World Bank, Washington, DC. World Bank (1994). Enriching Lives: Overcoming Vitamin and Mineral Malnutrition
in Developing Countries. World Bank: Washington, DC.
141
World Bank (2005). �World Development Indicators Database.� World Bank, Washington, DC. Available online: http://www.worldbank.org/data/.
World Bank (2006). Repositioning Nutrition as Central to Development: a Strategy for Large-Scale Action. Washington, DC: World Bank.
Wuehler, S.E., J.M. Peerson, K.H. Brown (2005). �Use of National Food Balance Data to Estimate the Adequacy of Zinc in National Food Supplies: Methodology and Regional Estimates.� Public Health Nutrition 8: 812-819.
Xu, B.-J., X.-Q. Jia, L.-J. Gu and C.-K. Sung (2006). �Review on the Qualitative and Quantitative Analysis of the Mycotoxin Citrinin.� Food Control 17: 271-285.
Xu, Z.-H. and S.-N. Bai (2002). �Impact of Biotechnology on Agriculture in China.� TRENDS in Plant Science 7: 374-375.
Ye, X., S. Al-Babili, A. Klöti, J. Zhang, P. Lucca, P. Beyer and I. Potrykus (2000). �Engineering the Provitamin A (β-Carotene) Biosynthetic Pathway into (Carotenoid-Free) Rice Endosperm.� Science 287: 303-305.
Yip, R. (2002). �Prevention and Control of Iron Deficiency: Policy and Strategy Issues.� Journal of Nutrition 132: S802-S805.
Ziegler, J. and S.-A. Way (2001). �The Right to Food: What Parliamentarians Can Do in the Fight Against Hunger.� A Briefing Paper prepared for the Inter-Parliamentary Union. Institute Universitaire d�Etudes du Développement, Geneva.
Zilberman, D., H. Ameden, G. Graff and M. Qaim (2004). �Agricultural Biotechnology: Productivity, Biodiversity, and Intellectual Property Rights.� Journal of Agricultural & Food Industrial Organization 2: Article 3.
Zimmermann, R. (2004). Biotechnology and Value-Added Traits in Food Crops: Relevance for Developing Countries and Economic Analysis. Development Economics and Policy Series No. 42. Frankfurt am Main: Peter Lang.
Zimmermann, R. and M. Qaim (2004). �Potential Health Benefits of Golden Rice: a Philippine Case Study.� Food Policy 29: 147-168.
Zlotkin, S., P. Arthur, C. Schauer, K. Yeboah Antwi, G. Yeung and A. Piekarz (2003). �Home Fortification with Iron and Zinc Sprinkles or Iron Sprinkles Alone Successfully Treats Anemia in Infants and Young Children.� Journal of Nutrition 133: 1075-1080.
Zwart-Rijkom, J.E.F. (2002). Assessment and Diffusion of Biotechnology Drugs. Dissertation, Utrecht Institute for Pharmaceutical Sciences. Utrecht: Univ of Utrecht.
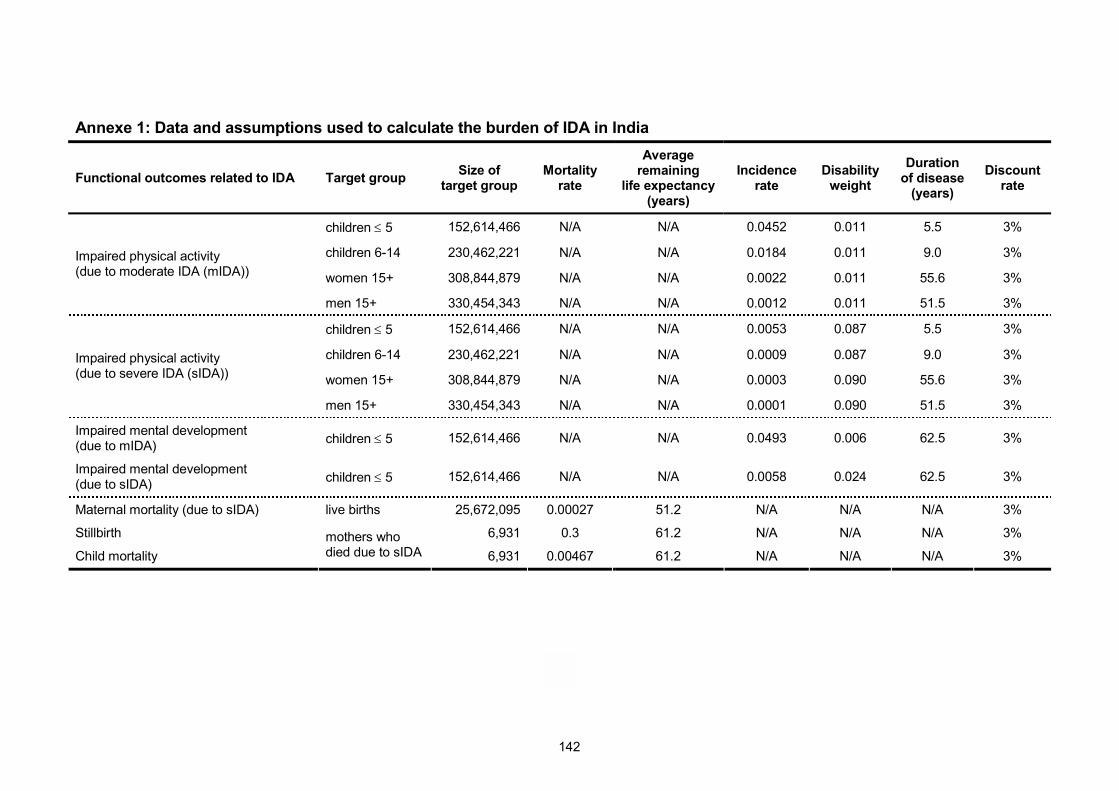
142
Annexe 1: Data and assumptions used to calculate the burden of IDA in India
Functional outcomes related to IDA Target group Size of target group
Mortality rate
Average remaining
life expectancy (years)
Incidence rate
Disability weight
Duration of disease
(years)
Discount rate
children ≤ 5 152,614,466 N/A N/A 0.0452 0.011 5.5 3%
children 6-14 230,462,221 N/A N/A 0.0184 0.011 9.0 3%
women 15+ 308,844,879 N/A N/A 0.0022 0.011 55.6 3% Impaired physical activity (due to moderate IDA (mIDA))
men 15+ 330,454,343 N/A N/A 0.0012 0.011 51.5 3%
children ≤ 5 152,614,466 N/A N/A 0.0053 0.087 5.5 3%
children 6-14 230,462,221 N/A N/A 0.0009 0.087 9.0 3%
women 15+ 308,844,879 N/A N/A 0.0003 0.090 55.6 3% Impaired physical activity (due to severe IDA (sIDA))
men 15+ 330,454,343 N/A N/A 0.0001 0.090 51.5 3%
Impaired mental development (due to mIDA) children ≤ 5 152,614,466 N/A N/A 0.0493 0.006 62.5 3%
Impaired mental development (due to sIDA) children ≤ 5 152,614,466 N/A N/A 0.0058 0.024 62.5 3%
Maternal mortality (due to sIDA) live births 25,672,095 0.00027 51.2 N/A N/A N/A 3%
Stillbirth 6,931 0.3 61.2 N/A N/A N/A 3%
Child mortality mothers who died due to sIDA 6,931 0.00467 61.2 N/A N/A N/A 3%

143
Annexe 2: Data and assumptions used to calculate the burden of ZnD in India
Functional outcomes related to ZnD Target group Size of target group
Mortality rate
Average remaining
life expectancy (years)
Incidence rate
Disability weight
Duration of disease
Discount rate
infants 25,059,172 N/A N/A 0.468 0.2 3 days 3% Diarrhoea
children 1-5 100,236,688 N/A N/A 0.234 0.15 4 days 3%
infants 25,059,172 N/A N/A 0.1189 0.3 4 days 3% Pneumonia
children 1-5 100,236,688 N/A N/A 0.1189 0.2 4 days 3%
Stunting infants 25,059,172 N/A N/A 0.455 0.0001 61.2 years 3%
Infant mortality live births 25,672,095 0.00268 61.2 N/A N/A N/A 3%
Child mortality live births 25,672,095 0.00104 64.4 N/A N/A N/A 3%
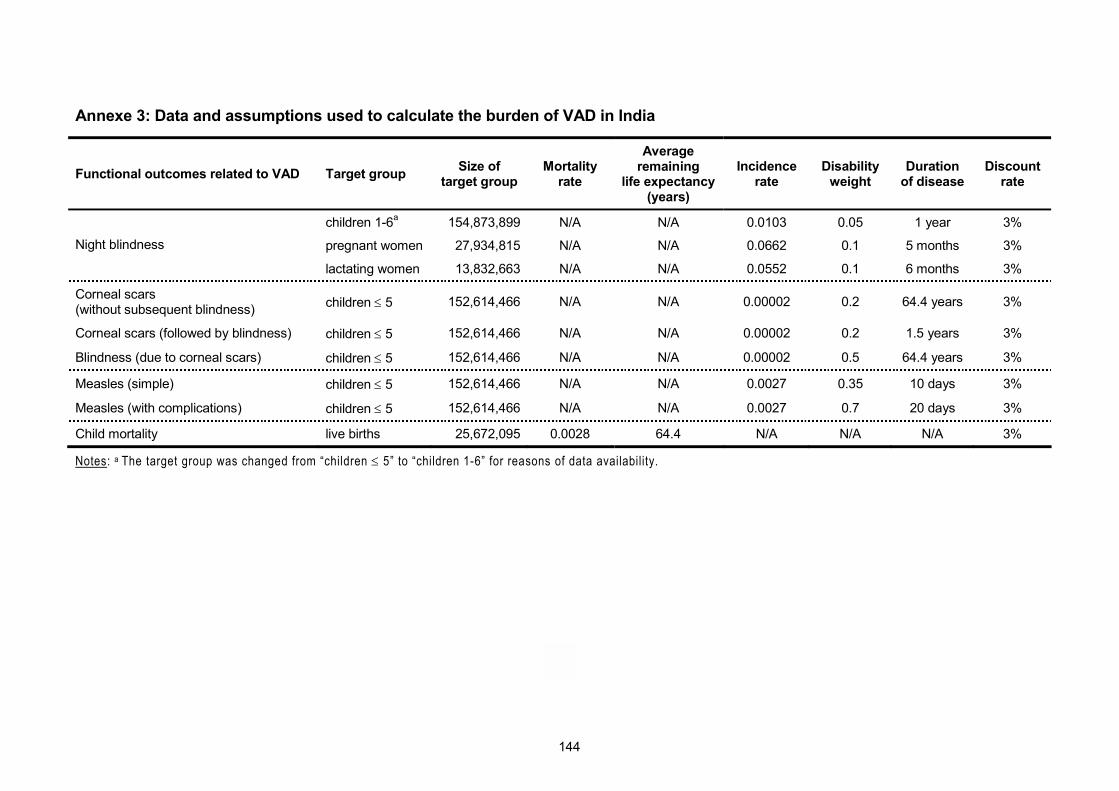
144
Annexe 3: Data and assumptions used to calculate the burden of VAD in India
Functional outcomes related to VAD Target group Size of target group
Mortality rate
Average remaining
life expectancy (years)
Incidence rate
Disability weight
Duration of disease
Discount rate
children 1-6a 154,873,899 N/A N/A 0.0103 0.05 1 year 3%
pregnant women 27,934,815 N/A N/A 0.0662 0.1 5 months 3% Night blindness
lactating women 13,832,663 N/A N/A 0.0552 0.1 6 months 3%
Corneal scars (without subsequent blindness) children ≤ 5 152,614,466 N/A N/A 0.00002 0.2 64.4 years 3%
Corneal scars (followed by blindness) children ≤ 5 152,614,466 N/A N/A 0.00002 0.2 1.5 years 3%
Blindness (due to corneal scars) children ≤ 5 152,614,466 N/A N/A 0.00002 0.5 64.4 years 3%
Measles (simple) children ≤ 5 152,614,466 N/A N/A 0.0027 0.35 10 days 3%
Measles (with complications) children ≤ 5 152,614,466 N/A N/A 0.0027 0.7 20 days 3%
Child mortality live births 25,672,095 0.0028 64.4 N/A N/A N/A 3%
Notes: a The target group was changed from �children ≤ 5� to �children 1-6� for reasons of data availability.
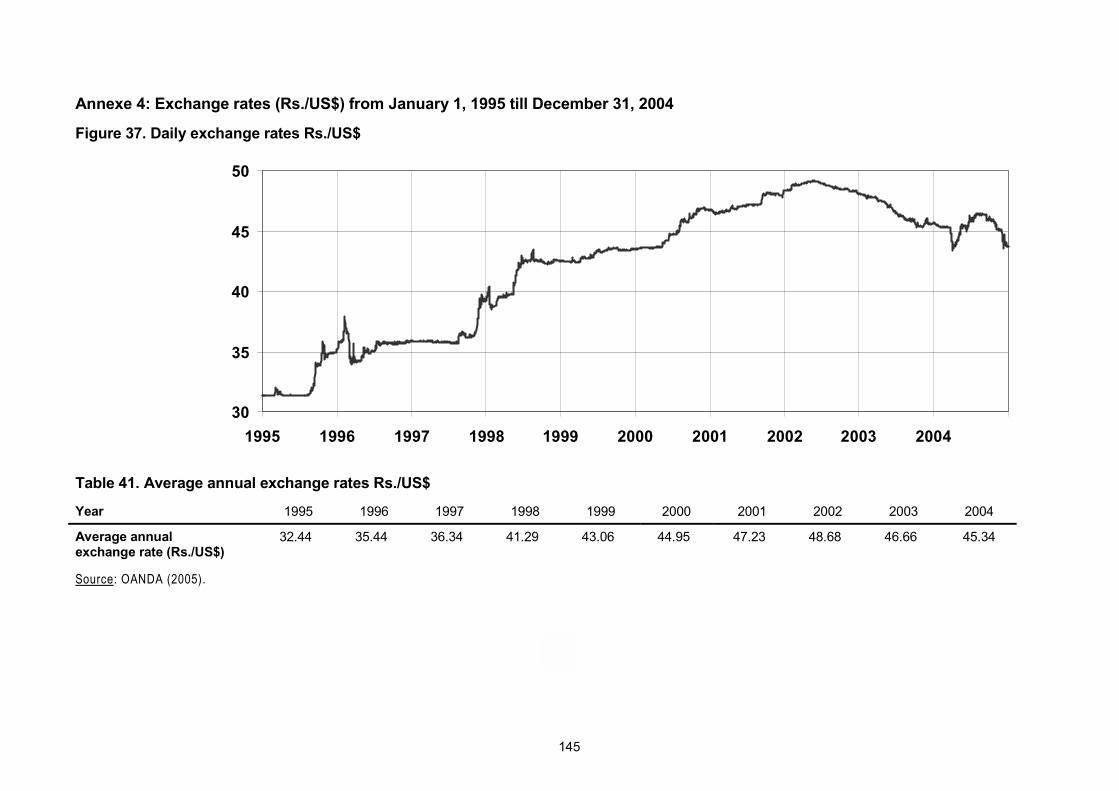
145
Annexe 4: Exchange rates (Rs./US$) from January 1, 1995 till December 31, 2004
Figure 37. Daily exchange rates Rs./US$
30
35
40
45
50
1995 1996 1997 1998 1999 2000 2001 2002 2003 2004
Table 41. Average annual exchange rates Rs./US$
Year 1995 1996 1997 1998 1999 2000 2001 2002 2003 2004
Average annual exchange rate (Rs./US$)
32.44 35.44 36.34 41.29 43.06 44.95 47.23 48.68 46.66 45.34
Source: OANDA (2005).

Alexander J. Stein is a research associate in the Depart-ment of Agricultural Economics and Social Sciences at the University of Hohenheim. He studied Economics at the universities of Würzburg, Münster and Montpellier, earned his MA in Economic Development and Policy Analysis from the University of Nottingham and obtained a PhD with distinction in Agricultural Economics from the University of Hohenheim. Prior to his current position he worked at the Centre for Development Research (ZEF) of the University of Bonn, as a consultant for development projects and for a stint as a trainee at the Council of the European Union. Throughout his career he has worked and travelled exten-sively overseas.
Vitamin and mineral deficiencies are widespread forms of undernutrition that affect particularly poor women and children, prevent them from reaching their full physical and mental potential and impose a heavy burden on public health and overall devel-opment. Current micronutrient interventions to control this problem, like pharmaceu-tical supplementation or industrial fortification, are considered to be cost-effective, even though their success in developing countries remains limited. Breeding staple crops for higher levels of essential micronutrients, or biofortification, is a novel inter-vention that has been proposed to address the issue of what is also called “hidden hunger”. While such breeding can often be carried out by conventional means, in some cases a genetic engineering approach may be required.
This ex ante study analyses the effectiveness of biofortification, both of conventional crops and of a genetically modified crop (Golden Rice), and juxtaposes the results and the costs of the intervention to determine its cost-effectiveness. To quantify the expected health gains, the study builds on “disability-adjusted life years” (DALYs), which is a way to add up mortality and weighted morbidity in a single index. Fur-thermore, in the study methodologies are developed to relate improved micronutrient intakes to better health outcomes and the economic aspects of using DALYs are dis-cussed.
In three case studies of iron-rich rice and wheat, zinc-rich rice and wheat and beta-carotene-rich Golden Rice in India, the potential of biofortification to reduce iron deficiency anaemia, zinc deficiency and vitamin A deficiency, respectively, is shown and its potential cost-effectiveness is illustrated. Because of the controversy sur-rounding genetically modified organisms (GMOs), the case of Golden Rice is dis-cussed in more depth. For biofortification to be successful in addressing micronutrient malnutrition (together with other micronutrient interventions), widespread adoption of the biofortified crops is important, as is the success of the ongoing R&D efforts in increasing the micronutrient content in the crops.