Embed Size (px)
Citation preview
The Proteome of Copper, Iron, Zinc, andManganese Micronutrient Deficiency inChlamydomonas reinhardtii*□S
Scott I. Hsieh‡, Madeli Castruita‡, Davin Malasarn‡, Eugen Urzica‡, Jonathan Erde‡,M. Dudley Page‡, Hiroaki Yamasaki‡, David Casero§¶, Matteo Pellegrini§¶,Sabeeha S. Merchant‡§�, and Joseph A. Loo‡§�**
Trace metals such as copper, iron, zinc, and manganeseplay important roles in several biochemical processes, in-cluding respiration and photosynthesis. Using a label-free,quantitative proteomics strategy (MSE), we examined theeffect of deficiencies in these micronutrients on the solubleproteome of Chlamydomonas reinhardtii. We quantified>103 proteins with abundances within a dynamic range of 3to 4 orders of magnitude and demonstrated statisticallysignificant changes in �200 proteins in each metal-deficientgrowth condition relative to nutrient-replete media.Through analysis of Pearson’s coefficient, we also exam-ined the correlation between protein abundance and tran-script abundance (as determined via RNA-Seq analysis) andfound moderate correlations under all nutritional states.Interestingly, in a subset of transcripts known to signifi-cantly change in abundance in metal-replete and metal-deficient conditions, the correlation to protein abundance ismuch stronger. Examples of new discoveries highlighted inthis work include the accumulation of O2 labile, anaerobio-sis-related enzymes (Hyd1, Pfr1, and Hcp2) in copper-defi-cient cells; co-variation of Cgl78/Ycf54 and coprogenoxidase; the loss of various stromal and lumenal photosyn-thesis-related proteins, including plastocyanin, in iron-lim-ited cells; a large accumulation (from undetectableamounts to over 1,000 zmol/cell) of two COG0523 domain-containing proteins in zinc-deficient cells; and the preser-vation of photosynthesis proteins in manganese-deficientcells despite known losses in photosynthetic function inthis condition. Molecular & Cellular Proteomics 12:10.1074/mcp.M112.021840, 65–86, 2013.
The investigation of cellular responses to micronutrient de-ficiency has provided important insights into the utilization ofmetals in biochemistry. Copper, iron, manganese, and zinc
(denoted by their elemental symbols Cu, Fe, Mn, and Zn,without reference to their ionic state) are among the mostwidely studied metals, as they are integral to many metabolicpathways and processes. A systematic examination of pro-teins with known three-dimensional structures belonging toone of 1,371 Enzyme Commission groups (defined as groupsof proteins known to catalyze the same reaction) showed that47% of these proteins require metals, often as part of thecatalytic center (1). Aside from magnesium, which is thoughtto bind to enzymes only transiently, zinc, iron, and manganeseare the three most highly utilized metals by enzymes, andcopper is the seventh most utilized (1). These four metals areof particular importance to plant biochemistry, as they eachplay a role in photosynthesis. Copper-containing plastocyanintransfers electrons from Photosystem (PS)1 II to PS I; iron isfound in all photosynthetic electron transport complexes, inferredoxin, and as heme and iron-sulfur centers in many en-zymes; manganese is required for the water splitting reactionof PS II; and zinc is utilized by carbonic anhydrases, whichhelp to concentrate inorganic carbon at the site of carbonfixation (2–4).
We have used Chlamydomonas reinhardtii, a single-celledalga, as a photosynthetic reference organism for understand-ing trace metal metabolism (3). Among other advantages,Chlamydomonas grows in culture in defined medium fromwhich it is straightforward to withhold the nutrient under study.In contrast to other plant models, Chlamydomonas can grow(photo)heterotrophically on acetate as a source of reduced car-bon when photosynthetic activity is compromised by mutationor the absence of an essential metal co-factor (5). Chlamy-domonas has also emerged as a reference organism for thestudy of the genetics and genomics of bio-fuel production (6).Most studies of triacylglyceride (TAG) synthesis in Chlamy-domonas have focused primarily on nitrogen-deficiency-induced TAG overaccumulation (7), but more recent studies
From the ‡Department of Chemistry and Biochemistry, Universityof California, Los Angeles, California 90095; §UCLA/DOE Institute ofGenomics and Proteomics, University of California, Los Angeles,California 90095; ¶Department of Molecular, Cell, and DevelopmentalBiology, University of California, Los Angeles, California 90095; **De-partment of Biological Chemistry, David Geffen School of Medicine atUCLA, University of California, Los Angeles, California 90095
Received July 5, 2012, and in revised form, September 30, 2012.Published, MCP Papers in Press, October 13, 2012, DOI 10.1074/
mcp.M112.021840
1 The abbreviations used are: Au10.2, Augustus 10.2; MnSOD,manganese-containing superoxide dismutase; MS, mass spectrom-etry; Oee, oxygen evolving enhancer protein; PS, photosystem; SAM,S-adenosylmethionine.
Research© 2013 by The American Society for Biochemistry and Molecular Biology, Inc.This paper is available on line at http://www.mcponline.org
Molecular & Cellular Proteomics 12.1 65
indicate that other stress conditions such as iron and zincdeficiency also result in TAG overaccumulation (8).
Traditional biochemical and classical genetic approacheshave revealed considerable information about responses tomicronutrient deficiencies in Chlamydomonas (3). The copperdeficiency response in Chlamydomonas is controlled via theactivity of a transcriptional regulator, CRR1 (9, 10). Examplesof CRR1-controlled responses include the replacement ofplastocyanin with heme-containing cytochrome c6 and in-creases in the abundance and activity of coporphyrinogenoxidase III (a product of the CPX1 gene, often abbreviated tocoprogen oxidase, that is involved in tetrapyrrole biosynthe-sis) and copper uptake proteins Ctr1, Ctr2, and a relatedsoluble protein Ctr3 (11). Recently, several CRR1-independ-ent changes in transcript abundance in copper-deficient cellswere also noted, and many of these overlap with changes thatoccur in anaerobic Chlamydomonas cells (12). Specifically,HYD1, HYDEF, HYDG, HCP2, HCP3, and PFR1 transcripts,which are involved in hydrogenase assembly, are increasedunder both copper deficiency and O2 deficiency conditions(12, 13). The proteins that correspond to these transcripts areO2 labile, and thus it is unclear whether the increase in HYD1,HYDEF, HYDG, HCP2, HCP3, and PFR1 transcripts will actu-ally result in an increase in the corresponding proteins.
As is the case for the copper nutrition regulon, responses toiron deficiency include up-regulation of iron assimilation pro-teins such as Ftr1 (a ferric ion transporter), ferroxidase (Fox1),Fea1, and Fea2 and elevation of the abundance of ferritins,which are believed to buffer iron released from iron-deficiency-induced degradation in heterotrophic cells of abundant ironproteins, including ferredoxin, an abundant iron–sulfur proteinin chloroplasts, and PS I with three Fe4S4 centers (14–16).Interestingly, although many PS I proteins are known to de-crease under iron limitation (17), changes in the transcripts ofthese proteins are not observed (18). Also, the magnitude ofchanges in the abundance of iron-containing proteins fromiron-deficient/limited cells differs greatly among proteins. Forexample, ferredoxin is known to decrease substantially iniron-starved cells (15), whereas the iron-containing superox-ide dismutase is only mildly affected, suggesting that someiron-proteins are more dispensable than others (19). This il-lustrates the need for proteomics surveys to identify changesat the protein level that are not apparent at the transcript leveland to help determine the dispensability of iron-proteins rel-ative to one another.
Manganese-deficient cells have reduced manganese-con-taining superoxide dismutase (MnSOD1) activity, and in se-verely deficient conditions PS II activity is reduced as well, sothat such cultures require acetate for growth. The oxygen evolv-ing enhancer proteins (Oee1, Oee2, Oee3) appear to be lesstightly associated with the thylakoid membrane in this situationand are found in soluble fractions of cell extracts (20).
Zinc deficiency has not been studied extensively in Chla-mydomonas to date. However, recent work has shown that
mRNAs encoding COG0523 family proteins, whose functionsare unknown but hypothesized to involve metal trafficking, areincreased in zinc-deficient growth conditions (21). Zinc-bind-ing carbonic anhydrases, which interconvert CO2 and bicar-bonate as part of the carbon-concentrating mechanism, areimportant for photosynthetic function at atmospheric levels ofCO2. They are decreased in abundance in zinc-deficient cells(22).
Availability of the Chlamydomonas genome has made pos-sible the initiation of large-scale examinations of changes tothe transcriptome and proteome under nutritional deficiencyconditions. Prior examinations of the metal-deficient tran-scriptomes in Chlamydomonas provide excellent examples ofthe application of the genome data. From these studies, agreat deal of information was obtained on the effect of metaldeficiency on the abundance of thousands of transcripts (13).Although transcript levels provide important information, theymay describe only a subset of all responses to metal defi-ciency. For instance, although plastocyanin abundance isdecreased dramatically in copper deficiency, the correspond-ing mRNAs are not (23). The need for proteome data to closethe knowledge gap between responses at the transcript leveland responses at the protein level is clear.
Recent advances in proteomics of Chlamydomonas haveled to the analysis of various subproteomes, including thosefrom the mitochondria (17, 24), chloroplast (17), centriole (25),eyespot apparatus (26–28), anaerobic responsive proteins(29), high-light responsive proteins (30), thioredoxin interact-ing proteins (31), and others (17, 24–32). To date, more than2,000 Chlamydomonas proteins have been identified viamass spectrometry (MS)-based proteomics techniques. Ofspecial interest are two comparative proteomics studies thatexamined the iron-responsive proteome of the chloroplastand mitochondria in Chlamydomonas (17) and a study of theheat-shock response in the total soluble proteome (33). Inboth studies, stable isotope labeling was used to examinechanges in the proteome via the relative quantification ofproteins. The iron deficiency study found that proteins in-volved in photosynthesis were reduced in abundance,whereas major respiratory proteins of the mitochondria eitherdid not change or were increased (17), but proteins outsidethe chloroplast and mitochondria were not examined. In theheat-shock study, over 1,100 proteins were quantified fromthe total soluble lysate, allowing for a more global look at theChlamydomonas proteome (33).
In the present contribution, we employed a label-free, ab-solute quantitative proteomics technique termed MSE on theChlamydomonas soluble proteome (post-ribosomal superna-tant) to further advance our understanding of the effects ofmicronutrient deficiency. The MSE data-independent scan-ning mode allows for parallel collection of precursor andproduct ion data measured by oscillating between high andlow energies in the collision cell of a tandem mass spectrom-eter (34–37). The absolute quantification of proteins, as de-
The Proteome of Micronutrient Deficiency in Chlamydomonas reinhardtii
66 Molecular & Cellular Proteomics 12.1
scribed by Silva and coworkers, is accomplished with MSE
data by utilizing a universal response factor (34). To ourknowledge, this work represents the first absolute quantitativeexamination of the soluble subproteome of Chlamydomonas.This study allows a quantitative comparison of a large pro-teomic dataset to a recently published transcriptome (13),thus providing a means to assess the degree of correlationbetween RNA and proteins in Chlamydomonas. This studyalso allows the examination of multiple metal-dependent pro-teomes, which provides a better understanding of the inter-relationship between various metal metabolisms.
EXPERIMENTAL PROCEDURES
Strains and Cultures—Chlamydomonas reinhardtii strain 2137 wasgrown in Tris acetate-phosphate (TAP) medium at 24 °C with shaking(180 rpm) and under continuous light (�50 to 100 �mol/m2/s, 2:1,cool white:warm white light). For copper deficiency studies, a traceelement solution was prepared as described by Quinn and Merchant(38). Trace element solutions for the manganese nutrition experimentswere made as described by Allen et al., except that we also examinedan intermediate nutritional condition with 0.05 �M MnCl2 present (20).Iron-limited (0.25 �M FeSO4), -deficient (1 �M FeSO4), and -replete (20�M FeSO4) media were prepared as described by Moseley et al. (18).For zinc deficiency studies, a revised trace element solution was usedcontaining 25 mM EDTA-Na2, 28.5 �M (NH4)6Mo7O24, 0.1 mM
Na2SeO3, 2.5 mM ZnSO4 in 2.75 mM EDTA, 6 mM MnCl2 in 6 mM
EDTA, 20 mM FeCl3 in 22 mM EDTA, and 2 mM CuCl2 with zinc in EDTAwithheld in zinc-deficient medium (8). For each experiment, cells werecollected at a density of �3 � 106 to 6 � 106 cell ml�1. For eachexperimental condition, biological triplicates were grown in separateflasks to account for biological variation among cultures.
Sample Preparation and MSE Analysis—MSE quantitative proteo-mics measurements were performed as previously described, withslight modifications (13). In brief, cells were broken via two freeze-thaw cycles at �80 °C. Insoluble material was removed after centri-fugation at 16,000 � g for 10 min at 4 °C followed by a secondcentrifugation at 253,000 � g for 20 min at 4 °C. For each sample,�30 �g of protein was separated via denaturing gel electrophoresis(4% to 12% NuPage Bis-Tris gels; Invitrogen) and visualized viaCoomassie blue staining (Bio-Rad). Each gel lane was divided into �3mm bands, and individual bands were subjected to in-gel trypsindigestion (sequencing grade modified trypsin; Promega, Madison,WI). Tryptic peptides were extracted into 50/50 water/acetonitrilesolution containing 2.5% (v/v) formic acid and lyophilized. Peptideswere then resuspended in a 1% formic acid solution containing 25fmol/�l bovine serum albumin (BSA) trypsin digestion standard(MassPREP BSA Digestion Standard; Waters Corporation, Milford,MA).
The peptides were analyzed as described elsewhere (13) using anultra-performance liquid chromatography (UPLC) system (WatersnanoAcquity UltraPerformance UPLC) coupled to a Waters Xevo qua-drupole time-of-flight mass spectrometer. Peptides were separatedvia UPLC with a 5 �m Symmetry C18 180 �m � 20 mm reversed-phase trap column in-line with a 1.7 �m BEH130, 75 �m � 100 mmreversed-phase C18 analytical column. Peptides were eluted using a60 min 3% acetonitrile/0.1% formic acid to 40% acetonitrile/0.1%formic acid gradient at a flow rate of 0.3 �l/min to the electrosprayionization (ESI) mass spectrometer. [Glu1]-Fibrinopeptide B was usedas a mass calibration standard (100 fmol/�l) and was infused via aseparate ESI sprayer, and the standard peptide was measured at 1min intervals during the LC-MS experiment. The LC-mass spectrom-eter was operated in the MSE data independent acquisition mode (34,
35, 37). The collision energy was continually switched between low (6eV) and elevated energy (ramped from 15 to 40 eV) during alternatingscans (m/z 50–2,000). The correlation of product ions to precursorions was achieved by using reconstructed retention times (i.e. align-ment of LC retention times of the precursors and products) andchromatographic peak shapes. To ensure adequate coverage of theproteome from each band, at least two 1 �l replicate injections fromeach gel band were analyzed via LC-MS.
Database Searches—Protein Lynx Global Server (PLGS version2.4; Waters) was used to process the LC-MS raw data and determineprotein identification and quantification. The quantification of proteinlevels was achieved via the addition of an internal protein standard(BSA trypsin digest standard) to which the data set was normalized(34, 35, 39).
The MS data were searched using the PLGS algorithm describedby Li and coworkers (40). Briefly, the calibrated mass spectra arecentroided, de-isotoped, and charge-state-reduced to yield amonoisotopic mass for each peptide and its tentatively associatedproduct ions. The direct correlation of a precursor ion and a potentialproduct ion is initially achieved through the alignment of drift times,followed by a further correlation process during the database search-ing that is based on the physicochemical characteristics of peptideswhen they undergo collisionally activated dissociation. Searches werelimited to trypsin proteolysis fragments, and peptide precursor andproduct ion mass tolerances were set to 20 ppm and 40 ppm,respectively. Other search parameters included the minimum numberof peptide matches (1), minimum number of product ions per peptide(2), minimum number of product ions per protein (2), maximum num-ber of missed tryptic cleavage sites (2), and maximum false positiverate for identification (4%) (40). Carbamidomethylation of cysteineresidues was set as a fixed modification, and methionine oxidation,asparagine and glutamine deamidation, and N-terminal acetylationwere set as variable modifications. Additional stringency was appliedto the data by requiring that a protein be detected in at least twodifferent conditions in order to be considered identified and be ob-served in two of three biological replicates in each condition in orderto be considered quantifiable. The average abundances of proteinsare thus based on two or three different measurements.
Three different Chlamydomonas gene model sets are presently inuse and are based on two different genome assemblies. For each ofthe two assemblies, there are multiple gene model predictions. Thecatalogue track contains the best gene model at each locus asdetermined by users or by automated annotation. Catalogue trackgene models from the version 3 genome assembly are called FM3.1models (14,723 entries), and catalogue track gene models from theversion 4 assembly are called the FM4 (16,837 entries) and Augustus10.2 (Au10.2) model sets (17,430 entries). The Au10.2 set representsa new set of gene models predicted by an algorithm separate fromthat used for deriving FM3.1 and FM4. MS data were searchedagainst each of the three Chlamydomonas protein databases modi-fied by the replacement of some catalogue models with individualuser-curated models and supplemented with sequences for keratin,trypsin, BSA, and chloroplast and mitochondrial proteins from theNational Center for Biotechnology Information. Quantification wasdetermined using up to the three most abundant shared peptides asdescribed by Silva et al. (34–36).
Identifications from FM3.1 and FM4 databases were converted toAu10.2 identifiers by mutual best blast hits using the Algal FunctionalAnnotation Tool (41). All quantifications reported were derived fromAu10.2 database searches, with one exception. Because Au10.2 andFM3 were based on different genome assemblies, it is possible thatproteins detected in FM3 searches do not exist in the Au10.2 data-base. Thus, identifications unique to FM3 (vide infra) were maintained
The Proteome of Micronutrient Deficiency in Chlamydomonas reinhardtii
Molecular & Cellular Proteomics 12.1 67
in the dataset. All other proteins not identified in Au10.2 searcheswere not examined further.
Functional Analysis—Proteins were separated into subgroupsbased on whether they showed a statistically significant (p � 0.05 byStudent’s t test) increase or decrease of at least 2-fold in magnitudeof a protein in the metal deficiency condition. Proteins that weredetected in only one of the conditions could not be assigned statis-tical significance and were included in the analysis only if their abun-dances were over 20 zmol/cell. In the case of manganese and irondeficiency studies, we focused on differences observed between themetal-replete condition and the metal-limited (0 �M Mn and 0.25 �M
Fe) conditions. Protein lists were analyzed using the “Enriched On-tology Terms” function of the Algal Functional Annotation Tool (41).Proteins that could not be clustered using this function were manuallyinvestigated and grouped based on their Au10.2 annotations.
Functional categories were based on those utilized by Karpowicz etal., with slight modifications (42). The “pigments” category was ex-panded to include other co-factor metabolism components such asfolate, quinone, tocopherol, iron–sulfur centers, thiamin, and molyb-denum co-factor. This new grouping was renamed “secondary me-tabolites and co-factors.” It should be noted, however, that the “sec-ondary metabolites and co-factors” do not include proteins that bindor utilize co-factors; rather, they are proteins involved in the degra-dation, synthesis, or insertion of co-factors. All other categories re-mained with similar classification rationale applied. “Protein metabo-lism” included any enzyme involved in protein or amino acidsynthesis, degradation, or modification. “Nucleic acid metabolism”referred to any protein involved in nucleotide synthesis/degradation,DNA or RNA binding, and transcriptional regulators. “Photosynthesis”was related to proteins involved in the photosynthetic apparatus andthe carbon-concentrating mechanism. “Transport” included anytransport proteins, channels, or assimilation factors that interact di-rectly with transporters. “Redox” proteins are involved in electrontransfer (not including photosynthetic proteins) and other reduction/oxidation reactions. “Signaling” included kinases, sensory proteins,and factors involved in signal transduction. The “lipid metabolism”category included proteins involved in fatty acid, membrane, andstorage lipid synthesis, degradation, and membrane trafficking. “Car-bohydrate metabolism” included proteins related to sugar or starchsynthesis and/or degradation including glycolysis/gluconeogenesis.“Cell cycle” referred to proteins that are involved in cell developmentand cell division. “Other” proteins were those with functions notrelated to the categories described here. “Unknown” included pro-teins with no known function.
Protein Expression and Purification and Antibody Production—TheCGL78/YCF54 expression construct was generated using nestedPCR and the Gateway recombinational cloning system (Invitrogen,Carlsbad, CA) as described elsewhere (43). The segment of A. thali-ana CGL78 (At5g58250) encoding amino acids S73–V211 was ampli-fied from the cDNA clone U63260 (ABRC) using Phusion polymerase(New England Biolabs, Ipswich, MA). The forward primer(CGL78.S73.For.) added a 5� extension encoding a tobacco etchvirus (TEV) protease cleavage site, and the reverse primer(CGL78.V211.Rev.) added a C-terminal hexahistidine tag followed bya stop codon. This initial PCR product was then amplified using asecond set of primers (PE-277 and PE-278) to introduce AttB1 andAttB2 recombination sites. The final PCR product was gel purified andrecombined into the donor vector pDONR201 and subsequently intothe expression vector pKM596 (43) to produce a His-tagged maltosebinding protein fusion. The expression construct was checked viaDNA sequencing (Genewiz, South Plainfield, NJ).
The expression plasmid was transformed into E. coli BL21-Gold(DE3) cells (Novagen, EMD Chemicals, Billerica, MA) harboringpRK603, an expression vector for the TEV protease. Cells were grown
at 37 °C in LB supplemented with ampicillin (100 �g/ml) and kana-mycin (30 �g/ml) to an OD600 of 1.0, at which point the temperaturewas shifted to 18 °C and protein expression was induced by theaddition of isopropyl 1-thio-�-D-galactopyranoside (IPTG) to a con-centration of 1 mM. Cells were left to grow overnight and wereharvested via centrifugation the following day. The cell pellet wasresuspended in lysis buffer (50 mM Tris/Cl pH 8.0, 300 mM NaCl, 10%glycerol, 20 mM imidazole) supplemented with protease inhibitor mix-ture (Sigma), 100 �M PMSF, DNase, lysozyme, and 10 mM �-mercap-toethanol and broken using a French press. The lysate was clarifiedvia centrifugation (35,000 � g, 30 min, 4 °C), and the supernatant wasincubated with nickel-nitrilotriacetic acid agarose beads (Qiagen, Va-lencia, CA) for 60 min at 4 °C. The beads were washed extensivelywith lysis buffer, and bound protein was eluted with 300 mM imidazolein lysis buffer. CGL78 was further purified via size exclusion chroma-tography using a HiLoad Superdex S-200 column (GE Healthcare)equilibrated with 50 mM Tris/Cl pH 8.0 containing 300 mM NaCl and10% glycerol. Peak fractions were analyzed via SDS-PAGE, andthose containing pure CGL78 were pooled and concentrated. Thepurified protein was used directly for antiserum production in rabbits(at Agrisera AB, Vannas, Sweden, and the antibodies are availablefrom the vendor).
A synthetic codon-optimized ZCP2 gene (Genscript, Piscataway,NJ) was cloned NdeI-XhoI in pET28b (Novagen) to allow expression ofZCP2 as a fusion protein with an N-terminal hexahistidine tag. Theexpression construct was checked via DNA sequencing (Genewiz).
The ZCP2 expression plasmid was transformed into E. coli BL21-Gold (DE3) cells (Novagen). Cells were grown at 37 °C in Terrific Brothsupplemented with kanamycin (30 �g/ml) and glucose (20 mM) to anOD600 of 1.0, at which point the temperature was shifted to 18 °C andprotein expression was induced by addition of IPTG to a concentra-tion of 1 mM. Cells were left to grow overnight and were harvested viacentrifugation the following day. The cell pellet was resuspended insupplemented lysis buffer (see above) and broken by means of son-ication. The crude lysate was clarified via centrifugation (35,000 � g,30 min, 4 °C), and the supernatant was loaded onto a HisTrap Ni2�
chelation affinity column (GE Healthcare) equilibrated with Buffer A(20 mM Tris/Cl pH 8.0, 1 M NaCl, 10% glycerol, 10 mM imidazole). Thecolumn was washed extensively with Buffer A, and the target proteinwas eluted with a linear gradient of imidazole (10–300 mM) in thisbuffer. The eluted protein was concentrated and purified further viasize exclusion chromatography using a HiLoad Superdex S-200 col-umn (GE Healthcare) equilibrated with 20 mM Tris/Cl pH 8.0 contain-ing 1 M NaCl and 10% glycerol. The fractions containing ZCP2 stillcontained numerous impurities as determined via SDS-PAGE, soselected fractions were pooled, dialyzed against 20 mM Tris/Cl pH 8.0containing 100 mM NaCl and 10% glycerol (Buffer C), and loaded ona Q-Sepharose column (GE Healthcare) equilibrated with this buffer.Bound proteins were eluted with a linear gradient of NaCl (0.1–0.5 M)in Buffer C. Fractions were analyzed via SDS-PAGE, and those con-taining pure ZCP2 were pooled and concentrated. The purified pro-tein was used directly for antiserum production in rabbits (serviceprovided by Covance Inc., Denver, PA).
Immunoblot Analysis—Immunoblot analysis for Cgl78/Ycf54, co-progen oxidase, ferredoxin, and plastocyanin was performed as de-scribed elsewhere (11); for Cgl78/Ycf54, SDS was omitted from thetransfer buffer, and the transfer time was reduced to 45 min. Primaryantibodies were used at the following dilutions: anti-Cgl78/Ycf54(1:1,000), anti-coprogen oxidase (1:1,000) (44), anti-ferredoxin (1:1,000), and anti-plastocyanin (1:1,000). Plastocyanin was also immu-nodetected via chemiluminescence as described elsewhere (15) us-ing primary antibody at a 1:1,000 dilution in blocking buffer.
Transmembrane Domain Prediction—A hidden Markov modelbased algorithm, TMHMM, was used to predict the presence of
The Proteome of Micronutrient Deficiency in Chlamydomonas reinhardtii
68 Molecular & Cellular Proteomics 12.1
transmembrane domains in the Chlamydomonas proteome (45). Thealgorithm was accessed via the Web site of the Center for BiologicalSequence Analysis.
RESULTS
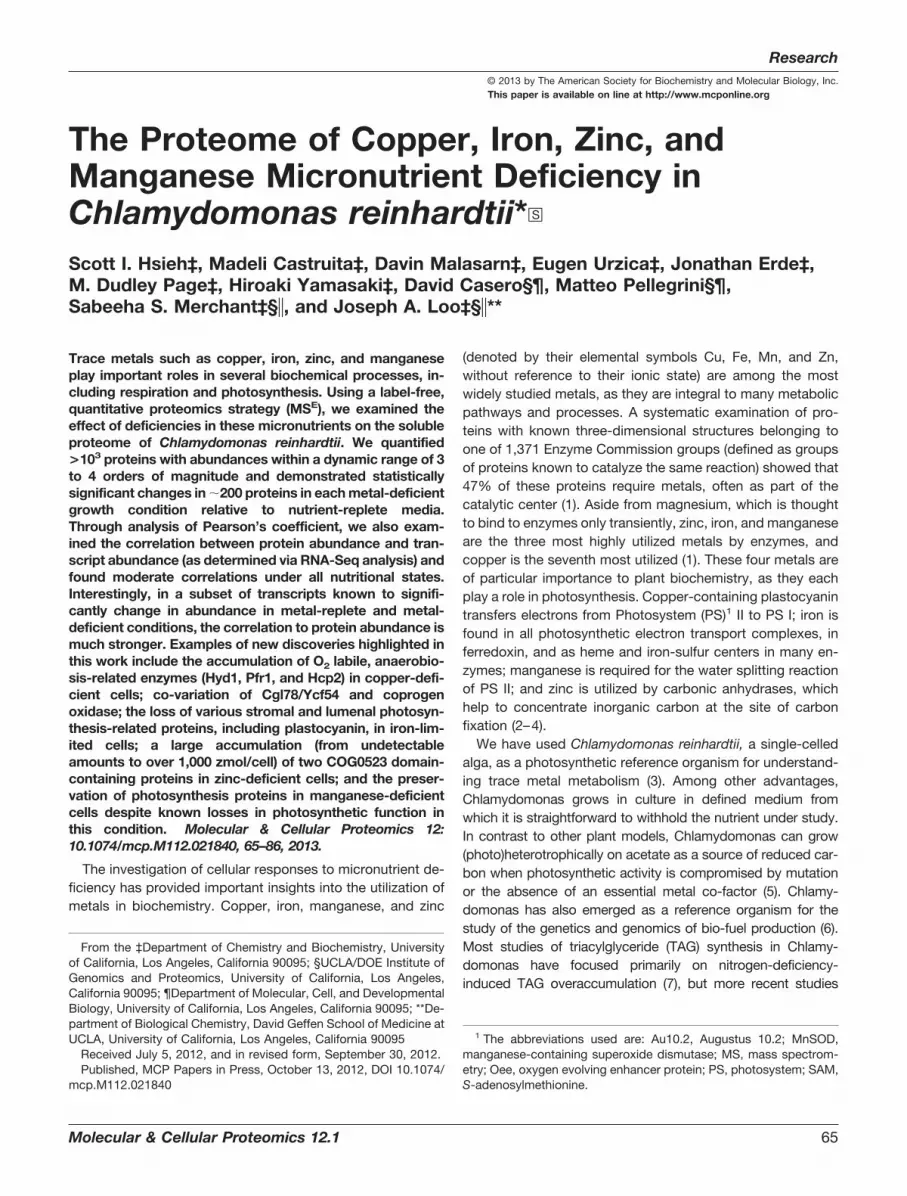
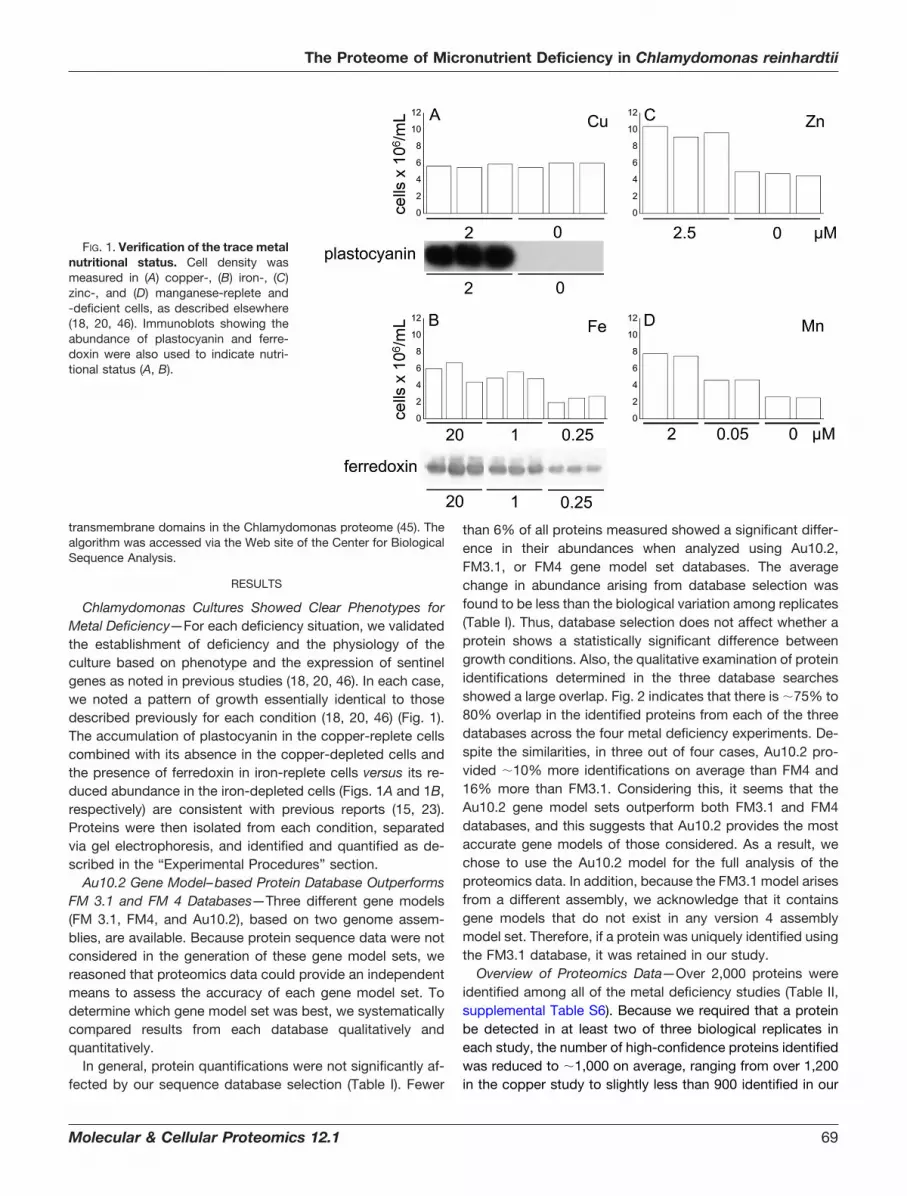
Chlamydomonas Cultures Showed Clear Phenotypes forMetal Deficiency—For each deficiency situation, we validatedthe establishment of deficiency and the physiology of theculture based on phenotype and the expression of sentinelgenes as noted in previous studies (18, 20, 46). In each case,we noted a pattern of growth essentially identical to thosedescribed previously for each condition (18, 20, 46) (Fig. 1).The accumulation of plastocyanin in the copper-replete cellscombined with its absence in the copper-depleted cells andthe presence of ferredoxin in iron-replete cells versus its re-duced abundance in the iron-depleted cells (Figs. 1A and 1B,respectively) are consistent with previous reports (15, 23).Proteins were then isolated from each condition, separatedvia gel electrophoresis, and identified and quantified as de-scribed in the “Experimental Procedures” section.
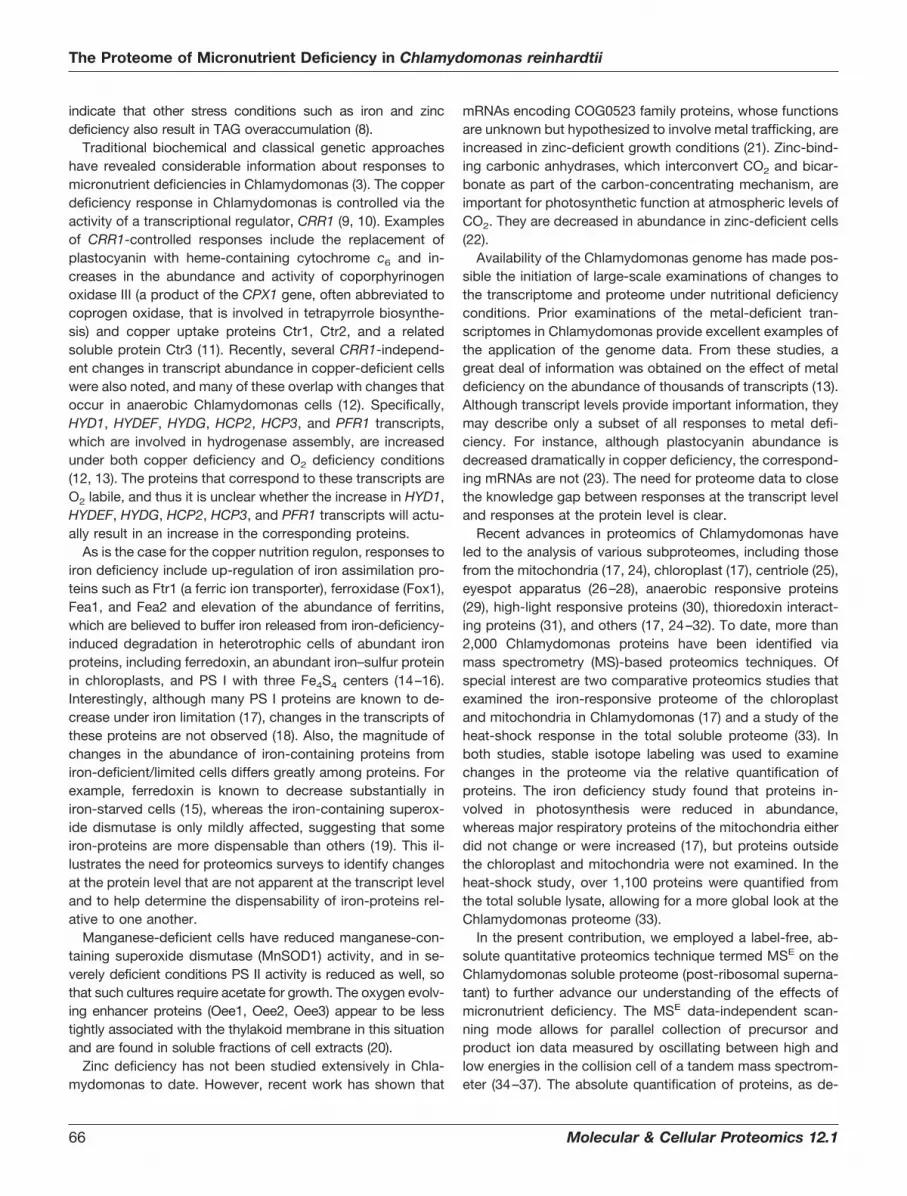
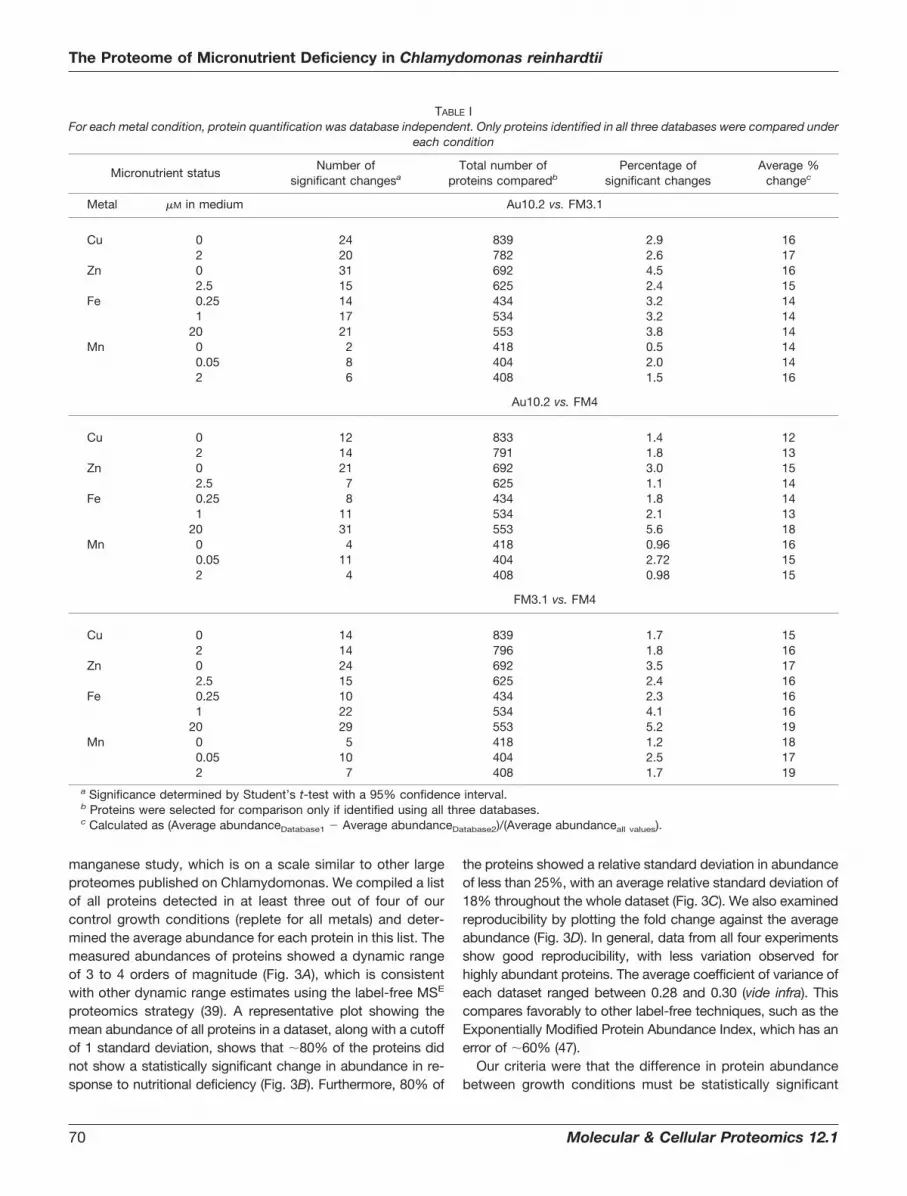
Au10.2 Gene Model–based Protein Database OutperformsFM 3.1 and FM 4 Databases—Three different gene models(FM 3.1, FM4, and Au10.2), based on two genome assem-blies, are available. Because protein sequence data were notconsidered in the generation of these gene model sets, wereasoned that proteomics data could provide an independentmeans to assess the accuracy of each gene model set. Todetermine which gene model set was best, we systematicallycompared results from each database qualitatively andquantitatively.
In general, protein quantifications were not significantly af-fected by our sequence database selection (Table I). Fewer
than 6% of all proteins measured showed a significant differ-ence in their abundances when analyzed using Au10.2,FM3.1, or FM4 gene model set databases. The averagechange in abundance arising from database selection wasfound to be less than the biological variation among replicates(Table I). Thus, database selection does not affect whether aprotein shows a statistically significant difference betweengrowth conditions. Also, the qualitative examination of proteinidentifications determined in the three database searchesshowed a large overlap. Fig. 2 indicates that there is �75% to80% overlap in the identified proteins from each of the threedatabases across the four metal deficiency experiments. De-spite the similarities, in three out of four cases, Au10.2 pro-vided �10% more identifications on average than FM4 and16% more than FM3.1. Considering this, it seems that theAu10.2 gene model sets outperform both FM3.1 and FM4databases, and this suggests that Au10.2 provides the mostaccurate gene models of those considered. As a result, wechose to use the Au10.2 model for the full analysis of theproteomics data. In addition, because the FM3.1 model arisesfrom a different assembly, we acknowledge that it containsgene models that do not exist in any version 4 assemblymodel set. Therefore, if a protein was uniquely identified usingthe FM3.1 database, it was retained in our study.
Overview of Proteomics Data—Over 2,000 proteins wereidentified among all of the metal deficiency studies (Table II,supplemental Table S6). Because we required that a proteinbe detected in at least two of three biological replicates ineach study, the number of high-confidence proteins identifiedwas reduced to �1,000 on average, ranging from over 1,200in the copper study to slightly less than 900 identified in our
FIG. 1. Verification of the trace metalnutritional status. Cell density wasmeasured in (A) copper-, (B) iron-, (C)zinc-, and (D) manganese-replete and-deficient cells, as described elsewhere(18, 20, 46). Immunoblots showing theabundance of plastocyanin and ferre-doxin were also used to indicate nutri-tional status (A, B).
The Proteome of Micronutrient Deficiency in Chlamydomonas reinhardtii
Molecular & Cellular Proteomics 12.1 69
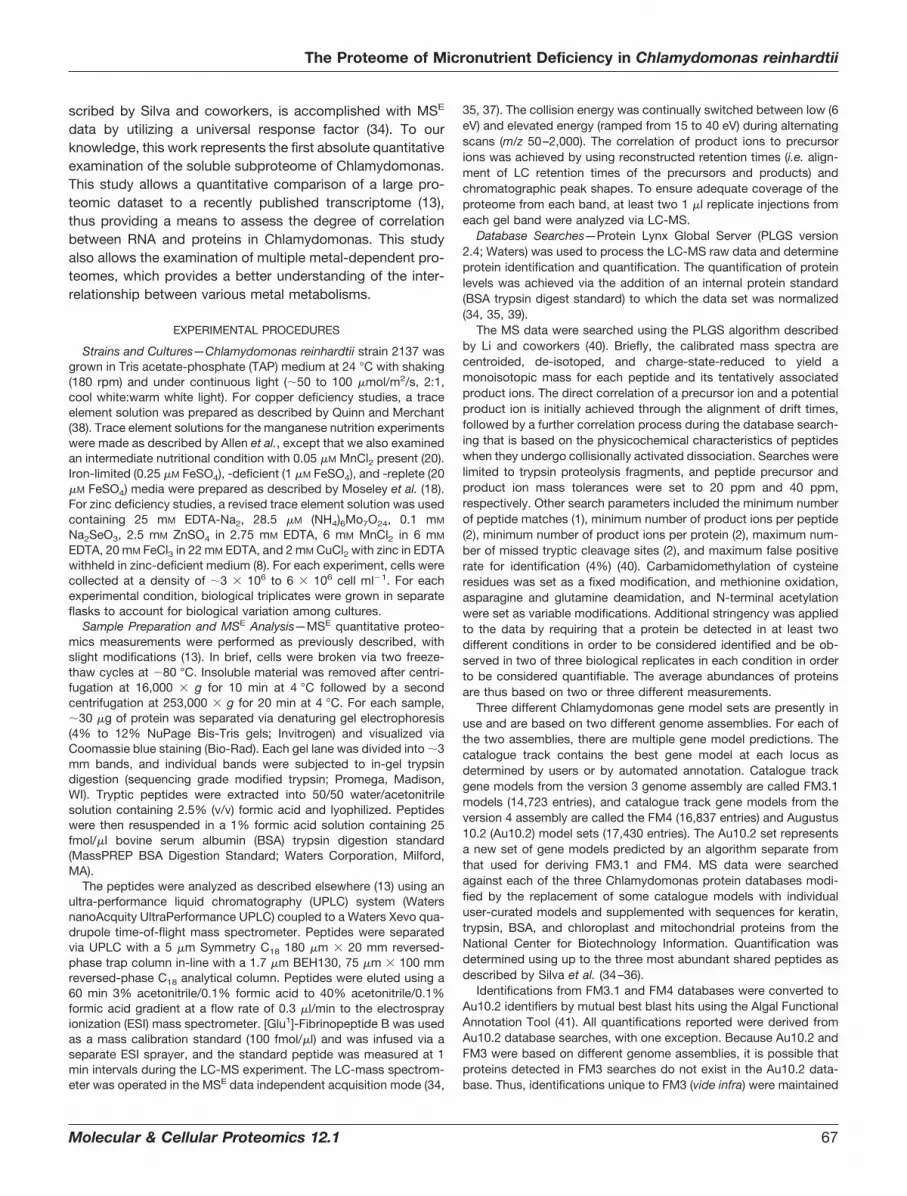
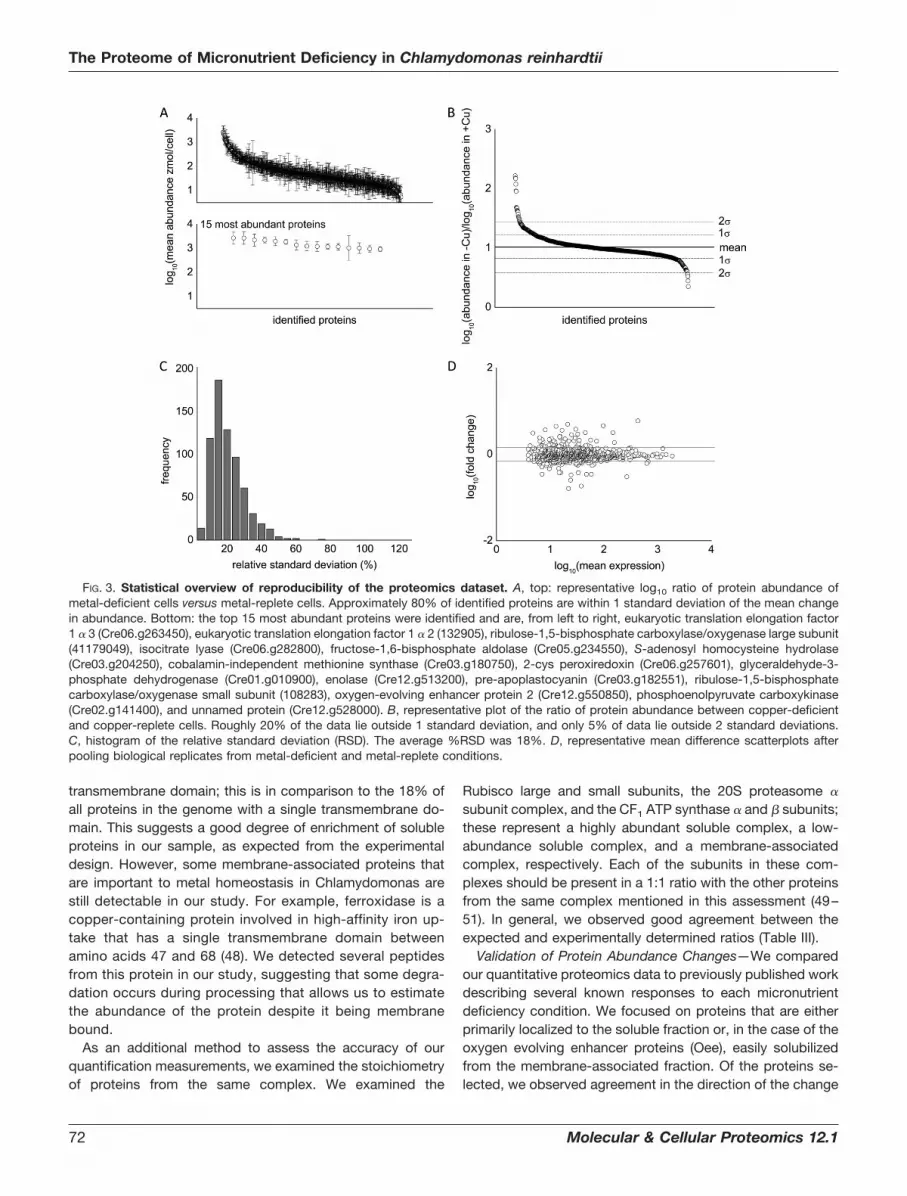
manganese study, which is on a scale similar to other largeproteomes published on Chlamydomonas. We compiled a listof all proteins detected in at least three out of four of ourcontrol growth conditions (replete for all metals) and deter-mined the average abundance for each protein in this list. Themeasured abundances of proteins showed a dynamic rangeof 3 to 4 orders of magnitude (Fig. 3A), which is consistentwith other dynamic range estimates using the label-free MSE
proteomics strategy (39). A representative plot showing themean abundance of all proteins in a dataset, along with a cutoffof 1 standard deviation, shows that �80% of the proteins didnot show a statistically significant change in abundance in re-sponse to nutritional deficiency (Fig. 3B). Furthermore, 80% of
the proteins showed a relative standard deviation in abundanceof less than 25%, with an average relative standard deviation of18% throughout the whole dataset (Fig. 3C). We also examinedreproducibility by plotting the fold change against the averageabundance (Fig. 3D). In general, data from all four experimentsshow good reproducibility, with less variation observed forhighly abundant proteins. The average coefficient of variance ofeach dataset ranged between 0.28 and 0.30 (vide infra). Thiscompares favorably to other label-free techniques, such as theExponentially Modified Protein Abundance Index, which has anerror of �60% (47).
Our criteria were that the difference in protein abundancebetween growth conditions must be statistically significant
TABLE IFor each metal condition, protein quantification was database independent. Only proteins identified in all three databases were compared under
each condition
Micronutrient statusNumber of
significant changesaTotal number of
proteins comparedbPercentage of
significant changesAverage %
changec
Metal �M in medium Au10.2 vs. FM3.1
Cu 0 24 839 2.9 162 20 782 2.6 17
Zn 0 31 692 4.5 162.5 15 625 2.4 15
Fe 0.25 14 434 3.2 141 17 534 3.2 14
20 21 553 3.8 14Mn 0 2 418 0.5 14
0.05 8 404 2.0 142 6 408 1.5 16
Au10.2 vs. FM4
Cu 0 12 833 1.4 122 14 791 1.8 13
Zn 0 21 692 3.0 152.5 7 625 1.1 14
Fe 0.25 8 434 1.8 141 11 534 2.1 13
20 31 553 5.6 18Mn 0 4 418 0.96 16
0.05 11 404 2.72 152 4 408 0.98 15
FM3.1 vs. FM4
Cu 0 14 839 1.7 152 14 796 1.8 16
Zn 0 24 692 3.5 172.5 15 625 2.4 16
Fe 0.25 10 434 2.3 161 22 534 4.1 16
20 29 553 5.2 19Mn 0 5 418 1.2 18
0.05 10 404 2.5 172 7 408 1.7 19
a Significance determined by Student’s t-test with a 95% confidence interval.b Proteins were selected for comparison only if identified using all three databases.c Calculated as (Average abundanceDatabase1 � Average abundanceDatabase2)/(Average abundanceall values).
The Proteome of Micronutrient Deficiency in Chlamydomonas reinhardtii
70 Molecular & Cellular Proteomics 12.1
(p � 0.05 by Student’s t test) and at least 2-fold or greater inmagnitude in order to define a change in protein abundance.It should be noted that we maintained some proteins in ouranalysis that did not show a 2-fold change. This was doneonly if the change in protein abundance was statistically sig-nificant and if changes to the abundance of the protein inquestion helped to provide additional insight into the effect ofthe metal deficiency on a pathway. Instances in which thiswas done are clearly indicated in supplemental Tables S1–S4.
Additionally, proteins that were detected in only one of theconditions could not be assigned statistical significance andtherefore were included in the analysis only if their abun-dances were over 20 zmol/cell. We also included some pro-teins previously examined as part of a copper deficiencytranscriptome study (13) in our analysis for completeness.
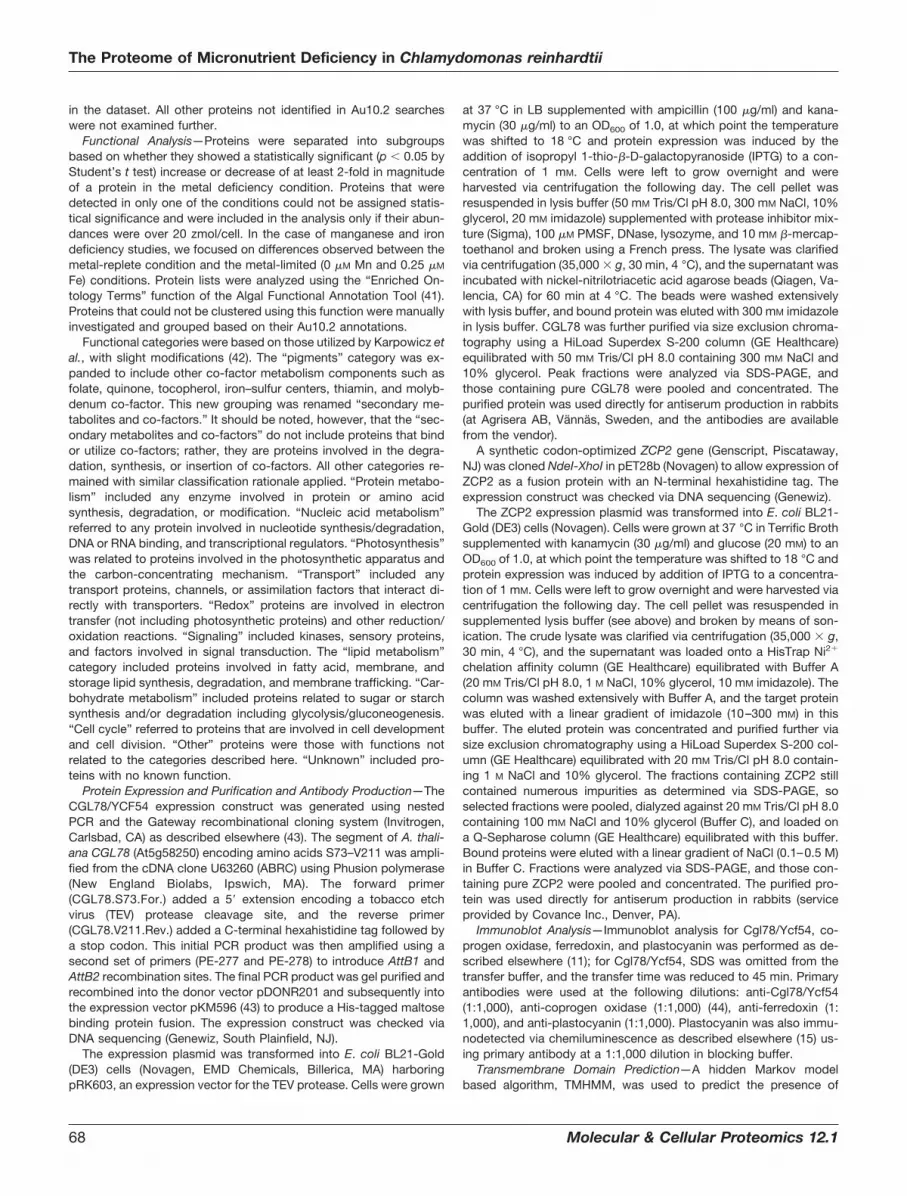
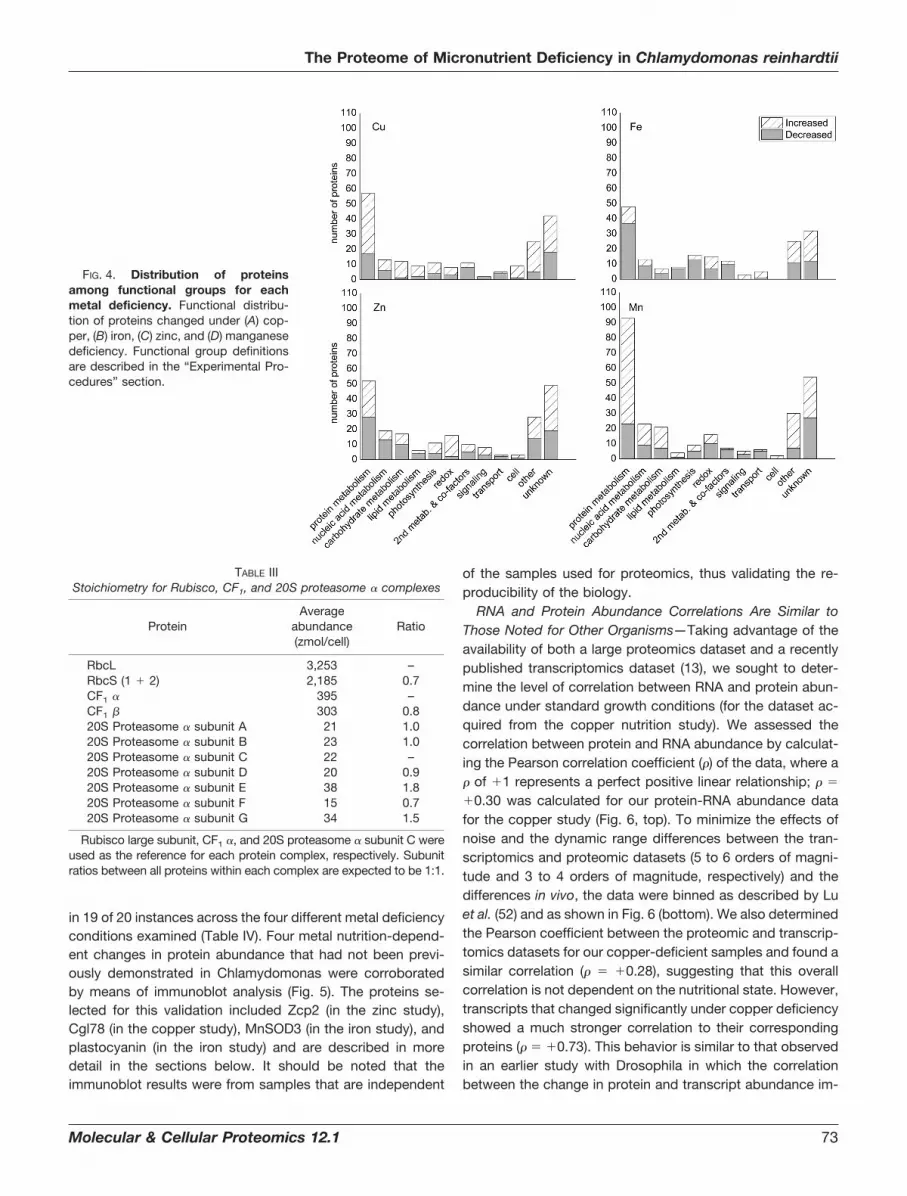
Based on these criteria, we identified 204 proteins thatchanged in abundance under copper deficiency, 184 in ironlimitation, 222 in zinc deficiency, and 270 in manganese limi-tation, suggesting that only 20% of proteins analyzedchanged in our deficiency studies. The proteins that changedunder each condition were distributed among several func-tional categories, with the “protein metabolism” and “un-known” categories being the most well represented (Fig. 4).We estimated our false discovery rate by randomly permutingthe data 1,000 times and comparing the number of changesobserved in the permutated runs to the number of changes inthe real experiment. Using this method, we estimated a 20%false discovery rate in determining when a change in abun-dance occurred for our data.
Using TMHMM, we examined the prevalence of transmem-brane domains in our proteomics dataset. The TMHMMmethod, when tested on a set of 645 proteins with knownthree-dimensional structures, was able to accurately discrim-inate between soluble and membrane proteins with an accu-racy of 99% (45). In our dataset, between 5% and 6% of allproteins in each study were found to contain at least a single
FIG. 2. FM3.1, FM4, and Au10.2 da-tabase searches identify many of thesame proteins. Venn diagrams showingthe overlap among identifications forproteins that were detected in two ofthree biological replicates from each da-tabase search for each metal deficiency:A, copper; B, iron; C, zinc; and D, man-ganese. Please see panel A for labelingof the different databases.
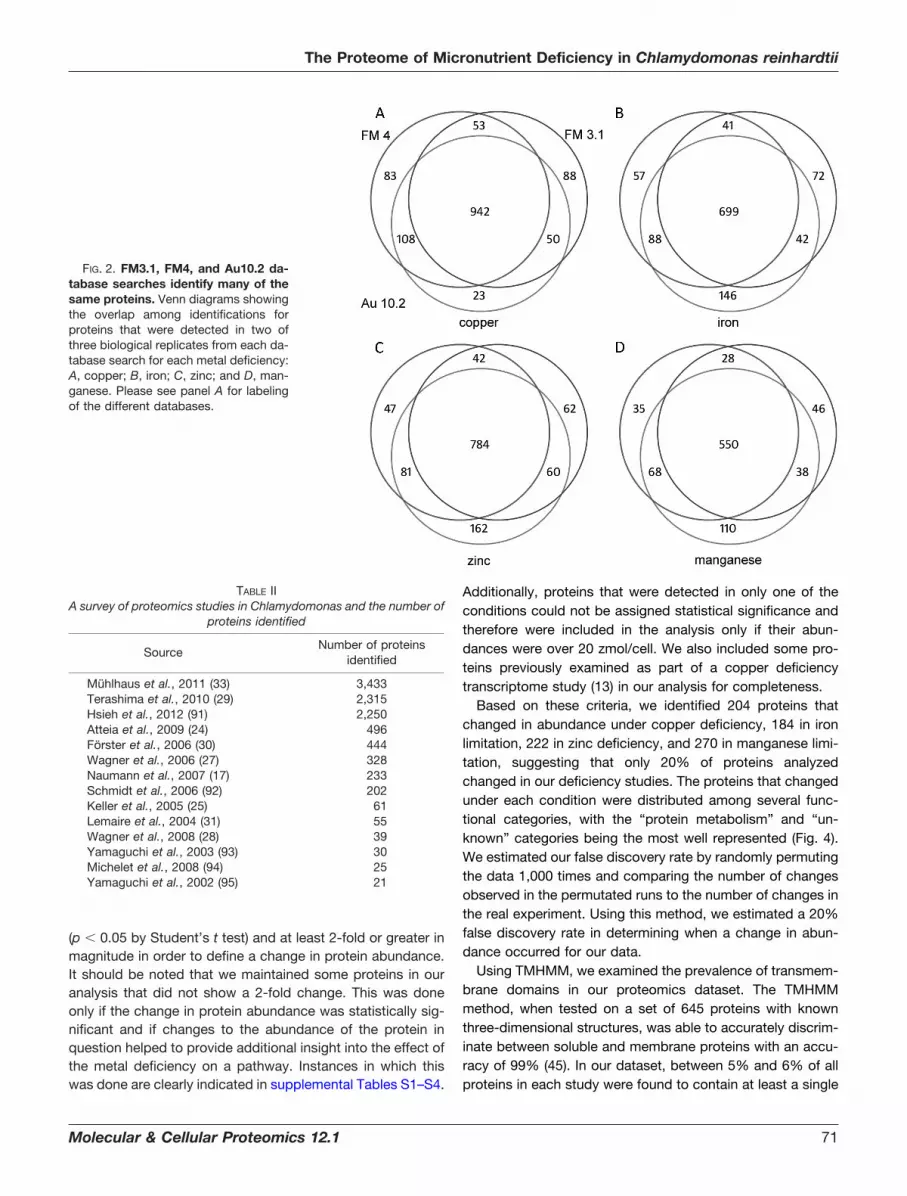
TABLE IIA survey of proteomics studies in Chlamydomonas and the number of
proteins identified
SourceNumber of proteins
identified
Mühlhaus et al., 2011 (33) 3,433Terashima et al., 2010 (29) 2,315Hsieh et al., 2012 (91) 2,250Atteia et al., 2009 (24) 496Förster et al., 2006 (30) 444Wagner et al., 2006 (27) 328Naumann et al., 2007 (17) 233Schmidt et al., 2006 (92) 202Keller et al., 2005 (25) 61Lemaire et al., 2004 (31) 55Wagner et al., 2008 (28) 39Yamaguchi et al., 2003 (93) 30Michelet et al., 2008 (94) 25Yamaguchi et al., 2002 (95) 21
The Proteome of Micronutrient Deficiency in Chlamydomonas reinhardtii
Molecular & Cellular Proteomics 12.1 71
transmembrane domain; this is in comparison to the 18% ofall proteins in the genome with a single transmembrane do-main. This suggests a good degree of enrichment of solubleproteins in our sample, as expected from the experimentaldesign. However, some membrane-associated proteins thatare important to metal homeostasis in Chlamydomonas arestill detectable in our study. For example, ferroxidase is acopper-containing protein involved in high-affinity iron up-take that has a single transmembrane domain betweenamino acids 47 and 68 (48). We detected several peptidesfrom this protein in our study, suggesting that some degra-dation occurs during processing that allows us to estimatethe abundance of the protein despite it being membranebound.
As an additional method to assess the accuracy of ourquantification measurements, we examined the stoichiometryof proteins from the same complex. We examined the
Rubisco large and small subunits, the 20S proteasome �
subunit complex, and the CF1 ATP synthase � and � subunits;these represent a highly abundant soluble complex, a low-abundance soluble complex, and a membrane-associatedcomplex, respectively. Each of the subunits in these com-plexes should be present in a 1:1 ratio with the other proteinsfrom the same complex mentioned in this assessment (49–51). In general, we observed good agreement between theexpected and experimentally determined ratios (Table III).
Validation of Protein Abundance Changes—We comparedour quantitative proteomics data to previously published workdescribing several known responses to each micronutrientdeficiency condition. We focused on proteins that are eitherprimarily localized to the soluble fraction or, in the case of theoxygen evolving enhancer proteins (Oee), easily solubilizedfrom the membrane-associated fraction. Of the proteins se-lected, we observed agreement in the direction of the change
FIG. 3. Statistical overview of reproducibility of the proteomics dataset. A, top: representative log10 ratio of protein abundance ofmetal-deficient cells versus metal-replete cells. Approximately 80% of identified proteins are within 1 standard deviation of the mean changein abundance. Bottom: the top 15 most abundant proteins were identified and are, from left to right, eukaryotic translation elongation factor1 � 3 (Cre06.g263450), eukaryotic translation elongation factor 1 � 2 (132905), ribulose-1,5-bisphosphate carboxylase/oxygenase large subunit(41179049), isocitrate lyase (Cre06.g282800), fructose-1,6-bisphosphate aldolase (Cre05.g234550), S-adenosyl homocysteine hydrolase(Cre03.g204250), cobalamin-independent methionine synthase (Cre03.g180750), 2-cys peroxiredoxin (Cre06.g257601), glyceraldehyde-3-phosphate dehydrogenase (Cre01.g010900), enolase (Cre12.g513200), pre-apoplastocyanin (Cre03.g182551), ribulose-1,5-bisphosphatecarboxylase/oxygenase small subunit (108283), oxygen-evolving enhancer protein 2 (Cre12.g550850), phosphoenolpyruvate carboxykinase(Cre02.g141400), and unnamed protein (Cre12.g528000). B, representative plot of the ratio of protein abundance between copper-deficientand copper-replete cells. Roughly 20% of the data lie outside 1 standard deviation, and only 5% of data lie outside 2 standard deviations.C, histogram of the relative standard deviation (RSD). The average %RSD was 18%. D, representative mean difference scatterplots afterpooling biological replicates from metal-deficient and metal-replete conditions.
The Proteome of Micronutrient Deficiency in Chlamydomonas reinhardtii
72 Molecular & Cellular Proteomics 12.1
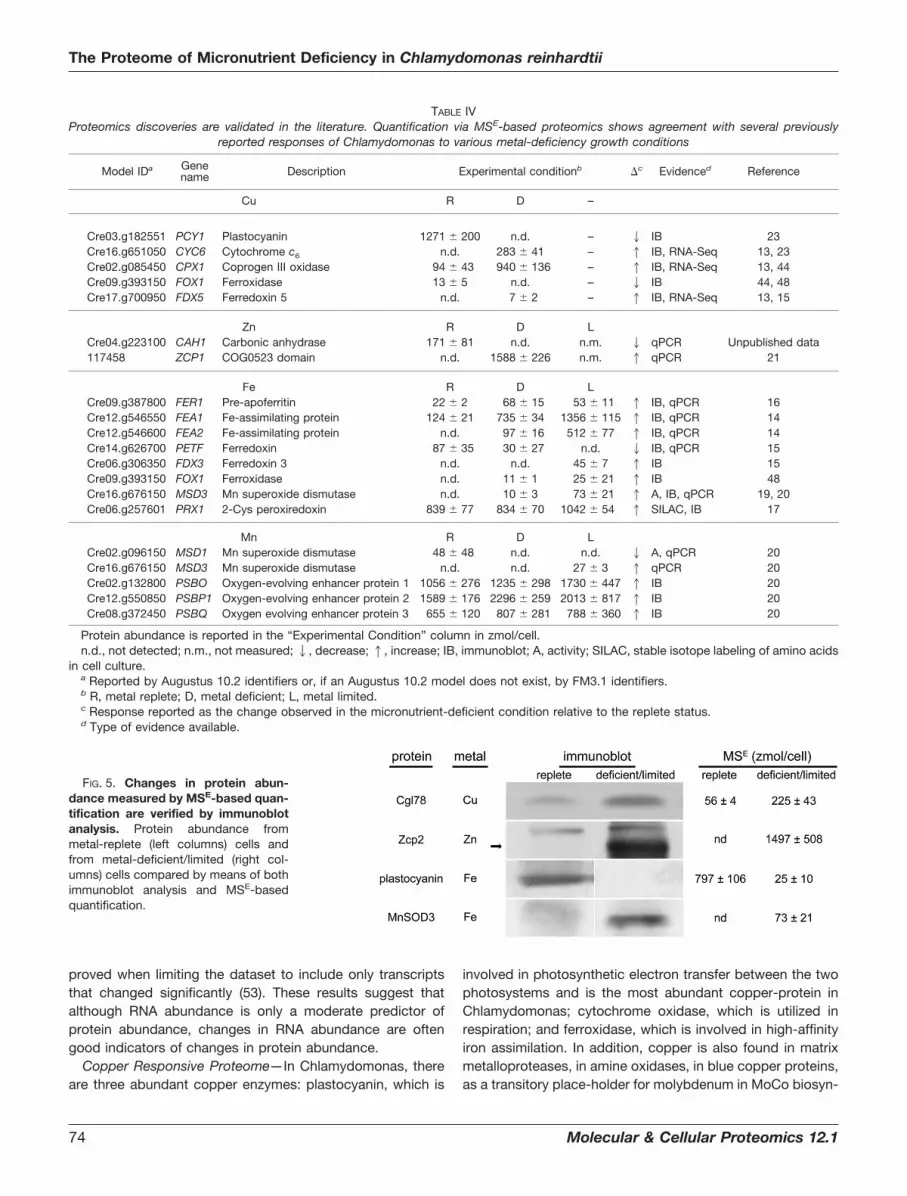
in 19 of 20 instances across the four different metal deficiencyconditions examined (Table IV). Four metal nutrition-depend-ent changes in protein abundance that had not been previ-ously demonstrated in Chlamydomonas were corroboratedby means of immunoblot analysis (Fig. 5). The proteins se-lected for this validation included Zcp2 (in the zinc study),Cgl78 (in the copper study), MnSOD3 (in the iron study), andplastocyanin (in the iron study) and are described in moredetail in the sections below. It should be noted that theimmunoblot results were from samples that are independent
of the samples used for proteomics, thus validating the re-producibility of the biology.
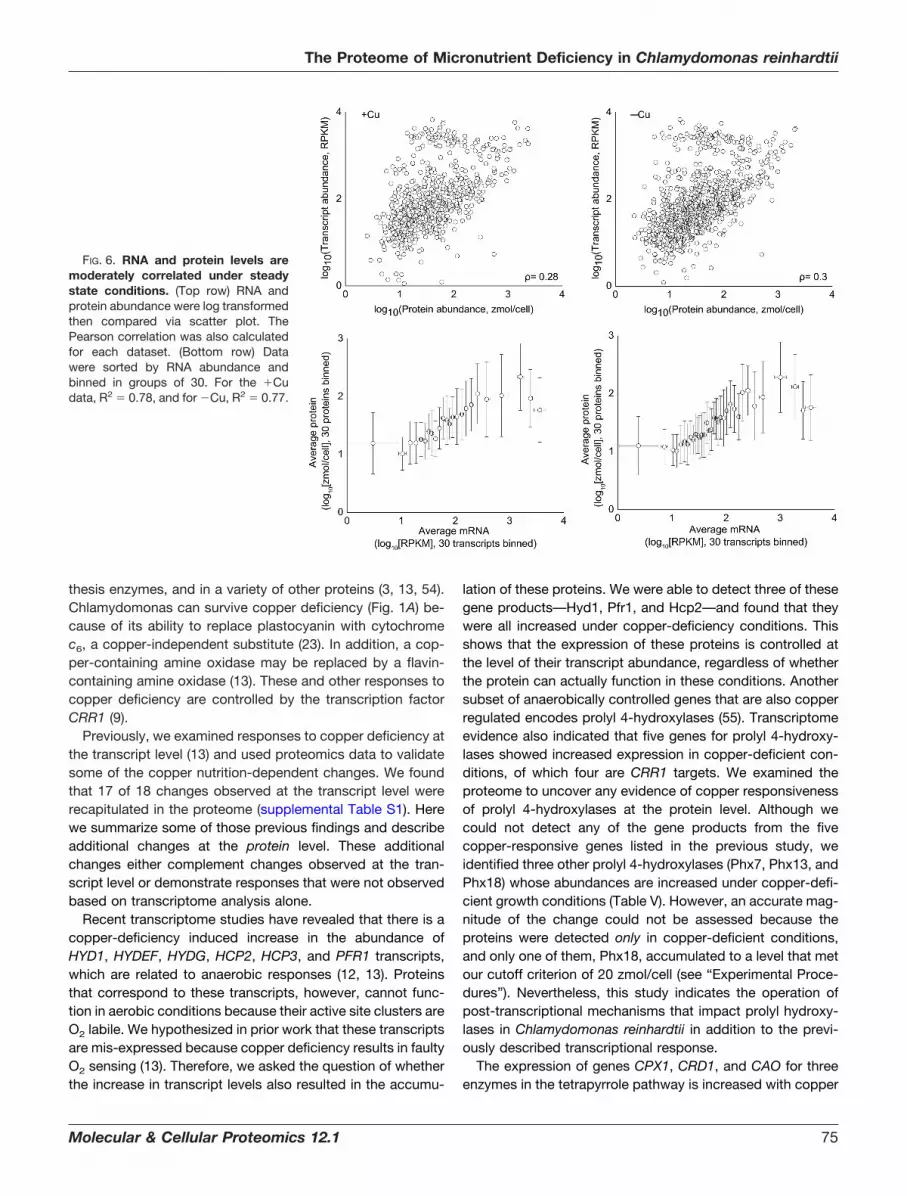
RNA and Protein Abundance Correlations Are Similar toThose Noted for Other Organisms—Taking advantage of theavailability of both a large proteomics dataset and a recentlypublished transcriptomics dataset (13), we sought to deter-mine the level of correlation between RNA and protein abun-dance under standard growth conditions (for the dataset ac-quired from the copper nutrition study). We assessed thecorrelation between protein and RNA abundance by calculat-ing the Pearson correlation coefficient (�) of the data, where a� of �1 represents a perfect positive linear relationship; � �
�0.30 was calculated for our protein-RNA abundance datafor the copper study (Fig. 6, top). To minimize the effects ofnoise and the dynamic range differences between the tran-scriptomics and proteomic datasets (5 to 6 orders of magni-tude and 3 to 4 orders of magnitude, respectively) and thedifferences in vivo, the data were binned as described by Luet al. (52) and as shown in Fig. 6 (bottom). We also determinedthe Pearson coefficient between the proteomic and transcrip-tomics datasets for our copper-deficient samples and found asimilar correlation (� � �0.28), suggesting that this overallcorrelation is not dependent on the nutritional state. However,transcripts that changed significantly under copper deficiencyshowed a much stronger correlation to their correspondingproteins (� � �0.73). This behavior is similar to that observedin an earlier study with Drosophila in which the correlationbetween the change in protein and transcript abundance im-
FIG. 4. Distribution of proteinsamong functional groups for eachmetal deficiency. Functional distribu-tion of proteins changed under (A) cop-per, (B) iron, (C) zinc, and (D) manganesedeficiency. Functional group definitionsare described in the “Experimental Pro-cedures” section.
TABLE IIIStoichiometry for Rubisco, CF1, and 20S proteasome � complexes
ProteinAverage
abundance(zmol/cell)
Ratio
RbcL 3,253 –RbcS (1 � 2) 2,185 0.7CF1 � 395 –CF1 � 303 0.820S Proteasome � subunit A 21 1.020S Proteasome � subunit B 23 1.020S Proteasome � subunit C 22 –20S Proteasome � subunit D 20 0.920S Proteasome � subunit E 38 1.820S Proteasome � subunit F 15 0.720S Proteasome � subunit G 34 1.5
Rubisco large subunit, CF1 �, and 20S proteasome � subunit C wereused as the reference for each protein complex, respectively. Subunitratios between all proteins within each complex are expected to be 1:1.
The Proteome of Micronutrient Deficiency in Chlamydomonas reinhardtii
Molecular & Cellular Proteomics 12.1 73
proved when limiting the dataset to include only transcriptsthat changed significantly (53). These results suggest thatalthough RNA abundance is only a moderate predictor ofprotein abundance, changes in RNA abundance are oftengood indicators of changes in protein abundance.
Copper Responsive Proteome—In Chlamydomonas, thereare three abundant copper enzymes: plastocyanin, which is
involved in photosynthetic electron transfer between the twophotosystems and is the most abundant copper-protein inChlamydomonas; cytochrome oxidase, which is utilized inrespiration; and ferroxidase, which is involved in high-affinityiron assimilation. In addition, copper is also found in matrixmetalloproteases, in amine oxidases, in blue copper proteins,as a transitory place-holder for molybdenum in MoCo biosyn-
TABLE IVProteomics discoveries are validated in the literature. Quantification via MSE-based proteomics shows agreement with several previously
reported responses of Chlamydomonas to various metal-deficiency growth conditions
Model IDa Genename Description Experimental conditionb �c Evidenced Reference
Cu R D –
Cre03.g182551 PCY1 Plastocyanin 1271 200 n.d. – 2 IB 23Cre16.g651050 CYC6 Cytochrome c6 n.d. 283 41 – 1 IB, RNA-Seq 13, 23Cre02.g085450 CPX1 Coprogen III oxidase 94 43 940 136 – 1 IB, RNA-Seq 13, 44Cre09.g393150 FOX1 Ferroxidase 13 5 n.d. – 2 IB 44, 48Cre17.g700950 FDX5 Ferredoxin 5 n.d. 7 2 – 1 IB, RNA-Seq 13, 15
Zn R D LCre04.g223100 CAH1 Carbonic anhydrase 171 81 n.d. n.m. 2 qPCR Unpublished data117458 ZCP1 COG0523 domain n.d. 1588 226 n.m. 1 qPCR 21
Fe R D LCre09.g387800 FER1 Pre-apoferritin 22 2 68 15 53 11 1 IB, qPCR 16Cre12.g546550 FEA1 Fe-assimilating protein 124 21 735 34 1356 115 1 IB, qPCR 14Cre12.g546600 FEA2 Fe-assimilating protein n.d. 97 16 512 77 1 IB, qPCR 14Cre14.g626700 PETF Ferredoxin 87 35 30 27 n.d. 2 IB, qPCR 15Cre06.g306350 FDX3 Ferredoxin 3 n.d. n.d. 45 7 1 IB 15Cre09.g393150 FOX1 Ferroxidase n.d. 11 1 25 21 1 IB 48Cre16.g676150 MSD3 Mn superoxide dismutase n.d. 10 3 73 21 1 A, IB, qPCR 19, 20Cre06.g257601 PRX1 2-Cys peroxiredoxin 839 77 834 70 1042 54 1 SILAC, IB 17
Mn R D LCre02.g096150 MSD1 Mn superoxide dismutase 48 48 n.d. n.d. 2 A, qPCR 20Cre16.g676150 MSD3 Mn superoxide dismutase n.d. n.d. 27 3 1 qPCR 20Cre02.g132800 PSBO Oxygen-evolving enhancer protein 1 1056 276 1235 298 1730 447 1 IB 20Cre12.g550850 PSBP1 Oxygen-evolving enhancer protein 2 1589 176 2296 259 2013 817 1 IB 20Cre08.g372450 PSBQ Oxygen evolving enhancer protein 3 655 120 807 281 788 360 1 IB 20
Protein abundance is reported in the “Experimental Condition” column in zmol/cell.n.d., not detected; n.m., not measured;2, decrease;1, increase; IB, immunoblot; A, activity; SILAC, stable isotope labeling of amino acids
in cell culture.a Reported by Augustus 10.2 identifiers or, if an Augustus 10.2 model does not exist, by FM3.1 identifiers.b R, metal replete; D, metal deficient; L, metal limited.c Response reported as the change observed in the micronutrient-deficient condition relative to the replete status.d Type of evidence available.
FIG. 5. Changes in protein abun-dance measured by MSE-based quan-tification are verified by immunoblotanalysis. Protein abundance frommetal-replete (left columns) cells andfrom metal-deficient/limited (right col-umns) cells compared by means of bothimmunoblot analysis and MSE-basedquantification.
The Proteome of Micronutrient Deficiency in Chlamydomonas reinhardtii
74 Molecular & Cellular Proteomics 12.1
thesis enzymes, and in a variety of other proteins (3, 13, 54).Chlamydomonas can survive copper deficiency (Fig. 1A) be-cause of its ability to replace plastocyanin with cytochromec6, a copper-independent substitute (23). In addition, a cop-per-containing amine oxidase may be replaced by a flavin-containing amine oxidase (13). These and other responses tocopper deficiency are controlled by the transcription factorCRR1 (9).
Previously, we examined responses to copper deficiency atthe transcript level (13) and used proteomics data to validatesome of the copper nutrition-dependent changes. We foundthat 17 of 18 changes observed at the transcript level wererecapitulated in the proteome (supplemental Table S1). Herewe summarize some of those previous findings and describeadditional changes at the protein level. These additionalchanges either complement changes observed at the tran-script level or demonstrate responses that were not observedbased on transcriptome analysis alone.
Recent transcriptome studies have revealed that there is acopper-deficiency induced increase in the abundance ofHYD1, HYDEF, HYDG, HCP2, HCP3, and PFR1 transcripts,which are related to anaerobic responses (12, 13). Proteinsthat correspond to these transcripts, however, cannot func-tion in aerobic conditions because their active site clusters areO2 labile. We hypothesized in prior work that these transcriptsare mis-expressed because copper deficiency results in faultyO2 sensing (13). Therefore, we asked the question of whetherthe increase in transcript levels also resulted in the accumu-
lation of these proteins. We were able to detect three of thesegene products—Hyd1, Pfr1, and Hcp2—and found that theywere all increased under copper-deficiency conditions. Thisshows that the expression of these proteins is controlled atthe level of their transcript abundance, regardless of whetherthe protein can actually function in these conditions. Anothersubset of anaerobically controlled genes that are also copperregulated encodes prolyl 4-hydroxylases (55). Transcriptomeevidence also indicated that five genes for prolyl 4-hydroxy-lases showed increased expression in copper-deficient con-ditions, of which four are CRR1 targets. We examined theproteome to uncover any evidence of copper responsivenessof prolyl 4-hydroxylases at the protein level. Although wecould not detect any of the gene products from the fivecopper-responsive genes listed in the previous study, weidentified three other prolyl 4-hydroxylases (Phx7, Phx13, andPhx18) whose abundances are increased under copper-defi-cient growth conditions (Table V). However, an accurate mag-nitude of the change could not be assessed because theproteins were detected only in copper-deficient conditions,and only one of them, Phx18, accumulated to a level that metour cutoff criterion of 20 zmol/cell (see “Experimental Proce-dures”). Nevertheless, this study indicates the operation ofpost-transcriptional mechanisms that impact prolyl hydroxy-lases in Chlamydomonas reinhardtii in addition to the previ-ously described transcriptional response.
The expression of genes CPX1, CRD1, and CAO for threeenzymes in the tetrapyrrole pathway is increased with copper
FIG. 6. RNA and protein levels aremoderately correlated under steadystate conditions. (Top row) RNA andprotein abundance were log transformedthen compared via scatter plot. ThePearson correlation was also calculatedfor each dataset. (Bottom row) Datawere sorted by RNA abundance andbinned in groups of 30. For the �Cudata, R2 � 0.78, and for �Cu, R2 � 0.77.
The Proteome of Micronutrient Deficiency in Chlamydomonas reinhardtii
Molecular & Cellular Proteomics 12.1 75

deficiency (13, 56, 57). In the present study, only the CPX1gene product was detected, as the other two proteins aremembrane associated (57). The abundance of coprogen oxi-dase increased, in accordance with a prior study that dem-onstrated increased enzyme activity and immunoreactive ma-terial (Table II) (56). In addition to coprogen oxidase, we alsoobserved changes to three other enzymes of the tetrapyrrolebiosynthetic pathway: urogen decarboxylase isoforms 1 and2, and PBG deaminase 1 (Cre11.g467700, Cre02.g076300,and Cre16.g663900, respectively) (supplemental Table S1). Incopper deficiency, we observed a decrease in isoform 1 ofurogen decarboxylase but an increase in isoform 2. A total ofthree well-expressed genes encode urogen decarboxylaseisozymes, but the pattern of expression of each gene is notknown, nor is it known whether there are functional differ-ences in the corresponding gene products. It is possible thatthis represents a compensatory change and thus is the firstindication of how the urogen decarboxylase isozymes mightbe regulated relative to each other. Again, these findingssuggest that in addition to CRR1-dependent transcriptionalmechanisms that impact tetrapyrrole metabolism, there arealso mechanisms that operate post-transcriptionally.
Besides our results relating copper nutrition and anaerobi-osis and the effect of copper on tetrapyrrole biosynthesis, weobserved three additional effects of copper deficiency inChlamydomonas. One such effect was a decrease in copperdeficiency of three isoprenoid pathway enzymes (supplemen-tal Table S1)—Pps1, Pps2, and Pps4—that are responsiblefor the synthesis of farnesyl pyrophosphate, geranylgeranylpyrophosphate, and solanesyl pyrophosphate, respectively.Pps1 was decreased 2-fold, Pps2 was decreased 3-fold, andPps4 was not detected (less than 1.7 zmol/cell) in copper-deficient cells. These enzymes are involved in pathways lead-ing to the synthesis of sterols, quinones, phytol, and preny-lated proteins. It should be noted that these proteins arebelieved to be membrane associated, and therefore it is dif-ficult to determine whether a decrease in these proteins rep-
resents an actual decrease in their total abundance or resultsfrom altered association with the membrane, perhaps due toincreased isoprenoid pathway activity. A second observationin copper deficiency was the decrease of two enzymes in theS-adenosylmethionine (SAM) biosynthesis pathway, 5,10-methylenetetrahydrofolate reductase (from 293 zmol/cell to180 zmol/cell) and cobalamin-independent methionine syn-thase (from 999 zmol/cell to 525 zmol/cell) (Cre10.g433600and Cre03.g180750, respectively). At the same time, a thirdmember of the pathway, serine hydroxymethyltransferase iso-form 1, was increased 3-fold (supplemental Table S1). Theseresults are interesting because the accumulation of anotherenzyme in the pathway, S-adenosylhomocysteine hydrolase,had been previously shown to be copper dependent, andcopper is a non-competitive inhibitor of the enzyme in mouseliver (58, 59). Although S-adenosylhomocysteine hydrolasewas detected in our proteomics study, we did not observe achange in its abundance, which contrasts with results fromthe mouse model. Lastly, our proteomics study also showedthat two selenocysteine tRNA synthases (encoded by TSS1,Cre02.g082850 and TSS2, Cre03.g189400) and a seleniumbinding-protein (SBD1, Cre03.g185550) are decreased incopper deficiency by �2-fold (supplemental Table S1). Pre-vious studies have shown that selenium-containing glutathi-one peroxidase activity levels are reduced in copper-deficientrats and chicken relative to animals given a copper-repletediet (60, 61). In the rat study, it was further shown that thismight have resulted from a reduced ability to retain seleniumin the cell (61). Although the connections between copper andselenium metabolism have not been established firmly in al-gae, these data suggest that there might well be one inChlamydomonas.
Iron Responsive Proteome—A prior study of iron deficiencyin Chlamydomonas detailed three distinct nutritional states(18). With 20 �M Fe in the growth medium, Chlamydomonascells show normal growth and are considered as iron replete.Iron-deficient (1–3 �M) cells do not show visible phenotypes
TABLE VProteins with altered accumulation under copper deficiency and implicated in anaerobic acclimation
Protein ID (Au10.2) Gene name DescriptionProtein amount
(zmol/cell) Fold changea
�Cu �Cu
Fermentation pathway enzymesCre20.g758200 ADH1 Alcohol/acetaldehyde dehydrogenase 114 13 217 38 2Cre02.g129550 HCP2 Hybrid-cluster protein n.d. 15 8 n/aCre01.g044800 PFL1 Pyruvate-formate lyase 280 95 475 75 2Cre03.g199800 HYDA1 Iron hydrogenase n.d. 22 24 n/aCre09.g396650 PAT2 Phosphate acetyltransferase n.d. 34 5 n/aCre11.g473950 PFR1 Pyruvate-ferredoxin oxidoreductase n.d. 88 43 n/a
Prolyl 4-hydroxylasesCre03.g160200 PHX7 Prolyl 4-hydroxylase n.d. 2 1 n/aCre10.g424900 PHX13 Prolyl 4-hydroxylase n.d. 13 9 n/aCre14.g626200 PHX18 Prolyl 4-hydroxylase n.d. 23 13 n/a
Fermentative pathway enzymes have been described elsewhere (29).n.d., not detected; n/a, not applicable.a Calculated as the ratio of protein abundance in �Cu versus the protein abudance in �Cu.
The Proteome of Micronutrient Deficiency in Chlamydomonas reinhardtii
76 Molecular & Cellular Proteomics 12.1

but are identified by increases in the expression of severalgenes encoding components of high-affinity iron uptake (48).In addition to these biochemical markers, iron-limited Chla-mydomonas cells are chlorotic and growth inhibited (18).Fluorescence rise and decay kinetics indicate that the iron-deficient cultures are mildly affected with respect to PS Ifunction, whereas iron-limited cells have lost PS II and PS Ifunction (18). To assess the changes to the proteome of cellsin these nutritional states, we compared the proteome ofwild-type cells grown photoheterotrophically in the presenceof 20 �M, 1 �M, and 0.25 �M supplemental iron and collectedfrom batch cultures at a density of �5 � 106 cells/ml. Growthof the cells was found to be similar to what was previouslyreported (18), and the accumulation of ferredoxin also closelyfollowed values in the published literature (15) (Fig.1B).
One of the most apparent effects of iron deficiency/limita-tion in Chlamydomonas is that on the photosynthetic appa-ratus (17, 18, 62). Other studies describe a remodeling of PSI, in which light harvesting complexes are disconnected fromphotosystem components (18), and previous proteomicsstudy showed that there was also a decrease in several pho-tosystem I and light harvesting complex proteins (62), but littlechange was observed for proteins involved in respiration orrelated to PS II function (17). These earlier studies, however,were limited to the examination of enriched chloroplast frac-tions with no evaluation of iron-deficiency/limitation-inducedeffects on metabolism and/or the entire system. Our studydemonstrates additional effects of iron deficiency/limitationthat have not been described previously.
Interestingly, functional analysis showed that a large subsetof proteins classified under the “photosynthesis” category isdecreased in abundance (Fig. 4, supplemental Table S2). Thisincluded LciB (Cre10.g452800) and LciC (Cre06.g307500),representing components of inorganic carbon assimilation;plastocyanin (Cre03.g182551), Oee1 (Cre02.g132800), andOee3 (Cre08.g372450), proteins associated with light reac-tions; and Calvin cycle enzymes Pgk1 (Cre22.g763250) andPrk1 (Cre12.g554800). Many of the changes to these proteinsare �2-fold (Oee1, Pgk1, and Prk1) or 3-fold (LciB and Oee3).LciC was detected at 41 zmol/cell in iron-replete cells, but itwas not detected in iron-limited cells. Plastocyanin was re-duced significantly from 797 zmol/cell in iron-replete condi-tions to 25 zmol/cell in iron-limited conditions, a change thatwas confirmed by immunoblot analysis of independent sam-ples (Fig. 5). These results indicate that the previously notedchanges in thylakoid membrane protein abundance extendalso to stromal and lumenal proteins of the photosyntheticapparatus (17, 63). It is worth noting that only Oee3 and Prk1decrease under iron deficiency (1 �M Fe), and even then lessthan a 2-fold change was observed relative to iron-repletecells (20 �M Fe). All other proteins described above weredecreased only under iron-limitation conditions (0.25 �M Fe).Therefore, it is likely that the Calvin cycle, carbon-concentrat-
ing mechanism (CCM), and light reactions are affected onlywhen the cells are growth-limited by the absence of Fe.
Previously, we demonstrated that changes in the abun-dance of thylakoid membrane proteins resulted from inducedproteolysis (18). Consistent with this earlier result, four pro-teases were found whose abundance increased in iron defi-ciency/limitation, including two matrix metalloproteases(isoforms 1 and 13, Cre17.g718500 and Cre60.g792000,respectively), a pepsin-type aspartyl protease (Cre04.g226850), and an unnamed protease (Cre17.g728100) (sup-plemental Table S2). Reduced protein synthesis is likely to bea contributing factor, as we noted a decrease in 11 amino acidmetabolism proteins and seven tRNA synthetases (supple-mental Table S2). There also was a concomitant decrease inthe abundance of urogen decarboxylase isozyme 1, PBGdeaminase 1, and coprogen oxidase; all three are enzymes inthe tetrapyrrole pathway, and this is consistent with the re-duction in chlorophyll and heme proteins in this condition.This might occur as a flux control step so that iron can bepreserved for other purposes such as oxidative stress de-fense in iron-containing superoxide dismutase.
Because PS I is a prime target of iron deficiency because ofthe presence of three Fe4S4 clusters, its compromised func-tion in this situation is likely to result in elevated superoxideproduction via the Mehler reaction (18, 62). Superoxide gen-erated by iron-less PS I may be detoxified via a plastid-localized MnSOD, with the resulting hydrogen peroxidefurther detoxified by peroxidases, which rely on either gluta-thione or ascorbate. Monodehydroascorbate reductase func-tions to regenerate ascorbate from monodehydroascorbate.In fact, the ascorbate-glutathione pathway has been pro-posed as a major detoxification pathway of superoxide (64).An iron-deficiency/limitation-inducible MnSOD activity hasbeen previously observed and attributed to MnSOD3, basedon the accumulation of the MSD3 transcript under the sameconditions and immunoblotting with an MnSOD3-specific an-tibody (19, 20). Not surprisingly, chloroplast anti-oxidantmechanisms are up-regulated in the iron-deficient/limitedstress situation. MnSOD3 is undetectable in iron-replete cells,but its levels increase to 10 zmol/cell in iron-deficient cells and73 zmol/cell in iron-limited cells (Fig. 5). Our protein datatherefore support the association of inducible superoxide dis-mutase activity to MnSOD3 levels (Fig. 5). Similarly, monode-hydroascorbate reductase 1 increases from 70 zmol/cell to224 zmol/cell to 1,234 zmol/cell, and glutathione synthetase 1increases from 34 zmol/cell to 45 zmol/cell to 95 zmol/cell(from iron replete to iron deficient to iron limited, respectively)(supplemental Table S2).
In addition, Hsp 70B (supplemental Table S2), a protein thathas been previously shown to act as a photoprotectant andwhich is involved in PS II repair in Chlamydomonas, increasesin iron-limited cells to 1,216 zmol/cell from 466 zmol/cell iniron-replete cells (30, 65). Schroda et al. showed that strainsover-expressing Hsp 70B had reduced rates of PS II photo-
The Proteome of Micronutrient Deficiency in Chlamydomonas reinhardtii
Molecular & Cellular Proteomics 12.1 77
inhibition and that Hsp 70B under-expressing strains showedslower rates of PS II repair relative to wild-type (65). Althoughiron-limited cells prepare for photooxidative damage via PS Iremodeling, it is noteworthy that additional mechanisms maybe employed. Interestingly, although two components of theascorbate-glutathione pathway (monodehydroascorbate re-ductase and MnSOD3) are increased already in iron defi-ciency, changes in the abundance of Hsp 70B do not occuruntil iron-limitation conditions are sensed. This might furthersuggest that the ascorbate-glutathione pathway is the primaryanti-oxidant defense mechanism in response to decreasediron availability.
We also observed an apparently non-photosynthesis-re-lated effect of iron deficiency/limitation. Four components ofthe SAM synthesis pathway—5,10-methylenetetrahydrofolatereductase, cobalamin-independent methionine synthase, ser-ine hydroxymethyl transferase isoform 2, and S-adenosylho-mocysteine hydrolase (Cre03.g204250)—were decreased un-der iron-limited conditions by small but statistically significantamounts. The effect of iron nutrition on SAM metabolismmight be based on the activity of adenosylmethionine-de-pendent Fe4S4 cluster proteins. One such Fe4S4 cluster pro-tein is biotin synthase, the transcripts of which are known tobe reduced under iron deficiency in Saccharomyces cerevi-siae. The decrease in biotin synthase transcripts is accompa-nied by an increase in VHT1, encoding for a high-affinity biotintransporter, presumably as a mechanism of iron sparing (66).Additionally, other adenosylmethionine-dependent Fe4S4
cluster proteins such as pyruvate formate lyase activase,fumarate-nitrate reductase, and others described by Cheekand Broderick (67) may be affected in a similar way. Thus, thepossibility exists that iron deficiency might result in a loss ofmany such iron–sulfur proteins and consequently a reductionin the need for SAM. Unfortunately, we did not detect anyradical SAM proteins in our dataset to validate this theory.
Zinc Responsive Proteome—Cells were grown (photo)het-erotrophically in TAP medium in triplicate cultures, and theirzinc content was reduced by two transfers into growth mediumwith no supplemental zinc (referred to as first and second“rounds,” respectively). This process reduces the internal zinccontent to 33% relative to zinc-replete cultures.2 By analogy tothe studies on iron and manganese deficiency, cells from thefirst round are more mildly deficient than are cells from thesecond round, with the more depleted Zn cultures showingevidence of a stress response. Therefore, we used protein sam-ples from the first round of growth in zinc-poor medium todistinguish the primary targets. The reduced growth rate of suchcultures shows that even a single transfer into zinc-depletedmedium is sufficient to disrupt normal cell function and thustrigger a zinc deficiency response (Fig.1C).
Carbonic anhydrases constitute a major group of proteinsthat bind zinc. The classical function of the carbonic anhy-drases is to interconvert CO2 and bicarbonate to facilitateCO2 assimilation for carbon fixation, and a subclass of theseproteins is involved in the CCM, which enables photosyn-thetic growth under limiting CO2 conditions (68, 69). Of the 12predicted carbonic anhydrases, only 3 were detected in ourdataset: Cah1 (Cre04.g223100), Cah3 (Cre09.g415700), andCah8 (Cre09.g405750). Cah1 was detected at 171 81 zmol/cell in zinc-replete growth conditions but was not recoveredunder zinc deficiency (Table IV and supplemental Table S3).Previous work showed that cah1 null mutants in Chlamy-domonas do not exhibit severe growth phenotypes, evenunder low CO2 growth conditions (70). Therefore, carbonicanhydrase 1 is a dispensable enzyme and, as an abundantenzyme, would make a good target for degradation if the cellwere to scavenge intracellular zinc for recycling and redistri-bution (22). In contrast to Cah1, Cah8, which was recentlycharacterized (71), was detected in zinc-deficient cells but notin zinc-replete cells (supplemental Table S3). Cah3 was de-tected, but its abundance did not change significantly in re-sponse to zinc nutrition.
We also observed three proteins that were detected inzinc-deficient proteomes but were not detected under zinc-replete conditions (supplemental Table S3). Each protein wasdetected at levels near the upper end of the dynamic range ofour study (over 1,000 zmol/cell). These three proteins do nothave a known function; one is unannotated (Cre07.g352000),and the other two are COG0523 domain-containing proteins(named Zcp1 and Zcp2, for zinc-responsive COG0523 do-main-containing proteins). Although ZCP1 (117458) and ZCP2(Cre02.g118400) transcript abundances were previouslyshown to be increased with zinc deficiency, this is the firstreport of a corresponding change in protein abundance de-pendent on zinc levels. The increase in Zcp2 abundance wasconfirmed in independent experiments via immunoblot anal-ysis (Fig. 5). The function of COG0523 domain-containingproteins is not well understood, although members of thisfamily are involved in cobalamin biosynthesis, activation of aniron-containing nitrile hydratase, and the bacterial zinc defi-ciency response (21, 72, 73). Despite the apparent diversity offunctions carried out by COG0523 proteins, all known func-tionalities are related to metal metabolism (21).
Interestingly, 2-fold abundance increases (on average) for14 redox proteins with zinc deficiency were detected (supple-mental Table S3). Of special interest is thioredoxin 5(Cre09.g391900), which is undetectable in zinc-replete cellsbut accumulated to 22 zmol/cell in zinc-deficient cells. Sev-eral targets of thioredoxin 5, identified by Lemaire et al., arealso affected by zinc deficiency (31), including Icl1, Acs3,Gln2, ferredoxin, and Rpn12 (Table VII). Although some areincreased and others are decreased, precluding a more pre-cise explanation, it is interesting that so many thioredoxin 5interacting proteins are affected. It was suggested that thiore-
2 Malasarn, D., Kropat, J., Hsieh, S. I., Finazzi, G., Casero, D., Loo,J. A., Pellegrini, M., Wollman, F.-A., and Merchant, S. S., in preparation.
The Proteome of Micronutrient Deficiency in Chlamydomonas reinhardtii
78 Molecular & Cellular Proteomics 12.1
doxin 5 might play a role in the insertion of the iron–sulfurcluster into ferredoxin (31). Indeed, this is supported by 3-foldincreases in ferredoxin levels and increases in several ferre-doxin interacting proteins, ferredoxin-NADP� reductase,ferredoxin thioredoxin reductase, and ferredoxin-sulfite re-ductase (Cre11.g476750, Cre03.g193950, Cre16.g693150;supplemental Table S3).
Several CRR1-controlled responses were observed to beaffected by zinc deficiency, albeit to a lesser extent than whatwas observed with copper-deficient cells (Table VI). Theseresponses include a decrease in plastocyanin, an increase incoprogen oxidase, and an increase in Cgl78 (Table IV, Figs. 1and 5). We also detected Ctr3, a soluble member of theChlamydomonas CTR3 family, in the zinc-deficient samples,but at low abundance (16 zmol/cell) (11). In addition to theCRR1-controlled responses, additional signs of copper defi-ciency were observed. Pyruvate phosphate dikinase 1, forexample, is increased in zinc deficiency, as it is in copper-deficient cells (supplemental Tables S1 and S3). Two of thecomponents of the anaerobically controlled fermentativepathway discussed previously, Adh1 and Pfl1, were increasedin this dataset as well. Other proteins in this pathway (Pat2and Ack2) did not show any change under zinc deficiency.Lastly, two out of three prolyl 4-hydroxylases (Phx18 andPhx7) that increased with copper deficiency (supplemental
Table S1) were also increased with zinc deficiency (from anundetectable amount in zinc-replete cells to 30 zmol/cell and11 zmol/cell, respectively, in zinc-deficient cells).
Manganese Responsive Proteome—Three growth condi-tions were examined in the manganese study. In addition tothe replete (2 �M supplemental Mn) and deficient (0 �M sup-plemental Mn) conditions described previously (20), we ex-amined the proteome of cells grown in 0.05 �M supplementalMn (Fig. 1D). Based on preliminary fluorescence induction anddecay kinetics measurements, it is suggested that PS II is stillfunctional with 0.05 �M Mn, although to a decreased extentrelative to the Mn-replete conditions (data not shown). Thisphenotype is reminiscent of the iron deficiency situation (18),and the examination of this intermediate Mn level might helpreveal early primary responses.
In Chlamydomonas, iron deficiency results in various bio-chemical changes such as the accumulation of assimilationfactors like Fea1 and ferroxidase. Only after cells become ironlimited are the dramatic effects on photosynthesis (describedin brief above) observed. Similar to this, manganese defi-ciency induces changes to the proteome before the completeloss of photosynthetic function. Several examples of proteinssignificantly increasing or decreasing in the 0.05 �M Mn con-dition relative to the replete situation were observed (supple-mental Table S4); subunits of the 20S proteasome increase
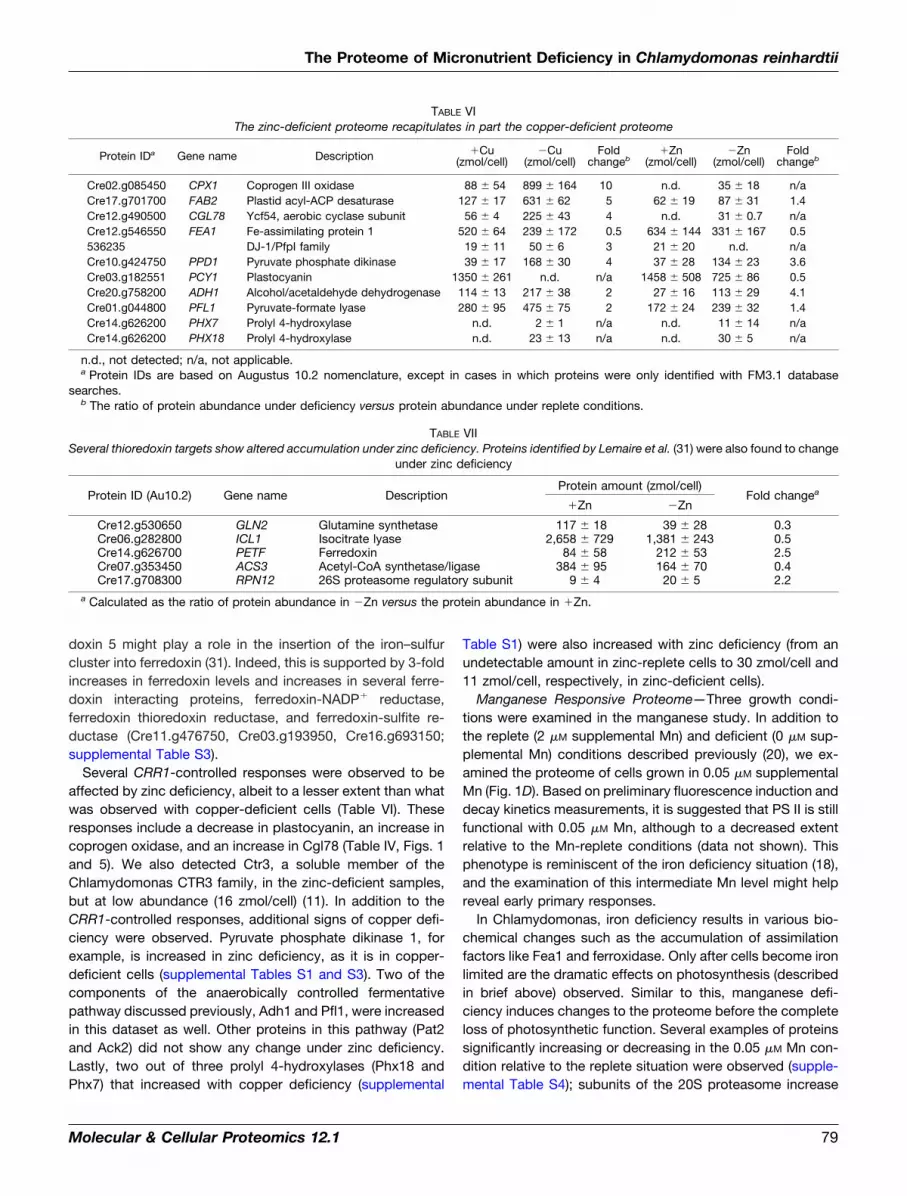
TABLE VIThe zinc-deficient proteome recapitulates in part the copper-deficient proteome
Protein IDa Gene name Description �Cu(zmol/cell)
�Cu(zmol/cell)
Foldchangeb
�Zn(zmol/cell)
�Zn(zmol/cell)
Foldchangeb
Cre02.g085450 CPX1 Coprogen III oxidase 88 54 899 164 10 n.d. 35 18 n/aCre17.g701700 FAB2 Plastid acyl-ACP desaturase 127 17 631 62 5 62 19 87 31 1.4Cre12.g490500 CGL78 Ycf54, aerobic cyclase subunit 56 4 225 43 4 n.d. 31 0.7 n/aCre12.g546550 FEA1 Fe-assimilating protein 1 520 64 239 172 0.5 634 144 331 167 0.5536235 DJ-1/PfpI family 19 11 50 6 3 21 20 n.d. n/aCre10.g424750 PPD1 Pyruvate phosphate dikinase 39 17 168 30 4 37 28 134 23 3.6Cre03.g182551 PCY1 Plastocyanin 1350 261 n.d. n/a 1458 508 725 86 0.5Cre20.g758200 ADH1 Alcohol/acetaldehyde dehydrogenase 114 13 217 38 2 27 16 113 29 4.1Cre01.g044800 PFL1 Pyruvate-formate lyase 280 95 475 75 2 172 24 239 32 1.4Cre14.g626200 PHX7 Prolyl 4-hydroxylase n.d. 2 1 n/a n.d. 11 14 n/aCre14.g626200 PHX18 Prolyl 4-hydroxylase n.d. 23 13 n/a n.d. 30 5 n/a
n.d., not detected; n/a, not applicable.a Protein IDs are based on Augustus 10.2 nomenclature, except in cases in which proteins were only identified with FM3.1 database
searches.b The ratio of protein abundance under deficiency versus protein abundance under replete conditions.
TABLE VIISeveral thioredoxin targets show altered accumulation under zinc deficiency. Proteins identified by Lemaire et al. (31) were also found to change
under zinc deficiency
Protein ID (Au10.2) Gene name DescriptionProtein amount (zmol/cell)
Fold changea
�Zn �Zn
Cre12.g530650 GLN2 Glutamine synthetase 117 18 39 28 0.3Cre06.g282800 ICL1 Isocitrate lyase 2,658 729 1,381 243 0.5Cre14.g626700 PETF Ferredoxin 84 58 212 53 2.5Cre07.g353450 ACS3 Acetyl-CoA synthetase/ligase 384 95 164 70 0.4Cre17.g708300 RPN12 26S proteasome regulatory subunit 9 4 20 5 2.2
a Calculated as the ratio of protein abundance in �Zn versus the protein abundance in �Zn.
The Proteome of Micronutrient Deficiency in Chlamydomonas reinhardtii
Molecular & Cellular Proteomics 12.1 79
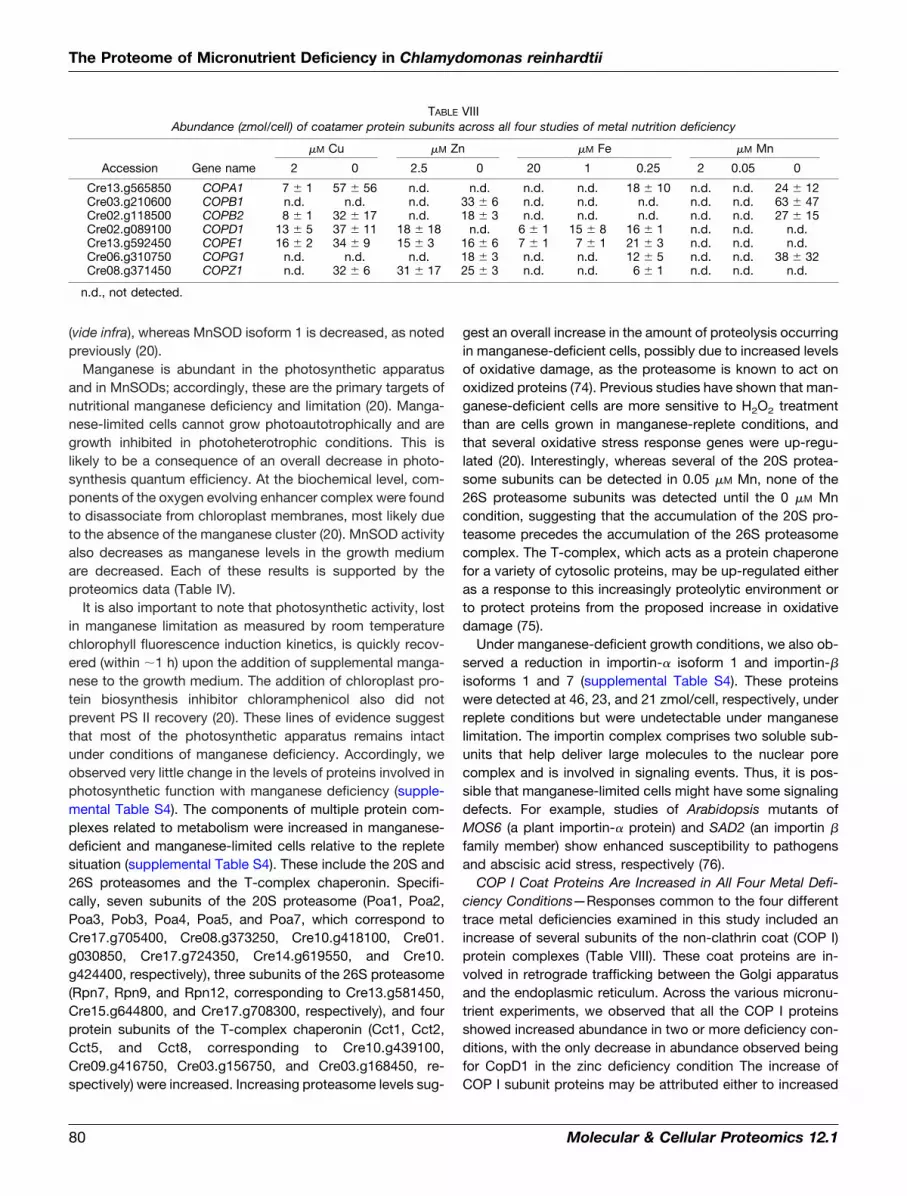
(vide infra), whereas MnSOD isoform 1 is decreased, as notedpreviously (20).
Manganese is abundant in the photosynthetic apparatusand in MnSODs; accordingly, these are the primary targets ofnutritional manganese deficiency and limitation (20). Manga-nese-limited cells cannot grow photoautotrophically and aregrowth inhibited in photoheterotrophic conditions. This islikely to be a consequence of an overall decrease in photo-synthesis quantum efficiency. At the biochemical level, com-ponents of the oxygen evolving enhancer complex were foundto disassociate from chloroplast membranes, most likely dueto the absence of the manganese cluster (20). MnSOD activityalso decreases as manganese levels in the growth mediumare decreased. Each of these results is supported by theproteomics data (Table IV).
It is also important to note that photosynthetic activity, lostin manganese limitation as measured by room temperaturechlorophyll fluorescence induction kinetics, is quickly recov-ered (within �1 h) upon the addition of supplemental manga-nese to the growth medium. The addition of chloroplast pro-tein biosynthesis inhibitor chloramphenicol also did notprevent PS II recovery (20). These lines of evidence suggestthat most of the photosynthetic apparatus remains intactunder conditions of manganese deficiency. Accordingly, weobserved very little change in the levels of proteins involved inphotosynthetic function with manganese deficiency (supple-mental Table S4). The components of multiple protein com-plexes related to metabolism were increased in manganese-deficient and manganese-limited cells relative to the repletesituation (supplemental Table S4). These include the 20S and26S proteasomes and the T-complex chaperonin. Specifi-cally, seven subunits of the 20S proteasome (Poa1, Poa2,Poa3, Pob3, Poa4, Poa5, and Poa7, which correspond toCre17.g705400, Cre08.g373250, Cre10.g418100, Cre01.g030850, Cre17.g724350, Cre14.g619550, and Cre10.g424400, respectively), three subunits of the 26S proteasome(Rpn7, Rpn9, and Rpn12, corresponding to Cre13.g581450,Cre15.g644800, and Cre17.g708300, respectively), and fourprotein subunits of the T-complex chaperonin (Cct1, Cct2,Cct5, and Cct8, corresponding to Cre10.g439100,Cre09.g416750, Cre03.g156750, and Cre03.g168450, re-spectively) were increased. Increasing proteasome levels sug-
gest an overall increase in the amount of proteolysis occurringin manganese-deficient cells, possibly due to increased levelsof oxidative damage, as the proteasome is known to act onoxidized proteins (74). Previous studies have shown that man-ganese-deficient cells are more sensitive to H2O2 treatmentthan are cells grown in manganese-replete conditions, andthat several oxidative stress response genes were up-regu-lated (20). Interestingly, whereas several of the 20S protea-some subunits can be detected in 0.05 �M Mn, none of the26S proteasome subunits was detected until the 0 �M Mncondition, suggesting that the accumulation of the 20S pro-teasome precedes the accumulation of the 26S proteasomecomplex. The T-complex, which acts as a protein chaperonefor a variety of cytosolic proteins, may be up-regulated eitheras a response to this increasingly proteolytic environment orto protect proteins from the proposed increase in oxidativedamage (75).
Under manganese-deficient growth conditions, we also ob-served a reduction in importin-� isoform 1 and importin-�
isoforms 1 and 7 (supplemental Table S4). These proteinswere detected at 46, 23, and 21 zmol/cell, respectively, underreplete conditions but were undetectable under manganeselimitation. The importin complex comprises two soluble sub-units that help deliver large molecules to the nuclear porecomplex and is involved in signaling events. Thus, it is pos-sible that manganese-limited cells might have some signalingdefects. For example, studies of Arabidopsis mutants ofMOS6 (a plant importin-� protein) and SAD2 (an importin �
family member) show enhanced susceptibility to pathogensand abscisic acid stress, respectively (76).
COP I Coat Proteins Are Increased in All Four Metal Defi-ciency Conditions—Responses common to the four differenttrace metal deficiencies examined in this study included anincrease of several subunits of the non-clathrin coat (COP I)protein complexes (Table VIII). These coat proteins are in-volved in retrograde trafficking between the Golgi apparatusand the endoplasmic reticulum. Across the various micronu-trient experiments, we observed that all the COP I proteinsshowed increased abundance in two or more deficiency con-ditions, with the only decrease in abundance observed beingfor CopD1 in the zinc deficiency condition The increase ofCOP I subunit proteins may be attributed either to increased
TABLE VIIIAbundance (zmol/cell) of coatamer protein subunits across all four studies of metal nutrition deficiency
�M Cu �M Zn �M Fe �M Mn
Accession Gene name 2 0 2.5 0 20 1 0.25 2 0.05 0
Cre13.g565850 COPA1 7 1 57 56 n.d. n.d. n.d. n.d. 18 10 n.d. n.d. 24 12Cre03.g210600 COPB1 n.d. n.d. n.d. 33 6 n.d. n.d. n.d. n.d. n.d. 63 47Cre02.g118500 COPB2 8 1 32 17 n.d. 18 3 n.d. n.d. n.d. n.d. n.d. 27 15Cre02.g089100 COPD1 13 5 37 11 18 18 n.d. 6 1 15 8 16 1 n.d. n.d. n.d.Cre13.g592450 COPE1 16 2 34 9 15 3 16 6 7 1 7 1 21 3 n.d. n.d. n.d.Cre06.g310750 COPG1 n.d. n.d. n.d. 18 3 n.d. n.d. 12 5 n.d. n.d. 38 32Cre08.g371450 COPZ1 n.d. 32 6 31 17 25 3 n.d. n.d. 6 1 n.d. n.d. n.d.
n.d., not detected.
The Proteome of Micronutrient Deficiency in Chlamydomonas reinhardtii
80 Molecular & Cellular Proteomics 12.1
synthesis of the proteins or to increased partitioning of theproteins to the soluble fraction.
DISCUSSION
Changes at the RNA Level Can Serve as Reliable Predictorsof Changes at the Protein Level but Do Not Reveal All ProteinLevel Changes—The Pearson coefficient between transcriptand protein data showed a moderate correlation (� � 0.28 forcopper-replete and � � 0.30 for copper-deficient cells). Giventhat the dynamic range of the proteomics study (3 to 4 ordersof magnitude) is significantly less than that of the transcrip-tomics study (roughly 5 to 6 orders of magnitude), the low-to-moderate correlation is likely due to the limited dynamicrange of the proteomics study. With over 15,000 genes in theChlamydomonas genome and �12,300 soluble proteins esti-mated (using TMHMM), only 23% of all gene products weredetected and quantified. Our transcript–protein correlationestimates agree with other studies of other organisms rangingfrom E. coli and yeast to mouse and human (52, 53, 77–80).Our analysis also suggests that this overall correlation doesnot change depending on the nutritional state. Therefore, RNAabundance is a moderate predictor of protein abundance as itis in other organisms.
However, changes in RNA abundance are good predictorsof changes in protein levels. In cases in which the transcriptshowed a significant change (identified by Castruita et al.(13)), the correlation between the transcript and protein abun-dance was determined to be fairly strong (� � 0.73). Thus, forChlamydomonas, significant changes in RNA abundance candenote a complementary change at the protein level. In otherwords, changes in RNA abundance can serve as a reliablepredictor of changes at the protein level. Studies on yeast,corn, and Drosophila further support this notion (53, 81, 82).
Despite this correlation, changes in RNA abundance do notalways result in corresponding changes in protein levels, es-pecially in cases in which RNA abundance is decreased. In arecent study on yeast, the decrease in RNA abundanceshowed poor correlation with changes in the protein abun-dance (81). This is because protein half-life, a key factor thatdetermines the magnitude of a response with respect to pro-tein abundance, is independent of RNA abundance (83). Adecrease in RNA abundance can prevent the synthesis of newprotein, but it does not impact preexisting protein. Changes inprotein levels then become evident only if proteolysis is in-duced in parallel.
Some changes in protein amount cannot be explained bychanges in transcriptome levels, such as those of proteinswhose half-lives are changed (e.g. by ubiquitination or in-duced proteolysis) or when rates of synthesis are changed bymechanisms operating at the translational level. Some excel-lent examples include plastocyanin in copper-deficient Chla-mydomonas and carbonic anhydrase in zinc-deficient cells(84). Additionally, only 60% of protein changes in yeast areexplained by changes in the transcript (81), studies in Dro-
sophila showed only a 30% overlap in significant changes atboth protein and transcript levels (53), and work in miceestimates that only 43% of changes to the protein are directlybased on changes to the transcriptome (77). This is also truefor Chlamydomonas, as many of the protein changes ob-served were not accompanied by significant changes in thecorresponding transcripts (13). Despite this, transcriptomicscan still serve as a strong predictor of changes at the proteinlevel, as the correlation between changes in transcript andprotein abundance is high.
Putative Oxidative Stress Responses with Metal Deficiency—Among the four metal deficiency/limitation conditions tested,only iron and zinc deficiency appeared to result in an oxidativestress response. Copper-deficient cells did not show cleartrends with regard to oxidative stress responses and did notdisplay visible stress phenotypes such as reduced growth orchanges in pigmentation. In manganese deficiency, reducedMnSOD activity is apparent (20), but there is no compensatoryresponse known.
In both iron and zinc deficiency, there are clear indicationsof a global oxidative stress response. With iron deficiency, thisis observed via up-regulation of the ascorbate-glutathionepathway, whereas the response appears to be much lessfocused on a single pathway in zinc deficiency. Much of theiron-deficiency-induced stress response is focused on theprevention of superoxide damage, likely generated from PS Iactivity. This observation supports previous reports that themajor detoxification pathway for PS I is the ascorbate-gluta-thione pathway (64). For zinc-deficient cells, the abundance of14 different redox proteins increased, and many of theseproteins are implicated in oxidative stress defense but showno other common metabolic associations. One of the redoxproteins that increases in zinc-deficient cells is thioredoxin 5,which has been shown to be induced by metal stress (Hg andCd) but not in response to oxidative stress generators, sug-gesting that metal-deficiency-induced stress might be occur-ring in the cell. Indeed, zinc-deficient cells tend to hyper-accumulate several metals including copper, iron, andmanganese.2
The Effect of Metal Deficiency on Photosynthetic Func-tion—Each of the metals selected for this study is linked tophotosynthetic function (2–4). Some of the metal-deficiencyeffects found in the proteomics data were expected andrepresent known responses. For example, copper deficiencyresulted in the loss of plastocyanin and accumulation of cy-tochrome c6, and zinc-containing carbonic anhydrase isoform1 was decreased under zinc deficiency (Table IV). The pro-teomics results for iron- and manganese-related growth con-ditions, however, reveal differences in how photosynthesis isaffected in metal-deficient Chlamydomonas.
Previous reports showed that Chlamydomonas cells re-model their PS I complexes (17, 18, 62) and show a reductionof photosynthesis-related proteins in iron-limited conditions(Fig. 5) (48). Although there is no clear reason for reducing the
The Proteome of Micronutrient Deficiency in Chlamydomonas reinhardtii
Molecular & Cellular Proteomics 12.1 81
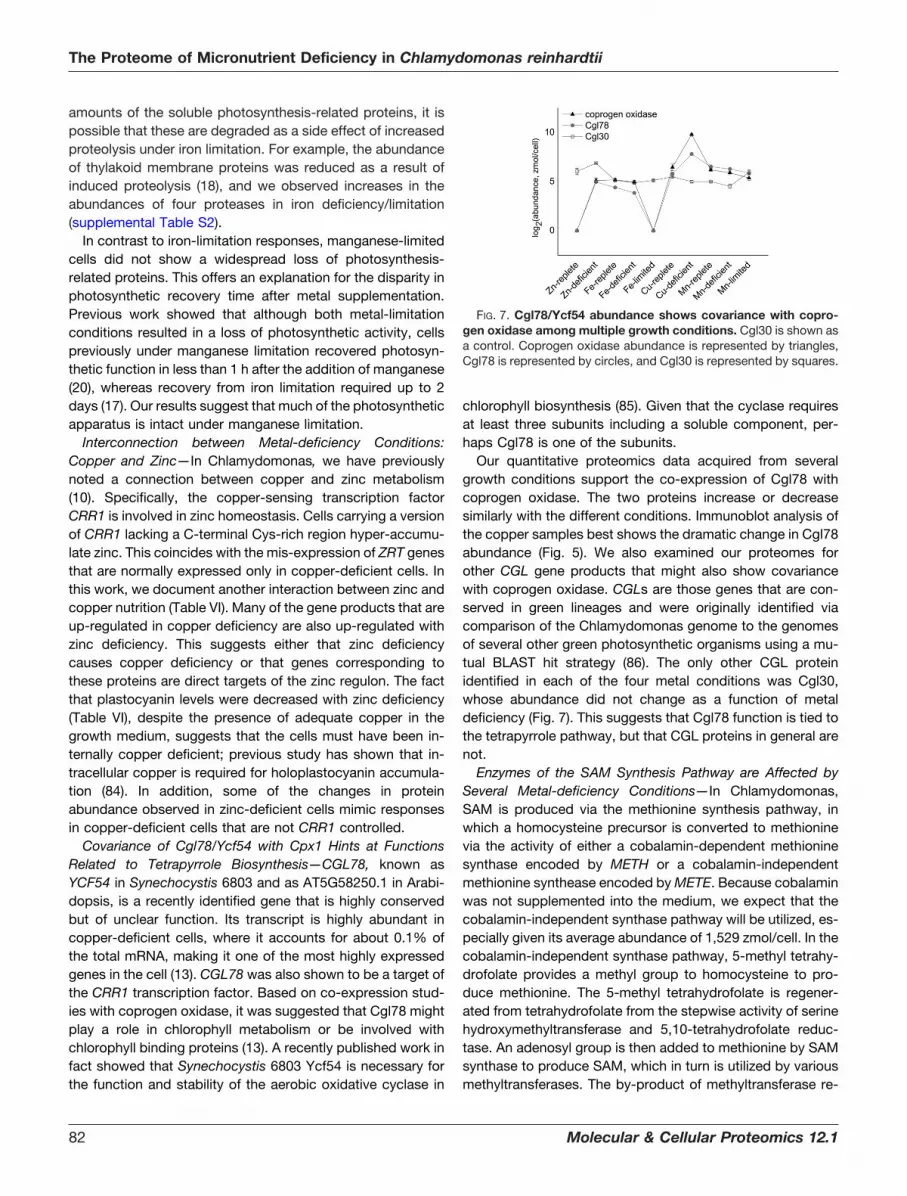
amounts of the soluble photosynthesis-related proteins, it ispossible that these are degraded as a side effect of increasedproteolysis under iron limitation. For example, the abundanceof thylakoid membrane proteins was reduced as a result ofinduced proteolysis (18), and we observed increases in theabundances of four proteases in iron deficiency/limitation(supplemental Table S2).
In contrast to iron-limitation responses, manganese-limitedcells did not show a widespread loss of photosynthesis-related proteins. This offers an explanation for the disparity inphotosynthetic recovery time after metal supplementation.Previous work showed that although both metal-limitationconditions resulted in a loss of photosynthetic activity, cellspreviously under manganese limitation recovered photosyn-thetic function in less than 1 h after the addition of manganese(20), whereas recovery from iron limitation required up to 2days (17). Our results suggest that much of the photosyntheticapparatus is intact under manganese limitation.
Interconnection between Metal-deficiency Conditions:Copper and Zinc—In Chlamydomonas, we have previouslynoted a connection between copper and zinc metabolism(10). Specifically, the copper-sensing transcription factorCRR1 is involved in zinc homeostasis. Cells carrying a versionof CRR1 lacking a C-terminal Cys-rich region hyper-accumu-late zinc. This coincides with the mis-expression of ZRT genesthat are normally expressed only in copper-deficient cells. Inthis work, we document another interaction between zinc andcopper nutrition (Table VI). Many of the gene products that areup-regulated in copper deficiency are also up-regulated withzinc deficiency. This suggests either that zinc deficiencycauses copper deficiency or that genes corresponding tothese proteins are direct targets of the zinc regulon. The factthat plastocyanin levels were decreased with zinc deficiency(Table VI), despite the presence of adequate copper in thegrowth medium, suggests that the cells must have been in-ternally copper deficient; previous study has shown that in-tracellular copper is required for holoplastocyanin accumula-tion (84). In addition, some of the changes in proteinabundance observed in zinc-deficient cells mimic responsesin copper-deficient cells that are not CRR1 controlled.
Covariance of Cgl78/Ycf54 with Cpx1 Hints at FunctionsRelated to Tetrapyrrole Biosynthesis—CGL78, known asYCF54 in Synechocystis 6803 and as AT5G58250.1 in Arabi-dopsis, is a recently identified gene that is highly conservedbut of unclear function. Its transcript is highly abundant incopper-deficient cells, where it accounts for about 0.1% ofthe total mRNA, making it one of the most highly expressedgenes in the cell (13). CGL78 was also shown to be a target ofthe CRR1 transcription factor. Based on co-expression stud-ies with coprogen oxidase, it was suggested that Cgl78 mightplay a role in chlorophyll metabolism or be involved withchlorophyll binding proteins (13). A recently published work infact showed that Synechocystis 6803 Ycf54 is necessary forthe function and stability of the aerobic oxidative cyclase in
chlorophyll biosynthesis (85). Given that the cyclase requiresat least three subunits including a soluble component, per-haps Cgl78 is one of the subunits.
Our quantitative proteomics data acquired from severalgrowth conditions support the co-expression of Cgl78 withcoprogen oxidase. The two proteins increase or decreasesimilarly with the different conditions. Immunoblot analysis ofthe copper samples best shows the dramatic change in Cgl78abundance (Fig. 5). We also examined our proteomes forother CGL gene products that might also show covariancewith coprogen oxidase. CGLs are those genes that are con-served in green lineages and were originally identified viacomparison of the Chlamydomonas genome to the genomesof several other green photosynthetic organisms using a mu-tual BLAST hit strategy (86). The only other CGL proteinidentified in each of the four metal conditions was Cgl30,whose abundance did not change as a function of metaldeficiency (Fig. 7). This suggests that Cgl78 function is tied tothe tetrapyrrole pathway, but that CGL proteins in general arenot.
Enzymes of the SAM Synthesis Pathway are Affected bySeveral Metal-deficiency Conditions—In Chlamydomonas,SAM is produced via the methionine synthesis pathway, inwhich a homocysteine precursor is converted to methioninevia the activity of either a cobalamin-dependent methioninesynthase encoded by METH or a cobalamin-independentmethionine synthease encoded by METE. Because cobalaminwas not supplemented into the medium, we expect that thecobalamin-independent synthase pathway will be utilized, es-pecially given its average abundance of 1,529 zmol/cell. In thecobalamin-independent synthase pathway, 5-methyl tetrahy-drofolate provides a methyl group to homocysteine to pro-duce methionine. The 5-methyl tetrahydrofolate is regener-ated from tetrahydrofolate from the stepwise activity of serinehydroxymethyltransferase and 5,10-tetrahydrofolate reduc-tase. An adenosyl group is then added to methionine by SAMsynthase to produce SAM, which in turn is utilized by variousmethyltransferases. The by-product of methyltransferase re-
FIG. 7. Cgl78/Ycf54 abundance shows covariance with copro-gen oxidase among multiple growth conditions. Cgl30 is shown asa control. Coprogen oxidase abundance is represented by triangles,Cgl78 is represented by circles, and Cgl30 is represented by squares.
The Proteome of Micronutrient Deficiency in Chlamydomonas reinhardtii
82 Molecular & Cellular Proteomics 12.1
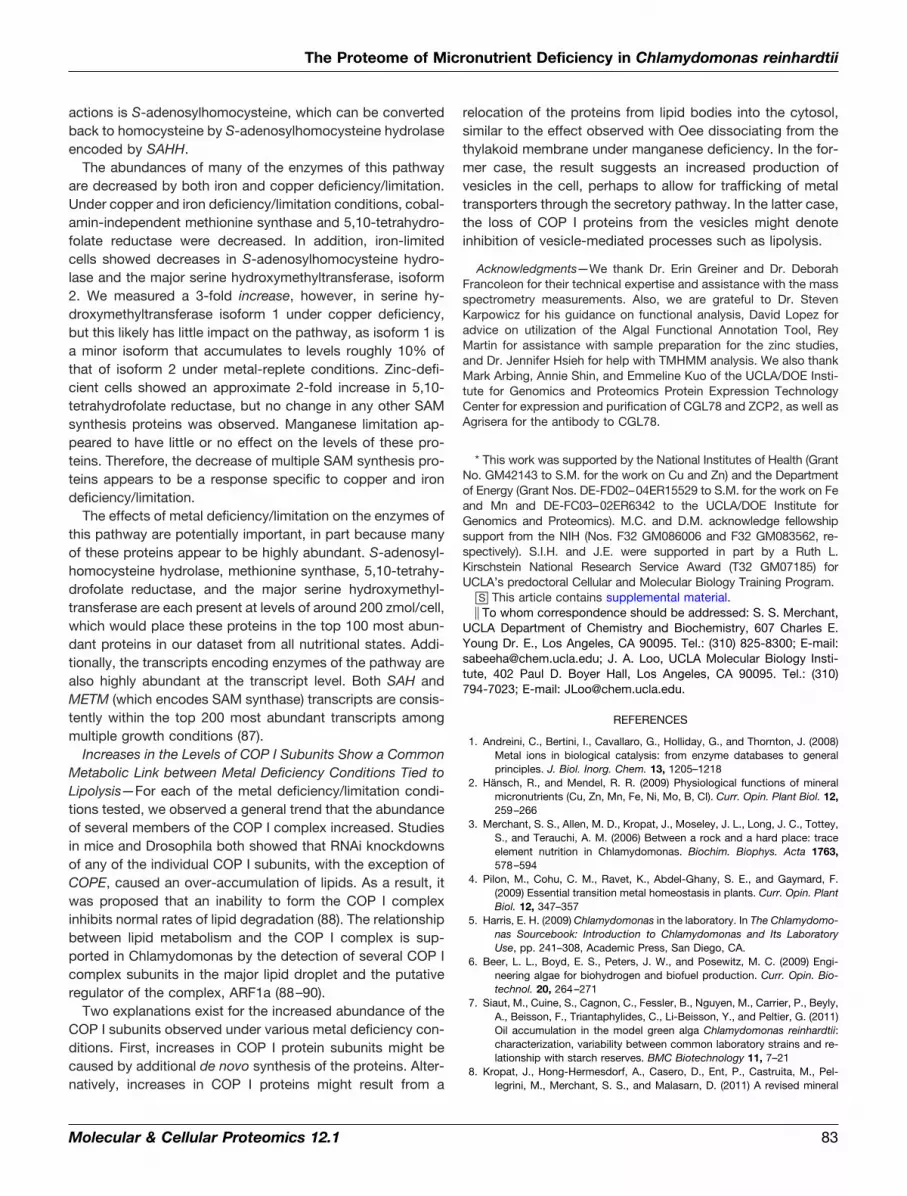
actions is S-adenosylhomocysteine, which can be convertedback to homocysteine by S-adenosylhomocysteine hydrolaseencoded by SAHH.
The abundances of many of the enzymes of this pathwayare decreased by both iron and copper deficiency/limitation.Under copper and iron deficiency/limitation conditions, cobal-amin-independent methionine synthase and 5,10-tetrahydro-folate reductase were decreased. In addition, iron-limitedcells showed decreases in S-adenosylhomocysteine hydro-lase and the major serine hydroxymethyltransferase, isoform2. We measured a 3-fold increase, however, in serine hy-droxymethyltransferase isoform 1 under copper deficiency,but this likely has little impact on the pathway, as isoform 1 isa minor isoform that accumulates to levels roughly 10% ofthat of isoform 2 under metal-replete conditions. Zinc-defi-cient cells showed an approximate 2-fold increase in 5,10-tetrahydrofolate reductase, but no change in any other SAMsynthesis proteins was observed. Manganese limitation ap-peared to have little or no effect on the levels of these pro-teins. Therefore, the decrease of multiple SAM synthesis pro-teins appears to be a response specific to copper and irondeficiency/limitation.
The effects of metal deficiency/limitation on the enzymes ofthis pathway are potentially important, in part because manyof these proteins appear to be highly abundant. S-adenosyl-homocysteine hydrolase, methionine synthase, 5,10-tetrahy-drofolate reductase, and the major serine hydroxymethyl-transferase are each present at levels of around 200 zmol/cell,which would place these proteins in the top 100 most abun-dant proteins in our dataset from all nutritional states. Addi-tionally, the transcripts encoding enzymes of the pathway arealso highly abundant at the transcript level. Both SAH andMETM (which encodes SAM synthase) transcripts are consis-tently within the top 200 most abundant transcripts amongmultiple growth conditions (87).
Increases in the Levels of COP I Subunits Show a CommonMetabolic Link between Metal Deficiency Conditions Tied toLipolysis—For each of the metal deficiency/limitation condi-tions tested, we observed a general trend that the abundanceof several members of the COP I complex increased. Studiesin mice and Drosophila both showed that RNAi knockdownsof any of the individual COP I subunits, with the exception ofCOPE, caused an over-accumulation of lipids. As a result, itwas proposed that an inability to form the COP I complexinhibits normal rates of lipid degradation (88). The relationshipbetween lipid metabolism and the COP I complex is sup-ported in Chlamydomonas by the detection of several COP Icomplex subunits in the major lipid droplet and the putativeregulator of the complex, ARF1a (88–90).
Two explanations exist for the increased abundance of theCOP I subunits observed under various metal deficiency con-ditions. First, increases in COP I protein subunits might becaused by additional de novo synthesis of the proteins. Alter-natively, increases in COP I proteins might result from a
relocation of the proteins from lipid bodies into the cytosol,similar to the effect observed with Oee dissociating from thethylakoid membrane under manganese deficiency. In the for-mer case, the result suggests an increased production ofvesicles in the cell, perhaps to allow for trafficking of metaltransporters through the secretory pathway. In the latter case,the loss of COP I proteins from the vesicles might denoteinhibition of vesicle-mediated processes such as lipolysis.
Acknowledgments—We thank Dr. Erin Greiner and Dr. DeborahFrancoleon for their technical expertise and assistance with the massspectrometry measurements. Also, we are grateful to Dr. StevenKarpowicz for his guidance on functional analysis, David Lopez foradvice on utilization of the Algal Functional Annotation Tool, ReyMartin for assistance with sample preparation for the zinc studies,and Dr. Jennifer Hsieh for help with TMHMM analysis. We also thankMark Arbing, Annie Shin, and Emmeline Kuo of the UCLA/DOE Insti-tute for Genomics and Proteomics Protein Expression TechnologyCenter for expression and purification of CGL78 and ZCP2, as well asAgrisera for the antibody to CGL78.
* This work was supported by the National Institutes of Health (GrantNo. GM42143 to S.M. for the work on Cu and Zn) and the Departmentof Energy (Grant Nos. DE-FD02–04ER15529 to S.M. for the work on Feand Mn and DE-FC03–02ER6342 to the UCLA/DOE Institute forGenomics and Proteomics). M.C. and D.M. acknowledge fellowshipsupport from the NIH (Nos. F32 GM086006 and F32 GM083562, re-spectively). S.I.H. and J.E. were supported in part by a Ruth L.Kirschstein National Research Service Award (T32 GM07185) forUCLA’s predoctoral Cellular and Molecular Biology Training Program.
□S This article contains supplemental material.� To whom correspondence should be addressed: S. S. Merchant,
UCLA Department of Chemistry and Biochemistry, 607 Charles E.Young Dr. E., Los Angeles, CA 90095. Tel.: (310) 825-8300; E-mail:[email protected]; J. A. Loo, UCLA Molecular Biology Insti-tute, 402 Paul D. Boyer Hall, Los Angeles, CA 90095. Tel.: (310)794-7023; E-mail: [email protected].
REFERENCES
1. Andreini, C., Bertini, I., Cavallaro, G., Holliday, G., and Thornton, J. (2008)Metal ions in biological catalysis: from enzyme databases to generalprinciples. J. Biol. Inorg. Chem. 13, 1205–1218
2. Hansch, R., and Mendel, R. R. (2009) Physiological functions of mineralmicronutrients (Cu, Zn, Mn, Fe, Ni, Mo, B, Cl). Curr. Opin. Plant Biol. 12,259–266
3. Merchant, S. S., Allen, M. D., Kropat, J., Moseley, J. L., Long, J. C., Tottey,S., and Terauchi, A. M. (2006) Between a rock and a hard place: traceelement nutrition in Chlamydomonas. Biochim. Biophys. Acta 1763,578–594
4. Pilon, M., Cohu, C. M., Ravet, K., Abdel-Ghany, S. E., and Gaymard, F.(2009) Essential transition metal homeostasis in plants. Curr. Opin. PlantBiol. 12, 347–357
5. Harris, E. H. (2009) Chlamydomonas in the laboratory. In The Chlamydomo-nas Sourcebook: Introduction to Chlamydomonas and Its LaboratoryUse, pp. 241–308, Academic Press, San Diego, CA.
6. Beer, L. L., Boyd, E. S., Peters, J. W., and Posewitz, M. C. (2009) Engi-neering algae for biohydrogen and biofuel production. Curr. Opin. Bio-technol. 20, 264–271
7. Siaut, M., Cuine, S., Cagnon, C., Fessler, B., Nguyen, M., Carrier, P., Beyly,A., Beisson, F., Triantaphylides, C., Li-Beisson, Y., and Peltier, G. (2011)Oil accumulation in the model green alga Chlamydomonas reinhardtii:characterization, variability between common laboratory strains and re-lationship with starch reserves. BMC Biotechnology 11, 7–21
8. Kropat, J., Hong-Hermesdorf, A., Casero, D., Ent, P., Castruita, M., Pel-legrini, M., Merchant, S. S., and Malasarn, D. (2011) A revised mineral
The Proteome of Micronutrient Deficiency in Chlamydomonas reinhardtii
Molecular & Cellular Proteomics 12.1 83
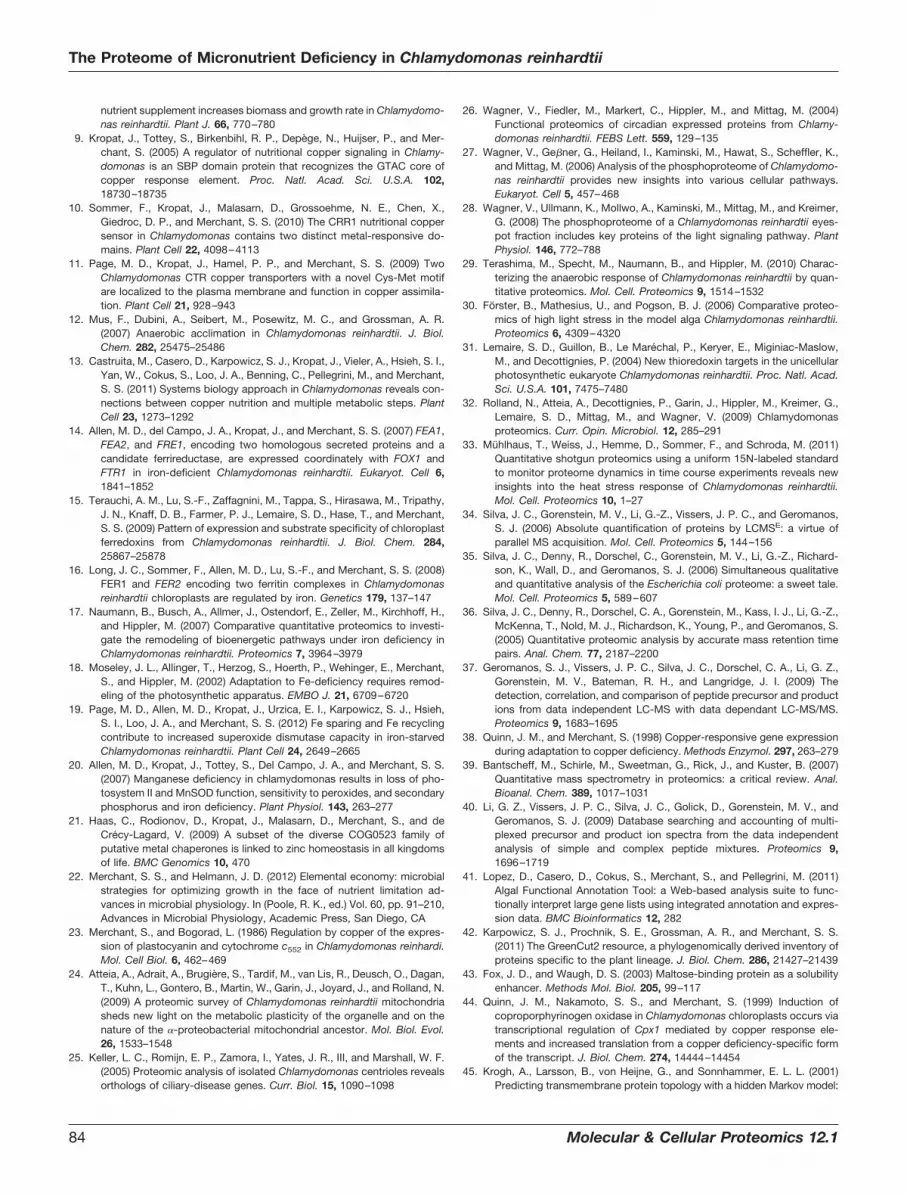
nutrient supplement increases biomass and growth rate in Chlamydomo-nas reinhardtii. Plant J. 66, 770–780
9. Kropat, J., Tottey, S., Birkenbihl, R. P., Depege, N., Huijser, P., and Mer-chant, S. (2005) A regulator of nutritional copper signaling in Chlamy-domonas is an SBP domain protein that recognizes the GTAC core ofcopper response element. Proc. Natl. Acad. Sci. U.S.A. 102,18730–18735
10. Sommer, F., Kropat, J., Malasarn, D., Grossoehme, N. E., Chen, X.,Giedroc, D. P., and Merchant, S. S. (2010) The CRR1 nutritional coppersensor in Chlamydomonas contains two distinct metal-responsive do-mains. Plant Cell 22, 4098–4113
11. Page, M. D., Kropat, J., Hamel, P. P., and Merchant, S. S. (2009) TwoChlamydomonas CTR copper transporters with a novel Cys-Met motifare localized to the plasma membrane and function in copper assimila-tion. Plant Cell 21, 928–943
12. Mus, F., Dubini, A., Seibert, M., Posewitz, M. C., and Grossman, A. R.(2007) Anaerobic acclimation in Chlamydomonas reinhardtii. J. Biol.Chem. 282, 25475–25486
13. Castruita, M., Casero, D., Karpowicz, S. J., Kropat, J., Vieler, A., Hsieh, S. I.,Yan, W., Cokus, S., Loo, J. A., Benning, C., Pellegrini, M., and Merchant,S. S. (2011) Systems biology approach in Chlamydomonas reveals con-nections between copper nutrition and multiple metabolic steps. PlantCell 23, 1273–1292
14. Allen, M. D., del Campo, J. A., Kropat, J., and Merchant, S. S. (2007) FEA1,FEA2, and FRE1, encoding two homologous secreted proteins and acandidate ferrireductase, are expressed coordinately with FOX1 andFTR1 in iron-deficient Chlamydomonas reinhardtii. Eukaryot. Cell 6,1841–1852
15. Terauchi, A. M., Lu, S.-F., Zaffagnini, M., Tappa, S., Hirasawa, M., Tripathy,J. N., Knaff, D. B., Farmer, P. J., Lemaire, S. D., Hase, T., and Merchant,S. S. (2009) Pattern of expression and substrate specificity of chloroplastferredoxins from Chlamydomonas reinhardtii. J. Biol. Chem. 284,25867–25878
16. Long, J. C., Sommer, F., Allen, M. D., Lu, S.-F., and Merchant, S. S. (2008)FER1 and FER2 encoding two ferritin complexes in Chlamydomonasreinhardtii chloroplasts are regulated by iron. Genetics 179, 137–147
17. Naumann, B., Busch, A., Allmer, J., Ostendorf, E., Zeller, M., Kirchhoff, H.,and Hippler, M. (2007) Comparative quantitative proteomics to investi-gate the remodeling of bioenergetic pathways under iron deficiency inChlamydomonas reinhardtii. Proteomics 7, 3964–3979
18. Moseley, J. L., Allinger, T., Herzog, S., Hoerth, P., Wehinger, E., Merchant,S., and Hippler, M. (2002) Adaptation to Fe-deficiency requires remod-eling of the photosynthetic apparatus. EMBO J. 21, 6709–6720
19. Page, M. D., Allen, M. D., Kropat, J., Urzica, E. I., Karpowicz, S. J., Hsieh,S. I., Loo, J. A., and Merchant, S. S. (2012) Fe sparing and Fe recyclingcontribute to increased superoxide dismutase capacity in iron-starvedChlamydomonas reinhardtii. Plant Cell 24, 2649–2665
20. Allen, M. D., Kropat, J., Tottey, S., Del Campo, J. A., and Merchant, S. S.(2007) Manganese deficiency in chlamydomonas results in loss of pho-tosystem II and MnSOD function, sensitivity to peroxides, and secondaryphosphorus and iron deficiency. Plant Physiol. 143, 263–277
21. Haas, C., Rodionov, D., Kropat, J., Malasarn, D., Merchant, S., and deCrecy-Lagard, V. (2009) A subset of the diverse COG0523 family ofputative metal chaperones is linked to zinc homeostasis in all kingdomsof life. BMC Genomics 10, 470
22. Merchant, S. S., and Helmann, J. D. (2012) Elemental economy: microbialstrategies for optimizing growth in the face of nutrient limitation ad-vances in microbial physiology. In (Poole, R. K., ed.) Vol. 60, pp. 91–210,Advances in Microbial Physiology, Academic Press, San Diego, CA
23. Merchant, S., and Bogorad, L. (1986) Regulation by copper of the expres-sion of plastocyanin and cytochrome c552 in Chlamydomonas reinhardi.Mol. Cell Biol. 6, 462–469
24. Atteia, A., Adrait, A., Brugiere, S., Tardif, M., van Lis, R., Deusch, O., Dagan,T., Kuhn, L., Gontero, B., Martin, W., Garin, J., Joyard, J., and Rolland, N.(2009) A proteomic survey of Chlamydomonas reinhardtii mitochondriasheds new light on the metabolic plasticity of the organelle and on thenature of the �-proteobacterial mitochondrial ancestor. Mol. Biol. Evol.26, 1533–1548
25. Keller, L. C., Romijn, E. P., Zamora, I., Yates, J. R., III, and Marshall, W. F.(2005) Proteomic analysis of isolated Chlamydomonas centrioles revealsorthologs of ciliary-disease genes. Curr. Biol. 15, 1090–1098
26. Wagner, V., Fiedler, M., Markert, C., Hippler, M., and Mittag, M. (2004)Functional proteomics of circadian expressed proteins from Chlamy-domonas reinhardtii. FEBS Lett. 559, 129–135
27. Wagner, V., Ge�ner, G., Heiland, I., Kaminski, M., Hawat, S., Scheffler, K.,and Mittag, M. (2006) Analysis of the phosphoproteome of Chlamydomo-nas reinhardtii provides new insights into various cellular pathways.Eukaryot. Cell 5, 457–468
28. Wagner, V., Ullmann, K., Mollwo, A., Kaminski, M., Mittag, M., and Kreimer,G. (2008) The phosphoproteome of a Chlamydomonas reinhardtii eyes-pot fraction includes key proteins of the light signaling pathway. PlantPhysiol. 146, 772–788
29. Terashima, M., Specht, M., Naumann, B., and Hippler, M. (2010) Charac-terizing the anaerobic response of Chlamydomonas reinhardtii by quan-titative proteomics. Mol. Cell. Proteomics 9, 1514–1532
30. Forster, B., Mathesius, U., and Pogson, B. J. (2006) Comparative proteo-mics of high light stress in the model alga Chlamydomonas reinhardtii.Proteomics 6, 4309–4320
31. Lemaire, S. D., Guillon, B., Le Marechal, P., Keryer, E., Miginiac-Maslow,M., and Decottignies, P. (2004) New thioredoxin targets in the unicellularphotosynthetic eukaryote Chlamydomonas reinhardtii. Proc. Natl. Acad.Sci. U.S.A. 101, 7475–7480
32. Rolland, N., Atteia, A., Decottignies, P., Garin, J., Hippler, M., Kreimer, G.,Lemaire, S. D., Mittag, M., and Wagner, V. (2009) Chlamydomonasproteomics. Curr. Opin. Microbiol. 12, 285–291
33. Muhlhaus, T., Weiss, J., Hemme, D., Sommer, F., and Schroda, M. (2011)Quantitative shotgun proteomics using a uniform 15N-labeled standardto monitor proteome dynamics in time course experiments reveals newinsights into the heat stress response of Chlamydomonas reinhardtii.Mol. Cell. Proteomics 10, 1–27
34. Silva, J. C., Gorenstein, M. V., Li, G.-Z., Vissers, J. P. C., and Geromanos,S. J. (2006) Absolute quantification of proteins by LCMSE: a virtue ofparallel MS acquisition. Mol. Cell. Proteomics 5, 144–156
35. Silva, J. C., Denny, R., Dorschel, C., Gorenstein, M. V., Li, G.-Z., Richard-son, K., Wall, D., and Geromanos, S. J. (2006) Simultaneous qualitativeand quantitative analysis of the Escherichia coli proteome: a sweet tale.Mol. Cell. Proteomics 5, 589–607
36. Silva, J. C., Denny, R., Dorschel, C. A., Gorenstein, M., Kass, I. J., Li, G.-Z.,McKenna, T., Nold, M. J., Richardson, K., Young, P., and Geromanos, S.(2005) Quantitative proteomic analysis by accurate mass retention timepairs. Anal. Chem. 77, 2187–2200
37. Geromanos, S. J., Vissers, J. P. C., Silva, J. C., Dorschel, C. A., Li, G. Z.,Gorenstein, M. V., Bateman, R. H., and Langridge, J. I. (2009) Thedetection, correlation, and comparison of peptide precursor and productions from data independent LC-MS with data dependant LC-MS/MS.Proteomics 9, 1683–1695
38. Quinn, J. M., and Merchant, S. (1998) Copper-responsive gene expressionduring adaptation to copper deficiency. Methods Enzymol. 297, 263–279
39. Bantscheff, M., Schirle, M., Sweetman, G., Rick, J., and Kuster, B. (2007)Quantitative mass spectrometry in proteomics: a critical review. Anal.Bioanal. Chem. 389, 1017–1031
40. Li, G. Z., Vissers, J. P. C., Silva, J. C., Golick, D., Gorenstein, M. V., andGeromanos, S. J. (2009) Database searching and accounting of multi-plexed precursor and product ion spectra from the data independentanalysis of simple and complex peptide mixtures. Proteomics 9,1696–1719
41. Lopez, D., Casero, D., Cokus, S., Merchant, S., and Pellegrini, M. (2011)Algal Functional Annotation Tool: a Web-based analysis suite to func-tionally interpret large gene lists using integrated annotation and expres-sion data. BMC Bioinformatics 12, 282
42. Karpowicz, S. J., Prochnik, S. E., Grossman, A. R., and Merchant, S. S.(2011) The GreenCut2 resource, a phylogenomically derived inventory ofproteins specific to the plant lineage. J. Biol. Chem. 286, 21427–21439
43. Fox, J. D., and Waugh, D. S. (2003) Maltose-binding protein as a solubilityenhancer. Methods Mol. Biol. 205, 99–117
44. Quinn, J. M., Nakamoto, S. S., and Merchant, S. (1999) Induction ofcoproporphyrinogen oxidase in Chlamydomonas chloroplasts occurs viatranscriptional regulation of Cpx1 mediated by copper response ele-ments and increased translation from a copper deficiency-specific formof the transcript. J. Biol. Chem. 274, 14444–14454
45. Krogh, A., Larsson, B., von Heijne, G., and Sonnhammer, E. L. L. (2001)Predicting transmembrane protein topology with a hidden Markov model:
The Proteome of Micronutrient Deficiency in Chlamydomonas reinhardtii
84 Molecular & Cellular Proteomics 12.1
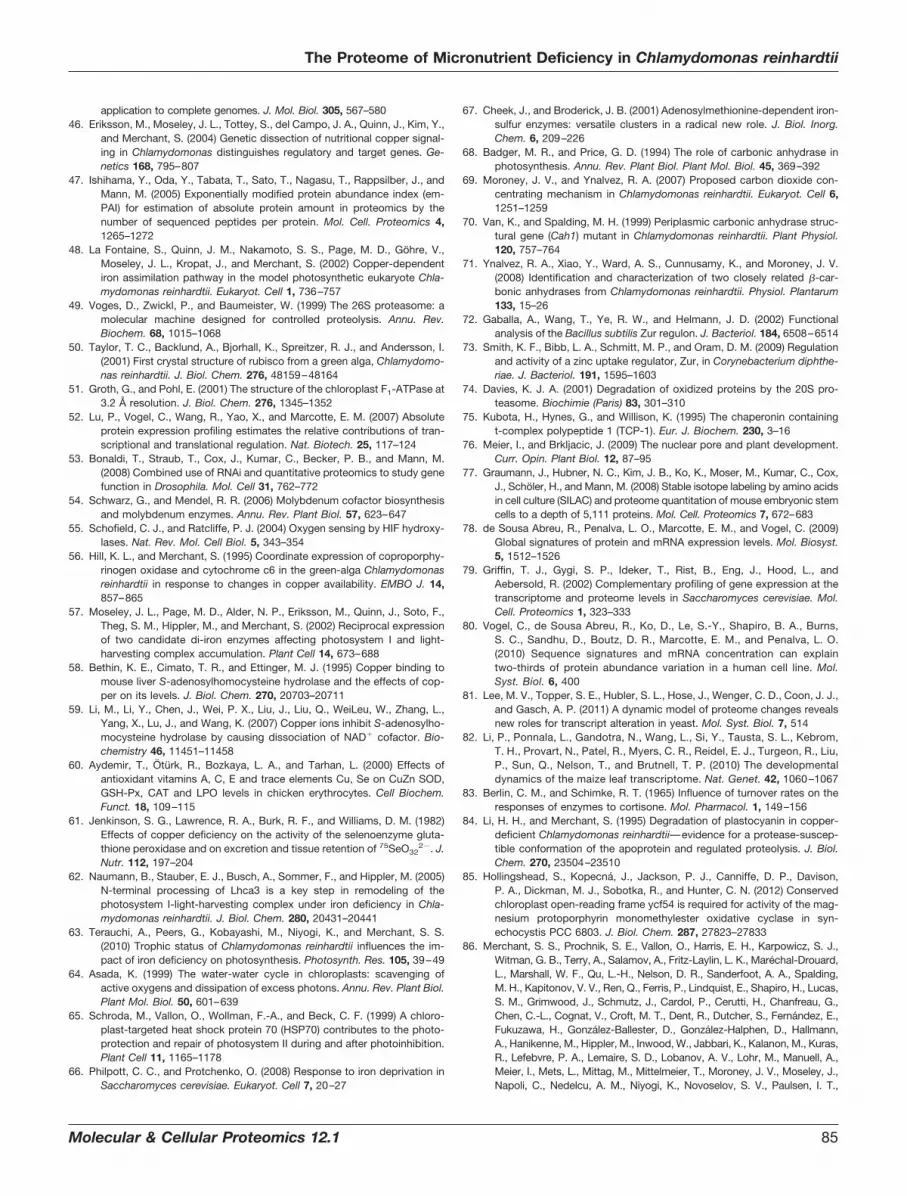
application to complete genomes. J. Mol. Biol. 305, 567–58046. Eriksson, M., Moseley, J. L., Tottey, S., del Campo, J. A., Quinn, J., Kim, Y.,
and Merchant, S. (2004) Genetic dissection of nutritional copper signal-ing in Chlamydomonas distinguishes regulatory and target genes. Ge-netics 168, 795–807
47. Ishihama, Y., Oda, Y., Tabata, T., Sato, T., Nagasu, T., Rappsilber, J., andMann, M. (2005) Exponentially modified protein abundance index (em-PAI) for estimation of absolute protein amount in proteomics by thenumber of sequenced peptides per protein. Mol. Cell. Proteomics 4,1265–1272
48. La Fontaine, S., Quinn, J. M., Nakamoto, S. S., Page, M. D., Gohre, V.,Moseley, J. L., Kropat, J., and Merchant, S. (2002) Copper-dependentiron assimilation pathway in the model photosynthetic eukaryote Chla-mydomonas reinhardtii. Eukaryot. Cell 1, 736–757
49. Voges, D., Zwickl, P., and Baumeister, W. (1999) The 26S proteasome: amolecular machine designed for controlled proteolysis. Annu. Rev.Biochem. 68, 1015–1068
50. Taylor, T. C., Backlund, A., Bjorhall, K., Spreitzer, R. J., and Andersson, I.(2001) First crystal structure of rubisco from a green alga, Chlamydomo-nas reinhardtii. J. Biol. Chem. 276, 48159–48164
51. Groth, G., and Pohl, E. (2001) The structure of the chloroplast F1-ATPase at3.2 Å resolution. J. Biol. Chem. 276, 1345–1352
52. Lu, P., Vogel, C., Wang, R., Yao, X., and Marcotte, E. M. (2007) Absoluteprotein expression profiling estimates the relative contributions of tran-scriptional and translational regulation. Nat. Biotech. 25, 117–124
53. Bonaldi, T., Straub, T., Cox, J., Kumar, C., Becker, P. B., and Mann, M.(2008) Combined use of RNAi and quantitative proteomics to study genefunction in Drosophila. Mol. Cell 31, 762–772
54. Schwarz, G., and Mendel, R. R. (2006) Molybdenum cofactor biosynthesisand molybdenum enzymes. Annu. Rev. Plant Biol. 57, 623–647
55. Schofield, C. J., and Ratcliffe, P. J. (2004) Oxygen sensing by HIF hydroxy-lases. Nat. Rev. Mol. Cell Biol. 5, 343–354
56. Hill, K. L., and Merchant, S. (1995) Coordinate expression of coproporphy-rinogen oxidase and cytochrome c6 in the green-alga Chlamydomonasreinhardtii in response to changes in copper availability. EMBO J. 14,857–865
57. Moseley, J. L., Page, M. D., Alder, N. P., Eriksson, M., Quinn, J., Soto, F.,Theg, S. M., Hippler, M., and Merchant, S. (2002) Reciprocal expressionof two candidate di-iron enzymes affecting photosystem I and light-harvesting complex accumulation. Plant Cell 14, 673–688
58. Bethin, K. E., Cimato, T. R., and Ettinger, M. J. (1995) Copper binding tomouse liver S-adenosylhomocysteine hydrolase and the effects of cop-per on its levels. J. Biol. Chem. 270, 20703–20711
59. Li, M., Li, Y., Chen, J., Wei, P. X., Liu, J., Liu, Q., WeiLeu, W., Zhang, L.,Yang, X., Lu, J., and Wang, K. (2007) Copper ions inhibit S-adenosylho-mocysteine hydrolase by causing dissociation of NAD� cofactor. Bio-chemistry 46, 11451–11458
60. Aydemir, T., Oturk, R., Bozkaya, L. A., and Tarhan, L. (2000) Effects ofantioxidant vitamins A, C, E and trace elements Cu, Se on CuZn SOD,GSH-Px, CAT and LPO levels in chicken erythrocytes. Cell Biochem.Funct. 18, 109–115
61. Jenkinson, S. G., Lawrence, R. A., Burk, R. F., and Williams, D. M. (1982)Effects of copper deficiency on the activity of the selenoenzyme gluta-thione peroxidase and on excretion and tissue retention of 75SeO32
2�. J.Nutr. 112, 197–204
62. Naumann, B., Stauber, E. J., Busch, A., Sommer, F., and Hippler, M. (2005)N-terminal processing of Lhca3 is a key step in remodeling of thephotosystem I-light-harvesting complex under iron deficiency in Chla-mydomonas reinhardtii. J. Biol. Chem. 280, 20431–20441
63. Terauchi, A., Peers, G., Kobayashi, M., Niyogi, K., and Merchant, S. S.(2010) Trophic status of Chlamydomonas reinhardtii influences the im-pact of iron deficiency on photosynthesis. Photosynth. Res. 105, 39–49
64. Asada, K. (1999) The water-water cycle in chloroplasts: scavenging ofactive oxygens and dissipation of excess photons. Annu. Rev. Plant Biol.Plant Mol. Biol. 50, 601–639
65. Schroda, M., Vallon, O., Wollman, F.-A., and Beck, C. F. (1999) A chloro-plast-targeted heat shock protein 70 (HSP70) contributes to the photo-protection and repair of photosystem II during and after photoinhibition.Plant Cell 11, 1165–1178
66. Philpott, C. C., and Protchenko, O. (2008) Response to iron deprivation inSaccharomyces cerevisiae. Eukaryot. Cell 7, 20–27
67. Cheek, J., and Broderick, J. B. (2001) Adenosylmethionine-dependent iron-sulfur enzymes: versatile clusters in a radical new role. J. Biol. Inorg.Chem. 6, 209–226
68. Badger, M. R., and Price, G. D. (1994) The role of carbonic anhydrase inphotosynthesis. Annu. Rev. Plant Biol. Plant Mol. Biol. 45, 369–392
69. Moroney, J. V., and Ynalvez, R. A. (2007) Proposed carbon dioxide con-centrating mechanism in Chlamydomonas reinhardtii. Eukaryot. Cell 6,1251–1259
70. Van, K., and Spalding, M. H. (1999) Periplasmic carbonic anhydrase struc-tural gene (Cah1) mutant in Chlamydomonas reinhardtii. Plant Physiol.120, 757–764
71. Ynalvez, R. A., Xiao, Y., Ward, A. S., Cunnusamy, K., and Moroney, J. V.(2008) Identification and characterization of two closely related �-car-bonic anhydrases from Chlamydomonas reinhardtii. Physiol. Plantarum133, 15–26
72. Gaballa, A., Wang, T., Ye, R. W., and Helmann, J. D. (2002) Functionalanalysis of the Bacillus subtilis Zur regulon. J. Bacteriol. 184, 6508–6514
73. Smith, K. F., Bibb, L. A., Schmitt, M. P., and Oram, D. M. (2009) Regulationand activity of a zinc uptake regulator, Zur, in Corynebacterium diphthe-riae. J. Bacteriol. 191, 1595–1603
74. Davies, K. J. A. (2001) Degradation of oxidized proteins by the 20S pro-teasome. Biochimie (Paris) 83, 301–310
75. Kubota, H., Hynes, G., and Willison, K. (1995) The chaperonin containingt-complex polypeptide 1 (TCP-1). Eur. J. Biochem. 230, 3–16
76. Meier, I., and Brkljacic, J. (2009) The nuclear pore and plant development.Curr. Opin. Plant Biol. 12, 87–95
77. Graumann, J., Hubner, N. C., Kim, J. B., Ko, K., Moser, M., Kumar, C., Cox,J., Scholer, H., and Mann, M. (2008) Stable isotope labeling by amino acidsin cell culture (SILAC) and proteome quantitation of mouse embryonic stemcells to a depth of 5,111 proteins. Mol. Cell. Proteomics 7, 672–683
78. de Sousa Abreu, R., Penalva, L. O., Marcotte, E. M., and Vogel, C. (2009)Global signatures of protein and mRNA expression levels. Mol. Biosyst.5, 1512–1526
79. Griffin, T. J., Gygi, S. P., Ideker, T., Rist, B., Eng, J., Hood, L., andAebersold, R. (2002) Complementary profiling of gene expression at thetranscriptome and proteome levels in Saccharomyces cerevisiae. Mol.Cell. Proteomics 1, 323–333
80. Vogel, C., de Sousa Abreu, R., Ko, D., Le, S.-Y., Shapiro, B. A., Burns,S. C., Sandhu, D., Boutz, D. R., Marcotte, E. M., and Penalva, L. O.(2010) Sequence signatures and mRNA concentration can explaintwo-thirds of protein abundance variation in a human cell line. Mol.Syst. Biol. 6, 400
81. Lee, M. V., Topper, S. E., Hubler, S. L., Hose, J., Wenger, C. D., Coon, J. J.,and Gasch, A. P. (2011) A dynamic model of proteome changes revealsnew roles for transcript alteration in yeast. Mol. Syst. Biol. 7, 514
82. Li, P., Ponnala, L., Gandotra, N., Wang, L., Si, Y., Tausta, S. L., Kebrom,T. H., Provart, N., Patel, R., Myers, C. R., Reidel, E. J., Turgeon, R., Liu,P., Sun, Q., Nelson, T., and Brutnell, T. P. (2010) The developmentaldynamics of the maize leaf transcriptome. Nat. Genet. 42, 1060–1067
83. Berlin, C. M., and Schimke, R. T. (1965) Influence of turnover rates on theresponses of enzymes to cortisone. Mol. Pharmacol. 1, 149–156
84. Li, H. H., and Merchant, S. (1995) Degradation of plastocyanin in copper-deficient Chlamydomonas reinhardtii—evidence for a protease-suscep-tible conformation of the apoprotein and regulated proteolysis. J. Biol.Chem. 270, 23504–23510
85. Hollingshead, S., Kopecna, J., Jackson, P. J., Canniffe, D. P., Davison,P. A., Dickman, M. J., Sobotka, R., and Hunter, C. N. (2012) Conservedchloroplast open-reading frame ycf54 is required for activity of the mag-nesium protoporphyrin monomethylester oxidative cyclase in syn-echocystis PCC 6803. J. Biol. Chem. 287, 27823–27833
86. Merchant, S. S., Prochnik, S. E., Vallon, O., Harris, E. H., Karpowicz, S. J.,Witman, G. B., Terry, A., Salamov, A., Fritz-Laylin, L. K., Marechal-Drouard,L., Marshall, W. F., Qu, L.-H., Nelson, D. R., Sanderfoot, A. A., Spalding,M. H., Kapitonov, V. V., Ren, Q., Ferris, P., Lindquist, E., Shapiro, H., Lucas,S. M., Grimwood, J., Schmutz, J., Cardol, P., Cerutti, H., Chanfreau, G.,Chen, C.-L., Cognat, V., Croft, M. T., Dent, R., Dutcher, S., Fernandez, E.,Fukuzawa, H., Gonzalez-Ballester, D., Gonzalez-Halphen, D., Hallmann,A., Hanikenne, M., Hippler, M., Inwood, W., Jabbari, K., Kalanon, M., Kuras,R., Lefebvre, P. A., Lemaire, S. D., Lobanov, A. V., Lohr, M., Manuell, A.,Meier, I., Mets, L., Mittag, M., Mittelmeier, T., Moroney, J. V., Moseley, J.,Napoli, C., Nedelcu, A. M., Niyogi, K., Novoselov, S. V., Paulsen, I. T.,
The Proteome of Micronutrient Deficiency in Chlamydomonas reinhardtii
Molecular & Cellular Proteomics 12.1 85

Pazour, G., Purton, S., Ral, J.-P., Riano-Pachon, D. M., Riekhof, W., Ry-marquis, L., Schroda, M., Stern, D., Umen, J., Willows, R., Wilson, N.,Zimmer, S. L., Allmer, J., Balk, J., Bisova, K., Chen, C.-J., Elias, M.,Gendler, K., Hauser, C., Lamb, M. R., Ledford, H., Long, J. C., Minagawa,J., Page, M. D., Pan, J., Pootakham, W., Roje, S., Rose, A., Stahlberg, E.,Terauchi, A. M., Yang, P., Ball, S., Bowler, C., Dieckmann, C. L., Gladyshev,V. N., Green, P., Jorgensen, R., Mayfield, S., Mueller-Roeber, B., Rajamani,S., Sayre, R. T., Brokstein, P., Dubchak, I., Goodstein, D., Hornick, L.,Huang, Y. W., Jhaveri, J., Luo, Y., Martínez, D., Ngau, W. C. A., Otillar, B.,Poliakov, A., Porter, A., Szajkowski, L., Werner, G., Zhou, K., Grigoriev, I. V.,Rokhsar, D. S., and Grossman, A. R. (2007) The Chlamydomonas genomereveals the evolution of key animal and plant functions. Science 318,245–250
87. Karpowicz, S. J. (2011) Genomics and Transcriptomics of Algae and Plants.PhD thesis, University of California, Los Angeles
88. Beller, M., Sztalryd, C., Southall, N., Bell, M., Jackle, H., Auld, D. S., andOliver, B. (2008) COPI complex is a regulator of lipid homeostasis. PLoSBiol. 6, 2530–2549
89. Moellering, E. R., and Benning, C. (2010) RNA interference silencing of amajor lipid droplet protein affects lipid droplet size in Chlamydomonasreinhardtii. Eukaryot. Cell 9, 97–106
90. Nguyen, H. M., Baudet, M., Cuine, S., Adriano, J.-M., Barthe, D., Billon, E.,Bruley, C., Beisson, F., Peltier, G., Ferro, M., and Li-Beisson, Y. (2011)Proteomic profiling of oil bodies isolated from the unicellular greenmicroalga Chlamydomonas reinhardtii: with focus on proteins involved in
lipid metabolism. Proteomics 11, 4266–427391. Hsieh, S. I., Castruita, M., Malasarn D., Urzica E., Erde J., Page, M. D.,
Yamasaki H., Casero D., Matteo Pellegrini, M., Merchant, S. S., and Loo,J. A., (2012) The Proteome of Copper, Iron, Zinc, and Manganese Mi-cronutrient Deficiency in Chlamydomonas reinhardtii. Mol. Cell Proteom-ics 12, 65–86
92. Schmidt, M., Geßner, G., Luff, M., Heiland, I., Wagner, V., Kaminski, M.,Geimer, S., Eitzinger, N., Reißenweber, T., Voytsekh, O., Fiedler, M.,Mittag, M., and Kreimer, G. (2006) Proteomic analysis of the eyespot ofChlamydomonas reinhardtii provides novel insights into its componentsand tactic movements. Plant Cell 18, 1908–1930
93. Yamaguchi, K., Beligni, M. V., Prieto, S., Haynes, P. A., McDonald, W. H.,Yates, J. R., and Mayfield, S. P. (2003) Proteomic characterization of theChlamydomonas reinhardtii chloroplast ribosome. Identification of theproteins unique to the 70S ribosome. J. Biol. Chem. 278, 33774–33785
94. Michelet, L., Zaffagnini, M., Vanacker, H., Le Marechal, P., Marchand, C.,Schroda, M., Lemaire, S. D., and Decottignies, P. (2008) In vivo targets ofS-thiolation in Chlamydomonas reinhardtii. J. Biol. Chem. 283,21571–21578
95. Yamaguchi, K., Prieto, S., Beligni, M. V., Haynes, P. A., McDonald, W. H.,Yates, J. R., and Mayfield, S. P. (2002) Proteomic characterization of thesmall subunit of Chlamydomonas reinhardtii chloroplast ribosome: iden-tification of a novel S1 domain-containing protein and unusually largeorthologs of bacterial S2, S3, and S5. Plant Cell 14, 2957–2974
The Proteome of Micronutrient Deficiency in Chlamydomonas reinhardtii
86 Molecular & Cellular Proteomics 12.1


