Embed Size (px)
Citation preview
Florida International UniversityFIU Digital Commons
FIU Electronic Theses and Dissertations University Graduate School
3-26-2015
Workplace Discrimination Climate and TeamEffectiveness: The Mediating Role of CollectiveValue Congruence, Team Cohesion, and CollectiveAffective CommitmentAnya T. EdunFlorida International University, [email protected]
DOI: 10.25148/etd.FI15032174Follow this and additional works at: https://digitalcommons.fiu.edu/etd
Part of the Applied Behavior Analysis Commons, Industrial and Organizational PsychologyCommons, Multicultural Psychology Commons, Organizational Behavior and Theory Commons,Other Social and Behavioral Sciences Commons, and the Social Psychology Commons
This work is brought to you for free and open access by the University Graduate School at FIU Digital Commons. It has been accepted for inclusion inFIU Electronic Theses and Dissertations by an authorized administrator of FIU Digital Commons. For more information, please contact [email protected].
Recommended CitationEdun, Anya T., "Workplace Discrimination Climate and Team Effectiveness: The Mediating Role of Collective Value Congruence,Team Cohesion, and Collective Affective Commitment" (2015). FIU Electronic Theses and Dissertations. 1761.https://digitalcommons.fiu.edu/etd/1761
FLORIDA INTERNATIONAL UNIVERSITY
Miami, Florida
WORKPLACE DISCRIMINATION CLIMATE AND TEAM EFFECTIVENESS:
THE MEDIATING ROLE OF COLLECTIVE VALUE CONGRUENCE, TEAM
COHESION, AND COLLECTIVE AFFECTIVE COMMITMENT
A dissertation submitted in partial fulfillment
of the requirements for the degree of
DOCTOR OF PHILOSOPHY
in
PSYCHOLOGY
by
Anya T. Edun
2015
ii
To: Dean Michael R. Heithaus College of Arts and Sciences
This dissertation, written by Anya T. Edun, and entitled Workplace Discrimination Climate and Team Effectiveness: The Mediating Role of Collective Value Congruence, Team Cohesion, and Collective Affective Commitment, having been approved in respect to style and intellectual content, is referred to you for judgment.
We have read this dissertation and recommend that it be approved.
_____________________________________________
Jesse S. Michel
_____________________________________________ Asia Eaton
_____________________________________________ Whitney Bauman
_____________________________________________
Valentina Bruk-Lee
_____________________________________________
Chockalingam Viswesvaran, Major Professor
Date of Defense: March 26, 2015
The dissertation of Anya T. Edun is approved.
_____________________________________________ Dean Michael R. Heithaus
College of Arts and Sciences
_____________________________________________ Dean Lakshmi N. Reddi
University Graduate School
Florida International University, 2015
iii
DEDICATION
I dedicate this dissertation to my parents, Anne and Azam Edun, and to my sister,
Alana Edun. I am so blessed to have the most loving and supportive family by my side.
We have such a strong family dynamic and I wouldn’t want it any other way. We are
quite opinionated and each other’s toughest critic, but that’s because we only want what’s
best for one another. You have been my greatest source of motivation, advice,
encouragement, and unconditional love. Especially when I’ve been stressed and may
have taken it out on you, thank you for dealing with me. I know there may have been
times when you thought this day would never come, but happily, it’s here and a huge
weight has been lifted!
Mom and Dad, I am eternally grateful for the sacrifices you’ve made for Alana
and me to achieve our life’s goals, including this one. Alana, you literally made this
dream a reality by helping me meet the last and final deadline for my Defense, it was
down to the wire. I cannot thank you enough, you’ve always been the person I could trust
with anything and this time was no different. I’m one lucky girl to have you as my big lil’
sis. Here’s to the next chapter and to many more adventures to come.
I LOVE YOU!
iv
ACKNOWLEDGMENTS
I would like to thank each of my committee members, Dr. Asia Eaton, Dr.
Whitney Bauman, and Dr. Valentina Bruk-Lee, for their contributions to my dissertation.
I would particularly like to recognize Dr. Jesse Michel for helping me begin the writing
process and Dr. Chockalingam Viswesvaran for helping me complete it. Jesse, I’m
grateful for your always being available to assist me, answer my questions, and
coordinate things on my behalf after I relocated to the Caribbean for work. In addition to
your constructive feedback, you provided me with words of encouragement when I
needed it most. Dr. Vish, thank you for your patience and always holding your students to
the highest standards; it challenges us to strive for excellence and be as thorough as we
can possibly be.
I also want to acknowledge my amazing family, friends, and colleagues who have
encouraged me every step of the way. In particular, I would like to thank my fellow
McKnight ladies, Dr. Patrice Reid and Dr. Carollaine García, who began this journey
with me and have inspired me with their individual successes. Also, I would like to
express my sincerest appreciation to Gina Passaro for being a daily source of motivation
and always holding me accountable. Even during the times when it seemed that there was
no end in sight, you helped me stay focused on the goal and stick to my deadlines.
Finally, I would like to thank Roy Forbes who selflessly allowed me to put my writing
first. From setting-up my writing space to providing me freshly brewed cups of coffee,
you always ensured I had everything I needed to be productive. I’m so fortunate to have
such an amazing support system. Once again, thank you to each of you!
v
ABSTRACT OF THE DISSERTATION
WORKPLACE DISCRIMINATION CLIMATE AND TEAM EFFECTIVENESS:
THE MEDIATING ROLE OF COLLECTIVE VALUE CONGRUENCE, TEAM
COHESION, AND COLLECTIVE AFFECTIVE COMMITMENT
by
Anya T. Edun
Florida International University, 2015
Miami, Florida
Professor Chockalingam Viswesvaran, Major Professor
This study explored the relationship between workplace discrimination climate on
team effectiveness through three serial mediators: collective value congruence, team
cohesion, and collective affective commitment. As more individuals of marginalized
groups diversify the workforce and as more organizations move toward team-based work
(Cannon-Bowers & Bowers, 2010), it is imperative to understand how employees
perceive their organization’s discriminatory climate as well as its effect on teams. An
archival dataset consisting of 6,824 respondents was used, resulting in 332 work teams
with five or more members in each. The data were collected as part of an employee
climate survey administered in 2011 throughout the United States’ Department of
Defense.
The results revealed that the indirect effect through M1 (collective value
congruence) and M2 (team cohesion) best accounted for the relationship between
workplace discrimination climate (X) and team effectiveness (Y). Meaning, on average,
teams that reported a greater climate for workplace discrimination also reported less
vi
collective value congruence with their organization (a1 = -1.07, p < .001). With less
shared perceptions of value congruence, there is less team cohesion (d21 = .45, p < .001),
and with less team cohesion there is less team effectiveness (b2 = .57, p < .001).
In addition, because of theoretical overlap, this study makes the case for studying
workplace discrimination under the broader construct of workplace aggression within the
I/O psychology literature. Exploratory and confirmatory factor analysis found that
workplace discrimination based on five types of marginalized groups: race/ethnicity,
gender, religion, age, and disability was best explained by a three-factor model,
including: career obstruction based on age and disability bias (CO), verbal aggression
based on multiple types of bias (VA), and differential treatment based on racial/ethnic
bias (DT). There was initial support to claim that workplace discrimination items covary
not only based on type, but also based on form (i.e., nonviolent aggressive behaviors).
Therefore, the form of workplace discrimination is just as important as the type when
studying climate perceptions and team-level effects. Theoretical and organizational
implications are also discussed.
vii
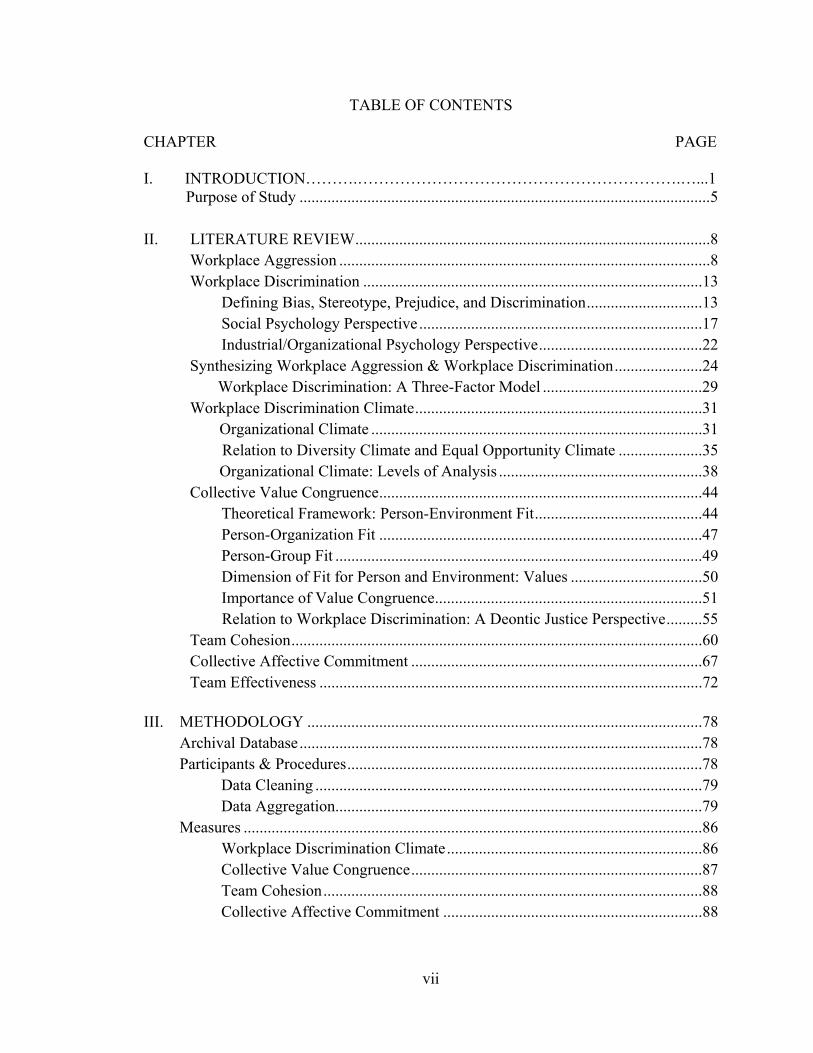
TABLE OF CONTENTS
CHAPTER PAGE
I. INTRODUCTION……….…………………………………………………….…...1 Purpose of Study .......................................................................................................5
II. LITERATURE REVIEW .........................................................................................8
Workplace Aggression .............................................................................................8 Workplace Discrimination .....................................................................................13
Defining Bias, Stereotype, Prejudice, and Discrimination .............................13 Social Psychology Perspective .......................................................................17 Industrial/Organizational Psychology Perspective .........................................22
Synthesizing Workplace Aggression & Workplace Discrimination ......................24 Workplace Discrimination: A Three-Factor Model ........................................29 Workplace Discrimination Climate ........................................................................31
Organizational Climate ...................................................................................31 Relation to Diversity Climate and Equal Opportunity Climate .....................35
Organizational Climate: Levels of Analysis ...................................................38 Collective Value Congruence .................................................................................44
Theoretical Framework: Person-Environment Fit ..........................................44 Person-Organization Fit .................................................................................47 Person-Group Fit ............................................................................................49 Dimension of Fit for Person and Environment: Values .................................50 Importance of Value Congruence ...................................................................51
Relation to Workplace Discrimination: A Deontic Justice Perspective .........55 Team Cohesion .......................................................................................................60 Collective Affective Commitment .........................................................................67 Team Effectiveness ................................................................................................72
III. METHODOLOGY ...................................................................................................78 Archival Database .....................................................................................................78 Participants & Procedures .........................................................................................78
Data Cleaning .................................................................................................79 Data Aggregation............................................................................................79
Measures ...................................................................................................................86 Workplace Discrimination Climate ................................................................86 Collective Value Congruence .........................................................................87 Team Cohesion ...............................................................................................88 Collective Affective Commitment .................................................................88
viii
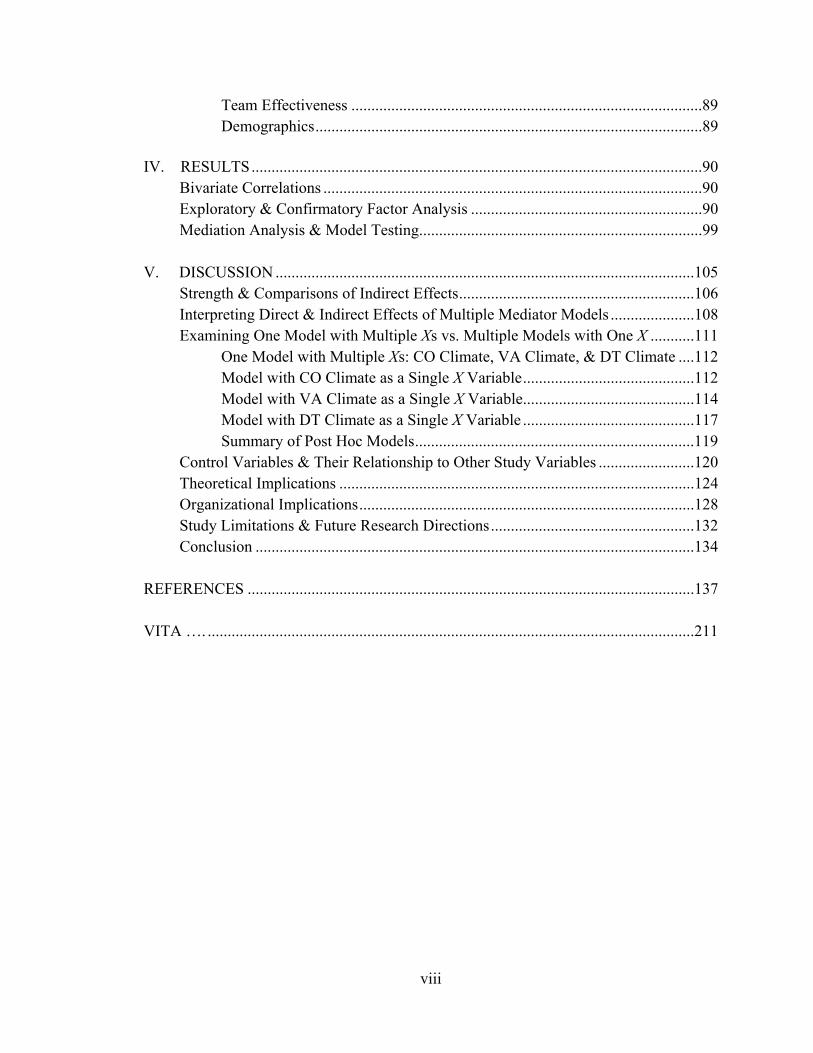
Team Effectiveness ........................................................................................89 Demographics .................................................................................................89
IV. RESULTS .................................................................................................................90 Bivariate Correlations ...............................................................................................90 Exploratory & Confirmatory Factor Analysis ..........................................................90 Mediation Analysis & Model Testing.......................................................................99 V. DISCUSSION .........................................................................................................105 Strength & Comparisons of Indirect Effects ...........................................................106 Interpreting Direct & Indirect Effects of Multiple Mediator Models .....................108 Examining One Model with Multiple Xs vs. Multiple Models with One X ...........111
One Model with Multiple Xs: CO Climate, VA Climate, & DT Climate ....112 Model with CO Climate as a Single X Variable ...........................................112 Model with VA Climate as a Single X Variable ...........................................114 Model with DT Climate as a Single X Variable ...........................................117 Summary of Post Hoc Models ......................................................................119
Control Variables & Their Relationship to Other Study Variables ........................120 Theoretical Implications .........................................................................................124 Organizational Implications ....................................................................................128 Study Limitations & Future Research Directions ...................................................132 Conclusion ..............................................................................................................134 REFERENCES ................................................................................................................137 VITA …. ..........................................................................................................................211
ix
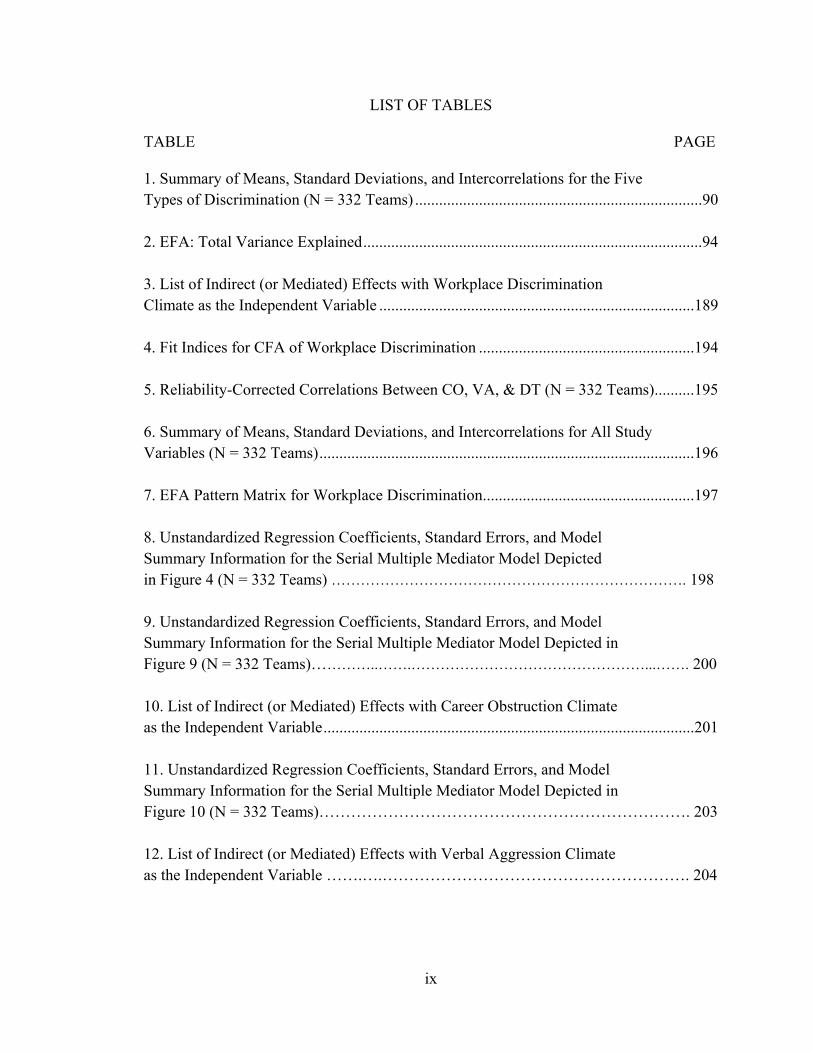
LIST OF TABLES
TABLE PAGE
1. Summary of Means, Standard Deviations, and Intercorrelations for the Five Types of Discrimination (N = 332 Teams) ........................................................................90 2. EFA: Total Variance Explained .....................................................................................94 3. List of Indirect (or Mediated) Effects with Workplace Discrimination Climate as the Independent Variable ...............................................................................189 4. Fit Indices for CFA of Workplace Discrimination ......................................................194 5. Reliability-Corrected Correlations Between CO, VA, & DT (N = 332 Teams)..........195 6. Summary of Means, Standard Deviations, and Intercorrelations for All Study Variables (N = 332 Teams) ..............................................................................................196 7. EFA Pattern Matrix for Workplace Discrimination .....................................................197 8. Unstandardized Regression Coefficients, Standard Errors, and Model Summary Information for the Serial Multiple Mediator Model Depicted in Figure 4 (N = 332 Teams) ………………………………………………………………. 198 9. Unstandardized Regression Coefficients, Standard Errors, and Model Summary Information for the Serial Multiple Mediator Model Depicted in Figure 9 (N = 332 Teams)…………..…….…………………………………………...……. 200 10. List of Indirect (or Mediated) Effects with Career Obstruction Climate as the Independent Variable .............................................................................................201 11. Unstandardized Regression Coefficients, Standard Errors, and Model Summary Information for the Serial Multiple Mediator Model Depicted in Figure 10 (N = 332 Teams)……………………………………………………………. 203 12. List of Indirect (or Mediated) Effects with Verbal Aggression Climate as the Independent Variable …….….…………………………………………………. 204
x
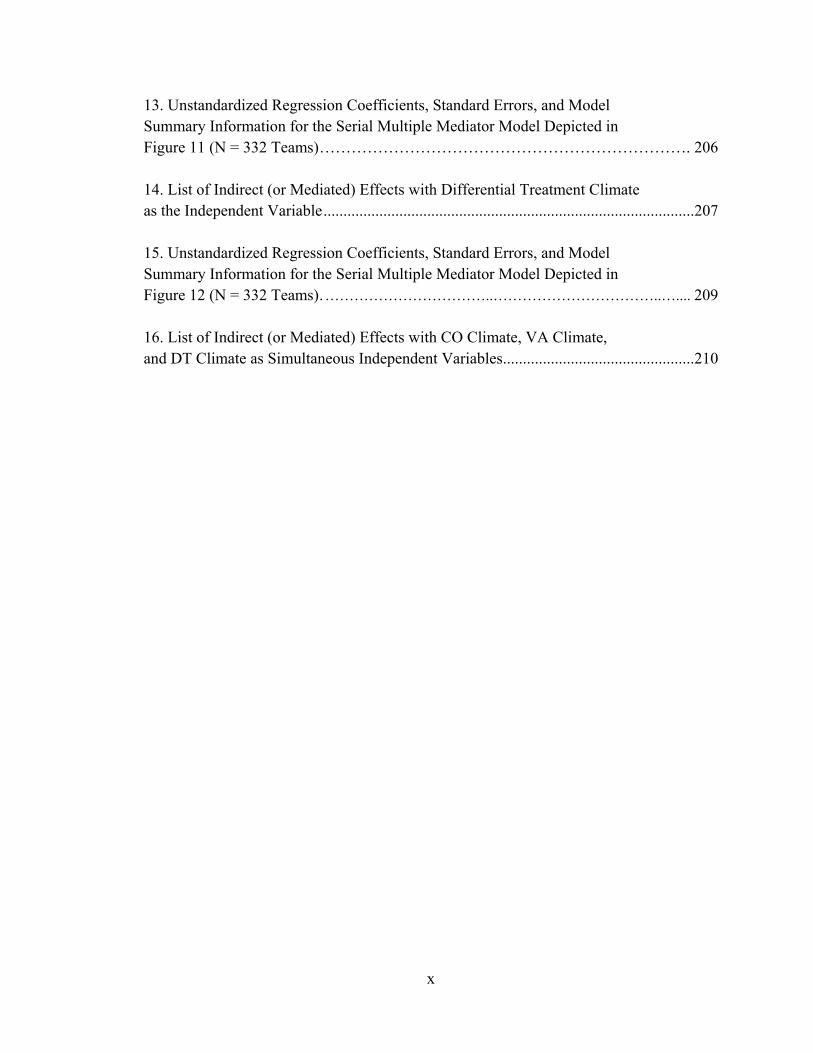
13. Unstandardized Regression Coefficients, Standard Errors, and Model Summary Information for the Serial Multiple Mediator Model Depicted in Figure 11 (N = 332 Teams) ……………………………………………………………. 206 14. List of Indirect (or Mediated) Effects with Differential Treatment Climate as the Independent Variable .............................................................................................207 15. Unstandardized Regression Coefficients, Standard Errors, and Model Summary Information for the Serial Multiple Mediator Model Depicted in Figure 12 (N = 332 Teams) . ……………………………..……………………………..….... 209 16. List of Indirect (or Mediated) Effects with CO Climate, VA Climate, and DT Climate as Simultaneous Independent Variables ................................................210
xi
LIST OF FIGURES
FIGURE PAGE
1. EFA Scree Plot ...............................................................................................................92 2A. Conceptual Model .....................................................................................................185 2B. Conceptual Model Post-Exploratory Factor Analysis (EFA) with Revised Workplace Discrimination Climate Subscales .................................................................186 3. Statistical Model with Workplace Discrimination Climate as the Independent Variable and Serial Multiple Mediators ...........................................................................187 4. Statistical Model with Workplace Discrimination Climate as the Independent Variable, Serial Multiple Mediators, and Superimposed (Unstandardized) Regression Coefficients (N = 332 Teams) .......................................................................188 5. One-Factor Model of Workplace Discrimination (16 Indicators) ...............................190 6. One-Factor Model of Workplace Discrimination with Standardized Regression Coefficients (16 Indicators) ...........................................................................191 7. Three-Factor Model of Workplace Discrimination (16 Indicators) .............................192 8. Three-Factor Model of Workplace Discrimination with Standardized Regression Coefficients (16 Indicators) ...........................................................................193 9. Statistical Model with Career Obstruction Climate as the Independent Variable, Serial Multiple Mediators, and Superimposed (Unstandardized) Regression Coefficients (N = 332 Teams) .......................................................................199 10. Statistical Model with Verbal Aggression Climate as the Independent Variable, Serial Multiple Mediators, and Superimposed (Unstandardized) Regression Coefficients (N = 332 Teams) .......................................................................202 11. Statistical Model with Differential Treatment Climate as the Independent Variable, Serial Multiple Mediators, and Superimposed (Unstandardized) Regression Coefficients (N = 332 Teams) .......................................................................205
xii
12. Statistical Model with CO Climate, VA Climate, and DT Climate as Simultaneous Independent Variables, Serial Multiple Mediators, and Superimposed (Unstandardized) Regression Coefficients (N = 332 Teams) ..................208
1
CHAPTER I
INTRODUCTION
In the twenty-first century, where organizations have expanded to meet the
dynamic needs of globalization, the employee landscape has also evolved to reflect this
change. Racially- and ethnically-diverse teams, generational differences, religious
differences, women in traditionally male-dominated fields, and integration of disabled
workers are just a few examples of how today’s workforce has evolved. With such an
increase in diverse workforces and organizations, additional research on workplace
discrimination warrants serious consideration (e.g., Avery, McKay, & Wilson, 2008;
Murray & Syed, 2005; Tung, 2008). Indeed, in the Society for Industrial and
Organizational Psychology’s (SIOP) premier journal (Industrial and Organizational
Psychology: Perspective on Science and Practice), a recent focal article has made a call
to the field to pay closer attention to marginalized groups’ experience with discrimination
in the workplace (Ruggs et al., 2013).
Ruggs and colleagues (Ruggs et al., 2013) argue that studies conducted on
discrimination are limited mostly to those against Blacks and women (i.e., sexual
harassment), however, the authors list seven additional groups that deserve further
research consideration, including ethnically- and racially-diverse employees in addition
to Blacks; lesbian, gay, bisexual, and transgender (LGBT) individuals; older workers;
individuals with disabilities; those who are overweight; religious minorities; and those
who face marital status discrimination. They state that industrial and organizational (I/O)
psychologists have “… missed the opportunity to be at the forefront of research
examining a broad range of marginalized employees’ experiences in the workplace”
2
(Ruggs et al., 2013, p. 40). As an attempt to answer their call, the present study will look
at workplace discrimination of five marginalized groups defined by: race/ethnicity,
gender, religion, age, and disability.
There seems to be a misconception that there is an abundance of academic papers
published on workplace discrimination for the full range of marginalized groups
protected by the U.S. Equal Employment Opportunity Commission (EEOC), especially
those accepted to top tier journals for I/O psychology (e.g., Academy of Management
Journal, Academy of Management Review, Journal of Applied Psychology, Journal of
Management, Organizational Behavior and Human Decision Processes, and Personnel
Psychology; Zickar & Highouse, 2001). However, since 1990, the number of articles in
top tier I/O psychology journals focusing on discrimination related issues of marginalized
employees (excluding Blacks and women) is fifty-seven (Ruggs et al., 2013). Out of
these fifty-seven articles, nineteen were published on racial discrimination (excluding
Blacks), ten were on disability discrimination, nine were on age discrimination, and only
one was on religious discrimination. In other words, in twenty-three years, minimal
attention has been given to this topic in the published I/O psychology literature.
Nevertheless, as research on discrimination against marginalized groups draws
heavily from sociopsychological concepts, such as stereotypes, prejudice, outgroups, and
social identity (Landy, 2008; Nadler & Stockdale, 2012), it is expected that these fields
may be where such research (i.e., discrimination against all marginalized groups) is being
published. Wanting to confirm this notion, Nadler and colleagues (Nadler, Bartels, Sliter,
Stockdale, & Lowery, 2013) duplicated Ruggs et al.’s (2013) study, but focused their
search on top social psychology journals. Their results were surprising. Since 1990, the
3
top I/O psychology journals have published double the amount of articles on workplace
discrimination against marginalized groups than social psychology journals (i.e., 26
articles). However, if general discrimination (not just workplace discrimination) studies
were included then the results would have been different. Nevertheless, although the I/O
psychology journals published more articles, the fact remains there were only fifty-seven
articles in over two decades. Arguably, the attention given to discrimination of
marginalized groups, in any context, may be overgeneralized to the workplace setting. As
a result, researchers and non-researchers alike may feel that there has been sufficient
attention given to the experience of workplace discrimination when in reality there has
not. Thus, there is a considerable gap in the literature and more research needs to
examine discrimination against marginalized groups specifically in the workplace.
Considering the present workforce composition and future trends, greater
importance should be placed on understanding workplace discrimination of more
marginalized groups. For instance, although the current workforce participation rate is
highest among 25 to 54-year-olds, the rate of older employees has drastically increased
over the past 20 years. It is anticipated that the number of older workers seeking
employment will increase over 36% by the next decade (Toossi, 2009), and by 2050,
19% of the labor force will be comprised of employees 55 years-and-older (Toossi,
2002). In regard to religion, across a 10-year span from 2001 to 2011, the number of
religious discrimination claims in the workplace reported to the EEOC doubled, and
according to a report published by the American Bar Association, religious-based
complaints were increasing at a much faster rate than either race or gender claims (Weiss,
2008).
4
Additionally, within the United States, 19% of the civilian population report
having a disability (U.S. Census Bureau, 2010). Of these individuals, 41% between the
ages of 21 to 64 are employed and 28% of these employees have a severe disability (U.S.
Census Bureau, 2010). However, these statistics do not even take into consideration the
number of veterans who become injured while on active duty. In 2011, military veterans
comprised approximately 9% (21.5 million) of the U.S. population over the age of 18,
and 16% (3.5 million) of these veterans became disabled while on duty (U.S. Census
Bureau, 2011). Particularly with the current situations abroad and the return of U.S.
troops back home, there has been, and will continue to be, an influx of disabled citizens
(veterans and civilians) entering the workforce.
Lastly, the percentage of women found today in traditionally male-dominated
fields has increased dramatically since 1970 when the first census was conducted
following the enactment of the EEOC. Women made up only 3.7% of police officers and
4.9% of lawyers and judges in the first census and in the 2006-2010 Census women made
up 14.8% and 33.4%, respectively (U.S. Census Bureau, 2010). Overall, the industries
that have seen the greatest percent increase of women include accounting, pharmacy,
medicine, law, law enforcement, and civil engineering (U.S. Census Bureau, 2010).
Evidently, with such dynamic changes to the workforce and its inevitable
continuation, researchers must pay closer attention to the experience of discrimination
against marginalized groups at work, and especially in the I/O psychology literature. If
one of the main goals of I/O psychology is to ensure an equitable and fair workplace for
all (cf. Ruggs et al., 2013), then action must be taken now. The field needs to take a
proactive approach to identifying workplace discrimination and understanding its effects.
5
Researchers should not limit studies to discrimination solely against Blacks and women,
even though the history of the United States is likely responsible for the emphasis on
these two groups. There are little signs of the workforce remaining as it does today. An
even more diverse workforce, and overall American landscape, is expected. Rather than
addressing the issue as it arises later on down the road, the field needs to be prepared to
handle it. Research needs to be available to inform and guide organizational practices and
public policies.
Lastly, what were once violent acts of discrimination are now more modern and
subtle forms of discrimination (e.g., Brief, Dietz, Cohen, Pugh, & Vaslow, 2000; Crosby,
Bromley, & Saxe, 1980; Dovidio & Gaertner, 1983, 1998; Frey & Gaertner, 1986;
Gaertner & McLaughlin, 1983; Katz, 1981; Kinder & Sears, 1981; McConahay, 1983;
Sears & Allen, 1984) embedded in everyday interactions, society, and norms. The
evolution of discrimination has made detecting it ambiguous while also giving the
impression that it is no longer a pressing issue. For example, Brief (1998) revealed that
modern racism is more indirect and rationalized such that negative attitudes toward
Blacks are masked with nonracial reasons to preserve a non-prejudicial self-image. The
recent Black Lives Matter movement is a large-scale effort to shed light on modern
racism and the injustices Blacks face in the United States. The movement began in 2012
after George Zimmerman, who plead self-defense, was acquitted for his crime against an
unarmed 17-year-old, Trayvon Martin.
Purpose of Study
Although modern discrimination exists in many social exchanges, this study
focuses solely on its occurrence within the workplace. The purpose of this dissertation is
6
to address how such discrimination, disguised as covert aggression, actually has serious
consequences for work teams. Also, along with Black and sexual harassment
occurrences, the current study expands research on workplace discrimination by
examining additional EEOC protected groups (i.e., race/ethnicity in addition to Blacks,
religion, age, and disability). As more individuals of marginalized groups diversify the
workforce and as more organizations move toward team-based work (Cannon-Bowers &
Bowers, 2010), it is imperative to understand how employees perceive their
organization’s discriminatory climate as well as its effect on teams. Furthermore, because
of theoretical overlap, this study makes the case for combining workplace discrimination
and workplace aggression to broaden the understanding of discrimination in the work
context. Lastly, a conceptual model is proposed to analyze how three serial mediators
(collective value congruence, team cohesion, and collective affective commitment)
explain the relationship between workplace discrimination climate and team
effectiveness.
In Chapter II, a brief review of all variables and their relationships is provided,
beginning with the relationship between workplace aggression and workplace
discrimination. As mentioned previously, this study intends to synthesize research on
workplace aggression and workplace discrimination. With the lack of research on
marginalized group members’ experience of workplace discrimination, it not only limits
the understanding and consequences of discrimination at work (Ruggs et al., 2013), but it
restricts the types of empirical questions to be considered. Presented in greater detail
below, discrimination is conceptualized as aggression motivated by negative prejudice

7
towards marginalized group members. As a result, research on workplace aggression is
examined and included to help inform the current study.
8
CHAPTER II
LITERATURE REVIEW
Workplace Aggression
Workplace aggression refers to a variety of adverse behaviors and instances that
occur within the work context. One of the main problems in the literature on workplace
aggression is that there are too many competing definitions and ways in which to
operationalize it (i.e., construct proliferation). Workplace aggression has been
operationalized under many differing names (Hershcovis, 2011; Hershcovis et al., 2007;
Martinko, Gundlach, & Douglas, 2002; Spector & Fox, 2005). For instance, constructs
examining mistreatment from the target’s perspective, include: bullying (e.g., Adams,
1992a; Adams, 1992b; Rayner, 1997; Einarsen, 2000), incivility (e.g., Andersson &
Pearson, 1999), social undermining (e.g., Duffy, Ganster, & Pagon, 2002), mobbing (e.g.,
Leymann, 1990; Olweus, 1991), psychological terror (Leymann, 1990), harassment (e.g.,
Brodsky, 1976), work abuse (e.g., Bassman, 1992), emotional abuse (e.g., Keashly, 1998;
Keashly, Hunter, & Harvey, 1997; Wilson, 1991), petty tyranny (e.g., Ashforth, 1994),
workplace aggression (e.g., Neuman & Baron, 1998; Fox & Spector, 1999), victimization
(e.g., Aquino, Grover, Bradfield, & Allen, 1999; Olweus, 1994), interpersonal conflict
(e.g., Spector & Jex, 1998), and abusive supervision (e.g., Tepper, 2000).
Duffy, Ganster, and Pagon (2002) describe social undermining as “behavior
intended to hinder, over time, the ability to establish and maintain positive interpersonal
relationships, work-related success, and favorable reputation” (p. 332). Tepper (2000)
defines abusive supervision, another construct operationalized as workplace aggression,
as “subordinates’ perceptions of the extent to which supervisors engage in the sustained
9
display of hostile verbal and nonverbal behaviors, excluding physical contact” (p. 178).
Keashly and Harvey (2005) used the term emotional abuse to describe “repeated hostile
verbal and nonverbal behaviors (excluding physical contact) directed at one or more
individuals over a period of time such that the target’s sense of self as a competent
worker and person is negatively affected” (p. 205). Examples of such behaviors include
humiliating or mocking an employee in front of others, giving someone the “silent
treatment,” name-calling, and deliberately withholding information (Keashly, 2001).
Despite the supervisor-subordinate power difference in abusive supervision (Tepper,
2000), the definitions above are quite similar. All exclude physical contact and refer to
sustained negative behaviors over time. Additionally, sample behaviors of each construct
include verbal and nonverbal behaviors all intended to belittle a target - their self-esteem,
their reputation, and their work-related success.
Likewise, there are numerous constructs from the actor’s (i.e., aggressor’s)
perspective, including: anti-social behavior (Giacalone & Greenberg, 1997; Robinson &
O’Leary-Kelly, 1998), counterproductive work behaviors (CWBs; Fox, Spector, & Miles,
2001), interpersonal deviance (e.g., Bennett & Robinson, 2000; Hollinger, 1986;
Robinson & Bennett, 1995), organizational retaliation behavior (e.g., Skarlicki & Folger,
1997), revenge (e.g., Aquino, Tripp, & Bies, 2001; Bies & Tripp, 2005; Bies, Tripp, &
Kramer, 1997), insidious workplace behavior (e.g., Edwards & Greenberg , 2010), and
workplace aggression (e.g., Greenberg & Barling, 1999).
Skarlicki and Folger (1997) defined organizational retaliation behavior as
“adverse reactions to perceived unfairness by disgruntled employees toward their
employer” (p. 434). Edwards and Greenberg (2010) defined insidious workplace behavior
10
as “a form of intentionally harmful workplace behavior that is legal, subtle, and low level
(rather than severe), repeated over time, and directed at individuals or organizations” (p.
4). Similar to Skarlicki and Folger’s (1997) definition of organizational retaliation,
Edwards and Greenberg’s (2010) definition of insidious workplace behavior refers to
intentional behavior directed both at the organization and people within it. More recently,
CWBs defined as “volitional acts that harm or are intended to harm organizations or
people in organizations” (Spector & Fox, 2005, p. 151) has integrated many perspectives
on workplace aggression and mistreatment. “It can include overt acts such as aggression
and theft or more passive acts, such as purposely failing to follow instructions or doing
work incorrectly” (Fox, Spector, & Miles, 2001, p. 292).
Evidently, there is considerable overlap in the definitions of workplace aggression
constructs, regardless of perspective (target or actor) and the many additional factors
intended to distinguish them apart. In addition to perspective, workplace aggression
constructs have been differentiated by many other factors including: intent (i.e., direct or
indirect), motive (proactive or reactive), intensity (i.e., physical or nonphysical; verbal or
nonverbal), rate of occurrence (i.e., frequent or infrequent), organization versus people
aggression, power imbalance (i.e., supervisor, colleague, or client), specific outcomes
(i.e., to affect an individual’s reputation and relationships or to directly attack the
individual), and the list goes on and on. However, even these distinctions are not
mutually exclusive.
Take for example incivility that is low intensity deviant acts, such as rude or
discourteous verbal and nonverbal behaviors, intended to harm the target and violate the
workplace norm of mutual respect (Andersson & Pearson, 1999). The construct alone
11
spans multiple factors that have been used to differentiate one workplace aggression
construct from another. Even in measurement, many scales overlap in the type of items
asked (Aquino & Thau, 2009; Fox & Spector, 2005). Interestingly, in the recently
popular CWB literature, researchers report similar construct proliferation and cite the
same interchangeable concepts (i.e., Fox, Spector, & Miles, 2001), as do workplace
aggression researchers. Further illustrating construct redundancy and lack of parsimony
across the field. However, a deeper look at the item-level may reveal individual
constructs are more alike than not and may assess a more global construct (e.g.,
Hershcovis & Barling, 2007; Raver & Barling, 2008; Spector & Fox, 2005).
Bowling and Beehr (2006) examined the predictors and consequences of
workplace aggression. Within their meta-analysis of mistreatment outcomes, they
combined multiple forms of mistreatment including abusive supervision, bullying,
emotional abuse, generalized workplace abuse, incivility, interpersonal conflict,
mobbing, social undermining, victimization, and workplace aggression. In combining the
correlational relationships among all of the mistreatment variables and their outcomes
(with the exception of interpersonal conflict), they were suggesting that each form of
aggression is largely the same. They argued that mistreatment research “appears under
many different labels…but each label refers to the same overall construct” (Bowling &
Beehr, 2006, p. 998).
Hershcovis (2011) set out to test the amount of overlap between five mistreatment
constructs, including abusive supervision, bullying, incivility, social undermining, and
interpersonal conflict. Although focused on the target’s perspective, Hershcovis (2011)
showed that even though researchers have conceptually distinguished multiple constructs
12
of workplace aggression, a closer look reveals a great deal of overlap between them.
Furthermore, when the constructs are analyzed separately there is no predictable pattern
of outcomes suggesting it may be more fruitful to look at workplace aggression globally.
The proliferation of constructs has not added appreciably to the understanding of
workplace aggression, thus, limiting the ability to address questions originally intended
(Hershcovis, 2011).
Before proceeding, it is important to note that aggression is used throughout this
study to represent the wide range of conceptualizations within the I/O psychology
literature, reflecting adverse behaviors from mild to severe, unintentional to intentional,
verbal to nonverbal, and more within the work context. In social psychology, aggression
has been defined as behavior directed toward another individual carried out with the
proximate (immediate) intent to cause harm (see Baron & Richardson, 1994; Berkowitz,
1993; Bushman & Anderson, 2001; Geen, 2001). Furthermore, the actor must believe that
the behavior will harm the target, and that the target is motivated to avoid the behavior.
Actual harm is not required (Anderson & Huesmann, 2003).
The I/O psychology aggression construct does not limit behaviors to causing
immediate harm. There is greater flexibility for incorporating behaviors that violate
norms of appropriate behavior (e.g., deviance or incivility) and disrupt productivity (e.g.,
sabotage, social undermining, or tardiness), which do not necessarily aim to harm the
target alone. Especially now, as acts of aggression have transformed into more covert
ones, they exist within society (e.g. workplace and school) concealed as an array of
behaviors. The I/O psychology literature recognizes this proliferation of behaviors;
13
targets may not even detect aggressive behaviors because the behaviors are intertwined
and masked as workplace processes and outcomes.
Workplace Discrimination Defining Bias, Stereotype, Prejudice, and Discrimination
In order to have a discussion on workplace discrimination, there must first be a
review of bias, stereotype, and prejudice. Bias is a preference or tendency to favor or
disfavor. For instance, favoring chocolate over vanilla or favoring one sports team over
another. In relation to intergroup bias, it is the systematic tendency to evaluate one’s own
group (i.e., ingroup) or its members more favorably than a non-group (i.e., outgroup) or
its members. Bias encompasses cognitive (i.e., stereotyping), affective (i.e., prejudice),
and behavioral (i.e., discrimination) components (Eagly & Chaiken, 1998; Mackie &
Smith, 1998; Petty &Wegener, 1998; Wilder & Simon, 2001).
Stereotypes are beliefs about people derived from their membership in a particular
group that can be positive, negative, or neutral. For example, a positive stereotype is that
all Asians are exceptional at math and science or that all Blacks are excellent athletes.
Alternatively, a negative stereotype is that all Middle Easterners are terrorists or all
Hispanics are illegal immigrants. A neutral stereotype is that all Irish like to drink or all
women like the color pink. Stereotypes are oversimplified, overgeneralized, and widely
accepted beliefs (Snyder, 1981). They are cognitive schemas that make information
processing easier by allowing the observer to rely on previously stored knowledge in
place of new information (Hilton & von Hippel, 1996). But, of course, stereotypes also
have the ability to restrain cognitive processing. In general, they create a readiness to
perceive behaviors or characteristics that are consistent with the stereotype. Like schemas
14
in general, stereotypes may cause observers to gloss over or ignore individual differences
(Tajfel, 1969; von Hippel, Jonides, Hilton, & Narayan, 1993). They are localized around
group features that are the most distinctive (Nelson & Miller, 1995), that provide the
greatest differentiation between groups, and that show the least within-group variation
(Ford & Stangor, 1992).
Besides allowing people to quickly process new information, stereotypes help to
organize past experiences and assist people in making meaningful assessments of
individuals and their behavior. Stereotypes not only reflect beliefs about the traits
characterizing typical group members but also contain information about other qualities
such as social roles, the degree to which members of the group share specific qualities
(i.e., within-group sameness or variability), and influence emotional reactions to group
members. Stereotypes lead to social categorization, which is one of the reasons for
prejudice attitudes (i.e., “them” vs. “us” mentality) that, in turn, leads to ingroups and
outgroups. Thus, to the extent that stereotypes guide appraisals of group members and
define appropriate roles and behaviors, stereotypes can determine how people respond
affectively and, ultimately, behaviorally to group members (Dipboye & Colella, 2005).
Prejudice is often said to mean, “to pre-judge” someone or something. That is, it
refers to the practice of forming an opinion or value of someone or something in the
absence of direct experience of that person or thing. Social psychology has provided
many different definitions and conceptualizations of prejudice over the years (e.g.,
Duckitt, 1992; Milner, 1981). Despite the variety, contemporary social psychology
largely follows, directly or indirectly, Allport’s (1954) classic definition of prejudice
from his book The Nature of Prejudice. Allport (1954) defined prejudice as “an antipathy
15
based on faulty and inflexible generalization. It may be felt or expressed. It may be
directed toward a group as a whole, or toward an individual because he is a member of
that group” (p. 9). As Milner (1981) pointed out, this definition succinctly captures the
five main features of almost all the different definitions of prejudice in mainstream social
psychology: (a) prejudice is an attitude; (b) it is derived from a faulty and inflexible
generalization; (c) it is a preconception; (d) it is rigid and resilient; and (e) prejudice is
not good.
Prejudice is an attitude or affective response toward certain group and its
individual members. Prejudices can either be positive or negative; both forms are usually
preconceived and difficult to alter. Eagly and Diekman (2005) emphasized how
individuals’ reactions to status and role differences contribute to prejudice. Individuals
who deviate from their group’s traditional role evoke negative reactions and others who
exhibit behaviors that reinforce the status quo elicit positive responses (Eagly &
Diekman, 2005). Along these same lines, prejudice toward women has both hostile and
benevolent components (Glick & Fiske, 1996). Hostile sexism punishes women who
deviate from a traditional subordinate role (e.g., women who fail to appreciate fully all
that men do for them), whereas benevolent sexism celebrates women’s supportive, yet
still subordinate, position (e.g., women who should be cherished and protected by men).
The previous examples reveal that current prejudices do not always include a
direct negative view about the target group. Prejudice may include more subtle, yet
patronizing and also deceptive “positive” views. Although seemingly favorable at face
value, the underlying attitude still endorses a biased view of a particular person or group
(e.g., women as unequal to men). As such, most researchers have continued to define
16
prejudice as a negative attitude (i.e., an antipathy; Dovidio, Hewstone, Glick, & Esses,
2010). The present study proceeds with Crandall & Eshleman (2003) definition of
prejudice as “a negative evaluation of a social group or a negative evaluation of an
individual that is significantly based on the individual’s group membership” (p. 414).
Affect or negative emotions such as hostility and anxiety play a major role in
prejudice. Displaced hostility, for example, has been suggested as an explanation of
prejudice against minority groups (Dollard, Doob, Miller, Mowrer, & Sears, 1939).
Anxiety as measured by physiological responses also tends to be associated with the
degree of prejudice (Dijker, 1987; Vidulich & Krevanick, 1966). Anxiety is aroused
when one interacts with others who hold a different worldview that causes uncertainty
and unpredictability (Barna, 1983). Most researchers have continued to define prejudice
as a negative attitude (i.e., an antipathy) as suggested by Allport (1954) in his seminal
work. Prejudice can lead to discrimination, although it is possible to be prejudiced and
not act upon the attitudes. Therefore, someone can be prejudiced towards a certain group
or individual but not discriminate against them.
Discrimination refers to the unfair treatment of certain groups and its individual
members. Although discrimination is the focus of this study, the cognitive, affective, and
behavioral components are all intertwined; consideration of one requires consideration of
the other two. As previously mentioned, differentiating individuals and things is
fundamental to making quick categorizations and judgments, which help to make sense
of the world around us (Tversky & Kahneman, 1974). However, this same tendency to
make quick categorizations also leads to the activation of stereotypes and biases that can
result in discrimination (Gilbert, 1998; Gilbert, Pelham, & Krull, 1988). Discrimination
17
differs from stereotypes and prejudice, in that it is not a belief or attitude, but rather the
behavioral application of these beliefs and attitudes (Fiske, 2010).
Social Psychology Perspective
Industrial and organizational psychologists have accumulated literature on
workplace discrimination, culminating in the reviews by Dipboye and Colella (2005) and
Goldman, Gutek, Stein, and Lewis (2006). As mentioned earlier, the primary focus of the
extant literature has been on White-Black race relations and sexual harassment, with little
attention given to other marginalized groups (Ruggs et al., 2013). Notably, when defining
workplace discrimination, both reviews (Dipboye & Colella, 2005; Goldman et al., 2006)
argue that I/O psychology draws heavily from social psychology theories of intergroup
relations. These theories include, for example, relational and compositional demography
(e.g., Riordan, Schaffer, & Stewart, 2005; Tsui, Egan, & O’Reilly, 1992; Tsui & Gutek,
1999), which predicts that higher demographic similarity in the workplace leads to
greater perceptions of support and fairness, while heightened levels of dissimilarity or
diversity may lead to perceptions of discriminatory treatment (e.g., Avery, McKay, &
Wilson, 2008). Also included are self-categorization and social identity theories (Tajfel,
1974; Tajfel & Turner, 1979, 1986; Turner, 1985, 1987) as well as stereotype and
ingroup-outgroup theories (Allport, 1954; Brewer, 1999; Dovidio & Gaertner, 2004;
Dovidio & Hebl, 2005).
In speaking directly of ingroups and outgroups, some researchers have argued that
ingroup favoritism is independent of outgroup hatred (Brewer 1999). The following will
briefly consider the independent nature of ingroup favoritism versus outgroup derogation.
Allport (1954) argued that ingroup favoritism plays a fundamental role in intergroup
18
relations, taking psychological precedence over outgroup antipathy. He noted that “in-
groups are psychologically primary. We live in them, and sometimes, for them. Hostility
toward out-groups helps strengthen our sense of belonging, but it is not required” (p. 42),
and proposed that
“...there is good reason to believe that this love-prejudice is far more basic to human life than is…hate-prejudice. When a person is defending a categorical value of his own, he may do so at the expense of other people’s interests or safety. Hate prejudice springs from a reciprocal love prejudice underneath” (p. 25).
In the 60 years since Allport’s observation, a substantial body of research has confirmed
that intergroup bias in prejudice and discrimination often involves ingroup favoritism in
the absence of overtly negative responses to outgroups (Brewer, 1979, 1999; Otten &
Mummendey, 2000).
Nonetheless, Brewer (1999) also pointed out that “ingroup favoritism, even in the
absence of overt antagonism toward outgroups, is not benign” (p. 438). Studies of racial
and ethnic prejudice in the United States and Europe demonstrate that the essence of
contemporary racism is not the presence of strong negative attitudes toward minority
outgroups but the absence of positive feelings toward those groups (e.g., Dovidio &
Gaertner, 1993; Pettigrew & Meertens, 1995; Stangor, Sullivan, & Ford, 1991).
Examples of contemporary racial biases include aversive racism (Dovidio & Gaertner,
2004; Gaertner & Dovidio, 1986), modern racism (McConahay, 1986), and symbolic
racism (Sears, Henry, & Kosterman, 2000). A shared, critical aspect of these three forms
of contemporary bias is the conflict between the denial of personal prejudice and the
underlying unconscious negative feelings and beliefs (i.e., stereotypes).
19
In contrast to traditional racism, aversive racism represents a subtle, often
unintentional form of bias against Blacks that is rooted in cognitive, motivational, and
sociocultural processes that promote racial bias (Dovidio & Gaertner, 2004; Gaertner &
Dovidio, 1986; Pearson, Dovidio, & Gaertner, 2009). These processes fundamentally
involve the consequences of social categorization. “The negative feelings that aversive
racists have toward Blacks typically do not reflect open antipathy, but rather consist of
more avoidant reactions of discomfort, anxiety, or fear” (Pearson, Dovidio, & Gaertner,
2009, p. 4). There are more positive reactions to Whites than to Blacks, reflecting a pro-
ingroup rather than an anti-outgroup orientation, thereby, avoiding the stigma of overt
prejudice and protecting a non-prejudiced self-image.
As a result of historical events, social categorization by race within the United
States is largely automatic, where the actual or imagined presence of a Black person is
enough to activate racial categories without conscious effort or control (Dovidio &
Gaertner, 2004; Otten & Moskowitz, 2000). Moreover, social categorization
spontaneously activates more positive feelings and beliefs about ingroup members than
outgroup members (Brewer, 1979; Gaertner & Dovidio, 2000; Tajfel, 1970). For
example, ingroup pronouns (e.g., “we,” “us,” and “ours”) are rated more favorably than
outgroup pronouns (e.g., “they,” “them,” and “theirs”; Perdue, Dovidio, Gurtman, &
Tyler, 1990). Whites automatically activate stereotypes of ingroup members as
intelligent, successful, and educated, and of Blacks as aggressive, impulsive, and lazy
(Blair, 2001). Also, trust is extended to fellow ingroup, but not outgroup, members
(Insko, Schopler, Hoyle, Dardis, & Graetz, 1990; Insko, Schopler, & Sedikides, 1998).
20
Research has shown that as the salience and strength of intragroup
interdependence and mutual obligation increase, the importance of maintaining group
boundaries also increases (Brewer, 1999), along with mutual distrust of outgroups
(Gardham & Brown, 2001). Therefore, as intergroup boundaries strengthen and distrust
of outgroups increases, the potential for cooperative interdependence and mutual liking is
reduced. Findings from cross-cultural studies of ingroup bias reveal that ingroup-
outgroup distinctions and distrust of outgroups are higher in collectivist societies than in
individualistic societies where social interdependence is less emphasized (Triandis,
1995). Thus, the findings suggest that both phenomena coexist together and one cannot
occur without the other. When ingroup boundaries increase, reciprocal outgroup
boundaries will increase.
Ultimately, many forms of discrimination and bias may develop not because
outgroups are hated, but because positive emotions such as admiration, sympathy, and
trust are reserved for the ingroup and withheld from outgroups. The extension of trust,
cooperation, empathy, and positive regard to ingroup, but not outgroup, members is an
initial form of discrimination, which is distinguished from bias that activates overt
aggression and outgroup derogation (Brewer 1999, 2000; Levin & Sidanius, 1999; Singh,
Choo, & Poh, 1998). The present study acknowledges this stream of research; yet, despite
which side of the coin you view it as (i.e., ingroup favoritism or outgroup derogation), the
outcome is still discrimination.
Intergroup relations have developed based on intergroup history, economics,
politics, and ideology as well as social psychological variables such as ingroup
identification and group threat (Tajfel & Turner, 1979). Discrimination exists today
21
because of historical events that have shaped social hierarchy and structure. Certain
groups benefit over others (e.g., Whites over non-Whites, men over women, etc.) as a
means of maintaining the status quo. Thus, ingroup favoritism has simply taken existing
attitudes (i.e., prejudices) and adapted them over time. The consequences of these
prejudices (e.g., the restriction of opportunity) are now just as significant and detrimental
for marginalized groups as “old-fashioned”, overt forms of discrimination (Dovidio &
Gaertner, 1998; Gaertner & Dovidio, 1986; Sears, 1988; Sears, Henry, & Kosterman,
2000).
In general, social psychologists broadly define discrimination as differential
treatment defined by membership in a social grouping (e.g., race/ethnicity, gender, age,
height, popularity, hair color, geographic region, socioeconomic status, employee tenure,
etc.; Fiske, 1998). However, these theories apply to “a variety of worker characteristics
including, but not limited to, workers in protected categories” (Goldman et al., 2006, p.
798). Social psychology theories may be used, and have been used, to study workplace
discrimination but they do not exclusively apply to discrimination research or to the
workplace context alone. As pointed out by Dipboye and Colella (2005) in their book’s
preface, “Although social psychological research and theory have provided invaluable
insights, an understanding of discrimination in the workplace and solutions requires
incorporating factors at the organizational, individual, and group levels” (p. xv).
Therefore, using theories that broadly examine similarities and differences of
prescribed social groups may overlook specific nuances of workplace discrimination (i.e.,
interpersonal behaviors and actions), especially in work teams consisting of members
from all varieties of social groups as seen in present-day organizations. Even though such
22
theories may do an adequate job of addressing discrimination, the intergroup-level of
analysis does not necessarily reflect one-on-one discriminatory behavior. As a matter of
fact, Fiske (2000) argued that “social psychologists have overslept… thoughts and
feelings do not exclude, oppress, and kill people; behavior does” (p. 312). Social
psychologists are only now starting to integrate thoughts and feelings to address
discriminatory behaviors (Fiske, 2000).
Industrial/Organizational Psychology Perspective
The majority of I/O psychology researchers have concentrated on the legal
aspects of discrimination such as determining fair selection systems, reducing adverse
impact, increasing diversity, and guaranteeing fair promotion decisions rather than
“focusing on understanding the manifestation and consequences of discrimination”
(Ruggs et al., 2013, p. 39). Specifically, Title VII incorporates two fundamental theories
of workplace discrimination, disparate treatment and disparate impact. Disparate
treatment is intentional discrimination against members of a marginalized group. On the
other hand, disparate impact refers to the policies, procedures, practices, tests, rules, and
other systems that appear to be neutral, but result in disproportionate impact for protected
groups (i.e., adverse impact).
Disparate impact allows an individual to assert discrimination without proving
intent by establishing that some work criterion was fair in form but discriminatory in
practice. The majority of adverse impact cases involve job selection cases. To aid in
establishing a case under disparate impact, the EEOC issued the Uniform Guidelines on
Employee Selection Procedures in 1978 (Uniform Guidelines). Although originally
intended to apply only to government agencies, the guidelines were eventually adopted as
23
accepted legal practices for all organizations. One of the most important concepts
embodied in the Uniform Guidelines is the four-fifths rule, that is, “a selection rate for
any race, sex, or ethnic group which is less than four-fifths (4/5) (or eighty percent) of the
rate for the group with the highest rate will generally be regarded by the Federal
enforcement agencies as evidence of adverse impact…” (Uniform Guidelines on
Employee Selection Procedures, 1978).
According to the EEOC, workplace discrimination is described as (a) ongoing
unfair treatment and harassment by managers, co-workers, or others in- and outside of the
workplace towards EEOC protected groups; (b) denial of reasonable workplace
accommodations that the employee needs based on his or her group membership (e.g.,
religion and disability); and (c) retaliation because the employee complained about
discrimination, or assisted with a discrimination investigation or lawsuit (U.S. Equal
Employment Opportunity Commission [EEOC], 2013a). Currently, the EEOC protects
the following groups: race, color, religion, sex (including pregnancy), national origin, age
(40 or older), and disability or genetic information.
There is an entire EEOC website dedicated to the specifics of workplace
discrimination for the employee and employer (EEOC, 2013a). In further trying to
understand what qualifies as harassment, the EEOC defines it as “unwelcomed conduct
that is based on race, color, religion, sex (including pregnancy), national origin, age (40
or older), and disability or genetic information (EEOC, 2013b)”. Harassment comes in
many forms including, but not limited to, offensive jokes, slurs, epithets or name calling,
physical assaults or threats, intimidation, ridicule or mockery, insults or put-downs,
offensive objects or pictures, interference with work performance, and other verbal or
24
physical conduct. The law also stipulates that simple teasing, offhand comments, or
isolated minor incidents are not illegal. Harassment becomes unlawful only when (a) it is
so frequent or severe enough to create a work environment that a reasonable person
would consider intimidating, hostile, or abusive and (b) if it results in an adverse
employment decision (e.g., the victim being fired or demoted; EEOC, 2013b).
Altogether, harassment includes a variety of aggressive behaviors covered in the previous
section.
Workplace discrimination, and specifically workplace harassment, encompasses a
great deal of overlap with workplace aggression. What makes these aggressive behaviors
discriminatory is that the victims are members of an EEOC protected group and the
ongoing aggression they experience is a result of prejudice. For purposes of this study,
workplace discrimination is defined as persistent aggressive behavior at work based on
prejudice against members of EEOC protected groups. Considering that workplace
aggression is a construct developed within the I/O psychology literature and is
conceptually related to workplace discrimination, this study looks to combine the two
constructs for a more robust and meaningful study in the field of I/O psychology.
Synthesizing Workplace Aggression & Workplace Discrimination
In an attempt to synthesize existing research, it is argued that present-day
workplace discrimination qualifies as workplace aggression; but not all incidences of
workplace aggression qualify as workplace discrimination. For instance, if an employee
is continuously ridiculed based on his or her age, not only is it workplace aggression
because he or she is encountering hostile behaviors but it is also discrimination since age
is a protected class under the EEOC and the aggression is more than an offhand
25
occurrence. Alternatively, when a coworker withholds valuable information that would
negatively impact another employee’s work (e.g., emotional abuse, CWBs, social
undermining) this would qualify as workplace aggression and not necessarily
discrimination.
To illustrate how the line between aggression and discrimination is blurred, if
information is constantly withheld because of an individual’s prejudice towards another
coworker then this would qualify as discrimination. However, it becomes quite
problematic to determine if aggressive acts are in fact due to prejudice; it is not so simple
asking an individual whether or not he or she holds a prejudice against others of a
particular group. Especially in organizational research that relies heavily on self-report
methodologies, it is socially unacceptable to admit to prejudices (Stone, Stone, &
Dipboye, 1992). As Brown (1995) pointed out, it is also virtually impossible to ascertain
rationality in holding any kind of prejudice. Therefore, if workplace discrimination falls
under workplace aggression then it may be more fruitful to examine discrimination
research by combining the two constructs operationally. As a reminder, workplace
discrimination is defined as persistent aggressive behavior based on prejudice towards
members of EEOC protected groups; these aggressive behaviors refer to a variety of
adverse behaviors and instances occurring within the work context.
Discriminatory behaviors do not fit neatly into any one particular aggression
construct such as social undermining, incivility, bullying, abusive supervision,
interpersonal conflict, and other behaviors. Instead, discriminatory acts can be a
combination of existing aggression constructs, sharing similar characteristics of many of
these constructs. For example, Einarsen (2000) defines bullying as situations where a
26
person repeatedly, and over a period of time, is exposed to negative acts (i.e., constant
abuse, offensive remarks or teasing, ridicule or social exclusion) on the part of co-
workers, supervisors, or subordinates. Bullying and discrimination are similar in that
abusive or offensive behavior is enacted over a period of time by colleagues, supervisors,
or subordinates. Furthermore, if there is prejudice by one’s supervisor then it is not only
discrimination but it is also bullying, interpersonal conflict, and abusive supervision.
To be considered discrimination, a case needs to be made proving that the target
is experiencing adverse behaviors because of prejudice against one’s group membership.
Support for the importance of intent in determining an actor’s behavior as discriminatory
can be seen within the law. The most often cited statement of what is required to prove a
case unlawful discrimination was made by the U.S. Supreme Court in McDonnell
Douglas Corp. v. Green (1973). In this case, the court required that intent to discriminate
be proven in order for an action to be considered unlawful discrimination. When referring
to intent, it is an actor’s desire for discrimination and belief or awareness that his or her
behavior would result in discriminatory treatment (Malle, 1999).
Nonetheless, research reveals the difficulty in determining prejudiced motives
especially when discrimination has become more elusive and seemingly
nondiscriminatory in nature. Modern-day claims of employment discrimination are more
likely to consist of a culmination of smaller, subtler behaviors (Sturm, 2001). For
example, questioning a marginalized employee’s qualifications for a promotion or
reporting negatively biased performance ratings because the rater has ill-feelings toward
a particular race (Brief et al., 2000; Dovidio, Gaertner, Kawakami, & Hodson, 2002a).
Dovidio and colleagues (2002a, 2002b) stated in reference to racial discrimination, “For
27
these subtle, contemporary forms of prejudice, bias is expressed in indirect ways that can
typically be justified on the basis of nonracial factors” (p. 90).
But what happens when the discrimination is not intentional but is, instead, driven
by unconscious biases? Can an employer still be liable? These are difficult issues to
answer and the courts often vary in their interpretation of the law (see Dukes v. Wal-Mart
Stores, Inc., 2010 and Wal-Mart Stores, Inc. v. Betty Dukes et al., 2011). However,
employers can be found liable for discrimination that results from unconscious motives.
Legally, racism is often defined as blatant incidents, such as using racial slurs to create a
hostile environment or refusing to hire minorities, stemming from hostile intent (Sturm,
2001). Plaintiffs who cannot prove hostile intent may have a more difficult time in court,
but the law does leave room for unintentional racism (Banks, Eberhardt, & Ross, 2008).
In fact, the United States Supreme Court has acknowledged, for both disparate treatment
(Desert Palace, Inc. v. Costa, 2003) and disparate impact (Griggs v. Duke Power, 1971)
cases, that discrimination may occur without intent or may be driven by unconscious bias
or stereotypical thinking. The elusiveness of proving intentionality in legal cases mirrors
the more recent years of social science research. Present-day discrimination is enacted in
more covert ways, and the use of prejudice as a motivating factor in decisions may be
unconscious (Dovidio & Gaertner, 2004; McConahay, 1986; Sears, Henry, & Kosterman,
2000).
Court rulings aside, the common view is that cases without hostile intent are
difficult, if not impossible, to win (King et al., 2011; Tolson, 2008). The reason for the
difficulty is because the average person (i.e., juror) may not perceive the actions as
discriminatory in nature. Whereas Blacks are more likely to view racism as
28
institutionalized and systemic, present in many everyday experiences, research indicates
that Whites are less likely to view these subtle incidents as racism (Bobo, 2001).
Observers and targets of prejudiced behaviors cannot know an actor’s intent with
complete certainty because it represents an internal state in the individual and may not be
expressed (Malle & Knobe, 1997). Even if it is expressed, some observers and targets
may not necessarily believe expressed lack of intent, especially when the behavior in
question involves differential treatment of members of different social groups. Davidson
and Friedman (1998) found that Blacks were less influenced by a White manager’s
excuse for negative treatment of a Black than were Whites, suggesting that Blacks were
more suspicious of the validity of the excuse.
As illustrated by the previous examples, discrimination is simply one more
consideration for labeling aggressive behaviors that may not add appreciably to the
existing workplace aggression construct within I/O psychology (Hershcovis, 2011). The
expectation is that adverse behaviors, whether categorized as aggression or
discrimination, produce similar unfavorable effects in the workplace. Especially when
behaviors overlap and are studied in relation to typical I/O psychology variables (e.g.,
performance; satisfaction; safety, health, and well-being), negative relationships are
anticipated in these instances. The issue is not about the actual labeling of behaviors as
aggression or discrimination, insomuch as it is the nature of the behaviors themselves.
Previous research has shown prejudices of different groups to be correlated (Harding,
Proshansky, Kutner, & Chein, 1969). Allport (1954) originally stated that “people who
reject one outgroup will tend to reject other outgroups. If a person is anti-Jewish, he is
likely to be anti-Catholic, anti-Negro, anti-any outgroup” (p. 68). Weigel and Howes
29
(1985) suggested that “racial prejudice is but one symptom of a generalized tendency to
disparage outgroups” (p. 131).
Researchers have used a variety of outgroups interchangeably in studying the
process of prejudice. Generally, these studies find that the processes of stereotyping and
prejudice apply similarly across groups (e.g., Batson et al., 1997; Crandall & Cohen,
1994; Devine et al., 1991; Meertens & Pettigrew, 1997; Stangor, Sullivan, & Ford, 1991).
Kogan (1961) found correlations among negative attitudes toward older people, those
with physical and mental disabilities, and ethnic minorities. Weigel and Howes (1985)
reported significant correlations among prejudice toward Blacks, older people, and
homosexuals. Agnew, Thompson, and Gaines (2000) found that prejudice toward
homosexuals, Blacks, foreigners, “members of other races,” and older people all load
reliably on a single latent variable. Hence, if research has shown significant correlations
between prejudices of different groups then correlations between different types of
discrimination (i.e., the behavioral manifestation of prejudice) may also be expected.
Hypothesis 1: The five types of workplace discrimination (i.e., race/ethnicity, gender,
religion, age, and disability) are positively related.
Workplace Discrimination: A Three-Factor Model
Discrimination is the behavioral manifestation of negative bias toward others (i.e.,
prejudice; Crandall & Eshleman, 2003; Brehm, 1999, Frijda, 1986). When people meet
(or think about) a target of their prejudice, they experience a tension or energy. This
emotional state can serve as a catalyst for action (e.g., Brehm, 1999; Esses, Haddock, &
Zanna, 1994). Similarly, aggression is the behavioral manifestation of hostility and anger
(Buss & Perry, 1992). Buss and Perry (1992) categorized aggression into three parts -
30
cognitive, emotional, and instrumental - to capture a person’s predisposition to engage in
antisocial behavior. Hostility involves feelings of ill-will and injustice, which represents
the cognitive component of behavior. Anger involves physiological arousal and
preparation for aggression, which represents the emotional or affective component of
behavior. Instrumental behavior encompasses physical and verbal aggression because it
involves hurting or harming others, which represents the behavioral or motor component
of aggression (Buss & Perry, 1992).
Thus, aggression and discrimination are the motor components of adverse
cognitive, attitudinal, and affective states. The outcome of these negative states results in
overlapping behaviors between aggression and discrimination. Hence, providing initial
rationale for combining discrimination under the much larger construct of aggression
within I/O psychology. Discrimination can be carried out in many different aggressive
forms, including all of those mentioned previously. Rather than building an argument for
a new construct, this study is taking Hershcovis’s (2011) recommendation for parsimony
and will incorporate workplace discrimination under the umbrella of workplace
aggression because of the significant overlap in behavioral manifestations. There is little
need to expand the field on adverse behaviors within the workplace when in reality
workplace discrimination is just aggression based on prejudice. Additionally, because of
the need to prove intentionality based on prejudice, differentiating workplace
discrimination from aggression is less practical than studying the behaviors altogether as
aggression within I/O psychology research.
The goal as Hershcovis (2011) puts it is to stop construct proliferation and find
parsimony in the field, which is why this study is taking that same approach and defining
31
workplace discrimination as it has. The focus is not on how workplace discrimination is
separate and distinct from workplace aggression; it is on how discrimination in the
workplace, enacted as persistent aggressive behavior, shares similar adverse effects on
work-related outcomes. Furthermore, because discrimination has evolved throughout
time, it is now disguised as everyday aggression with unclear motives of prejudice and is
difficult to measure. As a result, workplace discrimination should not be treated as
separate but should be integrated into the overall latent construct of workplace
aggression, an emergent field of study within I/O psychology. One final point of this
study’s conceptualization of workplace discrimination is that it only includes subtle
forms of aggression, thus, excluding any instances of physical altercations, violence, or
homicide.
Hypothesis 2: The five types of workplace discrimination measured (i.e., race/ethnicity,
gender, religion, age, and disability) will fall under three latent variables, representing the
cognitive, affective, and behavioral components of bias.
Workplace Discrimination Climate
Organizational Climate
Without diving too deep into history, the United States endured a turbulent
founding which left a lasting effect on society and present-day social norms. Many points
in history illustrate steps taken to protect and empower specific classes of people. For
instance, the President’s Commission on the Status of Women in 1961; the Equal Pay Act
of 1963 (EPA); Title VII of the Civil Rights Act of 1964 and amendment in 1991; Age
Discrimination in Employment Act of 1967 (ADEA); Rehabilitation Act of 1973;
Pregnancy Discrimination Act of 1978; Americans with Disabilities Act of 1990 (ADA);
32
Title II of the Genetic Information Nondiscrimination Act of 2008 (GINA); Civil Rights
and Women’s Rights Movements; Affirmative Action; and the Equal Employment
Opportunity Commission (EEOC) all represent significant milestones in history where
strides were taken to ensure equality and rights for all individuals. However, despite these
large-scale efforts to eradicate discrimination, the continuation of such acts has only
changed forms.
There is a need to incorporate a more modern perspective of discrimination
(McConahay, 1986; McConahay, Hardee, & Batts, 1981), one that treats discrimination
as subtle and pervasive, into the more traditional perspective of discrimination enacted by
individuals with blatant prejudiced attitudes (Deitch, Barsky, Butz, Chan, Brief, &
Bradley, 2003). As Deitch and colleagues (2003) pointed out, “…everyday
discrimination is manifested at work in the form of subtle acts of mistreatment
experienced disproportionately by minority group members” (p. 300). Today, where steps
have been taken to ensure equality of all people, discrimination still persists and the
workplace is impacted by its existence.
Federal laws and EEOC guidelines have helped curtail employment policies and
practices that discriminate and they have also sensitized individuals to blatant
discrimination at work. However, more subtle forms of discrimination are of even greater
importance. Crandall and Eshleman (2003) point out that as cultural norms have become
less accepting of explicit prejudice, and as people have matured, they have become more
motivated and savvy at suppressing many of their prejudices (Crandall & Eshleman,
2003). But, studies also reveal that even when people are determined not to engage in
racist behaviors, automatic stereotypes may exert an unconscious influence on their
33
behavior (Chen & Bargh, 1997; Crandall & Eshleman, 2003; Devine, 1989). Prejudice is
not directly expressed but is modified and manipulated to meet social and personal goals
(Crandall and Eshleman, 2003).
In the present study, employees are asked to report the likelihood of a behavior or
action occurring even if they do not personally observe or experience it. Measuring
workplace discrimination in this manner provides an indication of organizational climate
because it represents perceptions of discrimination likely to occur at work. Also, it would
help to reduce social response bias because the items (discussed later in greater detail) are
not presented as discrimination that the employee has enacted or even experienced; it is
his or her judgment of what is likely to occur. Furthermore, regardless of any prejudiced
beliefs a person may hold, he or she is still aware of what qualifies as discrimination in
accordance with present-day social norms and laws (Bobo, 1998); therefore, he or she is
able to report its occurrence when asked to do so.
For example, in Dovidio and Gaertner (1991), they noted that “at least in what
they say, White Americans are gradually becoming less prejudiced and more egalitarian”
(p.119). Yet these researchers suggest that “what may have changed across time in the
adjective checklist studies is what people regard as socially desirable rather than racial
attitudes per se” (p.125). This suggests that individuals are aware of existing social norms
and have acknowledged the shift away from explicit prejudice and discrimination in
history. But, simply examining news reports and articles across the television and Internet
demonstrates just how alive-and-well prejudice is in American society.
Organizational climate has been defined as the shared perceptions of employees
about the practices, procedures, and behaviors that are rewarded, supported, and expected
34
in the organization and send strong signals about what behavior is socially accepted
(Schneider, 1990; Schneider & Reichers, 1983). There have been many workplace
climates studied, such as the climate for innovation (Delbecq & Mills, 1985; Klein &
Sorra, 1996); climate for fairness (Colquitt, Noe, & Jackson, 2002); climate for service
(Schneider, 1990; Schneider, Parkington, & Buxton, 1980); climate for burnout (Moliner,
Martinez-Tur, Peiró, Ramos, & Cropanzano, 2005); climate for ethics (Martin & Cullen,
2006); climate for diversity within organizations (Hicks-Clarke & Iles, 2000); climate for
safety (Zohar, 1980); climate for industrial relations (Dastmalchian, 2008); climate for
sexual harassment by clients and customers (Gettman & Gelfand, 2007); and more.
In this study, workplace discrimination climate is the shared perceptions of
employees about aggression based on negative prejudice towards marginalized groups
and its members while at work. A discriminatory climate gauges the link between
discriminatory behaviors and consequences, that is, whether aggressive acts caused by
prejudice, are rewarded, punished, or ignored in the organization. Employee perceptions
of this link represent organizational tolerance for discrimination, a specific dimension of
organizational climate (Hulin, Fitzgerald, & Drasgow, 1996).
Tolerant discriminatory climates are a critical antecedent to negative
psychological and job-related outcomes (Fitzgerald, Hulin, Drasgow, Gelfand, & Magley,
1997; Fitzgerald, Swan, & Fischer, 1995). In tolerant discriminatory climates, employees
perceive weak links between maltreatment and repercussions and strong links between
complaints and backlash or career disruption. These perceptions, in turn, may affect the
reporting behavior of the target (Brooks & Perot, 1991). Thus, measuring a
discriminatory climate versus individual experiences of discrimination should help to
35
reduce this problem and reveal a more accurate picture of workplace discrimination.
Furthermore, there is particular interest in employees’ perceptions of a discriminatory
climate because perceived discriminatory practices are as much a problem for
organizations as actual discrimination itself. Research has found that “employees’ beliefs,
whether or not they are consistent with reality, affect their behaviors” (Ensher, Grant-
Vallone, & Donaldson, 2001, p. 53; Mor Barak, Cherin, & Berkman, 1998), as well as
their decisions to file equal-opportunity lawsuits and related legal action (Sanchez &
Brock, 1996).
Relation to Diversity Climate and Equal Opportunity Climate
In further understanding workplace discrimination climate, a brief discussion on
workplace diversity climate and equal opportunity (EO) climate is presented. Diversity
climate refers to “employees’ shared perceptions of the policies, practices, and
procedures that implicitly and explicitly communicate the extent to which fostering and
maintaining diversity and eliminating discrimination is a priority in the organization”
(Gelfand, Nishii, Raver, & Schneider, 2005, p. 104). An organization with a strong
diversity climate tends to treat diversity as an asset and looks for ways to leverage it in
developing their employees and the organization itself.
Research has shown that these organizations achieve positive customer
satisfaction (McKay, Avery, Liao, & Morris, 2011) and high sales growth (McKay,
Avery, & Morris, 2009). When commitment to diversity is ingrained in the organization’s
values, it results in a pro-diversity climate that employees perceive as their organization
standing for fair employee practices and integration of all employees (McKay et al.,
2009). Cox (1991, 1993, & 1994) conceptualized diversity climate as a multifaceted
36
construct defined by perceptions of six organizational conditions, one of which is low
cultural bias which exists when discrimination and prejudice throughout the organization
are minimized or eliminated.
Examining work-related outcomes, when employees perceive that the
organization embraces diversity and fosters a strong climate for diversity, they are more
likely to feel valued and fulfilled in their job, develop loyalty towards and attitudinal
attachment to the organization, and experience improved interactions with coworkers
(e.g., Cox, 1991; Eisenberger, Fasolo, & Davis-LaMastro, 1990; Gilbert & Ivancevich,
2001; Robinson & Dechant, 1997; Wolfson, Kraiger, & Finkelstein, 2011). Cox (1991,
1993, & 1994) stated that diversity climate influences individual affective outcomes such
as job satisfaction, organizational identification, and job involvement as well as
individual job performance measures such as work quality, productivity, and
absenteeism. However, considering that a workplace discrimination climate represents
policies and practices that condone discriminatory behavior in the workplace, inverse
relationships would be expected.
Equal opportunity climate is defined as "the expectation by an employee that
work-related behaviors directed by others toward the person will reflect merit and not
one's racial/ethnic group, gender, national origin or membership in any other minority
group” (Landis, Dansby, & Faley, 1993, p. 211). The EO climate construct was originally
developed in the armed services and reflects the mandate of Executive Order 9981
(1948), providing equal treatment of all military personnel, regardless of race, religion,
color, and national origin. In addition, EO climate is consistent with CRA (1964, 1991),

37
the ADEA of 1967, and the ADA of 1990, as the measure also includes questions
regarding sex, age, and disabilities.
The equal opportunity and diversity initiatives enacted within the Department of
Defense eventually led to stable research programs aimed at assessing EO climate in
military organizations (e.g., Dansby & Landis, 1998; Knouse & Dansby, 1999; Rosenfeld
et al., 1991). Equal opportunity climate does not measure perceptions about one's self, but
rather about the organization as a whole (Walsh, Matthews, Tuller, Parks, & McDonald,
2010). For example, even a person who is unaffected by low levels of EO climate should
be aware of the lack of equal opportunity for certain protected groups. Hence, collective
perceptions regarding the nature of EO climate can be obtained through aggregated
analyses.
Even though EO climate has some conceptual overlap with diversity climate,
these two types of climate are distinct. Diversity climate is typically assessed in terms of
individuals’ evaluations of and methods for dealing with workplace diversity (van
Knippenberg & Schippers, 2007), whereas, EO climate focuses more specifically on
perceptions of the opportunities and potential favoritism afforded to certain groups of
employees (Dansby & Landis, 1991). Equal opportunity climate reflects:
“The expectation by individuals that opportunities, responsibilities, and rewards will be accorded on the basis of a person’s abilities, efforts and contributions, and not on race, color, sex, religion, or national origin. It is to be emphasized that this definition involves the individual’s perceptions and may or may not be based on the actual witnessing of behaviors” (Dansby & Landis, 1991, p. 392).
Equal opportunity climate has proven to be an important construct in predicting
work outcomes. For example, McIntyre, Bartle, Landis, and Dansby (2002) found that an
38
increase in EO climate was related to an increase in job satisfaction, organizational
commitment, and perceived work group efficacy. However, unlike the present study,
their conceptualization of EO climate was limited to items only assessing racial/ethnic
discrimination. Additionally, low levels of EO climate in a military sample were
associated with lower unit efficiency and lower levels of combat readiness (Truhon,
2008). Estrada, Stetz, and Harbke (2007) reported significant positive relationships
between EO climate and organizational commitment, job satisfaction, and perceived
work group effectiveness in a study of reserve military personnel.
Walsh et al. (2010) revealed that an EO climate for military personnel resulted in
more collaborative team members. Also, Walsh et al. (2010) provided evidence for unit
cohesion mediating the relationship between EO climate and job satisfaction. In
conclusion, taking into account the inverse relationship of diversity climate and EO
climate with this study’s workplace discrimination climate, it is expected that workplace
discrimination climate would have negative relationships with similar outcomes. In other
words, when employees perceive a discriminatory work climate, the effects on the
individual, group, and organization would be deleterious (Corning & Krengal, 2002;
Gutek, Cohen, & Tsui, 1996; Mays & Cochran, 2001).
Organizational Climate: Levels of Analysis
One of the major focuses of climate research has been its multilevel methodology.
First, a distinction between psychological climate and organizational climate (Hellriegel
& Slocum, 1974; James & Jones, 1974) must be made. Psychological climate refers to
when the unit of data collection and the unit of analysis are both at the individual-level.
Psychological climate is how employees perceive and make sense of their work
39
environment by giving meaning to the organization’s policies, practices, and procedures
(James, 1982; Schneider & Rentsch, 1988). Even when individuals are exposed to the
same work context and situations, perceptions are idiosyncratic (James & Tetrick, 1986).
Organizational climate refers to when data collected from individuals is
aggregated to reflect an organizational attribute (i.e., shared perceptions or climate).
Organizational climate emerges from the idiosyncratic interpretations of the work
environment (i.e., policies, practices, procedures, routines, expected interactions and
behaviors, etc.) when individuals within a particular unit (e.g. group, department, or
organization) share similar perceptions. Empirical evidence has indicated that
organizational climate is related to higher-level behaviors and organizational
performance indicators, including customer satisfaction, customer service quality,
financial performance, organizational effectiveness, and total quality management
outcomes (e.g., Borucki & Burke, 1999; Johnson, 1996; Ostroff & Schmitt, 1993;
Schneider & Bowen, 1985)
Psychological and organizational climate are conceptually related to one another
(Schulte, Ostroff, & Kinicki, 2006). Only when individuals agree on their perceptions of
the work environment can their individual perceptions be meaningfully aggregated to
represent unit- or organizational-level climate (James, 1982; Klein et al., 2000).
Psychological climate is a property of the individual, but when shared across individuals
within a unit, the aggregate of the responses represents the construct of organizational
climate (Glisson & James, 2002). As such, organizational climate is an emergent property
because it originates in the interpretations and perceptions of individuals, and is
40
developed through interactions and exchanges with other unit members to manifest as a
higher-level shared phenomenon (Kozlowski & Klein, 2000).
Glick (1985) argued that the unit of theory for organizational climate research is
the organization (or subunit, team, group, department, etc.), not the individual. In order
for climate research to be considered meaningfully different from other individual-level
attitudinal research, the following should occur: (a) climate survey items should assess
organizational functioning, (b) individual-level responses should be aggregated to the
unit-level of analysis, and (c) climate measurement should focus on important
organizational outcomes (Glick, 1985). Even though the level of measurement is the
individual, the level of the construct is the unit or organization (Kozlowski & Klein,
2000). In other words, climate is a property of the unit; it is the organization’s climate,
not the individual’s (Glick, 1985).
Chan (1998) presented five typologies of "composition models" that can be used
in multilevel research to specify the nature of emergent processes from lower levels to
higher ones, they include: (a) additive, (b) direct consensus, (c) referent-shift consensus,
(d) dispersion, and (e) process composition. Composition models "specify the functional
relationships among phenomena or constructs at different levels of analysis…that
reference essentially the same content but that are qualitatively different at different
levels" (Chan, 1998, p. 234). Additive composition models posit that the meaning of the
unit-level construct is an average of the lower level perceptions, regardless of the
variance among those perceptions. Based on this model, climate would be determined by
the average of team member perceptions, regardless of within-team variability in those
41
perceptions. The validity of this model is supported if the group average correlates with
key outcome variables (Chan, 1998).
Consensus composition models (i.e., direct consensus and referent-shift
consensus) also posit that the unit-level construct is an average of the lower-level
perceptions, but contain the additional requirement that variation among those
perceptions is low based on indices of within-group agreement or interrater reliability
(James, 1982; James, Demaree, & Wolf, 1984; Shrout & Fleiss, 1979). In other words,
consensus at the lower level is a necessary condition for construct validity at the higher
level. Most climate research falls under either the direct consensus or the referent-shift
consensus models (Schneider, Ehrhart, & Macey, 2011). The main difference between
the direct consensus and referent-shift consensus models is the wording of the items, or
more specifically, whether respondents are asked about their own perspective or the
perspective of their overall unit (Chan, 1998). Therefore, the relationship between
psychological and organizational climate can be described as compositional in that both
constructs reference the same content but describe qualitatively different phenomena at
the individual and unit levels of analysis (Chan, 1998; James, 1982).
For item construction, the recommendation has been to focus respondents on
descriptions as opposed to evaluating personal feelings (James & Jones, 1974) and to
construct items that reference the higher level, not the level of measurement (James,
1982; Klein, Dansereau, & Hall, 1994; Rousseau, 1985). For example, computing the
mean of team members' self-efficacy scores as an indicator of unit-level team efficacy
would be inappropriate (Guzzo, Yost, Campbell, & Shea, 1993). The mean scores would
be a representation of individual members' perceptions about themselves as individuals,
42
not about the team as a whole. Klein, Conn, Smith, and Sorra (1998) have found that
survey items referencing the unit as a whole (e.g., "My team enjoys the work that we do")
produce less within-group variability and more between-group variability than
comparable survey items that reference individual experiences and perceptions (e.g., "I
enjoy the work that I do").
“There is consensus, though, that if one is studying the climate of the unit as a
whole, one should frame items for respondents such that they describe the unit to which
the items will be aggregated, and thus the level of analysis for analysis!” (Schneider et
al., 2011, p. 381). Making sure that respondents are focused on the correct level of
analysis by describing their units instead of giving their own personal attitude or opinion
is a major step in improving the likelihood that respondents will report unit consensus in
their perceptions. Altogether, taking into account Chan’s (1998) typology and previous
research recommendations, this study uses the direct consensus model and
operationalizes climate as behavioral items likely to occur within the respondent’s unit
versus behavioral items experienced by the individual him- or herself.
As was mentioned previously, consensus is fundamental to the conceptualization
of organizational climate; in order for the mean of individual responses to meaningfully
represent the unit as a whole, climate perceptions must be shared throughout the unit. As
Ashkanasy, Wilderom, and Peterson (2000) noted, there was considerable confusion
about this issue but both within-unit agreement and between-unit differences have been
used as solutions for the issue (Kozlowski & Hattrup, 1992; Bliese, 2000). Nevertheless,
the importance of the two and the necessity of demonstrating adequate levels of both are
not without debate (Chan, 1998; George & James, 1993). Interrater agreement addresses
43
the extent to which raters provide similar absolute ratings of climate (i.e., the same
numerical score on the measure), such that their ratings are interchangeable. The most
common measure of agreement in climate research is rwg (James et al., 1984, 1993),
although other alternatives, such as the average deviation (AD) index (Burke, Finkelstein,
& Dusig, 1999) and awg (Brown & Hauenstein, 2005) have also been proposed. Although
a review of each of these approaches is beyond the scope of this study, the important
issue here is that an adequate level of within-group agreement should be confirmed prior
to data aggregation.
Unlike interrater agreement, interrater reliability does not require absolute
consistency of scores. It is based on the extent to which the rank ordering of the ratings is
consistent across people within units (Bliese, 2000; LeBreton & Senter, 2008). For
instance, if one rater is more lenient than another but the rank ordering is still the same,
then the reliability would be very high but agreement would be low. In general, the
intraclass correlation coefficient (ICC) is a measure of the reliability of measurements or
ratings. For instance, climate researchers will often report the ICC which is the ratio of
between-unit variance to total variance (Bliese, 2000). Intraclass correlation coefficient
values can be interpreted as the percentage of variance explained by group membership
(Bliese, 2000). High ICC values occur when variability within units is low (i.e., there is
within-group interrater agreement) and variability between groups is high. Low ICC
values can result from too much within-group variability and/or too little between-group
variability. Demonstrating within-group agreement is critical to the definition of
organizational climate as shared perceptions.
44
In contrast, a lack of interrater reliability using the ICC may simply indicate a
lack of between-group variability, which limits the ability to detect relationships at the
unit level (Bliese, 2000). As pointed out by Chan (1998), a lack of between-group
variability may indicate that the level of analysis is inappropriate. In other words, if all
subunits within a department have similar means, then the department level may be the
appropriate level of analysis instead of the subunit. George and James (1993) contended
that only interrater agreement, not between-group variability (i.e., interrater reliability), is
needed to justify aggregation. Interrater reliability is important for finding group-level
relationships but not for explaining the appropriateness of data aggregation. As LeBreton
and Senter (2008) pointed out, measures of interrater reliability are rarely used alone in
multilevel modeling because justification of aggregation is typically not based on the
relative consistency of respondents’ scores irrespective of their absolute value. Thus, both
interrater agreement and interrater reliability are presented for all variables in this study.
Collective Value Congruence
Theoretical Framework: Person-Environment Fit
Person-environment (P-E) fit is “the compatibility between an individual and a
particular work environment that occurs when their characteristics are well matched”
(Kristof-Brown, Zimmerman, & Johnson, 2005, p. 281). People develop perceptions of
fit over time, and these perceptions drive individual behavior and choices (Cable &
DeRue, 2002; Cable & Judge, 1997; Kristof, 1996; Verquer, Beehr, & Wagner, 2003). P-
E fit theory assumes that individuals prefer an environment that possesses characteristics
(e.g., values, beliefs, goals) that are similar to their own (Kroeger, 1995). This
conceptualization grew from Lewin’s (1951) interaction theory which states that an
45
individual’s behavior (B) is determined by the interaction between the individual (P) and
the environment (E) represented by the equation: B = f(P, E) (Kristof-Brown, Jansen, &
Colbert, 2002; Schneider, 2001). As noted by Chatman (1989), examining questions
about behavior from an interactionist perspective is important because individuals
influence, and are influenced by, their situations. “[T]he tendencies exist for people both
to choose situations and to perform best in situations that are most compatible to
themselves” (Chatman, 1989, p. 337).
A laboratory experiment by Monson, Hesley, and Chernick (1982) showed the
importance of considering characteristics of both the person and the situation in
determining effects on behavior. Their objective was to identify when extraversion
predicted talkativeness by placing extraverts and introverts in either a strong or weak
situation. Drawing from Mischel's (1977) situational strength research, a strong situation
is one in which everyone interprets the situation similarly, the situation induces uniform
expectancies, the incentives of the situation induce a response to it, and everyone has the
skills to perform in the situation. Results showed that extraversion predicted talkativeness
only when the situation was weak. In strong situations, extraverts were no more talkative
than introverts. As this study illustrates, the opportunity of obtaining more information is
greater when looking at both person and environment characteristics.
Person-environment fit is multidimensional and has been examined at many
different levels: person-vocation fit (P-V fit), person-job fit (P-J fit), person-group fit (P-
G fit), person-supervisor fit (P-S fit), and person-organization fit (P-O fit; Kristof, 1996;
Kristof-Brown et al., 2005). Person-vocation fit is the broadest level of P-E fit (Kristof-
Brown et al., 2005) and includes vocational choice theories that propose a match between
46
a person’s career and their personal interests (e.g., Holland, 1985; Parsons, 1909; Super,
1953). Person-job fit is the fit between an individual’s abilities and the demands of the
job and/or the fit between an individual’s desires and the attributes of a job (e.g.,
Edwards, 1991). Person-group fit is defined as the compatibility between an individual
and his or her work group (e.g., Judge & Ferris, 1992; Kristof-Brown et al., 2005; Werbel
& Gilliland, 1999), where the group can range from a specific work group to
departments, regions, or divisions of an organization. A final form of P-E fit focuses on
the dyadic relationships between individuals and others in the work environment, with
the most well-researched area being the match between supervisors and subordinates
(Person-supervisor fit; e.g., Adkins, Russel, & Werbel, 1994; van Vianen, 2000). Lastly,
P-O fit is broadly defined as the compatibility between a person and the organization.
Person-environment theory posits that positive outcomes occur when the fit
between the person and the situation is congruent. Studies investigating person-job fit, for
example, show that compatibility between the person and his or her job can lead to job
satisfaction and better performance (Caldwell & O’Reilly, 1990; O’Reilly, 1971).
Additionally, scholars have found overall P-E fit relates positively to important job
attitudes (e.g., job satisfaction, subjective career success, and intentions to remain) and
job behaviors (e.g., core task performance and citizenship behavior; Hoffman & Woehr,
2006; Kristof-Brown et al., 2005). This study conceptualizes fit as perceptions of value
congruence between the organization and its members (i.e., P-O fit). The following
section will take a closer look at the P-O fit literature followed by a brief discussion of P-
G fit.
47
Person-Organization Fit
Person-organization fit (P-O fit) is the most widely studied area of P-E fit. The
concept of P-O fit is important to organizations because it suggests that if people fit well
with an organization, they are likely to exhibit more positive attitudes and behaviors. This
relation is supported by the literature, and many studies have found relations between P-
O fit and work-related attitudes and behaviors (e.g., Boxx, Odom, & Dunn, 1991; Posner,
1992; Saks & Ashforth, 1997; Ugboro, 1993). However, due to the many
conceptualizations and operationalizations of P-O fit, as well as its limited distinction
from other forms of P-E fit, a singular definition of P-O fit is elusive (Judge & Ferris,
1992; Rynes & Gerhart, 1990).
In an attempt to organize the varying conceptualizations of P-E fit, Kristof (1996)
summarizes multiple conceptualizations in her discussion of P-O fit. Kristof’s
conceptualizations of fit pertain to the notion of needs fulfillment. The first of these
conceptualizations is the needs-supplies perspective, or the view that fit occurs when the
organization satisfies individual needs, desires, or preferences (Kristof, 1996). In contrast
to the needs-supplies perspective is the demands-abilities perspective, which proposes
that fit occurs when the individual has the abilities necessary to meet organizational
demands (Kristof, 1996). Two additional conceptualizations of fit, presented next, deal
with the compatibility of individual and organizational characteristics originally
discussed by Muchinsky and Monahan (1987).
Muchinsky and Monahan (1987) provided two perspectives: supplementary fit
and complementary fit. Supplementary fit occurs when an individual “supplements,
embellishes, or possesses characteristics which are similar to other individuals” in an
48
environment (Muchinsky & Monahan, 1987, p. 269). This fit perspective is represented
as the similarities between individual characteristics (e.g., values, goals, personality, and
interests) and organizational and vocational characteristics (e.g., values, goals,
personality, and interests). For example, supplementary fit indicates that an individual
perceives that he or she “fits in” with the environment because of similar characteristics
(e.g., values, personality) with others in the environment.
Alternatively, complementary fit occurs when there is a “match between an
individual’s talents and the corresponding needs of the environment” (Muchinsky &
Monahan, 1987, p. 268). By complementary, they meant that the “characteristics of an
individual serve to make whole or complement the characteristics of an environment. The
environment is seen as either deficient in or requiring a certain type of person in order to
be effective” (Muchinsky & Monahan, 1987, p. 271). For example, complementary fit
indicates that an individual adds strength to a deficient environment with the addition of
his or her resources (e.g., time; effort; and knowledge, skills, abilities, and other
characteristics, KSAOs). Thus, in consolidating the various perspectives, Kristof (1996)
defined P-O fit as "the compatibility between people and organizations that occurs when
(a) at least one entity provides what the other needs, (b) they share similar fundamental
characteristics, or (c) both" (p. 4-5).
Certainly, supplementary and complementary fit occur in work teams as well. A
team may be comprised of individuals with similar attributes, skills, or personalities,
reflecting supplementary fit. On the other hand, a team may be comprised of individuals
who add unique skill sets to the group, reflecting complementary fit. The debate between
supplementary and complementary fit in work teams has been discussed extensively in
49
the team composition literature. Currently, there is mixed evidence concerning which
type of fit is best for team performance (Barsade, Ward, Turner, & Sonnenfeld, 2000).
Generally speaking, the outcomes of supplementary and complementary fit in teams
depend upon the particular criterion of interest. Supplementary fit with respect to
attitudes, values, and goals tends to increase group cohesiveness (Cartwright & Zander,
1960; Varney, 1989), but hurts group creativity. On the other hand, complementary fit on
technical skills and abilities improves group problem solving and creativity, but can hurt
cohesiveness (Guzzo & Dickson, 1996).
Person-Group Fit
According to Kristof-Brown and Guay (2010), person-group fit (P-G fit) is the
most emerging area of P-E fit. There is relatively little research on the compatibility or fit
between a person and his or her work group (Kristof, 1996; for two exceptions, see
Kristof-Brown & Stevens, 2001, and Kristof-Brown et al., 2002). Person-group fit
suggests that if people fit well with their coworkers, they are likely to exhibit more
positive attitudes and behaviors. This notion is supported by research that has found
relations between P-G fit and work-related attitudes and behaviors (e.g., Adkins, Ravlin,
& Meglino, 1996; Becker, 1992; Burch & Anderson, 2004, 2008; Good & Nelson, 1971;
Kristof-Brown & Stevens, 2001; Vancouver & Schmitt, 1991; Witt, 1998).
It is argued that research on relational demography (e.g., Jackson et al., 1991;
Tsui et al., 1992) qualifies as a form of P-G fit. Relational demography is based on the
assumption that the person’s self-comparison with those he or she interacts with will
affect his or her behavior and work attitudes (Riordan & Shore, 1997). However,
although demography assesses a person’s similarity to fellow group members, the
50
emphasis is generally on demographic variables (such as race, age, gender). Milliken and
Martins (1996) and Harrison, Price, and Bell (1998) categorize demographic variables as
surface-level or easily observable attributes and contrast them with other deep-level,
underlying characteristics such as values or goals. Harrison et al. (1998) demonstrated
that there are meaningful differences between similarity on surface-level and deep-level
characteristics, and that over time it is fit on deep-level characteristics that has the
greatest impact on outcomes.
Person-group fit has been found to be contingent upon the organization’s culture.
Depending on the size and age of the organization, group culture may reflect the
organization’s culture (Schein, 1991). Schein claimed that as an organization grows and
evolves, differentiation occurs among subunits of the organization (i.e., departments,
regional offices, work teams, etc.), and this differentiation creates subcultures. Siehl and
Martin (1984) proposed three types of subcultures: enhancing subcultures, orthogonal
subcultures, and countercultures. Enhancing and orthogonal subcultures are similar to the
dominant organization’s culture, while countercultures espouse assumptions, beliefs, and
values opposite of the overall culture of the organization. Thus, even if an organization
supports diversity and equality for all of its employees, if particular subunits of the
organization (i.e., teams) condone discriminatory behavior, this can potentially override
the organization’s justice and diversity culture.
Dimension of Fit for Person and Environment: Values
While researchers have used several different dimensions along which to
conceptualize fit, a fundamental requirement of fit theory is that conceptualization must
occur on commensurate dimensions for both the person and environment (e.g., values,
51
goals, personality, interests, norms, attitudes, etc.). Without commensurate dimensions, it
is impossible to directly compare person and environment characteristics (Edwards,
Caplan, & Harrison, 1998; French, Rogers & Cobb, 1974). The present study is
concerned with the value congruence between team members and their organization;
therefore, a supplementary fit perspective is taken. In fact, the most frequently used
operationalization of supplementary fit perspective is the congruence between individual
and organizational values (e.g.. Cable & Judge, 1996; Chatman, 1989, 1991; Harris &
Mossholder, 1996; Meglino, Ravlin, & Adkins, 1989; O ’Reilly, Chatman, & Caldwell.
1991; Piasentin & Chapman, 2006). Value congruence is a significant form of fit because
values are "fundamental and relatively enduring" (Chatman, 1991, p. 459) and are the
components of organizational culture that guide employees' behaviors (Schein, 1992).
Chatman (1989), widely cited with developing the seminal theory of P-O fit
(Kristof-Brown et al., 2005), conceptualized fit as “the congruence between the norms
and values of organizations and the values of persons” (p. 339). Thus, extending
Chatman’s (1989) conceptualization of P-O fit and taking into consideration the potential
of subcultures created within an organization’s teams (Schein, 1991; Siehl and Martin,
1984), this dissertation examines value congruence at the unit-level to identify the extent
to which a team’s perception of value congruence explains the relationship between
workplace discrimination climate and other team-level outcomes. Subsequently, the
importance of value congruence is presented.
Importance of Value Congruence
A substantial volume of research has acknowledged the importance of congruence
between the values of employees and organizations (Chatman, 1989; Kristof, 1996;
52
Ostroff & Judge, 2007). According to Schwartz (1992), values (a) are beliefs that
transcend specific actions and situations; (b) pertain to desirable goals or behaviors that
motivate action; (c) serve as standards or criteria that guide interpretation of actions,
policies, people, behaviors, and events; and (d) vary in terms of relative importance.
Individuals draw from their values to guide their decisions and actions; likewise,
organizational value systems provide norms that specify how organizational resources
should be allocated and how organizational members should behave. Value congruence
refers to the similarity between an individual’s values and the cultural value system of an
organization (Chatman, 1989; Kristof, 1996).
When employees hold values that match the values of their employing
organization, they identify with the organization, are satisfied with their jobs, and seek to
remain with the organization (Kristof, 1996; Kristof-Brown et al., 2005; Meglino &
Ravlin, 1998; Verquer et al., 2003). The favorable outcomes of value congruence are
relevant to employees as well as organizations, as they help organizations minimize
turnover costs, promote extra-role behaviors linked to positive employee attitudes, and
allow employees to feel a sense of fulfillment from their work roles (Cascio, 1999;
Podsakoff, MacKenzie, Paine, & Bachrach, 2000; Riketta, 2005).
Organizations are defined by the people within them. Therefore, an organization’s
values system can either be accepted and carried out by its employees or rejected by
them. Research has illustrated that individuals with value congruence benefit from
improved communication and increased predictability in social interactions (Festinger,
1954; O’Reilly et al., 1991; Tsui & O’Reilly, 1989). Additionally, they are also more
attracted to and trusting of others who are similar to them (e.g., Byrne, 1969; Tsui &
53
O’Reilly, 1989). Research on the similarity-attraction paradigm indicates that interactions
with similar others are gratifying because they affirm one’s own beliefs, and positive
feelings that result from such interactions are ascribed to the similar others who act as the
source of affirmation (Byrne, 1971; Newcomb, 1956).
A large number of studies have shown that value congruence promotes
communication within organizations (Erdogan & Bauer, 2005; Erdogan, Kraimer, &
Liden, 2004; Kalliath, Bluedorn, & Strube, 1999; Kemelgor, 1982; Meglino & Ravlin,
1998; Meglino et al., 1989, 1991; Posner, Kouzes, & Schmidt, 1985; van Vianen, De
Parter, Kristof-Brown, & Johnson, 2004). Communication refers to the open exchange of
information among members of the organization through formal and informal interactions
(Goldhaber, Yates, Porter, & Lesniak, 1978). Holding similar values for what is
important establishes common grounds for classifying, describing, and interpreting
events (Erdogan et al., 2004; Meglino & Ravlin, 1998; Schall, 1983). In turn, this helps to
facilitate the exchange of information and reduce the likelihood of misunderstanding
(Kalliath et al., 1999; Meglino et al., 1989, 1991).
Thus, interpersonal similarity based on value congruence allows for greater
frequency and quality of communication (Jablin, 1979; Lincoln & Miller, 1979; Padgett
& Wolosin, 1980; Roberts & O’Reilly, 1979; Smith, Smith, Sims, O’Bannon, & Scully,
1994; Swann, Polzer, Seyle, & Ko, 2004; Triandis, 1959; Williams & O’Reilly, 1998;
Zenger & Lawrence, 1989). Also, as stated by the uncertainty reduction theory of
communication (Berger, 2005; Berger & Calabrese, 1975), communication helps to
reduce uncertainty in social interactions allowing organizational interactions to be more
predictable.
54
Predictability refers to the confidence people have in their beliefs about how
events will unfold and how others will act (Miller, 1981). When employees possess
similar values they have similar motives, set similar goals, and respond to events in
similar ways (Kluckhohn, 1951; Meglino et al., 1991; O’Reilly, Chatman, & Caldwell,
1991; Pearce, 1981). Also, they have clearer role expectations because they can more
accurately predict behavior (Kluckhohn, 1951) by using their own motives and goals to
anticipate the actions of the organization and its members (Schein, 1990). In such
situations, individuals experience less role ambiguity and conflict and are more satisfied
and committed to their organization (Fisher & Gitelson, 1983). Theoretically, this notion
stems from research on relational demography, which suggests that interpersonal
similarity promotes mutual understanding and reduces uncertainty concerning how others
will behave (Pfeffer, 1983; Smith et al., 1994).
Equally important in the value congruence literature is the level of trust amongst
organizational members. Trust is “the willingness of a party to be vulnerable to the
actions of another party based on the expectation that the other will perform a particular
action important to the trust or, irrespective of the ability to monitor or control that other
party” (Mayer, Davis, & Schoorman, 1995, p. 712). Trust is vital to organizational
effectiveness (Golembiewski & McConkie, 1975). Research on value congruence has
shown that shared values support the development of trust in relationships (Christiansen,
Villanova, & Mikulay, 1997; Enz, 1988; Jehn & Mannix, 2001; Lau, Liu, & Fu, 2007).
Likewise, research on trust has revealed that trust is likely to develop and endure when
people hold similar values (Elangovan & Shapiro, 1998; Jones & George, 1998; Mayer et
al., 1995; McAllister, 1995; Sitkin & Roth, 1993; Williams, 2001). Trust among people
55
in an organization improves managerial problem solving (Boss, 1978; Zand, 1972) and
group interaction (Friedlander, 1970).
Positive feelings toward others can also promote trust because emotional bonds
that connect people become the basis for developing trust (McAllister, 1995) and positive
feelings toward others encourages compassion and benevolence that build trust
(Williams, 2001). Value congruence can promote trust by creating perceptions of
integrity whereby employees believe the organization adheres to principles that are
acceptable (moral integrity, encompassing honestly, fair treatment, and avoidance of
hypocrisy; Mayer et al., 1995) and shares basic assumptions about what is right and
wrong (Jones & George, 1998; Sitkin & Roth, 1993). Moreover, because an
organization’s values are reflected onto the employees who work there (Dutton &
Dukerich, 1991), value incongruence results in cognitive dissonance and dissatisfaction
(O’Reilly et al., 1991). In the following section, a closer look at how workplace
discrimination relates to person-organization fit, and more specifically to value
incongruence, is examined.
Relation to Workplace Discrimination: A Deontic Justice Perspective
Attraction-selection-attrition theory states that individuals are attracted to and
seek to work for organizations where they perceive high levels of person-organization fit
(Schneider, 1987). Thus, if high value congruence reaps positive outcomes for the
organization, such as reduced turnover, increased citizenship behaviors, and
organizational commitment (Andrews, Baker, & Hunt, 2010; Gregory, Albritton, &
Osmonbekov, 2010) and positive outcomes for the individual, such as job satisfaction and
identification (Kristof, 1996; Kristof-Brown et al., 2005; Meglino & Ravlin, 1998;
56
Verquer et al., 2003), then opposite results can be expected for value incongruence.
Based on present-day social norms, outright displays of prejudice and discrimination are
considered immoral and unacceptable (Dovidio & Gaertner, 1986, 1998). Therefore, if an
organization condones such behaviors, then they are inadvertently saying that they do not
value fair and equal treatment of all their employees. The organization’s integrity comes
into question and results in value incongruence between the organization and its
members.
Researchers have argued that individuals are motivated to act ethically and to
believe that societies operate by a set of moral standards (e.g., Cropanzano, Goldman, &
Folger, 2003; Cropanzano, Goldman, & Folger, 2005; Cropanzano, Stein, & Goldman,
2007; Folger, 1998). These authors also assert that individuals have a need to see others,
including strangers, be treated fairly. Since fairness is a social norm that prescribes
equitable treatment as a moral principle, third-party observers will disapprove of a person
who transgresses against others (Blau, 1964). Individuals are born with an innate capacity
to care about morality, and they are predisposed to maintain cooperative systems by
rewarding those who behave morally and punishing those who do not (Skitka, Bauman,
& Mullen, 2008).
“Moral judgment and the condemnation of others, including fictional others and
others who have not harmed the self, is a universal and essential feature of human social
life” (Rozin, Lowery, Imada, & Haidt, 1999, p. 574). This perspective also claims that
caring about morality is independent of material self-interest or belongingness needs
(Skitka et al., 2008). For example, Turillo, Folger, Lavelle, Umphress, and Gee (2002)
completed a series of four laboratory experiments wherein participants were willing to
57
sacrifice their financial self-interest in order to punish individuals for unfair treatment
against others. The authors concluded that people are motivated to act on the basis of an
internalized set of duties to uphold moral norms. Furthermore, even with no connection
to the victim or opportunity for personal gain, participants still punished wrongful acts to
correct for the social injustice witnessed.
Evolving from fairness theory, deonance theory maintains that people react
negatively to unfairness because of three things: (a) an undesirable event or outcome has
occurred, (b) someone’s discretionary actions caused the outcome, and (c) the actions
violate moral principles (Folger & Cropanzano, 2001). People innately care about moral
principles and become upset when those principles are violated (Folger, Cropanzano, &
Goldman, 2005). Folger (2001) coined the term deonance, a psychological state yielding
emotionally charged reactions to events seen as violating moral norms about social
conduct. The Greek term deon refers to one’s obligation or duty, as expressed by terms
such as should, must, or ought not do. Deonance perspectives have been in existence for
quite some time. The term, deontic, is widely used in cognitive psychology (e.g.,
Bucciarelli & Johnson-Laird, 2005), in philosophy as deontic logic, and in linguistics. In
fact, linguists say that should and related auxiliary verbs exhibit the deontic mood or
modality, as in “an individual should not steal.”
Justice includes treating others as they should or deserve to be treated by adhering
to standards of right and wrong. In other words, justice is partially a judgment about the
morality of an outcome, process, or interpersonal interaction (Greenberg, 1987). It is
concerned with what people view as ethically appropriate, and not merely what serves
their self-interest or group-based identity. The deontic justice perspective aims to
58
describe why people care about fairness and why they react negatively to unfair treatment
received by others (Cropanzano et al., 2003; Folger, 2001). Furthermore, deontic justice
suggests that individuals have a value-based system of beliefs about how human beings
should be treated. These beliefs become the standard against which treatment of others is
judged. As such, people take into account what is ethically and morally appropriate when
they make decisions about the fairness of others (Cropanzano et al., 2003; Folger, 2001).
Individuals react emotionally to violations, and these reactions often have long-
term effects on social relationships between violators and third parties (Rozin, Lowery,
Imada, & Haidt, 1999). Based on the deontic justice perspective, it is expected that a
climate for workplace discrimination would go against an employee’s values of equal and
fair treatment for all individuals, resulting in value incongruence and adverse
repercussions for organizations and work teams within them. For instance, cooperation
and trust in organizations are contingent upon employees being treated with respect and
dignity. Such treatment will motivate individuals to engage in cooperative behaviors
whereas violations of fair employee treatment would produce antagonistic results.
The present study proposes that perceived discrimination against marginalized
group members, as well as an organization that fosters such behaviors, will result in
attenuated value congruence between the employee and organization. This is consistent
with the deontic justice concept of moral accountability which emphasizes that “codes of
conduct” govern interpersonal relationships (Folger, 2001). Also important is the theory
of third-party reactions to mistreatment of others which suggests that not only are victims
of unfair circumstances likely to take action but so, too, are neutral observers when they
believe moral or ethical standards have been breached (Cropanzano et al., 2003, 2005).
59
Not only is discrimination both legally and morally wrong (Demuijnck, 2009; Dipboye &
Colella 2005), but such actions send a signal to all employees about the integrity of the
organization and its leaders (Goldman, Slaughter, Schmit, Wiley, & Brooks, 2008;
Salancik & Pfeffer, 1978). This aspect of justice goes beyond a focus on individuals’
tangible benefits, such as social standing or rewards, in that many individuals are
concerned about the welfare of others.
Discriminatory acts or tolerance for discriminatory acts are likely to be judged by
employees relative to their ethical and moral standards. Employees in organizations
observe how others are being treated, therefore, it is important to understand the negative
reactions that some employees have towards the ill-treatment of others, especially in their
immediate work teams. This is consistent with research showing that when employees
perceive discrimination in the organization in general (directed at themselves or at
others), they are more likely to say that the organization has a deontic deficiency,
meaning that it lacks integrity (Goldman et al., 2008). This implies that perceiving
mistreatment toward marginalized group members at work may damage the company’s
reputation in the eyes of the observer employees, especially those with a high value for
diversity (Triana, Wagstaff, & Kim, 2012).
Perceptions of deontic-based need fulfillment are likely to be very important to
individuals, as their moral and ethical standards could be driven by long-held
assumptions, beliefs, and values, often related to religion or secular humanism (Kohlberg
& Ryncarz, 1990). According to Cottrell, Neuberg, and Li (2007), trustworthiness is the
most valued trait in other people. However, a complex social world allows only partial
inferences to be made about the trustworthiness of others (e.g., Simpson, 2007), and
60
individuals may come to use a variety of heuristic cues when evaluating trustworthiness.
One such cue is assessing a person’s fair and ethical treatment of others. Discrimination
tears down trust and causes less value congruence between individuals in a work team.
Also, Robinson and Rousseau (1994) discussed the “spiral reinforcement” (p. 255) effect
of trust, where an initial lack of trust may lead to a further decline. A lack of trust
decreases the quantity and quality of communication (O’Reilly & Roberts, 1976),
cooperation (Deutsch, 1973), effective problem solving (Boss, 1978), and performance
(Zand, 1972).
Hypothesis 3: Workplace discrimination climate is negatively related to collective value
congruence.
Team Cohesion
Organizations have increasingly turned to the use of work teams to get the job
done (Cannon-Bowers, Oser, & Flanagan, 1992; Cohen & Bailey, 1997; Guzzo & Shea,
1992; Hackman, 1986, 1987, 1992; Ilgen, 1999; Ilgen, Hollenbeck, Johnson, & Jundt,
2005; Kozlowski & Bell, 2003; Sundstrom, McIntyre, Halfhill, & Richards, 2000).
Sundstrom, DeMeuse, and Futrell (1990) defined teams as “small groups of
interdependent individuals who share responsibility for outcomes for their organizations”
(p. 120). Similarly, Kozlowski and Ilgen (2006) summarized earlier research to derive the
following definition of teams:
“(a) two or more individuals who (b) socially interact (face-to-face or, increasingly, virtually); (c) possess one or more common goals; (d) are brought together to perform organizationally relevant tasks; (e) exhibit interdependencies with respect to workflow, goals, and outcomes; (f) have different roles and responsibilities; and (g) are together embedded in an encompassing

61
organizational system, with boundaries and linkages to the broader system context and task environment” (p. 79).
In the literature, the terms work group and work team have been used
interchangeably. However, many researchers argue that work groups describe groups of
people who perform independent jobs but share common goals and interact socially,
while work teams are groups of people with specified roles and high levels of
interdependence working together to achieve results (Guzzo & Dickson, 1996). For
example, employees within a Finance department represent a work group when their
common goals involve accurately maintaining and accounting for the company’s
finances, but they mostly work toward these goals independently.
On the other hand, a company-wide task force that brings together different
members with specified roles (e.g., Human Resources, Finance, IT, Marketing, etc.)
working interdependently to achieve a common goal or end-product would illustrate a
work team. Nevertheless, according to Sundstrom et al. (2000), although some
researchers distinguish between these terms, “the distinction has been neither consistent
or widely recognized” (p. 44). As argued by Cannon-Bowers and Bowers (2010), “it is
the defining characteristics and features of the construct that are important, not strictly the
label” (p. 599).
Interdependence is a defining characteristic of teams (Guzzo & Shea, 1992; Salas,
Dickinson, Converse, & Tannenbaum, 1992; Shea & Guzzo, 1987; Tannenbaum, Beard,
& Salas, 1992) and is often the reason teams are formed in the first place (Mintzberg,
1979). Whether based in task inputs and processes or in shared goals and rewards,
interdependence establishes connections and increases the need for cooperation between
62
team members (Saavedra, Earley, & Van Dyne, 1993; Thompson, 1967). Due to the fact
that high interdependence is characteristic of effective teams, presumably there is an
equally high level of cohesion needed amongst team members to accomplish activities
(Cartwright, 1968; Davis, 1969).
In a meta-analytic review, Gully, Devine, and Whitney (1995) found that the
relationship between cohesion and performance was moderated by task interdependence.
Under high levels of task interdependence there was a stronger relationship between
cohesion and performance. These findings indicate that cohesion is even more important
to performance when teams have a high degree of interaction on a task. Essentially, the
more interdependent a team becomes while working on a task, then the more interaction
team members will have with one another. Also, research has found that greater group
interdependence leads to stronger associations between cohesion and performance (e.g.,
Beal, Cohen, Burke, & McLendon, 2003).
Cohesion refers to the extent to which people interact frequently and intensely and
are, therefore, influenced by those with whom they have direct interaction (Burt, 1987;
Meyer, 1994). More specifically, Carron (1982) defined cohesion as “a dynamic process,
which is reflected in the tendency for a group to stick together and remain united in the
pursuit of its goals and objectives” (p. 124). Similarly, group cohesion has also been
defined as:
“the strengths of the bonds linking group members to the group, the unity (or we-ness) of a group, feelings of attraction for specific group members and the group itself, and the degree to which the group members coordinate their efforts to achieve goals” (Forsyth, 1999, p. 9).
63
Across these definitions of cohesion is a sense of togetherness and unity that team
members feel toward their teammates and tasks. As a matter of fact, Gross and Martin
(1952) described cohesion in terms of two underlying dimensions, task cohesion and
interpersonal cohesion. Task cohesion is a group’s shared commitment or attraction to the
group task or goal, and is thought to increase commitment to the task and to increase
individual effort by group members on the task. Interpersonal cohesion is defined as the
group members’ attraction to or liking of the group (Evans & Jarvis, 1980). Interpersonal
cohesion allows groups to have more open communication and to effectively coordinate
their efforts.
Highly cohesive teams work as one unit with every member’s involvement
contributing towards the goal. Members of cohesive groups are also able to share their
feelings and inner thoughts more freely because of the sense of acceptance (Valore,
2002). They also have higher levels of empathy, acceptance, self-disclosure, and trust
among group members (Roarck & Sharah, 1989) than less cohesive teams. Cohesiveness
is important because it has been shown to be positively linked to group effectiveness
(Dion & Evans, 1992; Evans & Dion, 1991; Gully et al., 1995; Mullen & Cooper, 1994).
This tendency for a group to stick together stems from the interpersonal attraction toward
the team. Interpersonal attraction to a group involves an individual’s degree of
identification with the group or the degree to which they see themselves belonging to that
particular group over others (Friedkin, 2004).
Strong interpersonal relationships are a critical component for effective teamwork
(Lott & Lott, 1965). Sense-making occurs as a result of social interaction with, and direct
persuasion by, team members. Consequently, members tend to share their views and
64
opinions and are motivated to agree in their attitudes and behaviors. Cohesion is
particularly intense in teams, given that task interdependence requires and results in more
cooperative behavior and information sharing than does individual-based work (e.g.,
Campion, Medsker, & Higgs, 1993; Campion, Papper, & Medsker, 1996; Janz, Colquitt,
& Noe, 1997).
Individuals within the same unit, team, or department tend to influence one
another (Salanick & Pfeffer, 1978), thus creating their own social environment and
establishing their own group norms (Festinger, 1950; Schneider, 1987; Schneider,
Goldstein, & Smith, 1995; Sundstrom et al., 2000). This cohesion also facilitates the
exchange of information among team members by providing the opportunity for all
members to discuss organizational policies and practices and to jointly interpret the
team’s experiences. Forsyth (1999) stated that “a cohesive group creates a healthier
workplace, at least at the psychological level (p. 161).” As a result, team members’
interpretations and evaluations of the team’s experiences may converge, resulting in
shared perceptions (i.e., climate).
When people enter a situation involving interdependence (e.g., teamwork), they
go through a judgmental phase (Lind, 2001). In this phase, a member of a team must
decide the costs and benefits of cooperating with a team. Team members that share a
group identity will want to contribute to group goals, because success for the group
would mean success for them as well (Brewer & Kramer, 1986). In teams that work well
together, there is a positive relationship with job satisfaction and organizational
commitment (Walsh et al., 2010). Similarly, Tjosvold (1998) showed that collaboration
and problem-solving have been positively associated with interpersonal and unit-level
65
effectiveness. However, since people working in the same team have more chances of
interacting with one another, they also have equal chances of engaging in negative as
well as positive behaviors (Forsyth, 1999).
If team members believe they are treated unfairly, either because their efforts and
resources are not rewarded or they are treated disrespectfully, it is less likely that they
will cooperate with a team. Individuals who report incidences of organizational
discrimination also tend to report less job satisfaction, organizational commitment, and
engage in fewer organizational citizenship behaviors (Ensher et al., 2001). Overt fighting,
competition, and active confrontation have been associated with reduced effectiveness at
the interpersonal and small-group level (De Dreu & Gelfand, 2008). Also, individuals
who have experienced unfair treatment are more likely to leave their jobs, show lower
levels of commitment, and may even start behaving in anti-normative ways (Greenberg,
1993).
These studies illustrate how people identify with and perform for a team, based on
perceptions of fairness or discrimination. Further, results from these studies support one
of the major tenets of the fairness heuristic theory (FHT): "Fairness judgments are
assumed to serve as a proxy for interpersonal trust in guiding decisions about whether to
behave in a cooperative fashion to social situations" (Lind, 2001, p. 56). If team members
do not trust the group to protect their interests and safety, they are more likely to work for
themselves (i.e., individual mode) as opposed to group interests (i.e., group mode; Lind,
2001).
People are either operating in group or individual mode. In order to shift from
individual mode to group mode, a person must feel a sense of trust that they will be
66
treated fairly when sacrificing personal resources for the team (Lind, 2001). An
organizational climate that does not promote equal opportunities likely incites feelings of
mistrust. Numerous organizational justice researchers have shown that employees are
happier and teams function more smoothly when group members believe they are treated
fairly (e.g., Jones & Lindley, 1998; Kirkman, Jones, & Shapiro, 2000; Kirkman, Shapiro,
Novelli, & Brett, 1996; Philips, 2002; Phillips, Douthitt, & Hyland, 2001). These results
stem from research showing that organizational climate can have a strong effect on
employees’ attitudes and behaviors (Colquitt, 2001; Colquitt, Conlon, Wesson, Porter, &
Ng, 2001). Altogether, if team members feel harassed because of their demographic
characteristics, they are less likely to bond with their team members (i.e., cohesion) and
perform as a team due to violation of trust.
According to Wellen and Neale (2006), the team cohesiveness can be threatened
by what they identified as “deviant” team members. Deviant individuals are particularly
influential members because their behavior stands out against a background of ongoing
normative behavior (Blanton & Christie, 2003; Fiske, 1980). Deviant behaviors diverge
from work norms in a manner that has negative implications for other individuals and the
organization. A deviant individual has the incredible ability to impact team perceptions as
well as reduce team effectiveness, productivity, trust, and cohesion (Wellen & Neale,
2006).
The atypical behaviors displayed by deviant individuals are likely to be noticed
and recalled when group members make judgments about the group as a whole. Feelings
of unfairness that stem from discriminatory behavior motivate employees to behave
negatively toward their organization (Goldman et al., 2006), and these negative reactions
67
are especially salient in the context of work teams. Thus, understanding what employees
judge to be just and fair is a key issue for understanding organizational behavior
(Cropanzano & Folger, 1989, 1991; Cropanzano & Greenberg, 1997; Folger &
Konovsky, 1989; Greenberg, 1990, 1993) and teams. Furthermore, when team members
perceive a high likelihood of deviant behaviors (e.g., discrimination) in the workplace, it
results in negative effects on team cohesion and, in turn, team effectiveness. Meta-
analytic evidence shows that cohesion is a reliable predictor of team outcomes such as
performance, satisfaction, turnover, and well-being (Oliver, Harman, Hoover, Hayes, &
Pandhi, 1999). Thus, if teams produce their own group norms (Festinger, 1950), then
engaging in and permitting discriminatory behaviors would result in a climate for
discrimination, reduced team cohesion, and lower team effectiveness.
Hypothesis 4: Workplace discrimination climate is negatively related to team cohesion.
Hypothesis 5: Collective value congruence is positively related to team cohesion.
Collective Affective Commitment
Organizational commitment refers to the extent to which employees are dedicated
to, willing to work on the behalf of, and intend on retaining membership at the
organizations that employ them. Organizational commitment is a very complex,
multidimensional construct of interest within the field of I/O research (Meyer & Allen,
1997). Scholars argue that commitment differs from other work constructs, in particular
employee engagement and job satisfaction, because commitment is an affective
attachment to the goals and values of an organization as a whole, as opposed to the work
itself (Brooke, Russell, & Price, 1988; Christian, Garza, & Slaughter, 2011; Maslach,
Schaufeli, & Leiter, 2001).
68
For example, Schaufeli, Salanova, González-Romá, and Bakker (2002) define
engagement as an employee’s vigor, dedication, and absorption in one’s work. Vigor is
characterized by high levels of mental resilience and energy while working. Dedication is
being firmly involved in one's work, and experiencing a sense of meaning and
enthusiasm. Lastly, absorption is being fully engrossed in one’s work, whereby time
passes quickly and it is difficult to detach oneself from work. Job satisfaction, on the
other hand, reflects “a positive (or negative) evaluative judgment one makes about one's
job or job situation” (Weiss, 2002, p. 175).
Overall, commitment is more global, reflecting a general affective response to the
organization as a whole. It is the attachment to the employing organization, including its
goals and values, as opposed to one’s affective orientation to the job (i.e., job
satisfaction) or enthusiasm with the work (i.e., employee engagement). Meyer and Allen
(1991) proposed that there are three different types of commitment: affective,
continuance, and normative. Affective commitment refers to the extent to which an
employee is committed to their organization because they identify with and feel loyalty
towards it. Continuance commitment refers to the idea that an individual may remain
committed to an organization because they have made an investment in it and have
determined that there would be costs if they chose to leave. Normative commitment
refers to the notion that an employee may be committed to an organization because they
feel a sense of obligation to the company and stay with them because morally, it is the
right thing to do (Meyer & Allen, 1991).
The present study is particularly concerned with an employee’s desire to remain
part of the organization as well as his or her identification with the goals and values of
69
the organization (i.e., affective commitment). Affective commitment is an attitudinal
construct that captures employees’ emotional bonds to their organization and their
willingness to exert effort on behalf of the organization (Meyer & Allen, 1997; Mowday,
Porter, & Steers, 1982). “Attitudinal commitment focuses on the process by which people
come to think about their relationship with the organization... a mind set in which
individuals consider the extent to which their own values and goals are congruent with
those of the organization” (Mowday et al., 1982, p.26).
Similar to the value congruence seen when an employee fits well with their
environment, the same is expected when an employee is strongly committed to their
organization. In other words, when the values of employees match those of their
organization, they identify with the organization, are satisfied with their jobs, and seek to
remain with the organization (Kristof, 1996; Kristof-Brown et al., 2005; Meglino &
Ravlin, 1998; Verquer et al., 2003). Furthermore, when employees feel a strong
connection to their team members because of shared feelings of equality and justice, this
will likely increase affective commitment. For instance, Wech, Mossholder, Steel, and
Bennett (1998) found that perceptions of work team cohesion significantly predicted
organizational commitment.
Wolfson, Kraiger, and Finkelstein (2011) explain how value (in)congruence
explains in part why a climate for discrimination is related to affective outcomes, such as
organizational commitment. Value congruence refers to the degree of congruence (or fit)
in values between individuals and their organization. Researchers have found value
congruence to be related to various outcomes, including: organizational commitment,
employee satisfaction, likelihood to quit, and actual turnover (O’Reilly, Chatman, &
70
Caldwell, 1991; Verquer et al., 2003). Since research suggests that individuals have the
innate desire to act morally and ethically (e.g., Folger & Cropanzano, 2001) as well as
react negatively to third-party discrimination (e.g., Cropanzano et al., 2003, 2005), there
is reason to believe that in a climate with no match between employees’ beliefs for
fairness and an organizational climate for discrimination, employees will have less
favorable affective experiences.
In other words, in an organization that allows discrimination against marginalized
group members, where employees perceive injustice and do not feel that their values are
being met, climate perceptions are more likely to be negatively related to collective
affective commitment. Previous studies have found support for a positive relationship
among diversity climate and job satisfaction, career commitment, empowerment, and
organizational commitment (Hicks-Clarke & Iles, 2000; Kossek & Zonia, 1993; Mor
Barak et al., 1998). Thus, the opposite can be expected with a climate for discrimination
against individuals of marginalized groups.
Employees with a strong affective commitment to their organization work for and
remain in their organization “because they want to do so” (Meyer & Allen, 1991, p. 67).
Affective commitment is associated not only with an emotional bond but also with a
long-term interest in remaining with the organization, as evidenced by the negative
relationship between organizational commitment and withdrawal (Mathieu & Zajac,
1990; Meyer, Stanley, Herscovitch, & Topolnytsky, 2002). Affectively committed
employees are attached to the organization for its own sake (Buchanan, 1974), they
internalize organizational values and objectives, and derive their gratifications from being
involved with the organization (Kanter, 1972). It is “the employee’s emotional
71
attachment to, identification with, and involvement in the organization” (Meyer & Allen,
1991, p. 67). Taken together, strong organizational commitment leads employees to focus
on maintaining and fostering a long-term relationship with their organization
(Wieselquist, Rusbult, Foster, & Agnew, 1999).
Perceived discrimination within organizations can undermine employee
commitment and lessen organizational citizenship behavior, morale, and job performance
(see Goldman et al., 2006, for a review). As people experience negative acts at work,
such as discrimination, they are likely to associate work with negatively related feelings
and become less affectively committed to their organization. Previous research has shown
that perceived discrimination at work is negatively related to affective commitment (e.g.,
Goldman et al., 2008). Social exchange theory suggests that perceptions of a supportive
and fair exchange relationship between the organization and its employees is necessary
for the development and continuation of high affective commitment (Meyer & Allen,
1997; Shore & Wayne, 1993).
When employees believe the organization is making an effort to value all
employees, they are more likely to feel an affective connection with their organization
(Meyer & Allen, 1991). A discriminatory climate is a clear violation of such an equitable
relationship, which is why it can negatively impact employees’ emotional attachment to
the organization, as well as their willingness to contribute. Thus, when an organization
tolerates a climate for discrimination, it reduces the affective commitment of its
employees and, in turn, reduces the aggregated affective commitment of the team.
Hassell and Perrewè (1993) showed such a decline in attachment to the organization for
members who perceived age discrimination in the workplace.
72
Hypothesis 6: Workplace discrimination climate is negatively related to collective
affective commitment.
Hypothesis 7: Collective value congruence is positively related to collective affective
commitment.
Hypothesis 8: Team cohesion is positively related to collective affective commitment.
Team Effectiveness
There has been an abundance of research to understand which variables affect the
effectiveness of work teams. The conceptualization that has shaped the last 50 years of
theory and research on team effectiveness is based on an input-process-output (I-P-O)
heuristic formulated by McGrath (1964). McGrath's model describes team effectiveness
(i.e., output) as involving inputs and processes. This line of thinking led to a series of I-P-
O models (e.g., Hackman, 1987; Salas et al., 1992; Tannenbaum et al., 1992). Inputs
include a variety of individual and team factors, resources, and organizational/contextual
variables (e.g., organizational climate). These inputs initiate the interaction among team
members or process (Mathieu, Heffner, Goodwin, Salas, & Cannon-Bowers, 2000).
Process refers to activities engaged in by the team to accomplish task demands,
essentially the transformation of inputs into outputs. At a global level, examples include
coordination, cooperation, and communication (Tannenbaum et al., 1992). Output
includes resulting team performance as well as other outcomes such as satisfaction,
cohesion, commitment, and viability (Mathieu et al., 2008).
McGrath's (1964) model has guided research in work teams for several decades.
However, more recently, Ilgen et al. (2005) have reconceptualized the I-P-O framework
based on observations from current research. Ilgen et al. (2005) suggested three areas in
73
the I-P-O model that would benefit from revision, given the advances in team literature.
The first area was in regards to the term process in the I-P-O theory. Marks, Mathieu, and
Zaccaro (2001) argued that the term process implies observable actions such as
interactions between team members. However, mediating forces observed in the literature
usually represent cognitive, motivational, or affective states. Therefore, Ilgen et al. (2005)
argued that mediator should replace process in McGrath's theory. The term mediator
more accurately includes emergent states which are "…cognitive, motivational, and
affective states of teams…that are typically dynamic in nature and vary as a function of
team context, inputs, processes, and outcomes" (Marks et al., 2001, p. 357).
The second recommended change related to the implication of I-P-O as a single
linear sequence. In other words, the original I-P-O framework only allowed for main
effects to proceed in the order of input, process, and outcome. Viewing work teams in
this way does not take into account possible feedback loops that may exist within a given
team (Ilgen et al., 2005). However, several researchers have found interactions between
inputs, processes, and emergent states (Colquitt et al., 2002; De Dreu & Weingart, 2003;
Taggar, 2002). Thus, input (I) is added after outcome (O) in the updated model to signify
the concept of a feedback loop (Ilgen et al., 2005). For example, if a team is able to
leverage their diverse talents (inputs) to increase team cohesion (process) which allows
them to perform well together (outcome), then this success will likely give them more
confidence for performing well in the future. In this manner, outputs from one completed
team task may act as inputs for subsequent team assignments. Given the limitations of
McGrath's (1964) I-P-O model, Ilgen et al. (2005) proposed the input-mediator-output-
input model (IMOI). Thirdly, the IMOI model included removing hyphens, suggesting
74
that the relationship between the separate constructs do not necessarily need to be linear,
but can be nonlinear or conditional (see Ilgen et al., 2005, for more detail).
On the basis of Ilgen and colleagues’ (2005) argument and the consensus of
researchers on the usefulness of the updated model (e.g., Mathieu et al., 2008), the
present study will use the IMOI model (see Figure 2A). In addition to I-P-O models,
several team scholars have presented models that attempt to describe a team over time,
focusing on developmental stages. These models differ from I-P-O models in that they
aim to explain what happens to a team across its life cycle rather than at any single point
in time. Kozlowski, Gully, Nason, and Smith (1999) provided a summary and review of
several of these types of models. According to these researchers, there is great consensus
with respect to developmental stages and emphasis on interpersonal processes and
outcomes (see Kozlowski et al., 1999). For example, Tuckman’s (1965) seminal
“norming, storming, forming, performing” framework set the scene for later frameworks
proposing separate stages of development (e.g., Bennis & Nanus, 1985; Caple, 1978;
Gersick, 1988, 1989; Morgan, Glickman, Woodward, Blaiwes, & Salas, 1986; Morgan,
Salas, & Glickman, 1993). As a result of the many existing models, there is no one best
way to view teams or team effectiveness; it depends on the researcher and his or her
study objectives (i.e., hypotheses).
The team effectiveness criteria is multifaceted and has been assessed in a variety
of ways, with emphasis on both internal (e.g., member satisfaction, team viability) and
external (e.g., productivity, performance) measures (Hackman, 1987). For instance,
Cohen and Bailey (1997) categorized effectiveness into “three major dimensions
according to the team’s impact on: (1) performance effectiveness assessed in terms of
75
quantity and quality of outputs, (2) member attitudes, and (3) behavioral outcomes” (p.
243). According to these authors, measures of performance effectiveness include
productivity, response times, efficiency, output quality, innovation, and customer
satisfaction. Examples of attitudinal measures include trust in management, employee
satisfaction, and commitment. Lastly, examples of behavioral measures include turnover,
safety, counterproductive work behaviors, organizational citizenship behaviors, and
absenteeism.
Unlike Cohen and Bailey’s (1997) dimensions, Beal and colleagues (2003) argued
in their meta-analysis for a distinction between team effectiveness and team efficiency.
They stated that team effectiveness represents outputs (e.g., gross sales, units completed,
number of customer complaints) while team efficiency adjusts for inputs and represents
behaviors. In other words, these authors feel that performance is in the doing (i.e.,
efficiency) and not in the result of what has been done (i.e., effectiveness). However,
Cannon-Bowers, Tannenbaum, Salas, and Volpe (1995) assessed effectiveness as a
behavior, which Beal and colleagues (2003) would consider a measure of efficiency and
not effectiveness.
Teams are often used in complex, evolving environments. As teams attempt to
accomplish tasks in these challenging settings, a necessary requirement is being able to
deviate from a plan in response to changing events, referred to as team adaptability or
team adaptation. This construct was defined by Cannon-Bowers and colleagues (1995) as
“the process by which a team is able to use information gathered from the task
environment to adjust strategies through the use of compensatory behaviors and
reallocation of intrateam resources” (p. 344).
76
Researchers use productivity and quality as dimensions of work team
effectiveness, as the goal of work teams is generally to generate something valuable to
the organization (e.g., Argote & McGrath, 1993; Shea & Guzzo, 1987). Also, team
effectiveness includes the notion that members’ needs are satisfied and that their
capability to work together in the future is maintained or strengthened. This has been
defined as team viability which is the willingness of team members to remain a part of
the team (Guzzo & Dickson, 1996; Sundstrom et al., 1990). Furthermore, job satisfaction
and commitment are also criteria of interest in work team research because it will affect
how a team may perform in the future (Ilgen et al., 2005). In teams that work well
together, there is a positive effect on job satisfaction and organizational commitment
(Walsh et al., 2010). As mentioned previously, team cohesion assists in the development
of cooperation, which in turn increases team productivity (Wheelan, 2005).
Evidently, there is tremendous diversion and overlap in how researchers
conceptualize the team effectiveness criteria. It is difficult to develop a single
specification of team effectiveness because it depends on so many factors. Limitations
stemming from a team’s context and tasks, as well as internal and external influences,
lead to different dimensions of performance being relevant for different types of teams.
Thus, team effectiveness specification and measurement must be grounded by the team
context, design factors, group processes, group psychosocial traits, and tasks (Cohen &
Bailey, 1997; Goodman, Ravlin, & Schminke, 1987).
Hypothesis 9: Workplace discrimination climate is negatively related to team
effectiveness.
Hypothesis 10: Collective value congruence is positively related to team effectiveness.
77
Hypothesis 11: Team cohesion is positively related to team effectiveness.
Hypothesis 12: Collective affective commitment is positively related to team
effectiveness.
Based on the IMOI (i.e., conceptual) model presented in Figure 2A, the following
indirect effects are explored.
Research Question 13a: The relationship between workplace discrimination climate and
team effectiveness is mediated through collective value congruence.
Research Question 13b: The relationship between workplace discrimination climate and
team effectiveness is mediated through collective value congruence and team cohesion.
Research Question 13c: The relationship between workplace discrimination climate and
team effectiveness is mediated through collective value congruence and collective
affective commitment.
Research Question 13d: The relationship between workplace discrimination climate and
team effectiveness is mediated through collective value congruence, team cohesion, and
collective affective commitment.
Research Question 13e: The relationship between workplace discrimination climate and
team effectiveness is mediated through team cohesion.
Research Question 13f: The relationship between workplace discrimination climate and
team effectiveness is mediated through team cohesion and collective affective
commitment.
Research Question 13g: The relationship between workplace discrimination climate and
team effectiveness is mediated through collective affective commitment.
78
CHAPTER III
METHODOLOGY
Data for this study were obtained from an archival dataset of United States
Military personnel from 2011. First, a review of the archival dataset will be discussed.
Secondly, a description of the participant demographics, data cleaning, and data
aggregation procedures will be presented. Lastly, the measures assessed in the dataset
will be reviewed.
Archival Database
The data for this study were collected as part of an annual employee climate
survey administered in 2011 throughout the United States’ Department of Defense.
Personnel completed this survey anonymously either in paper-and-pencil format or via an
online survey. All personnel were requested to complete this survey by their immediate
supervisor. Only teams of five or more were requested to complete the survey in order to
have appropriate aggregation of data. The DEOCS scales have been shown to be reliable
(average Cronbach's α = .84; range = .75-.91) and construct valid (Dansby & Landis,
1991; Landis et al., 1993) for military units. There were thirteen scales specifically
developed for the survey; however, this study only uses nine of these which are presented
below.
Participants & Procedures
A total of 6,824 participants completed the survey and after data cleaning 5,934
participants (332 work teams) remained. The team size ranged from 5 to 96 members
with the majority of teams consisting of 5 members, the median team size consisting of
12 members, and the average being 17.8 members. Of the 5,760 participants who
79
indicated their race/ethnicity, 69.6% (n = 4,008) identified themselves as White; 18.9% (n
= 1,086) as Black or African-American; 15.1% (n = 970) as Hispanic; 3.9% (n = 225) as
Asian (e.g., Asian Indian, Chinese, Filipino, Japanese, Korean, Vietnamese); 2.4% (n =
136) as Native Hawaiian or other Pacific Islander (e.g., Samoan, Guamanian, or
Chamorro); 1.4% (n = 82) as American Indian or Alaska Native; and 3.9% (n = 223) as
other or multiracial/multiethnic (note that the total adds up to 115.2% because of mixed
race/ethnicity). In regards to participants’ age, 13.7% (n = 881) were between the ages of
18-21; 41.5% (n = 2,666) between 22-30; 25.9% (n = 1,663) between 31-40; 15.6% (n =
1,003) between 41-50; and 3.3% (n = 210) over 51. Lastly, there were 17.1% (n = 1,099)
female and 82.9% (n = 5,324) male respondents.
Data Cleaning
Of the initial 6,824 survey respondents, 401 cases were eliminated due to missing
data. Also, as stated in the survey’s instructions, only cases in teams consisting of five or
more members were retained. Therefore, an additional 489 cases were omitted resulting
in 5,934 participants or 332 work teams. Since the initial employee survey used higher
ratings to indicate less likelihood and agreement (e.g., 5 = There is almost no chance that
the action occurred; 5 = Totally disagree with the statement), all responses were reverse
coded for ease of interpretation. Higher values indicated greater likelihood and agreement
and lower values indicated less likelihood and agreement.
Data Aggregation
In data aggregation, indices of consensus (i.e., agreement) and consistency (i.e.,
reliability) are reported to justify aggregation; each provides different yet complementary
information (e.g., Ehrhart, 2004; Gonzalez-Roma, Peiro, & Tordera, 2002). Within-group
80
agreement is the degree to which ratings from individuals are interchangeable; that is,
agreement reflects the degree to which raters provide essentially the same rating
(Kozlowski & Hattrup, 1992; Tinsley & Weiss, 1975). A lack of agreement suggests that
variables represent individual rather than group-level phenomena (see George & James,
1993; James, Demaree, & Wolf, 1984; Schneider & Bowen, 1985). James et al. (1984)
proposed two derivations of a within-group agreement score: the rwg and rwg(j). The
former is used as an index of agreement on single items; while the rwg(j) is an extension
used with multiple-item scales. Since this study is interested in the agreement between
team members on a number of items, the rwg(j) is used.
Agreement scores are the proportion of observed variances to expected variances,
where expected variances represent a complete lack of agreement among the respondents.
Expected variances are obtained from a theoretical null distribution. However, choosing
the null distribution is the single greatest factor complicating the use of within-group
agreement indices (see James et al., 1984; James, Demaree, & Wolf, 1993; Kozlowski &
Hattrup, 1992; Schmidt & Hunter, 1989). To date, the overwhelming majority of
researchers have relied on the uniform, or rectangular, null distribution (Finn, 1970;
James et al., 1984; LeBreton, Burgess, Kaiser, Atchley, & James, 2003; Schriesheim et
al., 2001).
The uniform distribution is the distribution that would emerge if group members
provided the same number of responses for each response category (e.g., providing an
equal number of 1s, 2s, 3s, 4s, and 5s on a 5-point scale). Certainly, there are theoretical
issues with assuming that the uniform distribution is always the best choice to represent a
random distribution. The uniform distribution assumes no response bias, yet given the
81
extant literature on the pervasiveness of cognitive and affective biases, this assumption
will rarely be met (e.g., Borman, 1991; Harris, 1994; Ilgen, Barnes-Farrell, & McKellin,
1993; Murphy & Cleveland, 1995; Varma, DeNisi, & Peters, 1996). Consequently,
reliance on the uniform null distribution will often result in inflated estimates of
agreement (Brown & Hauenstein, 2005; James et al., 1984; Kozlowski & Hattrup, 1992;
LeBreton et al., 2003).
Response bias typically results when participants use only a restricted part of the
response range. For example, under a positive response bias, individuals tend to use
neutral or positive response options (e.g., 3s, 4s, and 5s on a 5-point scale). The restricted
response range reduces the within-group variance (relative to the variance from a uniform
distribution) and makes it appear that group members agree. One of the major
contributions made by James et al. (1984) was the recognition that estimated values of
expected variance could be based upon distributions other than the uniform rectangular
distribution. They argued that theoretical and measurement reasons may justify the use of
triangular (corresponding to a central tendency bias), skewed (corresponding to leniency
and severity bias), or other distributions. James et al. (1984) recommended estimating the
rwg(j) indices using multiple, theoretically defensible null distributions and provided a set
of steps to aid in the selection of expected variance (LeBreton & Senter, 2008).
As a result of James et al.’s (1984) recommendation to use multiple null
distributions, the rwg(j) indices reported in this study are based on two distributions: slight
skew and uniform. Especially because items do not explicitly ask respondents if they
have engaged in workplace discrimination or if they have personally experienced it, the
presumption is that socially desirable response bias (SDRB) is attenuated. For this reason,
82
a slight skew distribution was selected to provide an accurate representation of the
expected variances. Also, the rationale for reporting the uniform null distribution despite
reluctance from LeBreton and Senter (2008), is for the sake of consistency with the
extant literature. The uniform distribution provides a well-known comparison for when
each response option has an equal chance of being selected (e.g., 20% chance for each
response on a 5-point scale). As discussed below, due to there being no conclusive cutoff
value for rwg(j), it is proposed that the true rwg(j) value falls somewhere in between the rwg(j)
indices with slight skew and uniform null distributions.
The rwg(j) statistic ranges from 0 to 1 with a widely-accepted cutoff value of .70
and greater (James, Demaree, & Wolf, 1984). The rwg(j) is interpreted as the proportional
reduction in error variance. Higher scores indicate greater reduction in error variance and,
thus, higher levels of agreement. A value of .70 suggests that there has been a 70%
reduction in error variance. Consequently, only 30% of the observed variance among
judges’ ratings should be attributed to random responding (i.e., error variance). However,
contemporary thinking is that the .70 threshold “artificially dichotomizes agreement in a
manner that is inconsistent with James et al.’s (1984) original intention, and it may not be
useful for justifying aggregation in multilevel models” (LeBreton & Senter, 2008, p.
835).
Therefore, LeBreton and Senter (2008) presented more-inclusive guidelines for
interpreting interrater agreement, which include: “lack of agreement” = .00 to .30; “weak
agreement” = .31 to .50; “moderate agreement” = .51 to .70; “strong agreement” = .71 to
.90, and; “very strong agreement” = .91 to 1.0. These guidelines overlap with Brown and
Hauenstein’s (2005) earlier extension of the .70 cutoff, which suggested that values from
83
0 to .59 represent an unacceptable level of agreement, .60 to .69 weak agreement, .70 to
.79 moderate agreement, and .80 and above strong agreement. An rwg(j) > .70 cutoff is a
heuristic and, like any heuristic, it is an arbitrary “line in the sand” (LeBreton & Senter,
2008). Nevertheless, LeBreton and Senter (2008) argue that a more-inclusive set of
guidelines may be beneficial for organizational researchers because in many instances an
absolute standard for agreement (i.e., .70 and above) may be too high, but in other
instances this value may be too low.
When it comes to reporting rwg(j), even with relatively modest sample sizes, there
can be a large number of rwg(j) indices. For example, assume that a researcher has data
from 50 teams of five employees who were asked to rate three dimensions of climate.
This researcher has identified four null distributions (e.g., slight skew, moderate skew,
triangular, and uniform) for use with rwg(j) and is interested in knowing whether or not
data aggregation is justified. Such an analysis would result in a total of 50 (number of
groups) × 3 (number of dimensions) × 4 (number of null distributions), or 600, rwg(j)
estimates. One recommended reporting solution is to report separate mean rwg(j) estimates
for each climate dimension using each null distribution (Cohen et al., 2001; LeBreton et
al., 2003). For the example above, the researcher would only need to have a table
reporting 12 mean rwg(j) values, instead of 600 individual rwg(j) values. In the present study,
the mean rwg(j) values using two separate null distributions (i.e., slight skew and uniform)
are reported for each measure.
The second index in determining whether or not to aggregate individual-level data
to team-level data is reliability. Reliability assesses the relative consistency of responses
among participants (Kozlowski & Hattrup, 1992). Following the suggestions of Bliese
84
(2000), team-level constructs are calculated using intraclass correlation coefficients
[ICC(1) and ICC(2)]. Intraclass refers to the relationship among variables that share both
their metric and variance (McGraw & Wong, 1996). In general, ICCs may be interpreted
as the proportion of observed variance in ratings that is due to systematic between-group
differences compared to the total variance in ratings. The ICCs are estimated when one is
interested in understanding the reliability of multiple targets (e.g., teams) rated by a
different set of participants (e.g., different employees in each team) on an interval
measurement scale (e.g., Likert-type scale; LeBreton & Senter, 2008). The results of one-
way random-effects analysis of variance (ANOVA; where teams serve as the independent
variable) are used to compute the two forms of ICCs (Shrout & Fleiss, 1979). In doing so,
a researcher is ensuring that there is sufficient variance within and between units of
analysis (Biemann, Cole, & Voelpel, 2012). Both ICC measures are based on the mean
scores within teams and serve as a measure of consistency (i.e., reliability).
The ICC(1) represents the reliability of a single rating of the team mean (Bliese,
2000; James, 1982), or the ratio of between-group variance to total variance (Bryk &
Raudenbush, 1982). The ICC(l) values are not influenced by group size or by the number
of groups in the sample (Bliese, 2000; Bliese & Halverson, 1998). According to LeBreton
and Senter (2008), the ICC(1) is typically interpreted as a measure of effect size (Bliese,
2000; Bryk & Raudenbush, 1992), revealing the extent to which individual ratings are
attributable to group membership. For example, an ICC(1) of .08 indicates that 8% of the
variance in individual-level responses can be explained by or is related to group
membership. When interpreting values for ICC(1), LeBreton and Senter (2008)
85
encourage researchers to adopt traditional conventions used when interpreting effect sizes
(i.e., percentage of variance explained).
Specifically, a value of .01 might be considered a “small” effect, a value of .10
might be considered a ‘‘medium’’ effect, and a value of .25 might be considered a
‘‘large’’ effect (see Murphy & Myors, 1998, p. 47). LeBreton and Senter (2008)
recommend ICC(1) = .05 to represent a small to medium effect. However, Bliese (1998)
simulated conditions where only 1% of the variance was attributed to group membership
[ICC(1) = .01] and, still, strong group-level relationships were detected that were not
evident in lower level data. As with rwg(j), there are no definitive rules for determining
ICC(1) values necessary to justify aggregation; nevertheless, this study will use .05 or
greater as suggested by LeBreton and Senter (2008).
It is important to note that the ICC(1) equation assumes equal group sizes (Castro,
2002). This is problematic because organizational researchers rarely have equal group
sizes (see Bliese & Halverson, 1996; George, 1990; Ostroff, 1992; Yammarino &
Markham, 1992). Unfortunately, the literature on ICC(1) rarely address the issue of
unequal group sizes (see Bartko, 1976; McGraw & Wong, 1996; Shrout & Fleiss, 1979).
The simplest solution to this problem is to use the arithmetic mean of the group sizes in
the ICC(1) equation (see Blalock, 1972). However, in situations where group sizes differ
considerably, as with teams in this dissertation, researchers (e.g., Blalock, 1972; Bliese &
Halverson, 1998; Castro, 2002) have recommended a formula originally presented by
Haggard (1958).
The ICC(2) represents the group-mean reliability and provides information about
the stability of the aggregated value (Bliese, 2000; James, 1982). It is a measure of
86
proportional consistency and is found by evaluating the mean-square between (MSB),
minus the mean-square within (MSW), and then dividing by the MSB (Bartko, 1976;
Bliese, 1998). The results give the reliability at the group-level (i.e., teams) and represent
the correlation between the mean score and the mean from a hypothetical group if again
drawn from the same population. In other words, this serves as an estimate of the
reliability of the values (James, 1982). As Bliese (2000) points out, “regardless of the
type of variable being aggregated, groups need to have reliably different mean values on
the construct of interest if one hopes to detect emergent relationships” (p. 375). The
recommended ICC(2) cutoff to justify aggregation is from .60 (Glick, 1985) to .70 and
above (Bliese, 2000). Empirical results supported the decision to aggregate all study
variables to the group-level.
Measures
Workplace Discrimination Climate
Workplace discrimination climate was assessed using 20-items to evaluate the
likelihood of various discriminatory acts occurring in the workplace. Respondents did not
have to personally see or experience the actions themselves. Instead, they were asked to
rate the likelihood of specific actions occurring within the last 30 workdays. There were
five types of discrimination measured: race/ethnicity, gender, religion, age, and disability.
Each item was scored on a 5-point Likert scale ranging from 1 = “There is a very high
chance that the action occurred” to 5 = “There is almost no chance that the action
occurred.”
Sample items from each subscale included, “A supervisor did not select a
qualified subordinate for promotion because of their race/ethnicity;” “Sexist jokes were
87
frequently heard;” “A demeaning comment was made about a certain religious group;”
“An older individual did not get the same career opportunities as did a younger
individual;” and “A supervisor did not appoint a qualified worker with a disability to a
new position, but instead appointed another, less qualified worker.” The 20-item measure
had an overall internal consistency reliability of .95, with facet level values as follows:
racial/ethnic discrimination (α = .88), gender discrimination (α = .84), religious
discrimination (α = .82), age discrimination (α = .88), and disability discrimination (α =
.85).
In reference to data aggregation, the 20-item measure had ICC(1) and ICC(2)
values of .09 and .63, respectively, with facet level values consisting of: racial/ethnic
discrimination [ICC(1) = .09, ICC(2) = .66], gender discrimination [ICC(1) = .07, ICC(2)
= .57], religious discrimination [ICC(1) = .04, ICC(2) = .45], age discrimination [ICC(1)
= .04, ICC(2) = .43], and disability discrimination [ICC(1) = .08, ICC(2) = .60]. The
overall measure also had acceptable mean rwg(j) values of .75 (slight skew) and .92
(uniform), suggesting that much of the variance in workplace discrimination climate was
due to group membership. The mean rwg(j) values for each facet were: racial/ethnic
discrimination [.62 (slight skew) and .84 (uniform)], gender discrimination [.46 (slight
skew) and .70 (uniform)], religious discrimination [.65 (slight skew) and .80 (uniform)],
age discrimination [.53 (slight skew) and .72 (uniform)], and disability discrimination
[.64 (slight skew) and .80 (uniform)].
Collective Value Congruence
Collective value congruence was conceptualized and measured as employees
making a direct assessment of the compatibility between their own values and those of
88
the organization (French et al., 1974; Kristof-Brown et al., 2005). Adapted from Cable
and De Rue (2002), value congruence was measured using four items. These included, “I
find that my values and the organization’s values are very similar,” “The values of this
organization reflect the values of its members,” “This organization is loyal to its
members,” and “This organization is proud of its people.” Each item was scored on a 5-
point Likert scale ranging from 1 = “Totally agree with the statement” to 5 = “Totally
disagree with the statement.” The internal consistency reliability of this scale was .87.
Furthermore, the ICC(1) and ICC(2) were .16 and .77, respectively, with mean rwg(j)
values of .28 (slight skew) and .61 (uniform).
Team Cohesion
Four items captured team cohesion and they were, “My work group works well
together as a team,” “Members of my work group pull together to get the job done,”
“Members of my work group really care about each other,” and “Members of my work
group trust each.” Each item was scored on a 5-point Likert scale ranging from 1 =
“Totally agree with the statement” to 5 = “Totally disagree with the statement.” The
internal consistency reliability of this scale was .91. Also, the ICC(1) and ICC(2) were
.09 and .63, respectively, with mean rwg(j) values of .46 (slight skew) and .70 (uniform).
Collective Affective Commitment
Collective affective commitment was assessed using the following four items, “I
am proud to tell other that I am part of this organization,” “Assuming I could stay until
eligible for retirement, I do not see many reason to do so” (reverse coded), “Often, I find
it difficult to agree with the policies of this organization on important matters relating to
its people” (reverse coded), and “Becoming a part of this organization was definitely not

89
in my best interest” (reverse coded). Each item was scored on a 5-point Likert scale
ranging from 1 = “Totally agree with the statement” to 5 = “Totally disagree with the
statement.” The internal consistency reliability of this scale was .77. Also, the ICC(1) and
ICC(2) were .19 and .81, respectively, with mean rwg(j) values of .14 (slight skew) and .43
(uniform).
Team Effectiveness
Four items measured team effectiveness, including “The amount of output of my
work group is very high;” “The quality of output of my work group is very high;” “When
high priority work arises, such as short deadlines, crash programs, and schedule changes,
the people in my work group do an outstanding job in handling these situations;” and
“My work group’s performance in comparison to similar work groups is very high.” Each
item was scored on a 5-point Likert scale ranging from 1 = “Totally agree with the
statement” to 5 = “Totally disagree with the statement.” The internal consistency
reliability of this scale was .87. Additionally, the ICC(1) and ICC(2) were .10 and .66,
respectively, with mean rwg(j) values of .56 (slight skew) and .77 (uniform).
Demographics
The following participant demographics were collected: team identification
number, age, gender, and race/ethnicity (i.e., White/Non-White).
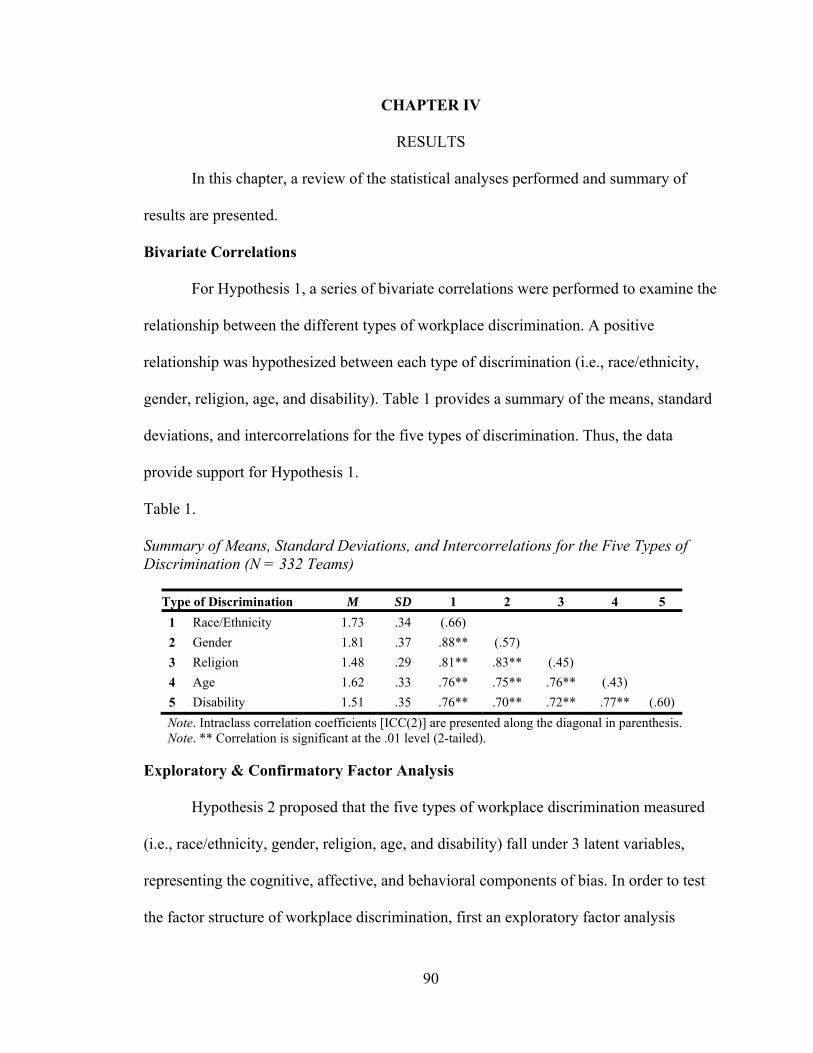
90
CHAPTER IV
RESULTS
In this chapter, a review of the statistical analyses performed and summary of
results are presented.
Bivariate Correlations
For Hypothesis 1, a series of bivariate correlations were performed to examine the
relationship between the different types of workplace discrimination. A positive
relationship was hypothesized between each type of discrimination (i.e., race/ethnicity,
gender, religion, age, and disability). Table 1 provides a summary of the means, standard
deviations, and intercorrelations for the five types of discrimination. Thus, the data
provide support for Hypothesis 1.
Table 1.
Summary of Means, Standard Deviations, and Intercorrelations for the Five Types of Discrimination (N = 332 Teams)
Type of Discrimination M SD 1 2 3 4 5
1 Race/Ethnicity 1.73 .34 (.66)
2 Gender 1.81 .37 .88** (.57)
3 Religion 1.48 .29 .81** .83** (.45)
4 Age 1.62 .33 .76** .75** .76** (.43)
5 Disability 1.51 .35 .76** .70** .72** .77** (.60)
Note. Intraclass correlation coefficients [ICC(2)] are presented along the diagonal in parenthesis. Note. ** Correlation is significant at the .01 level (2-tailed).
Exploratory & Confirmatory Factor Analysis
Hypothesis 2 proposed that the five types of workplace discrimination measured
(i.e., race/ethnicity, gender, religion, age, and disability) fall under 3 latent variables,
representing the cognitive, affective, and behavioral components of bias. In order to test
the factor structure of workplace discrimination, first an exploratory factor analysis
91
(EFA) was run, followed by a confirmatory factor analysis (CFA) to test the goodness-of-
fit of two models. Exploratory factor analysis is a technique that identifies the number of
latent constructs (i.e., variables not directly measured, called factors) without imposing
any preconceived structure on the outcome (Child, 1990). In general, researchers use
EFA when interested in making statements about the factors responsible for a set of
observed responses.
Twenty items were entered into the EFA using principal axis factoring (PAF) with
oblique rotation (i.e., direct oblimin). Rotation is a way of maximizing high loadings and
minimizing low loadings so that the simplest possible structure is achieved. There are two
basic types of rotation: oblique and orthogonal. Unlike orthogonal rotation, which
assumes that factors are uncorrelated with one another, oblique rotation derives factor
loadings based on the assumption that the factors are correlated. Due to the fact that there
is theoretical support for correlations between cognitive, affective, and behavioral
components of bias, oblique rotation was selected. Table 7 shows the factor loadings of
each item, with loadings of < .30 omitted from the output. A commonly acceptable factor
loading for an item is above .40 (Floyd, & Widaman, 1995), although many consider .30
as an acceptable cutoff as well (Tabachnick, & Fidell, 1996). Each factor loading
expresses the correlation of the item with the factor. The square of the factor loading
indicates the proportion of variance shared by the item with the factor.
In determining how many factors to retain, Cattell’s (1966) scree test was used to
visually assess which factors explained most of the variability in the data (Figure 1). A
scree plot is a two dimensional graph with factors on the x-axis and eigenvalues on the y-
axis. Since each factor explains less variance than the preceding factors, a line connecting
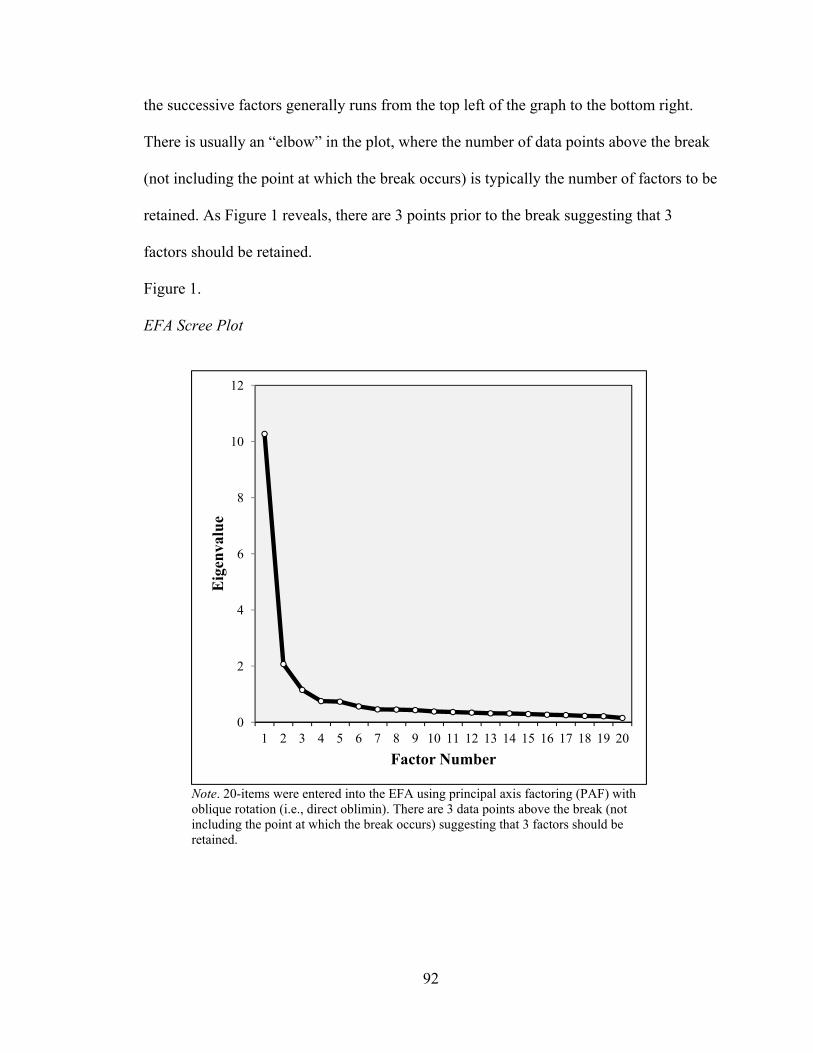
92
the successive factors generally runs from the top left of the graph to the bottom right.
There is usually an “elbow” in the plot, where the number of data points above the break
(not including the point at which the break occurs) is typically the number of factors to be
retained. As Figure 1 reveals, there are 3 points prior to the break suggesting that 3
factors should be retained.
Figure 1.
EFA Scree Plot
Note. 20-items were entered into the EFA using principal axis factoring (PAF) with oblique rotation (i.e., direct oblimin). There are 3 data points above the break (not including the point at which the break occurs) suggesting that 3 factors should be retained.
0
2
4
6
8
10
12
1 2 3 4 5 6 7 8 9 10 11 12 13 14 15 16 17 18 19 20
Eig
enva
lue
Factor Number
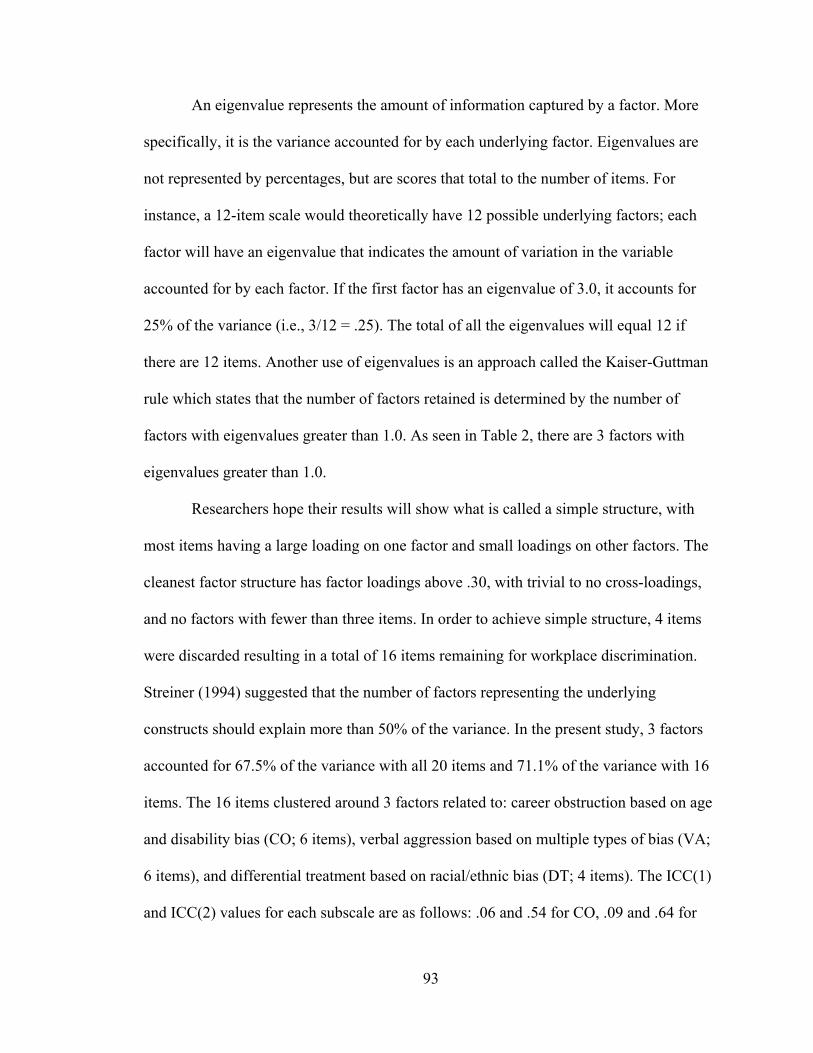
93
An eigenvalue represents the amount of information captured by a factor. More
specifically, it is the variance accounted for by each underlying factor. Eigenvalues are
not represented by percentages, but are scores that total to the number of items. For
instance, a 12-item scale would theoretically have 12 possible underlying factors; each
factor will have an eigenvalue that indicates the amount of variation in the variable
accounted for by each factor. If the first factor has an eigenvalue of 3.0, it accounts for
25% of the variance (i.e., 3/12 = .25). The total of all the eigenvalues will equal 12 if
there are 12 items. Another use of eigenvalues is an approach called the Kaiser-Guttman
rule which states that the number of factors retained is determined by the number of
factors with eigenvalues greater than 1.0. As seen in Table 2, there are 3 factors with
eigenvalues greater than 1.0.
Researchers hope their results will show what is called a simple structure, with
most items having a large loading on one factor and small loadings on other factors. The
cleanest factor structure has factor loadings above .30, with trivial to no cross-loadings,
and no factors with fewer than three items. In order to achieve simple structure, 4 items
were discarded resulting in a total of 16 items remaining for workplace discrimination.
Streiner (1994) suggested that the number of factors representing the underlying
constructs should explain more than 50% of the variance. In the present study, 3 factors
accounted for 67.5% of the variance with all 20 items and 71.1% of the variance with 16
items. The 16 items clustered around 3 factors related to: career obstruction based on age
and disability bias (CO; 6 items), verbal aggression based on multiple types of bias (VA;
6 items), and differential treatment based on racial/ethnic bias (DT; 4 items). The ICC(1)
and ICC(2) values for each subscale are as follows: .06 and .54 for CO, .09 and .64 for
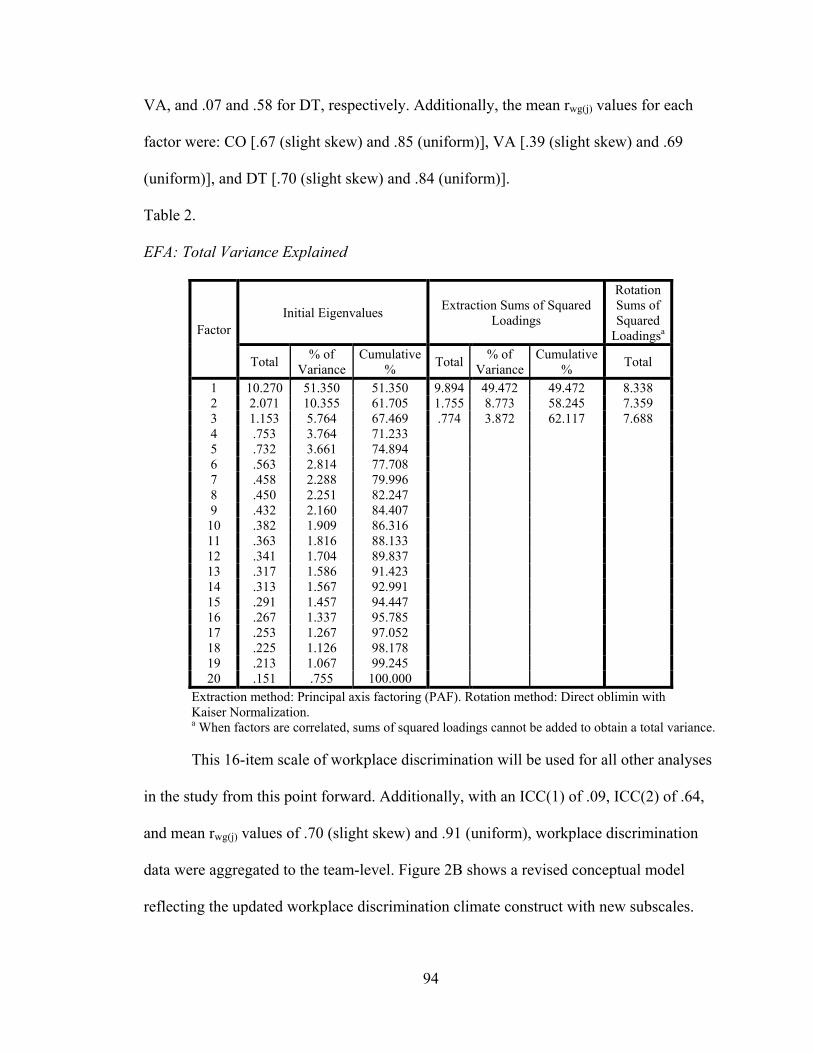
94
VA, and .07 and .58 for DT, respectively. Additionally, the mean rwg(j) values for each
factor were: CO [.67 (slight skew) and .85 (uniform)], VA [.39 (slight skew) and .69
(uniform)], and DT [.70 (slight skew) and .84 (uniform)].
Table 2.
EFA: Total Variance Explained
Factor Initial Eigenvalues
Extraction Sums of Squared Loadings
Rotation Sums of Squared
Loadingsa
Total % of
Variance Cumulative
% Total
% of Variance
Cumulative %
Total
1 10.270 51.350 51.350 9.894 49.472 49.472 8.338 2 2.071 10.355 61.705 1.755 8.773 58.245 7.359 3 1.153 5.764 67.469 .774 3.872 62.117 7.688 4 .753 3.764 71.233 5 .732 3.661 74.894 6 .563 2.814 77.708 7 .458 2.288 79.996 8 .450 2.251 82.247 9 .432 2.160 84.407
10 .382 1.909 86.316 11 .363 1.816 88.133 12 .341 1.704 89.837 13 .317 1.586 91.423 14 .313 1.567 92.991 15 .291 1.457 94.447 16 .267 1.337 95.785 17 .253 1.267 97.052 18 .225 1.126 98.178 19 .213 1.067 99.245 20 .151 .755 100.000
Extraction method: Principal axis factoring (PAF). Rotation method: Direct oblimin with Kaiser Normalization. a When factors are correlated, sums of squared loadings cannot be added to obtain a total variance. This 16-item scale of workplace discrimination will be used for all other analyses
in the study from this point forward. Additionally, with an ICC(1) of .09, ICC(2) of .64,
and mean rwg(j) values of .70 (slight skew) and .91 (uniform), workplace discrimination
data were aggregated to the team-level. Figure 2B shows a revised conceptual model
reflecting the updated workplace discrimination climate construct with new subscales.
95
Also, Table 6 provides a summary of the means, standard deviations, and correlations for
all of the study variables, including the revised workplace discrimination construct.
Ultimately, the results of the EFA produced three factors as hypothesized, but they did
not cluster around the cognitive, affective, and behavioral components of bias. Thus,
Hypothesis 2 is only partially supported.
Using AMOS, a CFA was run to test the goodness-of-fit of two models. The first
model was a one-factor model (“workplace discrimination”) that consisted of all 16 items
of the workplace discrimination scale as indicators of one latent factor of workplace
discrimination (Figure 5). The second model was a three-factor model in which the latent
variables of career obstruction based on age and disability bias (CO), verbal aggression
based on multiple types of bias (VA), and differential treatment based on racial/ethnic
bias (DT) were correlated with one another (Figure 7). The indicators for each latent
variable were the corresponding items that made up that subscale. The global fit indices
that were used to determine which model achieved a better fit included: the Tucker-Lewis
index (TLI), comparative fit index (CFI), root-mean-square error of approximation
(RMSEA), p-value for the test of close fit (PCLOSE), standardized root mean square
residual (SRMR), and Akaike’s information criterion (AIC).
The chi-square (χ2) test of model fit, also referred to as the “badness-of-fit” index,
is a measure of absolute fit that is routinely reported in all SEM results. Absolute fit
indices do not use an alternative model as a base for comparison. They are simply derived
from the fit of the obtained and implied covariance matrices and the maximum likelihood
minimization function. The χ2 value for the overall model fit of the one-factor model was
significant, χ2 (104) = 21751.28, p < .001, suggesting lack of fit between the
96
hypothesized model and the data. Similarly, the χ2 value for the second model was also
significant, χ2 (101) = 4795.12, p < .001, suggesting lack of fit between the three-factor
model and the data.
In practice, however, χ2 is not considered to be a very useful fit index because it is
largely affected by sample size, multicollinearity, and model size. Specifically, larger
samples produce larger chi-squares that are statistically significant, thus, denoting bad
model fit (Schumacker & Lomax, 2004). With smaller sample sizes, there may not be
enough power to detect differences between several competing models and χ2 is more
likely to result in accepting poorer models (i.e., type II error). Chi-square is also affected
by the distribution of variables; highly skewed and kurtotic variables increase χ2 values,
indicating poor model fit (Kenny, 2012). This has to do with the multivariate normality
assumption used with the χ2 method. Lastly, models with more variables tend to have
larger chi-squares. For these reasons, multiple fit indices were used to determine which of
the two models achieved better model fit.
The TLI and CFI are indices that depend on the average size of the correlations in
the data. If the average correlation between variables is not high, then the TLI and CFI
will not be very high because there would be less covariance to explain. Scores on both
statistics range from 0 to 1 with values of .90 or higher being indicative of good model fit
(e.g., Hu & Bentler, 1999). The RMSEA, which measures the average fitted residual, has
become one of the most, if not the most, widely used assessment of fit/misfit in the
application of SEM (e.g., Jackson, Gillaspy, & Purc-Stephenson, 2009). A score of less
than .10 (preferably less than .08) on this measure is indicative of good model fit (Jaccard
97
& Wan, 1996). MacCallum, Browne, and Sugawara (1996) have used RMSEA values of
.01, .05, and .08 to indicate excellent, good, and mediocre fit, respectively.
The p-value related to the RMSEA statistic is referred to as PCLOSE. This
measure determines model fit by using hypothesis testing to test the null hypothesis (Ho)
that RMSEA is equal to .05 (i.e., a “close-fitting model”). The alternative hypothesis (Ha)
is that the RMSEA is greater than .05 (i.e., a poor-fitting model). If PCLOSE is greater
than .05 and, therefore, not statistically significant, then we accept Ho and conclude that
the fit of the model is "close." If PCLOSE is less than .05, we reject Ho and conclude that
the computed RMSEA is greater than .05, indicating the model’s fit is worse than close
fitting. The SRMR is the standardized difference between the observed covariance and
predicted covariance. A value of zero indicates perfect model fit. This measure tends to
be smaller as sample size increases and as the number of variables in the model increase.
A value of .08 or less is considered good model fit. The AIC is used when comparing two
or more models estimated with the same data. It does not carry a penalty for sample size
the way that the χ2 does. Unlike performing a χ2 test to determine which model is a better
fit, when using the AIC the model with the smallest AIC value is chosen as the one
exemplifying a better fit of the hypothesized model and the one most likely to replicate in
future samples (Byrne, 2001; Hu & Bentler, 1995; Kline, 2011).
For both models, modification indices greater than 4.0 were taken into
consideration as they indicate that there are important associations in the data for which
the estimated model neglected to consider. Of these, however, only those pathways that
made conceptual sense were incorporated into the models. Certain error terms of
indicators were correlated, indicating that some of the covariance in the indicators (not
98
explained by the latent variable) is due to other common exogenous causes (Brown,
2006). Global fit indices, presented in Table 4, were compared between the two models
in order to determine which model had superior fit to the data. Examination of these
indices showed better fit for the three-factor model (TLI = .92, CFI = .93, RMSEA = .09,
PCLOSE = .00, SRMR = .05, and AIC = 4865.12) over the one-factor model (TLI = .63,
CFI = .68, RMSEA = .19, PCLOSE = .00, SRMR = .13, and AIC = 21815.28), regardless
of incorporating paths with modification indices greater than 4.0. Additionally, Figure 6
and Figure 8 show the standardized regression coefficients for the one-factor model and
three-factor model, respectively. Altogether, there is support for the argument that
workplace discrimination is not a single-factor construct. Although unable to confirm the
hypothesized components of bias (i.e., cognitive, affective, and behavioral), the CFA
results reinforce the findings of the EFA with a three-factor structure of workplace
discrimination, providing partial support for Hypothesis 2.
Correlations were calculated between the individual dimensions of workplace
discrimination (i.e., CO, VA, and DT) to ensure that they were positively related to one
another. Preliminary analyses were performed to ensure that no violation of the
assumptions of normality, linearity, and homoscedasticity were present. The correlations
(see Table 6) confirmed that all of the individual dimensions of workplace discrimination
had strong and positive relationships with one another. In order to determine that these
correlations were not so strong as to warrant concern that these constructs are identical,
reliability corrections were performed on all latent intercorrelations and these corrected
correlations were compared to 1.0. The results of these calculations are presented in
Table 5. One can see that all corrected correlations are less than 1.0, even after examining
99
the 95% confidence interval of the corrected value. These findings confirm that even
though the correlations between the subcomponents of workplace discrimination are
strong and positive, they are not indicative of these constructs being identical to one
another.
Mediation Analysis & Model Testing
Mediation analysis through model testing was used to test Hypotheses 3 through
12 and to examine the indirect effects for Research Questions 13a through 13g.
Specifically, mediation was conducted via Preacher and Hayes’s (2008a) bootstrapping
procedures to test the conceptual model with multiple mediators (or indirect effects).
“Conditional process analysis is used when one’s research goal is to describe the
conditional nature of the mechanism or mechanisms by which a variable transmits its
effect on another and testing hypotheses about such contingent effects” (Hayes, 2013, p.
10). This methodology allows for the estimation and interpretation of the conditional
nature (i.e., the moderation component) of the indirect and/or direct effects (i.e., the
mediation component) of X on Y in a causal system. Technically speaking, conditional
process analysis is termed to represent the analytical integration of mediation and
moderation (Hayes, 2013). However, in addition to this integration, Hayes’s (2013)
methodology also allows for more robust mediation testing, by including models with
multiple mediators. The statistical model is presented in Figure 3.
By including more than one mediator in a model simultaneously, it makes it
possible to “pit theories against each other by statistically comparing indirect effects that
represent different theoretical mechanisms” (Hayes, 2013, p. 123). There are two forms
of multiple mediator models: parallel and serial. Parallel multiple mediator models are
100
those with mediators that are allowed to correlate but do not causally influence other
mediators in the model. Serial multiple mediator models are those with mediators that are
linked together in a causal chain. This study hypothesizes causal order and will use the
serial multiple mediator model approach.
The utility of mediation analysis stems from its ability to go beyond the merely
descriptive to a more functional understanding of the relationships among variables. A
necessary component of mediation is a statistically and practically significant indirect
effect. At least a dozen methods for testing hypotheses about mediation have been
proposed (see MacKinnon, Lockwood, Hoffman, West, & Sheets, 2002, for a review). By
far the most commonly used is the causal steps strategy, popularized by Baron and
Kenny (1986), in which the investigator estimates the paths of a model using ordinary
least squares (OLS) regression or structural equation modeling (SEM), and assesses the
extent to which several criteria are met. Conditional process analysis, developed by
Preacher and Hayes (2008a; 2008b), uses an OLS or logistic regression-based path
analytical framework to estimate direct and indirect effects in simple and multiple
mediator models.
Preacher and Hayes (2004) created a macro supported by existing statistical
software packages (e.g., SPSS) to aide researchers in running mediation analyses more
efficiently. Recently, these same researchers created an updated macro, known as
PROCESS, vastly expanding the number and complexity of models that can be estimated
and pieced together in the form of a conditional process model. A macro is a program
that will run when a shortcut command is given to execute it. Rather than running the
entire program for each analysis, the program simply needs to be “activated” by running
101
it once or requesting that it be executed first in a batch using specific commands. The
user needs to run the macro only once when SPSS is first executed; the macro will remain
active until the user quits the program.
Using PROCESS, mediation analysis was conducted by estimating team
effectiveness from workplace discrimination climate through collective value congruence
(mediator 1), team cohesion (mediator 2), and collective affective commitment (mediator
3), all while controlling for age, gender, race/ethnicity (i.e., White/Non-White), and team
size. The statistical model with superimposed regression (beta, β) coefficients is
presented in Figure 4 and a summary of the model’s regression coefficients, standard
errors, and p-values is presented in Table 8. Unlike bivariate correlations, PROCESS
provides partial correlations (i.e., path coefficients) that explain the relationship between
two variables while holding all other variables in the model constant. The results for
Hypotheses 3 through 12 are presented next.
Supporting Hypothesis 3, workplace discrimination climate was negatively
related to collective value congruence (a1 = -1.07, p < .001). Supporting Hypothesis 4,
workplace discrimination climate was negatively related to team cohesion (a2 = -.32, p <
.001). Supporting Hypothesis 5, collective value congruence was positively related to
team cohesion (d21 = .45, p < .001). Supporting Hypothesis 6, workplace discrimination
climate was negatively related to collective affective commitment (a3 = -.19, p < .05).
Supporting Hypothesis 7, collective value congruence was positively related to collective
affective commitment (d31 = .82, p < .001). Finally, supporting Hypothesis 11, team
cohesion was positively related to team effectiveness (b2 = .57, p < .001). The results for
the remaining hypotheses revealed no significant effects, therefore, no support was found
102
for Hypotheses 8, 9, 10, and 12. In summary, all hypotheses were supported when
examining bivariate correlations alone. But, holding all other variables constant in the
model and reexamining each hypothesis via path coefficients, four hypotheses were not
supported (i.e., Hypotheses 8, 9, 10, and 12).
In examining direct and indirect effects, Preacher and Hayes (2008b) proposed
that multiple mediator analysis should involve two parts: (1) investigating the total
indirect effect, or deciding whether the set of mediators transmits the effect of X to Y;
and (2) testing hypotheses regarding individual mediators in the context of a multiple
mediator model (i.e., investigating the specific indirect effect associated with each
mediator). Preacher and Hayes (2008b) do not suggest that a significant total indirect
effect is a prerequisite for investigating specific indirect effects. It is entirely possible to
find specific indirect effects to be significant in the presence of a non-significant total
indirect effect. Either or both types of effect may be of theoretical interest and worth
investigating (Hayes, 2013). The results revealed that while holding team demographics
constant, the set of mediators did, indeed, transmit the effect of X (i.e., workplace
discrimination climate) to Y (i.e., team effectiveness) with 95% confidence that the total
indirect effect is between -.71 to -.44. The results for Research Questions 13a-13g,
examining the indirect effect associated with each mediator, are presented next.
With three serial mediators, there are seven indirect effects estimated as products
of regression coefficients (Table 3). Bootstrapping, a nonparametric resampling
procedure, was used to generate confidence intervals for each indirect effect. Confidence
intervals were calculated by repeatedly resampling from the data with replacement (i.e.,
bootstrap samples), estimating the model in each bootstrap sample, calculating the
103
indirect effects, and deriving the endpoints of a confidence interval for each (Hayes,
2013). By repeating this process thousands of times, an empirical approximation of the
sampling distribution is obtained and confidence intervals are constructed for each
indirect effect. One strength of bootstrapping is that it does not assume normality of the
sampling distribution. “Bootstrap confidence intervals better respect the irregularity of
the sampling distribution… and, as a result, yield inferences that are more likely to be
accurate than when the normal theory approach is used” (Hayes, 2013, p. 106).
For this study, parameter estimates were based on 5,000 bootstrap samples with a
95% bias-corrected confidence interval. Bias-corrected bootstrap confidence intervals
adjust for bias in the bootstrap distribution. In general, the lower- and upper-bounds of
bootstrap confidence intervals are obtained using (100-ci)/2%, where ci is the desired
confidence interval. For example, if a ci = 95% confidence interval is desired, the lower-
and upper-bounds of the interval are defined by the bootstrap values defining the 2.5th
and 97.5th percentiles in the distribution of k values of the indirect effect. In bias-
corrected bootstrapping, the endpoints are adjusted (upward or downward) as a function
of the proportion of k bootstrap values that are less than the point estimate of the indirect
effect calculated in the original data. When zero is not included in the 95% confidence
interval, it is concluded that the indirect (or mediated) effect is significantly different
from zero. Thus, based on this understanding, the indirect effects presented in Research
Questions 13b, 13e, and 13g were supported and those presented in Research Questions
13a, 13c, 13d, and 13f were not (Table 3).
Essentially, when statistically controlling for team demographics (i.e.,
composition of age, gender, race/ethnicity, and team size) as well as other model
104
mediators, the indirect effect of workplace discrimination climate on team effectiveness
through collective value congruence and team cohesion was statistically different from
zero (a1d21b2 = -.27, with a 95% bias-corrected confidence interval from -.39 to -.18;
supporting Research Question 13b). Similarly, the indirect effects of workplace
discrimination climate on team effectiveness through team cohesion (a2b2 = -.18, with a
95% bias-corrected confidence interval from -.28 to -.09) and through collective affective
commitment (a3b3 = -.02, with a 95% bias-corrected confidence interval from -.05 to -
.001) were both statistically different from zero (supporting Research Question 13e and
Research Question 13g, respectively). There was no evidence of a direct effect of
workplace discrimination climate on team effectiveness (c’ = -.07, t(323) = -1.13, p = .26,
with a 95% bias-corrected confidence interval from -.20 to .05). Thus, team effectiveness
does not differ as a function of workplace discrimination climate when collective value
congruence, team cohesion, collective affective commitment, and team demographics are
all statistically controlled. In summary, the evidence supports only three indirect paths as
explanation for the relationship between workplace discrimination climate and team
effectiveness. A discussion of the results is presented next.
105
CHAPTER V
DISCUSSION
The overall purpose of this study was to examine the implications of workplace
discrimination climate on team-level variables. A model consisting of three serial
mediators was tested to explain the relationship between workplace discrimination
climate and team effectiveness. The results revealed that there was no direct effect of
workplace discrimination climate on team effectiveness. While holding constant
collective value congruence, team effectiveness, collective affective commitment, and
team-level demographics, no significant change in team effectiveness was observed as a
result of changes in workplace discrimination climate. Thus, the effect of workplace
discrimination climate on team effectiveness is best understood through indirect causes.
In particular, three out of seven possible indirect effects were supported (Table 3). Lastly,
this study aimed to make a case for studying workplace discrimination under the much
broader construct of workplace aggression within I/O psychology. The outcome of this
objective was mixed and future research is still needed to address the relationship further.
The first indirect effect is interpreted as significantly negative because the 95%
bias-corrected confidence interval was entirely below zero (-.39 to -.18). Meaning, on
average, teams that reported a greater climate for workplace discrimination also reported
less collective value congruence with their organization (a1 = -1.07, p < .001). With less
shared perceptions of value congruence, there is less team cohesion (d21 = .45, p < .001),
and with less team cohesion there is less team effectiveness (b2 = .57, p < .001). The
second indirect effect is also interpreted as significantly negative with a 95% bias-
corrected confidence interval entirely below zero (-.28 to -.09). On average, teams that
106
reported a greater climate for workplace discrimination also reported less team cohesion
(a2 = -.32, p < .001), which in turn was associated with less team effectiveness (b2 = .57,
p < .001). Lastly, the third indirect effect is interpreted as significantly negative because
the 95% bias-corrected confidence interval was also below zero (-.05 to -.001).
Therefore, on average, teams that reported a greater climate for workplace discrimination
also reported less collective affective commitment (a3 = -.19, p < .05), and with less
collective affective commitment there was less team effectiveness (b3 = .10, p = .08).
Strength & Comparisons of Indirect Effects
In a multiple mediator model, it is sometimes of interest to test whether one
indirect effect is statistically different from another. The contrast option of PROCESS
offers bootstrap confidence intervals for pairwise comparisons of specific indirect effects.
For example, if the indirect effect of X through mediator Mi pertains to the mechanism
proposed by one theory and the indirect effect of X through mediator Mj quantifies the
mechanism relevant to a second theory, an inference about whether the indirect effects
are equal warrants consideration. The intent is to claim whether one mechanism accounts
for more of the effect of X on Y than the other mechanism. A confidence interval that
does not contain zero provides evidence that the two indirect effects are statistically
different from each other, whereas a confidence interval that straddles zero supports the
claim of no difference between the specific indirect effects.
A 95% bias-corrected confidence interval was used to make inferences about the
difference between the three indirect effects previously mentioned. The results revealed
that the indirect effect of X on Y through M1 (collective value congruence) and M2 (team
cohesion) was not statistically different from the indirect effect of X on Y through M2
107
(team cohesion) alone, as the bootstrap confidence interval for this contrast included zero
(-.25 to.05). We can say with 95% confidence that these two indirect effects are not
statistically different from each other. Therefore, the indirect effect of perceived
workplace discrimination on team effectiveness through collective value congruence and
team cohesion is no different than the indirect effect through team cohesion alone.
On the other hand, the indirect effect of X on Y through M1 (collective value
congruence) and M2 (team cohesion) was statistically different from the indirect effect of
X on Y through M3 (collective affective commitment) alone, with a confidence interval
non-inclusive of zero (-.38 to -.16). This finding reveals that the indirect effect of
workplace discrimination climate on team effectiveness through shared perceptions of
value congruence and team cohesion is different from the indirect effect through
collective affective commitment alone. Lastly, with a confidence interval from -.26 to -
.07, the indirect effect of X on Y through M2 (team cohesion) was statistically different
from the indirect effect of X on Y through M3 (collective affective commitment).
Therefore, the indirect effect of workplace discrimination climate on team effectiveness
through collective team cohesion is different from the indirect effect through collective
affective commitment.
“It is tempting to treat this as a test of the difference in strength of the
mechanisms at work linking X to Y, or that one indirect effect is larger than another in an
absolute sense. However, such an interpretation is justified only if the point estimates for
the two specific indirect effects being compared are of the same sign” (Hayes, 2013,
p.142). Fortunately, the point estimates of this study’s three significant indirect effects
were all negative. The point estimate for the indirect effect of X on Y through M1
108
(collective value congruence) and M2 (team cohesion) was -.27. The point estimate for
the indirect effect of X on Y through M2 (team cohesion) was -.18. Lastly, the point
estimate for the indirect effect of X on Y through M3 (collective affective commitment)
was -.02.
Taken together, the data suggests that the indirect effect of X on Y through M1
(collective value congruence) and M2 (team cohesion) best accounts for the relationship
between workplace discrimination climate (X) and team effectiveness (Y). Especially
with the previous contrasts revealing no statistical difference between the indirect effect
of X on Y through M1 (collective value congruence) and M2 (team cohesion) versus M2
(team cohesion) alone, provides further support that collective value congruence and
team cohesion best explain the effect of workplace discrimination climate on team
effectiveness. A possible explanation for the exclusion of collective affective
commitment as a third mediator could be due to multicollinearity, which will be
discussed next.
Interpreting Direct & Indirect Effects of Multiple Mediator Models
In a serial multiple mediator model, the total effect of X on Y partitions into direct
and indirect components, just as it does in simple mediation models (i.e., models with
only one mediator). Regardless of the number of mediators in the model, the direct effect
(c’) is interpreted as usual - change in Y due to changes in X while controlling for all
other model variables. The indirect effects, of which there may be many depending on the
number of mediators in the model, are all constructed by multiplying the regression
weights corresponding to each step in an indirect pathway. A specific indirect effect is
interpreted just as in simple mediation models, except with the addition of “controlling
109
for all other mediators in the model.” A specific indirect effect quantifies the influence of
X on Y through a particular mediator or mediators while holding constant all other
mediators in the model. This means that it is possible that a simple mediation analysis
reveals evidence of an indirect effect of X on Y through M1 when M1 is the sole mediator
in the model, but no such indirect effect when M1 is included in a model along with M2,
M3, and so forth. This will occur more so or with greater likelihood when the mediators
are correlated, which is precisely the circumstance in which a multiple mediator model is
most useful (Hayes, 2013).
However, when the intercorrelations between mediators become too large, the
usual problem with multicollinearity in regression models begin to take hold and muddle
the results, as the paths from each mediator to the outcome are estimated controlling for
all other mediators. Multicollinearity between the predictors increases sampling variance
in estimates of their partial relationships with an outcome (Cohen, Cohen, West, &
Aiken, 2003; Darlington, 1990; Fox, 1991). Sampling variance refers to the variation of a
particular statistic (e.g., mean, correlation, etc.) calculated from repeated sampling. In
other words, it is sample-to-sample variation that results when using sample sizes smaller
than the size of the population, which is almost always the case in research. Such
sampling variance will propagate throughout the estimates of indirect effects and increase
the width of confidence intervals as well as increase p-values of specific indirect effects
(Hayes, 2013).
With evidence of an indirect effect when a mediator is considered in isolation but
not when considered in a model with multiple mediators, it is reasonable to ask which
result is correct.
110
“But there is no good answer to this question. In fact, they could both be correct because the specific indirect effect in a multiple mediator model estimates something different than the indirect effect in a simple mediation model. The indirect effect in a model with a single mediator confounds influence through that sole mediator and other mediators it may be correlated with but that are excluded from the model. Including correlated mediators in the model allow you to disentangle spurious and epiphenomenal association from potential causal association, but this comes at the cost of greater sampling variance and reduced power” (Hayes, 2013, p. 157)
Two variables are said to be spuriously associated if they have no direct causal
connection, yet it may be wrongly inferred that they do, due to the presence of a third,
unseen variable (i.e., a confounding variable). Additionally, an association between X and
Y is epiphenomenal if X is correlated with a cause of Y but does not itself causally effect
Y. In other words, a mediator (M) may be correlated with some other variable that X is
actually affecting, and if that other variable causes Y rather than M, one may incorrectly
assume that X affects Y indirectly through M when in fact the other variable (not included
in the analysis) is the variable through which X exerts its indirect effect.
With few exceptions, inferences and interpretation of a multiple mediator model
usually focus more on the direct and specific indirect effects, not the total indirect effect.
“Investigators often estimate multiple mediator models because they are interested in
specific mechanisms at work, not the aggregate of all mechanisms” (Hayes, 2013, p.
159). The total indirect effect of X qualifies how differences in X relate to differences in Y
through all mediators at once. Evidence that the total indirect effect is different from zero
supports the claim that, taken together, X influences Y indirectly through one or more of
the mechanisms represented by the mediators. However, because the total indirect effect
111
is the sum of all specific effects, some seemingly paradoxical results are possible. One
such paradox is when the total indirect effect is not statistically different from zero
according to inferential testing, but one or more of the specific indirect effects is. The
opposite is also possible when there is evidence supporting a total indirect effect, yet an
inferential test shows no specific indirect effects that are statistically different from zero.
Fortunately, no such paradoxes were observed in the present study.
Examining One Model with Multiple Xs vs. Multiple Models with One X
Similar to the discussion on multiple mediator models, a discussion on whether or
not to examine one model with multiple Xs or multiple models with one X is presented
next. As stated by Hayes (2013), “either approach can be legitimate, and sometimes one
can learn from doing it both ways, but it is important to recognize that the direct and
indirect effects estimate different things and so interpretation of the results must be
undertaken with due care” (p.195). Consequently, post hoc models were run to compare
differences in results, if any. Four models with varying predictors were tested, including:
three separate models with one subscale of workplace discrimination climate (i.e., CO,
VA, and DT) each and one model with all three subscales simultaneously. The results of
each model are presented in Figures 9 through 12 and Tables 9 through 16, respectively.
When interpreting all Xs in one model, an estimate of one X’s effect on Y (directly and
indirectly) is unique to that X relative to the other Xs in the model. Alternatively, when
estimating several models each with a single X yields an estimate of X’s direct and
indirect effects on Y and, potentially, the effects of other Xs not included in the model.
112
One Model with Multiple Xs: CO Climate, VA Climate, & DT Climate
The risk of including multiple Xs in a mediation model, as when including
statistical controls, is the possibility that highly correlated Xs will cancel out each other’s
effects. The stronger the associations between model variables, then the greater the
potential of such a problem. This is a standard concern in linear models involving
correlated predictors. Two X variables (or an X variable and a control variable) highly
correlated with each other may also both be correlated with M or Y, so when they are both
included as predictors of M or Y in a mediation model, they compete against each other in
their attempt to explain variation in M and Y. The corresponding regression coefficients
quantify their unique association with the model’s mediator and outcome variable(s). As
a result, one could find that when included as the sole X, each variable exerts a direct
and/or indirect effect on Y through M, but when considered together, neither appears to
have any effect at all. In fact, this was the case when examining all three factors (i.e., CO,
VA, and DT) and control variables together in one model (Figure 12). Strong correlations
between CO, VA, and DT provided rationale for examining the three factors as a general
workplace discrimination climate. Furthermore, the results of models with only one X at a
time are presented next.
Model with CO Climate as a Single X Variable
With CO climate as a single X variable, there was a significant direct effect on
team effectiveness (c’ = -.16, p < .01). In other words, while holding all other variables
constant, teams that reported a greater climate for career obstruction based on age and
disability bias also reported less team effectiveness. Therefore, when employees perceive
a workplace where career opportunities are not equally attainable, there is a direct
113
negative effect on team effectiveness. A possible reason for this is that when qualified
older and disabled employees are not given fair consideration for promotions or
important assignments, they do not get the chance to utilize their knowledge and
expertise to influence their team; as a result, the team’s effectiveness directly suffers.
Additionally, teams introduce the potential for social comparisons, a phenomenon
examined with respect to procedural justice (Ambrose, Harland, & Kulik, 1991; Ambrose
& Kulik, 1989; Grienberger, Rutte, & van Knippenberg, 1997; Lind, Kray, & Thompson,
1998). When team members perceive discrimination in career opportunities, it calls into
question the fairness of all decision-making practices. Employees begin to doubt the
fairness of organizational procedures (i.e., procedural justice), which has been found to
negatively impact team effectiveness (Colquitt, Noe, & Jackson, 2002). Lind and Tyler
(1988) suggested that “procedural justice judgments should have strong effects on group
cohesiveness and loyalty, because fair procedures will reassure members that their
interests will be protected and advanced through group membership” (p. 227). In a
laboratory study, Colquitt (2000) found a positive relationship between team member
procedural justice perceptions and team member role performance. To the extent that
members believe the team will advance their interests, they should be more likely to
fulfill their individual role requirements, improving both performance and commitment
(Colquitt, Noe, & Jackson, 2002).
Out of seven possible indirect effects, two were found to be statistically different
from zero (Table 10). The indirect effect of CO climate on team effectiveness through M1
(collective value congruence) and M2 (team cohesion) had a 95% bias-corrected
confidence interval from -.33 to -.16 (a1d21b2 = -.24). Likewise, the indirect effect of CO
114
climate on team effectiveness through M2 (team cohesion) had a 95% bias-corrected
confidence interval from -.24 to -.07 (a2b2 = -.14). The results revealed, however, that the
indirect effect of X on Y through M1 (collective value congruence) and M2 (team
cohesion) was not statistically different from the indirect effect of X on Y through M2
(team cohesion) alone, as the bootstrap confidence interval for this contrast included zero
(-.22 to .02).
We can say with 95% confidence that these two indirect effects are not
statistically different from each other. A climate for career obstruction based on age and
disability bias on team effectiveness through collective value congruence and team
cohesion is no different from the indirect effect through team cohesion alone. Besides not
observing a third indirect effect of X on Y through M3 (collective affective commitment),
this finding is similar to that of the initial conceptual model. Thus, when examining a
climate for career obstruction on team effectiveness, the effect operates through reduced
collective value congruence (a1 = -.89, p < .001), which in turn reduces team cohesion
(d21 = .48, p < .001) and, lastly, reduces team effectiveness (b2 = .55, p < .001).
Model with VA Climate as a Single X Variable
Similar to the insignificant direct effect of workplace discrimination climate on
team effectiveness, the direct effect of VA climate on team effectiveness was also
insignificant (c’ = .06, p = .21). A possible explanation for the insignificant effect of VA
climate on team effectiveness may be due to variations in strength of interpersonal
relationships across teams. For instance, as teams begin to work more effectively, they
develop more informal way of communicating and interacting with one another. Research
has shown that spontaneous communication builds social ties (Festinger, Schachter, &
115
Back, 1950), increases awareness of others’ moods and states (Olson, Teasley, Covi, &
Olson, 2002), and strengthens interpersonal bonds even between geographically distant
workers (Nardi & Whittaker, 2002). Unlike planned, formal communication, where
people often feel constrained to predetermined topics and timeframes (see Olson &
Olson, 2000), spontaneous communication refers to casual, unplanned interactions that
occur among team members (Kiesler & Cummings, 2002; Kraut, Fussell, Brennan, &
Siegel, 2002; Monge & Kirste, 1980).
The strong bonds and interpersonal relationships of highly effective team
members may allow them to joke and make comments about marginalized groups, with
the understanding that it is not coming from a malicious place. Hence, as teams report
higher team effectiveness, they may also report a greater likelihood of jokes and remarks
referencing marginalized groups, yet interpret these occurrences as less offensive than
teams reporting lower team effectiveness. Essentially, if the interpersonal relationships of
team members are strong enough and built upon trust, even amongst marginalized and
non-marginalized individuals, it may allow for the acceptance of jokes and remarks
otherwise considered discriminatory in other contexts. On the other hand, if team
members are newly acquainted, there may be less acceptance of discriminatory remarks
even if intended as jokes.
As team members collaborate over time there is greater exchange of personal,
idiosyncratic information and a broader view of each person’s day-to-day behaviors
(Gruenfeld, Mannix, Williams, & Neale, 1996). Consequently, over time, as team
members learn more about each other, research has found that surface-level diversity
(i.e., observable demographic characteristics) becomes less important and deep-level
116
diversity (i.e., psychological characteristics, such as personality, values, and attitudes;
Jackson, May, & Whitney, 1995; Harrison, Price, & Bell, 1998) becomes more important
in determining team social integration (Harrison, Price, Gavin, & Florey, 2002). Using a
cross-sectional design, Harrison et al. (1998) reported that the influence of gender
differences on group cohesiveness diminished and the influence of attitude differences
increased as a function of team tenure. The findings from this post hoc model provide
support for the assertion that different forms of discrimination have varying effects on
teams and warrants further consideration. Future research should examine the
relationship between VA climate and team effectiveness while also considering team
tenure and the strength of team member’s interpersonal relationships.
Out of seven possible indirect effects, four were found to be statistically different
from zero (Table 12). The first indirect effect of VA climate on team effectiveness
through M1 (collective value congruence) and M2 (team cohesion) had a 95% bias-
corrected confidence interval from -.33 to -.15 (a1d21b2 = -.22). The second indirect effect
through M1 (collective value congruence) and M3 (collective affective commitment) had a
95% bias-corrected confidence interval from -.15 to -.01 (a1d31b3 = -.07). The third
indirect effect through M2 (team cohesion) had a 95% bias-corrected confidence interval
from -.17 to -.02 (a2b2 = -.09). Lastly, the fourth indirect effect through M3 (collective
affective commitment) had a 95% bias-corrected confidence interval from -.04 to -.001
(a3b3 = -.01). The four indirect effects were compared to see if they were significantly
different from one another.
All pairwise comparisons were statistically different from one another except for
one. The indirect effect of X on Y through M1 (collective value congruence) and M3
117
(collective affective commitment) was not statistically different from the indirect effect
of X on Y through M2 (team cohesion) because the bootstrap confidence interval for this
contrast included zero (-.08 to .12). Thus, the indirect effect of X on Y through collective
value congruence and collective affective commitment is no different than the indirect
effect through team cohesion alone. Also, as with the findings from the conceptual
model, the data suggests that the indirect effect of X on Y through M1 (collective value
congruence) and M2 (team cohesion) best accounts for the relationship between VA
climate (X) and team effectiveness (Y). A climate for verbal aggression impacts team
effectiveness by reducing collective value congruence (a1 = -.76, p < .001), which in turn
reduces team cohesion (d21 = .50, p < .001) and, lastly, reduces team effectiveness (b2 =
.59, p < .001).
Model with DT Climate as a Single X Variable
Similar to the results of CO climate on team effectiveness (c’ = -.16, p < .01), the
direct effect of DT climate on team effectiveness was also significantly negative (c’ = -
.14, p < .05). Thus, while holding all other variables constant, teams that reported a
greater climate for differential treatment based on racial/ethnic bias also reported less
team effectiveness. Consequently, when employees perceive a workplace where
differential treatment based on race/ethnicity is prevalent, there is a direct negative effect
on team effectiveness. A potential reason for this goes back to perceptions of fairness in
the organization’s decision-making practices. When employees begin to doubt the
fairness of organizational procedures (i.e., procedural justice), a negative impact on team
effectiveness is expected (Colquitt, Noe, & Jackson, 2002). Moreover, when qualified
racially/ethnically diverse employees fail to receive the same opportunities for
118
promotions and stretch assignments, the underutilization of talent (i.e., KSAOs) may
directly hinder the team’s performance.
Two indirect effects were found to be statistically different from zero (Table 14).
The indirect effect of DT climate on team effectiveness through M1 (collective value
congruence) and M2 (team cohesion) had a 95% bias-corrected confidence interval from -
.35 to -.16 (a1d21b2 = -.24). Likewise, the indirect effect of DT climate on team
effectiveness through M2 (team cohesion) had a 95% bias-corrected confidence interval
from -.28 to -.11 (a2b2 = -.19). The results revealed, however, that the indirect effect of X
on Y through M1 (collective value congruence) and M2 (team cohesion) was not
statistically different from the indirect effect of X on Y through M2 (team cohesion) alone,
as the bootstrap confidence interval for this contrast included zero (-.20 to .06).
We can say with 95% confidence that these two indirect effects are not
statistically different from each other. A climate for differential treatment based on
racial/ethnic bias on team effectiveness through collective value congruence and team
cohesion is no different than the indirect effect through team cohesion alone. Besides not
observing a third indirect effect of X on Y through M3 (collective affective commitment),
this model’s findings are similar to those of the initial conceptual model. Thus, when
examining the relationship between a climate for differential treatment based on
racial/ethnic bias and team effectiveness, the effect operates through reduced collective
value congruence (a1 = -.97, p < .001), which in turn reduces team cohesion (d21 = .45, p
< .001) and, lastly, reduces team effectiveness (b2 = .55, p < .001).
119
Summary of Post Hoc Models
Overall, two models (i.e., CO climate and DT climate as single X variables)
shared comparable results. Both models had significantly negative effects between X and
team effectiveness. Also, both models had the same two indirect effects statistically
different from zero. However, despite a similar non-significant direct effect, the model
with the greatest deviation from the conceptual model was the model with VA climate as
a single X variable. This model had two additional indirect effects through M3 (collective
affective commitment) that were not observed in the other models. Across all three post
hoc models, the indirect effect through M1 (collective value congruence) and M2 (team
cohesion) best explained the relationship between X and team effectiveness. Another
intriguing finding was that no matter the model examined (including the initial
conceptual model), three indirect effects were never found to have a 95% bias-corrected
confidence interval excluding zero. The first was the indirect effect of X on Y through M1
(collective value congruence). The second was the indirect effect of X on Y through all
three serial mediators and, lastly, the third was the indirect effect of X on Y through M2
(team cohesion) and M3 (collective affective commitment).
In the case of the first indirect effect, collective value congruence alone is not the
best explanation of X on team effectiveness, especially when also taking into
consideration team cohesion and collective affective commitment. Essentially, when
team members perceive a high likelihood of discrimination in the workplace, they also
perceive lower value congruence between the organization and its members. It is this
misalignment that subsequently impacts team cohesion and collective affective
commitment, through separate indirect effects, to reduce team effectiveness. However, as
120
much as collective value congruence impacts successive mediators, this was not the case
for the indirect effect through all three mediators together. A possible reason for this
finding may be attributed to the high partial correlations observed between collective
value congruence and collective affective commitment (i.e., ranging from .82 to .84
across all models).
Finally, with the indirect effect of X on Y through M2 (team cohesion) and M3
(collective affective commitment), team cohesion does not seem to have a serial
mediating effect on collective affective commitment when examining the effects of X on
team effectiveness. Thus, whether or not team members work well together or trust one
another (i.e., team cohesion) does not directly impact perceptions of affective
commitment, therefore, there is no support to claim that workplace discrimination climate
affects team effectiveness through these two mediators simultaneously.
Control Variables & Their Relationship to Other Study Variables
Of the control variables, two (age and gender) had significant path coefficients
with other study variables. As Figure 4 illustrates, with all things equal, age had a direct
effect on collective affective commitment (s1 = .15, p < .001) and gender had a direct
effect on collective value congruence (q2 = -.52, p < .001). It is important to remember
that the demographic variables, along with all other study variables, are aggregated to the
team-level; therefore, interpreting their value must take into consideration the team
composition of each variable. In other words, when interpreting age, higher values do not
indicate older respondents; instead, higher values represent a higher average age for
teams with N members. The results revealed that there is a positive relationship between
average team age and collective affective commitment. As the average age of the team
121
increases so do the shared perceptions of affective commitment. This result is not
surprising considering the extant literature examining this relationship.
According to many studies (e.g., Adler & Aranya, 1984; Alutto, Hrebiniak, &
Alonso, 1973; Angle & Perry, 1983; Brief & Aldag, 1980; Cohen, 1993; Meyer & Allen,
1984; Sheldon, 1971), age and tenure are considered important correlates of
organizational commitment. Research suggests that employees who are older and who
have been employed longer with a particular organization have a stronger affective
commitment to their employer (e.g., Porter, Steers, Mowday, & Boulian, 1974; Steers,
1977). As Cherrington, Condie, and England (1979) and Salancik (1977) point out, these
relationships can be given various interpretations. It may be, for example, (a) that these
employees have received more rewards from the organization (e.g., are in better
positions); (b) that they engage in more self-justification processes by deciding they are
more committed (e.g., “I have been here 20 years, I must like it”); (c) that there is
something about aging that predisposes older employees to be more committed to
organizations (i.e., a “maturity explanation”); (d) that older employees actually have, or
perceive to have, more positive experiences than younger employees (i.e., a “better
experiences explanation”); (e) or that there are generational differences in organizational
commitment (i.e., a “cohort explanation”).
The positive relationships between age, tenure, and affective commitment rest on
the assumption that seniority reflects opportunities to improve one's position within an
organization over time. In fact, meta-analytic work by Mathieu and Zajac (1990) has
revealed modest positive relationships involving attitudinal commitment (similar in
concept to affective commitment) and age (mean true correlation [rt] = .22) and tenure
122
(mean rt = .15). Allen and Meyer (1993) found that affective commitment increased with
employee age and was more strongly linked to age than to two other career stage
variables (i.e., organizational tenure and positional tenure). Similarly, Hackett, Bycio, &
Hausdorf (1994), found that age and organizational tenure were both positively related to
affective commitment (r = .17 and r = .17 for age and tenure, respectively).
It could be said that an effect attributed to age may really be an organizational
tenure effect or that an apparent tenure effect may actually be due to employee age
differences. However, Hackett and colleagues (1994) examined the relationship of each
component separately with age (partialing out the effect of organizational tenure) and
with organizational tenure (partialing out the effect of age). The corresponding partial
correlations of age and tenure with affective commitment were identical (r = .08, p <
.01). Furthermore, “as employee age and organizational tenure are highly correlated,
these effects may simply reflect ‘real’ age effects” (Allen & Meyer, 1993, p. 51). For
these reasons, having only age as a statistical control may be sufficient for purposes of
this dissertation. Lastly, the fact that this demographic variable had a significant path
coefficient after controlling for all other study variables suggests that it could be included
as a moderator in a future model.
One reason for considering age as a potential moderator rests on the notion that
collective affective commitment may interact with average team age to influence team
effectiveness. Earlier research has shown that affective commitment declines in the first
year of employment (e.g., Meyer & Allen, 1987, 1988; Mowday & McDade, 1980). A
possible explanation for this finding is that newcomers begin working with unrealistically
high expectations (Wanous, 1980). As they learn more about their work and come to
123
understand the reality, many employees leave. For those who stay, however, the affective
commitment developed during this early period sets the stage for subsequent levels of
commitment (Mowday et al., 1982). There is very little evidence showing a continuing
decline of affective commitment observed during the first year. Indeed, although there are
exceptions, affective commitment to the organization has been shown to be positively
correlated with age and tenure in several studies (e.g., Adler & Aranya, 1984; Angle &
Perry, 1983; Brief & Aldag, 1980). Therefore, the expectation is that for teams with older
employees the effect of collective affective commitment on team effectiveness would be
stronger than for teams with younger employees.
When interpreting gender, higher values signify more female members on the
team (i.e., males coded as “1” and females coded as “2”). The results revealed a negative
relationship between gender and shared perceptions of value congruence with one’s
organization. Thus, teams consisting of more females were less likely to report value
congruence versus teams with more males. This finding highlights a well-documented
component of organizational fit, which is demographic similarity or relational
demography (Ferris & Judge, 1991; Rynes, Bretz, & Gerhart, 1991; Tsui & O’Reilly,
1989). People use demographics, particularly those that are visible, to categorize one
another (e.g., Harrison, Price, & Bell, 1998). People categorize demographically similar
people as ingroup members and different people as outgroup members. Also, they vary
their attitudes and behaviors toward others based on such categorizations (Brewer, 1979).
For example, Tsui, Egan, and O’Reilly (1992) found that visible demographic
differences in age, gender, and race influenced people’s commitment to team and
organizational goals and objectives. By the same token, individuals who are
124
demographically similar to other team members appear to enjoy important benefits that
less similar individuals receive (Pfeffer, 1983). Similarities among group members tend
to cue the formation of interpersonal relations, trust, and cohesiveness within the group
(Tsui, Xin, & Egan, 1995). Relational demography can be contrasted with organizational
demography or compositional demography, both of which refer to the distribution of
basic attributes such as age, gender, race/ethnicity, education level, socioeconomic status,
and more (Tsui & Gutek, 1999).
In studies of relational demography, the unit of analysis is the dyad; in
organizational demography, the unit of analysis is the group or organization (Pfeffer,
1983; Jackson, Brett, Sessa, Cooper, Julin, & Peyronnin, 1991). A review of the literature
(Tsui & Gutek, 1999) found that the most common dependent variables of relational and
compositional demography were turnover, cohesion, and communication. Therefore,
team gender composition would be a valuable moderator added to the conceptual model
for further testing. Many opportunities exist for integrating mediation and moderation
into a single model using conditional process analysis (Hayes, 2013) and such models
would be advantageous for future research.
Theoretical Implications
This dissertation argued for the study of workplace discrimination under the
broader construct of workplace aggression within the I/O psychology literature.
Hypothesis 2 proposed that the five types of workplace discrimination measured (i.e.,
race/ethnicity, gender, religion, age, and disability) would fall under three latent
variables, representing the cognitive, affective, and behavioral components of bias. The
rationale supporting this hypothesis stems from the fact that aggression is composed of
125
cognitive, affective, and behavioral components (Buss & Perry, 1992). Similarly,
workplace discrimination consists of cognitive, affective, and behavioral components as
well (Eagly & Chaiken, 1998; Mackie & Smith, 1998a, 1998b; Petty & Wegener, 1998;
Wilder & Simon, 2001). Therefore, it was hypothesized that workplace discrimination,
conceptualized as aggression based on prejudice, would overlap with aggression and
share similar behaviors.
The results provided partial support for this hypothesis. Although not representing
cognitive, affective, and behavioral components of bias, exploratory and confirmatory
factor analyses revealed three latent constructs: career obstruction based on age and
disability bias (CO), verbal aggression based on multiple types of bias (VA), and
differential treatment based on racial/ethnic bias (DT). Additionally, two models were
analyzed to determine which model had superior fit to the data. The first model was a
one-factor model (“workplace discrimination”) that consisted of all 16 items of the
workplace discrimination scale (Figures 5 and 6). The second model was a three-factor
model in which the latent variables of CO, VA, and DT were correlated with one another
(Figures 7 and 8). Examination of the global fit indices showed better fit for the three-
factor model over the one-factor model. Also, not surprisingly, the items did not load on
five separate latent variables representing each of the five types of workplace
discrimination. Thus, there is something more than discrimination type influencing factor
loadings. A closer look at the items revealed distinct patterns.
With CO, items highlighted instances of impeding an employee’s success or
growth within the organization. Phrases such as “did not recommend promotion,” “did
not appoint a qualified worker,” and “did not get the same career opportunities” were
126
common across the six items. Additionally, the two types of discrimination common
amongst these items were age and disability. With VA, all six items referred to hearing
someone tell jokes, make suggestive remarks, or say offensive and demeaning comments
about individuals of an EEOC protected group or the group itself. The types of
discrimination referenced across these items included race/ethnicity, gender, and religion.
Lastly, with DT, all four items depicted a supervisor or person in charge treating
employees unequally based on race/ethnicity. Interestingly, one item (i.e., “A supervisor
did not select a qualified subordinate for promotion because of their race/ethnicity”) did
not load on the CO latent variable, which represented all other career obstruction items.
The only difference between this item and those of the CO latent variable was the group
being discriminated against.
As seen by the factor loading of items, there are instances where only one type of
discrimination covaries (i.e., DT) and other instances where multiple types of
discrimination covary (i.e., CO and VA). For instance, age and disability discrimination
cluster together based on items related to career obstruction. Likewise, racial/ethnic,
religious, and gender discrimination cluster together based on items related to verbal
aggression. Unlike the other workplace discrimination types, racial/ethnic items loaded
onto two separate latent variables. The difference was based on whether items described
verbal aggression (i.e., VA) or differential treatment by a supervisor (i.e., DT). This
further illustrates that workplace discrimination items covary or cluster together not only
based on type, but also based on form. At the very least, there is initial support to claim
that workplace discrimination items load onto latent factors related to specific workplace
aggression behaviors.
127
However, as a consequence of using an archival dataset, the full range of items
representing cognitive, affective, and behavioral components of bias was limited. In fact,
there were no items that assessed stereotypes (i.e., the cognitive component of bias) or
prejudice (i.e., the affective component of bias). All items assessed either verbal or covert
discrimination (i.e. the behavioral component of bias). Although beneficial for assessing
climate perceptions of workplace discrimination, having items that only assess the
behavioral component of bias limits the ability to fully test Hypothesis 2. Future research
would benefit from expanding on the present study and assessing the overlap between
workplace discrimination and workplace aggression. Preliminary analysis reveals that
despite the type of bias (i.e., race/ethnicity, gender, religion, age, and disability) there are
observed commonalities based on the form of discrimination (e.g., career obstruction,
verbal aggression, and differential treatment). Hence, the nature of the behavior may be
just as useful, if not more useful, for studying workplace discrimination and its effects.
Especially now that discrimination has shifted from egregious violent acts to acts
of covert aggression embedded in day-to-day interactions, teasing apart discrimination
from aggression in the workplace may be futile. Traditional discrimination may evoke
images of civil war, segregation, slavery, concentration camps, and other historically
grave events. The challenge is modifying our outdated schema to incorporate more
modern forms of discrimination. Certainly, violent acts of discrimination still exist today;
one look at the news and one can see that discrimination is alive and well. But, what was
once lynching has now become homicide based on Stand Your Ground state laws. In the
United States, the Stand Your Ground law asserts that an individual has no obligation to
retreat from any place they have lawful right to be and may use any level of force,
128
including lethal, if they reasonably believe they face an imminent and immediate threat of
serious bodily harm or death. It is not always clear-cut or apparent if a crime committed
under Stand Your Ground law is a result of self-defense or prejudice. Nevertheless, the
times have changed and so has the existence of discrimination.
As was stated earlier, this study is concerned with discrimination specific to the
workplace and is not focused on severe acts of violence, such as homicide. There are
many instances of discrimination that go unnoticed in daily business. For example,
Pearson, Dovidio, and Gaertner (2009) point out, aversive racists do not wish to
discriminate against members of minority groups and honestly believe in equal
employment, but, they will discriminate “when one’s actions can be justified or
rationalized on the basis of some other factor other than race” (p. 5). Likewise,
differences in ratings of applicants’ interviews for disabled and non-disabled applicants
have been found (Hayes & Macan, 1997). Therefore, the inability to detect prejudice
intent or know when discrimination is being disguised as justifiable acts (e.g., failing to
invite someone to a critical business meeting or providing lower performance evaluation
scores) makes studying workplace discrimination under the umbrella of workplace
aggression a more practical option.
Organizational Implications
When employees perceive their organization condoning workplace
discrimination, there are negative consequences that impact the individual, team, and
organization (Goldman, Gutek, Stein, & Lewis, 2006). This dissertation, in particular,
focused on the effects of discrimination in work teams. The use of teams has risen
throughout the past thirty years, partly as a means of reorganizing work in response to
129
increased foreign competition, changing task requirements and technology, and renewed
interest in the quality of work life (e.g., Cohen & Bailey, 1997). Consequently, reducing
perceptions of discrimination should be of great importance to organizational leaders,
even if their organization is not in danger of litigation. Organizations should aim to create
a work environment where fair treatment is not only valued, but is embedded in the
company culture. Organizational justice perceptions are key to achieving this. There are
three major types of organizational justice: distributive, procedural, and interactional
(Greenberg, 1987).
Distributive justice focuses on the perceived fairness of outcomes, procedural
justice focuses on whether the process used to make the decision was fair, and
interactional justice focuses on whether or not people are treated respectfully (i.e.,
interpersonal component) and are provided with adequate explanations for decisions (i.e.,
informational component; Greenberg, 1987; Lind & Tyler, 1988). Strong organizational
justice perceptions have the ability to mitigate perceptions of workplace discrimination.
Especially in instances of unfavorable outcomes (e.g., not being selected for a
promotion), procedural justice perceptions may reduce suspicions of prejudice intent. In
fact, research has shown that employees are more accepting of an unfavorable outcome if
they believe the procedures that resulted in the unfavorable outcome were fair (Brockner
& Wiesenfeld, 1996; Goldman, 2003).
Organizations should ensure that decisions are transparent and, whenever
possible, allow all stakeholders an opportunity for inclusion in the decision-making
process (Colquitt et al., 2002). Additionally, organizations should provide methods of
appeals for all decisions for which employees are affected (Colquitt et al., 2002). Lind
130
and Tyler (1988) illustrated the importance of providing employees with a voice during
difficult decisions and allowing them to express their views on significant matters. Also,
managers should take great care to avoid the appearance of favoritism towards any
individuals or groups of employees. Perceptions of favoritism could provide employees
with a “referent other” from which they could infer unfair treatment. Nonetheless, past
research has shown that managers can be trained to make decisions in a more
procedurally just manner (Skarlicki & Latham, 1996), therefore, an investment in training
to reduce bias may be useful in improving perceptions of workplace discrimination.
Along the same lines of training and development, organizations should consider
implementing diversity inclusion and team building programs. The contact hypothesis (or
intergroup contact theory; Allport, 1954; Amir, 1969; Cook, 1985) asserts that prejudice
can only be reduced when ingroup and outgroup members are brought together. Allport’s
intergroup contact theory has inspired extensive research over the past 60 years
(Pettigrew, 1998; Pettigrew & Tropp, 2000). These investigations have extended the
original focus on racial/ethnic groups to include a variety of groups, situations, and
societies. Pettigrew and Tropp (2006) conducted a meta-analysis of 515 studies involving
a quarter of a million participants in 38 nations to examine how intergroup contact
reduces prejudice. They found that three mediators were of particular importance: (a)
enhancing knowledge about the outgroup, (b) reducing anxiety about intergroup contact,
and (c) increasing empathy and perspective taking. Thus, offering diversity training to
employees would provide knowledge and understanding to ease anxiety of outgroups and
challenge ingroup assumptions of outgroups.
As Brown & Hewstone (2005) stated, more positive ingroup-outgroup outcomes
131
can be achieved to the extent that intergroup anxiety is reduced. Studies have shown
repeatedly that intergroup contact can reduce feelings of threat and anxiety about future
ingroup-outgroup interactions (e.g., Blair, Park, & Bachelor, 2003; Blascovich, Mendes,
Hunter, Lickel, & Kowai-Bell, 2001; Islam & Hewstone, 1993; Paolini, Hewstone,
Cairns, & Voci, 2004; Stephan & Stephan, 1985). Empathy, which has cognitive and
emotional aspects, has also been found to promote generalized positive feelings towards a
group on the whole (Batson et al., 1997; Finlay & Stephan, 2000; Galinsky &
Moskowitz, 2000).
When personalized interactions occur, members "attend to information that
replaces category identity as the most useful basis for classifying each other" (Brewer &
Miller, 1984, p. 288). In Bettencourt, Brewer, Rogers-Croak, and Miller (1992),
intergroup contact that permitted more personalized interactions (e.g., when cooperative
interaction was person-focused rather than task-focused) produced more positive attitudes
not only toward those outgroup members physically present in the contact situation but
also toward other outgroup members viewed in a video. This example illustrates the need
for more personalized interactions amongst team members to help reduce prejudice.
During personalization, members focus on information about an outgroup member as an
individual rather than as a particular group member. Repeated personalized interactions
should over time decrease the value of the category stereotypes as a source of information
about members of that group.
Likewise, decategorization proposes that in order to reduce intergroup bias,
intergroup interactions should be structured to weaken the salience of ingroup-outgroup
distinctions and to promote interpersonal interactions that facilitate the perceptions of
132
outgroup members as individuals. The main objective of decategorization is to change
how people regard one another from "us and them" to "you and me" (Gaertner et al.,
2000). Therefore, well-planned team building activities can provide opportunities for
such personalized interaction and decategorization. Altogether, this would help to reduce
prejudice and support a sense of “team” amongst a diverse group of employees.
Study Limitations & Future Research Directions
Though several limitations of this study have already been addressed, there are
others that should be mentioned. Firstly, this study used an archival dataset, therefore,
data were not directly manipulated. One of the objectives of this study was to assess
whether or not different types of workplace discrimination fall under the three
components of bias or aggression (i.e., cognitive, affective, and behavioral).
Unfortunately, using an archival dataset did not allow for the development of items to
measure more than the behavioral component of bias. As a result, future research should
extend the present work by developing specific items to cover the three components of
bias across each of the EEOC protected groups. Initial findings support workplace
discrimination items loading onto latent factors related to aggressive behaviors, even
despite the type of marginalized group referenced. But, not having the full range of items
to assess more than just the behavioral component of bias limits Hypothesis 2 of this
study. Ultimately, it is not as simple as saying that each type of discrimination is similar
because of a particular marginalized group. It is the actual behaviors themselves that help
to differentiate and categorize workplace discrimination across groups.
Secondly, it is also possible that the findings from the present study may not
generalize to other industries. For example, examining the effects of perceived workplace
133
discrimination climate on team effectiveness in a civilian sample would provide more
evidence for the external validity of the findings. However, the fact that perceived
workplace discrimination climate significantly effects team effectiveness in a sample of
predominantly White (69.6%) males (82.9%) between the ages of 22-40 (67.4%) suggests
that the results may be even stronger with a diverse sample. In other words, despite
primarily non-marginalized respondents in the sample, the effects of workplace
discrimination climate on team-level variables were still significant. Therefore, if the
study were to be replicated in a large company with greater diversity (i.e., individuals of
marginalized groups), then the relationships between variables are expected to be even
more prominent up to a certain threshold. Also, including disability and religion as
additional demographics would be valuable additions. Furthermore, differences in results
when moving from public sector to private sector would be of interest in its own right
too.
Thirdly, in the present study we were unable to obtain longitudinal data and, as a
result, the findings can only be conceptualized as relational rather than causal. In future
research, longitudinal designs will be needed in order to confidently interpret the pattern
of relationships among the variables identified in this study. Although we examine fit
(based on value congruence) at only one point in time, it is widely recognized that fit may
be conceptualized as dynamic rather than static (Ostroff, Shin, & Feinberg, 2002). That
is, because individuals and environments change over time, the degree of fit changes over
time as well (Tinsley, 2000). A growing body of research has shown that the more subtle,
interpersonal discrimination also has deleterious outcomes for its targets. Research by
Martel, Lane, and Willis (1996) shows that seemingly small and subtle behavioral
134
differences may have enormous impact in the workplace when compounded over time
(see Shapiro, King, & Quiñones, 2007; Stauffer & Buckley, 2005; Valian, 1998).
Lastly, this study conceptualized workplace discrimination as persistent
aggressive behavior at work based on prejudice against marginalized group members.
However, study participants were asked to report the likelihood of certain behaviors
occurring; whether or not these behaviors were based on prejudice was implied. As
discussed earlier, it is quite difficult to determine prejudice intent especially now that
discrimination has become more covert in nature. Nonetheless, significant effects were
found suggesting that perceptions alone of workplace injustice are enough to cause
negative effects for teams. A future research design could manipulate intentionality of
workplace discrimination behaviors to see how the results compare. It is expected that if
behaviors are presented as intentional, rather than inferred, then the effects of workplace
discrimination on teams would be even stronger than those observed in the present study.
Intentional discrimination based on prejudice in the workplace would clearly violate
justice perceptions and organizational norms, thus, causing adverse effects for team
effectiveness.
Conclusion
In conclusion, this study answers a call to the field to pay closer attention to
marginalized group experiences of workplace discrimination (Ruggs et al., 2013). Results
revealed that the form of workplace discrimination (e.g., CO, VA, and DT) is just as
important as the type (i.e., race/ethnicity, gender, religion, age, and disability). Typically,
workplace discrimination researchers have focused on only one or two marginalized
groups at a time, making it difficult to identify similar behaviors and effects across
135
groups. This study helps to fill a gap in the literature by taking a much broader look at
workplace discrimination across five EEOC protected groups and examining the overlap
between behaviors. There is initial support for studying workplace discrimination,
conceptualized as aggressive behaviors motivated by prejudice, under the much larger
construct of workplace aggression.
In fact, maybe I/O psychologists never missed the mark in examining
marginalized employees’ experiences of workplace discrimination, maybe it has been
studied under the guise of workplace aggression all along. A review of the literature
focusing on “discrimination” will generate a list of studies that specifically reference
discrimination (Ruggs et al., 2013), but may not include occasions where workplace
aggression was targeted at marginalized group members. As this study points out, actual
behaviors overlap despite being labeled workplace aggression or workplace
discrimination. Especially with the illegality of outright prejudice and the prevalence of
more covert forms, discrimination has not disappeared – it has only changed forms.
Accordingly, discrimination in the workplace resembles a wide array of (non-violent)
aggressive behaviors integrated into day-to-day interactions and business operations.
It may be that a literature search on workplace aggression returns numerous
studies examining aggressive behaviors across marginalized groups. Granted, the primary
focus of these studies may not be on group differences, but the nature of the behaviors
and their effects would be. Future research would benefit from examining possible
interaction effects between discrimination type and form. Perhaps more salient types of
discrimination, based on historical events (i.e., race/ethnicity and gender), interact
differently with certain aggressive behaviors than more emerging types of discrimination
136
(e.g., age, religion, disability, LGBT, marital status, weight, etc.). As demonstrated by
this study’s findings, there is more to consider when examining the effects of workplace
discrimination than just group type. Understanding how behaviors are enacted across
multiple groups will provide more specific ways of reducing its undesirable effects in
organizations.
Lastly, while most research on discrimination in the I/O psychology literature has
focused on litigation and unfair employment practices, this study provides an
examination of perceived workplace discrimination on team effectiveness. Specifically, a
climate for workplace discrimination was found to have negative effects on team
effectiveness through two separate mechanisms, which included: (a) reduced collective
value congruence that, in turn, reduced team cohesion and (b) reduced shared perceptions
of affective commitment. Organizations and, specifically, team leaders should continually
assess their teams’ perceptions of discrimination likely to occur in the workplace.
Perceptions alone seem to be enough for teams to collectively experience negative
repercussions (England, 1992; Kilbourne, England, Farkas, Beron, & Weir, 1994;
Neumark & McLennan, 1995; Reskin & Padavic, 1994). The outcomes of perceived
workplace discrimination result in less effective teams due to lack of value congruence
between team members and their organization, lack of trust and care towards fellow team
members, and reduced feelings of commitment and attachment to the organization – all of
which have been shown to promote team success. Therefore, monitoring workplace
discrimination perceptions can help to prevent such negative consequences and maintain
the effectiveness of teams.
137
REFERENCES
Adams, A. (1992a). Bullying at work: How to confront and overcome it. London, UK: Virago Press.
Adams, A. (1992b). Holding out against workplace harassment and bullying. Personnel
Management, 24, 38-50. Adkins, C. L., Russell, C. J., & Werbel, J. D. (1994). Judgments of fit in the selection
process: The role of work value congruence. Personnel Psychology, 47,605-623. Adler, S., & Aranya, N. (1984). A comparison of the work needs, attitudes, and
preferences of professional accountants at different career stages. Journal of Vocational Behavior, 25, 45-57.
Agnew, C. R., Thompson, V. D., & Gaines, S. O. (2000). Incorporating proximal and
distal influences on prejudice: Testing a general model across outgroups. Personality and Social Psychology Bulletin, 26, 403-418.
Allen, N. J., & Meyer, J. P. (1993). Organizational commitment: Evidence of career stage
effects? Journal of Business Research, 26, 49-61. Allport, G. (1954). The nature of prejudice. Reading, MA: Addison-Wesley. Alutto, J., Hrebiniak, L., & Alonso, R. (1973). On operationalizing the concept of
commitment. Social Forces, 51, 448-454. Ambrose, M. L., & Kulik, C. T. (1989). The influence of social comparison procedures
on perceptions of procedural fairness. Journal of Business and Psychology, 4, 129-138.
Ambrose, M. L., Harland, L. K., & Kulik, C. T. (1991). Influence of social comparisons
on perceptions of organizational fairness. Journal of Applied Psychology, 78, 239-246.
Amir, Y. (1969). Contact hypothesis in ethnic relations. Psychological Bulletin, 71, 319-
342. Anderson, C. A., & Huesmann, L. R. (2003). Human aggression: A social-cognitive
view. In M. A. Hogg & J. Cooper (Eds.), Handbook of social psychology (pp. 296-323). London, UK: Sage.
Andersson, L. M., & Pearson, C. M. (1999). Tit for tat? The spiraling effect of incivility
in the workplace. The Academy of Management Review, 24, 452-471.
138
Andrews, M. C., Baker, T., & Hunt, T. G. (2011). Values and person-organization fit: Does moral intensity strengthen outcomes? Leadership & Organization Development Journal, 32, 5-19.
Angle, H. L., & Perry, J. L. (1983). Organizational commitment: Individual and
organizational influences. Work and Occupations, 10, 123-146. Aquino, K., & Thau, S. (2009). Workplace victimization: Aggression from the target’s
perspective. Annual Review of Psychology, 60, 717-741. Aquino, K., Grover, S. L., Bradfield, M., & Allen, D. G. (1999). The effects of negative
affectivity, hierarchical status, and self-determination on workplace victimization. Academy of Management Journal, 42, 260-272.
Aquino, K., Tripp, T. M., & Bies, R. J. (2001). How employees respond to interpersonal
offense: The effects of blame attribution, offender status, and victim status on revenge and reconciliation in the workplace. Journal of Applied Psychology, 86, 52-59.
Argote, L., & McGrath, J. E. (1993). Group process in organizations: Continuity and
change. In C. I. Cooper & I. T. Robertson (Eds.), International review of industrial and organizational psychology (Vol. 8, pp. 333-389). London, UK: Wiley.
Ashforth, B. E. (1994). Petty tyranny in organizations. Human Relations, 47, 755-778. Ashkanasy, N. M., Wilderom, C. P. M., & Peterson, M. F. (Eds.). (2000). Handbook of
organizational culture and climate. Thousand Oaks, CA: Sage. Avery, D. R., McKay, P. F., & Wilson, D. C. (2008). What are the odds? How
demographic similarity affects the prevalence of perceived employment discrimination. Journal of Applied Psychology, 93, 235-249.
Banks, R.R., Eberhardt, J.L., & Ross, L. (2008). Race, crime, and antidiscrimination.
Beyond common sense: Psychological science in the courtroom (pp. 3-22). London, UK: Blackwell.
Barna, L. M. (1983). The stress factor in intercultural relations. In D. Landis & R. W.
Brislin (Eds.), Handbook of intercultural training (Vol. 2, pp. 19-49). New York: Pergamon.
Baron, R. A. & Richardson, D. R. (1994). Human aggression (2nd ed.). New York, NY:
Plenum Press.
139
Baron, R. A., & Neuman, J. H. (1996). Workplace violence and workplace aggression: Evidence on their relative frequency and potential causes. Aggressive Behavior, 22, 161-173.
Baron, R. M., & Kenny, D. A. (1986). The moderator-mediator variable distinction in
social psychological research: Conceptual, strategic, and statistical considerations. Journal of Personality & Social Psychology, 51, 1173-1182.
Barsade, S. G., Ward, A. J., Turner, J. D. F., & Sonnenfeld, J. A. (2000). To your heart’s content: A model of affective diversity in top management teams. Administrative Science Quarterly, 45, 802-837.
Bartko, J. J. (1976). On various intraclass correlation reliability coefficients. Psychological Bulletin, 83, 762-765.
Batson, C. D., Polycarpou, M. P., Harmon-Jones, E., Imhoff, H. J., Mitchener, E. C., Bednar, L. L., Klein, T. R., & Highberger, L. (1997). Empathy and attitudes: Can feeling for a member of a stigmatized group improve feelings toward the group? Journal of Personality and Social Psychology, 72, 105-118.
Beal, D. J., Cohen, R. R., Burke, M. J., & McLendon, C. L. (2003). Cohesion and performance in groups: A meta-analytic clarification of construct relations. Journal of Applied Psychology, 88, 989-1004.
Becker, T. E. (1992). Foci and bases of commitment: Are they distinctions worth making? Academy of Management Journal, 35, 232-244.
Bennett, R. J., & Robinson, S. L. (2000). Development of a measure of workplace deviance. Journal of Applied Psychology, 85, 349-360.
Bennis, W. G., & Nanus, B. (1985). Leaders: The strategies for taking charge. New York, NY: Harper & Row.
Berger, C. R. (2005). Interpersonal communication: Theoretical perspectives, future prospects. Journal of Communication, 55, 415-447.
Berger, C. R., & Calabrese, R. J. (1975). Some explorations in initial interaction and beyond: Toward a developmental theory of interpersonal communication. Human Communication Research, 1, 99-112.
Berkowitz, L. (1993). Aggression: Its causes, consequences, and control. New York, NY: McGrawHill.
Bettencourt, B. A., Brewer, M. B., Rogers-Croak, M., & Miller, N. (1992). Cooperation and the reduction of intergroup bias: The role of reward structure and social orientation. Journal of Experimental Social Psychology, 28, 301-319.
140
Biemann, T., Cole, M. S., & Voelpel, S. (2012). Within-group agreement: On the use (and misuse) of rwg and rwg(j) in leadership research and some best practice guidelines. Leadership Quarterly, 23, 66-80.
Bies, R. J., & Tripp, T. M. (2005). The study of revenge in the workplace: Conceptual, ideological, and empirical issues. In S. Fox, & P. E. Spector (Eds.), Counterproductive work behavior: Investigations of actors and targets (pp. 65-81). Washington, DC: American Psychological Association.
Bies, R. J., Tripp, T. M., & Kramer, R. M. (1997). At the breaking point: Cognitive and social dynamics of revenge in organizations. In R. A. Giacalone & J. Greenberg (Eds.), Antisocial behavior in organizations (pp. 18-36). Thousand Oaks, CA: Sage.
Blair, I. V. (2001). Implicit stereotypes and prejudice. In G. B. Moskowitz (Ed.), Cognitive social psychology: The Princeton Symposium on the Legacy and Future of Social Cognition (pp. 359-374). Mahwah, NJ: Erlbaum.
Blair, I. V., Park, B., & Bachelor, J. (2003). Understanding intergroup anxiety: Are some people more anxious than others? Group Processes and Intergroup Relations, 6, 151-169.
Blalock, H. M., Jr. (1972). Social statistics. New York, NY: McGraw-Hill.
Blanton, H., & Christie, C. (2003). Deviance regulation: A theory of action and identity. Review of General Psychology, 7, 115-149.
Blascovich, J., Mendes, W. B., Hunter, S. B., Lickel, B., & Kowai-Bell, N. (2001). Perceiver threat in social interactions with stigmatized others. Journal of Personality and Social Psychology, 80, 253-267.
Blau, P. M. (1964). Exchange and power in social life. New York, NY: Wiley.
Bliese, P. D. (1998). Group size, ICC values, and group-level correlations: A simulation. Organizational Research Methods, 1, 355-373.
Bliese, P. D. (2000). Within-group agreement, non-independence, and reliability: Implications for data aggregation analysis. In K. J. Klein, & S. W. J. Kozlowski (Eds.), Multilevel theory, research, and methods in organizations: Foundations, extensions, and new directions (pp. 349-381). San Francisco, CA: Jossey-Bass.
Bliese, P. D. (2002). Multilevel random coefficient modeling in organizational research: Examples using SAS and S-PLUS. In F. Drasgow & N. Schmitt (Eds.),
141
Measuring and analyzing behavior in organizations (pp. 401-445). San Francisco, CA: Jossey-Bass.
Bliese, P. D., & Halverson, R. R. (1996). Individual and nomothetic models of job stress: An examination of work hours, cohesion, and well-being. Journal of Applied Social Psychology, 26, 1171-1189.
Bliese, P. D., & Halverson, R. R. (1998). Group size and measures of group-level properties: An examination of eta-squared and ICC values. Journal of Management, 24, 157-172.
Bobo, L. (1998). Race, interests, and beliefs about affirmative action: Unanswered questions and new directions. American Behavioral Scientist, 41, 985-1003.
Bobo, L. D. (2001). Racial attitudes and relations at the close of the twentieth century. In N. J. Smelser, W. J. Wilson, & F. Mitchell (Eds.), America becoming: Racial trends and their consequences (Vol. 1, pp. 264-301). Washington, DC: National Academy Press.
Borman, W. C. (1991). Job behavior, performance, and effectiveness. In M. D. Dunnette & L. M. (Eds.), Handbook of industrial and organizational psychology (pp. 271-326). Newbury Park, CA: Sage.
Borucki, C. C., & Burke, M. J. (1999). An examination of service-related antecedents of retail store performance. Journal of Organizational Behavior, 20, 943-962.
Boss, R. W. (1978). Trust and managerial problem solving revisited. Group and Organization Studies, 3, 331-342.
Bowen, D. E., & Ostroff, C. (2004). Understanding HRM-firm performance linkages: The role of the “strength” of the HRM system. Academy of Management Review, 29, 203-221.
Bowling, N. A., & Beehr, T. A. (2006). Workplace harassment from the victim’s perspective: A theoretical model and meta-analysis. Journal of Applied Psychology, 91, 998-1012.
Boxx, W. R., Randall Y. O., & Mark G. D. (1991). Organizational values and value congruence and their impact on satisfaction, commitment, and cohesion: An empirical examination within the public sector. Public Personnel Management, 20, 195-205.
Brehm, J. W. (1999). The intensity of emotion. Personality and Social Psychology Review, 3, 2-22.

142
Brewer, M. B. & Kramer, R. M. (1986). Choice behavior in social dilemmas: Effects of social identity, group size, and decision framing. Journal of Personality and Social Psychology, 50, 543-549.
Brewer, M. B. (1979). In-group bias in the minimal intergroup situation: A cognitive-motivational analysis. Psychological Bulletin, 86, 61-79.
Brewer, M. B. (1999). The psychology of prejudice: Ingroup love or outgroup hate? Journal of Social Issues, 55, 429-444.
Brewer, M. B. (2000). Reducing prejudice through cross-categorization: Effects of multiple social identities. In S. Oskamp (Ed.), Reducing prejudice and discrimination (pp. 165-183). Mahwah, NJ: Lawrence Erlbaum.
Brewer, M. B., & Miller, N. (1984). Beyond the contact hypothesis: Theoretical perspectives on desegregation. In N. Miller & M. B. Brewer (Eds.), Groups in contact: The psychology of desegregation (pp. 281-302). Orlando, FL: Academic Press.
Brief, A. P. (1998). Attitudes in and around organizations. Thousand Oaks, CA: Sage.
Brief, A. P., & Aldag, R. J. (1980). Antecedents of organizational commitment among hospital nurses. Sociology of Work and Occupations, 7, 210-221.
Brief, A. P., Dietz, J., Cohen, R. R., Pugh, S. D., & Vaslow, J. B. (2000). Just doing business: Modern racism and obedience to authority as explanations for employment discrimination. Organizational Behavior and Human Decision Processes, 81, 72-97.
Brockner, J., & Wiesenfeld, B. M. (1996). An integrative framework for explaining reactions to decisions: Interactive effects of outcomes and procedures. Psychological Bulletin, 120, 189-208.
Brodsky, C. M. (1976). The harassed worker. Lexington, MA: Lexington Books.
Brooke, P. P. Jr., Russell, D. W., & Price, J. L. (1988). Discriminant validation of measures of job satisfaction, job involvement, and organizational commitment. Journal of Psychology, 73, 139-145.
Brooks, L., & Perot, A. R. (1991). Reporting sexual harassment: Exploring a predictive model. Psychology of Women Quarterly, 15, 31-47.
Brown, R. (1995). Prejudice: Its social psychology. Cambridge, MA: Wiley-Blackwell.
143
Brown, R. D., & Hauenstein, N. M. A. (2005). Interrater agreement reconsidered: An alternative to the rwg indices. Organizational Research Methods, 8, 165-184.
Brown, R., & Hewstone, M. (2005). An integrative theory of intergroup contact. In M. Zanna (Ed.), Advances in experimental social psychology (Vol. 37, pp. 255-343). San Diego, CA: Academic Press.
Brown, T. A. (2006). Confirmatory factor analysis for applied research. New York, NY: Guilford Press.
Bryk, A. S., & Raudenbush, S. W. (1992). Hierarchical linear models: Applications and data analysis methods. Newbury Park, CA: Sage.
Bucciarelli, M., & Johnson-Laird, P. N. (2005). Naïve deontics: A theory of meaning, representation, and reasoning. Cognitive Psychology, 50, 159-193.
Buchanan, B., II. (1974). Building organizational commitment: The socialization of managers in work organizations. Administrative Science Quarterly, 19, 533-546.
Burch, G. S. J., & Anderson, N. (2004). Measuring person-team fit: Development and validation of the team selection inventory. Journal of Managerial Psychology, 19, 406-426.
Burch, G. S. J., & Anderson, N. (2008). The team selection inventory: Empirical data from a New Zealand sample. Asia Pacific Journal of Human Resources, 46, 241-252.
Burke, M. J., Finkelstein, L. M., & Dusig, M. S. (1999). On average deviation indices for estimating interrater agreement. Organizational Research Methods, 2, 49-68.
Burt, R. S. (1987). Social contagion and innovation, cohesion versus structural equivalence. American Journal of Sociology, 92, 1287-1335.
Bushman, B. J., & Anderson, C. A. (2001). Is it time to pull the plug on the hostile versus instrumental aggression dichotomy? Psychological Review, 108, 273-279.
Buss, A. H., & Perry, M. (1992). The Aggression Questionnaire. Journal of Personality and Social Psychology, 63, 452-459.
Byrne, B. M. (2001). Structural equation modeling with AMOS: Basic concepts, applications and programming. Mahwah, NJ: Erlbaum.
Byrne, D. (1969). Attitudes and attraction. In L. Berkowitz (Ed.), Advances in experimental social psychology (Vol. 4, pp. 35-89). New York, NY: Academic Press.
144
Byrne, D. (1971). The attraction paradigm. New York: Academic Press.
Cable, D. M., & De Rue, D. S. (2002). The convergent and discriminant validity of subjective fit perceptions. Journal of Applied Psychology, 87, 875-884.
Cable, D. M., & Judge, T. A. (1996). Person–organization fit, job choice decisions, and organizational entry. Organizational Behavior & Human Decision Processes, 67, 294-311.
Cable, D. M., & Judge, T. A. (1997). Interviewers’ perceptions of person–organization fit and organizational selection decisions. Journal of Applied Psychology, 82, 546-561.
Caldwell, D F., & O’Reilly, C. A. (1990). Measuring person-job fit with a profile-comparison process. Journal of Applied Psychology. 15, 648-657.
Campion, M. A., Medsker, G. J., & Higgs, A. C. (1993). Relations between work group characteristics and effectiveness: Implications for designing effective work groups. Personnel Psychology, 46, 823-850.
Campion, M. A., Papper, E. M., & Medsker, G. J. (1996). Relations between work team characteristics and effectiveness: A replication and extension. Personnel Psychology, 49, 429-452.
Cannon-Bowers, J. A., & Bowers, C. A. (2010). Team development and functioning. In S. Zedeck (Ed.), Handbook of industrial and organizational psychology (Vol. 1, pp. 597-650). Washington, DC: American Psychological Association.
Cannon-Bowers, J. A., Oser, R., & Flanagan, D. (1992). Work teams in industry: A selected review and proposed framework. In R. W. Swezey & E. Salas, (Eds.), Teams: Their training and performance (pp. 355-377). Westport, CT: Ablex.
Cannon-Bowers, J. A., Tannenbaum, S. I., Salas, E., & Volpe, C. E. (1995). Defining team competencies and establishing team-training requirements. In R. A. Guzzo, E. Salas, & Associates (Eds.), Team effectiveness and decision making in organizations (pp. 333-380). San Francisco, CA: Jossey-Bass.
Caple, R. B. (1978). The sequential stages of group development. Small Group Behavior, 9, 470-476.
Carron, A. V. (1982). Cohesiveness in sport groups: Interpretations and considerations. Journal of Sport Psychology, 4, 123-138.
Cartwright, D. (1968). The nature of group cohesiveness. In D. Cartwright & A. Zander (Eds.), Group dynamics: Research and theory (3rd ed., pp. 91-109). New York, NY: Harper & Row.
145
Cartwright, D., & Zander, A. (Eds.). (1960). Group dynamics: Research and theory (2nd ed.). Evanston, IL: Row, Peterson, & Company.
Cascio, W. F. (1999). Costing human resources: The financial impact of behavior in organizations (4th ed.). Cincinnati, OH: Southwestern College Publishing.
Castro, S. L. (2002). Data analytic methods for the analysis of multilevel questions: A comparison of intraclass correlation coefficients, rwg(j), hierarchical linear modeling, within- and between-analysis, and random group resampling. The Leadership Quarterly, 13, 69-93.
Cattell, R. B. (1966). The scree test for the number of factors. Multivariate Behavioral Research, 1, 245-276.
Chan, D. (1998). Functional relations among constructs in the same content domain at different levels of analysis: A typology of composition models. Journal of Applied Psychology, 83, 234-246.
Chatman, J. A. (1989). Improving interactional organizational research: A model of person–organization fit. Academy of Management Review, 14, 333-349.
Chatman, J. A. (1991). Matching people and organizations: Selection and socialization in public accounting firms. Administrative Science Quarterly, 36, 459-484.
Chen, M., & Bargh, J. A. (1997). Nonconscious behavioral confirmation processes: The self-fulfilling consequences of automatic stereotype activation. Journal of Experimental Social Psychology, 33, 541-560.
Cherrington, D. J., Condie, S. J., & England, J. L. (1979). Age and work values. Academy of Management Journal, 22, 617-623.
Child, D. (1990). The essentials of factor analysis (2nd ed.). London, UK: Cassel Educational Limited.
Christian, M. S., Garza, A. S., & Slaughter, J. E. (2011). Work engagement: A quantitative review and test of its relations with task and contextual performance. Personnel Psychology, 64, 89-136.
Christiansen, N., Villanova, P., & Mikulay, S. (1997). Political influence compatibility: Fitting the person to the climate. Journal of Organizational Behavior, 18, 709-730.
Cohen, A. (1993). Age and tenure in relation to organizational commitment: A meta-analysis. Basic and Applied Social Psychology, 14, 143-159.
146
Cohen, A., Doveh, E., & Eick, U. (2001). Statistical properties of the rwg(j) index of agreement. Psychological Methods, 6, 297-310.
Cohen, J., Cohen, P. C., West, S. G., & Aiken, L. S. (2003). Applied multiple regression/correlation analysis for the behavioral sciences (3rd ed.). Mahwah, NJ: Erlbaum.
Cohen, S. G., & Bailey, D. E. (1997). What makes teams work: Group effectiveness research from the shop floor to the executive suite. Journal of Management, 23, 239-290.
Colquitt, J. A. (2000, August). Does the voice of the many outweigh the voice of the one? On the meaning of procedural justice in teams. In T. Tyler (Chair), Images of justice in the eyes of employees: What makes a process fair in work settings? Symposium conducted at the annual meeting of the Academy of Management, Toronto, Canada.
Colquitt, J. A. (2001). On the dimensionality of organizational justice: A construct
validation of a measure. Journal of Applied Psychology, 86, 386-400.
Colquitt, J. A., Conlon, D. E., Wesson, M. J., Porter, C., & Ng, K. Y. (2001). Justice at the millennium: A meta-analytic review of 25 years of organizational justice research. Journal of Applied Psychology, 86, 425-445.
Colquitt, J. A., Noe, R. A., & Jackson, C. L. (2002). Justice in teams: Antecedents and consequences of procedural justice climate. Personnel Psychology, 55, 83-109.
Cook, S. W. (1985). Experimenting on social issues: The case of school desegregation. American Psychologist, 40, 452-460.
Corning, A. F., & Krengal, M. (2002). Self-esteem as a moderator between perceived discrimination and psychological distress among women. Journal of Counseling Psychology, 40,117-124.
Cottrell, C. A., Neuberg, S. L., & Li, N. P. (2007). What do people desire in others? A sociofunctional perspective on the importance of different valued characteristics. Journal of Personality and Social Psychology, 92, 208-231.
Cox, T., Jr. (1991). The multicultural organization. Academy of Management Executive, 5, 34-47.
Cox, T., Jr. (1993). Cultural diversity in organizations: Theory, research, and practice. San Francisco, CA: Barrett-Kehler.
Cox, T., Jr. (1994). Cultural diversity in organizations. San Francisco, CA: Berrett-Koehler.
147
Crandall, C. S., & Cohen, C. (1994). The personality of the stigmatizer: Cultural world view, conventionalism, and self-esteem. Journal of Research in Personality, 28, 461-480.
Crandall, C. S., & Eshleman, A. (2003). A Justification-Suppression Model of the expression and experience of prejudice. Psychological Bulletin, 129, 414-446.
Cropanzano, R., & Folger, R. (1989). Referent cognitions and task decision autonomy: Beyond equity theory. Journal of Applied Psychology, 74, 293-299.
Cropanzano, R., & Folger, R. (1991). Procedural justice and worker motivation. In R. Steers & L. Porter (Eds.), Motivation and work behavior (5th ed., pp. 131-143). New York, NY: McGraw-Hill.
Cropanzano, R., & Greenberg, J. (1997). Progress in organizational justice: Tunneling through the maze. In C. L. Cooper & I. T. Robertson (Eds.), International review of industrial and organizational psychology (pp. 317-372). New York, NY: John Wiley.
Cropanzano, R., Goldman, B., & Folger, R. (2003). Deontic justice: The role of moral principles in workplace fairness. Journal of Organizational Behavior, 24, 1019-1024.
Cropanzano, R., Goldman, B., & Folger, R. (2005). Self-interest: Defining and understanding a human motive. Journal of Organizational Behavior, 26, 985-991.
Cropanzano, R., Stein, J., & Goldman, B. M. (2007). Self-interest. In E. H. Kessler & J. R. Bailey (Eds.), Handbook of organizational and managerial wisdom (pp. 181-221). Thousand Oaks, CA: Sage.
Crosby, F. J., Bromley, S., & Saxe, L. (1980). Recent unobtrusive studies of Black and White discrimination and prejudice: A literature review. Psychological Bulletin, 87, 546-563.
Dansby, M. R., & Landis, D. (1991). Measuring equal opportunity in the military environment. International Journal of Intercultural Relations, 15, 389-405.
Dansby, M. R., & Landis, D. (1998). Race, gender, and representation index as predictors of an equal opportunity climate in military organizations. Military Psychology, 10, 87-105.
Darlington, R. B. (1990). Regression and linear models. New York, NY: McGraw-Hill.
Dastmalchian, A. (2008). Industrial relations climate. In P. Blyton, N. Bacon, J. Fiorito, & E. Heery (Eds.), Handbook of industrial relations (pp. 548-571). Los Angeles, CA: Sage.
148
Davidson, M., & Friedman, R. A. (1998). Why excuses don’t work: Persistent injustice effect among black managers. Administrative Science Quarterly, 43, 154-183.
Davis, J. H. (1969). Group performance. Reading, MA: Addison Wesley.
De Dreu, C. K. W., & Gelfand, M. J. (Eds.), (2008). The psychology of conflict and conflict management in organizations. New York, NY: Taylor & Francis.
De Dreu, C. K. W., & Weingart, L. R. (2003). Task versus relationship conflict, team performance, and team member satisfaction: A meta-analysis. Journal of Applied Psychology, 88, 741-749.
Deitch, E. A., Barsky, A., Butz, R. M., Chan, S., Brief, A. P., & Bradley, J. (2003). Subtle yet significant: The existence and impact of everyday racial discrimination in the workplace. Social Relations, 56, 1299-1324.
Delbecq, A., & Mills, P. K. (1985). Managerial practices that enhance innovation. Organizational Dynamics, 14, 24-34.
Demuijnck, G. (2009). Non-discrimination in human resource management as a moral obligation. Journal of Business Ethics, 88, 83-101.
Desert Palace, Inc. v. Costa, 539 U.S. 90 (2003).
Deutsch, M. (1973). The resolution of conflict: Constructive and destructive processes. New Haven, CT: Yale University Press.
Devine, P. G. (1989). Stereotypes and prejudice: Their automatic and controlled components. Journal of Personality and Social Psychology, 56, 5-18.
Devine, P. G., Monteith, M. J., Zuwerink, J. R., & Elliot, A. J. (1991). Prejudice with and without compunction. Journal of Personality and Social Psychology, 60, 817-830.
Dijker, A. J. M. (1987). Emotional reactions to ethnic minorities. European Journal of Social Psychology, 17, 305–325.
Dion, K. L., & Evans, C. R. (1992). On cohesiveness: Reply to Keyton and other critics of the construct. Small Group Research, 23, 242-250.
Dipboye, R., & Colella, A. (2005). Discrimination at work: The psychological and organizational bases. Mahwah, NJ: Lawrence Erlbaum Associates.
Dollard, J., Doob, L., Miller, N., Mowrer, O., & Sears, R. (1939). Frustration and aggression. New Haven, CT: Yale University Press.
149
Dovidio, J. F., & Gaertner, S. L. (1983). Racial attitudes and the effects of a partners race on asking for help. In B. M. DePaulo, A. Nadler, & J. Fisher (Eds.), New directions in helping (Vol. 2, pp. 285-303). New York, NY: Academic Press.
Dovidio, J. F., & Gaertner, S. L. (1991). Changes in the nature and assessment of racial prejudice. In H. Knopke, J. Norrell, & R. Rodgers (Eds.), Opening doors: An appraisal of race relations in contemporary America (pp. 201-241). Tuscaloosa, AL: University of Alabama Press.
Dovidio, J. F., & Gaertner, S. L. (1993). Stereotypes and evaluative intergroup bias. In D. M. Mackie & D. L. Hamilton (Eds.), Affect, cognition, and stereotyping: Interactive processes in intergroup perception (pp. 167-193). Orlando, FL: Academic Press.
Dovidio, J. F., & Gaertner, S. L. (1998). On the nature of contemporary prejudice: The causes, consequences, and challenges of aversive racism. In J. Eberhardt & S.T. Fiske (Eds.), Confronting racism: The problem and the response (pp. 3-32). Newbury Park, CA: Sage.
Dovidio, J. F., & Gaertner, S. L. (2004). Aversive racism. In M. P. Zanna (Ed.), Advances
in experimental social psychology (Vol. 36, pp. 1-51). San Diego, CA: Academic Press.
Dovidio, J. F., & Hebl, M. R. (2005). Discrimination at the level of the individual: Cognitive and affective factors. In R. L. Dipboye & A. Colella (Eds.), Discrimination at work: The psychological and organizational bases (pp. 11-35). Mahwah, NJ: Erlbaum.
Dovidio, J. F., Gaertner, S. L., Kawakami, K., & Hodson, G. (2002a). Why can’t we just get along? Interpersonal biases and interracial distrust. Cultural Diversity & Ethnic Minority Psychology, 8, 88-102.
Dovidio, J. F., Kawakami, K., & Gaertner, S. L. (2002b). Implicit and explicit prejudice and interracial interaction. Journal of Personality and Social Psychology, 82, 62-68.
Dovidio, J. F., Hewstone, M., Glick, P., & Esses, V. (2010). Prejudice, stereotyping and discrimination: Theoretical and empirical overview. In J. Dovidio, M. Hewstone, P. Glick, & V. Esses (Eds.), Handbook of prejudice, stereotyping and discrimination (pp. 3-29). London, UK: Sage.
Dovidio, J. F., & Gaertner, S. L. (1986). Prejudice, discrimination, and racism: Historical trends and contemporary approaches. In J. F. Dovidio & S. L. Gaertner (Eds.), Prejudice, discrimination, and racism (pp. 1-34). New York, NY: Academic Press.
150
Duckitt, J. (1992). Psychology and prejudice: A historical analysis and integrative framework. American Psychologist, 47, 1182-1193.
Duffy, M. K., Ganster, D. C., & Pagon, M. (2002). Social undermining in the workplace. Academy of Management Journal, 45, 331-351.
Dukes v. Wal-Mart Stores, Inc., 603 F.3d 571 (9th Cir. 2010).
Dutton, J. E., & Dukerich, J. M. (1991). Keeping an eye on the mirror: The role of image and identity in organizational adaptation. Academy of Management Journal, 34, 517-554.
Eagly, A. H., & Chaiken, S. (1998). Attitude structure and function. In D. T. Gilbert, S. T. Fiske, & G. Lindzey (Eds.), Handbook of social psychology (4th ed., Vol. 1, pp. 269-322). New York, NY: MacGraw-Hill.
Eagly, A. H., & Diekman, A. B. (2005). What is the problem? Prejudice as attitude-in context. In J. F. Dovidio, P. Glick, & L. A. Rudman (Eds.), On the nature of prejudice: Fifty years after Allport (pp. 19-35). Malden, MA: Blackwell.
Edwards, J. R. (1991). Person-job fit: A conceptual integration, literature review, and methodological critique. In C. L. Cooper & I. T. Robertson (Eds.), International review of industrial and organizational psychology (Vol. 6, pp. 283-357). New York, NY: Wiley.
Edwards, J. R., Caplan, R. D., & Harrison, R. V. (1998). Person-environment fit theory: Conceptual foundations, empirical evidence, and directions for future research. In C. L. Cooper (Ed.), Theories of organizational stress (pp. 28-67). Oxford, England: Oxford University Press.
Edwards, M. S., & Greenberg, J. (2010). What is insidious workplace behavior? In J. Greenberg (Ed.), Insidious workplace behavior. New York, NY: Routledge.
Einarsen, S. (2000). Harassment and bullying at work: A review of the Scandinavian approach. Aggression and Violent Behavior: A Review Journal, 5, 371-401.
Eisenberger, R., Fasolo, P., & Davis-LaMastro, V. (1990). Perceived organizational support and employee diligence, commitment, and innovation. Journal of Applied Psychology, 75, 51-59.
Elangovan, A. R., & Shapiro, D. L. (1998). Betrayal of trust in organizations. Academy of Management Review, 23, 547-566.
England, P. (1992). Comparable worth: Theories and evidence. New York, NY: Aldine.
151
Ensher, E. A., Grant-Vallone, E. J., & Donaldson, S. I. (2001). Effects of perceived discrimination on organizational citizenship behavior, job satisfaction, and organizational commitment. Human Resource Development Quarterly, 12, 53-72.
Enz, C. A. (1988). The role of value congruity in intraorganizational power. Administrative Science Quarterly, 33, 284-304.
Erdogan, B., & Bauer, T. N. (2005). Enhancing career benefits of employee proactive personality: The role of fit with jobs and organizations. Personnel Psychology, 58, 859-891.
Erdogan, B., Kraimer, M. L., & Liden, R. C. (2004). Work value congruence and intrinsic career success: The compensatory roles of leader-member exchange and perceived organizational support. Personnel Psychology, 57, 305-332.
Esses, V. M., Haddock, G., & Zanna, M. P. (1993). Values, stereotypes, and emotions as determinants of intergroup attitudes. In D. M. Mackie & D. L. Hamilton (Eds.), Affect, cognition and stereotyping: Interactive processes ingroup perception (pp. 137-166). New York, NY: Academic Press.
Estrada, A. X., Stetz, M. C., & Harbke, C. R. (2007). Further examination and refinement of the psychometric properties of the MEOCS with data from reserve component personnel. International Journal of Intercultural Relations, 31, 137-161.
Evans, C. R., & Dion, K. L. (1991). Group cohesion and performance: A meta-analysis. Small Group Research, 22, 175-186.
Evans, C. R., & Jarvis, P. A. (1980). Group cohesion: A review and reevaluation. Small Group Behavior, 11, 359-370.
Ferris, G. R., & Judge, T. A. (1991). Personnel/human resources management: A political influence perspective. Journal of Management, 17, 447-488.
Festinger, L. (1950). Informal social communication. Psychological Review, 57, 271-282.
Festinger, L. (1954). A theory of social comparison processes. Human Relations, 7, 117-140.
Festinger, L., Schachter, S., & Back, K. (1950). Social pressures in informal groups: A study of human factors in housing. Stanford, CA: Stanford University Press.
Finlay, K. A., & Stephan, W. G. (2000). Improving intergroup relations: The effects of empathy on racial attitudes. Journal of Applied Social Psychology, 30, 1720-1737.
Finn, R. H. (1970). A note on estimating the reliability of categorical data. Educational and Psychological Measurement, 30, 71-76.
152
Fisher, C. D., & Gitelson, R. (1983). A meta-analysis of the correlates of role conflict and
ambiguity. Journal of Applied Psychology, 68, 320-333.
Fiske, S. T. (1980). Attention and weight in person perception: The impact of negative and extreme behavior. Journal of Personality and Social Psychology, 38, 889-906.
Fiske, S. T. (1998). Stereotyping, prejudice, and discrimination. In D. T. Gilbert, S. T. Fiske, & G. Lindzey (Eds.), Handbook of social psychology (4th ed., Vol. 2, pp. 357-411). New York, NY: McGraw-Hill.
Fiske, S. T. (2000). Stereotyping, prejudice, and discrimination at the seam between the centuries: Evolution, culture, mind, and brain. European Journal of Social Psychology, 30, 299-322.
Fiske, S. T. (2010). Social beings: Core motives in social psychology (2nd ed.). Hoboken, NJ: Wiley.
Fitzgerald, L. F., Hulin, C. L., Drasgow, F., Gelfand, M., & Magley, V. (1997). The antecedents and consequences of sexual harassment in organizations: A test of an integrated model. Journal of Applied Psychology, 82, 578-589.
Fitzgerald, L. F., Swan, S., & Fisher, K. (1995). Why didn't she just report him? The psychological and legal context of women's responses to sexual harassment. Journal of Social Issues, 51, 117-183.
Floyd, F. J., & Widaman, K. F. (1995). Factor analysis in the development and refinement of clinical assessment instruments. Psychological Assessment, 7, 286-299.
Folger, R. (1998). Fairness as a moral virtue. In M. Schminke (Ed.), Managerial ethics: Moral management of people and processes (pp. 13-34). Mahwah, NJ: Erlbaum.
Folger, R. (2001). Fairness as deonance. In S. W. Gilliland, D. D. Steiner, & D. P. Skarlicki (Eds.), Research in social issues in management (Vol. 1, pp. 3-33). Greenwich, CT: Information Age Publishers.
Folger, R., & Cropanzano, R. (2001). Fairness theory: Justice as accountability. In J. Greenberg & R. Cropanzano (Eds.), Advances in organizational justice (pp. 1-55). Stanford, CA: Stanford University Press.
Folger, R., & Konovsky, M. A. (1989). Effects of procedural and distributive justice on reactions to pay raise decisions. Academy of Management Journal, 32, 115-130.
153
Folger, R., Cropanzano, R., & Goldman, B. (2005). What is the relationship between justice and morality? In J. Greenberg & J. Colquitt (Eds.), Handbook of organizational justice (pp. 215-245). Mahwah, NJ: Lawrence Erlbaum Associates.
Ford, T. E., & Stangor, C. (1992). The role of diagnosticity in stereotype formation: Perceiving group means and variances. Journal of Personality and Social Psychology, 63, 356-367.
Forsyth, D. R. (1999). Group Dynamics (3rd ed.). Belmont, CA: Wadsworth Publishing Company.
Fox, J. (1991). Regression diagnostics: An introduction. Newbury Park, CA: Sage.
Fox, S. & Spector P. E. (Eds.). (2005). Counterproductive work behavior: Investigations of actors and targets. Washington, DC: APA.
Fox, S., & Spector, P. E. (1999). A model of work frustration-aggression. Journal of Organizational Behavior, 20, 915-931.
Fox, S., Spector, P. E., & Miles, D. (2001). Counterproductive work behavior (CWB) in response to job stressors and organizational justice: Some mediator and moderator tests for autonomy and emotions. Journal of Vocational Behavior, 59, 291-309.
French, J. R. P., Jr., Rogers, W., & Cobb, S. (1974). Adjustment as person-environment fit. In G. V. Coelho, D. A. Hamburg, & J. E. Adams (Eds.), Coping and adaptation. New York, NY: Basic Books.
Frey, D. L., & Gaertner, S. L. (1986). Helping and the avoidance of inappropriate interracial behavior: A strategy that perpetuates a nonprejudiced self-image. Journal of Personality and Social Psychology, 50, 1083-1090.
Friedkin, N. E. (2004). Social cohesion. Annual Review of Sociology, 30, 409-425.
Friedlander, F. (1970). The primacy of trust as a facilitator of further group accomplishment. Journal of Applied Behavioral Science, 6, 387-400.
Frijda, N. H. (1986). The emotions. Cambridge, UK: Cambridge University Press.
Gaertner, S. L., & Dovidio, J. F. (1986). The aversive form of racism. In J. F. Dovidio & S. L. Gaertner (Eds.), Prejudice, discrimination, and racism (pp. 61-89). Orlando, FL: Academic Press.
Gaertner, S. L., & Dovidio, J. F. (2000). Reducing intergroup bias: The common ingroup identity model. Philadelphia, PA: The Psychology Press.
154
Gaertner, S. L., & McLaughlin, J. (1983). Racial stereotypes: Associations and ascriptions of positive and negative characteristics. Social Psychology Quarterly, 46, 23-30.
Gaertner, S. L., Dovidio, J. F., Banker, B. S., Houlette, M., Johnson, K. M., & McGlynn, E. A. (2000). Reducing intergroup conflict: From superordinate goals to decategorization, recategorization, and mutual differentiation. Group Dynamics: Theory, Research, and Practice, 4, 98-114.
Galinsky, A. D., & Moskowitz, G. B. (2000). Perspective-taking: Decreasing stereotype expression, stereotype accessibility, and in-group favoritism. Journal of Personality and Social Psychology, 78, 708-724.
Gardham, K., & Brown, R. (2001). Two forms of intergroup discrimination with positive and negative outcomes: Explaining the positive-negative asymmetry effect. British Journal of Social Psychology, 40, 23-34.
Geen, R. G. (2001). Human Aggression (2nd ed.). Oxford, UK: Taylor & Francis.
Gelfand, M. J., Nishii, L., Raver, J., & Schneider, B. (2005). Discrimination in organizations: A systems perspective. In R. Dipboye and A. Colella (Eds.) Psychological and organizational bases of discrimination at work (pp. 89-116). New York, NY: Jossey Bass.
George, J. M. (1990). Personality, affect, and behavior in groups. The Journal of Applied Psychology, 75, 107-116.
George, J. M., & James, L. R. (1993). Personality, affect, and behavior in groups revisited: Comment on aggregation, levels of analysis, and a recent application of within and between analysis. Journal of Applied Psychology, 78, 798-804.
Gersick, C. J. G. (1988). Time and transition in work teams: Toward a new model of group development. Academy of Management Journal, 31, 9-41.
Gersick, C. J. G. (1989). Marking time: Predictable transitions in task groups. The Academy of Management Journal, 32, 274-309.
Gettman, H. J., & Gelfand, M. J. (2007). When the customer shouldn’t be king: Antecedents and consequences of sexual harassment by clients and customers. Journal of Applied Psychology, 92, 757-770.
Giacalone, R. A., & Greenberg. J. (Eds.). (1997). Antisocial behavior in organizations. Thousand Oaks, CA: Sage.
155
Gilbert, D. T. (1998). Ordinary personology. In D. T. Gilbert, S. T. Fiske, & G. Lindzey
(Eds.), Handbook of social psychology (4th ed., Vol. 2, pp. 89-150). New York,
NY: McGraw-Hill.
Gilbert, D. T., Pelham, B. W., & Krull, D. S. (1988). On cognitive busyness: When
person perceivers meet persons perceived. Journal of Personality and Social
Psychology, 54, 733-740.
Gilbert, J. A., & Ivancevich, J. M. (2001). Effects of diversity management on attachment. Journal of Applied Social Psychology, 31, 1331-1349.
Glick, P., & Fiske, S. T. (1996). The Ambivalent Sexism Inventory: Differentiating hostile and benevolent sexism. Journal of Personality and Social Psychology, 70, 491-512.
Glick, W. H. (1985). Conceptualizing and measuring organizational and psychological climate: Pitfalls of multilevel research. Academy of Management Review, 10, 601-616.
Glisson, C., & James, L. R. (2002). The cross-level effects of culture and climate in human service teams. Journal of Organizational Behavior, 23, 767-794.
Goldhaber, G., Yates, M., Porter, T., & Lesniak, R. (1978). Organizational communication. Human Communication Research, 5, 76-96.
Goldman, B. M. (2003). The application of reference cognitions theory to legal-claiming by terminated workers: The role of organizational justice and anger. Journal of Management, 29, 705-728.
Goldman, B. M., Gutek, B. A., Stein, J. H., & Lewis, K. (2006). Employment discrimination in organizations: Antecedents and consequences. Journal of Management, 32, 786-830.
Goldman, B. M., Slaughter, J. E., Schmit, M. J., Wiley, J. W., & Brooks, S. M. (2008). Perceptions of discrimination: A multiple needs model perspective. Journal of Management, 34, 952-977.
Golembiewski, R., & McConkie, M. (1988). The centrality of interpersonal trust in group process. In C. L. Cooper (Ed.), Theories of group process. New York, NY: Wiley.
Good, L. R., & Nelson, D. A. (1971). Effects of person-group and intragroup attitude similarity on perceived group attractiveness and cohesiveness. Psychonomic Science, 25, 215-217.
156
Goodman, P. S., Ravlin, E., & Schminke, M. (1987). Understanding groups in organizations. Research in Organizational Behavior, 9, 121-173.
Greenberg, J. (1987). A taxonomy of organizational justice theories. Academy of Management Review, 12, 9-22.
Greenberg, J. (1990). Employee theft as a reaction to underpayment inequity: The hidden cost of pay cuts. Journal of Applied Psychology, 75, 561-568.
Greenberg, J. (1993). Stealing in the name of justice: Informational and interpersonal moderators of theft reactions to underpayment inequity. Organizational Behavior and Human Decision Processes, 54, 81-103.
Greenberg, L., & Barling, J. (1999). Predicting employee aggression against co-workers, subordinates and supervisors: The roles of person behaviors and perceived workplace factors. Journal of Organizational Behavior, 20, 897-913.
Gregory, B. T., Albritton, M. D., & Osmonbekov, T. (2010). The mediating role of psychological empowerment on the relationships between P-O fit, job satisfaction, and in-role performance. Journal of Business Psychology, 25, 639-647.
Grienberger, I. V., Rutte, C. G., & Van Knippenberg. A. F. M. (1997). Influence of social comparisons of outcomes and procedures on fairness judgments. Journal of Applied Psychology, 82, 913-919.
Griggs v. Duke Power, 401 U.S. 424 (1971).
Gross, N., & Martin, W. E. (1952). On group cohesiveness. American Journal of Sociology, 57, 546-554.
Gruenfeld, D. H., Mannix, E. A., Williams, K. Y., & Neale, M. A. (1996). Group composition and decision making: How member familiarity and information distribution affect process and performance. Organizational Behavior and Human Decision Processes, 67, 1-15.
Gully, S. M., Devine, D. J., & Whitney, D. J. (1995). A meta-analysis of cohesion and performance: Effects of level of analysis and task interdependence. Small Group Research, 26, 497-520.
Gutek, B. A., Cohen, A. G., & Tsui, A. (1996). Reactions to perceived sex discrimination, Human Relations, 49, 791-813.
Guzzo, R. A., & Dickson, M. W. (1996). Teams in organizations: Recent research on performance and effectiveness. Annual Review of Psychology, 47, 307-338.
157
Guzzo, R. A., & Shea, G. P. (1992). Group performance and intergroup relations in organizations. In M. D. Dunnette & L. M. Hough (Eds.), Handbook of industrial and organizational psychology (2nd ed., Vol. 3, pp. 269-313). Palo Alto, CA: Consulting Psychologist Press.
Guzzo, R. A., Yost, P. R., Campbell, R. J., & Shea, G. P. (1993). Potency in groups: Articulating a construct. British Journal of Social Psychology, 32, 87-106.
Hackett, R. D., Bycio, P., & Hausdorf, P. A. (1994). Further assessments of Meyer and Allen’s (1991) three-component model of organizational commitment. Journal of Applied Psychology, 79, 15-23.
Hackman, J. R. (1986). The psychology of self-management in organizations. In M. S. Pollack & R. O. Perlogg (Eds.), Psychology and work: Productivity change and employment (pp. 85-136). Washington, DC: American Psychological Association.
Hackman, J. R. (1987). The design of work teams. In J. Lorsch (Ed.), Handbook of organizational behavior (pp. 315-342). Englewood Cliffs, NJ: Prentice-Hall.
Hackman, J. R. (1992). Group influences on individuals in organizations. In M. D. Dunnette & L. M. Hough (Eds.), Handbook of industrial and organizational psychology (2nd ed., Vol. 3, pp. 199-267). Palo Alto, CA: Consulting Psychologist Press.
Haggard, E. A. (1958). Intraclass correlation and the analysis of variance. New York, NY: Dryden Press.
Harding, J., Proshansky, H., Kutner, B., & Chein, I. (1969). Prejudice and ethnic relations. In G. Lindzey & W. Aronson (Eds.), Handbook of social psychology (2nd ed., Vol. 5, pp. 1-76). Reading, MA: Addison-Wesley.
Harris, M. M. (1994). Rater motivation in the performance appraisal context: A theoretical framework. Journal of Management, 20, 737-756.
Harris, S. G. & Mossholder, K. W. (1996). The affective implications of perceived
congruence with culture dimensions during organizational transformation. Journal of Management, 22, 527-548.
Harrison, D. A., Price, K. H., & Bell, M. P. (1998). Beyond relational demography: Time and the effects of surface- and deep-level diversity on work group cohesion. Academy of Management Journal, 41, 96-107.
Harrison, D. A., Price, K. H., Gavin, J. H., & Florey, A. T. (2002). Time, teams, and task performance: Changing effects of surface- and deep-level diversity on group functioning. Academy of Management Journal, 45, 1029-1045.
158
Hassel, B. L., & Perrewè, P. L. (1993). An examination of the relationship between older workers’ perceptions of age discrimination and employee psychological states. Journal of Management Issues, 5, 109-120.
Hayes, A. F. (2013). Introduction to mediation, moderation, and conditional process analysis: A regression-based approach. New York, NY: The Guilford Press.
Hayes, T. L., & Macan, T. H. (1997). Comparison of the factors influencing interviewer hiring decisions for applicants with and those without disabilities. Journal of Business and Psychology, 11, 357-371.
Hellriegel, D., & Slocum, J. W., Jr. (1974). Organizational climate: Measures, research, and contingencies. Academy of Management Journal, 17, 255-280.
Hershcovis, M. S. (2011). Incivility, social undermining, bullying…oh my! A call to reconcile constructs within workplace aggression research. Journal of Organizational Behavior, 32, 499-519.
Hershcovis, M. S., & Barling, J. (2007). Towards A relational model of workplace aggression. In J. Langan-Fox, C. L. Cooper, & R. Klimoski (Eds.), Dysfunctional workplace: Management challenges and symptoms (pp. 268-284). Cheltenham, UK: Edward Elgar Publishing Ltd.
Hershcovis, M. S., Turner, N., Barling, J., Arnold, K. A., Duprè, K. E., Inness, M., LeBlanc, M. M., Sivanathan, N. (2007). Predicting workplace aggression: A meta-analysis. Journal of Applied Psychology, 92, 228-238.
Hicks-Clarke, D., & Iles, P. (2000). Climate for diversity and its effects on career and organizational attitudes and perceptions. Personnel Review, 29, 324-345.
Hilton, J. L., & von Hippel, W. (1996). Stereotypes. Annual Review of Psychology, 47, 237-271.
Hoffman, B. J., & Woehr, D. J. (2006). A quantitative review of the relationship between person-organization fit and behavioral outcomes. Journal of Vocational Behavior, 68, 389-399.
Holland, J. (1985). Making vocational choices: A theory of vocational personalities and work environments (2nd ed.). Englewood Cliffs, NJ: Prentice-Hall.
Hollinger, R. C. (1986). Acts against the workplace: Social bonding and employee deviance. Deviant Behavior, 7, 53-75.
Hu, L. T., & Bentler, P. M. (1995). Evaluating model fit. In R. H. Hoyle (Ed.), Structural equation modeling: Concepts, issues, and applications (pp. 76-99). Thousand Oaks, CA: Sage.
159
Hu, L. T., & Bentler, P. M. (1999). Cutoff criteria for fit indexes in covariance structure analysis: Conventional criteria versus new alternatives. Structural Equation Modeling, 6, 1-55.
Hulin, C. L., Fitzgerald, L. F., & Drasgow, F. (1996). Organizational influences on sexual harassment. In M. Stockdale (Ed.), Sexual harassment in the workplace: Perspectives, frontiers, and response strategies (Vol. 5, pp. 127-150). Thousand Oaks, CA: Sage
Ilgen, D. R. (1999). Teams embedded in organizations. American Psychologist, 54, 129-139.
Ilgen, D. R., Barnes-Farrell, J. L., & McKellin, D. B. (1993). Performance appraisal process research in the 1980’s: What has it contributed to appraisals in use? Organizational Behavior and Human Decision Processes, 54, 321-368.
Ilgen, D. R., Hollenbeck, J., Johnson, M., & Jundt, D. (2005). Teams in organizations: From input-process-output models to IMOI models. Annual Review of Psychology, 56, 517-543.
Insko, C. A., Schopler, J., & Sedikides, C. (1998). Personal control, entitativity, and evolution. In C. Sedikides, J. Schopler, & C. A. Insko (Eds.), Intergroup cognition and intergroup behavior (pp. 75-108). Mahwah, NJ: Erlbaum.
Insko, C. A., Schopler, J., Hoyle, R. H., Dardis, G. J., & Graetz, K. A. (1990). Individual-group discontinuity as a function of fear and greed. Journal of Personality and Social Psychology, 58, 68-79.
Islam, M. R., & Hewstone, M. (1993). Dimensions of contact as predictors of intergroup anxiety, perceived out-group variability, and out-group attitude: An integrative model. Personality and Social Psychology Bulletin, 19, 700-710.
Jablin, F. M. (1979). Superior-subordinate communication: The state of the art. Psychological Bulletin, 86, 1201-1222.
Jaccard, J., & Wan, C. K. (1996). LISREL approaches to interaction effects in multiple regression. Newbury Park, CA: Sage.
Jackson, D. L., Gillaspy Jr., J. A., & Purc-Stephenson, R. (2009). Reporting practices in confirmatory factor analysis: An overview and some recommendations. Psychological Methods, 14, 6-23.
Jackson, S. E., Brett, J. F., Sessa, V. I., Cooper, D. M., Julin, J. A., & Peyronnin, K. (1991). Some differences make a difference: Individual dissimilarity and group
160
heterogeneity as correlates of recruitment, promotions, and turnover. Journal of Applied Psychology, 76, 675-689.
Jackson, S. E., May, K. E., & Whitney, K. (1995). Understanding the dynamics of diversity in decision making teams. In R. Guzzo & E. Salas (Eds.), Team effectiveness and decision making in organizations (pp. 204-261). San Francisco, CA: Jossey-Bass.
James, L. R. (1982). Aggregation bias in estimates of perceptual agreement. Journal of Applied Psychology, 67, 219-229.
James, L. R., & Jones, A. P. (1974). Organizational climate: A review of theory and research. Psychological Bulletin, 81, 1096-1112.
James, L. R., & Tetrick, L. E. (1986). Confirmatory analytic tests of three causal models relating job perceptions to job satisfaction. Journal of Applied Psychology, 71, 77-82.
James, L. R., Demaree, R. G., & Wolf, G. (1984). Estimating within-group interrater reliability with and without response bias. Journal of Applied Psychology, 69, 85-98.
James, L. R., Demaree, R. G., & Wolf, G. (1993). rwg: An assessment of within-group interrater agreement. Journal of Applied Psychology, 78, 306-309.
Janz, B. D., Colquitt, J. A., & Noe, R. A. (1997). Knowledge worker team effectiveness: The role of autonomy, interdependence, team development, and contextual support variables. Personnel Psychology, 50, 877-904.
Jehn, K. A., & Mannix, E. A. (2001). The dynamic nature of conflict: A longitudinal study of intragroup conflict and group performance. Academy of Management Journal, 44, 238-252.
Jex, S. M., & Britt, T. W., (2008). Organizational psychology: A scientist-practitioner approach (2nd ed.). Hoboken, NJ: John Wiley & Sons.
Johnson, J. W. (1996). Linking employee perceptions of service climate to customer satisfaction. Personnel Psychology, 49, 831-851.
Jones, G. R., & George, J. M. (1998). The experience and evolution of trust: Implications for cooperation and teamwork. Academy of Management Review, 23, 531-546.
Jones, R. G., & Lindley, W. D. (1998). Issues in the transition to teams. Journal of Business and Psychology, 13, 31-40.
161
Judge, T. A., & Ferris, G. R. (1992). The elusive criterion of fit in human resources staffing decisions. Human Resource Planning, 15 (4), 47-67.
Kalliath, T. J., Bluedorn, A. C., & Strube, M. J. (1999). A test of value congruence effects. Journal of Organizational Behavior, 20, 1175-1198.
Kanter, R. M. (1972). Commitment and community: Communes and utopias in sociological perspective. Cambridge, MA: Harvard University Press.
Katz, I. (1981). Stigma: A social psychological analysis. Hillsdale, NJ: Erlbaum.
Keashly, L. (1998). Emotional abuse in the workplace: Conceptual and empirical issues. Journal of Emotional Abuse, 1, 85-117.
Keashly, L. (2001). Interpersonal and systemic aspects of emotional abuse at work: The target’s perspective. Violence & Victims, 16, 233-268.
Keashly, L., & Harvey, S. (2005). Emotional abuse in the workplace. In S. Fox & P. E. Spector (Eds.), Counterproductive work behavior: Investigations of actors and targets (pp. 201-235). Washington, DC: American Psychological Association.
Keashly, L., Trott, V., & MacLean, L. M. (1994). Abusive behavior in the workplace: A preliminary investigation. Violence and Victims, 9, 341-357.
Kemelgor, B. H. (1982). Job satisfaction as mediated by the value congruity of supervisors and their subordinates. Journal of Occupational Behavior, 3, 147-160.
Kenny, D. A. (2014, October 6). Measuring Model Fit. Retrieved from http://davidakenny.net/cm/fit.htm
Kiesler, S., & Cummings, J. N. (2002). What do we know about proximity and distance in work groups? In P. J. Hinds & S. Kiesler, (Eds.) Distributed work: New research on working across distance using technology (pp. 57-80). Cambridge, MA: MIT Press.
Kilbourne, B., England, P., Farkas, G., Beron, K., & Weir, D. (1994). Returns to skill, compensating differentials, and gender bias: Effects of occupational characteristics on the wages of White women and men. American Journal of Sociology, 100, 689-719.
Kinder, D. R., & Sears, D. O. (1981). Prejudice and politics: Symbolic racism versus racial threats to the good life. Journal of Personality and Social Psychology, 40, 414-431.
162
King, E. B., Dunleavy, D. G., Dunleavy, E. M., Jaffer, S., Botsford, Morgan, W., Elder, K., & Graebner, R. (2011). Discrimination in the 21st century: Are science and the law aligned? Psychology, Public Policy, and Law, 17, 54-75.
Kirkman, B. L., Jones, R. G., & Shapiro, D. L. (2000). Why do employees resist teams? Examining the “resistance barrier” to work team effectiveness. The International Journal of Conflict Management, 11, 74-92.
Kirkman, B. L., Shapiro, D. L., Novelli, L., Jr., & Brett, J. M. (1996). Employee concerns regarding self-managing work teams: A multidimensional justice perspective. Social Justice Research, 9, 47-67.
Klein, K. J., & Sorra, J. S. (1996). The challenge of innovation implementation. Academy of Management Review, 21, 1055-1080.
Klein, K. J., Bliese, P. D., Kozlowski, S. W. J., Dansereau, F., Gavin, M. B., Griffin, M. A., … Bligh, M. C. (2000). Multilevel analytical techniques: Commonalities, differences, and continuing questions. In K. J. Klein & S. W. J. Kozlowski (Eds.), Multilevel theory, research, and methods in organizations: Foundations, extensions, and new directions (pp. 512-553). San Francisco, CA: Jossey-Bass.
Klein, K. J., Conn, A. B., Smith, D. B., & Sorra, J. S. (2001). Is everyone on agreement? Exploring the determinants of within-group agreement in survey responses. Journal of Applied Psychology, 86, 3-16.
Klein, K. J., Dansereau, F., & Hall, R. J. (1994). Levels issues in theory development, data collection, and analysis. Academy of Management Review, 19, 195-229.
Kline, R. B. (2011). Principles and practice of structural equation modeling (3rd ed.). New York, NY: Guilford Press.
Kluckhohn, C. (1951). Values and value orientations in the theory of action. In T. Parsons & E. Shils (Eds.), Toward a general theory of action (pp. 388-433). Cambridge, MA: Harvard University Press.
Knouse, S. B., & Dansby, M. R. (1999). Percentage of work-group diversity and work-group effectiveness. The Journal of Psychology, 133, 486-494.
Kogan, N. (1961). Attitudes toward old people: the development of a scale and examination of correlates. Journal of Abnormal and Social Psychology, 62, 44-54.
Kohlberg, L., & Ryncarz, R. A. (1990). Beyond justice reasoning: Moral development and consideration of a seventh stage. In C. N. Alexander & E. J. Langer (Eds.), Higher stages of human development (pp. 191-207). New York, NY: Oxford University Press.
163
Kossek, E. E., & Zonia, S. C. (1993). Assessing diversity climate: A field study of reactions to employer efforts to promote diversity. Journal of Organizational Behavior, 14, 61-81.
Kozlowski, S. W. J., & Bell, B. S. (2003). Work group and teams in organizations. In W. C. Borman, D. R. Ilgen, & R. J. Klimoski (Eds.), Handbook of psychology: Industrial and organizational psychology (Vol. 12, pp. 333-375). London, UK: Wiley.
Kozlowski, S. W. J., & Hattrup, K. (1992). A disagreement about within-group agreement: Disentangling issues of consistency versus consensus. Journal of Applied Psychology, 77, 161-167.
Kozlowski, S. W. J., & Ilgen, D. (2006). Enhancing the effectiveness of work groups and teams. Psychological Science in the Public Interest, 7, 77-124.
Kozlowski, S. W. J., & Klein, K. J. (2000). A multilevel approach to theory and research in organizations: Contextual, temporal, and emergent processes. In K. J. Klein & S. W. J. Kozlowski (Eds.), Multilevel theory, research and methods in organizations: Foundations, extensions, and new directions (pp. 3-90). San Francisco, CA: Jossey-Bass.
Kozlowski, S. W. J., Gully, S. M., Nason, E. R., & Smith, E. M. (1999). Developing adaptive teams: A theory of compilation and performance across levels and time. In D. R. Ilgen & E. D. Pulakos (Eds.), The changing nature of work and performance: Implications for staffing, personnel actions, and development (pp. 240-292). San Francisco, CA: Jossey-Bass.
Kraut, R., Fussell, S., Brennan, S., & Siegel, J. (2002). Understanding effects of proximity on collaboration: Implications for technologies to support remote collaborative work. In P. Hinds & S. Kiesler (Eds.), Distributed work: New research on working across distance using technology (pp. 137-162). Cambridge, MA: MIT Press.
Kristof, A. L. (1996). Person-organization fit: An integrative review of its conceptualizations, measurement, and implications. Personnel Psychology, 49, 1-49.
Kristof-Brown, A. L., & Guay, R. P. (2010). Person-environment fit. In S. Zedeck (Ed.), Handbook of industrial and organizational psychology (Vol. 3, pp. 3-50). Washington, DC: American Psychological Association.
Kristof-Brown, A. L., & Stevens, C. K. (2001). Goal congruence in project teams: Does the fit between members’ personal mastery and performance goals matter? Journal of Applied Psychology, 86, 1083-1095.
164
Kristof-Brown, A. L., Jansen, K. J., & Colbert, A. E. (2002). A policy-capturing study of the simultaneous effects of fit with jobs, groups, and organizations. Journal of Applied Psychology, 87, 985-993.
Kristof-Brown, A. L., Zimmerman, R. D., & Johnson, E. C. (2005). Consequences of individual’s fit at work: A meta-analysis of person-job, person-organization, person-group, and person-supervisor fit. Personnel Psychology, 58, 281-342.
Kroeger, N. W. (1995). Person-environment fit in the final jobs of retirees. The Journal of Social Psychology, 135, 545-551.
Landis, D., Dansby, M. R., & Faley, R. H. (1993). The Military Equal Opportunity Climate Survey: An example of surveying organizations. In P. Rosenfeld, J. E. Edwards, & M. D. Thomas (Eds.), Improving organizational surveys: New directions, methods, and applications (pp. 210-239). Newbury Park, CA: Sage.
Landy, F. J. (2008). Stereotypes, bias, and personnel decisions: Strange and stranger. Industrial and Organizational Psychology: Perspective on Science and Practice, 1, 379-392.
Lau, D., Liu, J., & Fu, P. (2007). Feeling trusted by business leaders in China: Antecedents and the mediating role of value congruence. Asia Pacific Journal of Management, 24, 321-340.
LeBreton, J. M., & Senter, J. L. (2008). Answers to twenty questions about interrater reliability and interrater agreement. Organizational Research Methods, 11, 815-852.
LeBreton, J. M., Burgess, J. R. D., Kaiser, R. B., Atchley, E. K. P., & James, L. R. (2003). The restriction of variance hypothesis and interrater reliability and agreement: Are ratings from multiple sources really dissimilar? Organizational Research Methods, 6, 80-128.
Levin, S., & Sidanius, J. (1999). Social dominance and social identity in the United States and Israel: Ingroup favoritism or outgroup derogation? Political Psychology, 20, 99-126.
Lewin, K. (1951). Field theory in social science: Selected theoretical papers. Westport, CT: Greenwood Press.
Leymann, H. (1990). Mobbing and psychological terror at workplaces. Violence and Victims, 5, 119-126.
Lincoln, J. R., & Miller, J. (1979). Work and friendship ties in organizations: A comparative analysis of relational networks. Administrative Science Quarterly, 24, 181-199.
165
Lind, E. A. (2001). Fairness heuristic theory: Justice judgments as pivotal cognitions in organizational relations. In J. Greenberg & R. Cropanzano (Eds.), Advances in organization justice, (pp. 56-88). Stanford, CA: Stanford University Press.
Lind, E. A., & Tyler, T. R. (1988). The social psychology of procedural justice. New York, NY: Plenum.
Lind, E. A., Kray, L., & Thompson, L. (1998). The social construction of injustice:
Fairness judgments in response to own and others’ unfair treatment by authorities. Organizational Behavior and Human Decision Processes, 75, 1-22.
Lott, A. J., & Lott, B. E. (1965). Group cohesiveness as interpersonal attraction: A review
of relationships with antecedent and consequent variables. Psychological Bulletin, 64, 259-309.
MacCallum, R. C., Browne, M. W., & Sugawara, H. M. (1996). Power analysis and determination of sample size for covariance structure modeling. Psychological Methods, 1, 130-149.
Mackie, D. M., & Smith, E. R. (1998a). Intergroup cognition and intergroup behavior: Crossing the boundaries. In C. Sedikides, J. Schopler, & C. A. Insko (Eds.), Intergroup cognition and intergroup behavior (pp. 423-450). Mahwah, NJ: Erlbaum.
Mackie, D. M., & Smith, E. R. (1998b). Intergroup relations: Insights from a theoretically integrative approach. Psychological Review, 105, 499-529.
MacKinnon, D. P., Lockwood, C. M., Hoffman, J. M., West, S. G., & Sheets, V. (2002). A comparison of methods to test mediation and other intervening variable effects. Psychological Methods, 7, 83-104.
Malle, B. F. (1999). How people explain behavior: A new theoretical framework. Personality and Social Psychology Review, 3, 23-48.
Malle, B. F., & Knobe, J. (1997). Which behaviors do people explain? A basic actor-
observer asymmetry. Journal of Personality and Social Psychology, 72, 288-304. Marks, M. A., Mathieu, J. E., & Zaccaro, S. J. (2001). A temporally based framework
and taxonomy of team processes. Academy of Management Review, 26, 356-376.
Martel, R., Lane, D. M., & Willis, C. (1996). Male-female differences: A computer simulation. American Psychologist, 51, 157-158.
166
Martin, K. D., & Cullen, J. B. (2006). Continuities and extensions of ethical climate theory: A meta-analytic review. Journal of Business Ethics, 69, 175-194.
Martinko, M. J., Gundlach, M. J., & Douglas, S. C. (2002). Toward an integrative theory of counterproductive work behavior: A causal reasoning perspective. International Journal of Selection and Assessment, 10, 36-50.
Maslach, C., Schaufeli, W. B., & Leiter, M. P. (2001). Job burnout. Annual Review Psychology, 49, 24-33.
Mathieu, J. E., & Zajac, D. M. (1990). A review and meta-analysis of the antecedents, correlates, and consequences of organizational commitment. Psychological Bulletin, 108, 171-194.
Mathieu, J. E., Heffner, T. S., Goodwin, G. F., Salas, E., & Cannon-Bowers, J. A. (2000). The influence of shared mental models on team process and performance. Journal of Applied Psychology, 85, 273-283.
Mayer, R. C., Davis, J. H., & Schoorman, F. D. (1995). An integrative model of organizational trust. Academy of Management Review, 20,709-734.
Mays, V. M., & Cochran, S. D. (2001). Mental health correlates of perceived discrimination among lesbian, gay, and bisexual adults in the United States. American Journal of Public Health, 91, 1869-1876.
McAllister, D. J. (1995). Affect- and cognition-based trust as foundations for interpersonal cooperation in organizations. Academy of Management Journal, 38, 24-59.
McConahay, J. B. (1983). Modern racism and modern discrimination: The effects of race, racial attitudes, and context on simulated hiring decisions. Personality and Social Psychology Bulletin, 9, 551-558.
McConahay, J. B. (1986). Modem racism, ambivalence, and the Modem Racism Scale. In J. F. Dovidio & S. L. Gaertner (Eds.), Prejudice, discrimination, and racism (pp. 99-125). Orlando, FL: Academic Press.
McConahay, J. B., Hardee, B. B., & Batts, V. (1981). Has racism declined in America? It depends on who is asking and what is asked. The Journal of Conflict Resolution, 25, 563-579.
McDonnell Douglas Corp. v. Green, 411 U.S. 792 (1973). McGrath, J. E. (1964). Social psychology: A brief introduction. New York, NY: Holt,
Rinehart, & Winston.
167
McGraw, K. O., & Wong, S. P. (1996). Forming inferences about some intraclass correlation coefficients. Psychological Methods, 1, 30-46.
McIntyre, R. M., Bartle, S. A., Landis, D., & Dansby, M. R. (2002). The effects of equal
opportunity fairness attitudes on job satisfaction, organizational commitment, and perceived work group efficacy. Military Psychology, 14, 299-319.
McKay, P. F., Avery, D. R., & Morris, M. A. (2009). A tale of two climates: Diversity climate from subordinates' and managers' perspectives and their role in store unit sales performance. Personnel Psychology, 62, 767-791.
McKay, P. F., Avery, D. R., Liao, H., & Morris, M. A. (2011). Does diversity climate lead to customer satisfaction? It depends on the service climate and business unit demography. Organization Science, 22, 788-803.
Meertens, R. W., & Pettigrew, T. F. (1997). Is subtle prejudice really prejudice? Public Opinion Quarterly, 61, 54-71.
Meglino, B. M., & Ravlin, E. C. (1998). Individual values in organizations: Concepts, controversies, and research. Journal of Management, 24, 351-389.
Meglino, B. M., Ravlin, E. C., & Adkins, C. L. (1989). A work values approach to corporate culture: A field test of the value congruence process and its relationship to individual outcomes. Journal of Applied Psychology, 74, 424-432.
Meglino, B. M., Ravlin, E. C., & Adkins, C. L. (1991). Value congruence and satisfaction with a leader: An examination of the role of interaction. Human Relations, 44, 481-495.
Meyer, G. W. (1994). Social information processing and social networks: A test of social influence mechanisms. Human Relations, 47, 1013-1047.
Meyer, J. P., & Allen, N. J. (1984). Testing the “side bet theory” of organizational commitment: Some methodological considerations. Journal of Applied Psychology, 69, 372-378.
Meyer, J. P., & Allen, N. J. (1987). A longitudinal analysis of the early development and consequences of organizational commitment. Canadian Journal of Behavioral Science, 19, 199-215.
Meyer, J. P., & Allen, N. J. (1988). Links between work experiences and organizational commitment during the first year of employment: A longitudinal analysis. Journal of Occupational Psychology, 61, 195-209.
Meyer, J. P., & Allen, N. J. (1991). A three-component conceptualization of organizational commitment. Human Resource Management Review, 1, 61-98.
168
Meyer, J. P., & Allen, N. J. (1997). Commitment in the workplace: Theory, research, and application. Thousand Oaks, CA: Sage.
Meyer, J. P., Stanley, D. J., Herscovitch, L., & Topolnytsky, L. (2002). Affective, continuance, and normative commitment to the organization: A meta-analysis of antecedents, correlates, and consequences. Journal of Vocational Behavior, 61, 20-52.
Miller, S. M. (1981). Predictability and human stress: Toward a clarification of evidence and theory. In L. Berkowitz (Ed.), Advances in experimental social psychology (Vol. 14, pp. 203-225). New York, NY: Academic Press.
Milliken, F. J., & Martins, L. L. (1996). Searching for common threads: Understanding the multiple effects of diversity in organizational groups. Academy of Management Journal, 25, 402-433.
Milner, D. (1981). Racial prejudice. In J. Turner & H. Giles (Eds.), Intergroup behavior (pp.102-143). Oxford, UK: Blackwell.
Mintzberg, H. (1979). The structuring of organizations: A synthesis of the research. Englewood Cliffs, NJ: Prentice-Hall.
Mischel, W. (1977). The interaction of person and situation. In D. Magnusson & N. S. Endler (Eds.), Personality at the crossroads: Current issues in interactional psychology (pp. 333-352). Hillsdale, NJ: Erlbaum.
Moliner, C., Martínez-Tur, V., Peiró, J. M., Ramos J., & Cropanzano, R. (2005). Relationships between organizational justice and burnout at the work-unit level. International Journal of Stress Management, 12, 99-116.
Monge, P. R., & Kirste, K. K. (1980). Measuring proximity in human organization. Social Psychology Quarterly, 43, 110-115.
Monson, T. C., Hesley, J. W., & Chernick, L. (1982) Specifying when personality traits can and cannot predict behavior: An alternative to abandoning the attempt to predict single-act criteria. Journal of Personality and Social Psychology, 43, 385-399.
Mor Barak, M. E., Cherin, D. A., & Berkman, S. (1998). Organizational and personal dimensions of diversity climate. Journal of Applied Behavioral Science, 34, 82-104.
Morgan, B. B., Glickman, A. S., Woodard, E. A., Blaiwes, A. S., & Salas, E. (1986). Measurement of team behaviors in a Navy environment (Technical Report No. NTSC TR-86-014). Orlando, FL: Naval Training Systems Center.
169
Morgan, B. B., Salas, E., & Glickman, A. S. (1993). An analysis of team evolution and maturation. Journal of General Psychology, 120, 277-291.
Mowday, R. T., & McDade, T. W. (1980). The development of job attitudes, job perceptions, and withdrawal propensities during the early employment period. Paper presented at the annual meeting of the Academy of Management, Detroit, MI.
Mowday, R. T., Porter, L. W., & Steers, R. M. (1982). Employee-organization linkages: The psychology of commitment, absenteeism, and turnover. San Diego, CA: Academic Press.
Muchinsky, P. M., & Monahan, C. J. (1987). What is person-environment congruence? Supplementary versus complementary models of fit. Journal of Vocational Behavior, 31, 268-277.
Mullen, B., & Cooper, C. L. (1994). The relation between group cohesiveness and performance: An integration. Psychological Bulletin, 115, 210-227.
Murphy, K. R., & Myors, B. (1998). Statistical power analysis: A simple and general model for traditional and modern hypothesis tests. Mahwah, NJ: Erlbaum.
Murphy, K., & Cleveland, J. (1995). Understanding performance appraisal: Social, organizational and goal-oriented perspectives. Newbury Park, CA: Sage.
Murray, P., & Syed, J. (2005). Critical issues in managing age diversity in Australia. Asia Pacific Journal of Human Resources, 43, 210-224.
Nadler, J. T., & Stockdale, M. S. (2012). Workplace gender bias: Not between just strangers. North American Journal of Psychology, 14, 281-292.
Nadler, J. T., Bartels, L. K., Sliter, K. A., Stockdale, M. S., & Lowery, M. (2013). Research on the discrimination of marginalized employees: Fishing in other ponds. Industrial and Organizational Psychology: Perspective on Science and Practice, 6, 66-70.
Nardi, B., & Whittaker, S. (2002). The place of face-to-face communication in distributed work. In P. J. Hinds & S. Kiesler (Eds.), Distributed work: New research on working across distance using technology (pp. 83-110). Cambridge, MA: MIT Press.
Nelson, L. J., & Miller, D. T. (1995). The distinctiveness effect in social categorization: You are what makes you unusual. Psychological Science, 6, 246-249.
170
Neuman, J. H., & Baron, R. A. (1998). Workplace violence and workplace aggression: Evidence concerning specific forms, potential causes, and preferred targets. Journal of Management, 24, 391-419.
Neumark, D., & McLennan, M. (1995). Sex discrimination and women’s labor market outcomes. Journal of Human Resources, 30, 713-740.
Newcomb, T. M. (1956). The prediction of interpersonal attraction. American Psychologist, 11, 575-586.
O’Reilly, C. A. (1971). Personality-job fit: Implications for individual attitudes and performance. Organizational Behavior and Human Performance, 18, 36-46.
O’Reilly, C. A., Chatman, J., & Caldwell, D. F. (1991). People and organizational culture: A profile comparison approach to assessing person-organization fit. Academy of Management Journal, 34, 487-516.
Oliver, L. W., Harman, J., Hoover, E., Hayes, S. M., & Pandhi, N. A. (1999). A quantitative integration of the military cohesion literature. Military Psychology, 11, 57-83.
Olson, G. M., & Olson, J. S. (2000). Distance matters. Human Computer Interaction, 15, 139-179.
Olson, J. S., Teasley, S. D., Covi, L. M., & Olson, G. M. (2002). The (currently) unique advantages of collocated work. In P. Hinds & S. Keisler (Eds.), Distributed work: New research on working across distance using technology (pp. 113-135). Cambridge, MA: MIT Press.
Olweus, D. (1991). Bully/victim problems among schoolchildren: Basic facts and effects
of a school based intervention program. In K. Rubin & D. Pepler (Eds.), The development and treatment of children aggression (pp. 411-448). Hillsdale, NJ: Erlbaum
Olweus, D. (1994). Annotation: Bullying at school: Basic facts and effects of a school based intervention program. Journal of Child Psychology and Psychiatry, 35, 1171-1190.
O'Reilly, C. A., & Roberts, K. H. (1976). Relationships among components of credibility and communication in work units. Journal of Applied Psychology, 61, 99-102.
Ostroff, C., & Judge, T.A. (Eds.) (2007). Perspectives on Organizational Fit. Mahwah, NJ: Lawrence Erlbaum.
171
Ostroff, C. (1992). The relationship between satisfaction, attitudes, and performance: An organizational level analysis. Journal of Applied Psychology, 77, 963-974.
Ostroff, C., & Schmitt, N. (1993). Configurations of organizational effectiveness and
efficiency. Academy of Management Journal, 36, 1345-1361.
Ostroff, C., Shin, Y., & Feinberg, B. (2002). Skill acquisition and person-environment fit. In D. C. Feldman (Ed.), Work careers: A developmental approach (pp. 63-90). San Francisco, CA: Jossey-Bass.
Otten, S., & Moskowitz, G. B. (2000). Evidence for implicit evaluative in-group bias: Affect- biased spontaneous trait inference in a Minimal Group Paradigm. Journal of Experimental Social Psychology, 36, 77-89.
Otten, S., & Mummendey, A. (2000). Valence-dependent probability of ingroup
favoritism between minimal groups: An integrative view on the positive-negative asymmetry in social discrimination. In D. Capozza & R. Brown (Eds.), Social identity processes (pp. 33-48). London, UK: Sage.
Padgett, V. R., & Wolosin, R. J. (1980). Cognitive similarity in dyadic communication.
Journal of Personality and Social Psychology, 39, 654-659.
Paolini, S., Hewstone, M., Cairns, E., & Voci, A. (2004). Effects of direct and indirect cross-group friendships on judgments of Catholics and Protestants in Northern Ireland: The mediating role of an anxiety reduction mechanism. Personality and Social Psychology Bulletin, 30, 770-786.
Parsons, F. (1909). Choosing a vocation. Boston, MA: Houghton-Mifflin.
Pearce, J. (1981). Bringing some clarity to role ambiguity research. Academy of Management Review, 6, 665-674.
Pearson, A. R., Dovidio, J. F., & Gaertner, S. L. (2009). The nature of contemporary prejudice: Insights from aversive racism. Social and Personality Psychology Compass, 3, 314-338.
Perdue, C., Dovidio, J., Gurtman, M., & Tyler, R. (1990). “Us” and “Them”: Social categorization and the process of intergroup bias. Journal of Personality and Social Psychology, 59, 475-486.
Pettigrew, T. F. (1998). Intergroup contact theory. Annual Review of Psychology, 49, 65-85.
172
Pettigrew, T. F., & Meertens, R. W. (1995). Subtle and blatant prejudice in Western Europe. European Journal of Social Psychology, 25, 57-75.
Pettigrew, T. F., & Tropp, L. R. (2000). Does intergroup contact reduce prejudice? Recent meta-analytic findings. In S. Oskamp (Ed.), Reducing prejudice and discrimination: Social psychological perspectives (pp. 93-114). Mahwah, NJ: Erlbaum.
Pettigrew, T. F., & Tropp, L. R. (2006). A meta-analytic test of intergroup contact theory. Journal of Personality and Social Psychology, 90, 751-783.
Petty R. E., Wegener, D. T., & White, P. H. (1998). Flexible correction processes in social judgment: implications for persuasion. Social Cognition, 16, 93-113.
Petty, R. E., & Wegner, D. T. (1998). Attitude change: Multiple roles for persuasion variables. In D. T. Gilbert, S. T. Fiske, & G. Lindzey (Eds.), Handbook of social psychology (Vol. 1, pp. 323- 390). New York, NY: McGraw-Hill.
Pfeffer, J. (1983). Organizational demography. In L. L. Cummings & B. M. Staw (Eds.), Research in organizational behavior (Vol. 5, pp. 299-357). Greenwich, CT: JAI Press.
Phillips, J. M. (2002). Antecedents and consequences of procedural justice perceptions in hierarchical decision-making teams. Small Group Research, 33, 32-64.
Phillips, J. M., Douthitt, E. A., & Hyland, M. M. (2001). The role of justice in team member satisfaction with the leader and attachment to the team. Journal of Applied Psychology, 86, 316-325.
Piasentin, K. A., & Chapman, D. S. (2006). Subjective person-organization fit: Bridging the gap between conceptualization and measurement. Journal of Vocational Behavior, 69, 202-221.
Podsakoff, P. M., MacKenzie, S. B., Paine, J. B., & Bachrach, D. G. (2000). Organizational citizenship behaviors: A critical review of the theoretical and empirical literature and suggestions for future research. Journal of Management, 26, 513-563.
Porter, L. W., Steers, R. M., Mowday, R. T., & Boulian, P. V. (1974). Organizational commitment, job satisfaction, and turnover among psychiatric technicians. Journal of Applied Psychology, 59, 603-609.
Posner, B. Z. (1992). Person-organization values congruence: No support for individual differences as a moderating influence. Human Relations, 45, 351-361.
173
Posner, B. Z., Kouzes, J. M., & Schmidt, W. H. (1985). Shared values make a difference: An empirical test of corporate culture. Human Resource Management, 24, 293-309.
Preacher, K. J., & Hayes, A. F. (2004). SPSS and SAS procedures for estimating indirect effects in simple mediation models. Behavior Research Methods, Instruments, and Computers, 36, 717-731.
Preacher, K. J., & Hayes, A. F. (2008a). Contemporary approaches to assessing mediation in communication research. In A. F. Hayes, M. D. Slater, & L. B. Snyder (Eds.), The sourcebook of advanced data analysis methods for communication research (pp. 13-54). Thousand Oaks, CA: Sage.
Preacher, K. J., & Hayes, A. F. (2008b). Asymptotic and resampling strategies for assessing and comparing indirect effects in multiple mediator models. Behavior Research Methods, 40, 879-891.
Raver, J. L., & Barling, J. (2008). Workplace aggression and conflict: Constructs, commonalities, and challenges for future inquiry. In C. K. W. De Dreu, & M. J. Gelfand (Eds.), The psychology of conflict and conflict management in organizations (pp. 211-244). Mahawah, NJ: Erlbaum.
Rayner, C. (1997). The incidence of workplace bullying. Journal of Community and Applied Social Psychology, 7, 173-256.
Reskin, B. F., & Padavic, I. (1994). Women and men at work. Thousand Oaks, CA: Pine Forge Press.
Riketta, M. (2005). Organizational identification: A meta-analysis. Journal of Vocational Behavior, 66, 358-384.
Riordan, C. M., Schaffer, B. S., & Stewart, M. M. (2005). Relational demography in groups: Through the lens of discrimination. In R. L. Dipboye & A. Colella (Eds.), Discrimination at work: The psychological and organizational bases (pp. 37-61). Mahwah, NJ: Erlbaum.
Riordan, C. M., & Shore, L. M. (1997). Demographic diversity and employee attitudes: An empirical examination of relational demography within work units. Journal of Applied Psychology, 82, 342-358.
Roarck, A. E., & Sharah, H. S. (1989). Factors related to group cohesiveness. Small Group Behavior, 20, 62-69.
Roberts, K. H., & O’Reilly, C. A., III. (1979). Some correlates of communication roles in organizations. Academy of Management Journal, 22, 42-57.
174
Robinson, G., & Dechant, K. (1997). Building a business case for diversity. Academy of Management Executive, 11, 21-31.
Robinson, S. L., & Bennett, R. J. (1995). A typology of deviant workplace behaviors: A multi-dimensional scaling study. Academy of Management Journal, 38, 555-572.
Robinson, S. L., & O’Leary-Kelly, A. M. (1998). Monkey see, monkey do: The influence of work groups on the antisocial behavior of employees. Academy of Management Journal, 41, 658-672.
Robinson, S. L., & Rousseau, D. M. (1994). Violating the psychological contact: not the exception but the norm. Journal of Organizational Behavior, 15, 245-259.
Rosenfeld, P., Thomas, M. D., Edwards, J. E., Thomas, P. J., & Thomas, E. D. (1991). Navy research into race, ethnicity, and gender issues: A historical review. International Journal of' Intercultural Relations, 15, 407-426.
Rousseau, D. M. (1985). Issues of level in organizational research: Multi-level and cross-level perspectives. In L. L. Cummings & B. Staw (Eds.), Research in organizational behavior (Vol. 7, pp. 1-37). Greenwich, CT: JAI Press.
Rozin, P., Lowery, L., Imada, S., & Haidt, J. (1999). The CAD triad hypothesis: A mapping between three moral emotions (contempt, anger, disgust) and three moral codes (community, autonomy, divinity). Journal of Personality and Social Psychology, 76, 574-586.
Ruggs, E. N., Hebl, M. R., Law, C., Cox, C. B., Roehling, M. V., Wiener, R. L., & Barron, L. (2013). Gone fishing: I-O psychologists’ missed opportunities to understand marginalized employees’ experiences with discrimination. Industrial and Organizational Psychology: Perspective on Science and Practice, 6 (1), 39-60.
Rynes, S. L., & Gerhart, B. (1990). Interviewer assessments of applicant "fit": An exploratory investigation. Personnel Psychology, 43, 13-35.
Rynes, S. L., Bretz, R. D., & Gerhart, B. (1991). The importance of recruitment in job choice: A different way of looking. Personnel Psychology, 44, 487-521.
Saavedra, R., Earley, P. C., & Van Dyne, L. (1993). Complex interdependence in task-performing groups. Journal of Applied Psychology, 78, 61-72.
Saks, A. M., & Ashforth, B. E. (1997). A longitudinal investigation of the relationships between job information sources, applicant perceptions of fit, and work outcomes. Personnel Psychology, 50, 395-426.
175
Salancik, G. (1977). Commitment and the control of organizational behavior and belief. In B. Staw & G. Salancik (Eds.), New directions in organizational behavior (pp.1-54). Chicago, IL: St. Clair Press.
Salancik, G. R., & Pfeffer, G. (1978). A social information processing approach to job attributes and task design. Administrative Science Quarterly, 23, 224-253.
Salas, E., Dickinson, T., Converse, S., & Tannenbaum, S. (1992). Toward an understanding of team performance and training. In R. Swezey & E. Salas (Eds.), Teams: Their training and performance (pp. 3-29). Westport, CT: Ablex Publishing.
Sanchez, J. I., & Brock, P. (1996). Outcomes of perceived discrimination among Hispanic employees: Is diversity management a luxury or a necessity? Academy of Management Journal, 39, 704-719.
Schall, M. S., (1983). A communication-rules approach to organizational culture. Administrative Science Quarterly, 28, 557-580.
Schaufeli, W. B., Salanova, M., González-Romá, V., & Bakker, A. B. (2002). The measurement of engagement and burnout: A confirmative analytic approach. Journal of Happiness Studies, 3, 71-92.
Schein, E. H. (1990). Organizational culture. American Psychologist, 45, 109-119.
Schein, E. H. (1991). What is Culture? In P. J. Frost, L. F. Moore, M. R. Louis, C. C. Lundberg, & J. Martin (Eds.), Reframing Organizational Culture (pp. 243-253). Newbury Park, CA: Sage.
Schein, E. H. (1992) Organizational culture and leadership (2nd ed.). San Francisco, CA: Jossey Bass.
Schmidt, F. L., & Hunter, J. E. (1989). Interrater reliability coefficients cannot be computed when only one stimulus is rated. Journal of Applied Psychology, 74, 368-370.
Schneider, B. (1987). The people make the place. Personnel Psychology, 40, 437-453.
Schneider, B. (2001). Fits about fit. Applied Psychology: An International Review, 50, 141-152.
Schneider, B. (Ed.). (1990). Organizational climate and culture. San Francisco: Jossey-Bass.
Schneider, B., & Bowen, D. (1985). Employee and customer perceptions of service in banks: Replication and extension. Journal of Applied Psychology, 70, 423-433.
176
Schneider, B., & Reichers, A. E. (1983). On the etiology of climates. Personnel Psychology, 36, 19-39.
Schneider, B., & Rentsch, J. (1988). Managing climates and cultures: A futures perspective. In J. Hage (Ed.), The futures of organizations. Lexington, MA: Lexington Books.
Schneider, B., Ehrhart, M. G., & Macey, W. H. (2011). Perspectives on organizational climate and culture. In S. Zedeck (Ed.), Handbook of industrial and organizational psychology (pp. 373-414). Washington, DC: American Psychological Association.
Schneider, B., Goldstein, H.W., & Smith, D.B. (1995). The ASA framework: An update. Personnel Psychology, 48, 747-779.
Schneider, B., Parkington, J. P., & Buxton, V. M. (1980). Employee and customer perceptions of service in banks. Administrative Science Quarterly, 25, 252-267.
Schriesheim, C. A., Donovan, J. A., Zhou, X., LeBreton, J. M., Whanger, J. C., & James, L. R. (2001, August). Use and misuse of the rwg coefficient of within-group agreement: Review and suggestions for future research. Presented at the annual meeting of the Academy of Management, Washington, DC.
Schulte, M., Ostroff, C., & Kinicki, A. J. (2006). Organizational climate systems and
psychological climate perceptions: A cross-level study of climate-satisfaction relationships. Journal of Occupational and Organizational Psychology, 79, 645-671.
Schumacker, R. E., & Lomax, R. G. (2004). A beginner's guide to structural equation modeling (2nd ed.). Mahwah, NJ: Erlbaum.
Schwartz, S. H. (1992). Universals in the content and structure of values: Theory and
empirical tests in 20 countries. In M. Zanna (Ed.), Advances in experimental social psychology (Vol. 25, pp. 1-65). New York, NY: Academic Press.
Sears, D. O. (1988). Symbolic racism. In P. Katz & D. Taylor (Eds.), Eliminating racism: Profiles in controversy (pp. 53-84). New York, NY: Plenum Press.
Sears, D. O., & Allen, H. M., Jr. (1984). The trajectory of local desegregation
controversies and Whites opposition to busing. In N. Miller & M. B. Brewer (Eds.), Groups in contact: The psychology of desegregation (pp. 123-157). Orlando, FL: Academic Press.
Sears, D. O., Henry, P. J., & Kosterman, R. (2000). Egalitarian values and contemporary racial politics. In D. O. Sears, J. Sidanius, & L. Bobo (Eds.), Racialized politics:
177
The debate about racism in America (pp. 75-117). Chicago, IL: University of Chicago Press.
Shapiro, J. R., King, E. B., & Quiñones, M. A. (2007). Expectations of obese trainees: How stigmatized trainee characteristics influence training effectiveness. Journal of Applied Psychology, 92, 239-249.
Shea, G. P., & Guzzo, R. A. (1987). Groups as human resources. In K. R. Rowland & G. R. Ferris (Eds.), Research in personnel and human resources management (Vol. 5, pp. 323-356). Greenwich, CT: JAI Press.
Sheldon, M. E. (1971). Investments and involvements as mechanisms producing commitment to the organization. Administrative Science Quarterly, 16, 143-150.
Shore, L. M., & Wayne, S. (1993). Commitment and employee behavior: Comparison of affective commitment and continuance commitment with perceived organizational support. Journal of Applied Psychology, 78, 774-780.
Shrout, P. E., & Fleiss, J. L. (1979). Intraclass correlations: Uses in assessing rater reliability. Psychological Bulletin, 86, 420-428.
Siehl, C., & Martin, J. (1984). The role of symbolic management: How can managers effectively transmit organizational culture? In J. G. Hunt, D. Hosking, C. A. Schriesheim, & R. Steward (Eds.), Leaders and managers: International perspectives on managerial behavior and leadership (pp. 227-239). Elmsford, NY: Pergamon Press.
Simpson, J. A. (2007). Foundations of interpersonal trust. In A. W. Kruglanski & E. T. Higgins (Eds.), Social psychology: Handbook of basic principles (2nd ed., pp. 587-607). New York, NY: Guilford.
Singh, R., Choo, W. M., & Poh, L. L. (1998). In-group bias and fair-mindedness as strategies of self-presentation in intergroup perception. Personality and Social Psychology Bulletin, 24, 147-162.
Sitkin, S. B., & Roth, N. L. (1993). Explaining the limited effectiveness of legalistic “remedies” for trust/distrust. Organization Science, 4, 367-392.
Skarlicki, D. P., & Latham, G. P. (1996). Increasing citizenship behavior within a labor union: A test of organizational justice theory. Journal of Applied Psychology, 81, 161-169.
Skarlicki, D., & Folger, R. (1997). Retaliation in the workplace: The roles of distributive,
procedural, and interactional justice. Journal of Applied Psychology, 82, 434-443.
178
Skitka, L. J., Bauman, C. W., & Mullen, E. (2008). Morality and justice: An expanded theoretical perspective and review. In K. A. Hedgvedt & J. Clay-Warner (Eds.), Advances in Group Processes (Vol. 25, pp. 1-27). Bingley, UK: Emerald Group Publishing Limited.
Smith, K. G., Smith, K. A., Sims, H. P., O’Bannon, D. P., & Scully, J. A. (1994). Top management team demography and process: The role of social integration and communication. Administrative Science Quarterly, 39, 412-438.
Snyder, M. (1981). On the self-perpetuating nature of social stereotypes. In D. Hamilton (Ed.), Cognitive processes in stereotyping and intergroup behavior (pp. 183-212). Hillsdale, NJ: Erlbaum.
Spector, P. E., & Fox, S. (2005). The stressor-emotion model of counterproductive work behavior. In S. Fox & P. E. Spector (Eds.), Counterproductive work behavior: Investigations of actors and targets (pp. 151-174). Washington, DC: American Psychological Association.
Spector, P. E., & Jex, S. M. (1998). Development of four self-report measures of job stressors and strain: Interpersonal conflict at work scale, organizational constraints scale, quantitative workload inventory, and physical symptoms inventory. Journal of Occupational Health Psychology, 3, 356-367.
Stangor, C., Sullivan, L. A., & Ford, T. E. (1991). Affective and cognitive determinants of prejudice. Social Cognition, 9, 359-380.
Stauffer, J. M., & Buckley, M. R. (2005). The existence and nature of racial bias in supervisory ratings. Journal of Applied Psychology, 90, 586-591.
Steers, R. M. (1977). Antecedents and outcomes of organizational commitment. Administrative Science Quarterly, 22, 46-56.
Stephan, W. G., & Stephan, C. W. (1985). Intergroup anxiety. Journal of Social Issues, 41, 157-175.
Stone, E. F., Stone, D. L., & Dipboye, R. L. (1992). Stigmas in organizations: Race, handicaps, and physical unattractiveness. In K. Kelley (Ed.), Issues, theory, and research in industrial/organizational psychology (pp. 385-457). Albany, NY: Elsevier.
Streiner, D. L. (1994). Figuring out factors: The use and misuse of factor analysis.
Canadian Journal of Psychiatry, 39, 135-140.
Sturm, S. (2001). Second generation employment discrimination: A structural approach. Columbia Law Review, 101, 458-569.
179
Sundstrom, E., DeMeuse, K., & Futrell, D. (1990). Work teams: Applications and effectiveness. American Psychologist, 45, 120-133.
Sundstrom, E., McIntyre, M., Halfhill, T., & Richards, H. (2000). Work groups: From the Hawthorne studies to work teams of the 1990s and beyond. Group Dynamics: Theory, Research, and Practice, 4, 44-67.
Super, D. E. (1953). A theory of vocational development. American Psychologist, 8, 185-190.
Swann, W. B., Polzer, J. T., Seyle, D. C., & Ko, S. J. (2004). Finding value in diversity: Verification of personal and social self-views in diverse groups. Academy of Management Review, 29, 9-27.
Tabachnick, B. G., & Fidell, L. S. (1996). Using multivariate statistics (3rd ed.). New York, NY: Harper Collins.
Taggar, S. (2002). Individual creativity and group ability to utilize individual creative resources: A multilevel model. Academy of Management Journal, 45, 315-330.
Tajfel, H. (1969). Cognitive aspects of prejudice. Journal of Social Issues, 25, 79-97.
Tajfel, H. (1970). Experiments in intergroup discrimination. Scientific American, 223, 96-102.
Tajfel, H. (1974). Social identity and intergroup behaviour. Social Science Information, 13, 65-93.
Tajfel, H., & Turner, J. (1979). An integrative theory of intergroup conflict. In W. G. Austin & S. Worchel (Eds.), The social psychology of intergroup relations (pp. 33-48). Monterey, CA: Brooks/Cole.
Tajfel, H., & Turner, J. C. (1986). The social identity theory of intergroup behavior. In S.
Worchel & W. G. Austin (Eds.), Psychology of intergroup relations (pp. 7-24). Chicago, IL: Nelson-Hall.
Tannenbaum, S., Beard, R., & Salas, E. (1992). Team building and its influence on team effectiveness: An examination of conceptual and empirical developments. In K. Kelley (Ed.), Issues, theory, and research in industrial/organizational psychology (pp. 117-153). Oxford, UK: North-Holland.
Tepper, B. J. (2000). Consequences of abusive supervision. Academy of Management Journal, 43, 178-190.
Thompson, J. D. (1967). Organizations in action. New York, NY: McGraw-Hill.
180
Tickle-Degnen, L., & Rosenthal, R. (1987). Group rapport and nonverbal behavior. In C. Hendrick et al. (Eds.), Group processes and intergroup relations: Review of personality and social psychology (Vol. 9, pp.113-136). Beverly Hills, CA: Sage.
Tinsley, H. E. A. (2000). The congruence myth: An analysis of the efficacy of the person environment fit models. Journal of Vocational Behavior, 56, 147-179.
Tinsley, H. E. A., & Weiss, D. J. (1975). Interrater reliability and agreement of subjective judgments. Journal of Counseling Psychology, 22, 358-376.
Tjosvold, D. (1998). Employee involvement in support of corporate values in successful organizations: Groups, cooperative interaction, and influence. International Journal of Value-Based Management, 11, 35-46.
Tolson, F. (2008). The boundaries of litigating unconscious discrimination: Firm-based remedies in response to a hostile judiciary. Delaware Journal of Corporate Law, 33, 347-421.
Toossi, M. (2002). A century of change: The U.S. labor force, 1950-2050. Monthly Labor Review, 125, 15-28.
Toossi, M. (2009). Labor force projections to 2018: Older workers staying more active. Monthly Labor Review, 128, 30-51.
Triana, M., Wagstaff, M. F., & Kim, K. (2012). That’s not fair! How personal value for diversity influences reactions to the perceived discriminatory treatment of minorities. Journal of Business Ethics, 111, 211-218.
Triandis, H. C. (1959). Cognitive similarity and interpersonal communication in industry. Journal of Applied Psychology, 43, 321-326.
Triandis, H. C. (1995). Individualism and collectivism. Boulder, CO: Westview Press.
Truhon, S. A. (2008). Equal opportunity climate in the United States military: Are differences in the eye of the beholder? European Journal of Work and Organizational Psychology, 17, 153-169.
Tsui, A. S., & Gutek, B. A. (1999). Demographic differences in organizations: Current research and future directions. Lanham, MD: Lexington Books
Tsui, A. S., & O’Reilly, C. A. (1989). Beyond simple demographic effects: The importance of relational demography in superior-subordinate dyads. Academy of Management Journal, 32, 402-423.
181
Tsui, A. S., Egan, T. D., & O’Reilly, C. A. (1992). Being different: Relational demography and organizational attachment. Administrative Science Quarterly, 37, 549-579.
Tsui, A. S., Xin, K. R., & Egan, T. D. (1995). Relational demography: The missing link in vertical dyad linkage. In S. E. Jackson & M. N. Ruderman (Eds.), Diversity in work teams: Research paradigms for a changing workplace (pp. 97-129). Washington, DC: American Psychological Association.
Tuckman, B. (1965). Developmental sequence in small groups. Psychological Bulletin, 63, 384-399.
Tung, R. L. (2008). Do race and gender matter in international assignments to/from Asia Pacific? An exploratory study of attitudes among Chinese and Korean Executives. Human Resource Management, 47, 91-110.
Turillo, C. J., Folger, R., Lavelle, J. J., Umphress, E., & Gee, J. (2002). Is virtue its own reward? Self-sacrificial decisions for the sake of fairness. Organizational Behavior and Human Decision Processes, 89, 839-865.
Turner, J. C. (1985). Social categorization and the self-concept: A social cognitive theory of group behavior. In E. J. Lawler (Ed.), Advances in group processes: Theory and research (Vol. 2, pp. 77-122). Greenwich, CT: JAI.
Turner, J. C. (1987). Rediscovering the Social Group: A Self-Categorization Theory. Oxford, UK: Blackwell.
Tversky, A., & Kahneman, D. (1974). Judgment under uncertainty: Heuristics and biases. Science, 185, 1124-1131.
U.S. Census Bureau (2010). Facts for features: 20th anniversary of Americans with Disabilities Act: July 26. Retrieved from http://www.census.gov/newsroom/releases/archives/facts_-for_features_special_editions/cb10-ff13.html
U.S. Census Bureau (2011). The American Indian and Alaska Native population 2010. Retrieved from http://www.census.gov/prod/cen2010/briefs/c2010br-10.pdf
U.S. Equal Employment Opportunity Commission (2013a). Retrieved from http://www.eeoc.gov/
U.S. Equal Employment Opportunity Commission (2013b). Harassment. Retrieved from http://www.eeoc.gov/laws/types/harassment.cfm
Ugboro, I. O. (1993) Loyalty, value congruence, and affective organisational commitment. Mid-American Journal of Business, 8, 29-36.
182
Uniform Guidelines on Employee Selection Procedures (UGESP). 1978. 29 C. F. R. section 1607.4D.
Valian, V. (1998). Why so slow? The advancement of women. Cambridge, MA: MIT Press.
Valore, T. G. (2002). Sharing adventure: The group is important! Reclaiming Children and Youth, 1, 90-94.
van Knippenberg, D., & Schippers, M. C. (2007). Work group diversity. In S. T. Fiske, A. E. Kazdin, & D. L. Schacter (Eds.). Annual review of psychology (Vol. 58, pp. 515-541). Palo Alto, CA: Annual Reviews.
van Vianen, A. E. M. (2000). Person-organization fit: The match between newcomers’ and recruiters’ preferences for organizational cultures. Personnel Psychology, 53, 113-149.
van Vianen, A. E. M., De Parter, I. E., Kristof-Brown, A. L., & Johnson, E. C. (2004). Fitting in: Surface- and deep-level cultural differences and expatriates’ adjustment. Academy of Management Journal, 47, 697-709.
Vancouver, J. B., & Schmitt, N. W. (1991). An exploratory examination of person-organization fit: Organizational goal congruence. Personnel Psychology, 44, 333-352.
Varma, A., DeNisi, A. S., & Peters, L. H. (1996). Interpersonal affect and performance appraisal: A field study. Personnel Psychology, 49, 341-360.
Varney, G. H. (1989). Building productive teams: An action guide and resource book.
San Francisco, CA: Jossey-Bass.
Verquer, M. L., Beehr, T. A., & Wagner, S. H. (2003). A meta-analysis of relations between person-organization fit and work attitudes. Journal of Vocational Behavior, 63, 473-489.
Vidulich, R. N., & Krevanick, E. W. (1966). Racial attitudes and emotional response to visual representations of the Negro. Journal of Social Psychology, 68, 85-93.
von Hippel, W., Jonides, J., Hilton, J. L., & Narayan, S. (1993). Inhibitory effect of schematic processing on perceptual encoding. Journal of Personality and Social Psychology, 64, 921-935.
Wal-Mart Stores, Inc. v. Betty Dukes et al., 131 S. Ct. 2541, 2550-52 (2011).
183
Walsh, B. M., Matthews, R. A., Tuller, M. D., Parks, K. M., & McDonald, D. P. (2010). A multilevel model of the effects of equal opportunity climate on job satisfaction in the military. Journal of Occupational Health Psychology, 15, 191-207.
Wanous, J. P. (1980). Organizational entry: Recruitment, selection, and socialization of newcomers. Reading, MA: Addison-Wesley.
Wech, B. A., Mossholder, K. W., Steel, R. P., & Bennett, N. (1998). Does work group cohesiveness affect individuals’ performance and organizational commitment? A cross-level examination. Small Group Research, 29, 472-494.
Weigel, R.H., & Howes, P.W. (1985). Conceptions of racial prejudice: Symbolic racism reconsidered. Journal of Social Issues, 41, 117-138.
Weiss, D. C. (2008, October 16). Meatpacker prayer dispute among rising complaints of religious bias. American Bar Association Journal. Retrieved from http://www.abajournal.com/news/meatpacker_prayer_dispute_among_rising_complaints_of_religious_bias/#when:09:29:01Z
Weiss, H. M. (2002). Deconstructing job satisfaction: Separating evaluations, beliefs, and affective experiences. Human Resource Management Review, 12, 173-194.
Wellen, J. M., & Neale, M. (2006). Deviance, self-typicality, and group cohesion: The corrosive effects of the bad apples on the barrel. Small Group Research, 37, 165-186.
Werbel, J. D., & Gilliland, S. W. (1999). Person-environment fit in the selection process. In G. R. Ferris (Ed.), Research in personnel and human resource management (Vol. 17, pp. 209-243). Stamford, CT: JAI Press.
Wheelan, S. A. (2005). Group processes: A developmental perspective (2nd ed.). Boston, MA: Allyn and Bacon.
Wieselquist, J., Rusbult, C. E., Foster, C. A., & Agnew, C. R. (1999). Commitment, pro-relationship behavior, and trust in close relationships. Journal of Personality and Social Psychology, 77, 942-966.
Wilder, D. A., & Simon, A. F. (2001). Affect as a cause of intergroup bias. In R. J. Brown & S. L. Gaertner (Eds.), Handbook of social psychology (pp. 153-172). Malden, MA: Blackwell.
Wilder, D., & Simon, A. F. (2001). Affect as a cause of intergroup bias. In R. Brown & S. Gaertner (Eds.), Handbook of social psychology (pp. 153-172). Oxford, UK: Blackwell.
184
Williams, K. Y., & O’Reilly, C. A., III. (1998). Demography and diversity in organizations: A review of 40 years of research. In B. M. Staw & R. I. Sutton (Eds.), Research in organizational behavior (Vol. 20, pp. 77-140). Greenwich, CT: JAI Press.
Williams, M. (2001). In whom we trust: Group membership as an affective context for trust development. Academy of Management Review, 26, 377-396.
Wilson, C. B. (1991). U.S. businesses suffer from workplace trauma. Personnel Journal, 70, 47-50.
Witt, L. A. (1998). Enhancing goal congruence: A solution to organizational politics. Journal of Applied Psychology, 83, 666-674.
Wolfson, N., Kraiger, K., & Finkelstein, L. (2011). The relationship between diversity climate perceptions and workplace attitudes. The Psychologist-Manager Journal, 14, 161-176.
Yammarino, F. J., & Markham, S. E. (1992). On the application of within and between analysis: Are absence and affect really group-based phenomena? Journal of Applied Psychology, 77, 168-176.
Zand, D. E. (1972). Trust and managerial problem solving. Administrative Science Quarterly, 17, 229-239.
Zenger, T. R., & Lawrence, B. S. (1989). Organizational demography: The differential effects of age and tenure distributions on technical communication. Academy of Management Journal, 32, 353-376.
Zickar, M. J., & Highouse, S. (2001). Measuring prestige of journals in industrial-organizational psychology. The Industrial-Organizational Psychologist, 38, 29-36.
Zohar, D. (1980). Safety climate in industrial organizations: Theoretical and applied implications. Journal of Applied Psychology, 65, 96-102.
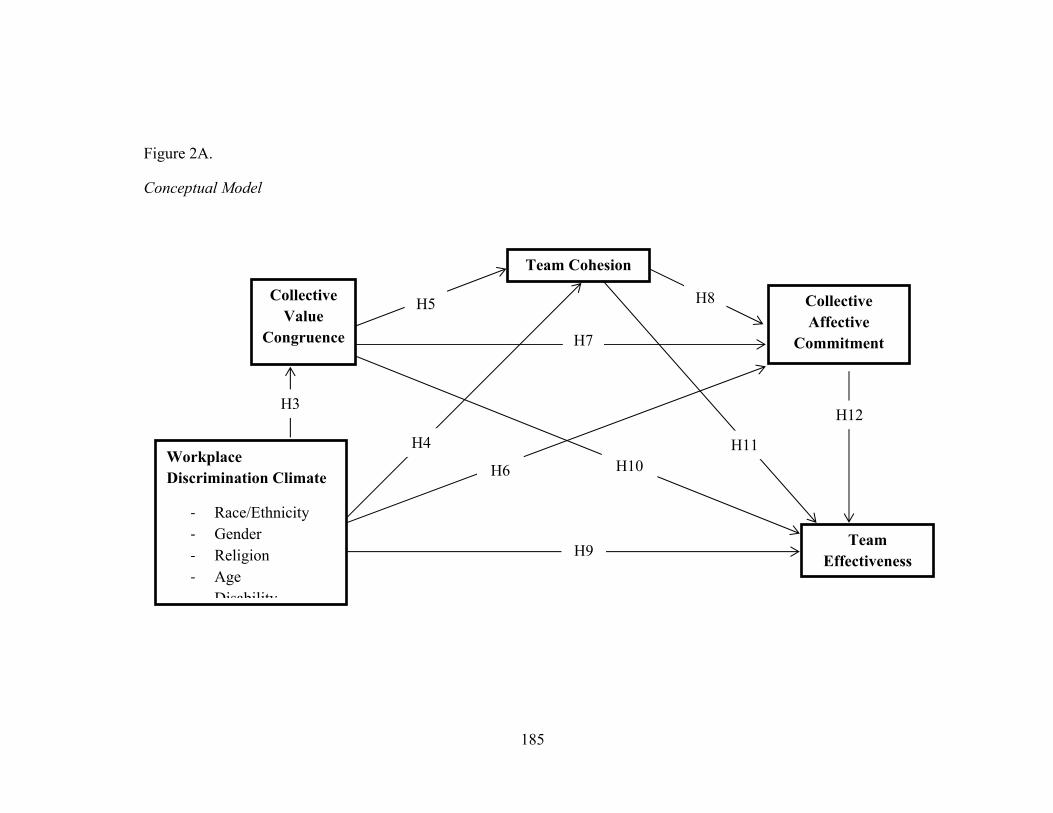
185
Figure 2A.
Conceptual Model
Workplace Discrimination Climate
‐ Race/Ethnicity ‐ Gender ‐ Religion ‐ Age
Disability
Collective Value
Congruence
Team Cohesion
Collective Affective
Commitment
Team Effectiveness
H3
H4
H6
H9
H5 H8
H7
H10 H11
H12
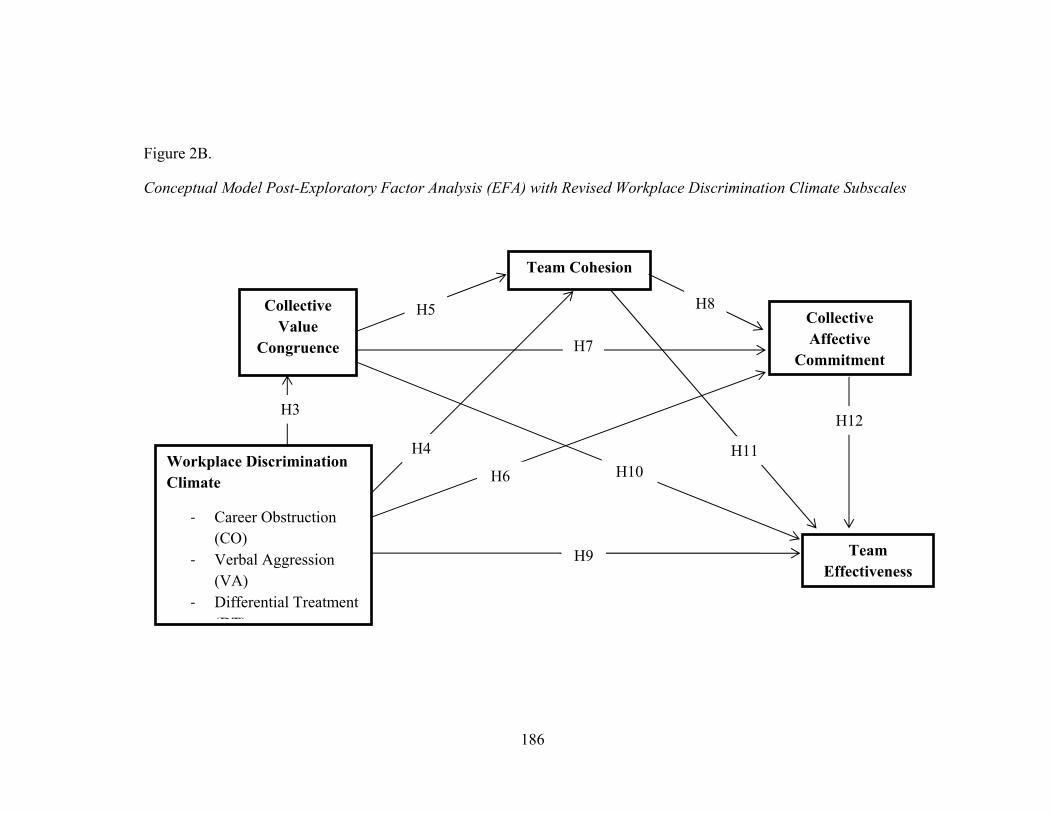
186
Figure 2B.
Conceptual Model Post-Exploratory Factor Analysis (EFA) with Revised Workplace Discrimination Climate Subscales
Workplace Discrimination Climate
‐ Career Obstruction (CO)
‐ Verbal Aggression (VA)
‐ Differential Treatment (DT)
Collective Value
Congruence
Team Cohesion
Collective Affective
Commitment
Team Effectiveness
H3
H4
H6
H9
H5 H8
H7
H10 H11
H12
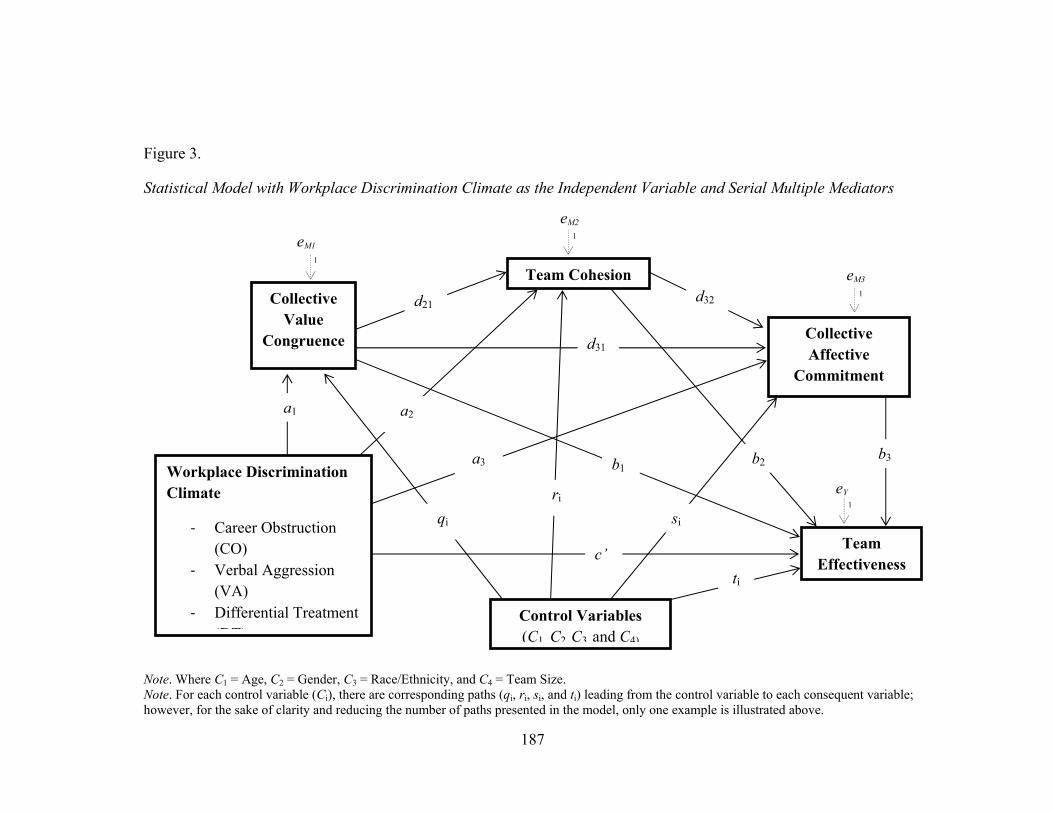
187
Figure 3.
Statistical Model with Workplace Discrimination Climate as the Independent Variable and Serial Multiple Mediators
Note. Where C1 = Age, C2 = Gender, C3 = Race/Ethnicity, and C4 = Team Size. Note. For each control variable (Ci), there are corresponding paths (qi, ri, si, and ti) leading from the control variable to each consequent variable; however, for the sake of clarity and reducing the number of paths presented in the model, only one example is illustrated above.
eM2
Collective Value
Congruence
Team Cohesion
Collective Affective
Commitment
Team Effectiveness
a1 a2
a3
c’
d21d32
d31
b1b2
b3
eM1
eM3 1
eY
1
1
Workplace Discrimination Climate
‐ Career Obstruction (CO)
‐ Verbal Aggression (VA)
‐ Differential Treatment (DT)
Control Variables (C1 C2 C3 and C4)
qi
ri
si
ti
1
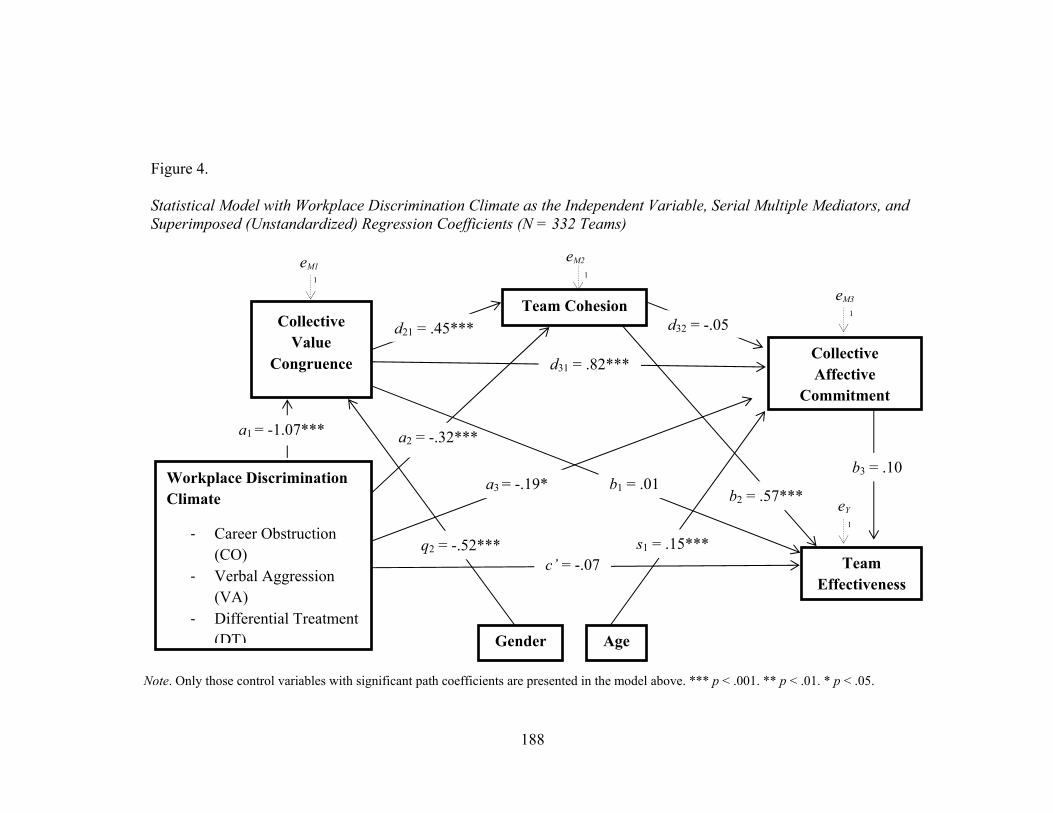
188
Figure 4. Statistical Model with Workplace Discrimination Climate as the Independent Variable, Serial Multiple Mediators, and Superimposed (Unstandardized) Regression Coefficients (N = 332 Teams)
Note. Only those control variables with significant path coefficients are presented in the model above. *** p < .001. ** p < .01. * p < .05.
1
Collective Value
Congruence
Team Cohesion
Collective Affective
Commitment
Team Effectiveness
a1 = -1.07*** a2 = -.32***
a3 = -.19*
c’ = -.07
d21 = .45*** d32 = -.05
d31 = .82***
b3 = .10
eM1
eM3 1
eY
1
1
Workplace Discrimination Climate
‐ Career Obstruction (CO)
‐ Verbal Aggression (VA)
‐ Differential Treatment (DT) Age Gender
q2 = -.52*** s1 = .15***
eM2
b1 = .01 b2 = .57***
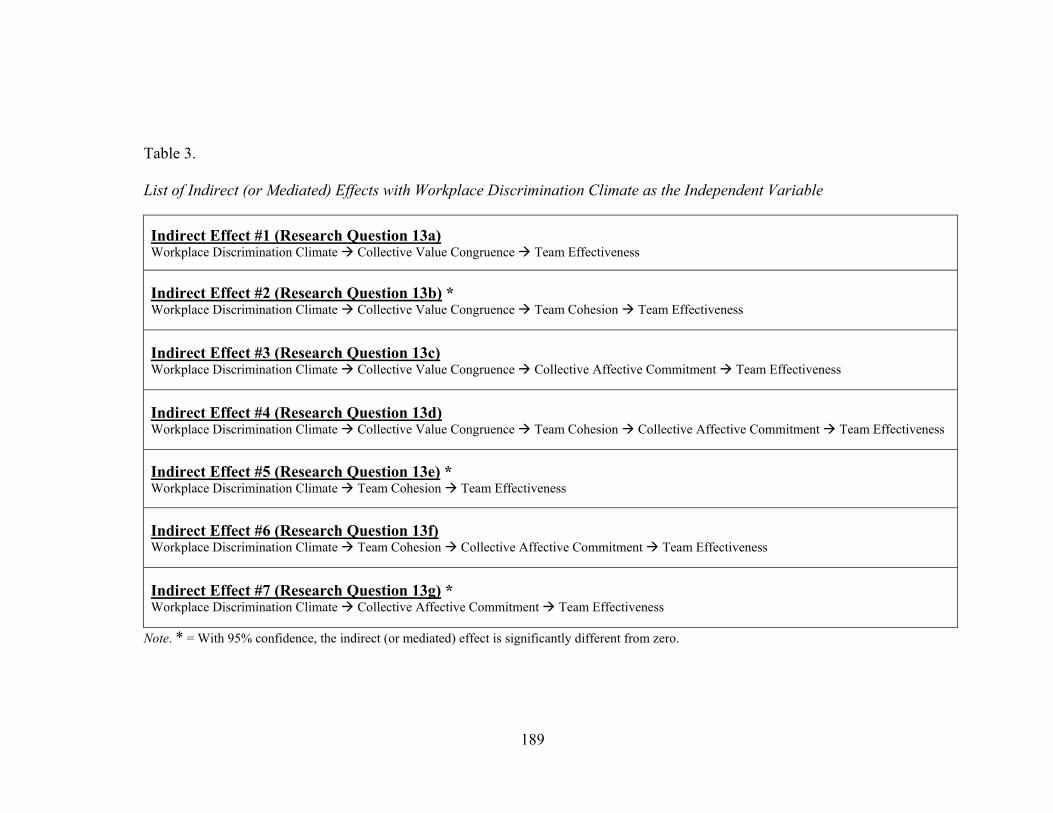
189
Table 3.
List of Indirect (or Mediated) Effects with Workplace Discrimination Climate as the Independent Variable
Indirect Effect #1 (Research Question 13a) Workplace Discrimination Climate Collective Value Congruence Team Effectiveness
Indirect Effect #2 (Research Question 13b) * Workplace Discrimination Climate Collective Value Congruence Team Cohesion Team Effectiveness
Indirect Effect #3 (Research Question 13c) Workplace Discrimination Climate Collective Value Congruence Collective Affective Commitment Team Effectiveness
Indirect Effect #4 (Research Question 13d) Workplace Discrimination Climate Collective Value Congruence Team Cohesion Collective Affective Commitment Team Effectiveness
Indirect Effect #5 (Research Question 13e) * Workplace Discrimination Climate Team Cohesion Team Effectiveness
Indirect Effect #6 (Research Question 13f) Workplace Discrimination Climate Team Cohesion Collective Affective Commitment Team Effectiveness
Indirect Effect #7 (Research Question 13g) * Workplace Discrimination Climate Collective Affective Commitment Team Effectiveness
Note. * = With 95% confidence, the indirect (or mediated) effect is significantly different from zero.
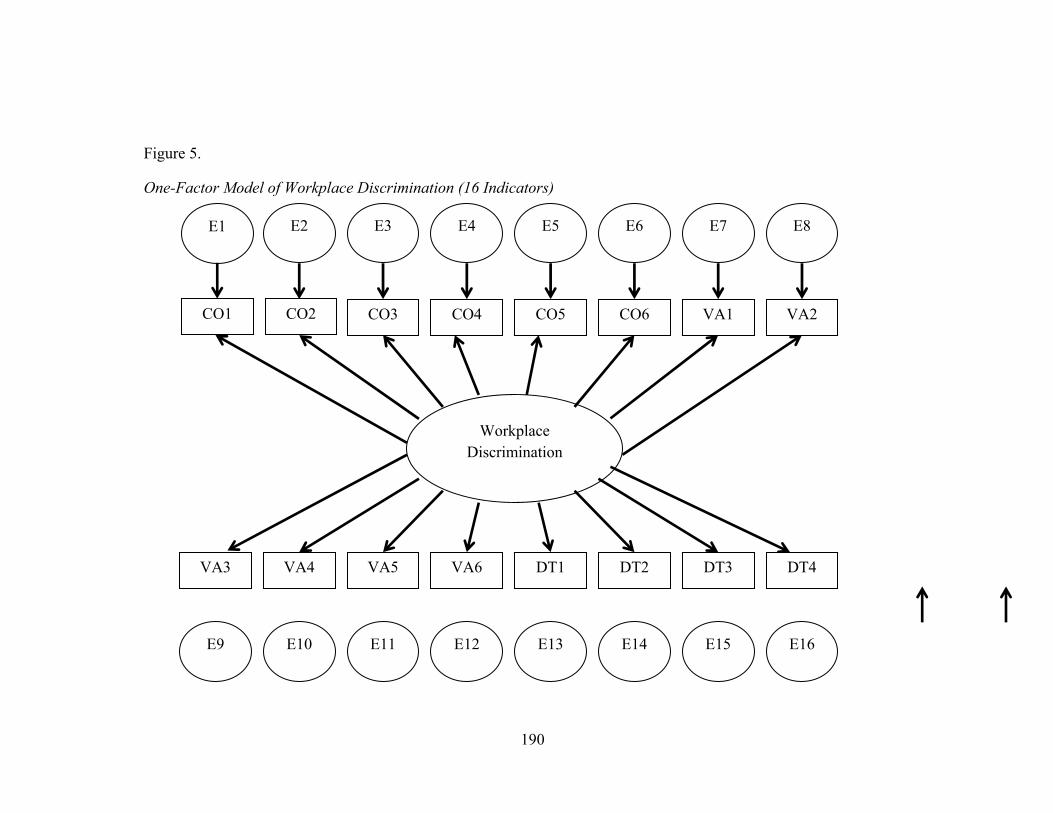
190
Figure 5.
One-Factor Model of Workplace Discrimination (16 Indicators)
Workplace Discrimination
CO1 CO2 CO3 CO4 CO5 CO6 VA1 VA2
VA3 VA4 VA5 VA6 DT1 DT2 DT3 DT4
E1 E2 E3
E9 E11 E12 E13 E15 E14 E16 E10
E4 E5 E6 E7 E8
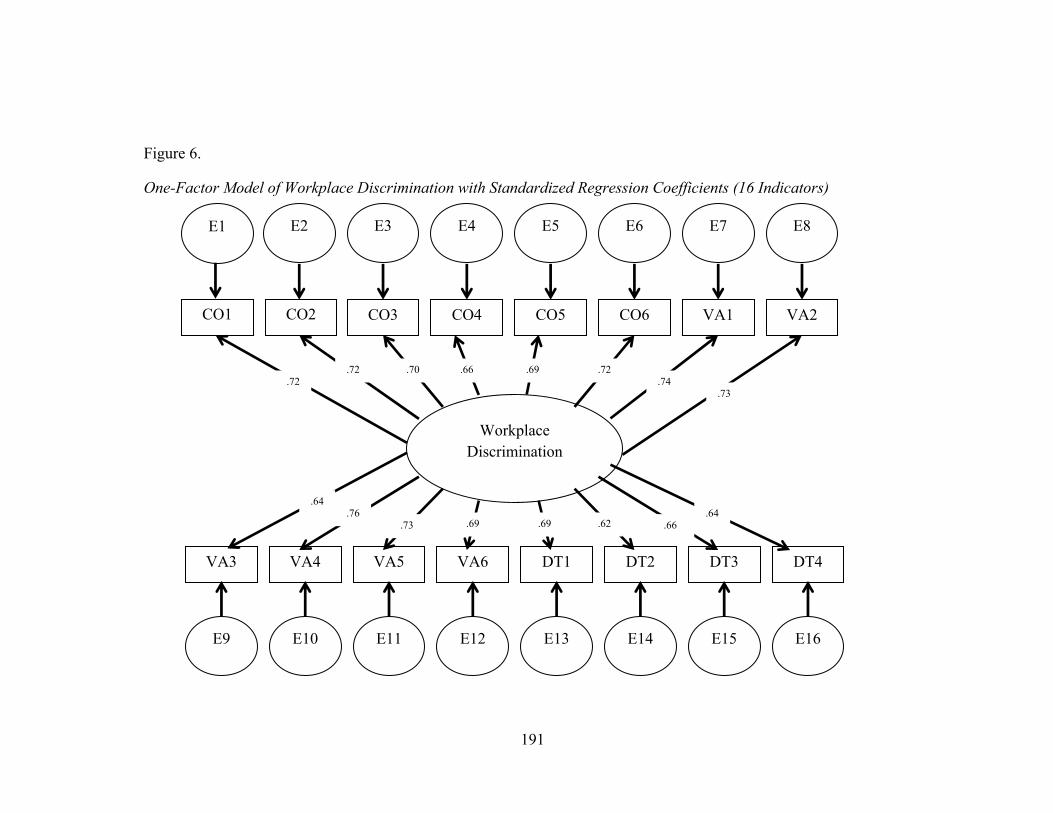
191
Figure 6.
One-Factor Model of Workplace Discrimination with Standardized Regression Coefficients (16 Indicators)
Workplace Discrimination
.72 .70 .66
.73 .74
.72 .69
.64
.69 .69 .62 .76
.73 .66 .64
.72
CO1 CO2 CO3 CO4 CO5 CO6 VA1 VA2
E1 E2 E3 E4 E5 E6 E7 E8
VA3 VA4 VA5 VA6 DT1 DT2 DT3 DT4
E9 E11 E12 E13 E15 E14 E16 E10
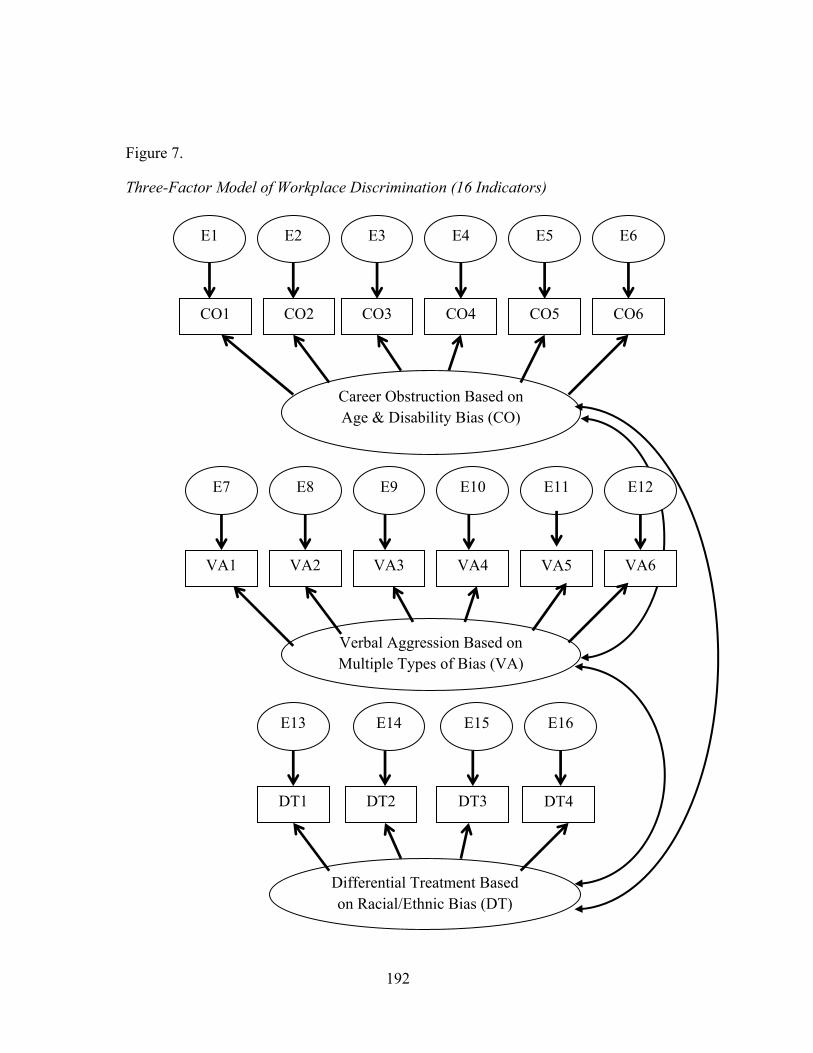
192
Figure 7.
Three-Factor Model of Workplace Discrimination (16 Indicators)
Career Obstruction Based on Age & Disability Bias (CO)
CO1 CO2
E1 E2 E3
Verbal Aggression Based on Multiple Types of Bias (VA)
Differential Treatment Based on Racial/Ethnic Bias (DT)
VA1
E7
VA2 VA3 VA4
E10
VA5
E11
VA6
E12 E9 E8
E4 E5 E6
DT1
E13
DT3
E15
DT4
E16
DT2
E14
CO3 CO4 CO5 CO6
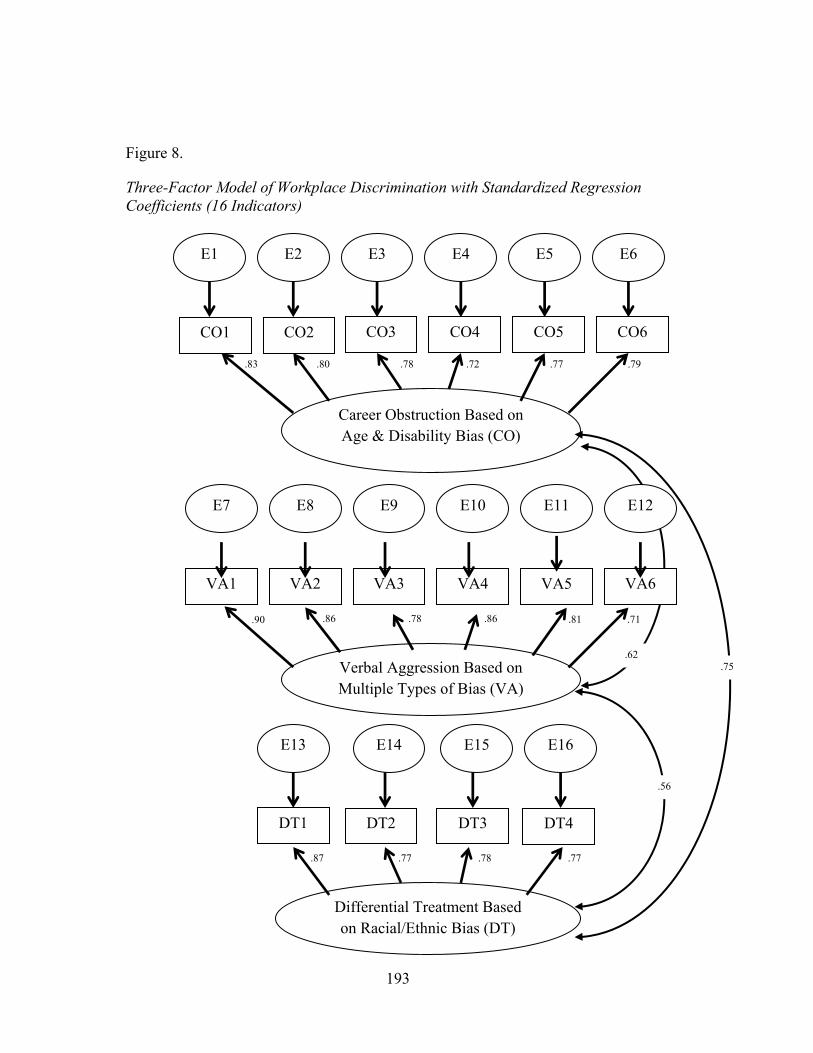
193
Figure 8.
Three-Factor Model of Workplace Discrimination with Standardized Regression Coefficients (16 Indicators)
.79 .77 .72 .78 .80 .83
.87
.71 .81 .78 .86 .86 .90
.77 .78 .77
Differential Treatment Based on Racial/Ethnic Bias (DT)
VA1
E7
VA2 VA3 VA4
E10
VA5
E11
VA6
E12 E9 E8
Career Obstruction Based on Age & Disability Bias (CO)
CO1 CO2 CO3 CO4 CO5 CO6
E1 E2 E3
Verbal Aggression Based on Multiple Types of Bias (VA)
E4 E5 E6
DT1
E13
DT3
E15
DT4
E16
DT2
E14
.75
.56
.62
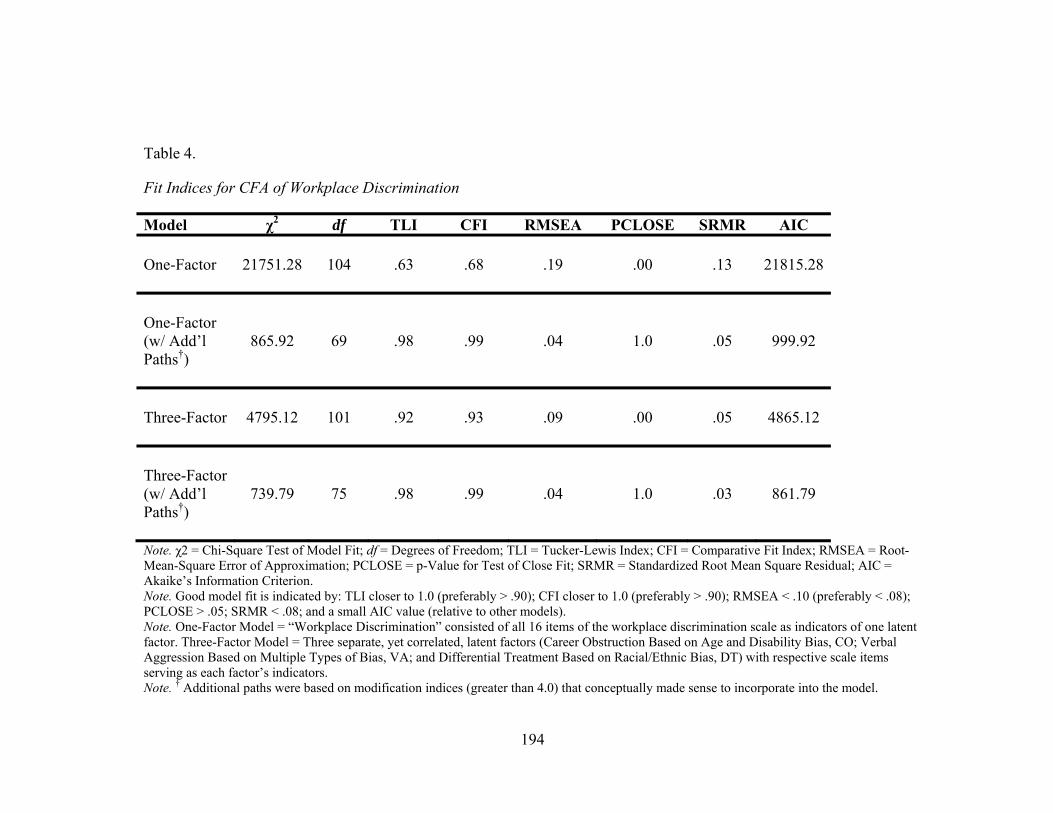
194
Table 4.
Fit Indices for CFA of Workplace Discrimination
Model χ2 df TLI CFI RMSEA PCLOSE SRMR AIC One-Factor
21751.28 104 .63 .68 .19 .00 .13 21815.28
One-Factor (w/ Add’l Paths†)
865.92 69 .98 .99 .04 1.0 .05 999.92
Three-Factor
4795.12 101 .92 .93 .09 .00 .05 4865.12
Three-Factor (w/ Add’l Paths†)
739.79 75 .98 .99 .04 1.0 .03 861.79
Note. χ2 = Chi-Square Test of Model Fit; df = Degrees of Freedom; TLI = Tucker-Lewis Index; CFI = Comparative Fit Index; RMSEA = Root- Mean-Square Error of Approximation; PCLOSE = p-Value for Test of Close Fit; SRMR = Standardized Root Mean Square Residual; AIC = Akaike’s Information Criterion. Note. Good model fit is indicated by: TLI closer to 1.0 (preferably > .90); CFI closer to 1.0 (preferably > .90); RMSEA < .10 (preferably < .08); PCLOSE > .05; SRMR < .08; and a small AIC value (relative to other models). Note. One-Factor Model = “Workplace Discrimination” consisted of all 16 items of the workplace discrimination scale as indicators of one latent factor. Three-Factor Model = Three separate, yet correlated, latent factors (Career Obstruction Based on Age and Disability Bias, CO; Verbal Aggression Based on Multiple Types of Bias, VA; and Differential Treatment Based on Racial/Ethnic Bias, DT) with respective scale items serving as each factor’s indicators. Note. † Additional paths were based on modification indices (greater than 4.0) that conceptually made sense to incorporate into the model.
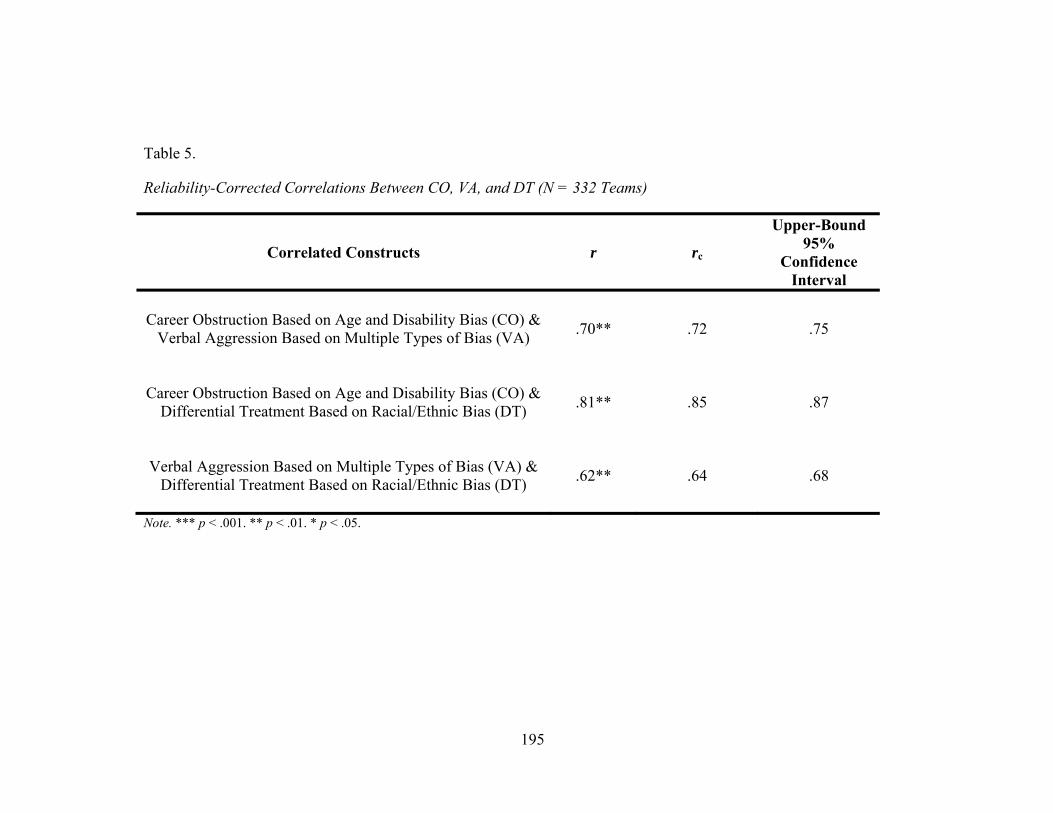
195
Table 5.
Reliability-Corrected Correlations Between CO, VA, and DT (N = 332 Teams)
Correlated Constructs r rc
Upper-Bound 95%
Confidence Interval
Career Obstruction Based on Age and Disability Bias (CO) &
Verbal Aggression Based on Multiple Types of Bias (VA)
.70** .72 .75
Career Obstruction Based on Age and Disability Bias (CO) &
Differential Treatment Based on Racial/Ethnic Bias (DT)
.81** .85 .87
Verbal Aggression Based on Multiple Types of Bias (VA) &
Differential Treatment Based on Racial/Ethnic Bias (DT)
.62** .64 .68
Note. *** p < .001. ** p < .01. * p < .05.
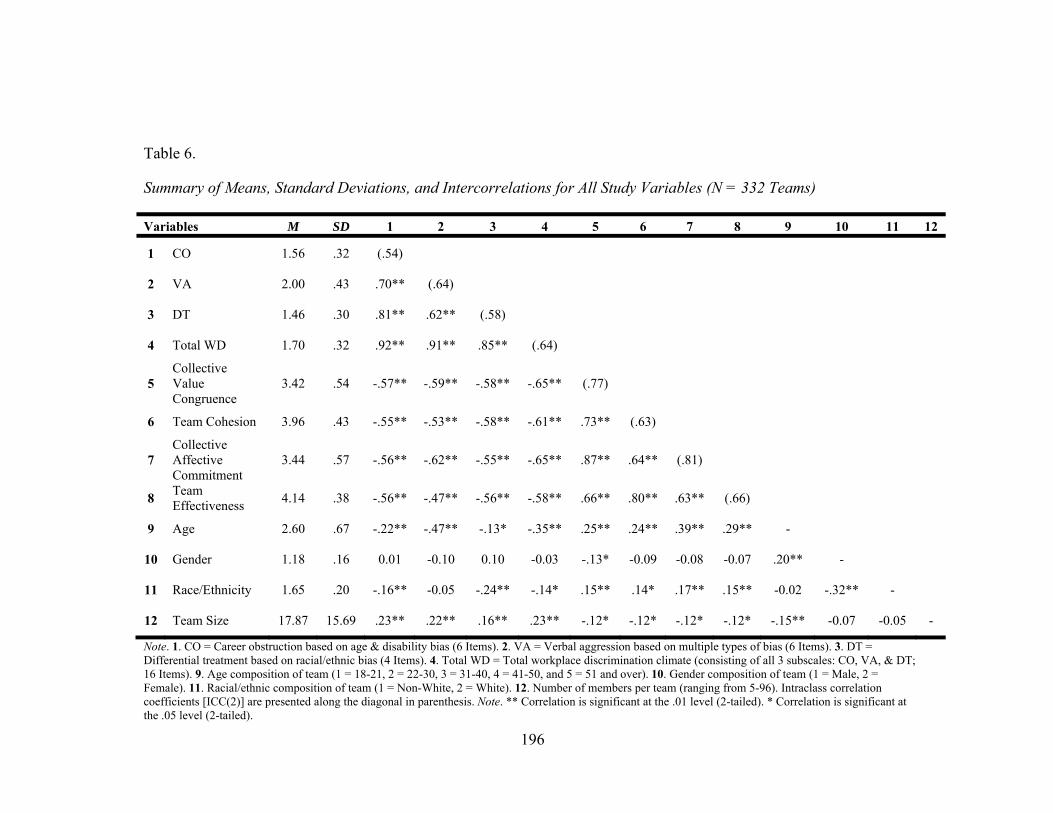
196
Table 6.
Summary of Means, Standard Deviations, and Intercorrelations for All Study Variables (N = 332 Teams)
Variables M SD 1 2 3 4 5 6 7 8 9 10 11 12
1 CO 1.56 .32 (.54)
2 VA 2.00 .43 .70** (.64)
3 DT 1.46 .30 .81** .62** (.58)
4 Total WD 1.70 .32 .92** .91** .85** (.64)
5 Collective Value Congruence
3.42 .54 -.57** -.59** -.58** -.65** (.77)
6 Team Cohesion 3.96 .43 -.55** -.53** -.58** -.61** .73** (.63)
7 Collective Affective Commitment
3.44 .57 -.56** -.62** -.55** -.65** .87** .64** (.81)
8 Team Effectiveness
4.14 .38 -.56** -.47** -.56** -.58** .66** .80** .63** (.66)
9 Age 2.60 .67 -.22** -.47** -.13* -.35** .25** .24** .39** .29** -
10 Gender 1.18 .16 0.01 -0.10 0.10 -0.03 -.13* -0.09 -0.08 -0.07 .20** -
11 Race/Ethnicity 1.65 .20 -.16** -0.05 -.24** -.14* .15** .14* .17** .15** -0.02 -.32** -
12 Team Size 17.87 15.69 .23** .22** .16** .23** -.12* -.12* -.12* -.12* -.15** -0.07 -0.05 -
Note. 1. CO = Career obstruction based on age & disability bias (6 Items). 2. VA = Verbal aggression based on multiple types of bias (6 Items). 3. DT = Differential treatment based on racial/ethnic bias (4 Items). 4. Total WD = Total workplace discrimination climate (consisting of all 3 subscales: CO, VA, & DT; 16 Items). 9. Age composition of team (1 = 18-21, 2 = 22-30, 3 = 31-40, 4 = 41-50, and 5 = 51 and over). 10. Gender composition of team (1 = Male, 2 = Female). 11. Racial/ethnic composition of team (1 = Non-White, 2 = White). 12. Number of members per team (ranging from 5-96). Intraclass correlation coefficients [ICC(2)] are presented along the diagonal in parenthesis. Note. ** Correlation is significant at the .01 level (2-tailed). * Correlation is significant at the .05 level (2-tailed).
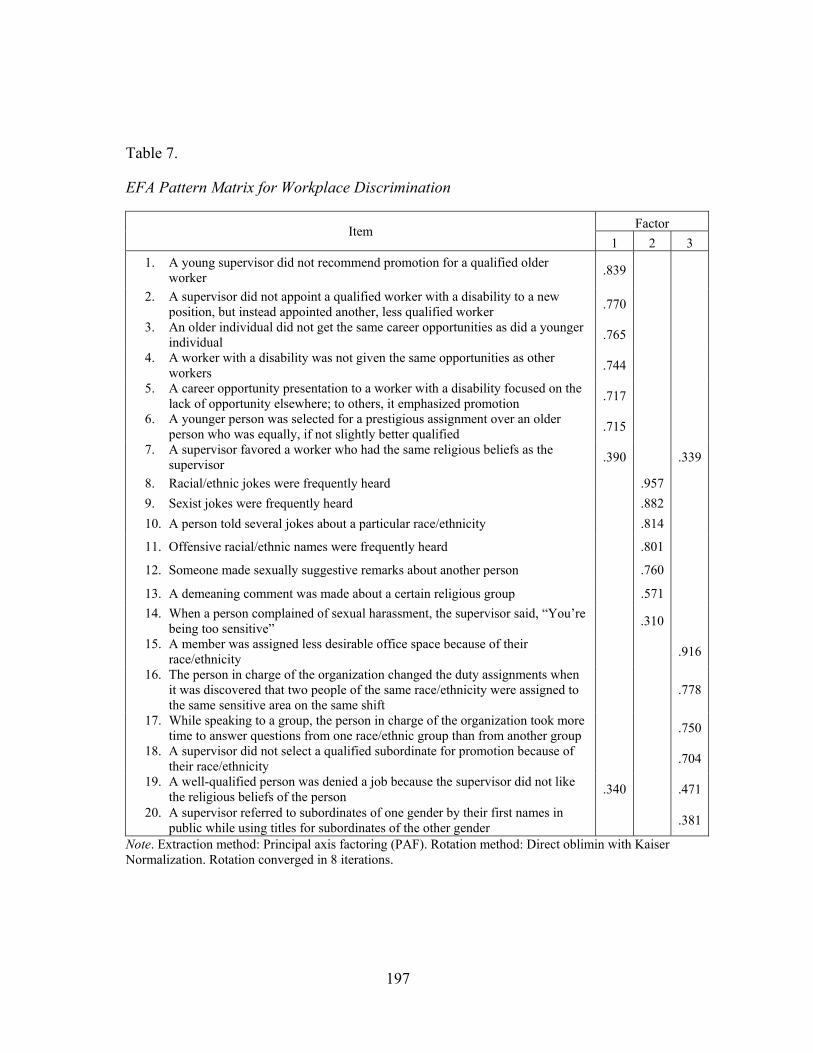
197
Table 7.
EFA Pattern Matrix for Workplace Discrimination
Note. Extraction method: Principal axis factoring (PAF). Rotation method: Direct oblimin with Kaiser Normalization. Rotation converged in 8 iterations.
Item Factor
1 2 3
1. A young supervisor did not recommend promotion for a qualified older worker
.839
2. A supervisor did not appoint a qualified worker with a disability to a new position, but instead appointed another, less qualified worker
.770
3. An older individual did not get the same career opportunities as did a younger individual
.765
4. A worker with a disability was not given the same opportunities as other workers
.744
5. A career opportunity presentation to a worker with a disability focused on the lack of opportunity elsewhere; to others, it emphasized promotion
.717
6. A younger person was selected for a prestigious assignment over an older person who was equally, if not slightly better qualified
.715
7. A supervisor favored a worker who had the same religious beliefs as the supervisor
.390 .339
8. Racial/ethnic jokes were frequently heard .957
9. Sexist jokes were frequently heard .882
10. A person told several jokes about a particular race/ethnicity .814
11. Offensive racial/ethnic names were frequently heard .801
12. Someone made sexually suggestive remarks about another person .760
13. A demeaning comment was made about a certain religious group .571
14. When a person complained of sexual harassment, the supervisor said, “You’re being too sensitive”
.310
15. A member was assigned less desirable office space because of their race/ethnicity
.916
16. The person in charge of the organization changed the duty assignments when it was discovered that two people of the same race/ethnicity were assigned to the same sensitive area on the same shift
.778
17. While speaking to a group, the person in charge of the organization took more time to answer questions from one race/ethnic group than from another group
.750
18. A supervisor did not select a qualified subordinate for promotion because of their race/ethnicity
.704
19. A well-qualified person was denied a job because the supervisor did not like the religious beliefs of the person
.340 .471
20. A supervisor referred to subordinates of one gender by their first names in public while using titles for subordinates of the other gender
.381
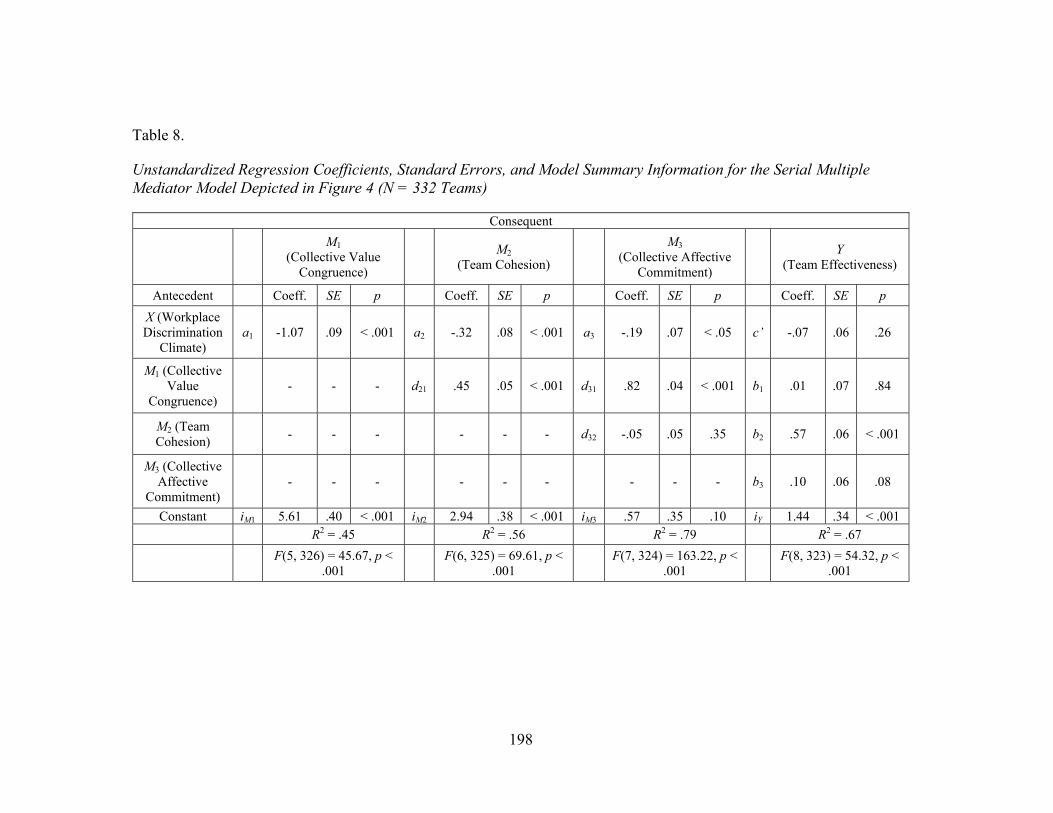
198
Table 8.
Unstandardized Regression Coefficients, Standard Errors, and Model Summary Information for the Serial Multiple Mediator Model Depicted in Figure 4 (N = 332 Teams)
Consequent
M1
(Collective Value Congruence)
M2
(Team Cohesion)
M3 (Collective Affective
Commitment)
Y (Team Effectiveness)
Antecedent Coeff. SE p Coeff. SE p Coeff. SE p Coeff. SE p
X (Workplace Discrimination
Climate) a1 -1.07 .09 < .001 a2 -.32 .08 < .001 a3 -.19 .07 < .05 c’ -.07 .06 .26
M1 (Collective Value
Congruence) - - - d21 .45 .05 < .001 d31 .82 .04 < .001 b1 .01 .07 .84
M2 (Team Cohesion)
- - - - - - d32 -.05 .05 .35 b2 .57 .06 < .001
M3 (Collective Affective
Commitment) - - - - - - - - - b3 .10 .06 .08
Constant iM1 5.61 .40 < .001 iM2 2.94 .38 < .001 iM3 .57 .35 .10 iY 1.44 .34 < .001 R2 = .45 R2 = .56 R2 = .79 R2 = .67
F(5, 326) = 45.67, p <
.001
F(6, 325) = 69.61, p < .001
F(7, 324) = 163.22, p <
.001
F(8, 323) = 54.32, p < .001
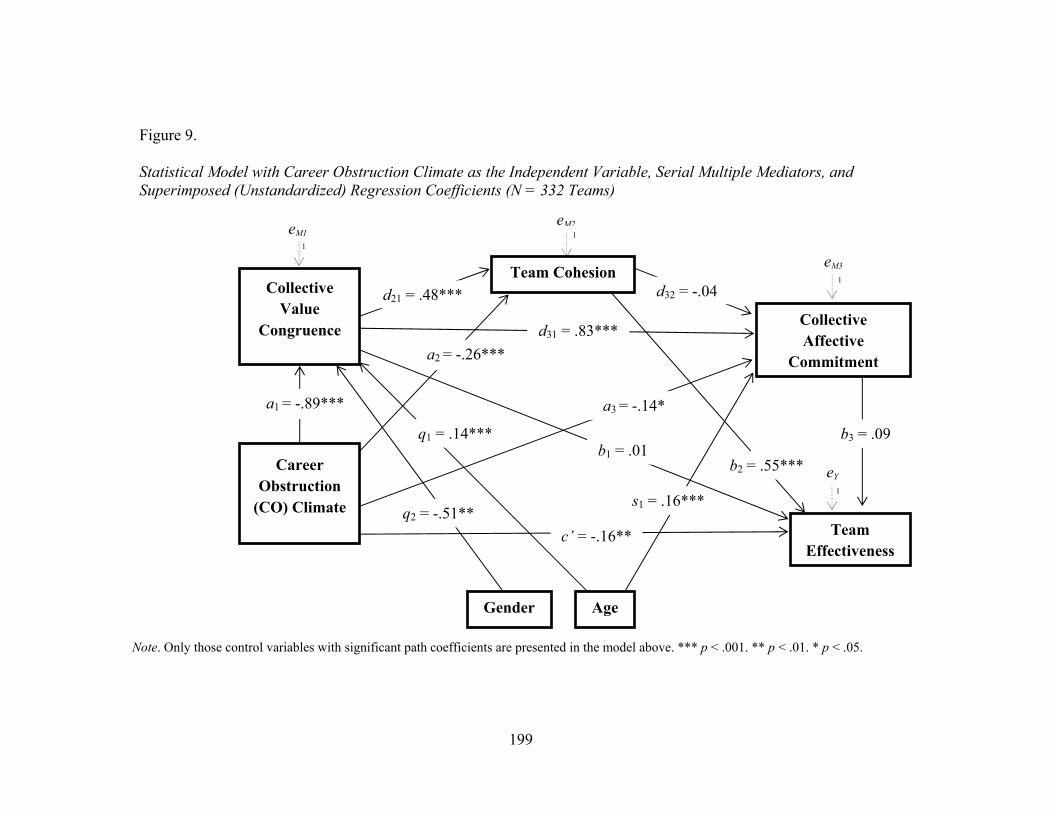
199
Figure 9. Statistical Model with Career Obstruction Climate as the Independent Variable, Serial Multiple Mediators, and Superimposed (Unstandardized) Regression Coefficients (N = 332 Teams)
Note. Only those control variables with significant path coefficients are presented in the model above. *** p < .001. ** p < .01. * p < .05.
1eM1 eM2
a1 = -.89*** a3 = -.14*
d31 = .83***
b3 = .09
eY 1
Career Obstruction
(CO) Climate q2 = -.51** s1 = .16***
b1 = .01 q1 = .14***
a2 = -.26***
Collective Value
Congruence
Team Cohesion
Collective Affective
Commitment
Team Effectiveness
c’ = -.16**
d21 = .48*** d32 = -.04
eM3 1
1
b2 = .55***
Age Gender

200
Table 9.
Unstandardized Regression Coefficients, Standard Errors, and Model Summary Information for the Serial Multiple Mediator Model Depicted in Figure 9 (N = 332 Teams)
Consequent
M1
(Collective Value Congruence)
M2
(Team Cohesion)
M3 (Collective Affective
Commitment)
Y (Team Effectiveness)
Antecedent Coeff. SE p Coeff. SE p Coeff. SE p Coeff. SE p
X (Career Obstruction
Climate) a1 -.89 .10 < .001 a2 -.26 .08 < .001 a3 -.14 .06 < .05 c’ -.16 .05 < .01
M1 (Collective Value
Congruence) - - - d21 .48 .04 < .001 d31 .83 .04 < .001 b1 .01 .07 .90
M2 (Team Cohesion)
- - - - - - d32 -.04 .06 .45 b2 .55 .06 < .001
M3 (Collective Affective
Commitment) - - - - - - - - - b3 .09 .06 .12
Constant iM1 4.96 .42 < .001 iM2 2.65 .37 < .001 iM3 .35 .32 .27 iY 1.70 .31 < .001 R2 = .36 R2 = .56 R2 = .79 R2 = .67
F(5, 326) = 34.05, p <
.001
F(6, 325) = 67.34, p < .001
F(7, 324) = 160.45, p <
.001
F(8, 323) = 56.77, p < .001
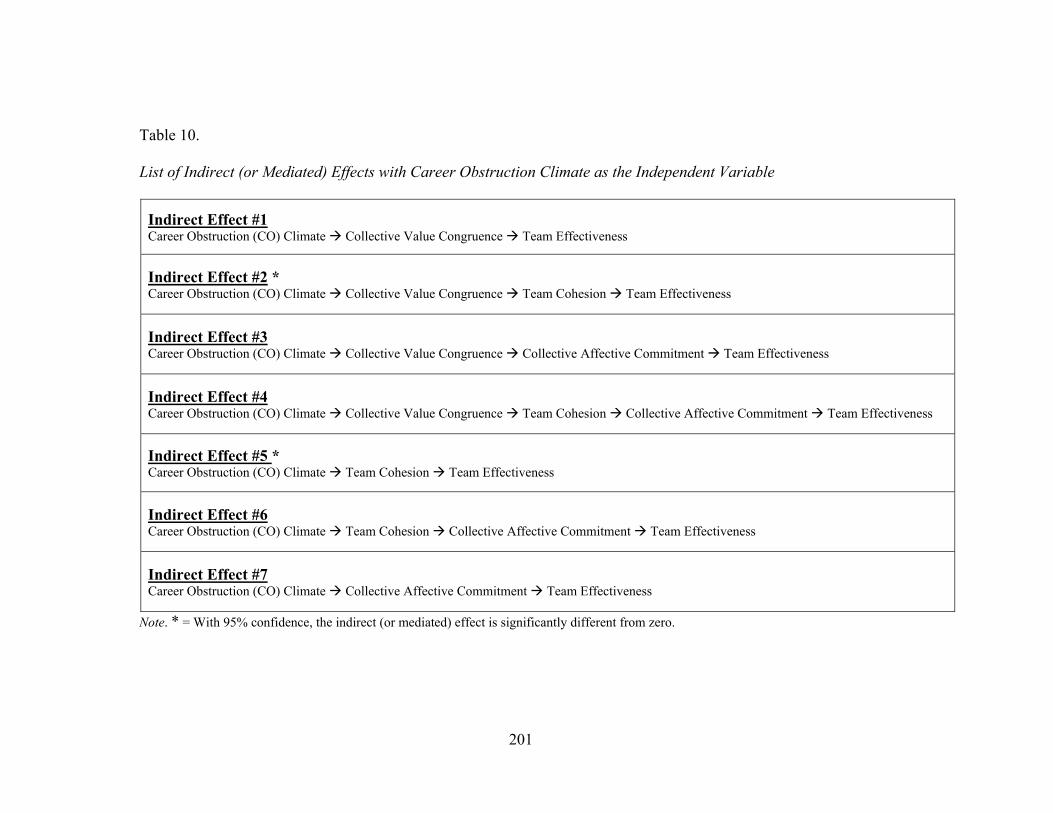
201
Table 10.
List of Indirect (or Mediated) Effects with Career Obstruction Climate as the Independent Variable
Indirect Effect #1 Career Obstruction (CO) Climate Collective Value Congruence Team Effectiveness
Indirect Effect #2 * Career Obstruction (CO) Climate Collective Value Congruence Team Cohesion Team Effectiveness
Indirect Effect #3 Career Obstruction (CO) Climate Collective Value Congruence Collective Affective Commitment Team Effectiveness
Indirect Effect #4 Career Obstruction (CO) Climate Collective Value Congruence Team Cohesion Collective Affective Commitment Team Effectiveness
Indirect Effect #5 * Career Obstruction (CO) Climate Team Cohesion Team Effectiveness
Indirect Effect #6 Career Obstruction (CO) Climate Team Cohesion Collective Affective Commitment Team Effectiveness
Indirect Effect #7 Career Obstruction (CO) Climate Collective Affective Commitment Team Effectiveness
Note. * = With 95% confidence, the indirect (or mediated) effect is significantly different from zero.
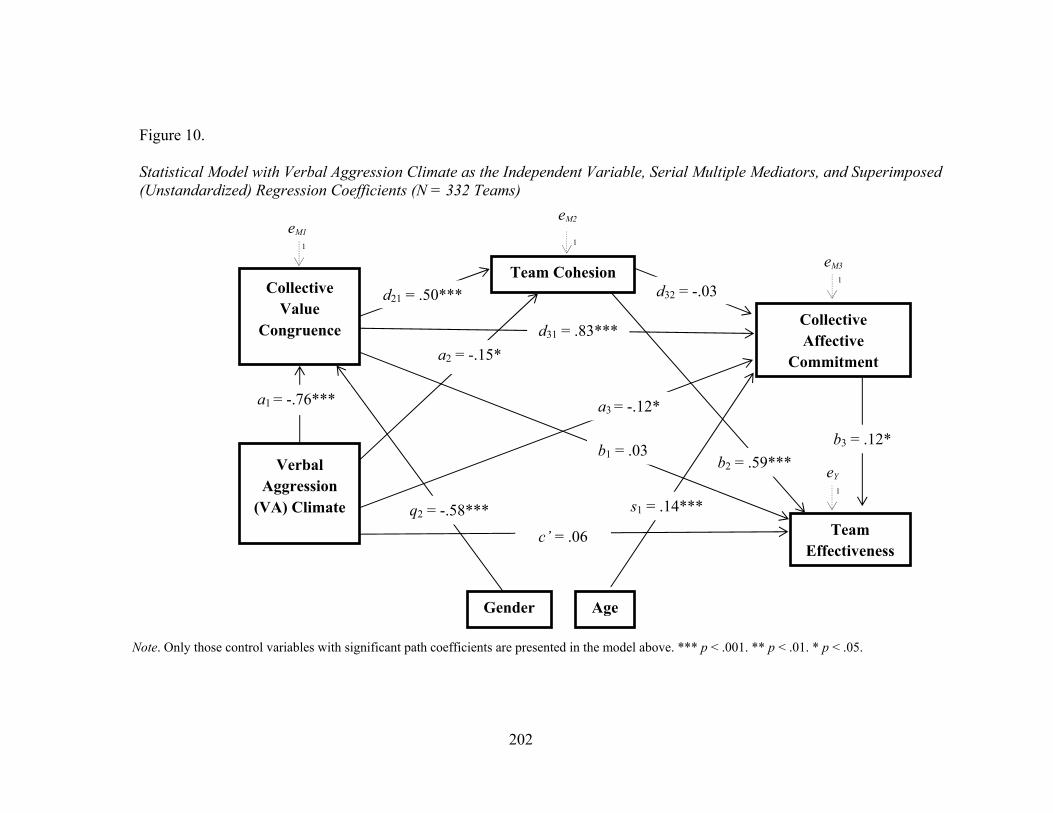
202
Figure 10. Statistical Model with Verbal Aggression Climate as the Independent Variable, Serial Multiple Mediators, and Superimposed (Unstandardized) Regression Coefficients (N = 332 Teams)
Note. Only those control variables with significant path coefficients are presented in the model above. *** p < .001. ** p < .01. * p < .05.
1 1
b3 = .12*
eM1 eM2
b1 = .03
a3 = -.12* a1 = -.76***
a2 = -.15*
Collective Value
Congruence
Team Cohesion
Collective Affective
Commitment
Team Effectiveness
c’ = .06
d21 = .50*** d32 = -.03
d31 = .83***
eM3
eY
1
1
Verbal Aggression
(VA) Climate
Age Gender
q2 = -.58*** s1 = .14***
b2 = .59***
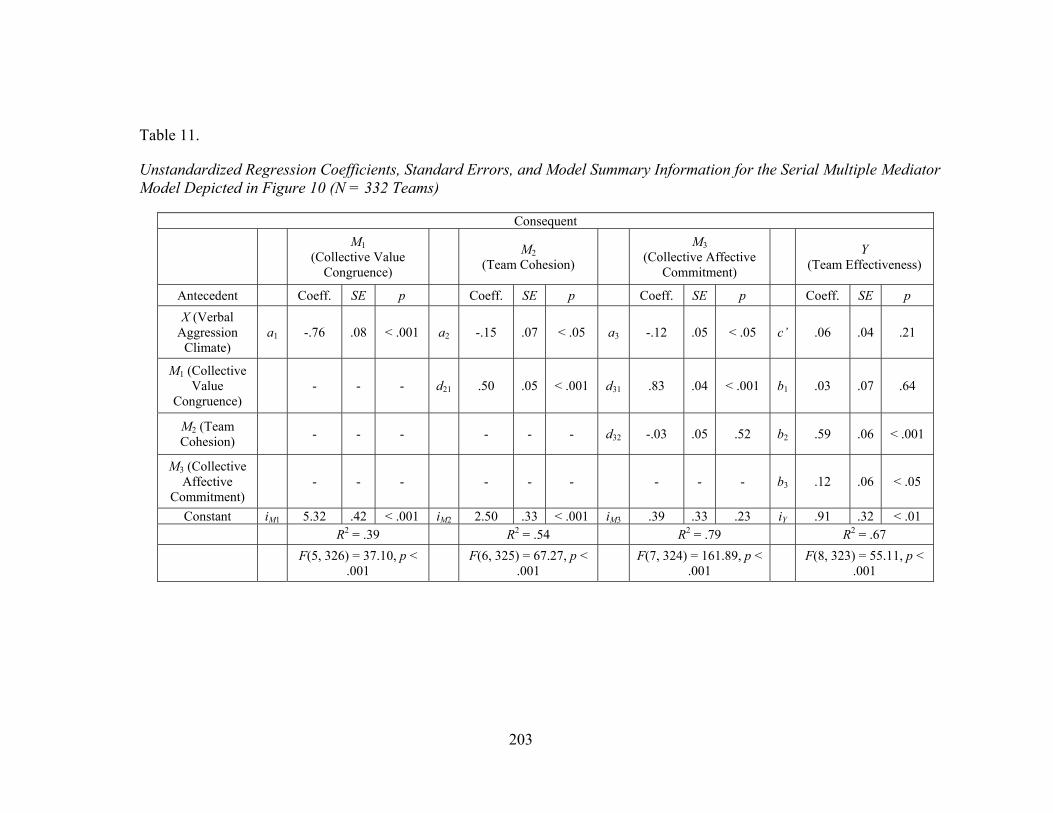
203
Table 11.
Unstandardized Regression Coefficients, Standard Errors, and Model Summary Information for the Serial Multiple Mediator Model Depicted in Figure 10 (N = 332 Teams)
Consequent
M1
(Collective Value Congruence)
M2
(Team Cohesion)
M3 (Collective Affective
Commitment)
Y (Team Effectiveness)
Antecedent Coeff. SE p Coeff. SE p Coeff. SE p Coeff. SE p
X (Verbal Aggression
Climate) a1 -.76 .08 < .001 a2 -.15 .07 < .05 a3 -.12 .05 < .05 c’ .06 .04 .21
M1 (Collective Value
Congruence) - - - d21 .50 .05 < .001 d31 .83 .04 < .001 b1 .03 .07 .64
M2 (Team Cohesion)
- - - - - - d32 -.03 .05 .52 b2 .59 .06 < .001
M3 (Collective Affective
Commitment) - - - - - - - - - b3 .12 .06 < .05
Constant iM1 5.32 .42 < .001 iM2 2.50 .33 < .001 iM3 .39 .33 .23 iY .91 .32 < .01 R2 = .39 R2 = .54 R2 = .79 R2 = .67
F(5, 326) = 37.10, p <
.001
F(6, 325) = 67.27, p < .001
F(7, 324) = 161.89, p <
.001
F(8, 323) = 55.11, p < .001
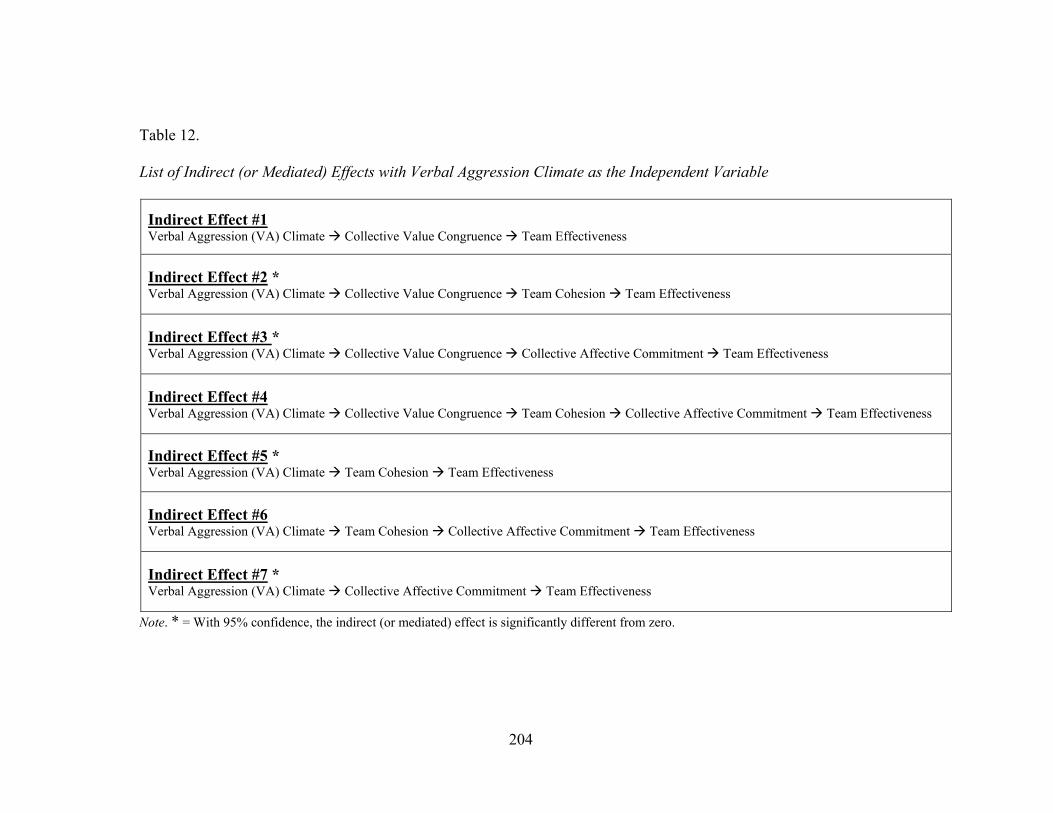
204
Table 12.
List of Indirect (or Mediated) Effects with Verbal Aggression Climate as the Independent Variable
Indirect Effect #1 Verbal Aggression (VA) Climate Collective Value Congruence Team Effectiveness
Indirect Effect #2 * Verbal Aggression (VA) Climate Collective Value Congruence Team Cohesion Team Effectiveness
Indirect Effect #3 * Verbal Aggression (VA) Climate Collective Value Congruence Collective Affective Commitment Team Effectiveness
Indirect Effect #4 Verbal Aggression (VA) Climate Collective Value Congruence Team Cohesion Collective Affective Commitment Team Effectiveness
Indirect Effect #5 * Verbal Aggression (VA) Climate Team Cohesion Team Effectiveness
Indirect Effect #6 Verbal Aggression (VA) Climate Team Cohesion Collective Affective Commitment Team Effectiveness
Indirect Effect #7 * Verbal Aggression (VA) Climate Collective Affective Commitment Team Effectiveness
Note. * = With 95% confidence, the indirect (or mediated) effect is significantly different from zero.

205
Figure 11. Statistical Model with Differential Treatment Climate as the Independent Variable, Serial Multiple Mediators, and Superimposed (Unstandardized) Regression Coefficients (N = 332 Teams)
Note. Only those control variables with significant path coefficients are presented in the model above. *** p < .001. ** p < .01. * p < .05.
1
1
s1 = .16***
a1 = -.97***
Differential Treatment
(DT) Climate
a2 = -.34***
Collective Affective
Commitment
a3 = -.14*
d31 = .84***
Collective Value
Congruence
Team Cohesion
Team Effectiveness
c’ = -.14*
b3 = .09
eM1
eM3 1
eY
1
Age Gender
q2 = -.43**
eM2
b1 = .01 q1 = .17***
d21 = .45***
b2 = .55***
d32 = -.05
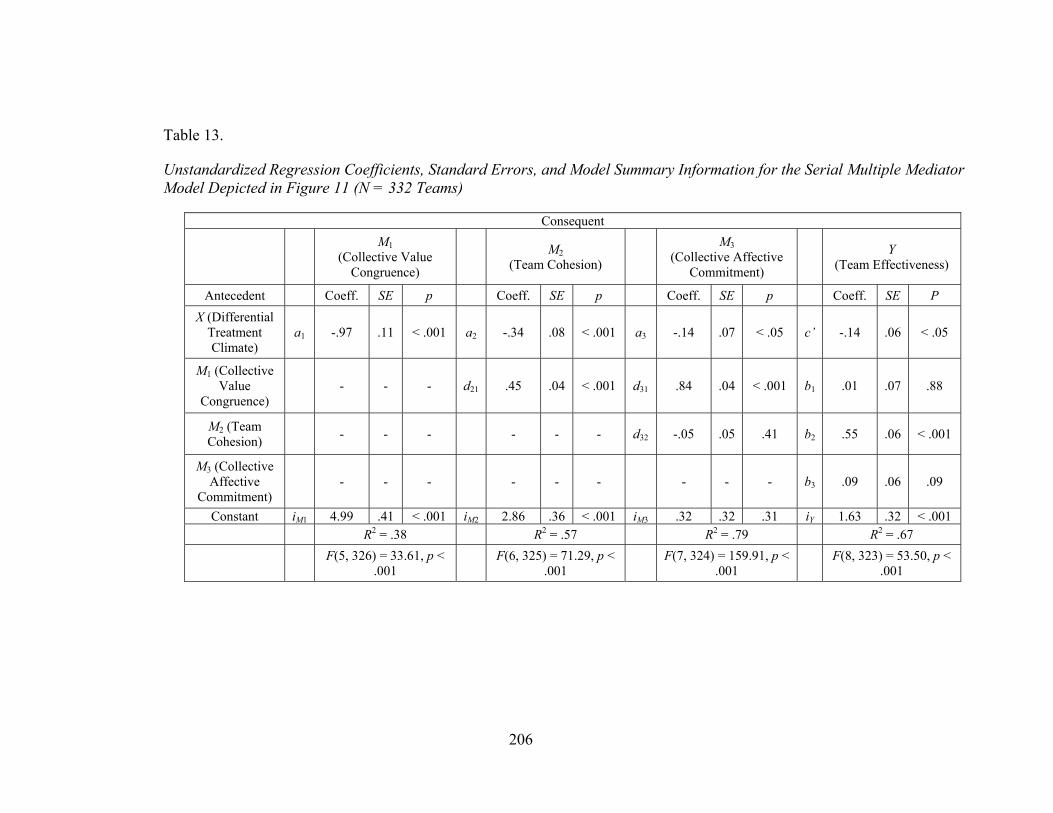
206
Table 13.
Unstandardized Regression Coefficients, Standard Errors, and Model Summary Information for the Serial Multiple Mediator Model Depicted in Figure 11 (N = 332 Teams)
Consequent
M1
(Collective Value Congruence)
M2
(Team Cohesion)
M3 (Collective Affective
Commitment)
Y (Team Effectiveness)
Antecedent Coeff. SE p Coeff. SE p Coeff. SE p Coeff. SE P
X (Differential Treatment Climate)
a1 -.97 .11 < .001 a2 -.34 .08 < .001 a3 -.14 .07 < .05 c’ -.14 .06 < .05
M1 (Collective Value
Congruence) - - - d21 .45 .04 < .001 d31 .84 .04 < .001 b1 .01 .07 .88
M2 (Team Cohesion)
- - - - - - d32 -.05 .05 .41 b2 .55 .06 < .001
M3 (Collective Affective
Commitment) - - - - - - - - - b3 .09 .06 .09
Constant iM1 4.99 .41 < .001 iM2 2.86 .36 < .001 iM3 .32 .32 .31 iY 1.63 .32 < .001 R2 = .38 R2 = .57 R2 = .79 R2 = .67
F(5, 326) = 33.61, p <
.001
F(6, 325) = 71.29, p < .001
F(7, 324) = 159.91, p <
.001
F(8, 323) = 53.50, p < .001
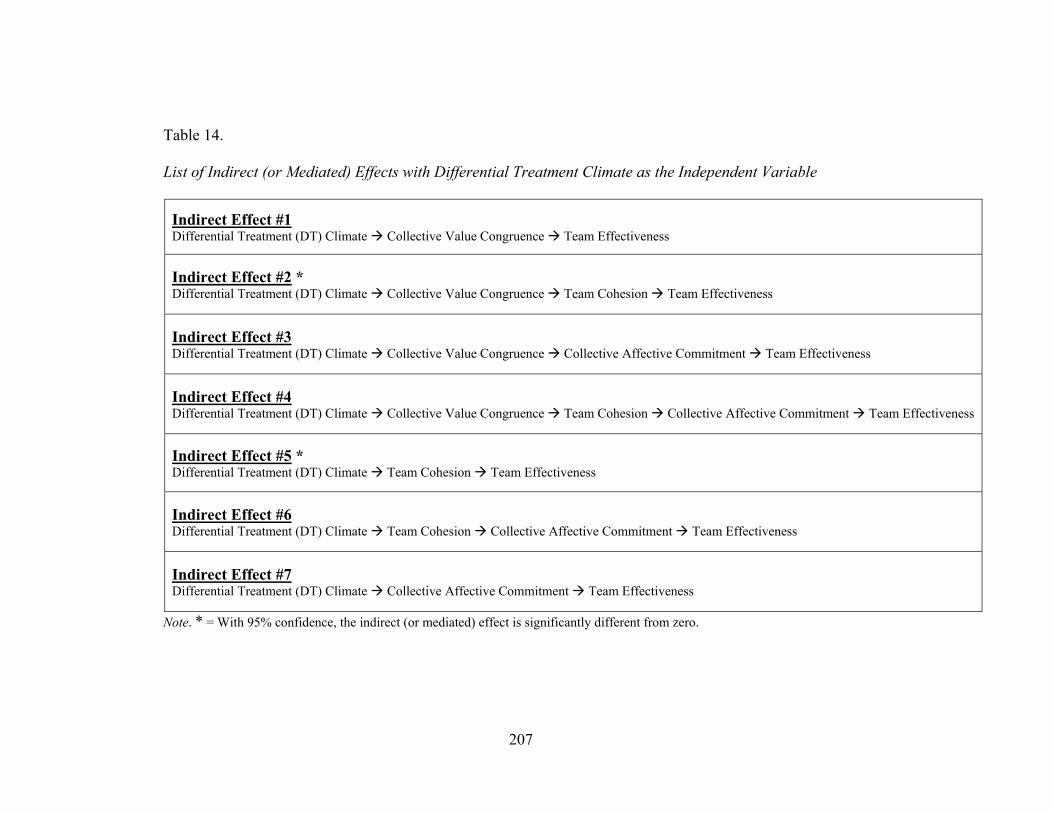
207
Table 14.
List of Indirect (or Mediated) Effects with Differential Treatment Climate as the Independent Variable
Indirect Effect #1 Differential Treatment (DT) Climate Collective Value Congruence Team Effectiveness
Indirect Effect #2 * Differential Treatment (DT) Climate Collective Value Congruence Team Cohesion Team Effectiveness
Indirect Effect #3 Differential Treatment (DT) Climate Collective Value Congruence Collective Affective Commitment Team Effectiveness
Indirect Effect #4 Differential Treatment (DT) Climate Collective Value Congruence Team Cohesion Collective Affective Commitment Team Effectiveness
Indirect Effect #5 * Differential Treatment (DT) Climate Team Cohesion Team Effectiveness
Indirect Effect #6 Differential Treatment (DT) Climate Team Cohesion Collective Affective Commitment Team Effectiveness
Indirect Effect #7 Differential Treatment (DT) Climate Collective Affective Commitment Team Effectiveness
Note. * = With 95% confidence, the indirect (or mediated) effect is significantly different from zero.
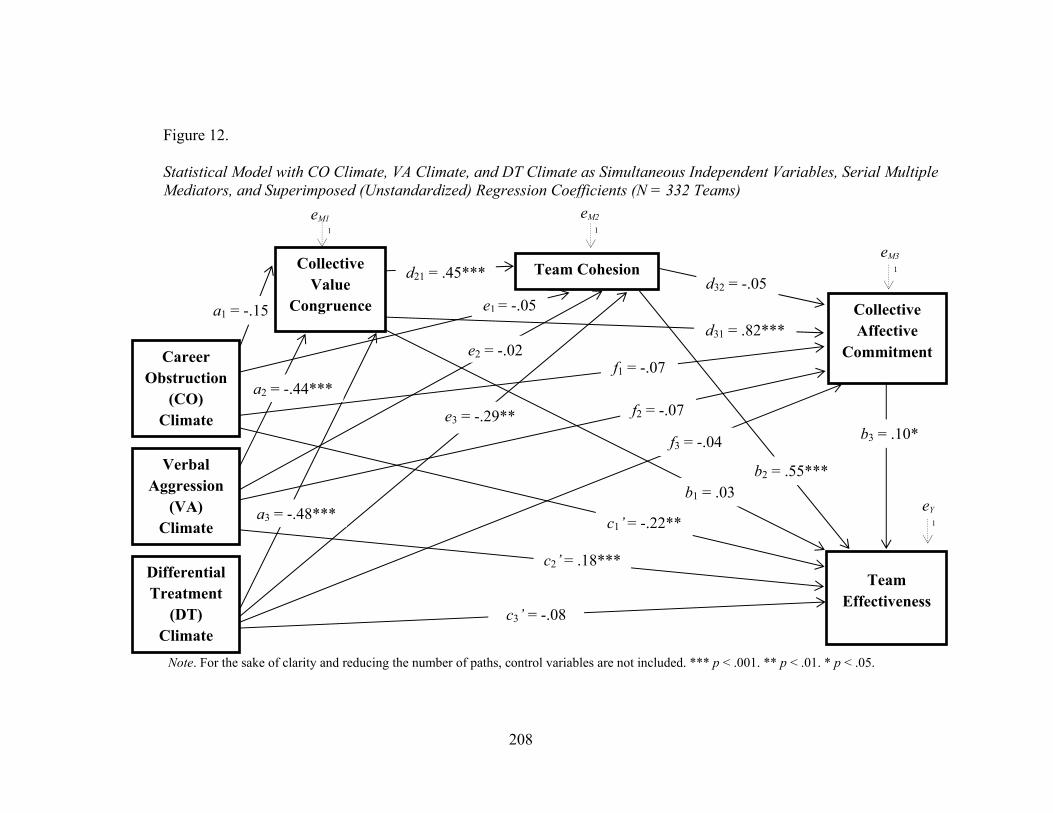
208
Figure 12. Statistical Model with CO Climate, VA Climate, and DT Climate as Simultaneous Independent Variables, Serial Multiple Mediators, and Superimposed (Unstandardized) Regression Coefficients (N = 332 Teams)
Note. For the sake of clarity and reducing the number of paths, control variables are not included. *** p < .001. ** p < .01. * p < .05.
eM2 1
Collective Affective
Commitment
Team Effectiveness
Team Cohesion
d31 = .82***
b3 = .10*
eM3
eY
1
1
Verbal Aggression
(VA) Climate
b1 = .03
Career Obstruction
(CO) Climate
Differential Treatment
(DT) Climate
eM1
d21 = .45***d32 = -.05
1
a1 = -.15 e1 = -.05
c3’ = -.08
Collective Value
Congruence
c1’ = -.22**
c2’ = .18***
f1 = -.07 a2 = -.44***
e2 = -.02
f2 = -.07
a3 = -.48***
e3 = -.29**
f3 = -.04
b2 = .55***
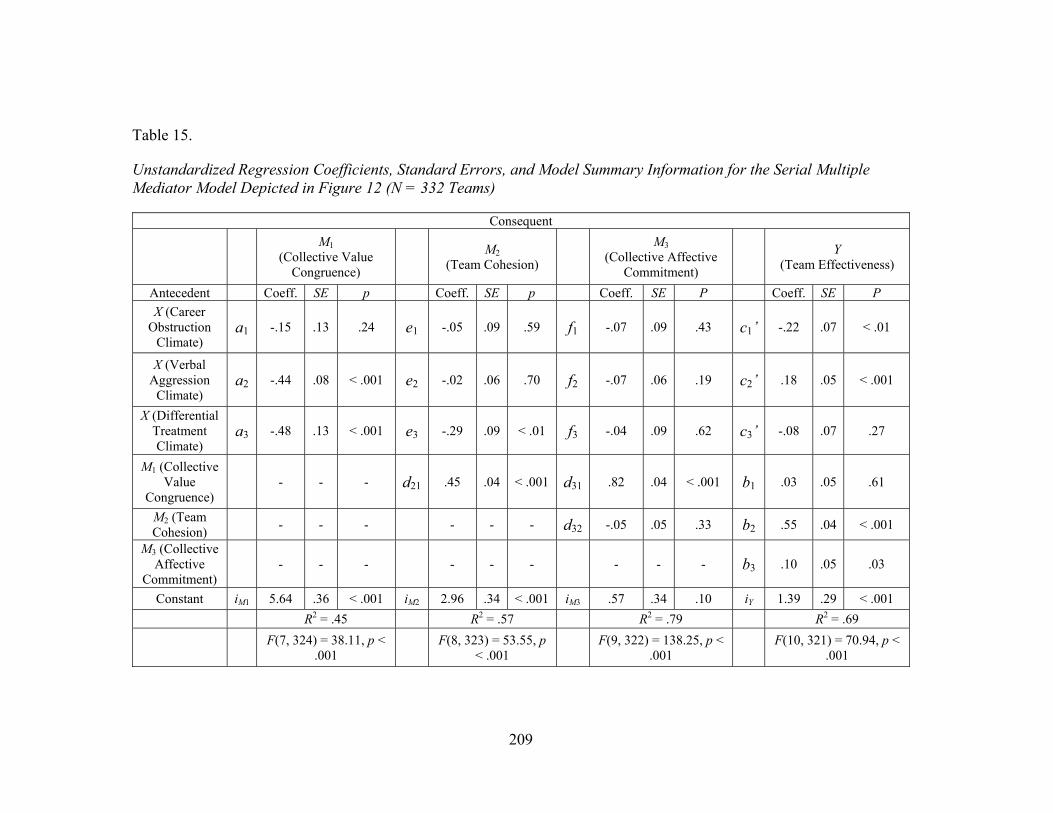
209
Table 15.
Unstandardized Regression Coefficients, Standard Errors, and Model Summary Information for the Serial Multiple Mediator Model Depicted in Figure 12 (N = 332 Teams)
Consequent
M1
(Collective Value Congruence)
M2
(Team Cohesion)
M3 (Collective Affective
Commitment)
Y (Team Effectiveness)
Antecedent Coeff. SE p Coeff. SE p Coeff. SE P Coeff. SE P
X (Career Obstruction
Climate) a1 -.15 .13 .24 e1 -.05 .09 .59 f1 -.07 .09 .43 c1’ -.22 .07 < .01
X (Verbal Aggression
Climate) a2 -.44 .08 < .001 e2 -.02 .06 .70 f2 -.07 .06 .19 c2’ .18 .05 < .001
X (Differential Treatment Climate)
a3 -.48 .13 < .001 e3 -.29 .09 < .01 f3 -.04 .09 .62 c3’ -.08 .07 .27
M1 (Collective Value
Congruence) - - - d21 .45 .04 < .001 d31 .82 .04 < .001 b1 .03 .05 .61
M2 (Team Cohesion)
- - - - - - d32 -.05 .05 .33 b2 .55 .04 < .001
M3 (Collective Affective
Commitment) - - - - - - - - - b3 .10 .05 .03
Constant iM1 5.64 .36 < .001 iM2 2.96 .34 < .001 iM3 .57 .34 .10 iY 1.39 .29 < .001
R2 = .45 R2 = .57 R2 = .79 R2 = .69
F(7, 324) = 38.11, p <
.001
F(8, 323) = 53.55, p < .001
F(9, 322) = 138.25, p <
.001
F(10, 321) = 70.94, p < .001
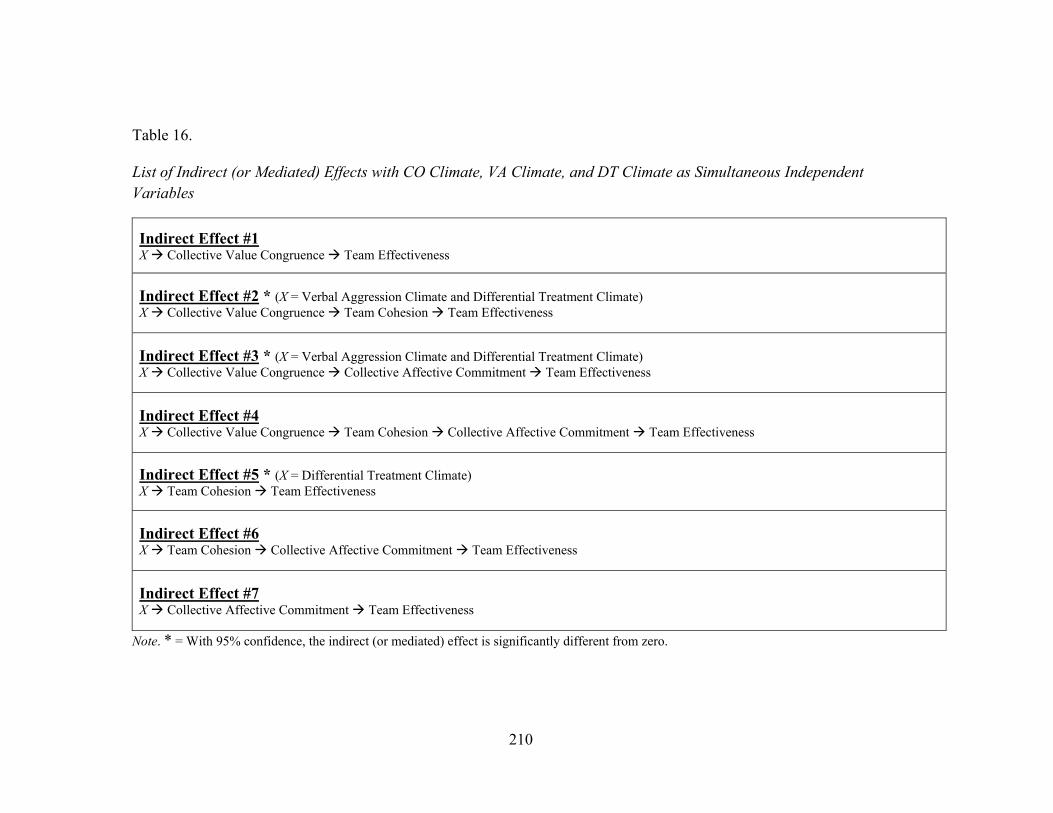
210
Table 16.
List of Indirect (or Mediated) Effects with CO Climate, VA Climate, and DT Climate as Simultaneous Independent Variables
Indirect Effect #1 X Collective Value Congruence Team Effectiveness
Indirect Effect #2 * (X = Verbal Aggression Climate and Differential Treatment Climate) X Collective Value Congruence Team Cohesion Team Effectiveness
Indirect Effect #3 * (X = Verbal Aggression Climate and Differential Treatment Climate) X Collective Value Congruence Collective Affective Commitment Team Effectiveness
Indirect Effect #4 X Collective Value Congruence Team Cohesion Collective Affective Commitment Team Effectiveness
Indirect Effect #5 * (X = Differential Treatment Climate) X Team Cohesion Team Effectiveness
Indirect Effect #6 X Team Cohesion Collective Affective Commitment Team Effectiveness
Indirect Effect #7 X Collective Affective Commitment Team Effectiveness
Note. * = With 95% confidence, the indirect (or mediated) effect is significantly different from zero.
211
VITA
ANYA T. EDUN
2007 B.A., Criminology (Major); Psychology and Business Management & Organizational Behavior (Minors) University of Miami Coral Gables, Florida
2007 - 2012 McKnight Doctoral Fellow
2010 - 2012 Graduate & Research Assistant Florida International University’s Center for Leadership Miami, Florida
2011 M.S., Industrial/Organizational Psychology Florida International University Miami, Florida
2012 - 2013 Field Trainer, Training & Development Starboard Cruise Services, Incorporated | An LVMH Moët Hennessy • Louis Vuitton Company Doral, Florida
2013 - Present Training Manager, Learning & Development Active Capital Limited | A Dart Enterprises Company Grand Cayman, Cayman Islands
2015 Ph.D., Industrial/Organizational Psychology Florida International University Miami, Florida
PUBLICATIONS AND PRESENTATIONS Michel, J. S., Pace, V. L., Edun, A., Sawhney, E., & Thomas, J. (2014). Development and validation of an explicit aggressive beliefs and attitudes scale. Journal of Personality Assessment, 96, 327-338.