Embed Size (px)
Citation preview
Bimodal sensory discrimination is finer than dual singlemodality discrimination
Department of Psychology, University College London,London, UK,
Knowledge Creating Communication Research Center,NICT, Kyoto, Japan, &
ATR Computational Neuroscience Laboratories,Kyoto, JapanAnsgar Koene
School of Psychology, The University of Queensland,St. Lucia, Queensland, AustraliaDerek Arnold
Departments of Psychology and Complex,University College London, London, U.KAlan Johnston
Here we show that discriminating between different signal modulation rates can be easier when stimuli are presented in twomodalities (vision and audition) rather than just one. This was true even when the single modality signal was repeated. Thisfacilitation did not require simultaneous presentations in both modalities and therefore cannot rely on sensory fusion. Signaldetection threshold for bimodal signals and double single modality signals were found to be equivalent indicating that thedouble single modality signals were not intrinsically noisier. The lack of facilitation in double single modality conditions wasnot due to inaccessibility of the first sample because there is no performance difference when noise was added to either thefirst or second samples. We propose that the bimodal signal discrimination advantage arises from fluctuations in themagnitude of sensory noise over time and because observers select the most reliable modality on a trial by trial basis. Noiselevels within repeated single modality trials are more likely to be similar than those within signals from different modalities.As a consequence, signal selection would be less effective in the former circumstances. Overall, our findings illustrate theadvantage of using separate sensory channels to achieve reliable information processing.
Keywords: bimodal, signal discrimination, optimal cue integration, audio, visual
Citation: Koene, A., Arnold, D., & Johnston, A. (2007). Bimodal sensory discrimination is finer than dual single modalitydiscrimination. Journal of Vision, 7(11):14, 1–11, http://journalofvision.org/7/11/14/, doi:10.1167/7.11.14.
Introduction
Many environmental events generate correspondingsignals in multiple modalities. For instance, a passinghoneybee provides an audiovisual signal that indicatesboth its location and direction of movement. Integration ofinformation from multiple modalities can therefore poten-tially enhance the precision and accuracy of our sensoryperception.Cross modal interaction can also qualitatively alter
stimulus appearance, as in the double flash illusion wheretwo auditory tones heard around the same time as a singleflash can create the subjective impression of a double visualflash (Shams, Kamitani, & Shimojo, 2000, 2002; Violentyev,Shimojo, & Shams, 2005). The temporal window forthese audiovisual interactions has been estimated as beingapproximately 100 ms (Shams et al., 2002). However, theexact size of the temporal window for multisensoryintegration is likely to be stimulus specific because it hasbeen shown that subjects are unable to detect stimulus
onset asynchrony for audiovisual stimulus pairs thatare presented within 21 ms in the case of sound beforelight and within 150 ms for light before sound (Stoneet al., 2001).Audio beeps can also influence the number of reported
tactile taps (Bresciani et al., 2005). This cross modalmodulating affect of audition on tactile perception isreduced when the stimuli in the two modalities arepresented asynchronously, implying that audio and tactilesignals are only combined if they are likely to begenerated by the same stimulus. Similarly, Bresciani,Dammeier, and Ernst (2006) have found that altering thenumbers of flashes can bias the number of taps reportedand vice versa. The strength of this effect depends on thereliability of the signals in the two modalities. However,in these counting experiments, it can be difficult todistinguish a perceptual bias from a response bias.In the ventriloquist effect, sound is typically mislocated
in the direction of a visual stimulus (Alais & Burr, 2004;Battaglia, Jacobs, & Aslin, 2003; Bertelson, Vroomen, deGelder, & Driver, 2000; Vroomen, Bertelson, & de
Journal of Vision (2007) 7(11):14, 1–11 http://journalofvision.org/7/11/14/ 1
doi: 10 .1167 /7 .11 .14 Received September 7, 2006; published August 31, 2007 ISSN 1534-7362 * ARVO
Gelder, 2001). This effect relies on the fact that visionusually provides a more reliable cue to position thanaudition. Alais and Burr (2004) have shown that theapparent location of a discrepant audiovisual targetdepends on the sum of the audio and the visual locationsweighted by the reliability of each signal. This reliability-based weighted summations rule, previously described forother mixed modality tasks (Ernst & Banks, 2002), canalso increase sensitivity. For instance, Hillis, Ernst, Banks,and Landy (2002) found that bimodal stimulus discrim-ination was better than single modality discrimination forvisual and haptic information, as would be predicted froma maximum likelihood strategy in which independentestimates are weighted in inverse proportion to thevariance of the estimates (Ernst, 2006; Hillis et al.,2002; Landy, Maloney, Johnston, & Young, 1995; Yuille& Buelthoff, 1996). Bresciani et al. (2006) have alsoshown that the judgments of the number of stimulipresented can be more reliable when two modalitiesprovided the same information compared to just one.However, this advantage was only significant whensubjects reported on the tactile cueVthe more reliable cue.Improvements in sensory discrimination can provide
reliable evidence of optimal cue combination, even insituations when the signals carry equal value and are equallydiscriminable. However, if we simply compare bimodalstimuli with singlemodality cues, the bimodal benefits couldbe attributed to differences in the amount of informationprovided. We therefore decided to compare bimodalpresentation against both single modality cues and doublesingle modality cues. This necessitates the additional controlof sequential as well as simultaneous bimodal presentations.This manipulation also allowed us to test whether anybenefits in discrimination depend on stimulus simultaneity.We chose to investigate how audio and visual percep-
tual cues are combined to detect and to judge differencesin an amodal stimulus property, temporal frequency. Wefirst compared bimodal and repeated unimodal conditionsin a signal detection task to determine whether there wasany evidence of effective summation of the bimodal signalsat threshold, which would be indicative of sensory fusion.Judgments were based on (1) single visual or (2) auditorystimuli, (3) simultaneous or (4) sequential audiovisualstimuli, and (5) repeated visual or (6) auditory stimuli. The(1) single visual and (2) single auditory stimulus conditionsprovided baseline performance data.
Experiment 1: Signal detection
The signal detection experiment measured the signal tonoise ratios at which subjects are able to detect thepresence of a periodic (10 Hz) amplitude/intensitymodulation embedded in band-limited white noise. Ifbimodal facilitation of signal detection requires perceptualfusion, this facilitation should occur only in the simultaneous
bimodal condition (Condition 3). If, on the other hand,bimodal facilitation of signal detection is simply a con-sequence of an increase in stimulus information, then wepredict that both bimodal conditions (Conditions 3 and 4)as well as the repeated unimodal conditions (Conditions 5and 6) should show the same facilitation. We thereforecompared signal detection performance in the bimodalconditions (Conditions 3 and 4) and in the repeatedunimodal conditions (Conditions 5 and 6) against thebaseline performances (Conditions 1 and 2) and perfor-mance predicted on the basis of “probability summation”(Macmillan & Creelman, 2005).
MethodParticipants
Participants were one of the authors and three paidvolunteers who were naive as to the purpose of theexperiment. All had normal or corrected-to-normal visionand normal hearing.
Apparatus and stimuli
Visual stimuli were presented on a 19W. SONY TrinitronMultiscan 500PS monitor (160 Hz frame rate) and weregenerated using a Cambridge Systems VSG card con-trolled with Matlab 6 (the MathWorks) running on aPentium 4 PC with Windows 2000 operating system.Auditory stimuli were generated using a Tucker DavisTechnologies (TDT) RP2.1 Enhanced Real-Time Pro-cessor. For the simultaneous bimodal condition, onsettimes of the auditory and the visual stimuli weresynchronized using trigger outputs from the VSG card.Responses were given by means of a Cambridge SystemsCB3 experiment response box. The participant sat in aquiet room 57 cm from the stimulus monitor withbackground illumination. The visual stimulus consistedof a single luminance-modulated Gaussian blob (SD: 5-)in the center of a black screen with a central bull’s-eyefixation point (diameter: 0.2-) superimposed (Figure 1A).The luminance increment of the blob was temporallymodulated between 0 and È5 cd/m2. A Gaussian blobmodulated at 10 Hz provides a strong visual signal (Kelly,1979). Participants were instructed to maintain fixation atthe fixation point.The auditory stimulus was a 3-kHz tone diotically
presented via headphones (Sennheiser HDA 200) with asampling frequency of 24420 Hz. The amplitude of theauditory tone was modulated in time (56 dB soundpressure level [SPL] at the peak of modulation).All stimulus waveforms were amplitude modulated by a
temporal Gaussian envelope (A = 0.28 s) to avoid suddensignal onset effects. The amplitude/luminance of the audioand the visual test stimuli was sinusoidally modulated at arate of 10 Hz (Figure 1B). The S/N of the test stimuluswas adjusted by adding band-limited (Fc = 10 Hz, Bw =
Journal of Vision (2007) 7(11):14, 1–11 Koene, Arnold, & Johnston 2
5 Hz) white noise (Figure 1D). The same type of noisewas used for the “noise-only” comparison stimulus(Figure 1C). The noise for both signals was independentlysampled. A single stimulus presentation lasted 2.5 s.
Procedure
We used a two-interval forced-choice design. For the“unimodal single presentation” and the “simultaneousbimodal” conditions, subjects were presented with the testsignal (noise +10 Hz modulation) once per trial. This waseither preceded or followed by a single presentation of the“noise-only” stimulus. For the “unimodal repeated pre-sentation,” the test and the “noise only” stimuli werepresented twice (immediate repetition with independentnoise in both presentations) before the other stimuli werepresented. The “sequential bimodal” condition followedthe same procedure as the “repeated unimodal” conditionsexcept that the stimulus repetition was in a differentmodality. The order of audio and visual modalitypresentation was randomized. At the end of each trialsubjects indicated, by means of a button press, whichinterval contained the 10-Hz amplitude modulation.Using a blocked design, we first determined detection
thresholds for the audio and the visual “unimodal singlepresentation” conditions (randomly mixed blocks) usingthe method of constant stimuli with six different S/N
values (vision: 0.2, 0.4, 0.6, 0.8, 1, and 1.2; sound: 0.04,0.06, 0.08, 0.1, 0.12, and 0.14, where S/N is defined asamplitude of sinusoidal signal component divided by peakamplitude of noise signal component). Each S/N level wasrepeated on 10 trials per session in a random mixed orderwith six sessions per condition. Detection thresholds weredefined as the S/N for which observers gave 75% correctresponses (determined using maximum likelihood Weibullfunction fits).Subsequently, the simultaneous and the sequential
bimodal conditions, as well as the “repeated unimodal”audio and the visual conditions, were tested in randomlymixed blocks. The S/N values for the test signals in thebimodal and the “repeated unimodal” conditions werechosen from 12.5%, 25%, 50%, 75%, 100%, 125%, and150% of the detection thresholds for the “unimodal singlepresentation” conditions (Figure 2A). Because the S/N forthe audio and the visual stimuli in the bimodal conditionsare independent variables, there is a two-dimensionalparameter space. Our goal was only to establish if signaldetection performance for bimodal stimuli requires sen-sory fusion of the audio and the visual stimuli into apercept of a single event and, if not, whether repeatedunimodal stimulation will achieve the same degree offacilitation as bimodal stimulation does. We thereforeconfined our experiment to stimuli with S/N for theauditory and the visual modalities that were equal
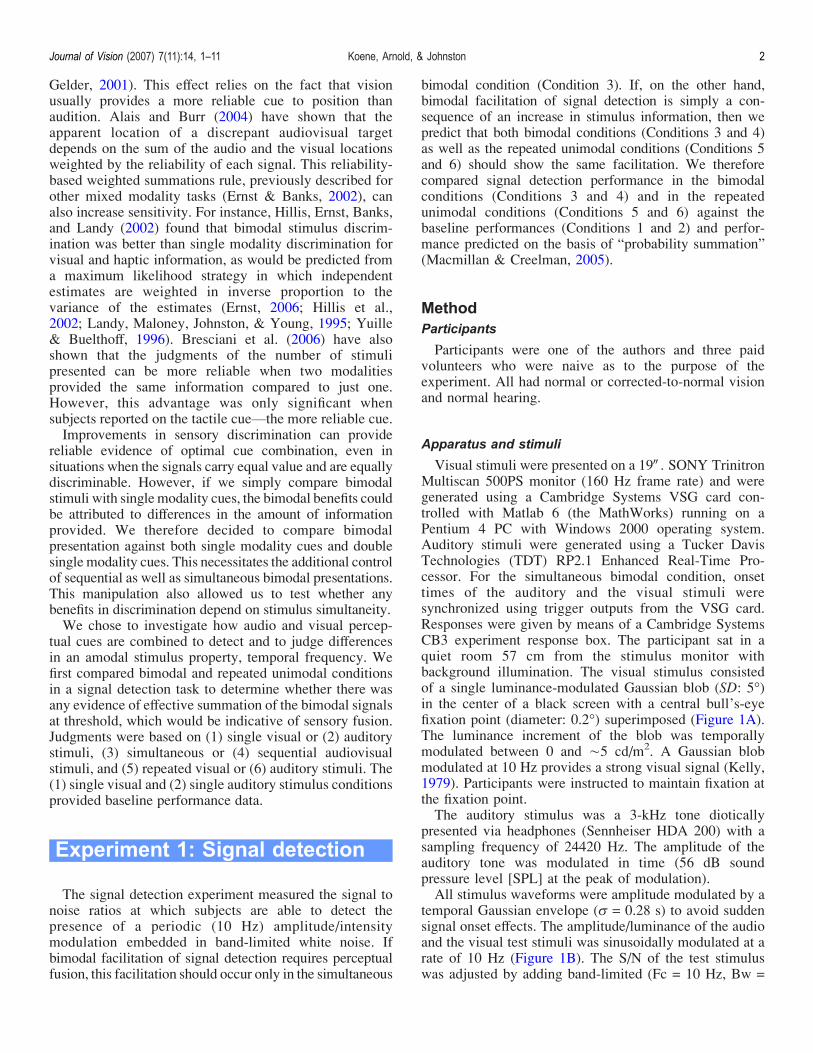
Figure 1. Panel A shows a schematic snapshot of the visual stimulus. Panels B, C, and D illustrate the temporal amplitude/intensitymodulation of the audio and the visual stimuli (time on the X-axis and sound amplitude/light intensity on the Y-axis). Panel B shows thewaveform of the 10-Hz reference signal. Panel C illustrates the waveform of the band-limited white noise used as the ‘noise-only’comparison stimulus. Panel D illustrates the waveform of the test stimuli (i.e., D = BV+ CV, where BVis of type B with a different oscillationfrequency and CVis of type C with independent random fluctuations).
Journal of Vision (2007) 7(11):14, 1–11 Koene, Arnold, & Johnston 3
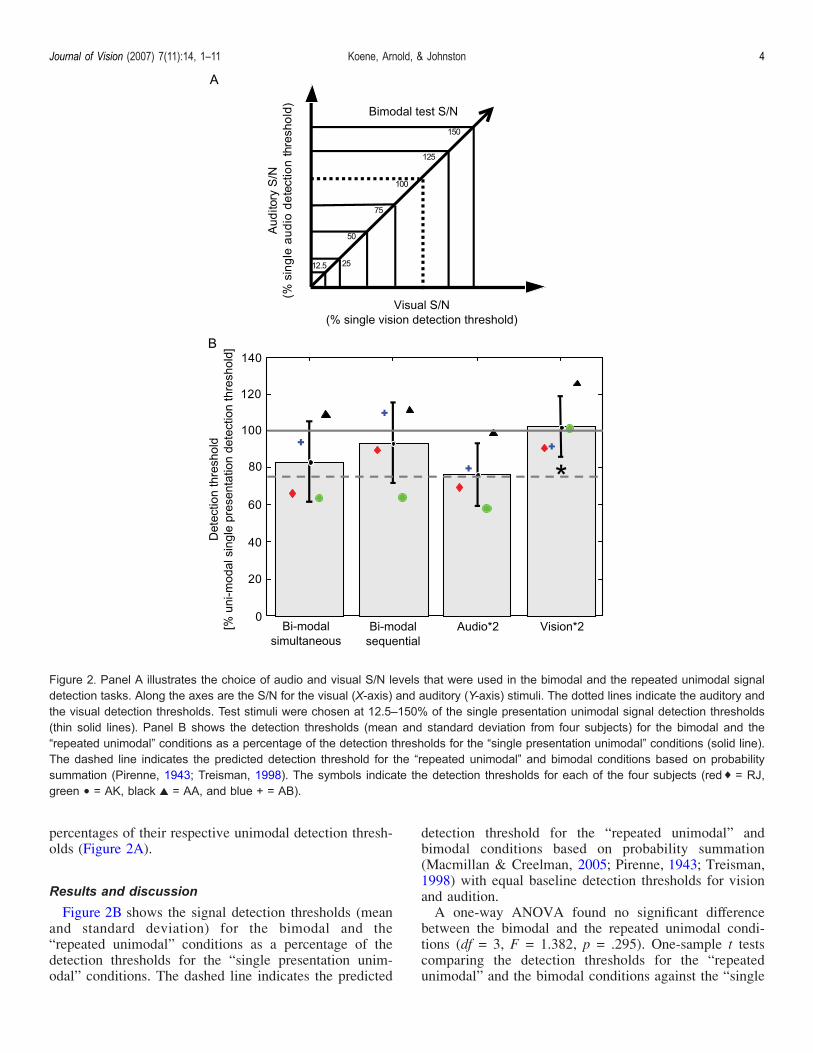
percentages of their respective unimodal detection thresh-olds (Figure 2A).
Results and discussion
Figure 2B shows the signal detection thresholds (meanand standard deviation) for the bimodal and the“repeated unimodal” conditions as a percentage of thedetection thresholds for the “single presentation unim-odal” conditions. The dashed line indicates the predicted
detection threshold for the “repeated unimodal” andbimodal conditions based on probability summation(Macmillan & Creelman, 2005; Pirenne, 1943; Treisman,1998) with equal baseline detection thresholds for visionand audition.A one-way ANOVA found no significant difference
between the bimodal and the repeated unimodal condi-tions (df = 3, F = 1.382, p = .295). One-sample t testscomparing the detection thresholds for the “repeatedunimodal” and the bimodal conditions against the “single
Figure 2. Panel A illustrates the choice of audio and visual S/N levels that were used in the bimodal and the repeated unimodal signaldetection tasks. Along the axes are the S/N for the visual (X-axis) and auditory (Y-axis) stimuli. The dotted lines indicate the auditory andthe visual detection thresholds. Test stimuli were chosen at 12.5–150% of the single presentation unimodal signal detection thresholds(thin solid lines). Panel B shows the detection thresholds (mean and standard deviation from four subjects) for the bimodal and the“repeated unimodal” conditions as a percentage of the detection thresholds for the “single presentation unimodal” conditions (solid line).The dashed line indicates the predicted detection threshold for the “repeated unimodal” and bimodal conditions based on probabilitysummation (Pirenne, 1943; Treisman, 1998). The symbols indicate the detection thresholds for each of the four subjects (red 0 = RJ,green & = AK, black r = AA, and blue + = AB).
Journal of Vision (2007) 7(11):14, 1–11 Koene, Arnold, & Johnston 4
presentation unimodal” detection thresholds (solid line at100%) found no significant differences (bimodal simulta-neous: df = 3, t = 1.548, p = .219; bimodal sequential: df = 3,t = 0.594, p = .594; repeated unimodal audio: df = 3, t =2.745, p = .071; repeated unimodal vision: df = 3, t = 0.286,p = .794). Comparison against the prediction from proba-bility summation only showed a significant difference forthe “repeated unimodal vision” condition (bimodal simul-taneous: df = 3, t = 0.756, p = .505; bimodal sequential:df = 3, t = 1.7, p = .188; repeated unimodal audio: df = 3,t = 0.164, p = .88; repeated unimodal vision: df = 3, t =3.371, p = .043).Signal detection performance was somewhere between
that predicted by probability summation and the perfor-mance of a single presentation in either of the twomodalities (Treisman, 1998).The results of our signal detection experiment showed
no clear difference between either of the bimodalconditions (Conditions 3 and 4) or between the bimodaland the repeated unimodal conditions (Conditions 5 and 6).There was therefore no evidence of sensory signalsummation because there were no benefits in the bimodalsimultaneous case over the other conditions that could notbe accounted for by probability summation.From the results of Experiment 1, we can conclude that,
in this context, the provision of a multisensory audiovisualsignal did not aid 10 Hz signal detection relative torepeated audio or repeated visual signal presentations.However, it has been previously shown that the combina-tion of audio and visual signals can facilitate discrim-ination for superthreshold signals (Alais & Burr, 2004).We therefore decided to examine discriminations betweendiffering superthreshold temporal frequency signals.
Experiment 2: Signaldiscrimination with equalizedunimodal performance
In this signal discrimination experiment, we measuredtemporal frequency discrimination thresholds for ampli-tude/luminance intensity modulations of a periodic audio/visual signal, with respect to a reference modulation rateof 10 Hz. If bimodal facilitation of signal discriminationrequires perceptual fusion, we predict that this facilitationshould occur only in the simultaneous bimodal condition(Condition 3). If, on the other hand, bimodal facilitation issimply a consequence of an increase in stimulus informa-tion, we predict that both bimodal conditions (Conditions3 and 4), as well as the repeated unimodal conditions(Conditions 5 and 6), should show the same facilitation.We therefore compared signal discrimination performancein the bimodal conditions (Conditions 3 and 4), therepeated unimodal conditions (Conditions 5 and 6), and
the baseline performances (Conditions 1 and 2) in additionto performance predicted by maximum likelihood optimalcue combination (Ernst & Banks 2002; Landy et al., 1995;Yuille & Buelthoff, 1996).
MethodParticipants
Participants were two of the authors and two volunteerswho were practiced observers but were naive as to thepurpose of the experiment. All had normal or corrected-to-normal vision and normal hearing. Informed consentwas obtained after the nature and the possible consequen-ces of the study were explained.
Apparatus and stimuli
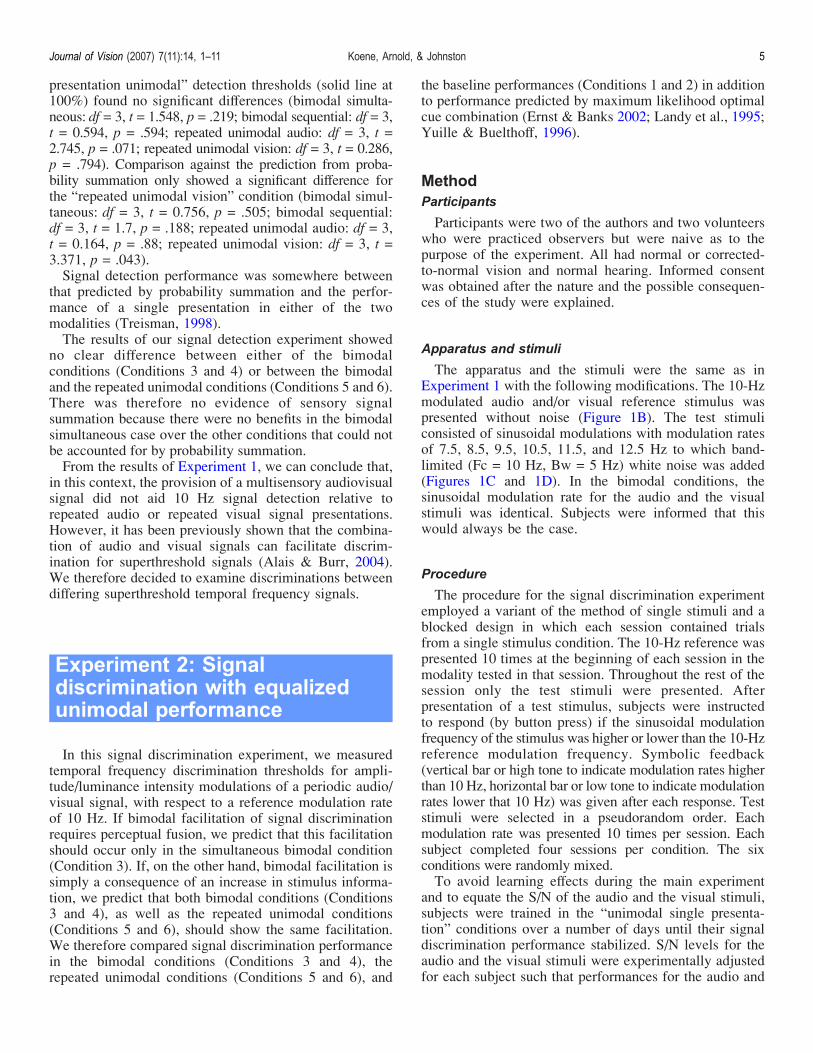
The apparatus and the stimuli were the same as inExperiment 1 with the following modifications. The 10-Hzmodulated audio and/or visual reference stimulus waspresented without noise (Figure 1B). The test stimuliconsisted of sinusoidal modulations with modulation ratesof 7.5, 8.5, 9.5, 10.5, 11.5, and 12.5 Hz to which band-limited (Fc = 10 Hz, Bw = 5 Hz) white noise was added(Figures 1C and 1D). In the bimodal conditions, thesinusoidal modulation rate for the audio and the visualstimuli was identical. Subjects were informed that thiswould always be the case.
Procedure
The procedure for the signal discrimination experimentemployed a variant of the method of single stimuli and ablocked design in which each session contained trialsfrom a single stimulus condition. The 10-Hz reference waspresented 10 times at the beginning of each session in themodality tested in that session. Throughout the rest of thesession only the test stimuli were presented. Afterpresentation of a test stimulus, subjects were instructedto respond (by button press) if the sinusoidal modulationfrequency of the stimulus was higher or lower than the 10-Hzreference modulation frequency. Symbolic feedback(vertical bar or high tone to indicate modulation rates higherthan 10 Hz, horizontal bar or low tone to indicate modulationrates lower that 10 Hz) was given after each response. Teststimuli were selected in a pseudorandom order. Eachmodulation rate was presented 10 times per session. Eachsubject completed four sessions per condition. The sixconditions were randomly mixed.To avoid learning effects during the main experiment
and to equate the S/N of the audio and the visual stimuli,subjects were trained in the “unimodal single presenta-tion” conditions over a number of days until their signaldiscrimination performance stabilized. S/N levels for theaudio and the visual stimuli were experimentally adjustedfor each subject such that performances for the audio and
Journal of Vision (2007) 7(11):14, 1–11 Koene, Arnold, & Johnston 5
the visual “unimodal single presentation” conditions wereapproximately equal and in a range where any possiblebimodal facilitation effects would be detectable. Oncethese S/Ns were established, they remained constantthroughout the experiment.Psychometric functions were fitted using the maximum-
likelihood Probit-function fitting procedure adapted from
David Foster’s bootstrap program (Foster & Bischof,1987) with 40 measurements per data point.
Results and discussion
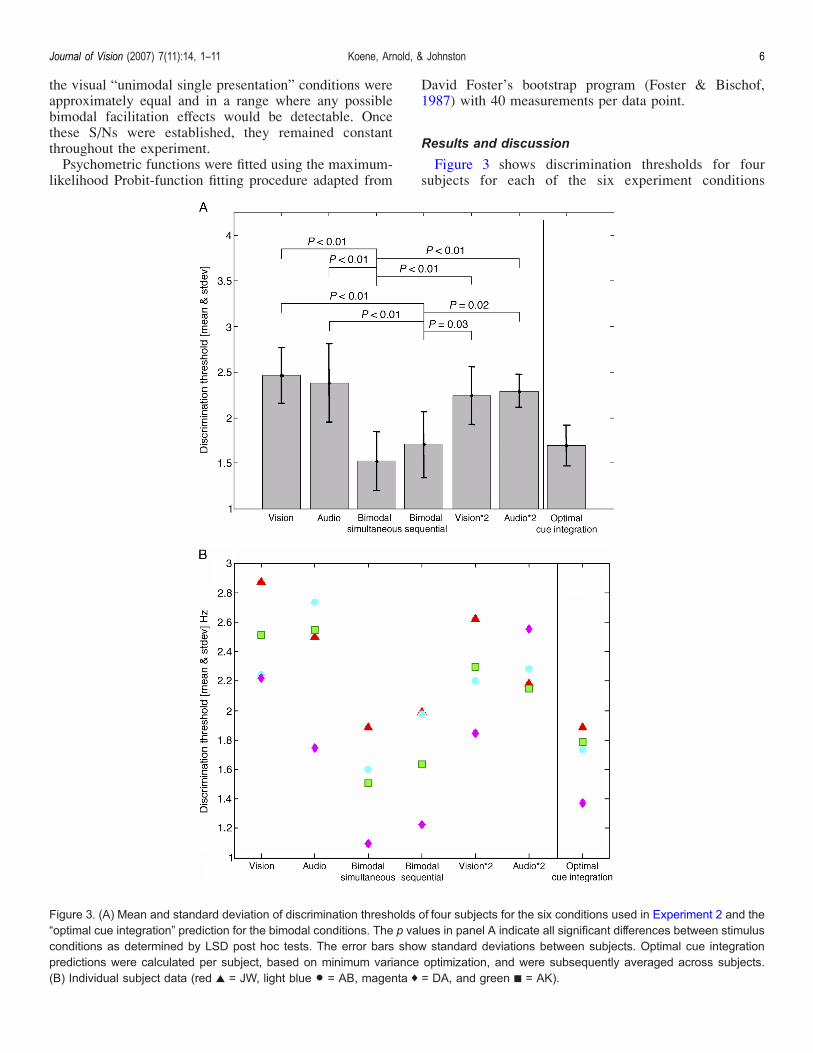
Figure 3 shows discrimination thresholds for foursubjects for each of the six experiment conditions
Figure 3. (A) Mean and standard deviation of discrimination thresholds of four subjects for the six conditions used in Experiment 2 and the“optimal cue integration” prediction for the bimodal conditions. The p values in panel A indicate all significant differences between stimulusconditions as determined by LSD post hoc tests. The error bars show standard deviations between subjects. Optimal cue integrationpredictions were calculated per subject, based on minimum variance optimization, and were subsequently averaged across subjects.(B) Individual subject data (red r = JW, light blue & = AB, magenta 0 = DA, and green h = AK).
Journal of Vision (2007) 7(11):14, 1–11 Koene, Arnold, & Johnston 6
(Figure 3A: mean data; Figure 3B: individual data). Aone-way ANOVA showed a significant effect of exper-imental condition across subjects (N = 4, df = 5, F =5.553, p = .003). LSD post hoc tests (see Figure 3A)revealed a significant difference between bimodal con-ditions versus unimodal conditions, but no significantdifferences between sequential and simultaneous bimodalconditions or between unimodal single and repeatedpresentation conditions. There was no significant differ-ence between the unimodal audio and the visualconditions.The reduced discrimination threshold in the simulta-
neous bimodal condition indicates that observers are ableto take advantage of the signals in both modalities whenpresented at the same time, confirming previous findingsin conditions where perceptual sensory fusion can occur.However, the reduced discrimination threshold in thesequential bimodal condition indicates that the facilitationfor bimodal stimuli does not require sensory fusion.Sensory information from multiple modalities can betapped to facilitate discrimination of amodal signalproperties, such as temporal modulation frequency, evenover an extended period of time. This bimodal facilitationof signal discrimination is consistent with predictions foroptimal cue combination (Ernst & Banks, 2002). Note thatthe optimal prediction for within-modal and intermodaltasks is the same here because single presentation audioand single presentation visual performances were equated.The optimal prediction is therefore the single presentationdiscrimination threshold divided by ¾2.1
The lack of significant facilitation for the “unimodalrepeated presentation” conditions, relative to the “singlepresentation conditions,” raises the question of whyobservers were unable to take advantage of the extrainformation provided by the unimodal stimulus repeti-tions. It is possible that, because both stimuli were in thesame modality, the second stimulus presentation may haveinterfered with recollection of the first. Alternatively,some kind of adaptation induced by the first stimuluspresentation may have interfered with the full utilizationof the second. To test these possibilities, we performed asecond signal discrimination experiment aimed at deter-mining if both the first and the second stimulus presenta-tions were fully accessible to subjects during the bimodalsequential and the repeated unimodal trials.
Experiment 3: Signaldiscrimination with different S/Nfor first and second stimulus
We tested if subjects were able to utilize the informa-tion in both the first and the second stimulus presentations
by using different S/Ns for the first and the second stimuliwithin a trial. If subjects are only able to use theinformation from the first stimulus presentation, perfor-mance should be best when the S/N is high in the firststimulus presentation and low in the second. Conversely,if subjects are only able to use the information from thesecond presentation, performance should be best when theS/N is low in the first stimulus presentation and high inthe second. If, however, performances in the “low S/N first”and “high S/N first” cases are not significantly different,then there would be no evidence for an informationbottleneck limiting the use of information in eitherstimulus presentation.
MethodParticipants
There were two participants, one of the authors and avolunteer who was naive as to the purpose of theexperiment. Both subjects had previously participated inExperiments 1 and 2.
Apparatus and stimuli
The apparatus and the stimuli were the same as inExperiment 2 with the following modifications: “high S/N”stimuli had the same noise amplitudes that had been usedfor these subjects in Experiment 2; “low S/N” stimuli hadnoise amplitudes È1 order of magnitude greater. This wassimply achieved by introducing a proportional change inthe amplitude of the added noise.
Procedure
The experimental procedure was the same as in Experi-ment 2, with the exception that the first and the secondstimulus in the repeated unimodal and the sequentialbimodal conditions had different S/N levels. The simulta-neous bimodal condition was not tested because we wereinterested in temporal sequence effects. The four unimodalsingle presentation conditions (audio “high S/N,” audio“low S/N,” vision “high S/N,” and vision “low S/N”) weretested in random order prior to testing the bimodal and the“repeated unimodal” conditions.Once the baseline measures were completed, the two
“sequential bimodal” conditions (“first high S/N” fol-lowed by “low S/N” presentation and “first low S/N”followed by “high S/N” presentation) and the four“repeated unimodal” conditions (“first high S/N” followedby “low S/N” presentation and “first low S/N” followedby “high S/N” presentation for audio and vision) weretested in randomized blocks. Each session consisted of“first high S/N” and “first low S/N” trials randomly mixedwith 10 trials per modulation rate for each (2 � 5 � 10 =100 trials per block session). Each condition was repeated
Journal of Vision (2007) 7(11):14, 1–11 Koene, Arnold, & Johnston 7
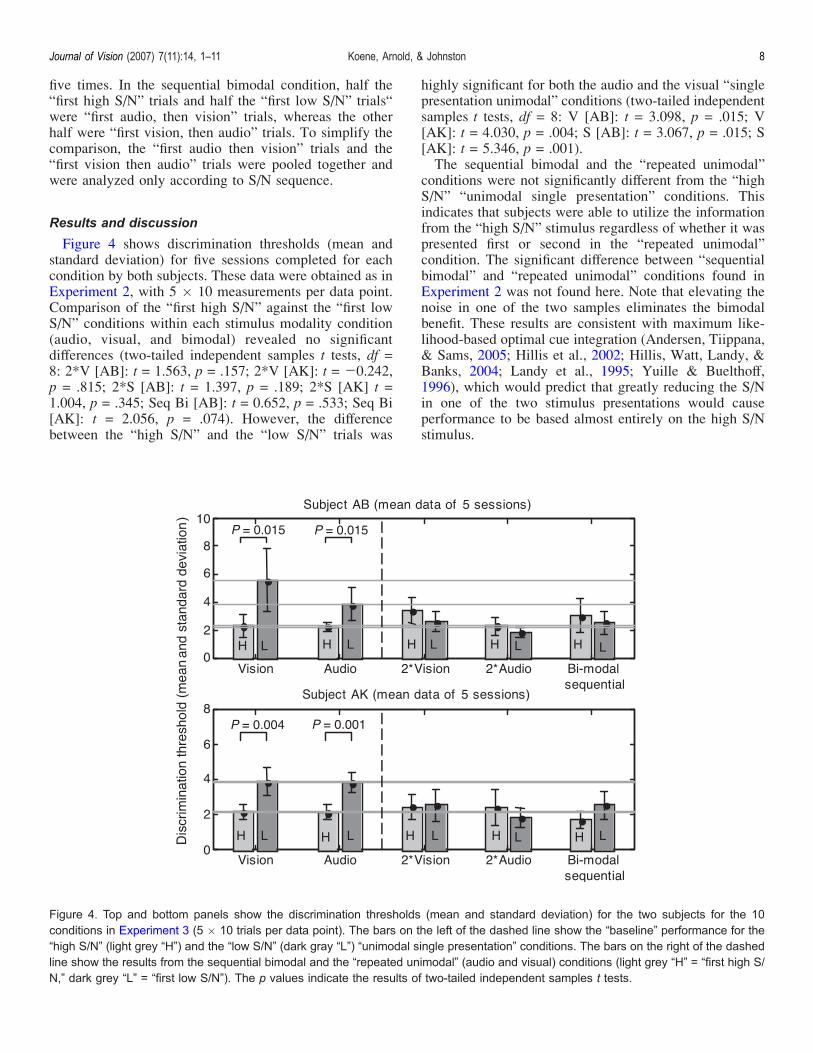
five times. In the sequential bimodal condition, half the“first high S/N” trials and half the “first low S/N” trials“were “first audio, then vision” trials, whereas the otherhalf were “first vision, then audio” trials. To simplify thecomparison, the “first audio then vision” trials and the“first vision then audio” trials were pooled together andwere analyzed only according to S/N sequence.
Results and discussion
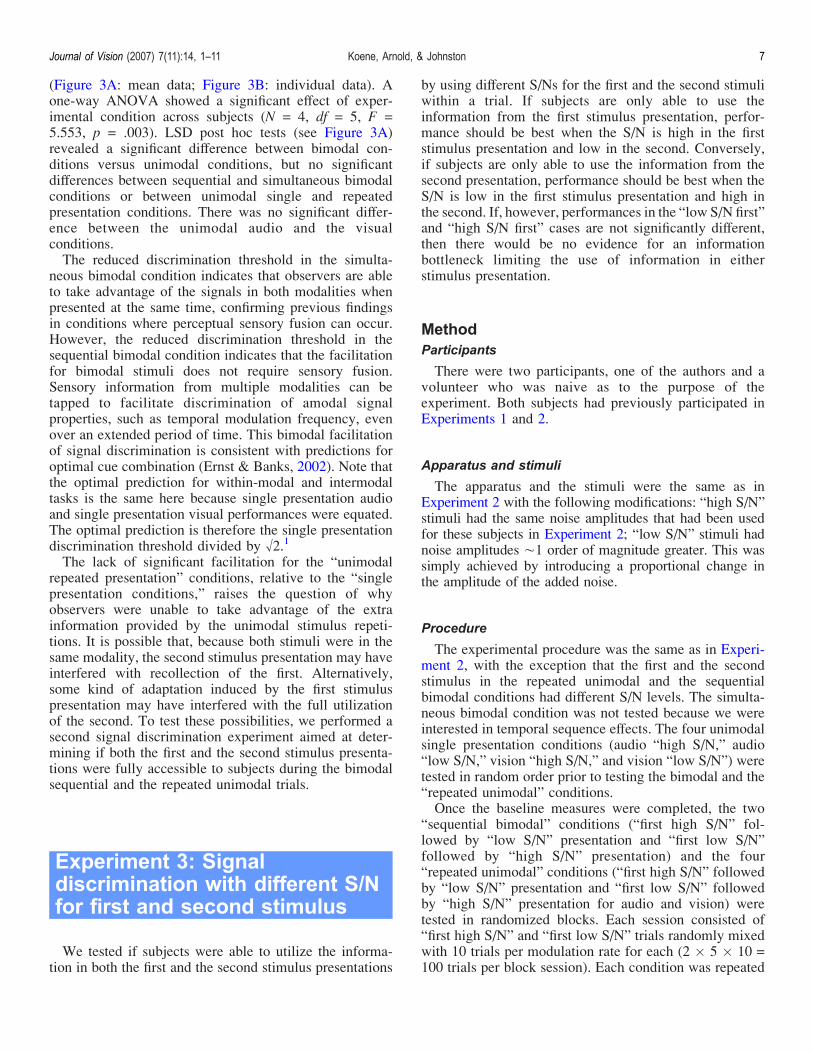
Figure 4 shows discrimination thresholds (mean andstandard deviation) for five sessions completed for eachcondition by both subjects. These data were obtained as inExperiment 2, with 5 � 10 measurements per data point.Comparison of the “first high S/N” against the “first lowS/N” conditions within each stimulus modality condition(audio, visual, and bimodal) revealed no significantdifferences (two-tailed independent samples t tests, df =8: 2*V [AB]: t = 1.563, p = .157; 2*V [AK]: t = j0.242,p = .815; 2*S [AB]: t = 1.397, p = .189; 2*S [AK] t =1.004, p = .345; Seq Bi [AB]: t = 0.652, p = .533; Seq Bi[AK]: t = 2.056, p = .074). However, the differencebetween the “high S/N” and the “low S/N” trials was
highly significant for both the audio and the visual “singlepresentation unimodal” conditions (two-tailed independentsamples t tests, df = 8: V [AB]: t = 3.098, p = .015; V[AK]: t = 4.030, p = .004; S [AB]: t = 3.067, p = .015; S[AK]: t = 5.346, p = .001).The sequential bimodal and the “repeated unimodal”
conditions were not significantly different from the “highS/N” “unimodal single presentation” conditions. Thisindicates that subjects were able to utilize the informationfrom the “high S/N” stimulus regardless of whether it waspresented first or second in the “repeated unimodal”condition. The significant difference between “sequentialbimodal” and “repeated unimodal” conditions found inExperiment 2 was not found here. Note that elevating thenoise in one of the two samples eliminates the bimodalbenefit. These results are consistent with maximum like-lihood-based optimal cue integration (Andersen, Tiippana,& Sams, 2005; Hillis et al., 2002; Hillis, Watt, Landy, &Banks, 2004; Landy et al., 1995; Yuille & Buelthoff,1996), which would predict that greatly reducing the S/Nin one of the two stimulus presentations would causeperformance to be based almost entirely on the high S/Nstimulus.
Figure 4. Top and bottom panels show the discrimination thresholds (mean and standard deviation) for the two subjects for the 10conditions in Experiment 3 (5 � 10 trials per data point). The bars on the left of the dashed line show the “baseline” performance for the“high S/N” (light grey “H”) and the “low S/N” (dark gray “L”) “unimodal single presentation” conditions. The bars on the right of the dashedline show the results from the sequential bimodal and the “repeated unimodal” (audio and visual) conditions (light grey “H” = “first high S/N,” dark grey “L” = “first low S/N”). The p values indicate the results of two-tailed independent samples t tests.
Journal of Vision (2007) 7(11):14, 1–11 Koene, Arnold, & Johnston 8
General discussion
We compared bimodal temporal frequency detectionand discrimination against dual single modality signals.For signal detection (Experiment 1), we found nosignificant difference between the bimodal and the unim-odal conditions or between the simultaneous and thesequential bimodal conditions. In short, we found noevidence for sensory signal integration over what could beaccounted for by probability summation.For signal discrimination (Experiment 2), we found
significant facilitation not only for the simultaneous bimodalcondition but also for the sequential bimodal condition,indicating that the bimodal advantage did not requireperceptual fusion of the sensory inputs. Surprisingly,repeated stimulation in the same modality did not signifi-cantly improve discrimination performance over singlepresentation, although a control experiment (Experiment 3)showed that observers were able to utilize the informationfrom both the first and the second unimodal stimuluspresentations. The results of Experiment 3 further revealedthat the bimodal facilitation does not occur if the perceivedS/N in the two modalities is greatly different.
Attention effects
When comparing subject performance for different stimulusconditions, each presented in separate blocks, there is aninherent possibility that subject performance might be affectedby differences in perceptual load. The simultaneous bimodalcondition, duringwhich subjects must attend to both audio andvisual stimuli at the same time, would seem to be the mostattention demanding condition. Performance for the sequentialand the simultaneous bimodal conditions, however, wasnot significantly differentVindicating that there was nodisadvantage in having to process both the audio and thevisual stimuli at the same time.
Bimodal advantage or unimodal disadvantage
Experiments that have measured reaction times (RTs) tounimodal and bimodal stimuli have typically found abimodal advantage, delivering shorter RTs for bimodalstimuli than for unimodal stimuli (e.g., Miller, 1982). AsPatching and Quinlan (2004) have pointed out, however,the difference in RTs might result from a unimodaldisadvantage, for example, modality-switching costs thatmay be present on unimodal trials (Quinlan & Hill, 1999;Spence & Driver, 1997) that require the subject to switchattention to a specific stimulus modality to respond. Theblocked presentation of the stimulus conditions in ourexperiment makes it unlikely that modality-switchingcosts play a role. Experiment 3 showed that the lack of
discrimination improvement in the “repeated unimodal”conditions was not due to an inability to use informationfrom both stimulus presentations.
Sensory fusion and bimodal discriminationfacilitation
It has been previously shown that, under conditionssupporting sensory fusion (i.e., near simultaneous multi-modal stimulation), strong multimodal interaction effectscan take place (Alais & Burr, 2004; Ernst & Banks, 2002;Patching & Quinlan, 2004; Shams et al., 2000, 2002;Violentyev et al., 2005). These include facilitation of bothstimulus detection and discrimination (Bresciani et al.,2006; Hillis et al., 2002). Such multisensory interactionscan occur even when subjects are expressly instructed toattend only to one modality and to ignore stimuli in theother modality. Here we showed, however, that sensoryfusion conditions are not required for bimodal facilitationof temporal frequency discrimination. Performance inboth the simultaneous and the sequential bimodal con-ditions was statistically indistinguishable from discrim-ination performance predicted by maximum likelihoodestimation (Alais & Burr, 2004; Ernst & Banks, 2002;Hillis et al., 2004; Landy et al., 1995; Yuille & Buelthoff,1996). This suggests that simultaneous bimodal activa-tions of multimodal neurons are not essential for this kindof temporal frequency discrimination facilitation.
Why is there no significant discriminationbenefit in repeated unimodal conditions?
Considering that bimodal signal discrimination benefitdoes not require sensory fusion and the informationcontent in the bimodal and dual single modality presenta-tions is the same, why is there no significant benefit fordual single modality discrimination?In Experiment 3, in which the repeated unimodal
signals had clearly different signal to noise ratios, subjectshad no difficulty in basing their response on the signalwith the greater S/N (see Figure 4); thus, it is not due to aninability to use both stimulus presentations. Indeed, thepossibility of choosing the most reliable signal mayprovide the explanation.Signal discrimination is limited by internal noise. Sources
of internal noise are various, but we note that neuromodula-tors such as acetylcholine, which has been linked to the“reporting of uncertainty” (Dayan &Yu, 2002), are known tohave onset time constants between 1 and 2 s and decayconstants of 10 to 20 s (Hasselmo & Fehlau, 2001). If themagnitude of the internal sensory noise in each modalitychanges slowly, and relatively independently, but signifi-cantly varies over the course of an experimental session,then there is an opportunity to improve performance in
Journal of Vision (2007) 7(11):14, 1–11 Koene, Arnold, & Johnston 9
bimodal trials by favoring the modality with the best S/N oneach trial. The noise level within a single modality would bemore likely to be similar within a trial than noise levels intwo different modalities. As a consequence, signal selectionwould be less effective in the dual single modality case.Note, however, that this strategy requires that subjects havesome means of establishing which modality is more reliableon any given trial. It also requires that the independentfluctuations in S/N be sufficient to change which of the twomodalities provides the more accurate signal estimate.This selection theory is also compatible with the results
of Experiment 3, where no bimodal advantage was found.In this experiment, the most discriminable stimulus oneach trial would be entirely determined by the addedexternal noise.
Conclusions
Discrimination, but not detection, of signal modulationrate was easier when stimuli were presented in twomodalities rather than just one. This was true even whentwo unimodal signals were provided. Discriminationthresholds for repeated unimodal stimuli, in contrast, werenot significantly different from the thresholds for singlepresentations of unimodal stimuli. The bimodal facilita-tion therefore did not require simultaneous presentationsin both modalities and evidently does not rely on bimodalsensory fusion. We propose that the improved perform-ance in bimodal over dual unimodal stimuli results fromselection of the highest S/N stimuli within each trial. Thenoise level within a single modality is more likely to besimilar within a trial than noise levels in two differentmodalities. As a consequence, signal selection would bemore effective for bimodal stimulus presentations.
Acknowledgments
This work was supported by the Human FrontierScience Program.
Commercial relationships: none.Corresponding author: Ansgar Koene.Email: [email protected]: Psychology department, National Taiwan Uni-versity, Taipei 106, Taiwan.
Footnote
1
According to the maximum likelihood estimation rule,the prediction for the discrimination threshold (T12) when
two cue stimuli are presented can be determined from thesingle stimulus discrimination thresholds (T1 and T2) as
T212 ¼
ðT21T
22Þ
ðT21 þ T2
2Þ
(cf. Equation 7 of Ernst & Banks, 2002).By design, T1 = T2 in our experiment, regardless of
whether T1 and T2 refer to the same stimulus modality(i.e., repeated unimodal conditions) or different modalities(i.e., bimodal conditions). Thus, we can write:
T212 ¼
ðT21T
22Þ
ðT21 þ T2
2Þ¼ ðT2
1Þ2ð2T2
1Þ¼ T2
1
2Á T12 ¼ T1
ffiffiffi
2p :
References
Alais, D., & Burr, D. (2004). The ventriloquist effectresults from near-optimal bimodal integration. Cur-rent Biology, 14, 257–262. [PubMed] [Article]
Andersen, T. S., Tiippana, K., & Sams, M. (2005).Maximum likelihood integration of rapid flashes andbeeps.Neuroscience Letters, 380, 155–160. [PubMed]
Battaglia, P. W., Jacobs, R. A., & Aslin, R. N. (2003).Bayesian integration of visual and auditory signals forspatial localization. Journal of the Optical Society ofAmerica A, Optics, image science, and vision, 20,1391–1397. [PubMed]
Bertelson, P., Vroomen, J., de Gelder, B., & Driver, J.(2000). The ventriloquist effect does not depend onthe direction of deliberate visual attention. Perception& Psychophysics, 62, 321–332. [PubMed]
Bresciani, J. P., Ernst, M. O., Drewing, K., Bouyer, G.,Maury, V., & Kheddar, A. (2005). Feeling what youhear: Auditory signals can modulate tactile tap percep-tion. Experimental Brain Research, 162, 172–180.[PubMed]
Bresciani, J. P., Dammeier, F., & Ernst, M. O. (2006).Vision and touch are automatically integrated for theperception of sequences of events. Journal of Vision,6(5):2, 554–564, http://journalofvision.org/6/5/2/,doi:10.1167/6.5.2. [PubMed] [Article]
Dayan, P., & Yu, A. J. (2002). Acetylcholine, uncertainty,and cortical inference. In T. G. Dietterich, S. Becker,& Z. Ghahramani (Eds.), Advances in neural infor-mation processing systems (vol. 14). Cambridge, MA:MIT Press.
Ernst, M. O. (2006). A Bayesian view on multimodalcue integration. In G. Knoblich, I. M. Thornton,M. Grosjean, & M. Shiffrar (Eds.), Human body
Journal of Vision (2007) 7(11):14, 1–11 Koene, Arnold, & Johnston 10
perception from the inside out. New York: OxfordUniversity Press.
Ernst, M. O., & Banks, M. S. (2002). Humans integratevisual and haptic information in a statistically optimalfashion. Nature, 415, 429–433. [PubMed]
Foster, D. H., & Bischof, W. F. (1987). Bootstrap varianceestimators for the parameters of small-sample sensory-performance functions. Biological Cybernetics, 57,341–347. [PubMed]
Hasselmo, M. E., & Fehlau, B. P. (2001). Differences intime course of ACh and GABA modulation ofexcitatory synaptic potentials in slices of rat hippo-campus. Journal of Neurophysiology, 86, 1792–1802.[PubMed] [Article]
Hillis, J. M., Ernst, M. O., Banks, M. S., & Landy, M. S.(2002). Combining sensory information: Mandatoryfusion within, but not between, senses. Science, 298,1627–1630. [PubMed]
Hillis, J. M., Watt, S. J., Landy, M. S., & Banks M. S.(2004). Slant from texture and disparity cues: Optimalcue combination. Journal of Vision 4(12):1, 967–992,http://journalofvision.org/4/12/1/, doi:10.1167/4.12.1.[PubMed] [Article]
Kelly, D. H. (1979). Motion and vision. II. Stabilizedspatio-temporal threshold surface. Journal of theOptical Society of America, 69, 1340–1349.[PubMed]
Landy, M. S., Maloney, L. T., Johnston, E. B., & Young,M.(1995). Measurement and modeling of depth cuecombination: In defense of weak fusion. VisionResearch, 35, 389–412. [PubMed]
Macmillan, N. A., & Creelman, C. D. (2005). Detectiontheory: A user’s guide (2nd ed.). London: LawrenceErlbaum Associates.
Miller, J. (1982). Divided attention: Evidence for coac-tivation with redundant signals. Cognitive Psychology,14, 247–279. [PubMed]
Patching, G. R., & Quinlan, P. T. (2004). Crossmodalintegration of simple auditory and visual events.Perception & Psychophysics, 66, 131–140. [PubMed][Article]
Pirenne, M. H. (1943). Binocular and uniocular thresholdof vision. Nature, 152, 698–699.
Quinlan, P. T., & Hill, N. I. (1999). Sequential effects inrudimentary auditory and visual tasks. Perception &Psychophysics, 61, 375–384. [PubMed]
Shams, L., Kamitani, Y., & Shimojo, S. (2000). Illusions.What you see is what you hear. Nature, 408, 778.[PubMed]
Shams, L., Kamitani, Y., & Shimojo, S. (2002). Visualillusion induced by sound. Cognitive Brain Research,14, 147–152. [PubMed]
Spence, C., & Driver, J. (1997). On measuring selectiveattention to an expected sensory modality. Perception& Psychophysics, 59, 389–403. [PubMed]
Stone, J. V., Hunkin, N. M., Porrill, J., Wood, R., Keeler,V., Beanland, et al. (2001). When is now? Perceptionof simultaneity. Proceedings of the Royal Society B:Biological sciences, 268, 31–38. [PubMed] [Article]
Treisman, M. (1998). Combining information: Probabilitysummation and probability averaging in detection anddiscrimination. Psychological Methods, 2, 252–265.
Violentyev, A., Shimojo, S., & Shams, L. (2005). Touch-induced visual illusion. Neuroreport, 16, 1107–1110.[PubMed]
Vroomen, J., Bertelson, P., & de Gelder, B. (2001). Theventriloquist effect does not depend on the directionof automatic visual attention. Perception & Psycho-physics, 63, 651–659. [PubMed] [Article]
Yuille, A. L., & Buelthoff, H. H. (1996). Bayesiandecision theory and psychophysics. In D. C. Knill &W. Richards (Eds.), Perception as Bayesian inference(pp. 123–161). Cambridge University Press.
Journal of Vision (2007) 7(11):14, 1–11 Koene, Arnold, & Johnston 11