Embed Size (px)
Citation preview

0
Dr Pip Arnold Karekare Education
Statistics Day November 2018
What makes a good investigative question?
In this workshop participants will actively engage in the learning process for understanding what makes
a good investigative question. Investigative questions are fundamental to the statistical enquiry
cycle. Without the (first) P in the PPDAC cycle, there is no purpose to the cycle.
Criteria for what makes a good investigative question as well as the criteria for judging the
quality of investigative questions posed based on SOLO taxonomy will be shared with participants.
All materials that will be used and shared in the session were developed as part of Pip’s PhD
research: Statistical investigative questions. An enquiry into posing and answering investigative
questions from existing data
1
www.karekareeducation.co.nz Pip Arnold [email protected]
Contents Workshop plan ................................................................................................................................................ 2
Posing investigative questions ........................................................................................................................ 3
Activity ........................................................................................................................................................ 3
Interrogative questions for existing data sets ......................................................................................... 3
2009 Census At School Questionnaire ................................................................................................. 3
Sorting questions into groups ......................................................................................................................... 7
Activity ........................................................................................................................................................ 7
Features of a good investigative question ...................................................................................................... 8
Activity ........................................................................................................................................................ 8
Lesson plan from C@S ........................................................................................................................... 9
Including populations .................................................................................................................................... 13
Activity ...................................................................................................................................................... 13
Using SOLO .................................................................................................................................................... 19
Grading comparison investigative questions..................................................................................... 19
Activity ...................................................................................................................................................... 20
Reflections ..................................................................................................................................................... 21
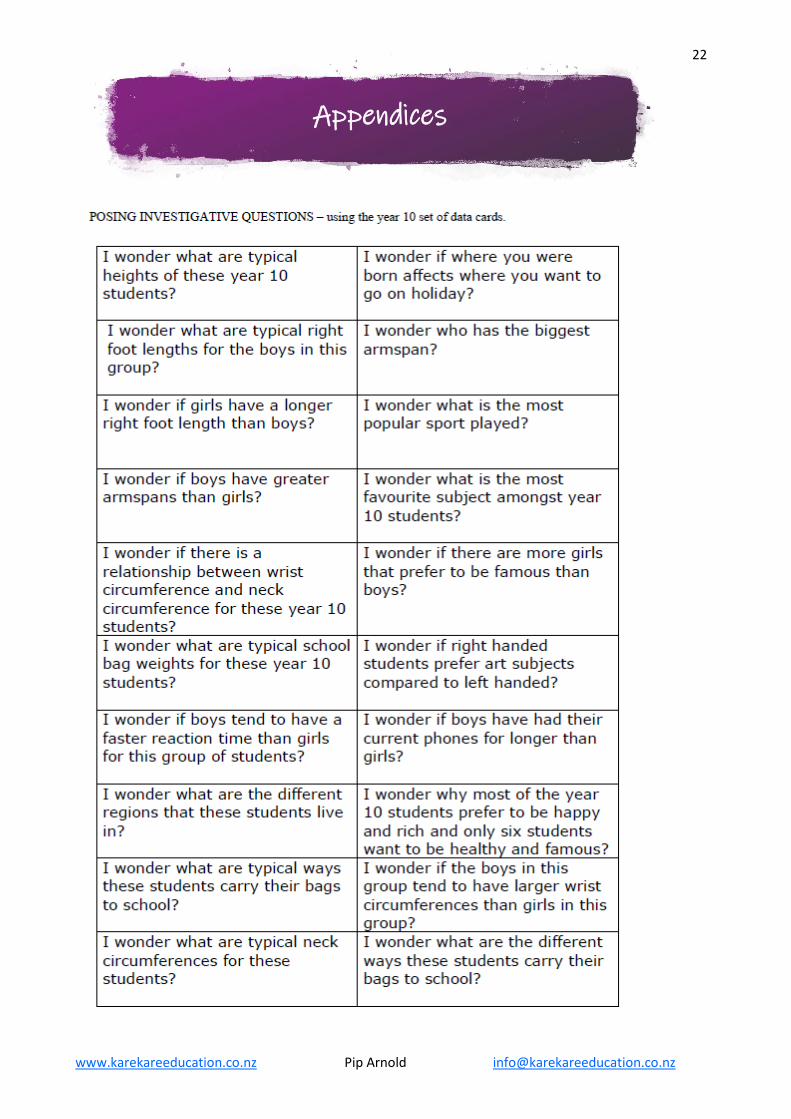
Appendices .................................................................................................................................................... 22
Population descriptors activity questions ............................................................................................. 23
2
www.karekareeducation.co.nz Pip Arnold [email protected]
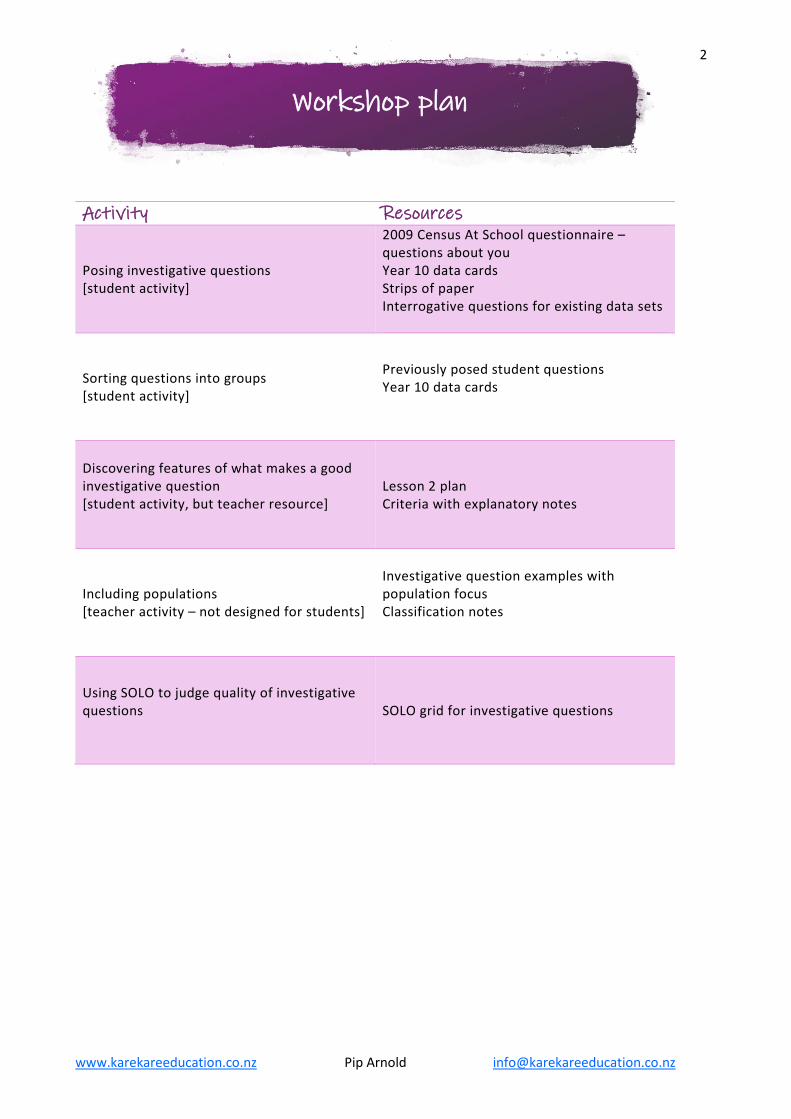
Activity Resources
Posing investigative questions [student activity]
2009 Census At School questionnaire – questions about you Year 10 data cards Strips of paper Interrogative questions for existing data sets
Sorting questions into groups [student activity]
Previously posed student questions Year 10 data cards
Discovering features of what makes a good investigative question [student activity, but teacher resource]
Lesson 2 plan Criteria with explanatory notes
Including populations [teacher activity – not designed for students]
Investigative question examples with population focus Classification notes
Using SOLO to judge quality of investigative questions
SOLO grid for investigative questions
Workshop plan
3
www.karekareeducation.co.nz Pip Arnold [email protected]
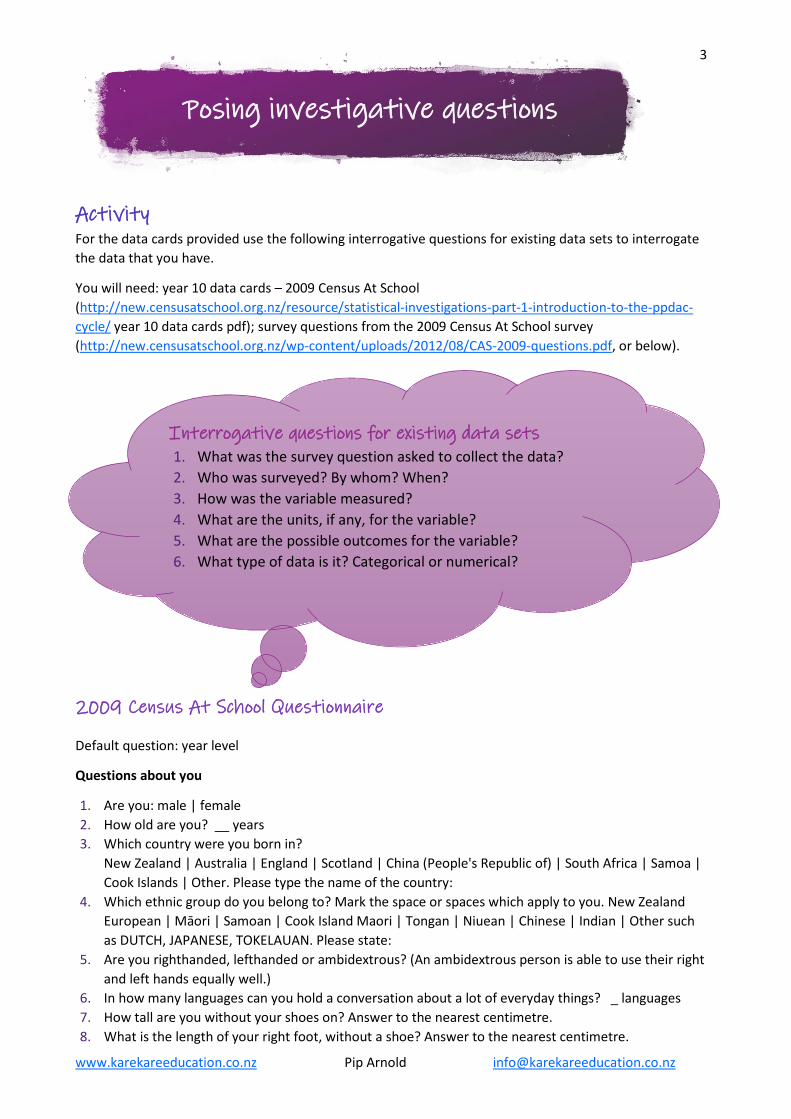
Activity For the data cards provided use the following interrogative questions for existing data sets to interrogate the data that you have.
You will need: year 10 data cards – 2009 Census At School (http://new.censusatschool.org.nz/resource/statistical-investigations-part-1-introduction-to-the-ppdac-cycle/ year 10 data cards pdf); survey questions from the 2009 Census At School survey (http://new.censusatschool.org.nz/wp-content/uploads/2012/08/CAS-2009-questions.pdf, or below).
2009 Census At School Questionnaire
Default question: year level
Questions about you
1. Are you: male | female 2. How old are you? __ years 3. Which country were you born in?
New Zealand | Australia | England | Scotland | China (People's Republic of) | South Africa | Samoa | Cook Islands | Other. Please type the name of the country:
4. Which ethnic group do you belong to? Mark the space or spaces which apply to you. New Zealand European | Māori | Samoan | Cook Island Maori | Tongan | Niuean | Chinese | Indian | Other such as DUTCH, JAPANESE, TOKELAUAN. Please state:
5. Are you righthanded, lefthanded or ambidextrous? (An ambidextrous person is able to use their right and left hands equally well.)
6. In how many languages can you hold a conversation about a lot of everyday things? _ languages 7. How tall are you without your shoes on? Answer to the nearest centimetre. 8. What is the length of your right foot, without a shoe? Answer to the nearest centimetre.
Posing investigative questions
Interrogative questions for existing data sets 1. What was the survey question asked to collect the data? 2. Who was surveyed? By whom? When? 3. How was the variable measured? 4. What are the units, if any, for the variable? 5. What are the possible outcomes for the variable? 6. What type of data is it? Categorical or numerical?
4
www.karekareeducation.co.nz Pip Arnold [email protected]
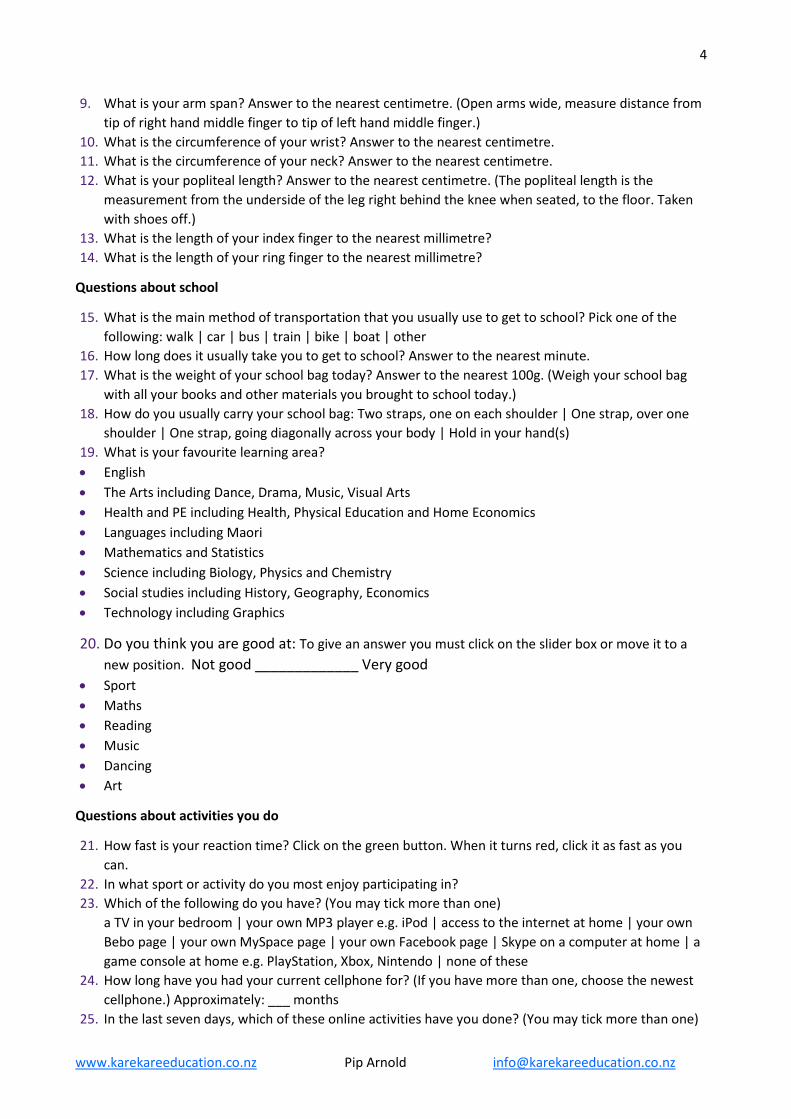
9. What is your arm span? Answer to the nearest centimetre. (Open arms wide, measure distance from tip of right hand middle finger to tip of left hand middle finger.)
10. What is the circumference of your wrist? Answer to the nearest centimetre. 11. What is the circumference of your neck? Answer to the nearest centimetre. 12. What is your popliteal length? Answer to the nearest centimetre. (The popliteal length is the
measurement from the underside of the leg right behind the knee when seated, to the floor. Taken with shoes off.)
13. What is the length of your index finger to the nearest millimetre? 14. What is the length of your ring finger to the nearest millimetre?
Questions about school
15. What is the main method of transportation that you usually use to get to school? Pick one of the following: walk | car | bus | train | bike | boat | other
16. How long does it usually take you to get to school? Answer to the nearest minute. 17. What is the weight of your school bag today? Answer to the nearest 100g. (Weigh your school bag
with all your books and other materials you brought to school today.) 18. How do you usually carry your school bag: Two straps, one on each shoulder | One strap, over one
shoulder | One strap, going diagonally across your body | Hold in your hand(s) 19. What is your favourite learning area? • English • The Arts including Dance, Drama, Music, Visual Arts • Health and PE including Health, Physical Education and Home Economics • Languages including Maori • Mathematics and Statistics • Science including Biology, Physics and Chemistry • Social studies including History, Geography, Economics • Technology including Graphics
20. Do you think you are good at: To give an answer you must click on the slider box or move it to a new position. Not good _____________ Very good
• Sport • Maths • Reading • Music • Dancing • Art
Questions about activities you do
21. How fast is your reaction time? Click on the green button. When it turns red, click it as fast as you can.
22. In what sport or activity do you most enjoy participating in? 23. Which of the following do you have? (You may tick more than one)
a TV in your bedroom | your own MP3 player e.g. iPod | access to the internet at home | your own Bebo page | your own MySpace page | your own Facebook page | Skype on a computer at home | a game console at home e.g. PlayStation, Xbox, Nintendo | none of these
24. How long have you had your current cellphone for? (If you have more than one, choose the newest cellphone.) Approximately: ___ months
25. In the last seven days, which of these online activities have you done? (You may tick more than one)
5
www.karekareeducation.co.nz Pip Arnold [email protected]
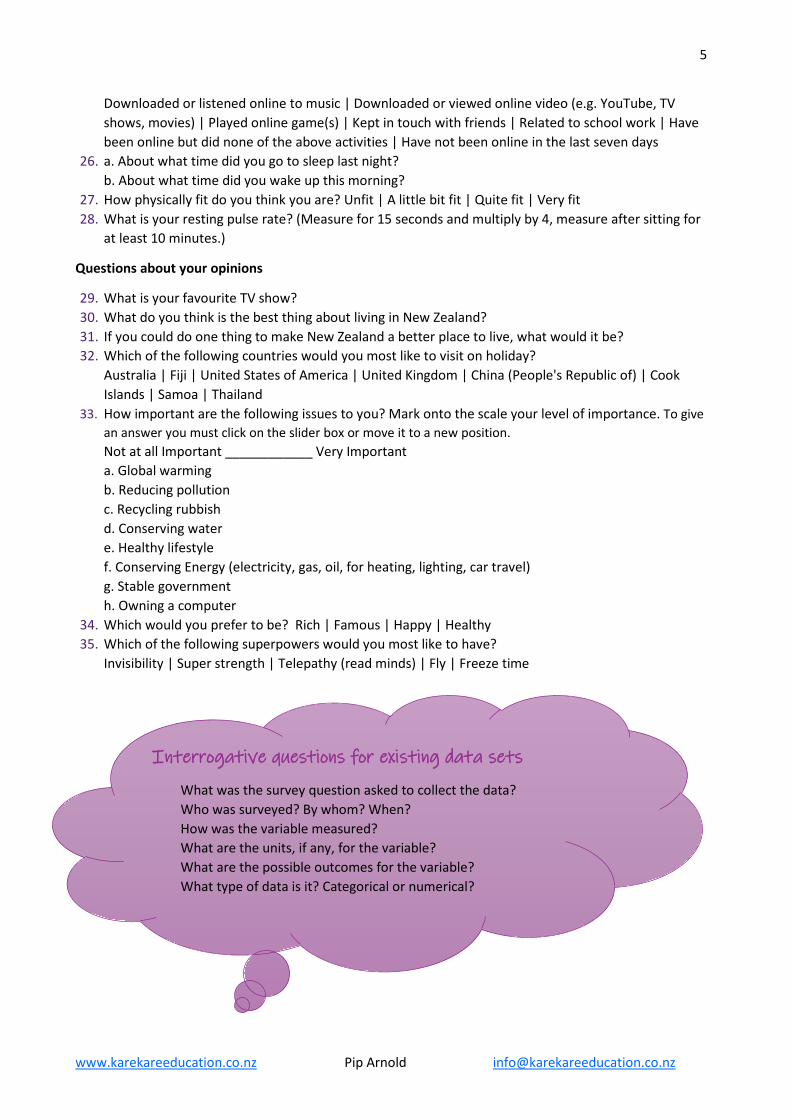
Downloaded or listened online to music | Downloaded or viewed online video (e.g. YouTube, TV shows, movies) | Played online game(s) | Kept in touch with friends | Related to school work | Have been online but did none of the above activities | Have not been online in the last seven days
26. a. About what time did you go to sleep last night? b. About what time did you wake up this morning?
27. How physically fit do you think you are? Unfit | A little bit fit | Quite fit | Very fit 28. What is your resting pulse rate? (Measure for 15 seconds and multiply by 4, measure after sitting for
at least 10 minutes.)
Questions about your opinions
29. What is your favourite TV show? 30. What do you think is the best thing about living in New Zealand? 31. If you could do one thing to make New Zealand a better place to live, what would it be? 32. Which of the following countries would you most like to visit on holiday?
Australia | Fiji | United States of America | United Kingdom | China (People's Republic of) | Cook Islands | Samoa | Thailand
33. How important are the following issues to you? Mark onto the scale your level of importance. To give an answer you must click on the slider box or move it to a new position. Not at all Important ____________ Very Important a. Global warming b. Reducing pollution c. Recycling rubbish d. Conserving water e. Healthy lifestyle f. Conserving Energy (electricity, gas, oil, for heating, lighting, car travel) g. Stable government h. Owning a computer
34. Which would you prefer to be? Rich | Famous | Happy | Healthy 35. Which of the following superpowers would you most like to have?
Invisibility | Super strength | Telepathy (read minds) | Fly | Freeze time
Interrogative questions for existing data sets
What was the survey question asked to collect the data? Who was surveyed? By whom? When? How was the variable measured? What are the units, if any, for the variable? What are the possible outcomes for the variable? What type of data is it? Categorical or numerical?
6
www.karekareeducation.co.nz Pip Arnold [email protected]
Take at least two categorical variables and two numerical variables and give answers below for the interrogative questions for existing data sets.
Categorical variable 1: Categorical variable 2: Numerical variable 1: Numerical variable 2:
Pose two summary investigative questions and two comparison investigative questions that you could answer using this data set.
Summary investigative question
Summary investigative question
Comparison investigative question
Comparison investigative question
7
www.karekareeducation.co.nz Pip Arnold [email protected]
Activity Sort the question cards given into groups. You may use any criteria you like to sort the groups. Describe the different groups you have created below, note any issues or problems you have with any of the questions. Note the questions have been posed from the year 10 data cards from the last activity.
Sorting questions into groups
Issues or problems with the questions
Describe the different groups
Template for student posed questions are in the appendices
8
www.karekareeducation.co.nz Pip Arnold [email protected]
Activity Make notes of the ideas from the discussion that come up as to the features or criteria of a good investigative question.
Features of a good investigative question
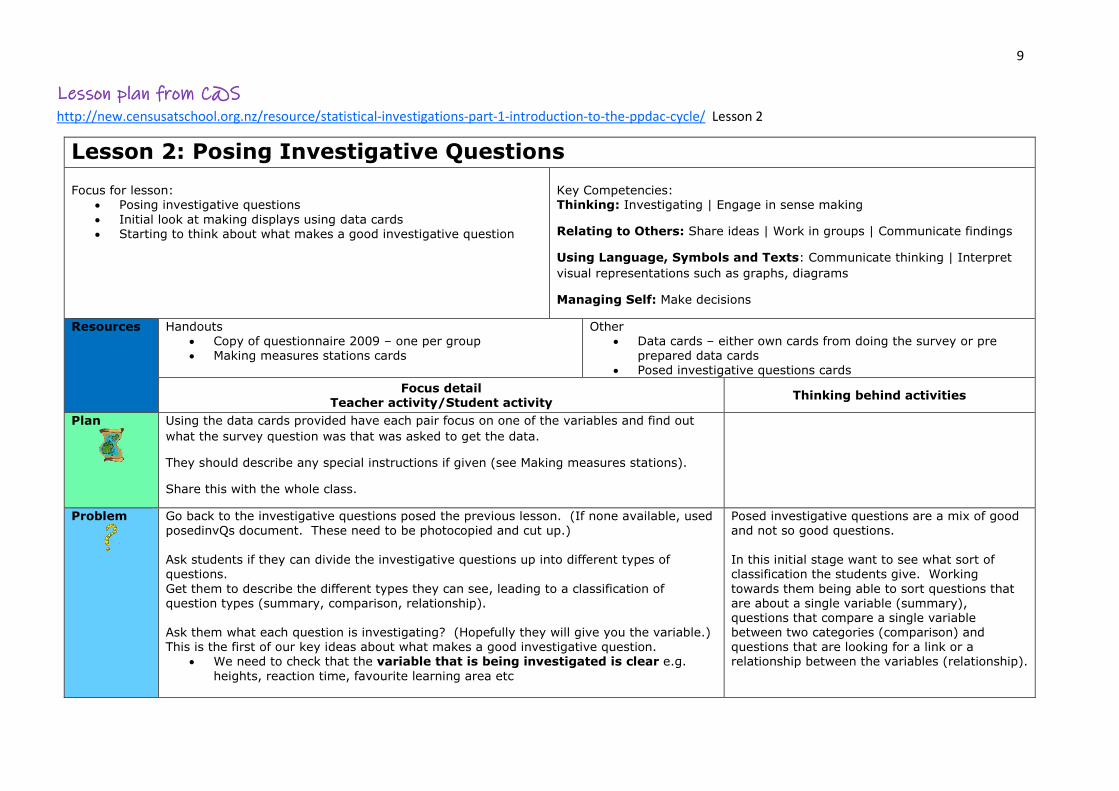
9 Lesson plan from C@S http://new.censusatschool.org.nz/resource/statistical-investigations-part-1-introduction-to-the-ppdac-cycle/ Lesson 2
Lesson 2: Posing Investigative Questions Focus for lesson:
• Posing investigative questions • Initial look at making displays using data cards • Starting to think about what makes a good investigative question
Key Competencies: Thinking: Investigating | Engage in sense making
Relating to Others: Share ideas | Work in groups | Communicate findings
Using Language, Symbols and Texts: Communicate thinking | Interpret visual representations such as graphs, diagrams
Managing Self: Make decisions
Resources Handouts • Copy of questionnaire 2009 – one per group • Making measures stations cards
Other • Data cards – either own cards from doing the survey or pre
prepared data cards • Posed investigative questions cards
Focus detail Teacher activity/Student activity Thinking behind activities
Plan
Using the data cards provided have each pair focus on one of the variables and find out what the survey question was that was asked to get the data.
They should describe any special instructions if given (see Making measures stations).
Share this with the whole class.
Problem
Go back to the investigative questions posed the previous lesson. (If none available, used posedinvQs document. These need to be photocopied and cut up.) Ask students if they can divide the investigative questions up into different types of questions. Get them to describe the different types they can see, leading to a classification of question types (summary, comparison, relationship). Ask them what each question is investigating? (Hopefully they will give you the variable.) This is the first of our key ideas about what makes a good investigative question.
• We need to check that the variable that is being investigated is clear e.g. heights, reaction time, favourite learning area etc
Posed investigative questions are a mix of good and not so good questions. In this initial stage want to see what sort of classification the students give. Working towards them being able to sort questions that are about a single variable (summary), questions that compare a single variable between two categories (comparison) and questions that are looking for a link or a relationship between the variables (relationship).
10
www.karekareeducation.co.nz Pip Arnold [email protected]
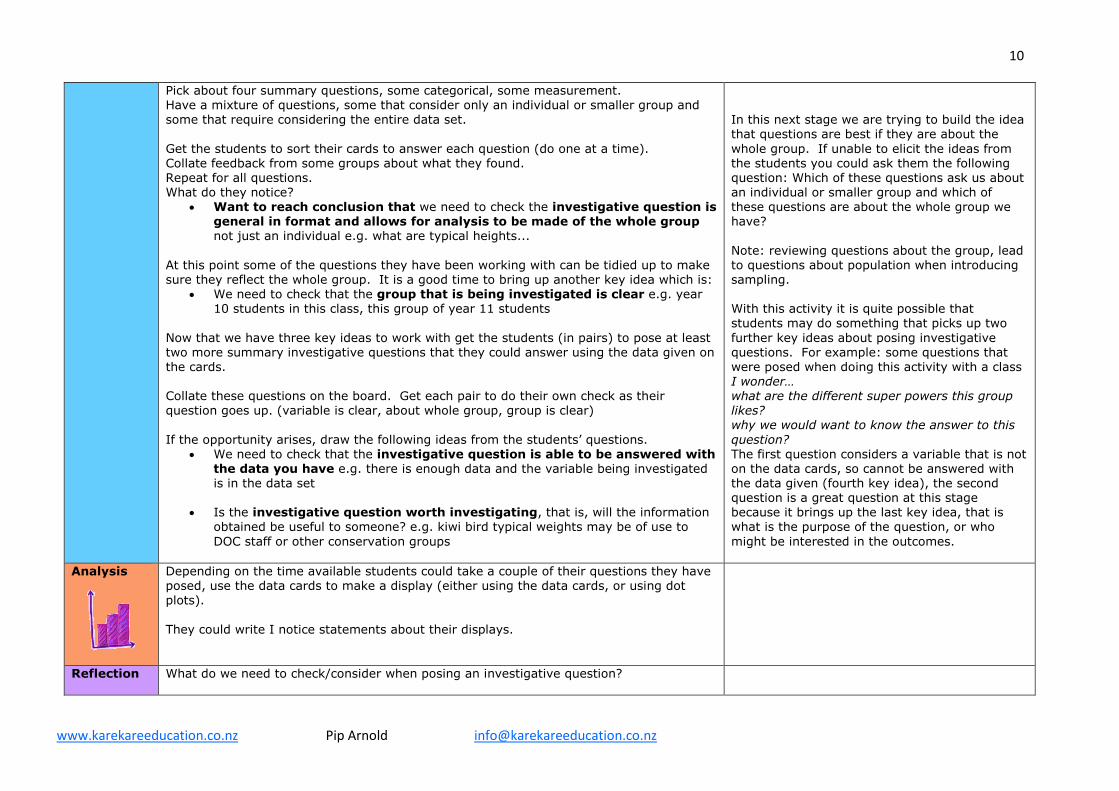
Pick about four summary questions, some categorical, some measurement. Have a mixture of questions, some that consider only an individual or smaller group and some that require considering the entire data set. Get the students to sort their cards to answer each question (do one at a time). Collate feedback from some groups about what they found. Repeat for all questions. What do they notice?
• Want to reach conclusion that we need to check the investigative question is general in format and allows for analysis to be made of the whole group not just an individual e.g. what are typical heights...
At this point some of the questions they have been working with can be tidied up to make sure they reflect the whole group. It is a good time to bring up another key idea which is:
• We need to check that the group that is being investigated is clear e.g. year 10 students in this class, this group of year 11 students
Now that we have three key ideas to work with get the students (in pairs) to pose at least two more summary investigative questions that they could answer using the data given on the cards. Collate these questions on the board. Get each pair to do their own check as their question goes up. (variable is clear, about whole group, group is clear) If the opportunity arises, draw the following ideas from the students’ questions.
• We need to check that the investigative question is able to be answered with the data you have e.g. there is enough data and the variable being investigated is in the data set
• Is the investigative question worth investigating, that is, will the information obtained be useful to someone? e.g. kiwi bird typical weights may be of use to DOC staff or other conservation groups
In this next stage we are trying to build the idea that questions are best if they are about the whole group. If unable to elicit the ideas from the students you could ask them the following question: Which of these questions ask us about an individual or smaller group and which of these questions are about the whole group we have? Note: reviewing questions about the group, lead to questions about population when introducing sampling. With this activity it is quite possible that students may do something that picks up two further key ideas about posing investigative questions. For example: some questions that were posed when doing this activity with a class I wonder… what are the different super powers this group likes? why we would want to know the answer to this question? The first question considers a variable that is not on the data cards, so cannot be answered with the data given (fourth key idea), the second question is a great question at this stage because it brings up the last key idea, that is what is the purpose of the question, or who might be interested in the outcomes.
Analysis
Depending on the time available students could take a couple of their questions they have posed, use the data cards to make a display (either using the data cards, or using dot plots). They could write I notice statements about their displays.
Reflection What do we need to check/consider when posing an investigative question?
11
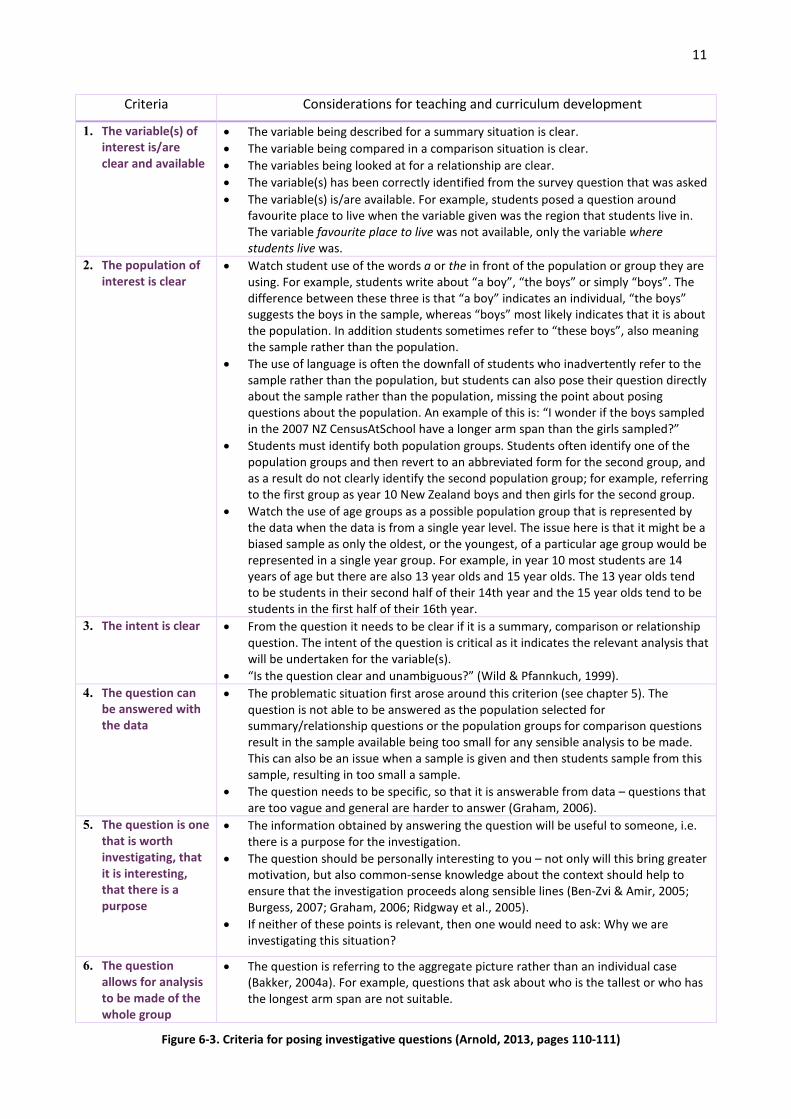
Criteria Considerations for teaching and curriculum development
1. The variable(s) of interest is/are clear and available
• The variable being described for a summary situation is clear. • The variable being compared in a comparison situation is clear. • The variables being looked at for a relationship are clear. • The variable(s) has been correctly identified from the survey question that was asked • The variable(s) is/are available. For example, students posed a question around
favourite place to live when the variable given was the region that students live in. The variable favourite place to live was not available, only the variable where students live was.
2. The population of interest is clear
• Watch student use of the words a or the in front of the population or group they are using. For example, students write about “a boy”, “the boys” or simply “boys”. The difference between these three is that “a boy” indicates an individual, “the boys” suggests the boys in the sample, whereas “boys” most likely indicates that it is about the population. In addition students sometimes refer to “these boys”, also meaning the sample rather than the population.
• The use of language is often the downfall of students who inadvertently refer to the sample rather than the population, but students can also pose their question directly about the sample rather than the population, missing the point about posing questions about the population. An example of this is: “I wonder if the boys sampled in the 2007 NZ CensusAtSchool have a longer arm span than the girls sampled?”
• Students must identify both population groups. Students often identify one of the population groups and then revert to an abbreviated form for the second group, and as a result do not clearly identify the second population group; for example, referring to the first group as year 10 New Zealand boys and then girls for the second group.
• Watch the use of age groups as a possible population group that is represented by the data when the data is from a single year level. The issue here is that it might be a biased sample as only the oldest, or the youngest, of a particular age group would be represented in a single year group. For example, in year 10 most students are 14 years of age but there are also 13 year olds and 15 year olds. The 13 year olds tend to be students in their second half of their 14th year and the 15 year olds tend to be students in the first half of their 16th year.
3. The intent is clear
• From the question it needs to be clear if it is a summary, comparison or relationship question. The intent of the question is critical as it indicates the relevant analysis that will be undertaken for the variable(s).
• “Is the question clear and unambiguous?” (Wild & Pfannkuch, 1999). 4. The question can
be answered with the data
• The problematic situation first arose around this criterion (see chapter 5). The question is not able to be answered as the population selected for summary/relationship questions or the population groups for comparison questions result in the sample available being too small for any sensible analysis to be made. This can also be an issue when a sample is given and then students sample from this sample, resulting in too small a sample.
• The question needs to be specific, so that it is answerable from data – questions that are too vague and general are harder to answer (Graham, 2006).
5. The question is one that is worth investigating, that it is interesting, that there is a purpose
• The information obtained by answering the question will be useful to someone, i.e. there is a purpose for the investigation.
• The question should be personally interesting to you – not only will this bring greater motivation, but also common-sense knowledge about the context should help to ensure that the investigation proceeds along sensible lines (Ben-Zvi & Amir, 2005; Burgess, 2007; Graham, 2006; Ridgway et al., 2005).
• If neither of these points is relevant, then one would need to ask: Why we are investigating this situation?
6. The question allows for analysis to be made of the whole group
• The question is referring to the aggregate picture rather than an individual case (Bakker, 2004a). For example, questions that ask about who is the tallest or who has the longest arm span are not suitable.
Figure 6-3. Criteria for posing investigative questions (Arnold, 2013, pages 110-111)
12
www.karekareeducation.co.nz Pip Arnold [email protected]
References Arnold, P. (2013). Statistical investigative questions. An enquiry into posing and answering investigative
questions from existing data (Doctoral dissertation, ResearchSpace@ Auckland). https://researchspace.auckland.ac.nz/handle/2292/21305
Bakker, A. (2004a). Design research in statistics education: On symbolizing and computer tools. Utrecht, The Netherlands: Freudenthal Institute.
Ben-Zvi, D., & Amir, Y. (2005). How do primary school students begin to reason about distributions? In K. Makar (Ed.), Reasoning about distribution: A collection of research studies. Proceedings of the Fourth International Research Forum on Statistical Reasoning, Thinking and Literacy (SRTL-4, July, 2005), Auckland, New Zealand (pp. 1–22). Brisbane, Australia: University of Queensland.
Burgess, T. (2007). Investigating the nature of teacher knowledge needed and used in teaching statistics (Doctoral thesis.) Retrieved from http://www.stat.auckland.ac.nz/~iase/publications/dissertations/07.Burgess.Dissertation.pdf
Graham, A. (2006). Developing Thinking in Statistics. London, England: Paul Chapman.
Ridgway, J., McCusker, S., & Nicholson, J. (2005). Uncovering and developing student statistical competences via new interfaces. In G. Burrill & M. Camden (Eds.), Curricular development in statistics education: International Association for Statistical Education 2004 Round table (pp. 75–92). Voorburg, The Netherlands: International Statistical Institute.
Wild, C. J., & Pfannkuch, M. (1999). Statistical thinking in empirical enquiry. International Statistical Review, 67(3), 223–265. doi: 10.1111/j.1751-5823.1999.tb00442.x
13
www.karekareeducation.co.nz Pip Arnold [email protected]
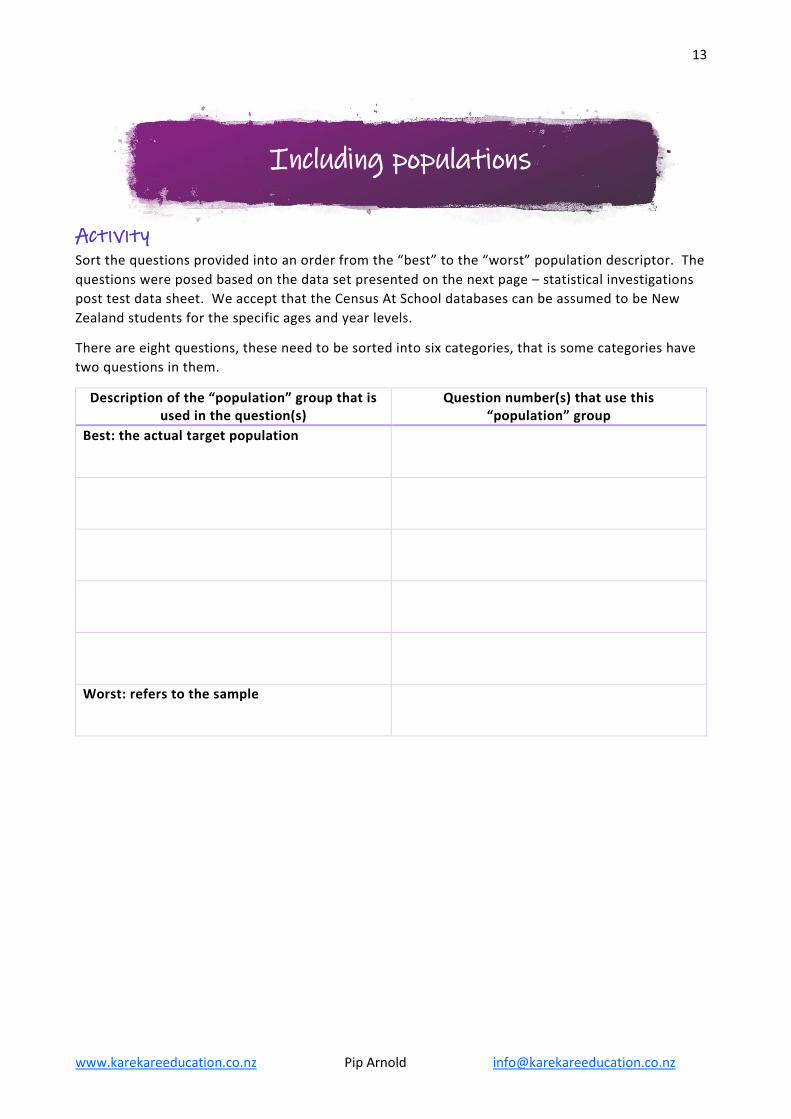
Activity Sort the questions provided into an order from the “best” to the “worst” population descriptor. The questions were posed based on the data set presented on the next page – statistical investigations post test data sheet. We accept that the Census At School databases can be assumed to be New Zealand students for the specific ages and year levels.
There are eight questions, these need to be sorted into six categories, that is some categories have two questions in them.
Description of the “population” group that is used in the question(s)
Question number(s) that use this “population” group
Best: the actual target population
Worst: refers to the sample
Including populations
14
www.karekareeducation.co.nz Pip Arnold [email protected]
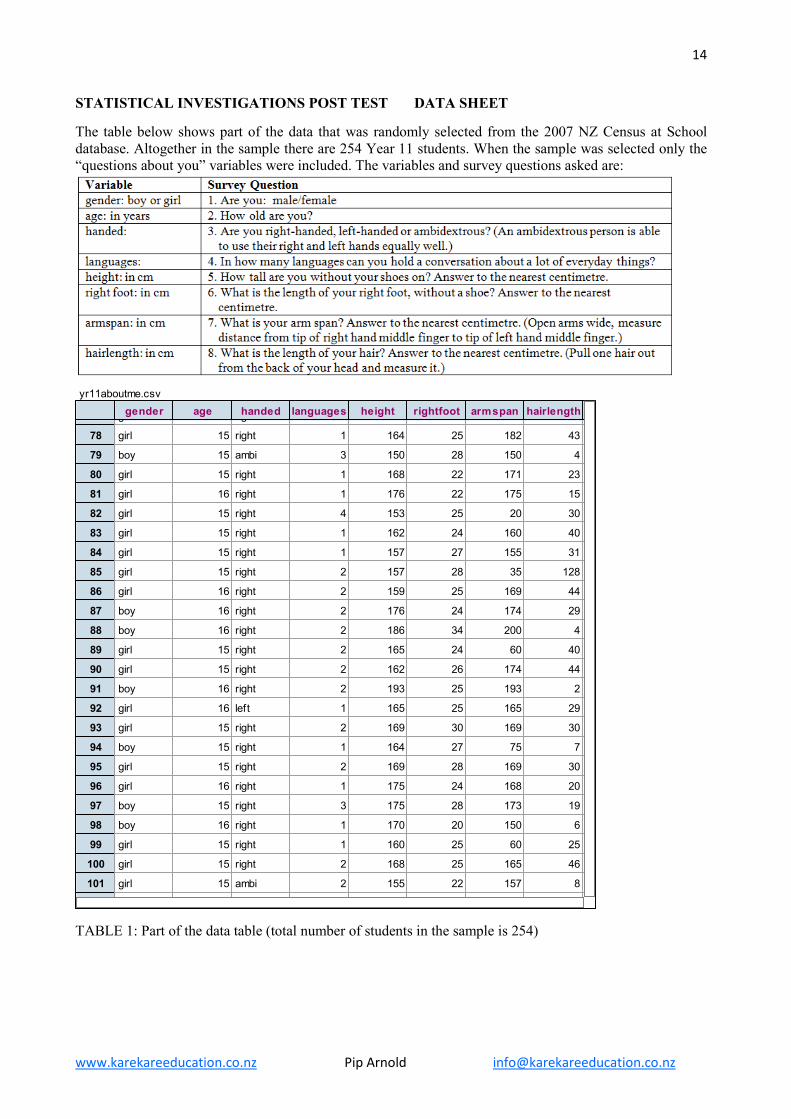
STATISTICAL INVESTIGATIONS POST TEST DATA SHEET
The table below shows part of the data that was randomly selected from the 2007 NZ Census at School database. Altogether in the sample there are 254 Year 11 students. When the sample was selected only the “questions about you” variables were included. The variables and survey questions asked are:
TABLE 1: Part of the data table (total number of students in the sample is 254)
yr11aboutme.csvgender age handed languages height rightfoot armspan hairlength
78
79
80
81
82
83
84
85
86
87
88
89
90
91
92
93
94
95
96
97
98
99
100
101
g 6 g t 0 5 3 35
girl 15 right 1 164 25 182 43
boy 15 ambi 3 150 28 150 4
girl 15 right 1 168 22 171 23
girl 16 right 1 176 22 175 15
girl 15 right 4 153 25 20 30
girl 15 right 1 162 24 160 40
girl 15 right 1 157 27 155 31
girl 15 right 2 157 28 35 128
girl 16 right 2 159 25 169 44
boy 16 right 2 176 24 174 29
boy 16 right 2 186 34 200 4
girl 15 right 2 165 24 60 40
girl 15 right 2 162 26 174 44
boy 16 right 2 193 25 193 2
girl 16 left 1 165 25 165 29
girl 15 right 2 169 30 169 30
boy 15 right 1 164 27 75 7
girl 15 right 2 169 28 169 30
girl 16 right 1 175 24 168 20
boy 15 right 3 175 28 173 19
boy 16 right 1 170 20 150 6
girl 15 right 1 160 25 60 25
girl 15 right 2 168 25 165 46
girl 15 ambi 2 155 22 157 8
15
www.karekareeducation.co.nz Pip Arnold [email protected]
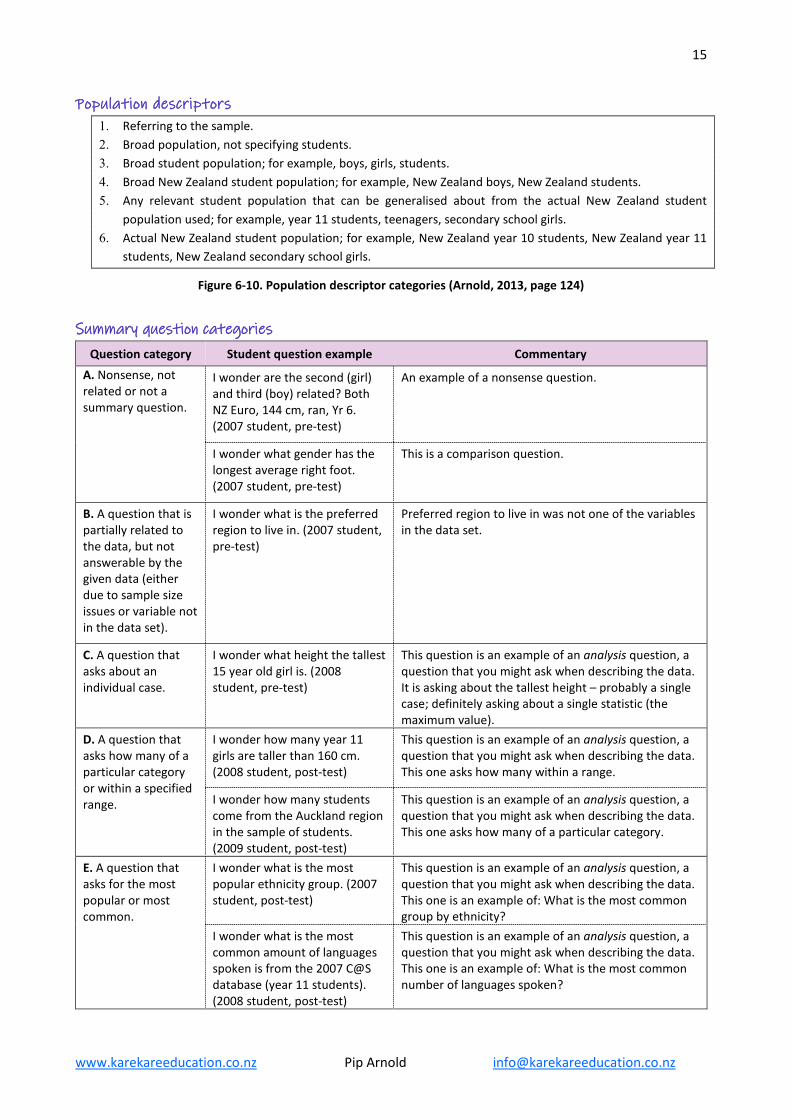
Population descriptors 1. Referring to the sample. 2. Broad population, not specifying students. 3. Broad student population; for example, boys, girls, students. 4. Broad New Zealand student population; for example, New Zealand boys, New Zealand students. 5. Any relevant student population that can be generalised about from the actual New Zealand student
population used; for example, year 11 students, teenagers, secondary school girls. 6. Actual New Zealand student population; for example, New Zealand year 10 students, New Zealand year 11
students, New Zealand secondary school girls.
Figure 6-10. Population descriptor categories (Arnold, 2013, page 124)
Summary question categories Question category Student question example Commentary
A. Nonsense, not related or not a summary question.
I wonder are the second (girl) and third (boy) related? Both NZ Euro, 144 cm, ran, Yr 6. (2007 student, pre-test)
An example of a nonsense question.
I wonder what gender has the longest average right foot. (2007 student, pre-test)
This is a comparison question.
B. A question that is partially related to the data, but not answerable by the given data (either due to sample size issues or variable not in the data set).
I wonder what is the preferred region to live in. (2007 student, pre-test)
Preferred region to live in was not one of the variables in the data set.
C. A question that asks about an individual case.
I wonder what height the tallest 15 year old girl is. (2008 student, pre-test)
This question is an example of an analysis question, a question that you might ask when describing the data. It is asking about the tallest height – probably a single case; definitely asking about a single statistic (the maximum value).
D. A question that asks how many of a particular category or within a specified range.
I wonder how many year 11 girls are taller than 160 cm. (2008 student, post-test)
This question is an example of an analysis question, a question that you might ask when describing the data. This one asks how many within a range.
I wonder how many students come from the Auckland region in the sample of students. (2009 student, post-test)
This question is an example of an analysis question, a question that you might ask when describing the data. This one asks how many of a particular category.
E. A question that asks for the most popular or most common.
I wonder what is the most popular ethnicity group. (2007 student, post-test)
This question is an example of an analysis question, a question that you might ask when describing the data. This one is an example of: What is the most common group by ethnicity?
I wonder what is the most common amount of languages spoken is from the 2007 C@S database (year 11 students). (2008 student, post-test)
This question is an example of an analysis question, a question that you might ask when describing the data. This one is an example of: What is the most common number of languages spoken?
16
www.karekareeducation.co.nz Pip Arnold [email protected]
Question category Student question example Commentary
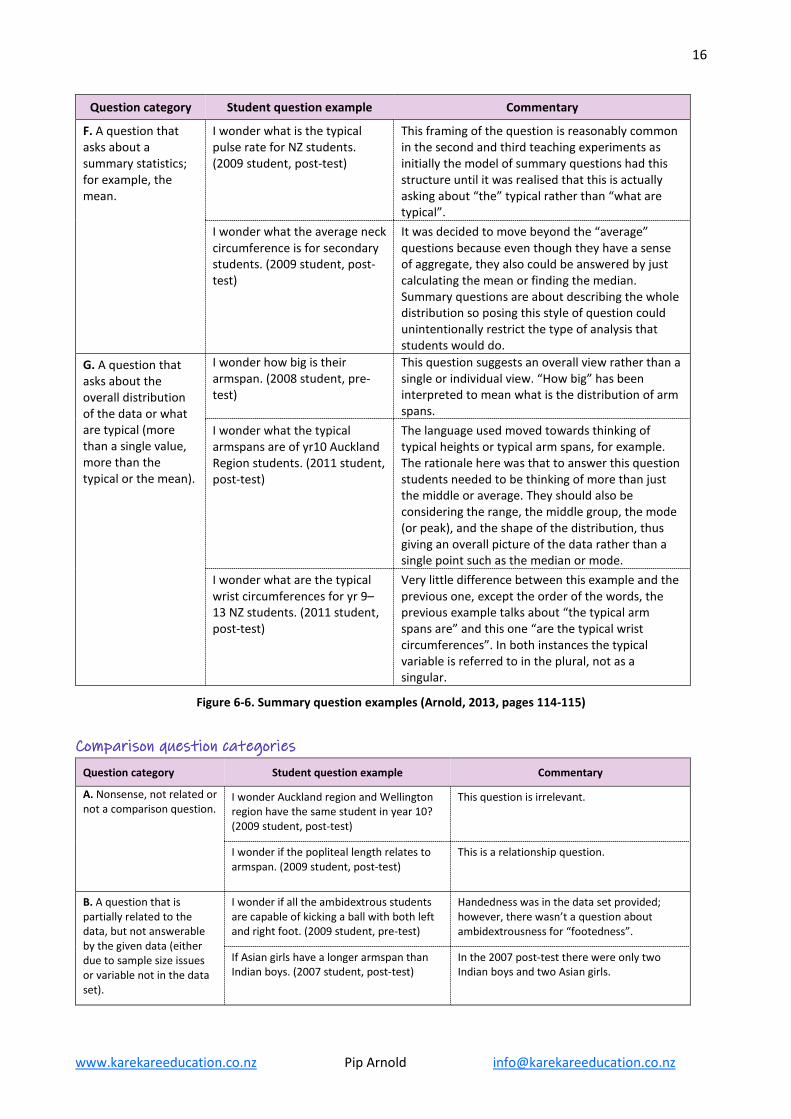
F. A question that asks about a summary statistics; for example, the mean.
I wonder what is the typical pulse rate for NZ students. (2009 student, post-test)
This framing of the question is reasonably common in the second and third teaching experiments as initially the model of summary questions had this structure until it was realised that this is actually asking about “the” typical rather than “what are typical”.
I wonder what the average neck circumference is for secondary students. (2009 student, post-test)
It was decided to move beyond the “average” questions because even though they have a sense of aggregate, they also could be answered by just calculating the mean or finding the median. Summary questions are about describing the whole distribution so posing this style of question could unintentionally restrict the type of analysis that students would do.
G. A question that asks about the overall distribution of the data or what are typical (more than a single value, more than the typical or the mean).
I wonder how big is their armspan. (2008 student, pre-test)
This question suggests an overall view rather than a single or individual view. “How big” has been interpreted to mean what is the distribution of arm spans.
I wonder what the typical armspans are of yr10 Auckland Region students. (2011 student, post-test)
The language used moved towards thinking of typical heights or typical arm spans, for example. The rationale here was that to answer this question students needed to be thinking of more than just the middle or average. They should also be considering the range, the middle group, the mode (or peak), and the shape of the distribution, thus giving an overall picture of the data rather than a single point such as the median or mode.
I wonder what are the typical wrist circumferences for yr 9–13 NZ students. (2011 student, post-test)
Very little difference between this example and the previous one, except the order of the words, the previous example talks about “the typical arm spans are” and this one “are the typical wrist circumferences”. In both instances the typical variable is referred to in the plural, not as a singular.
Figure 6-6. Summary question examples (Arnold, 2013, pages 114-115)
Comparison question categories
Question category Student question example Commentary
A. Nonsense, not related or not a comparison question.
I wonder Auckland region and Wellington region have the same student in year 10? (2009 student, post-test)
This question is irrelevant.
I wonder if the popliteal length relates to armspan. (2009 student, post-test)
This is a relationship question.
B. A question that is partially related to the data, but not answerable by the given data (either due to sample size issues or variable not in the data set).
I wonder if all the ambidextrous students are capable of kicking a ball with both left and right foot. (2009 student, pre-test)
Handedness was in the data set provided; however, there wasn’t a question about ambidextrousness for “footedness”.
If Asian girls have a longer armspan than Indian boys. (2007 student, post-test)
In the 2007 post-test there were only two Indian boys and two Asian girls.
17
www.karekareeducation.co.nz Pip Arnold [email protected]
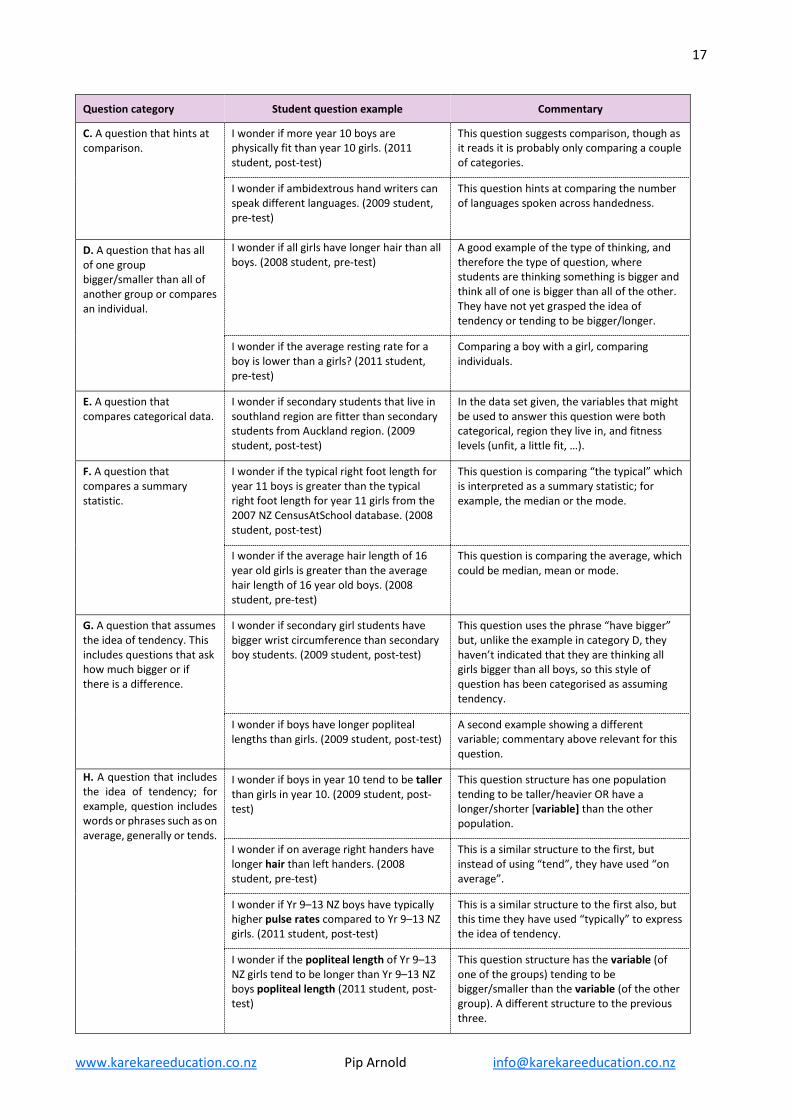
Question category Student question example Commentary
C. A question that hints at comparison.
I wonder if more year 10 boys are physically fit than year 10 girls. (2011 student, post-test)
This question suggests comparison, though as it reads it is probably only comparing a couple of categories.
I wonder if ambidextrous hand writers can speak different languages. (2009 student, pre-test)
This question hints at comparing the number of languages spoken across handedness.
D. A question that has all of one group bigger/smaller than all of another group or compares an individual.
I wonder if all girls have longer hair than all boys. (2008 student, pre-test)
A good example of the type of thinking, and therefore the type of question, where students are thinking something is bigger and think all of one is bigger than all of the other. They have not yet grasped the idea of tendency or tending to be bigger/longer.
I wonder if the average resting rate for a boy is lower than a girls? (2011 student, pre-test)
Comparing a boy with a girl, comparing individuals.
E. A question that compares categorical data.
I wonder if secondary students that live in southland region are fitter than secondary students from Auckland region. (2009 student, post-test)
In the data set given, the variables that might be used to answer this question were both categorical, region they live in, and fitness levels (unfit, a little fit, …).
F. A question that compares a summary statistic.
I wonder if the typical right foot length for year 11 boys is greater than the typical right foot length for year 11 girls from the 2007 NZ CensusAtSchool database. (2008 student, post-test)
This question is comparing “the typical” which is interpreted as a summary statistic; for example, the median or the mode.
I wonder if the average hair length of 16 year old girls is greater than the average hair length of 16 year old boys. (2008 student, pre-test)
This question is comparing the average, which could be median, mean or mode.
G. A question that assumes the idea of tendency. This includes questions that ask how much bigger or if there is a difference.
I wonder if secondary girl students have bigger wrist circumference than secondary boy students. (2009 student, post-test)
This question uses the phrase “have bigger” but, unlike the example in category D, they haven’t indicated that they are thinking all girls bigger than all boys, so this style of question has been categorised as assuming tendency.
I wonder if boys have longer popliteal lengths than girls. (2009 student, post-test)
A second example showing a different variable; commentary above relevant for this question.
H. A question that includes the idea of tendency; for example, question includes words or phrases such as on average, generally or tends.
I wonder if boys in year 10 tend to be taller than girls in year 10. (2009 student, post-test)
This question structure has one population tending to be taller/heavier OR have a longer/shorter [variable] than the other population.
I wonder if on average right handers have longer hair than left handers. (2008 student, pre-test)
This is a similar structure to the first, but instead of using “tend”, they have used “on average”.
I wonder if Yr 9–13 NZ boys have typically higher pulse rates compared to Yr 9–13 NZ girls. (2011 student, post-test)
This is a similar structure to the first also, but this time they have used “typically” to express the idea of tendency.
I wonder if the popliteal length of Yr 9–13 NZ girls tend to be longer than Yr 9–13 NZ boys popliteal length (2011 student, post-test)
This question structure has the variable (of one of the groups) tending to be bigger/smaller than the variable (of the other group). A different structure to the previous three.
18
www.karekareeducation.co.nz Pip Arnold [email protected]
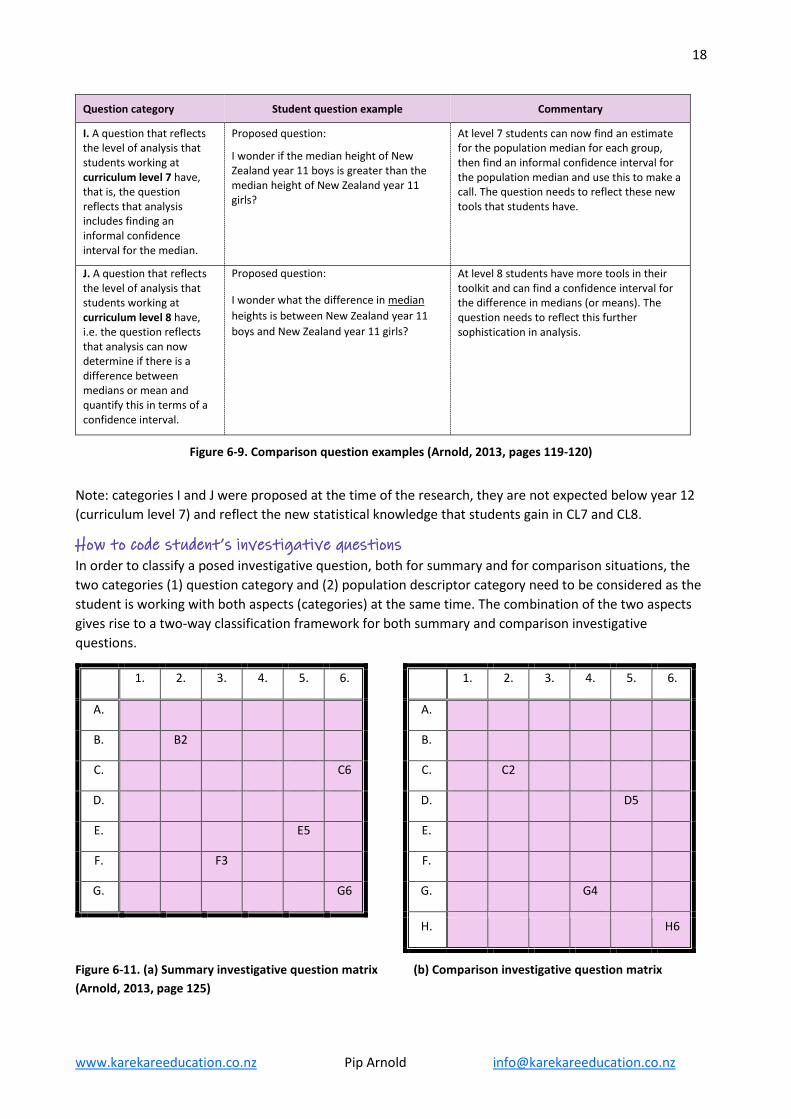
Question category Student question example Commentary
I. A question that reflects the level of analysis that students working at curriculum level 7 have, that is, the question reflects that analysis includes finding an informal confidence interval for the median.
Proposed question:
I wonder if the median height of New Zealand year 11 boys is greater than the median height of New Zealand year 11 girls?
At level 7 students can now find an estimate for the population median for each group, then find an informal confidence interval for the population median and use this to make a call. The question needs to reflect these new tools that students have.
J. A question that reflects the level of analysis that students working at curriculum level 8 have, i.e. the question reflects that analysis can now determine if there is a difference between medians or mean and quantify this in terms of a confidence interval.
Proposed question:
I wonder what the difference in median heights is between New Zealand year 11 boys and New Zealand year 11 girls?
At level 8 students have more tools in their toolkit and can find a confidence interval for the difference in medians (or means). The question needs to reflect this further sophistication in analysis.
Figure 6-9. Comparison question examples (Arnold, 2013, pages 119-120)
Note: categories I and J were proposed at the time of the research, they are not expected below year 12 (curriculum level 7) and reflect the new statistical knowledge that students gain in CL7 and CL8.
How to code student’s investigative questions In order to classify a posed investigative question, both for summary and for comparison situations, the two categories (1) question category and (2) population descriptor category need to be considered as the student is working with both aspects (categories) at the same time. The combination of the two aspects gives rise to a two-way classification framework for both summary and comparison investigative questions.
1. 2. 3. 4. 5. 6. 1. 2. 3. 4. 5. 6.
A. A.
B. B2 B.
C. C6 C. C2
D. D. D5
E. E5 E.
F. F3 F.
G. G6 G. G4
H. H6
Figure 6-11. (a) Summary investigative question matrix (b) Comparison investigative question matrix (Arnold, 2013, page 125)
19
www.karekareeducation.co.nz Pip Arnold [email protected]
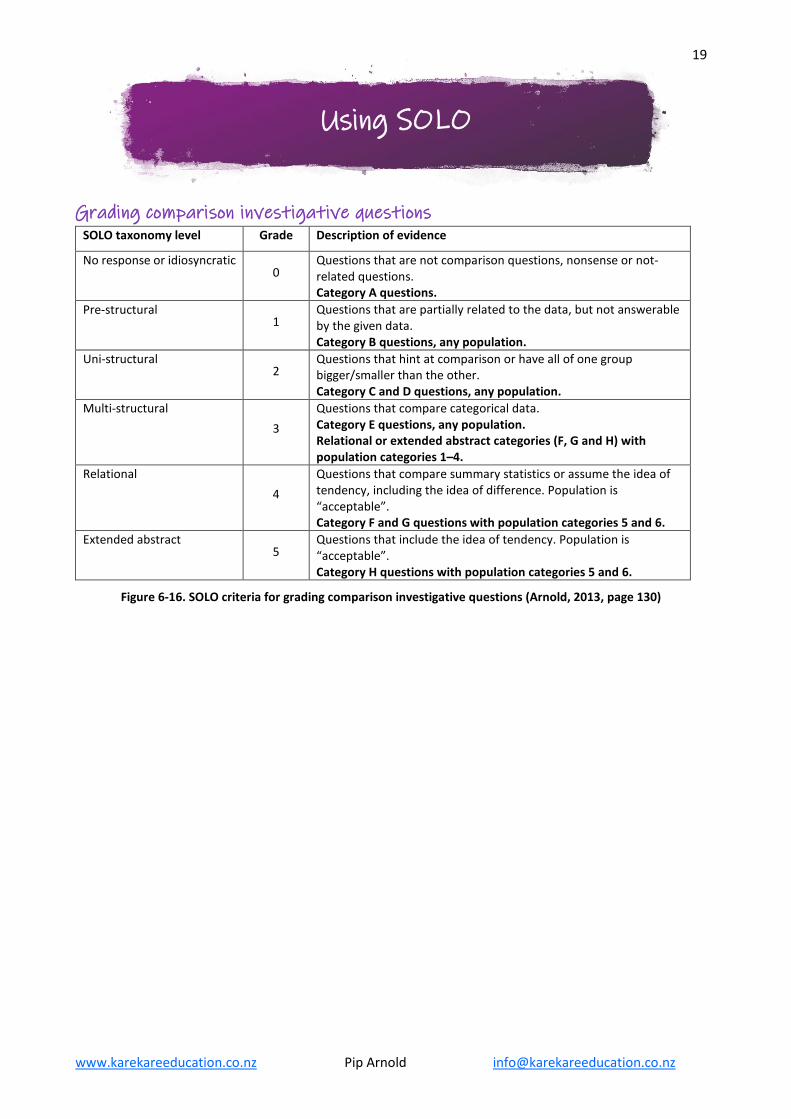
Grading comparison investigative questions SOLO taxonomy level Grade Description of evidence
No response or idiosyncratic 0
Questions that are not comparison questions, nonsense or not-related questions. Category A questions.
Pre-structural 1
Questions that are partially related to the data, but not answerable by the given data. Category B questions, any population.
Uni-structural 2
Questions that hint at comparison or have all of one group bigger/smaller than the other. Category C and D questions, any population.
Multi-structural 3
Questions that compare categorical data. Category E questions, any population. Relational or extended abstract categories (F, G and H) with population categories 1–4.
Relational 4
Questions that compare summary statistics or assume the idea of tendency, including the idea of difference. Population is “acceptable”. Category F and G questions with population categories 5 and 6.
Extended abstract 5
Questions that include the idea of tendency. Population is “acceptable”. Category H questions with population categories 5 and 6.
Figure 6-16. SOLO criteria for grading comparison investigative questions (Arnold, 2013, page 130)
Using SOLO
20
www.karekareeducation.co.nz Pip Arnold [email protected]
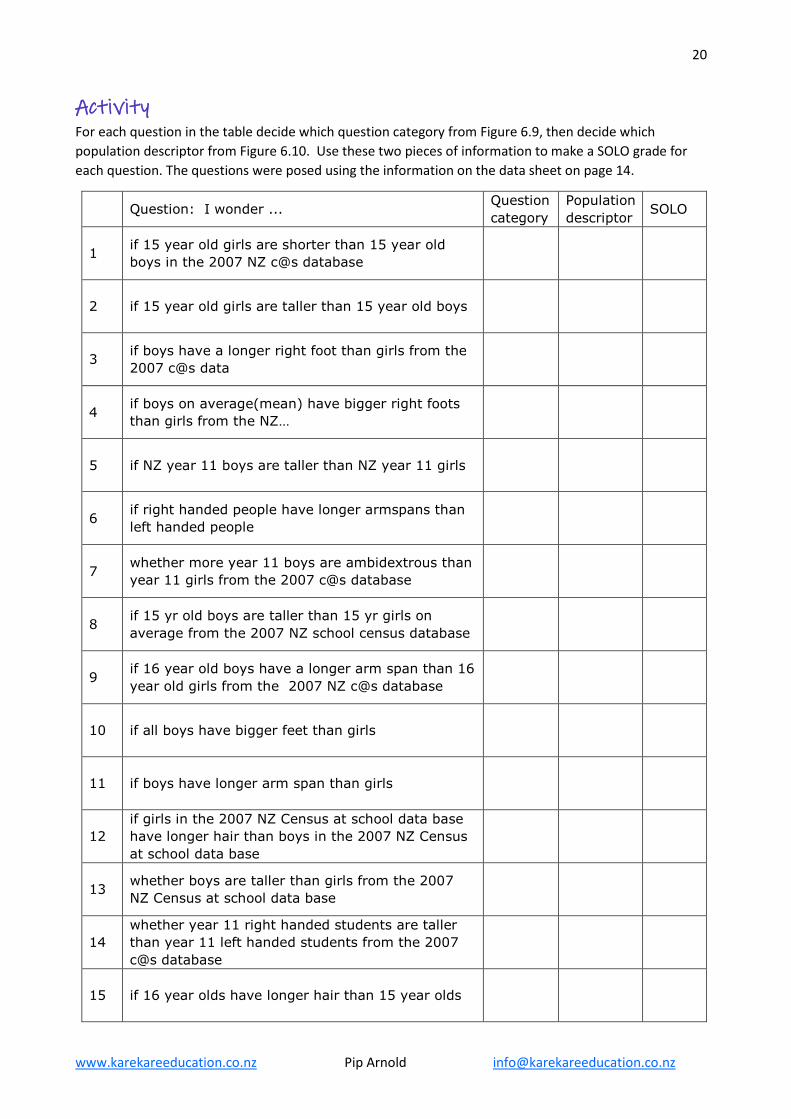
Activity For each question in the table decide which question category from Figure 6.9, then decide which population descriptor from Figure 6.10. Use these two pieces of information to make a SOLO grade for each question. The questions were posed using the information on the data sheet on page 14.
Question: I wonder ... Question category
Population descriptor SOLO
1 if 15 year old girls are shorter than 15 year old boys in the 2007 NZ c@s database
2 if 15 year old girls are taller than 15 year old boys
3 if boys have a longer right foot than girls from the 2007 c@s data
4 if boys on average(mean) have bigger right foots than girls from the NZ…
5 if NZ year 11 boys are taller than NZ year 11 girls
6 if right handed people have longer armspans than left handed people
7 whether more year 11 boys are ambidextrous than year 11 girls from the 2007 c@s database
8 if 15 yr old boys are taller than 15 yr girls on average from the 2007 NZ school census database
9 if 16 year old boys have a longer arm span than 16 year old girls from the 2007 NZ c@s database
10 if all boys have bigger feet than girls
11 if boys have longer arm span than girls
12 if girls in the 2007 NZ Census at school data base have longer hair than boys in the 2007 NZ Census at school data base
13 whether boys are taller than girls from the 2007 NZ Census at school data base
14 whether year 11 right handed students are taller than year 11 left handed students from the 2007 c@s database
15 if 16 year olds have longer hair than 15 year olds
21
www.karekareeducation.co.nz Pip Arnold [email protected]
Name two people that you can share this with in your school and the particular aspects you wish to share
What new ideas have you learnt today that you can use in your teaching in the future
Reflections
23
www.karekareeducation.co.nz Pip Arnold [email protected]
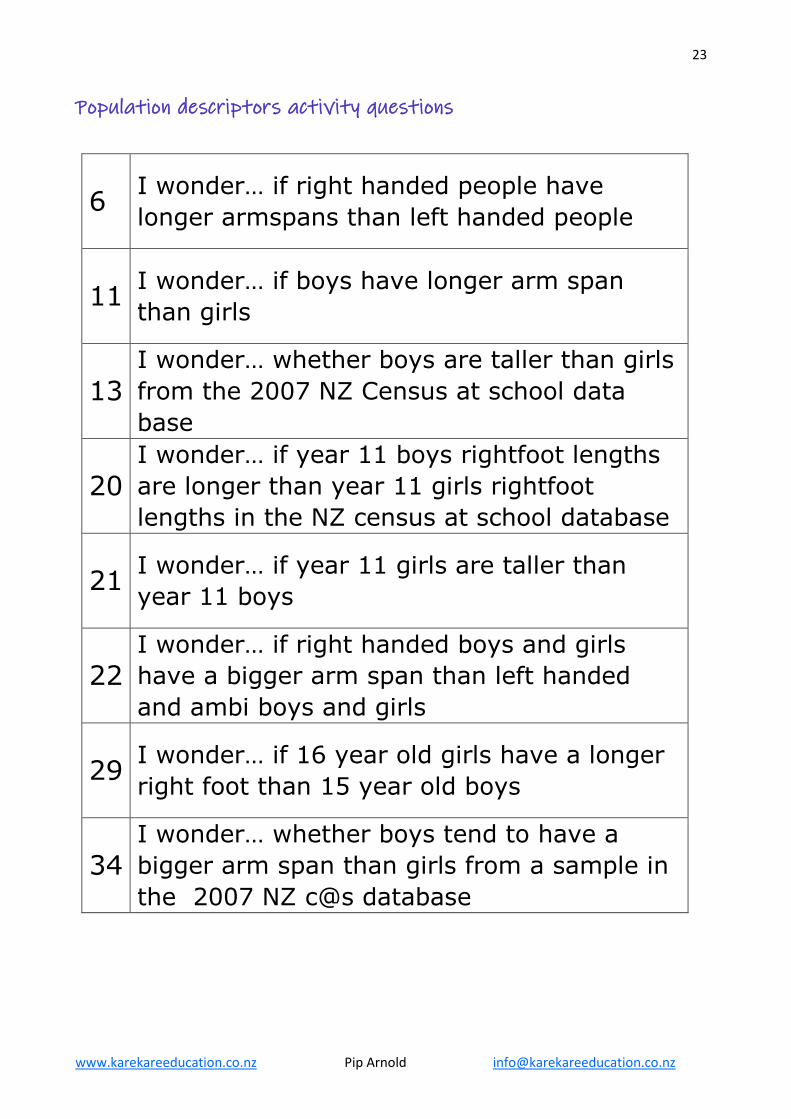
Population descriptors activity questions
6 I wonder… if right handed people have longer armspans than left handed people
11 I wonder… if boys have longer arm span than girls
13 I wonder… whether boys are taller than girls from the 2007 NZ Census at school data base
20 I wonder… if year 11 boys rightfoot lengths are longer than year 11 girls rightfoot lengths in the NZ census at school database
21 I wonder… if year 11 girls are taller than year 11 boys
22 I wonder… if right handed boys and girls have a bigger arm span than left handed and ambi boys and girls
29 I wonder… if 16 year old girls have a longer right foot than 15 year old boys
34 I wonder… whether boys tend to have a bigger arm span than girls from a sample in the 2007 NZ c@s database