Embed Size (px)
Citation preview

QQUESTIONUESTION O ONENE::
(a). Define the terms instrumentation, measurement and quantity.
Instrumentation: The design, provision, or use of measuring instrumentsMeasurement: The process or the result of determining the physical quantity or ratio of a, such as a length or a mass, to a unit of measurement, such as the metre or the kilogram. The science of measurement is called metrology.Quantity: The extent, size, or sum of countable or measurable discrete events, objects, or phenomenon, expressed as a numerical value.
(b). Re-draw Table T1, filling in relevant physical relations leading to the SI dimensions for the following sixteen mechanico-electrical measurands. Examples are given for volume and velocity.
VARIABLE WORD SYMBOL
RELATIONS DIMENSION
1. Volume V - L2
2. Velocity v
3. Acceleration A4. Force F5. Momentum M6. Work W7 Power P8.
Charge q
9. Magnetic field H
10. Magnetic moment
M
11. Magnetization M
12. Current I
13. Quantity Q
14. Electromotive force
E
15. Resistance R

16. Capacity C
VARIABLE WORD SYMBOL
RELATIONS DIMENSION
1. Volume V L2
2. Velocity v
3. Acceleration A
4. Force F (Newton)5. Momentum M6. Work W7 Power P
8.Charge q
Fd2=kqq’(Coulomb)
9. Magnetic field HFM=qH,
10. Magnetic moment
M ql
11. Magnetization M M/V
12. Current I Hl
13. Quantity Q It
14. Electromotive force
E W/Q
15. Resistance R E/I (Ohm)
16. Capacity C Q/E

(c). Through dimensional analysis, prove homogeneity for:
(i). The energy E of a vibrating wire given by
E=cls,
where ℓ is the length, s is the tension and c is a constant.
(ML2/T2) = c L. (ML/T2) = (ML2/T2), since tension [s]=(ML/T2)
(ii). An equation of motion :
s(displacement) = u(initial velocity) X t(time) + 1/2 X a(acceleration)X t2(time)
s = u.t + 1/2 a.t2
Step 1: Identify the terms in the equation and identify which symbol stands for which physical quantity.
The terms here are : s, u.t, a.t2
Step 2: Write down the dimensional formula of each symbol used in the equation. If you are unclear how to do it, go to the first article in this series.
[s] = [L]
[u] = [LT-1]
[t] = [T]
[a] = [LT-2]
Step 3: Calculate the dimension of each term in the equation.
Term 1: [s] = [L]
Term 2: [u.t] = [LT -1.T] = [L]
Term 3: [a.t2] = [LT -2.T2] = [L]

Note that, as stated above, we have canceled dimensions from numerator and denominator like [T -2.T2] .
Conclusion: The equations are dimensionally consistent since all the terms have the same dimensions.
(iii). The energy equations:
(d). Define the following electrical terms. Write out relevant expressions, naming the variables for each term.
(i). Electrical conductivity.
Electrical conductivity or specific conductivity is the measure of a material's ability to conduct an electric current. Conductivity is the reciprocal (inverse) of electrical resistivity.
Electrical conductivity is defined as the ratio of the current density to the electric field strength and can be expressed as
σ = J / E
where
σ = electrical conductivity (1/Ohms m, 1/Ω m, Siemens/m, SI/m)
J = current density (Amps/m2)
E = electric field strength (Volts/m)
(ii). Electrical resistivity.
Conductivity is the reciprocal (inverse) of electrical resistivity. Electrical resistivity can be expressed as
σ = 1 / Ω
where
σ = electrical resistivity (ohm m2/m, ohm m)

(iii). Electrical resistance.
Resistance is a term that describes the forces that oppose the flow of electron current in a conductor.
Electrical resistance of an electrical conductor depends on
the length of the conductor the material of the conductor
the temperature of the material
the cross-sectional area of the conductor
and can be expressed as
R = ρ l / A (1)
where
R = resistance (ohms, Ω)
ρ = resistivity (ohm meter, Ω m)
l = length of conductor (m)
A = cross-sectional area of conductor (m2)
The larger the length of a conducting wire, the more the particles opposing the motion of the charges to the end of the wire, and the larger the cross section area, A, the more the available charges to be moved to constitute current, the larger the current, and the less the resistance.
Resistance values for conductors at any temperature other than the standard temperature (usually specified at 20 Celsius) on the specific resistance table must be determined through yet another formula:

The "alpha" (α) constant is known as the temperature coefficient of resistance, and symbolizes the resistance change factor per degree of temperature change. Just as all materials have a certain specific resistance (at 20o C), they also change resistance according to temperature by certain amounts. For pure metals, this coefficient is a positive number, meaning that resistance increases with increasing temperature. For the elements carbon, silicon, and germanium, this coefficient is a negative number, meaning that resistance decreases with increasing temperature.
As is seen above, the electrical resistance changes with temperature. An intuitive approach to temperature dependence leads one to expect a fractional change in resistance which is proportional to the temperature change:
dR / Rs = α dT (5)
where
dR = change in resistance (ohm)
Rs = standard resistance according reference tables (ohm)
α = temperature coefficient of resistance
dT = change in temperature (K)
(e). Write notes on
(i). inductance and inductor.
and
(ii). Capacitance and capacitor.

(i). Inductance and inductor
Inductance is the property of a circuit when there is an electromagnetic field - EMF - induced into the circuit by the change of flux linkages produced by a current change.
An inductor is a passive electronic component that stores energy in the form of a magnetic field.
The standard unit of inductance is the henry abbreviated H. This is a large unit and more commonly used units are the microhenry abbreviated μH (1 μH =10-6H) and the millihenry abbreviated mH (1 mH =10-3 H). Occasionally, the nanohenry abbreviated nH (1 nH = 10-9 H) is used.
The unit of inductance is henry - H - where a circuit has an inductance of one henry when an e.m.f. of one volt is induced by a current changing at the rate of one ampere per second.
Induced electromagnetic field - EMF - in a coil can be expressed as
E = -n dΦ / dt (1)
where
E = electromagnetic field - EMF (Volts)
n = turns
dΦ = change in flux (Webers, Wb)
dt = time (s)
Alternatively, induced electromagnetic field - EMF - in a coil of inductance L henrys can be expressed as
E = -L dI / dt (2)
where
L = inductance (henrys, H)
dI = change in current (Amperes)
dt = time (s)
(ii). Capacitance and capacitor.
In electromagnetism and electronics, capacitance is the ability of a capacitor to store energy in an electric field. Capacitance is also a measure of the amount of electric potential energy stored

(or separated) for a given electric potential. A common form of energy storage device is a parallel-plate capacitor. In a parallel plate capacitor, capacitance is directly proportional to the surface area of the conductor plates and inversely proportional to the separation distance between the plates.
where
C is the capacitance;A is the area of overlap of the two plates;εr is the relative static permittivity (sometimes called the dielectric constant) of the material between the plates (for a vacuum, εr = 1);ε0 is the electric constant (ε0 ≈ 8.854×10⁻¹² F m–1); andd is the separation between the plates.
Capacitance is proportional to the area of overlap and inversely proportional to the separation between conducting sheets. The closer the sheets are to each other, the greater the capacitance.
Parallel Plate Capacitor
From the above arrangement, it is seen that on one hand, the larger the cross sectional area of the plates, the more the charges, therefore the bigger the electric field, thus the larger the capacitance. On the other hand, the smaller the distance between the plates, the more “squezzed” is the electric field and the greater the capacitance.
The capacitance can be expressed as
C = Q / V

One farad is defined as the capacitance of a capacitor when there is a potential difference across the plates of one volt when holding a charge of one volt.
It is common to use µF (10-6 F).
(f). Referring to the crystal structure and piezoelectric coefficient of materials, discuss piezoelectricity.
Piezo means pressure in Greek. In a piezoelectric effect, energy is converted from the
mechanical to the electrical form. Specifically, when pressure is applied to a polarized
crystal, the resulting mechanical deformation results in an electrical charge as is illustrated.
Internal Structure of an electret
This effect was discovered in the 1880's by the Curie brothers.

A sensor based on the piezoelectric effect
The resulting surface charge is Qf = d F. This charge results in a voltage , where is the charge resulting from a force f, and C is the capacitance of the device.
In fact, the force is a vector quantity, and the d (piezoelectric coefficient) is a 3x3 matrix. Forces along the x axis produce charges along the x, y, and z axes, with the charge along the x axis given by the d11 coefficient of the matrix, the charge along the y axis given by the d21 coefficient, and so on.

Piezoelectric coefficients have been tabulated for several materials (primarily those materials with large coefficients), and a table of coefficients is in the textbooks. Typical values of the piezoelectric charge coefficients are 1-100 pico-coulombs/N.
(g). A 1 cm x 1cm slab of 1 mm thick piezoelectric material has a 1 N force applied along the z axis, which is the 1mm dimension. Determine
(i). the voltage appearing across electrodes on the large surfaces.
(ii). the capacitance of this device.
(iii). the change in length of the crystal changed under this load of 1 N.
QQUESTIONUESTION T TWOWO::
(a).

(i). Using a block diagram, explain the three elements in a basic instrument system.
A block diagram of a basic system is shown.
(ii). Name three industries using the systems in (i).1. Auto Industry. There are 15 million cars sold a year in the US. Most components cost $5.
If the auto industry wants something, they usually get it. Right now, they want to detect skids, detect the location and orientation of the passengers, and they want to provide navigational assistance to drivers.
2. Medical Industry. You only have to watch ER or any other hospital-based drama on TV to be shown several examples each hour of sensor-based medical technology. The big things this industry wants are blood chemistry sensors, low-cost, high speed diagnostics, implantable therapeutic devices, and DNA testing.
3. The Department of Defense (DoD). The cold war might be over, but the DoD still has the largest basic research budget in the world. The DoD loves sensors, and is very interested in technologies that allow us to wage war without putting personnel at risk. Night vision, navigation, "smart" soldier, smart munitions, bullets, etc, Stealth technologies for Sonar and Radar, and many more. The DoD usually gets what they want, and they have the $$$ to pay for people to work on their problems, so things will emerge.
(b). Differentiate between a sensor and an actuator.
(i). A sensor is a device which converts a physical phenomena into an electrical signal. As such, sensors represent part of the interface between the physical world and the world of electrical devices, such as computers. The other part of this interface is represented by Actuators, which convert electrical signals into physical phenomena.
(c). Define the following sensor performance characteristics.
(i). Transfer Function:
The functional relationship between physical input signal and electrical output signal. Usually, this relationship is represented as a graph showing the relationship between the input and output signal, and the details of this relationship may constitute a complete description of the sensor characteristics. For expensive sensors which are individually calibrated, this might take the form of the certified calibration curve.

(ii). Sensitivity:
The sensitivity is defined in terms of the relationship between input physical signal and output electrical signal. The sensitivity is generally the ratio between a small change in electrical signal to a small change in physical signal. As such, it may be expressed as the derivative of the transfer function with respect to physical signal. Typical units: Volts/Kelvin. A Thermometer would have "high sensitivity" if a small temperature change resulted in a large voltage change.
(iii). Span or Dynamic Range:
The range of input physical signals which may be converted to electrical signals by the sensor. Signals outside of this range are expected to cause unacceptably large inaccuracy. This span or dynamic range is usually specified by the sensor supplier as the range over which other performance characteristics described in the data sheets are expected to apply. Typical units: Kelvin
(iv). Accuracy:
Generally defined as the largest expected error between actual and ideal output signals. Typical Units: Kelvin. Sometimes this is quoted as a fraction of the full scale output. For example, a thermometer might be guaranteed accurate to within 5% of FSO (Full Scale Output)
(v). Hysteresis:
Some sensors do not return to the same output value when the input stimulus is cycled up or down. The width of the expected error in terms of the measured quantity is defined as the hysteresis. Typical units: Kelvin or % of FSO
(vi). Nonlinearity (often called Linearity):
The maximum deviation from a linear transfer function over the specified dynamic range. There are several measures of this error. The most common compares the actual transfer function with the `best straight line', which lies midway between the two parallel lines which encompasses the entire transfer function over the specified dynamic range of the device. This choice of comparison method is popular because it makes most sensors look the best.
(vii). Noise:
All sensors produce some output noise in addition to the output signal. In some cases, the noise of the sensor is less than the noise of the next element in the electronics, or less than the fluctuations in the physical signal, in which case it is not important. Many other cases exist in which the noise of the sensor limits the performance of the system based on the sensor. Noise is generally distributed across the frequency spectrum. Many common

noise sources produce a white noise distribution, which is to say that the spectral noise density is the same at all frequencies. Johnson noise in a resistor is a good example of such a noise distribution. For white noise, the spectral noise density is characterized in units of Volts/Root(Hz). A distribution of this nature adds noise to a measurement with amplitude proportional to the square root of the measurement bandwidth. Since there is an inverse relationship between the bandwidth and measurement time, it can be said that the noise decreases with the square root of the measurement time.
Resolution:
The resolution of a sensor is defined as the minimum detectable signal fluctuation. Since fluctuations are temporal phenomena, there is some relationship between the timescale for the fluctuation and the minimum detectable amplitude. Therefore, the definition of resolution must include some information about the nature of the measurement being carried out. Many sensors are limited by noise with a white spectral distribution. In these cases, the resolution may be specified in units of physical signal/Root(Hz). Then, the actual resolution for a particular measurement may be obtained by multiplying this quantity by the square root of the measurement bandwidth. Sensor data sheets generally quote resolution in units of signal/Root(Hz) or they give a minimum detectable signal for a specific measurement. If the shape of the noise distribution is also specified, it is possible to generalize these results to any measurement.
Bandwidth:
All sensors have finite response times to an instantaneous change in physical signal. In addition, many sensors have decay times, which would represent the time after a step change in physical signal for the sensor output to decay to its original value. The reciprocal of these times correspond to the upper and lower cutoff frequencies, respectively. The bandwidth of a sensor is the frequency range between these two frequencies.
(d). Use circuit diagrams and relevant mathematical expressions, where necessary, to explain the principles of the following types of sensors:
(i). Resistive

Voltage Divider
Resistive devices obey Ohm's law, which basically states that when current flows through a resistor, there will be a voltage difference across the resistor. So, one way to measure resistance is to force a current to flow and measure the voltage drop. Current sources can be built in number of ways (see Horowitz and Hill for loads of good examples). One of the easiest current sources to build is to take a voltage source and a stable resistor whose resistance is much larger than the one you're interested in measuring. The reference resistor is called a load resistor, and the two resistor configuration is sometimes called a resistive bridge. Analyzing the connected load and sense resistors as shown in Figure 1, we can see that the current flowing through the circuit is nearly constant, since most of the resistance in the circuit is constant. Therefore, the voltage across the sense resistor is nearly proportional to the resistance of the sense resistor.
As stated, the load resistor must be much larger than the sense resistor for this circuit to offer good linearity. As a result, the output voltage will be much smaller than the input voltage. Therefore, some amplification will be needed.
(ii). Capacitive
Many sensors respond to physical signals by producing a change in capacitance. How is capacitance measured? Essentially, all capacitors have an impedance which is given by
where `f' is the oscillation frequency in Hz, ‘ω’ is in rad/sec, and `C' is the capacitance in Farads. The `i' in this equation is the square root of -1, and signifies the phase shift between the current through a capacitor and the voltage across the capacitor.

Now, ideal capacitors cannot pass current at DC, since there is a physical separation between the conductive elements. However, oscillating voltages induce charge oscillations on the plates of the capacitor, which act as if there is physical charge flowing through the circuit. Since the oscillation reverses direction before substantial charges accumulate, there are no problems. The effective resistance of the capacitor is a meaningful characteristic, as long as we are talking about oscillating voltages.
With this in mind, the capacitor looks very much like a resistor. Therefore, we may measure capacitance by building voltage divider circuits as in Figure. 1, and we may use either a resistor or a capacitor as the load resistance. It is generally easiest to use a resistor, since inexpensive resistors are available which have much smaller temperature coefficients than any reference capacitor. Following this analogy, we may build capacitance bridges as well. The only substantial difference is that these circuits must be biased with oscillating voltages. Since the ‘resistance’ of the capacitor depends on the frequency of the AC bias, it is important to select this frequency carefully. By doing so, all of the advantages of bridges for resistance measurement are also available for capacitance measurement.
However, providing an AC bias is a substantial hassle. Moreover, converting the AC signal to a dc signal for a microprocessor interface can be a substantial hassle. On the other hand, the availability of a modulated signal creates an opportunity for use of some advanced sampling and processing techniques. Several good examples are described in the textbook, and there are several more in any good circuits book, such as Horowitz and Hill. Generally speaking, voltage oscillations must be used to bias the sensor. It can also be used to trigger voltage sampling circuits in a way that automatically subtracts the voltages from opposite clock phases. Such a technique is very valuable, because signals which oscillate at the correct frequency are added up, while any noise signals at all other frequencies are subtracted away. One reason these circuits have become popular in recent years is that they may be easily designed and fabricated using ordinary digital VLSI fabrication tools. Clocks and switches are easily made from transistors in CMOS circuits. Therefore, such designs can be included at very small additional cost - remember that the oscillator circuit has to be there to bias the sensor anyway.
So, capacitance measuring circuits are increasingly implemented as integrated clock/sample circuits of various kinds. Such circuits are capable of good capacitance measurement, but not of very high performance measurement, since the clocked switches inject noise charges into the circuit. These injected charges result in voltage offsets and errors which are very difficult to eliminate entirely. Therefore, very accurate capacitance measurement still requires expensive precision circuitry.
(iii). Inductive
Inductances are also essentially resistive elements. The ‘resistance’ of an inductor is given by

(where L is the inductance), and this resistance may be compared with the resistance of any other passive element in a divider circuit or in a bridge circuit as shown in Figure 1 above. Inductive sensors generally require expensive techniques for the fabrication of the sensor mechanical structure, so inexpensive circuits are not generally of much use. In large part, this is because inductors are generally 3-dimensional devices, consisting of a wire coiled around a form. As a result, inductive measuring circuits are most often of the traditional variety, relying on resistance divider approaches.
(e). Discuss the limitations in the use of
(i). resistive sensing
Lead Resistance - The wires leading from the resistive sensor element have resistance of their own. These resistances may be large enough to add errors to the measurement, and they may have temperature dependencies which are large enough to matter. One useful solution to the problem is the use of the so-called 4-wire resistance approach (Figure. 2). In this case, current (from a current source as in Figure. 1) is passed through the leads and through the sensor element. A second pair of wires is independently attached to the sensor leads, and a voltage reading is made across these two wires alone.
Lead Resistance Compensation with 4-wire measurement. Note that ‘E’ represents a voltage measurement.
It is assumed that the voltage measuring instrument does not draw significant current (see next point), so it simply measures the voltage drop across the sensor element alone. Such a 4-wire configuration is especially important when the sensor resistance is small, and the lead resistance is most likely to be a significant problem.
Output Impedance - The measuring network has a characteristic resistance which, simply put, places a lower limit on the value of a resistance which may be connected across the output terminals without changing the output voltage. For example, if the

thermistor resistance is 10kΩ and the load resistor resistance is 1 MΩ, the output impedance of this circuit is approximately 10kΩ. If a 1kΩ resistor is connected across the output leads, the output voltage would be reduced by about 90%. This is because the load applied to the circuit (1kΩ) is much smaller than the output impedance of the circuit (10kΩ), and the output is `loaded down'. So, we must be concerned with the effective resistance of any measuring instrument that we might attach to the output of such a circuit. This is a well-known problem, so measuring instruments are often designed to offer maximum input impedance, so as to minimize loading effects. In our discussions we must be careful to arrange for instrument input impedance to be much greater than sensor output impedance.
(ii). capacitive sensing.
Stray Capacitance - Any wire in a real world environment has a finite capacitance with respect to ground. If we have a sensor which has an output which looks like a capacitor, we must be careful with the wires which run from the sensor to the rest of the circuit. These stray capacitances appear as additional capacitances in the measuring circuit, and can cause errors. One source of error is the changes in capacitance which result from these wires moving about with respect to ground, causing capacitance fluctuations which might be confused with the signal. Since these effects can be due to acoustic pressure-induced vibrations in the positions of objects, they are often referred to as microphonics. An important way to minimize stray capacitances is to minimize the separation between the sensor element and the rest of the circuit. Another way to minimize the effects of stray capacitances is mentioned later - the virtual ground amplifier.
QQUESTIONUESTION T THREEHREE::
(a).
(i). Using an action-reaction expression, explain the principle of a typical thermometer with a bulb at the bottom acting as a reservoir for the mercury. State the assumption/s made.
When the temperature rises, the volume changes as
Where V is the volume of the mercury in the reservoir, ΔV is the change in volume, T is the temperature {Kelvin, K}, and ΔT is the change in temperature.
This assumes that the change in volume is caused only by the change in the mercury column length and NOT change in the radius of the bulb.
(ii). Use the expression in (i) to calculate the radius needed for a thermometer

When the temperature rises, the change in volume of the mercury causes it to rise into the column (radius = R) by ΔL.
Therefore,
If we want 1 mm/K at room temperature, and we have a reservoir volume of 0.1 cm3, we need :
(iii). For a voltage divider with a thermistor of average resistance R1 and a load resistor with resistance RL, derive the expression for the voltage at the output.
The voltage at the output is given by
Now, if RL>>R1, we have
(b). A Platinum resistance thermometer has a resistance of 100 at 0oC and the value of is 0.00385. In operation the resistance is 101 . Calculate the temperature.
Rearrange the formula to make the subject and evaluate. R 1 105 1 o
? Ro 100 C 12.987 a 0.00385
(c). Referring to the temperature coefficient, explain how the thermistor behaves with temperature change.

If the temperature of R1 changes by 1 K, the resistance changes by (Alpha R1), so the voltage changes by Alpha(Vin R1/RL). The definition of the temperature coefficient as a fractional change in resistance per unit change in temperature produces a result in which the fractional change in voltage per unit change in temperature is given by alpha as well.
(d). Evaluate and explain the effect of noise on accuracy when using a thermistor to measure small temperature changes.
When using a thermistor to measure small temperature changes, noise can impose a limitation. For example, all resistive elements exhibit voltage noise known as Johnson noise with density given by
(e). Explain the use of Seebeck effect in thermocouples.
When two wires with dissimilar electrical properties are joined at both ends and one junction is made hot and the other cold, a small electric current is produced proportional to the difference in the temperature. Seebeck discovered this effect.
(f). Illustrate how a thermocouple may be connected to extract the value of the measurand.
(g). A thermocouple produces an e.m.f. in mV according to the temperature difference between the sensor tip 1 and the gauge head 2 such that
e = (1-2) + (12-2
2) = 3.5 x 10⁻² and = 8.2 x 10⁻⁶ The gauge head is at 20oC. The mV output is 12 mV. Calculate the temperature at the sensor.
62
10 ? 0.035 1 20 10 x 8.2 (? 2 20 )1
2

10 0.035?1 0.7 10 x 8.2 6?1
0.00328 2
10 8.2x10⁶?1 0.035?1 69672.0 2
10 x 8.2 6?1 0.035?1 30328.9 0 Solving the quadratic equation yields 1 = 251oC
QQUESTIONUESTION F FOUROUR::
(a).
(i). Explain the general principle of a strain gauge.
If a strip of conductive metal is stretched, it will become skinnier and longer, both changes resulting in an increase of electrical resistance end-to-end. Conversely, if a strip of conductive metal is placed under compressive force (without buckling), it will broaden and shorten. If these stresses are kept within the elastic limit of the metal strip (so that the strip does not permanently deform), the strip can be used as a measuring element for physical force, the amount of applied force inferred from measuring its resistance.
(ii). Define gauge factor.
We define a quantity called the gage factor K as:
Hence,
(iii). Prove that the gauge factor for liquid gauges is 2. Comment on the meaning of this value.
Taking the derivative gives

Since
,
we have K = 2 for a liquid strain gage.
Comment: This value means that the fractional change in resistance is twice the fractional change in length. In other words, if a liquid strain gauge is stretched by 1%, its resistance increases by 2%. This is true for all liquid strain gauges, since all that is needed is that the medium be incompressible.
(iv). State one application of liquid strain gauges. Describe an apparatus for such an application.
Liquid strain gauges are used in hospitals for measurements of fluctuations in blood pressure.
A rubber hose filled with mercury is stretched around a human limb, and the fluctuations in pressure is recorded on strip-chart recorders, and the shape of the pressure pulses used to diagnose the condition of the arteries.
(v). Derive the gauge factor for metal strain gauges.
A metal wire is compressible and resistivity varies as it is stretched. Therefore,
Where r is radius of a wire with circular cross-section. Then,

Since
is defined as Poisson's ratio, v, we have
(vi). Comment on the result, giving the actual values.
For different metals, this quantity depends on the material properties, and on the details of the conduction mechanism. In general, metals have gage factors between 2 and 4.
(b).
(i). Show that the fractional change in resistance of a strain gauge is proportional to the applied force, and is proportional to the gage factor divided by young's modulus for the material.
Stress times the area is equal to the force, and the fractional change in resistance is equal to the gage factor times the fractional change in length (the strain), and stress is Young's modulus times the strain, we have
or
So the fractional change in resistance of a strain gauge is proportional to the applied force, and is proportional to the gage factor divided by young's modulus for the material.
(ii). Explain how the variables in (i) above influence the design of a strain gauge.
In the design, it is preferred to have a large change in resistance to simplify the rest of a sensing instrument. So, generally small diameters, small young's modulus, and large gage factors are

preferred. The elastic limits of most materials are below 1%, resistance changes which are in the 1% - 0.001% range are taken.
(c).
(i). Give two reasons for preference of doped silicon strain gauges to thin film strain gauges.
Doped silicon is a conductor which exhibits a gage factor which can be as large as 200, depending on the amount of doping. This creates an opportunity to make strain gages from silicon, and to use them to produce more sensitive devices than would be easy to make in any other material.
Another aspect of the utility of silicon is that recent years have seen the development of a family of etching techniques which allow the fabrication of micromechanical structures from silicon wafers. Generally referred to as Silicon Micromachining, these techniques use the patterning and processing techniques of the electronics industry to define and produce micromechanical structures.
(ii). Use an illustration to explain how micromachining of silicon materials can be used for data storage. Indicate the currently achievable dimensions.

A Data Storage Silicon Cantilever.
Micromachining can be used to fabricate piezoresistive cantilevers for a wide variety of applications. Past research between IBM and Stanford focused on the development of piezoresistitve cantilevers for a data storage applications. In this design, a 100 micron-long piezoresistive cantilever is dragged along a polycarbonate disk at 10 mm/s, bouncing up and down as it passes over sub-micron indentations in the surface of the disk. The devices shown above illustrate cantilevers developed for this data storage application.
These techniques are capable of producing diaphragms and cantilevers of silicon with thickness of microns and lateral dimensions of hundreds of microns up to millimeters
(d). It is required that a piezoresistive cantilever be designed and used with a bridge to sense variations in the shape of a surface which is passed beneath.(i). Sketch the design, including the connections to the bridge and the monitor.
Piezoresistive Cantilever

(ii). Derive the expression for the strain on the cantilever if the load-deflection relationship for a simple cantilever beam is
where
E is stress,
F is the exerted force,
L is the length, T is the thickness, and w is the width.
Hints:
1. The angle of deflection to be approximately 2. The vertical radius of curvature of the cantilever is approximately
and
3. The difference in arc length for the upper and lower surfaces is
.
Since F = kZ, we have stiffness :
For a deflection Z, the cantilever has an angle of deflection of approximately
,
and, therefore, a radius of curvature of approximately

The strain in the upper surface of the cantilever is caused by the difference in arc length for the upper and lower surfaces.
The strain is given by
(iii). A doped silicon cantilever is designed to have have the following parameters:
T = 4µm, L = 100 µm, w = 4 µm, E = 2 x 10^11 N/m2, and F = 10-7 N. Calculate the valur of strain.
QQUESTIONUESTION F FIVEIVE::
(a). (i). State the needs for signal processing in measuring equipment.
Processing may do the following things.
← Change the level or value of the signal (e.g. voltage level) ← Change the signal from one form to another. (e.g. current to pneumatic) ← Change the operating characteristic with respect to time. ← Convert analogue and digital signals from one to the other.
(ii). Differentiate between the processing functions of electrical signals by amplifiers and

transformers. In each case, use relevant expressions of factors which relate the input and the output signals.
Amplifiers may amplify low voltages, currents or both (power) to reach the level which can be sensed by the measuring instrument.
The relevant factor in this case is the amplifier gain, which may be expressed as a ratio or in decibels. The letter W indicates it refers to power gain. The gain in dbW is given by Gain(dbW)
10log
A transformer primary coil has the input a.c. voltage applied and a.c. current flows according to the reactance.
The flux produced is concentrated in the core and passes around the core. It follows that the same flux cuts the turns on the secondary coil and so an e.m.f will be generated in the secondary coil. The flux depends upon the number of turns T1 and the same flux cuts the secondary. The e.m.f in the secondary will depend on the number of turns T2. It follows that V1/V2 = T1/T2 = n, where n is the turns ratio.
In an ideal transformer there is no energy loss and so the power in and power out are equal. V 1 i1
= V2 i2. It follows that if the voltage is stepped down, the current is stepped up and vice versa.
(iii). Using construction sketches showing relevant dimensions, explain the functions, indicating pertinent output-to-input ratios of

EITHER A mechanical transformer
OR A hydraulic pressure amplifier
MECHANICAL Mechanical transformers are levers and gear boxes which change movement, force, speed and torque but not the power. The are used in many instruments (e.g. a mechanical pressure gauge and the nozzle flapper system
The gear ratio is in direct proportion to the pitch circle diameters (mean diameters) or number of teeth on each wheel. The lever movements at the ends are in direct proportion to the length each side of the fulcrum.
HYDRAULIC
Figure 7

The hydraulic pressure amplifier shown increases the pressure in direct proportion to the areas of the pistons. It is also called an intensifier. The force on the input piston = Force on the output piston.
F=A1p1=A2 p2. Therefore, p2/p1 = A1/A2.
(b). Explain the construction and principle of the Linear Variable Differential Transformers (LVDT) in measurements. State its advantages over potentiometric measurements.
Using AC instead of DC, we are able to completely avoid sliding contact between parts, which leads to fast ageing and noise due to poor contact, as in the potentiometer. A variable transformer reduces these shortcomings.
Devices made for this purpose are called LVDT's, which stands for Linear Variable Differential Transformers. The design of an LVDT looks like this:

Te LVDT has a single primary winding powered by an external source of AC voltage, and two secondary windings connected in series-bucking fashion. It is variable because the core is free to move between the windings. It is differential because of the way the two secondary windings are connected. Being arranged to oppose each other (180o out of phase) means that the output of this device will be the difference between the voltage output of the two secondary windings. When the core is centered and both windings are outputting the same voltage, the net result at the output terminals will be zero volts. It is called linear because the core's freedom of motion is straight-line.
The AC voltage output by an LVDT indicates the position of the movable core. Zero volts means that the core is centered. The further away the core is from center position, the greater percentage of input ("excitation") voltage will be seen at the output. The phase of the output voltage relative to the excitation voltage indicates which direction from center the core is offset.
The primary advantage of an LVDT over a potentiometer for position sensing is the absence of physical contact between the moving and stationary parts. The core does not contact the wire windings, but slides in and out within a nonconducting tube. Thus, the LVDT does not "wear" like a potentiometer, nor is there the possibility of creating an arc.
Excitation of the LVDT is typically 10 volts RMS or less, at frequencies ranging from power line to the high audio (20 kHz) range. One potential disadvantage of the LVDT is its response time, which is mostly dependent on the frequency of the AC voltage source. If very quick response times are desired, the frequency must be higher to allow whatever voltage-sensing circuits enough cycles of AC to determine voltage level as the core is moved. To illustrate the potential problem here, imagine this exaggerated scenario: an LVDT powered by a 60 Hz voltage source, with the core being moved in and out hundreds of times per second. The output of this LVDT wouldn't even look like a sine wave because the core would be moved throughout its range of motion before the AC source voltage could complete a single cycle! It would be almost impossible to determine instantaneous core position if it moves faster than the instantaneous source voltage does.
(c).(i). Compare analogue and digital measuring instruments.
Here are some of the advantages of the digital instruments over the analogue instruments:
1) They are very easy to read.
2) Since there are very few moving parts in the electronic instruments, they are usually more accurate than the analogue instruments. Even the human error involved in reading these instruments is very less, which adds to the accuracy of digital instruments.

3) The electronic items tend to be cheaper than the mechanical items.
4) The data from the instruments can be recorded for future reference.
5) The output of the digital devices can be obtained in the computer
There are also some disadvantages of the digital instruments. Here they are:
1) Sometimes they tend to indicate erratic values due to faulty electronic circuit or damaged display.
2) In case of high humidity and corrosive atmosphere the internal parts may get damaged and indicate the faulty values.
3) Sometimes these instrument show some readings even though there is no applied measurable parameter.
Hence,
(ii). Justify the wide of digital measuring equipment and the need for analogue-to-digital (A/D) and digital-to-analogue (D/A) conversions.
On the whole, the advantages of the digital instruments outdo the disadvantages, which is why they have become highly popular. You can find digital instruments in the cars, air planes, motor cycles, and also in places like air ports, railway stations, public places etc. The digital clocks are one of the most widely used instruments for the personal use and also in public and private places. The trend is towards the digital instruments since they are convenient to use and also have excellent looks. In future their use is sure to increase much more.
So many modern systems now use digital signals that it is important to appreciate how analogue signals from sensors are processed into digital form and vice versa. Analogue to digital conversion is a process of turning an analogue voltage or current into a digital pattern which can be read by a computer and processed.
Digital to analogue conversion is a process of turning a digital pattern from a computer into an analogue voltage or current.

(iii). Using diagrams, describe the functioning of
EITHER The Counter Type or The Integrated type A/D converter.
OR The Adder Type or The Ladder type D/A converter. A/D CONVERSION:
Either
The output of the counter is a digital pattern and this is converted back into an analogue signal by the D/A converter and compared with the input. The input is compared with the feed back signal and so long as it is smaller, the counter will go on running. When the two become equal, the counter stops and the digital value of the counter is the digital value of the analogue signal. Another type uses an integrator as shown
OR

Figure 16 This time no feedback is used. The reference voltage is integrated so the output of the integrator is a ramp which grows with time. The time taken for the ramp to reach the same value as the input is converted into a digital form by a counter.
DIGITAL TO ANALOGUE CONVERTERS:
EITHER THE ADDER TYPE CONVERTER
One way to convert a digital pattern into an analogue voltage is with the adder type shown below. The diagram shows a 5 bit pattern.
The output voltage is controlled by the state of the I/O switches (these might be a register).The output of the summing amplifier is Vo = (Vref/2)[1/16 + 1/8 + 1/4 + 1/2 + 1] 1/16 is the least significant bit and 1 is the most significant bit.

The maximum number represented by the digital number is 31 for the 5 bit system shown. An increase of one produces a voltage increment of 1/32V. The maximum voltage output is 31V/32. One problem with this system is that the theoretical resistance values can become ridiculously large.
OR THE LADDER TYPE
Figure 14 The output voltage is given by
Vo = (Vref/2)[1/16 + 1/8 + 1/4 + 1/2 +1 ]
(d). Briefly discuss at least six receivers used to show the value of the measurand in a measurement system.The input of an instrument system is sensed with a primary transducer and then processed or conditioned before being sent on to the last item in the chain which is the signal receiver. The signal receiver may be ← an indicator ← a chart recorder ← a plotter ← a printer ← an alarm ← a computer
INDICATORS Indicators may be analogue or digital. Analogue indicators have a scale and a pointer moves
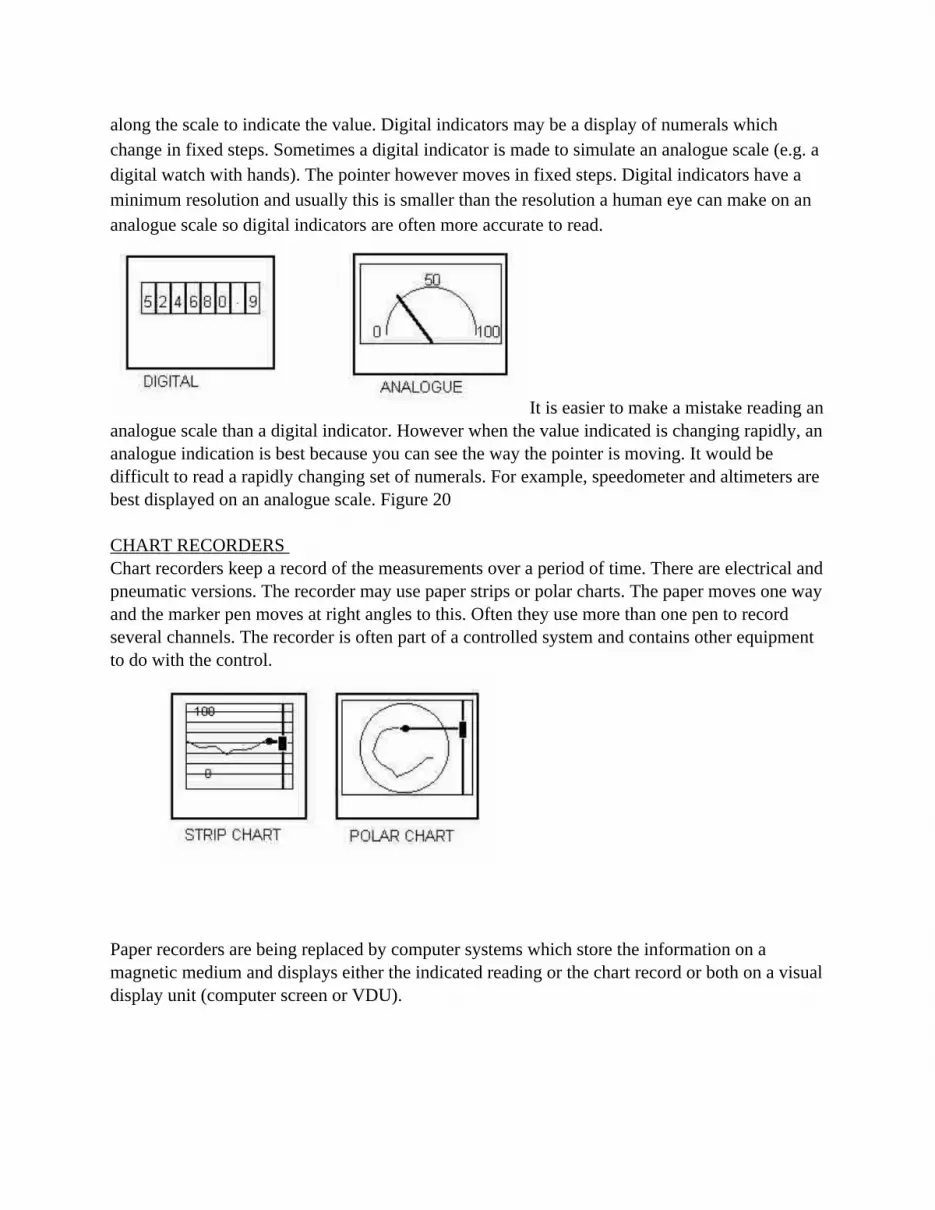
along the scale to indicate the value. Digital indicators may be a display of numerals which change in fixed steps. Sometimes a digital indicator is made to simulate an analogue scale (e.g. a digital watch with hands). The pointer however moves in fixed steps. Digital indicators have a minimum resolution and usually this is smaller than the resolution a human eye can make on an analogue scale so digital indicators are often more accurate to read.
It is easier to make a mistake reading an analogue scale than a digital indicator. However when the value indicated is changing rapidly, an analogue indication is best because you can see the way the pointer is moving. It would be difficult to read a rapidly changing set of numerals. For example, speedometer and altimeters are best displayed on an analogue scale. Figure 20
CHART RECORDERS Chart recorders keep a record of the measurements over a period of time. There are electrical and pneumatic versions. The recorder may use paper strips or polar charts. The paper moves one way and the marker pen moves at right angles to this. Often they use more than one pen to record several channels. The recorder is often part of a controlled system and contains other equipment to do with the control.
Paper recorders are being replaced by computer systems which store the information on a magnetic medium and displays either the indicated reading or the chart record or both on a visual display unit (computer screen or VDU).

Plotters draw graphs or charts. The pen recorders described above are types of plotters specifically for recording a signal over a long time period. The term plotter usually refers to a system where the paper is stationary and the pen is able to move in the x and y directions. Often the x direction is time and so the plotter become a recorder. Plotters are more often used to plot one signal against another. They are very commonly used for producing engineering drawings created on a computer.
Printers refer to a system where the paper is marked by a printing head. There are many types such as dot matrix, ink jets, laser and other electrostatic devices. Printers will print text or they may be used to print pictures and drawings reproducing on paper what can be seen on a VDU.
ALARMS The purpose of an instrument may be to set off an alarm such as a bell, siren, flashing light and so on. They are switched on by the signal processor. An example is a smoke detector.
COMPUTERS Computer technology is taking over many rolls performed by traditional equipment. The signal is processed into digital form, in other words into numbers. The computer processes the numbers and stores the data, sends it on to a VDU or to other control equipment.END.