Embed Size (px)
Citation preview

ww.sciencedirect.com
wat e r r e s e a r c h 7 3 ( 2 0 1 5 ) 9 8e1 0 8
Available online at w
ScienceDirect
journal homepage: www.elsevier .com/locate /watres
Water quality of small seasonal wetlands in thePiedmont ecoregion, South Carolina, USA: Effects ofland use and hydrological connectivity
Xubiao Yu a,b, Joanna Hawley-Howard c, Amber L. Pitt d, Jun-Jian Wang b,Robert F. Balddin c, Alex T. Chow b,c,*
a School of Chemistry and Chemical Engineering, South China University of Technology, 510640, Chinab The Belle W. Baruch Institute of Coastal Ecology and Forest Science, Clemson University, Georgetown, SC 29440,
USAc Department of Forestry and Environmental Conservation, Clemson University, Clemson, SC 29634, USAd Department of Biological & Allied Health Sciences, Bloomsburg University of Pennsylvania, Bloomsburg, PA 17815,
USA
a r t i c l e i n f o
Article history:
Received 2 June 2014
Received in revised form
29 December 2014
Accepted 5 January 2015
Available online 13 January 2015
Keywords:
Dissolved organic matter
Fluorescence
Isolated wetlands
Nutrients
* Corresponding author. The Belle W. BaruchUSA. Tel.: þ1 843 546 1013x232; fax: þ1 843
E-mail address: [email protected] (A.Thttp://dx.doi.org/10.1016/j.watres.2015.01.0070043-1354/© 2015 Elsevier Ltd. All rights rese
a b s t r a c t
Small, shallow, seasonal wetlands with short hydroperiod (2e4 months) play an important
role in the entrapment of organic matter and nutrients and, due to their wide distribution,
in determining the water quality of watersheds. In order to explain the temporal, spatial
and compositional variation of water quality of seasonal wetlands, we collected water
quality data from forty seasonal wetlands in the lower Blue Ridge and upper Piedmont
ecoregions of South Carolina, USA during the wet season of February to April 2011. Results
indicated that the surficial hydrological connectivity and surrounding land-use were two
key factors controlling variation in dissolved organic carbon (DOC) and total dissolved
nitrogen (TDN) in these seasonal wetlands. In the sites without obvious land use changes
(average developed area <0.1%), the DOC (p < 0.001, t-test) and TDN (p < 0.05, t-test) of
isolated wetlands were significantly higher than that of connected wetlands. However, this
phenomenon can be reversed as a result of land use changes. The connected wetlands in
more urbanized areas (average developed area ¼ 12.3%) showed higher concentrations of
dissolved organic matter (DOM) (DOC: 11.76 ± 6.09 mg L�1, TDN: 0.74 ± 0.22 mg L�1,
mean ± standard error) compared to those in isolated wetlands (DOC: 7.20 ± 0.62 mg L�1,
TDN: 0.20 ± 0.08 mg L�1). The optical parameters derived from UV and fluorescence also
confirmed significant portions of protein-like fractions likely originating from land use
changes such as wastewater treatment and livestock pastures. The average of C/N molar
ratios of all the wetlands decreased from 77.82 ± 6.72 (mean ± standard error) in February
to 15.14 ± 1.58 in April, indicating that the decomposition of organic matter increased with
the temperature. Results of this study demonstrate that the water quality of small, sea-
sonal wetlands has a direct and close association with the surrounding environment.
© 2015 Elsevier Ltd. All rights reserved.
Institute of Coastal Ecology and Forest Science, 130 Heriot Road, Georgetown, SC 29440,546 6296.. Chow).
rved.

wa t e r r e s e a r c h 7 3 ( 2 0 1 5 ) 9 8e1 0 8 99
1. Introduction
Wetlands performa suite of ecological functions such aswater
purification, nutrient retention, floodprotection, groundwater
recharge and habitat for wildlife. Based on different scientific
and policy objectives, various ecological functions of wetlands
have been studied and evaluated, including hydrology (Cook
and Hauer, 2007; Min et al., 2010), water quality (Trebitz
et al., 2007; Verhoeven et al., 2006; Whigham and Jordan,
2003), vegetation composition (Hebb et al., 2013) and animal
population dynamics (Fracz and Chow-Fraser, 2013; Seil-
heimer and Chow-Fraser, 2006). Among these factors, water
quality has generated substantial concern because it is not
only essential for all biological growth and reproduction, but
also directly interacts with other factors across multiple
spatial and temporal scales. For example, land use (Maassen
et al., 2012; Morrice et al., 2008), hydrological connections
(Cook and Hauer, 2007; Kazezyilmaz-Alhan et al., 2007), soil
and vegetation characteristics (Batzer et al., 2000;Montgomery
and Eames, 2008) have all been demonstrated to be related to
water quality. Thus, water quality serves as an important in-
dicator for characterizing the effects of land use on wetlands,
and furthermore, to direct policy and management of the
surrounding watershed. Particular water quality parameters
are selected as indicators of specific anthropogenic stressors,
such as dissolved organic carbon (DOC) with natural organic
matter (NOMs), nitrogen (N) and phosphorous (P) for agricul-
tural run-off, electronic conductivity (EC) for anthropogenic
discharge and chloride (Cl�) for point-source pollution (Tu,
2011). In most cases, dissolved carbon and nitrogen are sig-
nificant parameters due to their high content in all dissolved
organic matter (DOMs).
Small, seasonal wetlands are found throughout the Pied-
mont ecoregion of the southeastern United States. These
wetlands usually occur in areas with depressional topography
and are characterized by their small area and shallow depth
(Hayashi and van der Kamp, 2000). These wetlands typically
have a shorter hydroperiod than larger wetlands with greater
surfacewater area, and usually holdwater for only three to five
months per year (Hayashi and van der Kamp, 2000). Because of
their relatively small size and ephemeral nature, these wet-
lands are not typically protected as fully as coastal and riparian
wetlands, which satisfy the criteria for protection under the
Clean Water Act (McCauley et al., 2013; Stokstad, 2006). In
recent decades, wetlands have suffered significant habitat loss
and degradation across the US due to the rapid urbanization
processes (McCauley et al., 2013). Despite small surface areas
and short hydroperiods, these wetlands harbor a great deal of
biological diversity, especially for some amphibians (e.g., wood
frogs, spotted salamanders, spade foot toads) for which there
are selective pressures to breed in more ephemeral sites
(Stokstad, 2006). Moreover, the stagnant nature of seasonal
wetlands provide more time for microbes to convert excess
nutrients and prevent downstream algal blooms (Whitmire
and Hamilton, 2005). Based on the unique benefits for both
biodiversity and downstreamwater quality, many researchers
are calling for the amendment of wetland regulations to
includeprotectionof small, seasonalwetlands (Stokstad, 2006).
Research on water quality of small, seasonal wetlands has
been limited as a result of the small water surface area and
short hydroperiod that characterize these habitats. With re-
gard to hydrological characteristics, these seasonal wetlands
are generally considered to have little or no connection with
surface water or ground water, and they are primarily
dependent on precipitation and runoff (Whigham and Jordan,
2003). Because of this dependency on precipitation, these
wetlands may represent a simpler water pathway than that of
large wetlands (i.e., water quality of small wetlands may be
more closely linked to the characteristics of the surrounding
watershed such as land-use and vegetation cover). Moreover,
thesewetlands hold significantly lower volumes of water than
other wetlands and the water quality parameters may there-
fore respond to variation in the surrounding environment in a
more rapid and sensitive manner.
In order to better understand the water quality of these
seasonal wetlands, we collected water samples from forty
seasonal wetlands located in the lower Blue Ridge and upper
Piedmont ecoregions of northwestern South Carolina from
February through April of 2011. In addition to general water
parameters, DOM was quantified and characterized using UV
spectra and fluorescence to determine the compositional
variations among land-use and hydrological factors. We hy-
pothesized that small, seasonal wetlands have a strong rela-
tionship with the surrounding watershed, and can serve as a
sensitive indicator to evaluate the water quality at the land-
scape scale and also reflect the influences of human activities
on water quality rapidly.
2. Materials and methods
2.1. Study sites
Wetland study sites were distributed throughout north-
western South Carolina (34�480N, 82�560W), across Oconee,
Pickens, Anderson and Greenville Counties (Fig. 1). This region
is located at the base of the Appalachian Mountains and near
the headwaters of the Savannah River (boundary river of
South Carolina and Georgia). The water quality in this upper
portion of the watershed may influence the middle and lower
reaches where there are large urban populations. There is a
paucity of data regarding seasonal wetlands in this region,
and until recently few had been mapped (Pitt et al., 2012).
Increasing development pressure since 1990 associated with
the region's location between two major urban centers
(Atlanta, GA and Charlotte, NC) (Campbell et al., 2008), pro-
longed drought cycles, and increasing constraints on aquatic
resources necessitate timely assessment of small, seasonal
wetlands in this region. The southern Appalachians span the
northern portion of the study area and the general topography
transitions from steep mountainous terrain in the lower Blue
Ridge ecoregion to hilly foothills in the upper Piedmont ecor-
egion. Wetland elevation decreased approximately 700 m
from north to south. The climate in this portion of the
southeastern US is temperate forest and the annual precipi-
tation level is approximately 1700 mm.

Fig. 1 e Geographical position of studied seasonal wetlands in northwestern South Carolina, US. The circle and square
symbol represents the connected and isolated wetlands, respectively.
wat e r r e s e a r c h 7 3 ( 2 0 1 5 ) 9 8e1 0 8100
The key criteria for selecting study wetlands were small
area (<0.5 ha) and relatively shallow depths (<200 cm) (Pitt
et al., 2012). The largest wetland had an area of 3542 m2
(S29) and the smallest wetland had an area of 3.0 m2 (S37),
with the median value of 95 m2. The depth of all the wetlands
was less than 40 cm (Table S1).
There were 40 wetland sites in this study, labeled S1 to S40
from South to North approximately. In Fig. 1, the region
highlighted with a circle represents a more developed area
adjacent to regional cities [e.g., Pendleton, SC
(population z 3000) and Anderson, SC (population z 27,000)]
and also in close proximity to pastureland, both of which
generate heavy anthropogenic inputs (e.g., urban stormwater
and agricultural run-off). Wetlands S1 to S6 are located in this
more developed region, with S3 to S6 located close to a
highway. Four wetlands (S7eS10) are located in the Clemson
Experimental Forest (7082 ha mixed use, managed forest
owned by Clemson University but open to public recreational
activities) and most of the studied wetlands (S7eS40) are
located on publicly owned state or federal lands across the
lower Blue Ridge and upper Piedmont (Fig. 1). Considering the
different extents of urbanization, the wetlands located in the
more-developed areas (i.e., S1, S2, S3, S4, S5 and S6), were
grouped separately from the otherwetlands. Furthermore, the
wetlands were sub-grouped as either connected or isolated
based on surficial hydrological connectivity.
The primary source of water input for the seasonal wet-
lands in the study area is precipitation and evaporation is the
main transportation pathway of water. These conditions
mean that most study wetlands only hold water during the

wa t e r r e s e a r c h 7 3 ( 2 0 1 5 ) 9 8e1 0 8 101
rainy season (JanuaryeMay). From a hydrogeomorphic
perspective, wetlands were field characterized as having
ephemeral or permanent connections with surface waters
(referred to from here forward as “connected wetlands”), or
being relatively isolated from other bodies of water (referred
to from here forward as “isolatedwetlands”) using established
wetland delineation criteria (Department of the Army, 1987).
We collected data on land use/land cover (LULC) by
accessing the National Land Cover Database (http://www.
usgs.gov/climate_landuse/) and downloading the 2010 data
set for the region.We combined these data with our study site
maps and calculated the total area of 1) open water, 2)
disturbed/successional area, 3) cultivated area, 4) developed
area, 5) forested area and 6) pastureland at the 250 m, 500 m
and 1 km scale around eachwetland. All spatial analyses were
performed using Esri ArcMap (10.1, 2012). It should be noted
that the disturbed/successional area was characterized as an
area that was recently cleared or in the early stages of suc-
cession, as the result of some types of land use changes. The
open water area refers to major rivers and lakes located near
the wetlands.
2.2. Sample collection
Water samples were collected monthly in February (7the8th),
March (8the9th), and April (13the14th) in 2011. Water sam-
ples from all 40 wetlands were collected within a two
consecutive day sampling round each month. No obvious
precipitation occurred during the two day sampling events.
Temperature (�C) and dissolved oxygen (DO,mg L�1) of surface
water in wetlands were collected at each wetland using a
multi-parameter water quality meter (YSI 650MDS, USA). At
each site, 1 L of surface water was collected using acid-
washed, Nalgene bottles that were pre-rinsed with sample
water. Three bottles were collected at each wetland as repli-
cations. The water samples were kept on ice during trans-
portation from field sites to the laboratory.
2.3. Water quality
Electrical conductivity (EC) and pH of non-filtered samples
were measured upon arrival in the laboratory. The measured
EC was corrected to EC at 25 �C (EC25) using the temperature
correction equation: EC25 ¼ ECt/[1 þ 0.021(t-25)] (Hayashi,
2004). Water samples were filtered through a syringe filter
(Millipore Millex-HV Hydrophilic PVDC, 0.45 mm). All the
filtered samples were stored at 4 �C for the next chemical
analysis within a month.
Each filtered samplewas analyzed for DOC and TDNusing a
Shimadzu TOC/TN analyzer and the C/N molar ratio was
calculated accordingly. DOC was further characterized by Shi-
madzu UV-1800 visible and ultraviolet spectrophotometer
scanning from 200 to 700 nm. Specific ultraviolet absorbance
(SUVA254)wascalculatedbynormalizingultraviolet absorbance
at 254 nm (UVA254) to DOC concentration, recorded as
LmgC�1 cm�1. The E2:E3 ratio, absorbance at 254 nmdivided by
absorbance at 365 nm, was calculated. E2:E3 is related to the
molecular sizeofDOM(Helmsetal., 2008). The3-Dfluorescence
excitationeemission matrixes (EEM) were obtained from Shi-
madzu spectrofluorometer RF5301 and analyzed by
fluorescence regional integration basedonSimpson's Rule (FRI-SR) (Zhou et al., 2013) for selective samples. All samples were
diluted with Milli-Q water to an ultraviolet absorbance at
254 nm of 0.3 or less (Miller et al., 2010) to obtain the reliable
EEMs. The fluorescence scans (excitation wavelength range:
240e450 nm; emission wavelength range: 350e550 nm) for
DOM were measured with a 5-nm slits setting for both excita-
tion and emission. The raw EEM was corrected (Murphy et al.,
2010) for instrument-dependent effects, inner-filter effects,
and background effects, and standardized to the Raman's units(normalized to the integral of the Raman signal between 390
and 410 nm in emission at a fixed excitation of 350 nm).
The FRI program divides excitationeemissionmatrix (EEM)
spectroscopy into different regions based on the character of
different DOMs, and the normalized volumes of different re-
gions represent content of different DOMs (Chen et al., 2003).
Accordingly, a modified FRI program was developed which
characterized four typical organic matters as: aromatic pro-
tein region (RAP, lemission: 220e350 nm, lexcitation: 220e250 nm),
soluble microbial by-product-like materials region (RMB,
lemission: 220e350 nm, lexcitation > 250 nm), fulvic acid-like re-
gion (RFA, lemission >350 nm, lexcitation: 220e250 nm) and humic
acid-like materials region (RHA, lemission >350 nm,
lexcitation > 250 nm).
2.4. Data analysis
All water quality data were tested for normality using the
ShapiroeWilk goodness-of-fit test (p > 0.05). Differences in
water quality parameters among the sites were determined
using independent t-tests. Temporal variations in water
quality parameters were determined using paired-sample t
tests. To evaluate the influences of adjacent land use and
hydrological connectivity, we used the log-transformed water
quality parameters in amultiple-regression analysis. It should
be noted that proportion of forested area was excluded from
the regression analysis as we observed multicollinearity with
other land-use variables. DOC, TDN, C/N ratio and EC were
used as variables in the regression analysis. For comparing the
similarity of water quality for the wetlands, cluster analysis
was applied to the general water-quality data (EC, DOC, TDN
and C/N ratio) of 40 seasonal wetlands. Hierarchical cluster
analysis was performed on the normalized data set by the
Ward's linkage method, using Euclidean distances as a mea-
sure of similarity. All statistical analyses were performed
using SPSS 19.0 software (IBM Co. Ltd, USA).
3. Results
3.1. Surrounding land-use of wetlands
Fig. 2 shows the proportion of six land-use categories
(developed, cultivated, pastured, disturbed, open water and
forest) surrounding the wetlands at 250, 500 and 1000 m
scale. The developed, cultivated and pastureland areas
were the major land use changes surrounding our study
wetlands. Most wetlands that were located in close prox-
imity to the more developed city region had relatively high
proportions of developed area (S3: 16%, S4: 22%, S5: 5% and

Fig. 2 e The proportion of land-use surrounding the seasonal wetlands (highlighted wetlands are located inmore-developed
region). From inside to outside, three concentric rings are representative of 250, 500 and 1000 m surrounding area,
respectively.
wat e r r e s e a r c h 7 3 ( 2 0 1 5 ) 9 8e1 0 8102
S6: 7% in 1000 m scale) as compared to wetlands located
further from this region (most wetlands having less than
0.1% developed area at the spatial scales studied). There
was no evidence of large-scale agricultural activity in the
study area but pastureland did constitute a higher propor-
tion of adjacent lands. There are several longitudinal,
anthropogenic lakes in this region such as Lake Jocasee,
Lake Keowee and Lake Hartwell, which connect to each
other and flow into the upper reaches of the Savannah
River. Forest is the dominant land cover type in this region
with the exception of the sites close to the city centers of
Clemson and Pendleton, South Carolina. Some wetlands
located in the upper Piedmont and central Clemson Exper-
imental Forest area (S7, S11, S35 and S39) had forest cover
levels greater than 90%.
Fig. 3 e DOC, TDN and C/N ratio of the seasonal w
3.2. Temporal variation of water quality
DOC, TDN and C/N ratio (molar ratio) of study wetlands be-
tween February and April are shown in Fig. 3.We found a clear
difference in DOC and TDN between isolated and connected
wetlands in both less-developed and more-developed areas
within the study region. For the isolated and connected wet-
lands in less-developed region (i.e., S7 through S40) t-test re-
sults indicated that these wetlands had statistically
significant higher DOC (p < 0.001) and TDN (p < 0.05) con-
centrations compared to those of connected wetlands. For the
wetlands in the more-developed area, we observed a nearly-
opposite trend. Although there was no statistically signifi-
cant difference found due to the obvious inter-individual
variation, the connected wetlands such as S5 and S6
etlands in February, March and April, 2011.

Fig. 4 e Dendrogram showing clustering of 40 seasonal
wetlands based on water qualities (DOC, TDN, C/N ratio)
and land-use proportions.
wa t e r r e s e a r c h 7 3 ( 2 0 1 5 ) 9 8e1 0 8 103
expressed about 3 times higher DOC than isolated wetlands;
and S3, S5 and S6 expressed about 3 times higher TDN than
the isolated wetlands. For C/N ratio, there was no statistically
significant difference between isolated and connected wet-
lands in either less-developed or more-developed region.
Except for C/N ratio, data of DOC, TDN and EC had statis-
tically significant correlation with the land-use or water
connection. It can be seen from Table 1 that hydrological
connectivity exhibited one order of magnitude larger co-
efficients than land-use factors regarding DOC and TDN.
Among the land-use factors, the proportion of developed and
pastureland area had decisive effects on DOC and TDN. The
proportion of pastureland area has a stronger associationwith
the variation of DOC than that of more developed areas
although proportion of developed area had stronger overall
associations with TDN. For EC, proportion of developed area
was the only factor strongly related to its variation. Fig. 4
shows the cluster analysis-generated three groups of these
sites based on EC, DOC, TDN, and C/N ratio. It can be found
that S3, S4, S5 and S6were grouped in a cluster (Cluster III). For
the sites in less-developed region, isolated wetlands (S7eS22)
and connected wetlands (S23eS40) were grouped to Cluster I
and Cluster II approximately.
The temporal variations of water quality indicators for con-
nected versus isolated wetlands are illustrated in Fig. 5. Water
temperature showed a significant increase from February to
April (paired t-test, p < 0.001), whereas DO showed irregular
fluctuationwithno consistent trend through time.DOC showed
no clear trend for all the samples, and paired-samples t-test
indicated that therewas no statistically significant difference in
monthly comparisons. TDN analyses show that there was an
increasing trend of TDNconcentration fromFebruary toApril in
bothconnectedand isolatedwetlands (p<0.001), indicating that
therewas a statistically significant difference betweenFebruary
and April. As a result of the variation of DOC and TDN, the ratio
of carbon and nitrogen exhibited a clear decline with the time.
The paired t-test result (p < 0.001) indicated a significant dif-
ference of monthly C/N ratios.
3.3. Optical properties of DOM
3.3.1. UV absorbanceSpecific ultraviolet absorbance at 254 nm (SUVA254) is a useful
parameter to estimate the aromaticity of natural water and is
Table 1 e Best fit multiple-regressionmodels relating log-transvariables of seasonal wetlands located in the Piedmont and Bl
Water quality DOC (mg L�1)a
Factors 250 m 500 m 1000 m 250 m
Develop e e 0.028* e
Pasture 0.024* 0.029* 0.036** e
Open water �0.032* e
Cultivated e e e e
Disturbed e e e e
Water connection 0.529** 0.646** 0.613** 0.613**
r2 0.53** 0.71** 0.69** 0.29*
*: Sig. <0.05, **: Sig. <0.001.a Average values of all the sampling month were used in multiple-regres
determined by the ratio between UVA254 and DOC (Weishaar
et al., 2003). Fig. 6 shows the relationship between UVA254
and DOC for all the water samples collected over a three
month period, and the aromatic property can be approxi-
mated with the calculated slope. It can be found that the forty
wetlands exhibited a good relevance betweenUVA254 andDOC
(r2 ¼ 0.902, p < 0.001). Generally, the connected wetlands
appeared in lower UVA254 (<0.15 cm�1) and DOC (<3.0 mg L�1)
region whereas the isolated wetlands appeared in higher re-
gion (UVA254 > 0.15 cm�1, DOC>3.0 mg L�1). The connected
wetlands with higher value of UVA254 (>0.15 cm�1) and DOC
(>3.0mg L�1) were located in themore-developed region of the
study area (i.e., the area surrounding Clemson, SC).
Fig. 7a summarizes the data of SUVA254 and E2:E3 for all the
study wetlands. For E2:E3, it can be found that the isolated
wetlands in less-developed area exhibited more stable results
both temporally and spatially compared to other sites. On the
contrary, the E2:E3 results of S1 to S6 showed both temporally
and spatially-obvious patterns. The variation of E2:E3 from S1
to S6 had an inverse relationship with SUVA254; the relation-
ship between E2:E3 and SUVA254 for less-developed and more
more-developed region are shown in Fig. 7b.
formed water quality to the land-use and water connectionue Ridge ecoregions of South Carolina, USA.
TDN (mg L�1)a EC (mm cm�1)
500 m 1000 m 250 m 500 m 1000 m
e 0.044* 0.353* 0.414* 0.382*
e 0.027** e e e
e e e e e
e e e e e
e e e e e
0.463* 0.307* e e e
0.44* 0.53** 0.54** 0.66** 0.55**
sion.
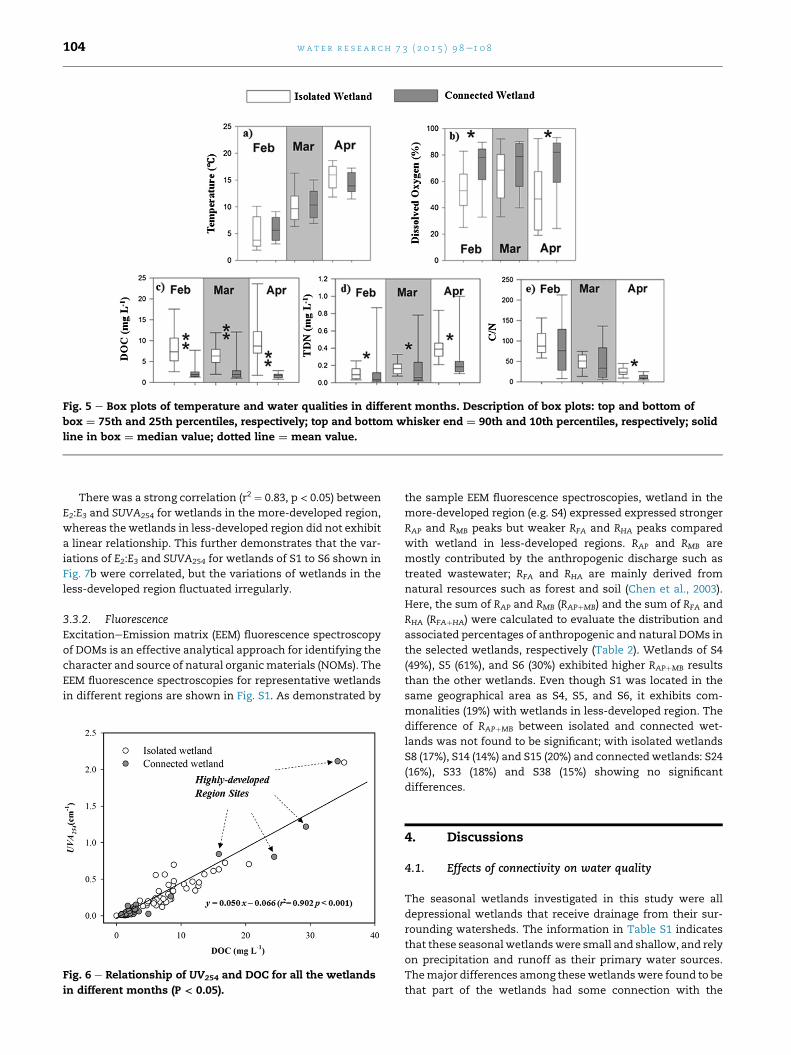
Fig. 5 e Box plots of temperature and water qualities in different months. Description of box plots: top and bottom of
box ¼ 75th and 25th percentiles, respectively; top and bottom whisker end ¼ 90th and 10th percentiles, respectively; solid
line in box ¼ median value; dotted line ¼ mean value.
wat e r r e s e a r c h 7 3 ( 2 0 1 5 ) 9 8e1 0 8104
There was a strong correlation (r2 ¼ 0.83, p < 0.05) between
E2:E3 and SUVA254 for wetlands in the more-developed region,
whereas the wetlands in less-developed region did not exhibit
a linear relationship. This further demonstrates that the var-
iations of E2:E3 and SUVA254 for wetlands of S1 to S6 shown in
Fig. 7b were correlated, but the variations of wetlands in the
less-developed region fluctuated irregularly.
3.3.2. FluorescenceExcitationeEmission matrix (EEM) fluorescence spectroscopy
of DOMs is an effective analytical approach for identifying the
character and source of natural organicmaterials (NOMs). The
EEM fluorescence spectroscopies for representative wetlands
in different regions are shown in Fig. S1. As demonstrated by
Fig. 6 e Relationship of UV254 and DOC for all the wetlands
in different months (P < 0.05).
the sample EEM fluorescence spectroscopies, wetland in the
more-developed region (e.g. S4) expressed expressed stronger
RAP and RMB peaks but weaker RFA and RHA peaks compared
with wetland in less-developed regions. RAP and RMB are
mostly contributed by the anthropogenic discharge such as
treated wastewater; RFA and RHA are mainly derived from
natural resources such as forest and soil (Chen et al., 2003).
Here, the sum of RAP and RMB (RAPþMB) and the sum of RFA and
RHA (RFAþHA) were calculated to evaluate the distribution and
associated percentages of anthropogenic and natural DOMs in
the selected wetlands, respectively (Table 2). Wetlands of S4
(49%), S5 (61%), and S6 (30%) exhibited higher RAPþMB results
than the other wetlands. Even though S1 was located in the
same geographical area as S4, S5, and S6, it exhibits com-
monalities (19%) with wetlands in less-developed region. The
difference of RAPþMB between isolated and connected wet-
lands was not found to be significant; with isolated wetlands
S8 (17%), S14 (14%) and S15 (20%) and connected wetlands: S24
(16%), S33 (18%) and S38 (15%) showing no significant
differences.
4. Discussions
4.1. Effects of connectivity on water quality
The seasonal wetlands investigated in this study were all
depressional wetlands that receive drainage from their sur-
rounding watersheds. The information in Table S1 indicates
that these seasonal wetlandswere small and shallow, and rely
on precipitation and runoff as their primary water sources.
Themajor differences among thesewetlandswere found to be
that part of the wetlands had some connection with the

Fig. 7 e (a): E2: E3 and SUVA254 of the forty seasonal wetlands. The vertical bars represent monthly variations, not the
analytical error (analytical error was usually <3%); (b): linear regression of E2:E3 and SUVA254 for the seasonal wetlands. Solid
triangle, open circle and solid circle represent the wetlands in more-developed region, connected wetland and isolated
wetlands in less-developed region, respectively.
wa t e r r e s e a r c h 7 3 ( 2 0 1 5 ) 9 8e1 0 8 105
surface water, but the others were almost entirely geograph-
ically isolated. As a result of higher levels of water exchange,
the connected wetlands exhibited higher DO levels than iso-
latedwetlands (Fig. 5d).We did not find statistically significant
differences in pH, temperature and EC between connected
and isolated wetlands. However, the differences of DOC and
TDN did reveal significant differences between isolated and
connected wetlands (t-test, p < 0.001).
The isolated wetlands in less-developed areas exhibited
higher DOC and TDN as compared to the connected wetlands.
Multiple-regression results (Table 1) indicate that water
connection was the primary driving force for the
concentration of DOC and TDN. Result of cluster analysis also
demonstrates that the isolated and connected wetlands in
less-developed region showed different characteristics on the
basic water quality. It is reasonable to believe that lack of
water connections made the isolated wetlands more effective
for retaining higher amounts of DOMs. In other words, part of
the dissolved carbon and nitrogen could be carried to down-
stream areas from the connected wetlands. The utility of
isolated wetlands for trapping pollutants and nutrients have
been reported in other studies (Whitmire and Hamilton, 2005).
C/N ratios were not significantly different between isolated
and connected wetlands. Since C/N ratio is more dependent

Table 2 e Proportions of FRI regions for representativewetlands in less and more-developed regions within thePiedmont and Blue Ridge ecoregions of South Carolina,USA.
Wetlands Anthropogenicresource
Natural resource
RAP
(%)RMB
(%)RAPþMB
(%)RFA
(%)RHA
(%)RFAþHA
(%)
S1 9.0 9.8 18.8 37.9 43.3 81.2
S4 23.9 16.0 40.0 34.7 25.3 60.0
S5 2.6 58.2 60.8 16.8 22.4 39.2
S6 16.1 13.4 29.5 39.7 30.8 70.5
S8 7.8 8.9 16.8 38.2 45.0 83.2
S14 8.4 5.1 13.5 56.9 29.6 86.5
S15 10.6 9.0 19.6 36.3 44.1 80.4
S24 8.4 7.7 16.1 39.3 44.6 83.9
S33 8.7 8.9 17.6 39.0 43.5 82.4
S38 14.5 0.7 15.2 50.1 34.8 84.8
RAP: percentage of aromatic protein region; RMB: percentage of sol-
uble microbial by-product like materials region; RFA: percentage of
fulvic acid-like region; RHA: percentage of humic acid-like materials
region.
wat e r r e s e a r c h 7 3 ( 2 0 1 5 ) 9 8e1 0 8106
on the microbial activity including ammonification and
immobilization (Bachand and Horne, 2000; Ehrenfeld and Yu,
2012), the influence of water connection was not a primary
driving factor in this particular instance. Moreover, the fitting
of DOC and SUVA254 for all the wetlands showed a strong
relationship (r2 ¼ 0.90, p < 0.001), which further illustrates that
there was no significant difference in the aromaticity of DOMs
between isolated and connected wetlands. The FRI result also
demonstrates a similar proportion of DOMs for both isolated
and connected wetlands without anthropogenic effects (Table
2).
The effects of hydrological connectivity in wetlands
located in more-developed areas were somewhat different
than what we observed in less-developed areas. Some con-
nectedwetlands (S3, S5 and S6) showed higher concentrations
of DOC and TDN than isolated wetlands. The multiple
regression results also indicated that land-use factors such as
developed and pastureland areas had an important effect on
water quality with the exception of hydrological connectivity.
Particularly, the developed proportion of land surrounding
study wetlands had a decisive effect on EC levels. The effects
of land-use on water quality will be further discussed below.
4.2. Nutrient dynamics
The temporal variation of the water quality can be discussed
on the context of both concentration and composition. Firstly,
the concentration variations of DOC and TDN for seasonal
wetlands were different. From February to April, most wet-
lands exhibited small variation on DOC, fluctuating between
5.71 ± 0.95 and 6.03 ± 1.30 mg L�1 (mean ± standard error,
n ¼ 40). In contrast, TDN showed a statistically significant
increase, from 0.14 ± 0.04 to 0.34 ± 0.05 mg L�1
(mean ± standard error, n ¼ 40). In natural water, the major
source of dissolved nitrogen comes from the decomposition of
plant detrital and soil matters to inorganic nitrogen with the
microbial catabolic activity (Fisk and Fahey, 2001). The
increased levels of TDN in seasonal wetlands were primarily
the result of microbial decomposition of leaf litter and soil
organic matter. During the rainy season, the temperature
increased from February to April, which could enhance mi-
crobial activity.
Secondly, variation of water composition in seasonal
wetlands can be analyzed using C/N ratio and optical prop-
erties. The C/N ratio decreased from 77.82 ± 1.38
(mean ± standard error, n ¼ 40) in February to 15.14 ± 0.26
(mean ± standard error, n ¼ 40). The significant variation of C/
N ratio further demonstrates the effect ofmicrobial activity on
N-transformation (Bedard-Haughn et al., 2006). However, re-
sults of SUVA254 and E2:E3 demonstrated irregular fluctuation
without an obvious trend throughout time. This result in-
dicates that the composition of DOC was relatively stable
compared with that of TDN, demonstrating that microbial
activity was not a driving force of DOC transformation.
4.3. Effect of land-use on water quality
Anthropogenic factors, which can be measured by remote
sensing as land-use, have an important influence on thewater
chemistry in different wetlands (Morrice et al., 2008; Reiss,
2006). Our results also indicated the substantial effect of
land-use factors on the water quality of seasonal wetlands.
Except for the hydrological connectivity, developed and
pastureland areas showed higher contributions of DOC and
TDN than other types of land uses. Previous researches have
demonstrated a positive relationship between developed/
urban areas and dissolved carbon and nitrogen in wetlands
(Haidary et al., 2013; Morrice et al., 2008). For pastureland area,
the positive relationship with dissolved carbon and nutrients
has also been found in streams (Buck et al., 2004) and large-
scale wetlands (Galbraith and Burns, 2007; Graves et al.,
2004). In the more-developed region, S3, S4, S5 and S6 were
adjacent to a highway (<500 m), which can be a primary
drainage pathway from areas with intense residential devel-
opment, whereas S1 and S2 were far away from the highway.
Results above indicate that water quality of small, seasonal
wetlands was sensitive to the land use of adjacent areas and
the land use could have a greater impact than the hydrological
connectivity. Furthermore, the proportion of developed area
was the only factor correlated with the variation of EC. As an
indicator of the total ionic level in water, EC is believed to
more strongly relate to anthropogenic discharge such as
sewage, runoff from lawns and other input sources (Haidary
et al., 2013). The exclusive correlation between the propor-
tion of developed area and EC further demonstrates the sub-
stantial influence of land-use on the water quality of adjacent
wetlands. In addition, there was no interaction between land-
use and C/N ratio in the multiple-regression analysis. As dis-
cussed in 4.2, C/N ratio is more dependent on the microbial
activity, thus the factors of land-use were not the driven force
to its variation. Cluster analysis based on DOC, TDN and EC
grouped wetland S3, S4, S5 and S6 as one cluster from other
wetlands, further demonstrating the clear effects of land use
on water quality of these seasonal wetlands.
Besides the effect on concentrations of DOC and TDN,
land-use factors may also affect the composition of DOM.
There are extensive studies which discuss the relationship

wa t e r r e s e a r c h 7 3 ( 2 0 1 5 ) 9 8e1 0 8 107
between land use changes and water quality (Cabezas et al.,
2009; Panno et al., 1999; Tu, 2011), but few studies have
focused on the impacts of anthropogenic forces on DOM'scomposition in wetlands. The fitting of UVA254 and DOC with
all of the data showed good relevance, indicating that the
water in all studied wetlands had similar aromaticity. Since
the forty seasonal wetlands are located in a small region
(70 � 70 km), the features of climate, vegetation and soil for
these wetlands are similar. Result of E2:E3 for wetlands in the
more-developed region showedmore dramatic variation than
that of wetlands in the less-developed region. This result in-
dicates that anthropogenic stress had some substantial in-
fluence on the composition of DOMs. Wetlands in more-
developed areas showed a strong negative correlation be-
tween E2:E3 and SUVA254, whereas no linear correlation was
observed for wetlands in the less-developed region (Fig. 7b).
Normally, SUVA254 increases with the molecular size of DOM,
thus it is inversely correlated with E2:E3 for DOM derived from
different resources (Helms et al., 2008). Wetlands located in
more-developed areas drain higher levels of anthropogenic
runoff, which may contain more pollutants of smaller mo-
lecular size such as aromatic proteins, thus resulting in the
significant negative correlation between E2:E3 and SUVA254.
Alternatively, without the substantial input of these pollut-
ants, wetlands in less-developed areas showed irregular
variation of E2:E3 and SUVA254. The FRI results show that the
proportions of RAP and RMB of wetlands in the more-developed
region (43 ± 9%, mean ± standard error, n ¼ 3) were higher
than that of wetlands in the less-developed region (17 ± 1%,
mean ± standard error, n ¼ 7). The higher percetages of RAP
and RMB correspond with the larger contents of aromatic
protein and microbial by-product-like material which is a
common characteristic of natural water that is affected by
land use changes (Chen et al., 2003). By contrast, the larger
contents of RFA and RHA demonstrate that humic and fulvic
matters are the dominated DOM for wetlands in the less-
developed region. Furthermore, the low proportion of
anthropogenic source for wetlands far from the road (S1) in-
dicates that it was not affected significantly by the drainage
from adjacent developed and pasture regions. The distance
between S1 and S5 was only about 1.5 km, thus it demon-
strates that the small, seasonal wetlands responded to the
surrounding environment within a small spatial scale.
5. Conclusions
Forty small, seasonal wetlands in the upper Piedmont and
lower Blue Ridge ecoregions of South Carolina were investi-
gated to examine the concentrations and compositions of
dissolved organic carbon (DOC) and total dissolved nitrogen
(TDN) during the wet season (FebruaryeApril) in 2011. The
characteristics of DOC and TDN were dependent on both
wetland hydrological connection and the surrounding land-
use. The isolated wetlands exhibited higher concentrations
of DOC and TDN than the connected wetlands. However, the
local, more-urbanized land use in adjacent areas can offset
this phenomenon, with possible inputs of carbon, nitrogen
and other pollutants draining fromurbanized and pastureland
areas. The DOC of wetlands impacted by human activities
suggested land-use factors as primary drivers, whereas the
wetlands in the less-developed region showed obvious DOC
characteristics belonging to NOMs. The temporal variation of
water quality primarily exhibited on the nitrogen compounds,
which had a significant increase during the study period. Mi-
crobial activity was believed to be the major contribution for
this variation but this did not significantly change the DOC
composition. Results of this work demonstrate that the water
quality of small, seasonal wetlands is affected by multiple
variables, and the small water volume of these wetlands
makes them more sensitive to land use change.
Acknowledgment
This study was supported by US EPA Region 4 Wetland Pro-
gram Development Grant, Clemson University School of
Agriculture, Forest, and Environmental Sciences, and Chinese
Postdoctoral Science Foundation (No. 2012M521607). This
material is based upon work supported by NIFA/USDA under
project number SC-1700489. Technical Contribution No. 6327
of the Clemson University Experiment Station.
Appendix A. Supplementary data
Supplementary data related to this article can be found at
http://dx.doi.org/10.1016/j.watres.2015.01.007.
r e f e r e n c e s
Bachand, P.A.M., Horne, A.J., 2000. Denitrification in constructedfree-water surface wetlands: II. Effects of vegetation andtemperature. Ecol. Eng. 14 (1e2), 17e32.
Batzer, D.P., Jackson, C.R., Mosner, M., 2000. Influences of riparianlogging on plants and invertebrates in small, depressionalwetlands of Georgia, USA. Hydrobiologia 441 (1e3), 123e132.
Bedard-Haughn, A., Matson, A.L., Pennock, D.J., 2006. Land useeffects on gross nitrogen mineralization, nitrification, and N2Oemissions in ephemeral wetlands. Soil Biol. Biochem. 38 (12),3398e3406.
Buck, O., Niyogi, D.K., Townsend, C.R., 2004. Scale-dependence ofland use effects on water quality of streams in agriculturalcatchments. Environ. Pollut. 130 (2), 287e299.
Cabezas, A., Garcia, M., Gallardo, B., Gonzalez, E., Gonzalez-Sanchis, M., Comin, F.A., 2009. The effect of anthropogenicdisturbance on the hydrochemical characteristics of riparianwetlands at the Middle Ebro River (NE Spain). Hydrobiologia617, 101e116.
Campbell, C.E., Allen, J., Lu, K.S., 2008. Modeling growth andpredicting future developed land in the upstate of SouthCarolina. In: Proceedings of the 2008 South Carolina WateResources Conference. Clemson University RestorationInstitute, Clemson. http://tigerprints.clemson.edu/cgi/viewcontent.cgi?article¼1038&context¼scwrc.
Chen, W., Westerhoff, P., Leenheer, J.A., Booksh, K., 2003.Fluorescence excitationeemission matrix regional integrationto quantify spectra for dissolved organic matter. Environ. Sci.Technol. 37 (24), 5701e5710.
Cook, B.J., Hauer, F.R., 2007. Effects of hydrologic connectivity onwater chemistry, soils, and vegetation structure and function

wat e r r e s e a r c h 7 3 ( 2 0 1 5 ) 9 8e1 0 8108
in an intermontane depressional wetland landscape.Wetlands 27 (3), 719e738.
Department of the Army, 1987. Wetlands Research ProgramTechnical 1 Report Y-87-1. Corps of Engineers WetlandsDelineation Manual (Vicksburg, Mississippi).
Ehrenfeld, J.G., Yu, S., 2012. Patterns of nitrogen mineralization inwetlands of the New Jersey Pinelands along a shallow watertable gradient. Am. Midl. Nat. 167 (2), 322e335.
Fisk, M.C., Fahey, T.J., 2001. Microbial biomass and nitrogencycling responses to fertilization and litter removal in youngnorthern hardwood forests. Biogeochemistry 53 (2), 201e223.
Fracz, A., Chow-Fraser, P., 2013. Changes in water chemistryassociated with beaver-impounded coastal marshes ofeastern Georgian Bay. Can. J. Fish. Aquat. Sci. 70 (6), 834e840.
Galbraith, L.M., Burns, C.W., 2007. Linking land-use, water bodytype and water quality in southern New Zealand. Landsc. Ecol.22 (2), 231e241.
Graves, G.A., Wan, Y.S., Fike, D.L., 2004. Water qualitycharacteristics of storm water from major land uses in SouthFlorida. J. Am. Water Resour. Assoc. 40 (6), 1405e1419.
Haidary, A., Amiri, B.J., Adamowski, J., Fohrer, N., Nakane, K.,2013. Assessing the impacts of four land use types on thewater quality of wetlands in Japan. Water Resour. Manag. 27(7), 2217e2229.
Hayashi, M., 2004. Temperature-electrical conductivity relation ofwater for environmental monitoring and geophysical datainversion. Environ. Monit. Assess. 96 (1e3), 119e128.
Hayashi, M., van der Kamp, G., 2000. Simple equations torepresent the volume-area-depth relations of shallowwetlands in small topographic depressions. J. Hydrol. 237(1e2), 74e85.
Hebb, A.J., Mortsch, L.D., Deadman, P.J., Cabrera, A.R., 2013.Modeling wetland vegetation community response to water-level change at Long Point, Ontario. J. Gt. Lakes Res. 39 (2),191e200.
Helms, J.R., Stubbins, A., Ritchie, J.D., Minor, E.C., Kieber, D.J.,Mopper, K., 2008. Absorption spectral slopes and slope ratiosas indicators of molecular weight, source, and photobleachingof chromophoric dissolved organic matter. Limnol. Oceanogr.53 (3), 955e969.
Kazezyilmaz-Alhan, C.M., Medina, M.A., Richardson, C.J., 2007. Awetland hydrology and water quality model incorporatingsurface water/groundwater interactions. Water Resour. Res.43 (4).
Maassen, S., Balla, D., Kalettka, T., Gabriel, O., 2012. Screening ofprevailing processes that drive surface water quality ofrunning waters in a cultivated wetland region of Germany e amultivariate approach. Sci. Total Environ. 438, 154e165.
McCauley, L.A., Jenkins, D.G., Quintana-Ascencio, P.F., 2013.Isolated wetland loss and degradation over two decades in anincreasingly urbanized landscape. Wetlands 33 (1), 117e127.
Miller, M.P., Simone, B.E., McKnight, D.M., Cory, R.M.,Williams, M.W., Boyer, E.W., 2010. New light on a dark subject:comment. Aquat. Sci. 72 (3), 269e275.
Min, J.H., Perkins, D.B., Jawitz, J.W., 2010. Wetland-groundwaterinteractions in subtropical depressional wetlands. Wetlands30 (5), 997e1006.
Montgomery, J.A., Eames, J.M., 2008. Prairie wolf slough wetlandsdemonstration project: a case study illustrating the need forincorporating soil and water quality assessment in wetlandrestoration planning, design and monitoring. Restor. Ecol. 16(4), 618e628.
Morrice, J.A., Danz, N.P., Regal, R.R., Kelly, J.R., Niemi, G.J.,Reavie, E.D., Hollenhorst, T., Axler, R.P., Trebitz, A.S.,Cotter, A.M., Peterson, G.S., 2008. Human influences on waterquality in Great Lakes coastal wetlands. Environ. Manage 41(3), 347e357.
Murphy, K.R., Butler, K.D., Spencer, R.G.M., Stedmon, C.A.,Boehme, J.R., Aiken, G.R., 2010. Measurement of dissolvedorganic matter fluorescence in aquatic environments: anInterlaboratory comparison. Environ. Sci. Technol. 44 (24),9405e9412.
Panno, S.V., Nuzzo, V.A., Cartwright, K., Hensel, B.R., Krapac, I.G.,1999. Impact of urban development on the chemicalcomposition of ground water in a fen-wetland complex.Wetlands 19 (1), 236e245.
Pitt, A.L., Baldwin, R.F., Lipscomb, D.J., Brown, B.L., Hawley, J.E.,Allard-Keese, C.M., Leonard, P.B., 2012. The missing wetlands:using local ecological knowledge to find cryptic ecosystems.Biodivers. Conserv. 21 (1), 51e63.
Reiss, K.C., 2006. Florida wetland condition index for depressionalforested wetlands. Ecol. Indic. 6 (2), 337e352.
Seilheimer, T.S., Chow-Fraser, P., 2006. Development and use ofthe Wetland Fish Index to assess the quality of coastalwetlands in the Laurentian Great Lakes. Can. J. Fish. Aquat.Sci. 63 (2), 354e366.
Stokstad, E., 2006. Water quality e high court asks Army Corps tomeasure value of wetlands. Science 312 (5782), 1870e1870.
Trebitz, A.S., Brazner, J.C., Cotter, A.M., Knuth, M.L., Morrice, J.A.,Peterson, G.S., Sierszen, M.E., Thompson, J.A., Kelly, J.R., 2007.Water quality in great lakes coastal wetlands: basin-widepatterns and responses to an anthropogenic disturbancegradient. J. Gt. Lakes Res. 33, 67e85.
Tu, J., 2011. Spatial and temporal relationships between waterquality and land use in northern Georgia, USA. J. Integr.Environ. Sci. 8 (3), 151e170.
Verhoeven, J.T.A., Arheimer, B., Yin, C.Q., Hefting, M.M., 2006.Regional and global concerns over wetlands and water quality.Trends Ecol. Evol. 21 (2), 96e103.
Weishaar, J.L., Aiken, G.R., Bergamaschi, B.A., Fram, M.S., Fujii, R.,Mopper, K., 2003. Evaluation of specific ultraviolet absorbanceas an indicator of the chemical composition and reactivity ofdissolved organic carbon. Environ. Sci. Technol. 37 (20),4702e4708.
Whigham, D.F., Jordan, T.E., 2003. Isolated wetlands and waterquality. Wetlands 23 (3), 541e549.
Whitmire, S.L., Hamilton, S.K., 2005. Rapid removal of nitrate andsulfate in freshwater wetland sediments. J. Environ. Qual. 34(6), 2062e2071.
Zhou, J., Wang, J.J., Baudon, A., Chow, A.T., 2013. Improvedfluorescence excitation-emission matrix regional integrationto quantify spectra for Fluorescent dissolved organic matter. J.Environ. Qual. 42 (3), 925e930.


