Embed Size (px)
Citation preview

4UDK 66:54(05) CODEN HMIDA 8 ISSN 0367–598X
Vol. 75 Časopis Saveza hemijskih inženjera Srbije
BEOGRAD, JULI-AVGUST 2021. HMIDA 8, 75 (4) 195 -256 (2021)

Aktivnosti Saveza hemijskih inženjera Srbije pomaž u:
MINISTARSTVO PROSVETE, NAUKE I TEHNOLOŠKOG RAZVOJA REPUBLIKE SRBIJE
Tehnološko-metalurški fakultet
Univerziteta u Beogradu, Beograd
Institut za tehnologiju nuklearnih i drugih mineralnih sirovina, Beograd
Hemijski fakutet Univerziteta u
Beogradu, Beograd
Prirodno-matematički fakultet
Univerziteta u Novom Sadu, Novi Sad
Institut za opštu i fizičku hemiju,
Beograd
Tehnološki fakultet
Univerziteta u Novom Sadu, Novi Sad
NU Institut za hemiju, tehnologiju i metalurgiju
Univerziteta u Beogradu, Beograd
Institut IMS, Beograd
Tehnološki fakultet
Univerziteta u Nišu, Leskovac
Fakultet tehničkih nauka,
Kosovska Mitrovica

Chemical Industry
Химическая промышленность
Časopis Saveza hemijskih inženjera Srbije
Journal of the Association of Chemical Engineers of Serbia
Журнал Союза химических инженеров Сербии
VOL. 75 Beograd, juli-avgust 2021. Broj 4
Izdavač Savez hemijskih inženjera Srbije Beograd, Kneza Miloša 9/I Glavni urednik Bojana Obradović
Zamenica glavnog i odgovornog urednika Emila Živković
Pomoćnik glavnog i odgovornog urednika Ivana Drvenica
Urednici Enis Džunuzović, Ivana Banković-Ilić, Maja Obradović, Dušan Mijin, Marija Nikolić, Tatjana Volkov-Husović, Đorđe Veljović, Članovi uredništva Nikolaj Ostrovski, Milorad Cakić, Željko Čupić, Miodrag Lazić, Slobodan Petrović, Milovan Purenović, Aleksandar Spasić, Dragoslav Stoiljković, Radmila Šećerov-Sokolović, Slobodan Šerbanović, Nikola Nikačević, Svetomir Milojević Članovi uredništva iz inostranstva Dragomir Bukur (SAD), Jiri Hanika (Češka Republika), Valerij Meshalkin (Rusija), Ljubiša Radović (SAD), Constantinos Vayenas (Grčka) Likovno-grafičko rešenje naslovne strane Milan Jovanović Redakcija 11000 Beograd, Kneza Miloša 9/I Tel/fax: 011/3240-018 E-pošta: [email protected] www.ache.org.rs Izlazi dvomesečno, rukopisi se ne vraćaju
Za izdavača: Ivana T. Drvenica
Sekretar redakcije: Slavica Desnica
Izdavanje časopisa pomaže Republika Srbija, Ministarstvo prosvete, nauke i tehnološkog razvoja Uplata pretplate i oglasnog prostora vrši se na tekući račun Saveza hemijskih inženjera Srbije, Beograd, broj 205-2172-71, Komercijalna banka a.d., Beograd Menadžer časopisa i Kompjuterska priprema Aleksandar Dekanski Štampa Razvojno-istraživački centar grafičkog inženjerstva, Tehnološko-metalurški fakultet, Univerzitet u Beogradu, Karnegijeva 4, 11000 Beograd Indeksiranje Radovi koji se publikuju u časopisu Hemijska Industrija ideksiraju se preko Thompson Reuters Scietific servisa Science Citation Index - ExpandedTM i Journal Citation Report (JCR)
SADRŽAJ/CONTENTS
Kompoziti / Composites
Jasmina Lj. Petrović, Srba A. Mladenović, Aleksandra T. Ivanović, Ivana I. Marković, Svetlana Lj. Ivanov, Korelisanje uticaja veličine i sadržaja ojačavajućih čestica Al2O3 na tvrdoću kompozita sa aluminijumskom matricom dobijenih meto-dom vrtložnog livenja / Correlation of hardness of alumi-num composites obtained by stir casting technology and the size and weight fraction of reinforcing Al2O3 particles ...... 195
Separacioni procesi / Separation Processes
Yam Morales, Nelson Herrera, Kevin Pérez, Lithium carbonate se-dimentation using flocculants with different ionic bases / Taloženje litijum karbonata korišćenjem flokulanata sa različitim jonskim bazama ......................................................... 205
Metalni materijali / Metal materials
Nataša G. Đorđević, Milica M. Vlahović, Sanja P. Martinović, Slavica R. Mihajlović, Nenad M. Vušović, Miroslav D. Sokić, Ispitiva-nje uticaja mehaničke aktivacije smeše MgO-TiO2 na sintezu magnezijum-titanata / Investigation of the impact of me-chanical activation on synthesis of the MgO-TiO2 system ......... 213
Kristina N. Božinović, Dragan M. Manasijević, Ljubiša T. Balanović, Milan D. Gorgievski, Uroš S. Stamenković, Miljan S. Marković, Zoran D. Mladenović, Study of microstructure, hardness and thermal properties of Sn-Bi alloys / Ispi-tivanje mikrostrukture, tvrdoće i termijskih karakteristika legura u sistemu Sn-Bi ............................................................... 227
Otpadni gasovi / Waste Gas Treatment
Aleksandras Chlebnikovas, Experimental investigation of a one-le-vel eight-channel cyclone-separator incorporating quarter-rings / Eksperimentalno istraživanje jednostepenog osmo-kanalnog industrijskog ciklonskog separatora ........................... 241
Prikaz knjiga i događaja / Book and Event Review
Kerstin Aldenhoff, MC2021 ended successfully: The limits of the measurable - exciting developments and latest trends in light and electron microscopy / MC 2021 je uspešno zavr-šen: Granice merljivog - uzbudljiv razvoj i najnoviji trendovi u svetlosnoj i elektronskoj mikroskopiji ................................... 253


195
Korelisanje uticaja veličine i sadržaja ojačavajućih čestica Al2O3 na tvrdoću kompozita sa aluminijumskom matricom dobijenih metodom vrtložnog livenja
Jasmina Lj. Petrović1, Srba A. Mladenović1, Aleksandra T. Ivanović2, Ivana I. Marković1 i
Svetlana Lj. Ivanov1
1Univerzitet u Beogradu, Tehnički fakultet u Boru, Bor, Srbija 2Institut za rudarstvo i metalurgiju Bor, Bor, Srbija
Izvod
U ovom radu, za izradu kompozita sa metalnom matricom dobijenih metodom vrtložnog livenja, korišćena je legura EN AW 6061 kao metalna osnova, a čestice Al2O3 kao ojačivač. Kompoziti sa metalnom matricom su značajni inženjerski materijali i potrebno je detaljno proučiti načine proizvodnje i faktore koji utiču na mehanička svojstva. U tu svrhu, primenjen je planirani eksperiment i matematički je modelovana tvrdoća. Za razvoj korelacionog modela korišćen je pun faktorni plan eksperimenata, 32. Veličina i maseni udeo ojačavajućih čestica Al2O3 bili su uticajni faktori, a vrednosti tvrdoće odziv sistema. Uticajni faktori posmatrani su na tri nivoa: 50, 80 i 110 μm za veličinu čestica i 2, 5 i 8 mas. % za sadržaj ojačivača. Izmerene vrednosti tvrdoće, kretale su se u opsegu od 72 HV10 do 80 HV10. Višestrukom regresionom analizom, dobijen je polinom drugog reda kojim se mogu pred-videti vrednosti tvrdoće kompozita sa metalnom osnovom. Određivanje uticaja ulaznih faktora na odziv sistema i provera adekvatnosti dobijenog regresionog modela, izvršena je primenom analize varijanse. Analiza rezultata je pokazala da veličina i maseni udeo ojača-vajućih čestica imaju značajan uticaj na vrednosti tvrdoće kompozita sa metalnom osnovom i da predloženi regresioni model potvrđuje eksperimentalno dobijene rezultate.
Ključne reči: metalna osnova; faktorni eksperiment; odziv sistema.
STRUČNI RAD
UDK: 669.714:661.183.8:620.178
Hem. Ind. 75 (4) 195-204 (2021)
Dostupno na web stranici časopisa: https://www.ache-pub.org.rs/index.php/HemInd/article/view/778
1. UVOD
Neprekidan razvoj nauke i tehnike doprineo je razvoju novih materijala za proizvodnju i dizajniranje inženjerskih
proizvoda. Od sredine prošlog veka, posebna pažnja posvećuje se istraživanju kompozitnih materijala (kompozita) [1].
Kompoziti se sastoje od dva ili više materijala, različitih fizičkih i hemijskih osobina pri čemu su konačna svojstva
kompozita bolja od svojstava sastavnih komponenti [2]. Veliki broj istraživača bavi se ispitivanjem čestičnih kompozita
sa metalnom matricom (engl. Metal Matrix Composite - MMC). Kod ovih materijala razlikuju se dve osnovne sastavne
komponente: metalna osnova (matrica) i ojačavajuća faza (ojačivač). Metali aluminijum, titan, magnezijum, bakar i
njihove legure, najčešće se koriste kao osnova za izradu MMC [2,3]. Materijali za ojačavanje su keramičke čestice u
obliku oksida (Al2O3, MgO, TiO2), karbida (SiC, TiC, B4C), nitrida (AlN, BN, Si3N4) i borida (TiB2) [4,5]. Među njima, po
značaju, posebno se ističu čestice Al2O3 i SiC [6]. Dodatak ojačivača metalnoj osnovi obezbeđuje: povećanu čvrstoću,
veći modul elastičnosti, višu radnu temperaturu, poboljšanu otpornost na habanje, smanjenu težinu konstrukcionih
delova, veliku električnu i toplotnu provodljivost, mali koeficijent termičkog širenja i dimenzionu stabilnost proizvoda u
poređenju sa samim metalima i legurama [1,7-10]. MMC se odlikuju niskom cenom, izotropnim osobinama i
mogućnošću proizvodnje upotrebom postojećih tehnologija [11,12]. Zastupljeni su u skoro svim granama industrije:
automobilskoj, avio-industriji, vojnoj industriji, građevinarstvu, medicini i dr. Raznolikost u primeni, zahteva odgovore
na mnoga pitanja u vezi sa dobijanjem i karakterizacijom metalnih kompozita [13,14].
Autor za prepisku: Jasmina Lj. Petrović, Univerzitet u Beogradu, Tehnički fakultet u Boru, Vojske Jugoslavije 12, 19210 Bor, Srbija
E-mail: [email protected]
Članak primljen: 9. aprila 2021; Članak prihvačen: 19 juna 2021; Članak publikovan: 19. jula 2021.
https://doi.org/10.2298/HEMIND210409018P

Hem. Ind. 75 (4) 195-204 (2021) J. LJ. PETROVIĆ et al.: TVRDOĆA KOMPOZITA SA ALUMINIJUMSKOM MATRICOM
196
U proizvodnji MMC, značajnu ulogu ima postupak njihovog dobijanja. Način proizvodnje primarno utiče na raspodelu
ojačavajućih čestica u metalnoj osnovi. Sve veći broj skorašnjih istraživanja bavi se rešavanjem pitanja selekcije
odgovarajućih tehnika za proizvodnju MMC i odabira adekvatnog ojačavajućeg materijala [14-17]. Podela tehnika za
proizvodnju kompozita izvršena je na osnovu stanja metalne osnove (tečno ili čvrsto) u momentu mešanja sa
ojačivačem. Zbog svoje jednostavnosti, ekonomičnosti i visoke proizvodnosti, posebno se izdvaja postupak dobijanja
MMC primenom metode vrtložnog livenja (engl. „stir casting“) [4, 10]. Postupak podrazumeva da se nakon pretapanja
metala u odgovarajućoj peći, ubacivanje ojačivača vrši uz primenu mešanja rastopa. Tokom mešanja, dolazi do
formiranja vrtloga, koji obezbeđuje unošenje veoma slabo kvašljivih čestica ojačivača unutar rastopa i njihovo
raspoređivanje.
U brojnim radovima [17-21], eksperimentalno je proučavan uticaj različitih faktora (veličina, oblik i maseni udeo
ojačavajućih čestica, brzina i vreme mešanja, oblik mešača, temperatura izlivanja) na osobine dobijenog kompozita.
Detaljno razumevanje uticaja različitih faktora na ispitivanu osobinu podrazumeva dugotrajan, komplikovan i skup
eksperimentalni rad. Potreban je veliki broj eksperimenata za optimizaciju ispitivane pojave ili određenog procesa. U
cilju skraćivanja eksperimentalnog rada i smanjenja troškova, koristi se metoda odzivne površine (engl. Responce
Surface Methodology - RSM). Ova metoda predstavlja zbir matematičkih i statističkih tehnika koje služe za modelovanje
i analizu problema u kojima na odziv sistema (zavisno promenljiva - y) utiče nekoliko faktora (nezavisno promenljive -
x0, x2,... xk) [22]. Metoda odzivne površine predviđa odziv sistema, analizira interakcije između faktora, definiše odnos
između odziva i faktora i predviđa vrednosti odziva uz upotrebu ograničenog broja eksperimenata [23]. Brojni istraživači
su koristili ovu metodu i razvili regresione modele za predviđanje različitih svojstava MMC [24,25].
Tako je razvijen regresioni model za predviđanje mikrotvrdoće kompozita na bazi aluminijumske legure EN AW 7075
ojačane česticama Al2O3 proizvedenih postupkom vrtložnog livenja koristeći faktorni plan eksperimenata sa četiri
faktora na pet nivoa [24]. U drugoj studiji je za razvoj regresionog modela korišćena metoda odzivne površine i
zaključeno je da je efekat zapreminskog udela ojačivača najuticajniji [25]. Na osnovu literaturnih istraživanja uticajnih
faktora [26-29], primećeno je da na vrednosti tvrdoće, između ostalih, najviše utiču veličina i maseni udeo ojačavajućih
čestica.
Cilj ovog rada je kreiranje regresionog modela na osnovu koga je moguće odrediti uticaj ispitivanih faktora (veličina
i maseni udeo ojačavajućih čestica Al2O3) na tvrdoću aluminijumskih MMC. Za razvoj regresionog modela, bitan faktor
je izbor plana eksperimenta [30]. U ovom ispitivanju, primenjen je pun faktorni plan eksperimenta (32). Statistička
obrada rezultata izvedena je korišćenjem programskog paketa SPSS Statistics [31]. Adekvatnost matematičkog modela,
statistički je proverena analizom varijanse (Analysis of variance - ANOVA) [22]. Ovakav pristup analizi uticajnih
parametara, uz primenu odgovarajućeg plana eksperimenta, uspešno je primenjen u modelovanju mnogih metalurških
procesa [32-37].
2. EKSPERIMENTALNI DEO
2. 1. Materijal i aparatura
Za izradu odlivaka korišćena je aluminijumska legura EN AW 6061 (Eling AD, Srbija) i čestice Al2O3 (Alumina DOO,
Republika Srpska). Hemijski sastav korišćene legure, određen primenom spektrofotometra Niton XL3t, dat je u Tabeli 1
i on odgovara graničnim vrednostima propisanim standardom EN 573-3 [38].
Prilikom izrade MMC, ojačavajuće čestice Al2O3 dodavane su u tri različite veličine, 50, 80 i 110 µm i tri različita
masena sadržaja, 2, 5 i 8 %.
Uzorci za eksperimentalna ispitivanja dobijeni su metodom vrtložnog livenja. Šematski prikaz korišćene aparature za
izvođenje ovog postupka prikazan je na Slici 1.

J. LJ. PETROVIĆ et al.: TVRDOĆA KOMPOZITA SA ALUMINIJUMSKOM MATRICOM Hem. Ind. 75 (4) 195-204 (2021)
197
Tabela 1. Hemijski sastav legure EN AW 6061 propisan standardom [38] i izmerene vrednosti u uzorku
Table 1. Chemical composition of EN AW 6061 alloy according to the standard [38] and measured values in the alloy sample
Element Količina, mas.%
Minimalna [38] Maksimalna [38] Izmerena
Si 0,5 0,9 0,82
Cu 0,15 0,40 0,15
Fe 0 0,7 0,29
Zn 0 0,25 0,11
Mg 0,8 1,2 0,84
Mn 0 0,15 0,04
Ni 0 0,05 <0,03
Pb 0 0,05 <0,04
Sn 0 0,05 <0,04
Ti 0 0,15 0,02
Cr 0,04 0,35 0,13
Ti+Zr 0 0,20 0,01
Al ostatak ostatak ostatak
Slika 1. Šematski prikaz aparature za vrtložno livenje: 1 – motor sa regulacijom brzine, 2 – elektrootporna peć, 3 – grejači, 4 – grafitni lonac, 5 – mešač, 6 – istopljeni metal, 7 – levak za doziranje čestica ojačivača, 8 – termopar, 9 – regulator temperature
Figure 1. Scheme of the stir casting experimental set up: 1 - motor with speed regulation, 2 - electric furnace, 3 - heaters, 4 - graphite crucible, 5 - mixer, 6 - molten metal, 7 - funnel for dosing of reinforcing particles, 8 - thermocouple, 9 - temperature regulator
2. 2. Opis eksperimenta
Postupak vrtložnog livenja se zasniva na infiltraciji ojačavajućih čestica Al2O3 u istopljenu metalnu aluminijumsku
osnovu EN AW 6061 legure uz mešanje rastopa. Legura EN AW 6061 istopljena je u grafitnom loncu zagrevanjem u
elektrootpornoj peći na 800˚C. U istopljeni rastop dodat je 1 mas.% Mg (99,9 %, Wifred, Kina), kako bi se povećala
kvašljivost ojačavajućih čestica. Posle potpunog topljenja, izvršeno je zahlađivanje rastopa do 710 oC, kako bi se povećala
viskoznost. Nakon zahlađenja, u rastop je stavljen mešač od alatnog čelika oblika ploče, koji je zagrejan u peći na 350 oC
kako se ne bi dodatno zahladio rastop. Nakon početka mešanja u rastop su ravnomerno dodate čestice Al2O3, koje su
prethodno zagrejane u peći 3 h na 500 oC, radi uklanjanja vlage. Primenjena je brzina mešanja od 500 o/min. Nakon
dodavanja ukupne količine ojačavajućih čestica, mešanje je nastavljeno još 5 min, u cilju njihove ravnomerne raspodele
po celoj zapremini rastopa. Izlivanje MMC izvršeno je u grafitnom kalupu. Kalup je prethodno zagrejan na 350˚C radi

Hem. Ind. 75 (4) 195-204 (2021) J. LJ. PETROVIĆ et al.: TVRDOĆA KOMPOZITA SA ALUMINIJUMSKOM MATRICOM
198
smanjenja poroznosti i ravnomernijeg očvršćavanja odlivka. Nakon dobijanja MMC sa različitim sadržajem (2, 5 i
8 mas.%) i različitom veličinom (50, 80 i 110 μm) Al2O3 čestica, izvršeno je merenje tvrdoće, pomoću Vikersovog aparata
za merenje tvrdoće (VEB Leipzig, Nemačka) sa opterećenjem od 10 kg (HV10). Vreme zadržavanja pri maksimalnom
opterećenju bilo je 10 s.
2. 3. Planirani eksperiment
U ovom radu, odziv sistema je tvrdoća kompozita (y), a uticajni faktori su veličina (x1) i sadržaj (x2) ojačavajućih čestica
Al2O3. Planirani eksperiment podrazumeva plansku promenu uticajnih faktora da bi se procenio njihov efekat na odziv
sistema. Opšti oblik matematičke zavisnosti odziva sistema od uticajnih faktora prikazan je jednačinom [35]:
y = f(x1, x2) + (1)
gde su: y – odziv sistema i zavisi od uticajnih faktora x1 i x2; – ukupna greška eksperimenta, sadrži slučajnu grešku
merenja i uticaje spoljašnje sredine koji nisu obuhvaćeni funkcijom f; f(x1, x2) – površina predstavljena ovom funkcijom,
odnosno odzivna površina.
Greška ε pokazuje razliku između izmerenih (stvarnih) vrednosti i vrednosti izračunatih po modelu. Ukoliko je greška
manja, aproksimacija je bolja. U cilju smanjivanja greške, merenja tvrdoće su ponovljena deset puta za isti nivo faktora
i izračunata je srednja vrednost.
Za predviđanja vrednosti tvrdoće kompozita na bazi legure EN AW 6061 ojačanih česticama Al2O3, eksperimentalni
podaci su modelovani regresionim polinomom drugog reda [13,17], oblika:
y = 0 + 1x1 + 2x2 + 11x12 + 22x2
2 + 12x1x2 (2)
gde 0, 1, 2, 11, 22, 12 predstavljaju koeficijente regresije. 0 je koeficijent regresije preseka modela; 1 i 2 su
koeficijenti regresije linearnih članova; 11 i 22 su koeficijenti regresije kvadratnih članova; 12 je koeficijent regresije
interakcije uticajnih faktora.
Izabrani pun faktorni plan eksperimenata, 32, ima dva faktora od kojih je svaki sa tri nivoa (donji, osnovni i gornji),
što znači ukupno 9 kombinacija nivoa faktora. U cilju lakšeg formiranja matrice, nivoi su kodirani sa -1, 0 i 1. Kodirane
vrednosti su bezdimenzionalne veličine i izračunate su iz opšte jednačine [36]:
+−
=−
max min
max min
2
2
x xx
Xx x
(3)
gde su: X – kodirana vrednost faktora; x - prava vrednost faktora; xmin i xmax – maksimalna i minimalna vrednost faktora,
redom.
U Tabeli 2 prikazani su uticajni faktori, njihovi nivoi i intervali variranja faktora.
Tabela 2. Nivoi faktora modela
Table 2. Model factor levels
Faktor Donji nivo Osnovni nivo Gornji nivo Interval variranja
Veličina čestica ojačivača, µm 50 80 110 30
X1 -1 0 1
Sadržaj ojačivača, % 2 5 8 3
X2 -1 0 1
2. 4. Statistička analiza regresionog modela
Programski paket SPSS Statistics (IBM, NY) korišćen je za statističku analizu. Određeni su svi koeficijenti regresije
(linearni, kvadratni i interakcije) i utvrđen je njihov efekat na predviđene vrednosti tvrdoće ANOVA testom. Rezultati
statističke analize predstavljeni su tabelama ANOVA.
ANOVA test sproveden je radi utvrđivanja adekvatnosti modela i značajnosti koeficijenata regresione jednačine. Zbir
kvadrata, broj stepena slobode, srednji kvadrati, F- i p-vrednosti korišćeni su kao statistički parametri. Statistička
značajnost uticajnih faktora analizirana je na osnovu vrednosti p. Faktori su statistički značajni ako je p-vrednost manja

J. LJ. PETROVIĆ et al.: TVRDOĆA KOMPOZITA SA ALUMINIJUMSKOM MATRICOM Hem. Ind. 75 (4) 195-204 (2021)
199
od 0,05. Adekvatnost regresionog modela ispitana je određivanjem koeficijenta determinacije (R2) koji pokazuje koji
procenat varijanse odziva sistema objašnjava model. Značaj modela je proveren pomoću F-testa.
3. REZULTATI I DISKUSIJA
U ovom radu analizirana su dva uticajna faktora na tri nivoa. Korišćen je pun faktorni plan eksperimenta, 32.
Napravljeno je 9 uzoraka različitog sastava na kojima je merena tvrdoća. Izvršeno je deset merenja tvrdoće na svakom
uzorku i izračunata srednja vrednost koja je korišćena u daljoj analizi. Razne kombinacije eksperimentalnih uslova
(kodirani i nekodirani) sa odgovarajućim eksperimentalnim vrednostima tvrdoće (srednje vrednosti) predstavljene su u
Tabeli 3. Eksperimentalne vrednosti tvrdoće kreću se u intervalu od 72 HV10 do 80 HV10. Najveća vrednost tvrdoće
(80,45 HV10) izmerena je na uzorku sa najmanjom veličinom čestica Al2O3 (50 µm) i najvećim sadržajem (8 mas.%), a
najmanje vrednosti tvrdoće (72,35 HV10) na uzorku sa najvećom veličinom čestica (110 µm) i najmanjim sadržajem
(2 mas.%).
Tabela 3. Plan eksperimenata i odziv sistema
Table 3. Experimental design and system response
Broj eksperimenta
Kodirane vrednosti Ulazne veličine Tvrdoća, HV10 ± standardna devijacija X1 X2 Veličina čestica, µm Sadržaj, %
1 -1 -1 50 2 73,28 ± 2,25
2 -1 0 50 5 78,31 ± 2,64
3 -1 1 50 8 80,45 ± 3,04
4 0 -1 80 2 73,11 ± 2,38
5 0 0 80 5 78,13 ± 1,18
6 0 1 80 8 79,08 ± 2,50
7 1 -1 110 2 72,35 ± 1,14
8 1 0 110 5 77,91 ± 2,59
9 1 1 110 8 78,51 ± 2.16
Vrednosti koeficijenata regresije, t-testa, p-vrednosti i statistike kolinearnosti, koju čine tolerancija i faktor povećanja
varijanse (Variance inflation factor – VIF) date su u Tabeli 4.
Tabela 4. Vrednosti koeficijenta regresije
Table 4. Values of the regression coefficients
Model Nestandardizovani koeficijent regresije Standardizovani koeficijent regresije
t - test p-vrednost Standardna greška
Konstanta 78,117 0,228 343,214 0,000
X1 -0,545 0,161 -0,157 -3,386 0,020
X2 3,217 0,161 0,925 19,987 0,000
X1X1 0,028 0,295 0,005 0,096 0,929
X2X2 -1,987 0,279 -0,330 -7,127 0,001
X1X2 -0,252 0,208 -0,059 -1,212 0,312
Rezultati iz Tabele 4 pokazuju da linearni članovi uticajnih faktora imaju statistički značajan uticaj na formiranje
modela odziva Y na nivou p < 0,05. Veći uticaj na predviđanje vrednosti tvrdoće ispitivanih aluminijumskih kompozita
ima sadržaj, u odnosu na uticaj veličine ojačavajućih čestica. Ovo se može objasniti činjenicom da veći sadržaj Al2O3 daje
gušću raspodelu ojačivača u matrici i na taj način je povećana dodirna površina između metala i čestica [41]. Statistički
značajan uticaj na formiranje modela odziva Y ima i kvadratni član masenog sadržaja ojačavajućih čestica. Koeficijenti
koji nisu statistički značajni (kvadratni član veličine čestica i član interakcije ulaznih faktora) izuzimaju se iz regresionog
polinoma. Tako se poboljšava sposobnost predviđanja predloženog modela.
Uzimajući u obzir samo statistički značajne parametre, formiran je matematički model uticaja veličine čestica i
sadržaja ojačivača na vrednosti tvrdoće ispitivanih aluminijumskih kompozita:

Hem. Ind. 75 (4) 195-204 (2021) J. LJ. PETROVIĆ et al.: TVRDOĆA KOMPOZITA SA ALUMINIJUMSKOM MATRICOM
200
Y = 78,117 – 0545X1 + 3,217X2 – 1,987X2X2 (4)
Primenom regresionog polinoma (4) može se predvideti promena vrednosti tvrdoće dobijenog MMC, sa promenom
veličine čestica i sadržaja ojačivača u granicama ispitivanih vrednosti ovih faktora.
Na osnovu vrednosti koeficijenata regresionog polinoma može se oceniti uticajnost pojedinih faktora. Vrednosti
koeficijenata uz uticajne faktore X1 i X2 iznose -0,545 i 3,217. Poređenjem ovih vrednosti može se zaključiti da X1 (sadržaj)
ima pozitivan, a X2 (veličina čestica) negativan uticaj na odziv sistema. Upoređivanjem standardizovanih koeficijenata β,
takođe se može odrediti uticaj ispitivanih faktora na odziv sistema. Dolazi se do istih zaključaka kao i upoređivanjem
koeficijenata regresionog polinoma.
Vrednovanje modela izvršeno je na osnovu rezultata statističke analize, korišćenjem vrednosti koeficijenta
determinacije, R2 (Tabela 5).
Tabela 5. Vrednovanje modela
Table 5. Model summary
Model R R2 Korigovano R2 Standardna greška procene
1 0,995 0,989 0,983 0,39422
Na osnovu rezultata prikazanih u Tabeli 5, zaključuje se da izabrani model objašnjava 98,9 % varijanse tvrdoće. Na
osnovu literaturnih podataka [42] polinomi sa R2>95 % mogu se smatrati prihvatljivim rezultatom nelinearne višestruke
regresije, odnosno da je primenjeni model faktornog eksperimenta adekvatan. Ovako visok koeficijent determinacije
ukazuje na izuzetno slaganje eksperimentalnih vrednosti i onih koje se modelom predviđaju.
Za procenu statističke značajnosti R2 i adekvatnosti modela korišćen je ANOVA test i rezultati odstupanja su prikazani
u Tabeli 6.
Tabela 6. Rezultati ANOVA testa modela drugog reda
Table 6. Results of the ANOVA test of the final second order polynomial model
Izbor varijabiliteta
Suma kvadrata odstupanja
Broj stepena slobode
Srednji kvadrat odstupanja f - test p - vrednost
Model 71,758 3 23,919 153,910 0,000
Ostatak 0,777 5 0,155
Ukupno 72,535 8
Sastavni deo statističke analize je grafički prikaz slaganja eksperimentalnih i vrednosti predviđenih regresionim
modelom (Slika 2). Linija 1 predstavlja idealan položaj, a Linija 2 regresionu liniju. Kružićima na grafiku predstavljene su
izmerene vrednosti tvrdoće. Uočava se da izmerene vrednosti tvrdoće leže vrlo blizu regresione linije (Linije 2), što
ukazuje na odlično slaganje eksperimentalnih i predviđenih vrednosti. Na podudarnost izmerenih i izračunatih vrednosti
ukazuje i visoka vrednost koeficijenta determinacije R2=0,989.
Na slici 3 predstavljena je odzivna površina koja prikazuje promenu odziva sistema, tvrdoće, sa promenom uticajnih
faktora, veličine i sadržaja ojačavajućih čestica.
Posmatrajući grafik sa slike 3, može se zaključiti da predviđene vrednosti tvrdoće rastu sa smanjenjem veličine čestica
ojačivača i sa povećanjem njihovog sadržaja u matrici.
Na granici ojačivač-matrica dolazi do povećanja energije naprezanja, kao posledica različitih koeficijenata termičkog
širenja aluminijumske osnove i ojačivača. Ova naprezanja izazivaju deformaciju rešetke metalne osnove i pojavu novih
dislokacija [43,44]. Povećanje tvrdoće uslovljeno je otežanim kretanjem dislokacija usled prisustva ojačavajućih čestica
u metalnoj osnovi. Veći sadržaj i manje dimenzije ojačavajućih čestica dovode do manjeg međučestičnog rastojanja u
metalnoj osnovi, dodatno otežavaju kretanje dislokacija i utiču na poboljšanje mehaničkih osobina [20,45].

J. LJ. PETROVIĆ et al.: TVRDOĆA KOMPOZITA SA ALUMINIJUMSKOM MATRICOM Hem. Ind. 75 (4) 195-204 (2021)
201
Slika 2. Zavisnost između eksperimentalnih i predviđenih vrednosti tvrdoće (linija 1 - idealan položaj, linija 2 - regresiona linija, o – izmerene vrednosti tvrdoće)
Figure 2. Correlation between experimental and predicted hardness values (line 1 - ideal position, line 2 - regression line, o - measured hardness values)
Slika 3. Zavisnost predviđenih vrednosti tvrdoće aluminijumskog kompozita od uticajnih faktora
Figure 3. Dependence of predicted hardness values of the aluminum composite on the investigated influencing factors
4. ZAKLJUČAK
MMC materijali na bazi EN AW 6061 legure koji sadrže 2, 5 i 8 mas.% ojačavajućih čestica Al2O3 veličine 50, 80 i
110 µm uspešno su dobijeni metodom vrtložnog livenja. Na osnovu analize efekata uticaja veličine i sadržaja
ojačavajućih čestica Al2O3 na tvrdoću dobijenih aluminijumskih kompozita, zaključuje se da vrednosti tvrdoće opadaju
sa povećanjem veličine, a rastu sa povećanjem sadržaja ojačavajućih čestica. Najveća vrednost tvrdoće (80,45 HV10)
dobijena je za MMC sa najmanjom veličinom čestica (50 µm) i najvećim sadržajem (8 mas.%), a najmanje vrednosti
tvrdoće (72,35 HV10) za MMC sa najvećom veličinom čestica (110 µm) i najmanjim sadržajem (2 mas.%).
Efekat uticajnih faktora na tvrdoću aluminijumskih MMC ispitan je primenom planiranog eksperimenta i statističke
analize. Korišćenjem punog faktornog plana eksperimenata, 32, višestrukom regresionom analizom dobijena je
matematička zavisnost za predviđanje vrednosti tvrdoće aluminijumskih MMC u funkciji veličine i sadržaja ojačavajućih
čestica Al2O3. Statističkom analizom utvrđeno je da na formiranje matematičkog modela promene tvrdoće statistički
R2 Linearno = 0,989

Hem. Ind. 75 (4) 195-204 (2021) J. LJ. PETROVIĆ et al.: TVRDOĆA KOMPOZITA SA ALUMINIJUMSKOM MATRICOM
202
značajan uticaj imaju linearni članovi uticajnih faktora (veličina i maseni sadržaj ojačavajućih čestica) i kvadratni član
masenog udela. Kvadratni član veličine čestica i član interakcije uticajnih parametara, nemaju statistički značajan
doprinos u predviđanju vrednosti tvrdoće.
Razvijeni regresioni matematički model pokazuje izuzetno slaganje sa eksperimentalnim vrednostima (R2=0,989).
Primenjeni RSM model može se uspešno koristiti za predviđanje vrednosti tvrdoće aluminijumskog MMC ojačanog Al2O3
česticama u posmatranom intervalu ulaznih faktora odnosno veličine i sadržaja čestica ojačivača.
Zahvalnica: Istraživanja predstavljena u ovom radu su urađena uz finansijsku podršku Ministarstva prosvete, nauke i
tehnološkog razvoja Republike Srbije, u okviru finansiranja naučno istraživačkog rada na Univerzitetu u Beogradu, Tehničkom
fakultetu u Boru, prema ugovoru sa evidencionim brojem 451-03-9/2021-14/ 200131.
LITERATURA
[1] Calister WD, Rethwisch DG. Materials Science and Engineering, An Introduction. 9th ed., New York, NY: Wiley; 2014 ISBN: 978-1-118-71718-9.
[2] Mazumdar SK. Composites Manufacturing: Materials, Product, and Process Engineering. 1th ed., Boca Raton, USA: CRC Press; 2001 ISBN 0-8493-0585-3.
[3] Campbell FC. Elements of Metallurgy and Engineering Alloys. 1th ed., ASM International, USA; 2008 ISBN: 978-0-87170-867-0.
[4] Yigezu BS, Jha PK, Mahapatra MM. The key attributes of synthesizing ceramic particulate reinforced Al-based matrix composites through stir casting. Materials and Manufacturing Processes. 2013; 28: 969–979.
[5] Yigezu BS, Mahapatra MM, Jha PK. Influence of reinforcement type on microstructure, hardness, and tensile properties of an aluminum alloy metal matrix composite. Journal of Minerals and Materials Characterization and Engineering. 2013; 4: 124-130. http://dx.doi.org/10.4236/jmmce.2013.14022
[6] Telang AK, Rehman A, Dixit G, Das S. Alternate materials in automobile brake disc applications with emphasis on Al composites—A technical review. Journal of Engineering Research and Studies. 2010; 1: 35-46.
[7] Vencl A, Šljivić V, Pokusová M, Kandeva M, Sun HG, Zadorozhnaya E, Bobić I. Production, microstructure and tribological properties of Zn-Al/Ti metal-metal composites reinforced with alumina nanoparticles. Inter Metalcast. 2021. https://doi.org/10.1007/s40962-020-00565-5
[8] Vencl A, Bobić I, Bobić B, Jakimovska K, Svoboda P, Kandeva M. Erosive wear properties of ZA-27 alloy-based nanocomposites: Influence of type, amount and size of nanoparticle reinforcements. Friction 2019; 7(4): 340–350. https://doi.org/10.1007/s40544-018-0222-x.
[9] Manasijević S, Marković S, Radiša R. Primena novih tehnologija u cilju poboljšanja eksploatacionih svojstava klipova sus motora od aluminijumskih legura. Zaštita materijala. 2013; 1(54): 45-50. http://idk.org.rs/wp-content/uploads/2013/12/8SRECKO.pdf
[10] Burzić M, Sedmak S, Burzić Z, Jaković D, Momčilović D. Uticaj sadržaja ojačavača na udarnu žilavost livenog Al-SiCp metal matričnog kompozita. Integritet i vek konstrukcija. 2002; 1-2: 11-14. http://divk.inovacionicentar.rs/ivk/pdf/IVK1-2-2002-3.pdf
[11] Sakthive A, Palaninathan R, Velmurugan R, Rao PR. Production and mechanical properties of SiCp particle-reinforced 2618 aluminum alloy composites. J Mater Sci. 2008; 43: 7047-7056. http://dx.doi.org/10.1007/s10853-008-3033-z
[12] Bayraktar E, Masounave J, Caplain R, Bathias C. Manufacturing and damage mechanisms in metal matrix composites. Journal of Achievements in Materia and Manufacturing Engineering, 2008; 2(31): 294-300.
[13] Miracle DB. Metal matrix composites from science to technological significance. Compos. Sci. Technol. 2005; 65 (15-16): 2526-2540. https://doi.org/10.1016/j.compscitech.2005.05.027
[14] Zhou MY, Ren LB, Fan LL, Zhang YWX, Lu TH, Quan GF, Gupta M. Progress in research on hybrid metal matrix composites. J Alloy Compd. 2020; 838: 1-40. https://doi.org/10.1155/2020/3765791
[15] George B, Sankar A, Bibin KT. Fabrication and characterization of aluminium hybrid composite. International Journal of Engineering Sciences and Research Technology. 2018; 7(4): 437-446.
[16] Shinde S. Manufactoring of aluminium matrix composite using stir casting method. International Journal of Innovations in Engineering Research and Technology. 2015; 2(5): 1-6.
[17] Bharath V, Nagaralb M, V Auradib V, Kori S. Preparation of 6061Al-Al2O3 MMC’s by stir casting and evaluation of mechanical and wear properties. Procedia Materials Science. 2014; 6: 1658-1667. https://doi.org/10.1016/j.mspro.2014.07.151
[18] Alaneme KK, Bodunrin MO, Awe AA. Microstructure, mechanical and fracture properties of groundnut shell ash and silicon carbide dispersion strengthened aluminium matrix composites. Journal of King Saud University – Engineering Sciences. 2018; 30(1): 96–103. https://doi.org/10.1016/j.jksues.2016.01.001
[19] Prabhu SR, Shettigar AK, Herbert MA, Rao SS. Microstructure and mechanical properties of rutile-reinforced AA6061 matrix composites produced via stir casting process. Trans. Nonferrous Met. Soc. China. 2019; 29: 2229−2236. https://doi.org/10.1016/S1003-6326(19)65152-6

J. LJ. PETROVIĆ et al.: TVRDOĆA KOMPOZITA SA ALUMINIJUMSKOM MATRICOM Hem. Ind. 75 (4) 195-204 (2021)
203
[20] Sajjadi SA, Ezatpour HR, Beygi H. Microstructure and mechanical properties of Al–Al2O3 micro and nano composites fabricated by stir casting. Mater Sci Eng A. 2011; 528: 8765-8771. https://doi.org/10.1016/j.msea.2011.08.052
[21] Baradeswaran A, Perumal AE. Study on mechanical and wear properties of Al7075/Al2O3/graphite hybrid composites. Composites: Part B. 2014; 56 : 464–471.
[22] Montgomery DC. Response Surface Methods and Other Approaches to Process Optimization. In: Montgomery DC, Design and Analysis of Experiments. 1st ed., New York, NY: John Wiley & Sons; 1997 ISBN 978-1118-14692-7.
[23] Khuri AI, Cornell JA. Response Surfaces: Designs and Analyses. 2nd ed., USA: CRC Press; 2019 ISBN 9780367401252.
[24] Deshmanya IB, Purohit GK. Development of mathematical model to predict micro-hardness of Al7075/Al2O3 composites produced by stir-casting. Journal of Engineering Science and Technology Review, 2012; 5(1): 44-50.
[25] Huda D, Baradie MA, Hasmi MSJ. Development of hardness model for MMCs (Al/A2O3). Journal Materials Processing Technology. 1994; 44: 81- 90. https://doi.org/10.1016/0924-0136(94)90040-X
[26] Anilkumar HC, Hebbar HS, Ravishankar KS. Mechanical properties of fly ash reinforced aluminium alloy (Al6061) composites. International Journal of Mechanical and Mechatronics Engineering. 2011; 6: 41–45.
[27] Kok M. Production and mechanical properties of Al2O3 particle-reinforced 2024 aluminium alloy composites. Journal of Materials Processing Technology. 2005; 161: 381–387.
[28] Kok M, Ozdin K. Wear resistance of aluminium alloy and its composites reinforced by Al2O3 particles. Journal of Materials Processing Technology. 2007; 183: 301–309. http://dx.doi.org/10.1016/j.jmatprotec.2006.10.021
[29] Mahdavi S, Akhlaghi F. Effect of the SiC particle size on the dry sliding wear behavior of SiC and SiC–Gr-reinforced Al6061 composites. J Mater Sci. 2011; 46: 7883–7894. https://doi.org/10.1007/s10853-011-5776-1
[30] Pantelić I. Uvod u reoriju inženjerskog eksperimenta. Novi Sad, Srbija: Radnički univerzitet „Radivoj Ćirpanov“; 1976.
[31] SPSS inc. PAWS Statistics 18, Predictive Analysis SoftwarePortfolio (www.spss.com).
[32] Ivanović A, Trumić B, Ivanov S, Marjanović S. Modelovanje uticaja temperatute i vremena homogenizacionog žarenja na tvrdoću PdNi5 legure. Hem. Ind. 2014; 68: 597–603. https://doi.org/10.2298/HEMIND130620085I
[33] Savić I, Nikolić G, Savić I, Cakić M, A. Dosić, Čanadi J. Modelovanje stabilnosti bioaktivnog bakar(II) kompleksa primenom eksperimentalnog dizajna, Hem. Ind. 2012; 66: 693–699. https://doi.org/10.2298/HEMIND120120021S
[34] Požega E, Ivanov S, Conić V, Čađenović B. Mogućnost procesa boriranja na presovanim uzorcima od železnog praha. Hem.Ind. 2009; 63: 253–258. https://doi.org/10.2298/HEMIND0903253P
[35] Ivanov S, Ivanić Lj, Gusković D, Mladenović S. Optimizacija režima starenja legura na aluminijumskoj osnovi. Hem. Ind. 2012; 66: 601–607.
[36] Ivanov S, Kočovski B, Stanojević B. Ocena uticaja termomehaničkih parametara prerade bakarne žice na izduženje spirale primenom faktornog eksperimenta. Metalurgija. 1996; 2: 13–23.
[37] Indumati D, Purohit G. Prediction of hardness of forged Al7075/Al2O3 composites using factorial design of experiments. International Journal of Engineering Research and Applications. 2012; 2: 84–90.
[38] BS EN 573-3: Aluminium and aluminium alloys. Chemical composition and form of wrought products. Chemical composition and form of products. 2019.
[39] Raymond HM, Douglas MC. Response Surface Methodology: Process and Product Optimization Using Designed Experiments. 4th ed., New York, NY: John Wiley & Sons; 2016 ISBN: 978-1-118-91601-8.
[40] Bas D, Boyaci IH. Modeling and optimization I: Usability of response surface methodology. J. Food Eng. 2007; 78: 836-845. https://doi.org/10.1016/j.jfoodeng.2005.11.024.
[41] Raghavendra N, Ramamurthy VS. Effect of particle size and weight fraction of alumina reinforcement on wear behavior of aluminum metal matrix composites. International Journal of Innovative Research in Science, Engineering and Technology. 2014; 4(3): 11191-11198.
[42] Mihajlović I, Nikolić Đ, Jovanović A. Teorija sistema. 1st ed., Bor, Srbija: Tehnički fakultet u Boru; 2009.
[43] Boopathi MM, Arulshri KP, Iyandurai N. Evaluation of mechanical properties of aluminium alloy 2024 reinforced with silicon carbide and fly ash hybrid metal matrix composites. American Journal of Applied Sciences. 2013; 10(3): 219-229. https://doi.org/10.3844/ajassp.2013.219.229
[44] Singh J, Suri N, Verma A. Affect of mechanical properties on groundnut shell ash reinforced Al 6063. International Journal for Technological Research in Engineering. 2015; 11(2): 2619-2623.
[45] Ashok N, Shanmughasundaram P. Effect of particles size on the mechanical properties of SiC-reinforced aluminium 8011 composites. Materials and Technology. 2017; 51(4): 667-672. https://doi.org/10.17222/mit.2016.252

Hem. Ind. 75 (4) 195-204 (2021) J. LJ. PETROVIĆ et al.: TVRDOĆA KOMPOZITA SA ALUMINIJUMSKOM MATRICOM
204
ABSTRACT
Correlation of hardness of aluminum composites obtained by stir casting technology and the size and weight fraction of reinforcing Al2O3 particles
Jasmina Lj. Petrović1, Srba A. Mladenović1, Aleksandra T. Ivanović2, Ivana I. Marković1 and Svetlana Lj. Ivanov1
1University of Belgrade, Technical Faculty in Bor, Bor, Serbia 2Mining and Metallurgical Institute Bor, Bor, Serbia
(Technical paper)
In this work, the stir casting method was applied to obtain composites based on the
alloy AN EW 6061 used as a metal base, and Al2O3 particles as a reinforcement.
Composites play a significant role as engineering materials. Therefore, it is
necessary to study, in detail, the production methods and the factors that affect
their mechanical properties. For this purpose, we have carried out a planned
experiment wi ASM International th the aim to use regression analysis to predict
the influence of particle size and mass fraction on hardness of the obtained
composites. The full factorial experimental design with two factors was used, which
was analyzed at three levels. Hardness was observed as a system response, while
particle size and mass fraction were set as influencing factors. Influencing factors
were observed at three levels: 50, 80 and 110 μm for the particle size and 2, 5 and
8 mass%. Measured hardness values of the composites ranged from 72 HV10 to 80
HV10. Based on the probability values (p<0.05), it was determined which factors are
important for the system response. Statistical analysis has shown that linear terms
of the influence factors (size and mass fraction of reinforcement particles) and the
square term of the mass fraction have statistical significance on the hardness
change. The square term of the particle size and the interaction term of the
influencing parameters do not have a statistically significant contribution in
predicting the hardness value. Thus, a second-order polynomial model was
obtained by the regression analysis. Influence of input factors on the system
response and the adequacy of the obtained mathematical model were determined
by using the Analysis of Variance (ANOVA). Based on the statistical data analysis, it
was established that, the particle mass fraction has a greater influence on hardness
of the obtained composite in relation to the particle size. By comparing the
experimental and predicted values, a high degree of agreement was achieved so
that the chosen model of the factorial experiment was adequate (R2=0.989). It can
be also concluded that the developed regression model can be applied to predict
hardness of the aluminum composite reinforced by Al2O3 particles in the chosen
variation interval of particle size and mass fraction.
Keywords: metal matrix; factorial experi-
ment; system response

205
Lithium carbonate sedimentation using flocculants with different ionic bases
Yam Morales1, Nelson Herrera1,2 and Kevin Pérez1,3,4
1Metallurgical and Mining Engineering Department, Universidad Católica del Norte, Antofagasta 1270709, Chile
2Oulu Mining School, University of Oulu, Oulu 90570, Finland 3Faculty of Engineering and Architecture, Universidad Arturo Prat, Almirante Juan José Latorre 2901, Antofagasta 1244260, Chile 4Department of Chemical Engineering and Mineral Processes, Faculty of Engineering, Universidad de Antofagasta, Antofagasta 1270300, Chile
Abstract
Lithium has become a metal of enormous interest worldwide. The extensive use of recharge-able batteries for a range of applications has pushed for rapid growth in demand for lithium carbonate. This compound is produced by crystallization, by reaction with lithium chloride (in solution) and by adding sodium carbonate. Low sedimentation rates in the evaporation pools present a problem in the crystallization process. For this reason, in this work, mineral sedimen-tation tests were carried out with the use of two flocculant types with different ionic charges. The tests were carried out at a laboratory level using different dosages for each flocculant and measurements were performed to obtain the increase in the content of solids in the sediment. The anionic flocculant had better performance as compared to that of the cationic flocculant, increasing the sedimentation rate of lithium carbonate by up to 6.5. However, similar solids contents were obtained with the use of the cationic flocculant at 3.5 times lower dosage making it the flocculant of choice regarding the economic point of view.
Keywords: Brine treatment; anionic flocculation; cationic flocculation; nonferrous metals; mining.
TECHNICAL PAPER
UDC: 661.834‑032.26:544.77.052.22
Hem. Ind. 75 (4) 205-212 (2021)
Available on-line at the Journal web address: http://www.ache.org.rs/HI/
1. INTRODUCTION
The mining industry in Chile is constantly growing [1–4] . Historically, Chile has traded copper, this commodity being
the main economic income contributing approximately 10 % of the gross domestic product (GDP) [5]. However, the
quantity of high-grade Cu minerals on the surface is decreasing [6]. Therefore, in recent years, considerable investments
have been made in utilization of other elements, lithium being the second most exploited commodity in the country [7].
Lithium is an electrochemically active metal and it has been recognized as one of the critical materials for the
advancement of modern life due to its superior properties compared to other materials, such as redox potential and
specific heat capacity [8]. This metal has a low atomic mass, low coefficient of thermal expansion, and high
electrochemical reactivity, which has made it a particularly attractive material for use in rechargeable batteries for
electronic devices, electric vehicles, and network storage systems [9,10].
The commercial value of lithium carbonate has increased over the years to reach US $ 13 per kg in 2017 [9]. In turn,
the production of LCE (Lithium Carbonate Equivalent) also increased, so that during 2016 approximately 200,000 tons
were produced, where Argentina is the largest producer (58.3% ) followed by Chile (38.9 %) [11]. It is precisely in South
America where the largest reserves are concentrated [12] (85 % of lithium reserves in brines) [13], accompanied also
with other elements such as potassium, sodium, boron, sulfate and chlorides [14].
Prices doubled between 2013 and 2017 and lithium demand is expected to triple by 2025, with the World Bank
estimating a 965 % increase in demand by 2050 [15]. By 2025, the investment banking group UBS forecasts that batteries
Corresponding author: Kevin Pérez, Metallurgical and Mining Engineering Department, Universidad Católica del Norte, Antofagasta 1270709, Chile; Tel: +56957694202
E-mail [email protected]
Paper received: 28 November 2020; Paper accepted: 03 July 2021; Paper published: 08 August, 2021
https://doi.org/10.2298/HEMIND201128020M

Hem. Ind. 75 (4) 205-212 (2021) Y. MORALES et al.: LITHIUM CARBONATE SEDIMENTATION
206
will account for at least 80 % of the total lithium demand in the application industries [15]. Chilean lithium production
comes from companies located in the Salar de Atacama (SQM and Albemarle).
Given the low concentration of this metal in nature reserves and other difficulties in its extraction from hard rocks,
many industrially advanced countries have struggled to ensure an uninterrupted supply of lithium to meet their
manufacturing demands. This fact has a significant impact on the price of lithium in the international market. For
example, in 2017 in China, there was an increase in the price of lithium carbonate to US$ 6,400-12,000 per ton from US
$ 2,000 per ton in 2005 [16]. Therefore, innovative processes to increase lithium production must be developed and
evaluated to meet future demands.
Lithium is present in a wide range of minerals (spodumene, lepidolite, petalite, amblygonite, and eucriptite). At the
same time, lithium is found in natural brines, brines associated with oil wells and geothermal fields. It is also present in
various clays (hectorite being the most important) and even in seawater [17]. Although the sources of lithium can be
diverse, at present only two production processes are economically feasible: using brines and minerals, with brine being
mostly used [18], due to lower manufacturing costs in comparison with the costs of extraction and processing of lithium
minerals [19].
The composition of commercial brines from which lithium is recovered varies considerably from brines with low
lithium contents (0.02 %) to some with higher contents (close to 0.4 %), with the presence of other elements and salts
such as potassium, sodium, calcium, magnesium, iron, boron, bromine, chlorine, nitrates, chlorides, sulfates and
carbonates, which imposes a requirement that each brine is treated in a particular way, according to its composition.
The production of lithium carbonate from brines is carried out by precipitation [20]. This lithium compound is the
most important compound commercially produced and represented 60 % of the market share of commercial products
based on lithium in 2017 [21]. Lithium carbonate precipitation using sodium carbonate (Na2CO3) has been commonly
used in industry as well as in research as the final step to produce crystals in a hydrometallurgical process [21].
After extraction of the brine (Sª) from a salt flat, it is pumped into huge pools for concentration of lithium, resulting
in a decrease in the lithium content from an average value of 600 mg dm-3 in the Puna salt flats, to about 5,000 to
10,000 mg dm-3. As a consequence of water evaporation, significant amounts of NaCl crystallize in the pools,
accompanied with crystallization of KCl and, depending on the brine composition, other salts, such as CaSO4 [22].
Prior to lithium precipitation, it is necessary to reduce calcium and magnesium contents, which is achieved by
chemical precipitation (equations 1 and 2), with the use of calcium hydroxide (Ca(OH)2), sodium carbonate (Na2CO3) or
sodium sulfate (Na2SO4). In the case of boron, its removal is achieved by solvent extraction and/or ion exchange [22].
Ca(OH)2 + Mg2+ → Mg(OH)2 + Ca2+ (1)
Na2(SO)4 + Ca2+ → Ca(SO)4 + 2Na+ (2)
The lithium carbonate precipitation stage is carried out at a high temperature (90 ºC), by adding sodium carbonate
to the concentrated and purified brine [22] as:
Na2(CO)3 + 2Li+ → Li2(CO)3 + 2Na+ (3)
Once the carbonate is obtained, particle sedimentation begins at rather low rates, which motivated this
investigation. In order to reduce the sedimentation time, it is necessary to add certain reagents that help formation of
flocs or particle binding, thus increasing the particle weight and, consequently, the sedimentation rate [23]. In the
present work, we present the importance of the use of flocculants to increase production of lithium carbonate, by
reducing the sedimentation time.
Flocculation of colloidal particles is typically performed by using high molecular weight polyacrylamides, which can
be different with respect to the electrical charge (cationic, anionic, or non-ionic), depending on the use required. Typical
chemical structures of anionic, neutral, and cationic polyacrylamides used as flocculants.
2. MATERIALS AND METHODS
2.1. Lithium carbonate sample
Lithium carbonate was acquired from Merck (N” CAS 554-13-2; Chile), having a density of 2.11 g cm-3. To reproduce
a brine, lithium carbonate was mixed with water up to a 7.5 wt.% solid content.

Y. MORALES et al.: LITHIUM CARBONATE SEDIMENTATION Hem. Ind. 75 (4) 205-212 (2021)
207
2.2. Flocculant preparation
As a cationic flocculant interfloc 5002 was used while SNF 60420 was used as the anionic flocculant. Small flocculant
crystals were dissolved in distilled water at the concentration of 1g dm-3 while stirring on a magnetic stirrer for 5 h due
to the high density of the reagent to obtain a homogeneous solution (without lumps).
2.3. Sedimentation tests
In the present work, the flocculant amounts for the sedimentation tests were 5, 15, 30, 50, 75, 100, 125, 150, 175, 200
and 275 g t-1 for each flocculant type. The chosen dosages are the typical values used in non-metallic mining industry.
Sedimentation tests, performed in duplicates, were conducted by pouring 270 cm3 of the homogeneous pulp into a
cylinder and performing interface height measurements every 20 min (due to the low sedimentation rate of lithium
carbonate) at the lowest point of clear liquid. The test tubes were previously graduated at the mm precision.
For pulp characterization, the mineralogical and chemical features can be reflected in the content of solids [24]. The
relative proportion in which the mineral and water are found is represented by the solid content (Cp), which corresponds
to the content ratio of the mineral weight to the pulp weight (eq. 7). For this calculation, from the data obtained in the
laboratory, the solid content by volume (Cv) is obtained by using eq. (6) and the volume of the thickened pulp (eq. 5)
from the conditions in the developed test. The content of solid is determined at the moment at which the height of the
interface stops changing, that is, it does not decrease further.
The volume of ore is calculated as:
m
s
mV
= (4)
The volume of the thickened pulp is calculated as:
Thikened volume = r2 hn (5)
The solid content by volume is calculated as:
sv
p
100V
CV
= (6)
The solid content by weight is calculated:
l s
vp
v v
100(1 )
sCCC C
=
− + (7)
Vm - Mineral volume Cv - Solid content by volume m - Mineral mass
Vp - Pulp volume s - Mineral density Vs - Solid volume r - Specimen inner radius Cp - Solid content by weight hn - Height at each measurement
2. 4. Sedimentation rate
Once the tests in duplicates have been completed, the average height values at each measured time were graphically
presented (Figure 1.) and the sedimentation rate is obtained by using the Coe and Clevenger method as the slope of the
initial tangent line. In the present investigation first three points were used for construction of the tangent, with the
aim to minimize error.
Figure 1. Determination of the sedimentation rate as a slope of the tangent (tg) at initial values of the thickened pulp height vs. time

Hem. Ind. 75 (4) 205-212 (2021) Y. MORALES et al.: LITHIUM CARBONATE SEDIMENTATION
208
3. RESULTS AND DISCUSSION
Table 1. presents the content of lithium carbonate in the sediment after 460 min based on utilization of both
flocculant types (anionic and cationic).
Table 1. Content of solids in the sediment obtained in flocculation tests after 460 min.
Dosage, g t-1 Cationic flocculant Anionic flocculant
Content of solids, wt.% Standard deviation, % Content of solids, wt.% Standard deviation, %
0 11.17 1.07 11.17 1.07
5 15.96 2.90 14.88 2.36
15 16.08 2.58 15.29 2.47
30 16.44 2.91 15.51 2.62
50 17.21 2.86 16.20 2.23
75 16.95 2.76 16.44 2.65
100 16.69 2.55 16.20 2.11
125 16.56 2.51 15.62 2.42
150 16.69 2.48 15.51 2.06
175 15.40 2.04 18.68 2.38
200 15.73 2.29 17.77 3.01
275 15.19 1.90 15.40 2.52
The highest solid concentrations in the sediments were ~17 % for the cationic and ~19 % for the anionic flocculant. To
reach these concentrations, dosages of 50 and 175 g t-1 for the cationic and anionic flocculant, respectively, were used,
which indicates an exceptionally large difference between these two flocculant types. The cationic flocculant is used for
sedimentation of non-metallic and organic particles, whereas the anionic one is more used for metallic materials [25].
Accordingly, higher contents of solids were achieved for the cationic flocculant in most of the cases, but it should be
noted that above the dosage of 175 g t-1 the opposite is observed that is higher solid concentrations for the anionic
flocculant. The cause of this phenomenon is high adsorption of the flocculant on the particles, reducing the particle
surface area to interact with the polymer chain attached to another particle [26], which causes a large part of the solids
to remain in suspension.
Figure 2. presents the sediment height over time for the two tests producing the best results.
Figure 2: Interface height over time for the control sedimentation test (without flocculant) and the tests with the use of 50 g t-1 cationic flocculant and 175 g t-1 anionic flocculant

Y. MORALES et al.: LITHIUM CARBONATE SEDIMENTATION Hem. Ind. 75 (4) 205-212 (2021)
209
A noticeable difference is seen with regard to the final interface heights obtained in the sedimentation tests,
decreasing from 28.5 cm to 12 cm for the cationic flocculant and to 11 cm for the anionic flocculant. Thus, there is a
greater compaction of the sediment and consequently a higher content of solids is obtained, possibly due to lower
entrapment of water in the test with the anionic flocculant in the compaction zone.
Figure 3. and Figure 4. show the solids concentrations in the sediment zone over time for the cationic and anionic
flocculant, respectively, at the dosages studied. It can be seen that the increase in the solids content is not very large (it
increases from 7.5 % to approximately 18 %), possibly due to the inverse solubility of lithium carbonate [27]. In specific,
at low temperatures, sedimentation is minor because part of the lithium carbonate is dissolved in the solution, thus
reducing the number of particles.
Figure 3: Solids content over time at different dosages of the cationic flocculant
Figure 4. Solids content over time at different dosages of the anionic flocculant
It can be seen that, at high dosages, the solids content stagnates at around 17 % for both flocculant types. It is
possible that there is an increase in the viscosity of the sediment due to the large amount of flocculant [28] causing
trapping of water and decreasing the content of solids.

Hem. Ind. 75 (4) 205-212 (2021) Y. MORALES et al.: LITHIUM CARBONATE SEDIMENTATION
210
It can be seen that even at low dosages of the cationic flocculant except at 5 g t-1, the content of solids exceeds 12 %
at the time of 160 min (Figure 3.), whereas for the anionic flocculant (Figure 4.) this result occurs at 220 min, which
indicates that the sedimentation rate at low dosages is higher for the cationic flocculant as compared to that for the
anionic flocculant. It can be also observed that at the initial times and at high flocculant dosages the solids content
increases faster for the anionic flocculant. This is possibly due for to the action mechanisms of each type of the flocculant
as mentioned by Concha [29] and Diaz [25]. In the case of the anionic flocculant, covalent bonds and/or hydrogen
bridges are formed between the particles and these flocculants are mainly used for concentrates and tailings of copper,
lead, zinc, etc. On the other hand, cationic flocculants act in a very similar way as coagulants, which predominantly
comprises neutralization of particle surface charges, rather than formation of bridges [30].
The thickening process provides concentration of a dilute pulp into a thickened pulp as solid particles settle under
the influence of the force of gravity. In the sedimentation tests, the addition of flocculants directly affects the suspension
properties, which can be identified by means of the sedimentation rate. Measurement proceeds from the time zero
that represents the pulp sample after complete mixing and the beginning of the test until the pulp reaches the maximum
compression point (critical point), at which the interface of the water-suspension meets with the interface of the
sediment-suspension at a critical height so that the sedimentation ends. The sedimentation rates obtained from Figure
2. and initial tangent slopes are presented in Table 2.
Table 2. Sedimentation rates for the tests in which the highest solid content was achieved
Test Rate, cm min-1 σ, cm min-1
No flocculant 0.040 0.964
Cationic Flocculant (50 g t-1) 0.143 0.991
Anionic flocculant (175 g t-1) 0.250 0.978
The sedimentation rate increased 3.5- fold with the flocculant addition to the pulp for the cationic flocculant at a
dosage of 50 g t-1, and 6.5-fold for the anionic flocculant at 175 g t-1. The obtained results may be since the cationic
flocculant destabilizes the charge of colloidal particles present in the pulp causing particle coagulation and consequently
better agglomeration, while another possible cause is that the bonds formed by the anionic flocculant are not strong
enough to allow preservation of the flocs over time.
The flocculant dosage difference for the tests resulting the highest solids contents is very high (125 g t-1 difference),
which could be a determining point in the choice of the reagent, since the expenses that could be caused by the use of
the anionic flocculant could be very high as compared to the those of the cationic flocculant.
4. CONCLUSIONS
Sedimentation of lithium carbonate was studied with the use of two flocculant types. For the maximum time studied
(460 min), the highest obtained of solids was 19 % at the use of the anionic flocculant (175 g t-1) and 17 % for the
cationic flocculant (50 g t-1). Therefore, it could be concluded that the best results are obtained with use of the cationic
flocculant, because similar contents of final solids are obtained for the two flocculants but at hugely different dosages.
When working at 25 °C, the highest increase in the content of solids was 11 %, obtained with the anionic flocculant
(175 g t-1). Also, the sedimentation rate for this flocculant was higher than that for the cationic flocculant (0.250 and
0.143 mm min-1, respectively), with the disadvantage that the flocculant amount is 3.5-fold higher. From the economic
point of view, it is more convenient to use the flocculant with a positive ionic base since it achieves results remarkably
similar to the anionic one, but at a noticeably lower dosage.
Overall, it is shown that the use of flocculants is a great alternative to accelerate the processes of obtaining lithium
carbonate by thickening in ponds. Still, it is necessary to investigate the behavior of other chemical compounds present
in brines during this process.
Acknowledgements: Kevin Pérez acknowledge the infrastructure and support of Doctorado en Ingeniería de Procesos
de Minerales of the Universidad de Antofagasta

Y. MORALES et al.: LITHIUM CARBONATE SEDIMENTATION Hem. Ind. 75 (4) 205-212 (2021)
211
REFERENCES
[1] Saldaña M, Ayala L, Torres D, Toro N. Global sensitivity analyses of a neural networks model for a flotation circuit. Hemijska
Industrija. 2020;74(4):247-256 https://doi.org/10.2298/HEMIND20060523S
[2] Toro N, Briceño W, Pérez K, Cánovas M, Trigueros E, Sepúlveda R, Hernández P. Leaching of Pure Chalcocite in a Chloride
Media Using Sea Water and Waste Water. Metals. 2019;9(7):780 https://doi.org/10.3390/met9070780
[3] Toro N, Pérez K, Saldaña M, Jeldres RI, Jeldres M, Cánovas M. Dissolution of pure chalcopyrite with manganese nodules and
waste water. Journal of Materials Research and Technology. 2019 https://doi.org/10.1016/j.jmrt.2019.11.020
[4] Torres D, Pérez K, Trigueros E, Jeldres R, Salinas-Rodríguez E, Robles P, Toro N. Reducing-effect of chloride for the dissolution
of black copper. Metals (Basel). 2020;10(1) https://doi.org/10.3390/met10010123
[5] Pérez K, Toro N, Campos E, González J, Jeldres R, Nazer A, Rodriguez MH. Extraction of Mn from Black Copper Using Iron
Oxides from Tailings and Fe2+ as Reducing Agents in Acid Medium. Metals (Basel). 2019;9:1112
https://doi.org/10.3390/met9101112
[6] Toro N, Robles P, Jeldres R. Seabed mineral resources, an alternative for the future of renewable energy: A critical review. Ore
Geology Reviews. August 2020:103699 https://doi.org/10.1016/j.oregeorev.2020.103699
[7] Toro N, Jeldres R, Órdenes J, Robles P, Navarra A. Manganese Nodules in Chile , an Alternative for the Production of Co and
Mn in the Future — A Review. Minerals. 2020;10(674):1-19 https://doi.org/10.3390/min10080674
[8] Heelan J, Gratz E, Zheng Z, Wang Q, Chen M, Apelian D, Wang Y. Current and Prospective Li-Ion Battery Recycling and
Recovery Processes. Jom. 2016;68(10):2632-2638 http://doi.org/10.1007/s11837-016-1994-y
[9] Maxwell P, Mora M. Lithium and Chile: looking back and looking forward. Mineral Economics. 2020;33(1-2):57-71
https://doi.org/10.1007/s13563-019-00181-8
[10] Pinna EG, Drajlin DS, Toro N, Rodriguez MH. Kinetic modeling of the leaching of LiCoO2 with phosphoric acid. Journal of
Materials Research and Technology. 2020;9(6):14017-14028 https://doi.org/10.1016/j.jmrt.2020.09.109
[11] Donoso, F; Garay, V; Cantallopts J. International Lithium Market and Its Potential in Chile. Chile; 2017.
[12] Gruber PW, Medina PA, Keoleian GA, Kesler SE, Everson MP, Wallington TJ. Global lithium availability: A constraint for electric
vehicles? Journal of Industrial Ecology. 2011;15(5):760-775 https://doi.org/10.1111/j.1530-9290.2011.00359.x
[13] U.S. Geological Survey. Mineral Commodity Summaries 2020.; 2020.
[14] Velásquez C, Cabrera V. Small-scale lithium production from brines. In: Lima, Perú; 2018:19-21.
[15] Lunde Seefeldt J. Lessons from the Lithium Triangle: Considering Policy Explanations for the Variation in Lithium Industry
Development in the “Lithium Triangle” Countries of Chile, Argentina, and Bolivia. Politics and Policy. 2020;48(4):727-765.
[16] Chen QB, Ji ZY, Liu J, Zhao YY, Wang SZ, Yuan JS. Development of recovering lithium from brines by selective-electrodialysis:
Effect of coexisting cations on the migration of lithium. Journal of Membrane Science. 2018;548(8):408-420
https://doi.org/10.1016/j.memsci.2017.11.040
[17] Miranda C. Background for a Public Policy in Strategic Minerals: Lithium. Chile; 2009.
[18] Boryta, Kullberg T. Production of lithium compounds directly from lithium containing brines, in: Google Patents. 2007;2(12).
[19] Jandová J, Dvořák P, Vu HN. Processing of zinnwaldite waste to obtain Li2CO3. Hydrometallurgy. 2010;103(1-4):12-18
https://doi.org/10.1016/j.hydromet.2010.02.010
[20] Taborga P, Brito I, Graber TA. Effect of additives on size and shape of lithium carbonate crystals. Journal of Crystal Growth.
2017;460(November 2016):5-12 https://doi.org/10.1016/j.jcrysgro.2016.12.001
[21] Han B, Anwar UI Haq R, Louhi-Kultanen M. Lithium carbonate precipitation by homogeneous and heterogeneous reactive
crystallization. Hydrometallurgy. 2020;195(October 2019):105386 https://doi.org/10.1016/j.hydromet.2020.105386
[22] Riveros Zapata A, Ale Ruiz L, Lezama J, Erdmann E. Lithium carbonate production: Simulation using aspen plus. Salta,
Argentina; 2018.
[23] Schoenmann, Hales, Bedell D. Strategies for instru-mentation and control of thickeners and other solid–liquid separation
circuits. Mineral Processing Plant Design, Practice, and Control. 2002;2:2164-2173.
[24] Teerikoski S. Optimal Control of Clarifier-Thickeners. Uppsala, Sweden; 2017 http://uu.diva-
portal.org/smash/get/diva2:1088256/FULLTEXT01.pdf
[25] Díaz J. Coagulants - organic and inorganic flocculants made from plants and scrap metal recycling, for the treatment of
polluted water. McKinsey Quarterly. 2014;2(1):1-22.
[26] Elhaei R, Kharrat R, Madani M. Stability, flocculation, and rheological behavior of silica suspension-augmented polyacrylamide
and the possibility to improve polymer flooding functionality. Journal of Molecular Liquids. 2021;322:114572
https://doi.org/10.1016/j.molliq.2020.114572
[27] Wilkomirsky I. Extraction and refining of non-ferrous metals: Lithium; Metallurgical engineering department, Universidad de
Concepción, Concepción, Chile 2008:1-25.

Hem. Ind. 75 (4) 205-212 (2021) Y. MORALES et al.: LITHIUM CARBONATE SEDIMENTATION
212
[28] Salam AM, Örmeci B, Simms PH. Determination of optimum polymer dosage for dewatering of oil sands tailings using torque
rheology. Journal of Petroleum Science and Engineering. 2021;197 (August 2020)
https://doi.org/10.1016/j.petrol.2020.107986
[29] Concha F. Filtration and separation manual; Metallurgical engineering department, Universidad de Concepción, Concepción,
Chile 2001;(January 2001):234-308.
SAŽETAK
Taloženje litijum karbonata korišćenjem flokulanata sa različitim jonskim bazama
Yam Morales1, Nelson Herrera1,2 i Kevin Pérez1,3,4
1Metallurgical and Mining Engineering Department, Universidad Católica del Norte, Antofagasta 1270709, Chile
2Oulu Mining School, University of Oulu, Oulu 90570, Finland 3Faculty of Engineering and Architecture, Universidad Arturo Prat, Almirante Juan José Latorre 2901, Antofagasta 1244260, Chile 4Department of Chemical Engineering and Mineral Processes, Faculty of Engineering, Universidad de Antofagasta, Antofagasta 1270300, Chile
(Stručni rad)
Litijum je postao metal od ogromnog interesa u celom svetu. Široka upotreba
punjivih baterija za čitav niz primena podstakla je brzi rast potražnje za litijum
karbonatom. Ovo jedinjenje se dobija kristalizacijom, reakcijom sa litijum hloridom
(u rastvoru) uz dodavanjem natrijum karbonata. Niske stope taloženja u bazenima
za isparavanje predstavljaju problem u procesu kristalizacije. Iz tog razloga, u ovom
radu su izvršena ispitivanja sedimentacije minerala upotrebom dva tipa flokulanta
sa različitim jonskim naelektrisanjem. Ispitivanja su izvedena na laboratorijskom
nivou koristeći različite doze za svaki flokulant, a cilj istraživawa je bio postizanje
povećanja asadržaja čvrstih materija u sedimentu. Anjonski flokulant je imao bolje
performanse u poređenju sa kationnim flokulantom, povećavajući brzinu taloženja
litijum karbonata do 6,5 puta. Međutim, slični sadržaji čvrstih materija dobijeni su
upotrebom katjonskog flokulanta u dozi nižoj 3,5 puta, što ga čini flokulantom izbora
sa ekonomskog stanovišta.
Ključne reči: tretman rastvora; anjonska
flokulacija; katjonska flokulacija; obojeni
metali; rudarstvo.

213
Ispitivanje uticaja mehaničke aktivacije smeše MgO-TiO2 na sintezu magnezijum- titanata
Nataša G. Đorđević1, Milica M. Vlahović2, Sanja P. Martinović2, Slavica R. Mihajlović1, Nenad M. Vušović3 i
Miroslav D. Sokić1
1Institut za tehnologiju nuklearnih i drugih mineralnih sirovina, Franše d’Eperea 86 Beograd, Srbija 2Univerzitet u Beogradu, Institut za hemiju, tehnologiju i metalurgiju, Njegoševa 12, Karnegijeva 4, Beograd, Srbija 3Univerzitet u Beogradu, Tehnički fakultet u Boru, Vojske Jugoslavije 12, Bor, Srbija
Izvod
U ovom istraživanju izvršena je mehanička aktivacija smeše magnezijum oksida i titanijum dioksida u cilju ispitivanja mogućnosti mehanohemijske sinteze magnezijum titanata. Mehanička aktivacija (MA) je vršena tokom 1000 min u visokoenergetskom vibro mlinu sa torzionim oprugama i prstenastim radnim elementima. Nakon ovog vremena, analiza strukture difrakcijom X-zraka je ukazala na potpunu amorfizaciju smeše polaznih komponenti. U skladu sa uputstvom za upotrebu vibro mlina u smislu vremenskog ograničenja kontinualnog rada, eksperiment je prekinut nakon 1000 minuta aktivnog mlevenja. Nemogućnost sinteze magnezijum titanata objašnjava se suviše niskom negativnom vrednošću Gibsove energije od -25,8 kJ mol-1 (i pored teorijske mogućnosti da se reakcija odigra), kao i količinom energije unete u sistem tokom mehaničke aktivacije koja se pokazala nedovoljnom za dobijanje željenog proizvoda. Iako sinteza magnezijum titanata nije ostvarena, dobijeni su značajni rezultati koji identifikuju metode za dalje ispitivanje mogućnosti odvijanja mehanohemijskih reakcija zemnoalkalnih metala i titanijum dioksida.
Ključne reči: visokoenergetski vibro mlin; magnezijum titanat; amorfizacija; analiza difrakcijom X-zraka.
STRUČNI RAD
UDK 666.962:542.057:542.22:
546.824
Hem. Ind. 75 (4) 213-225 (2021)
Dostupno na web stranici časopisa: https://www.ache-pub.org.rs/index.php/HemInd/article/view/773
1. UVOD
U oblasti ispitivanja mogućnosti dobijanja titanata zemnoalkalnih metala, postupak sinteze mehanohemijskim
postupkom zauzima značajno mesto. Dobijanje kalcijum titanata je vršeno različitim metodama. Proučavani su
nanoprahovi kalcijum-titanata (CaTiO3) dobijeni mehanohemijskom metodom uz pomoć mikrotalasnog zračenja
kalcijum-oksida i titan-dioksida, kao i njegove suspenzije uz dodatak akril-polietilen glikola [1]. Kalcijum titanat (CaTiO3)
sintetizovan je sagorevanjem izvora kalcijuma, ljuske jajeta patke, titanijum dioksida (A-TiO2) i magnezijuma (Mg) [2]. U
nekim radovima vreme mlevenja polaznih komponenti je iznosilo 10 do 50 h [3]. U radu Manafija i saradnika [4] metoda
mehaničkog legiranja primenjena je za dobijanje kalcijum-titanata bez toplotne obrade. Praćena je mehanohemijska
sinteza CaTiO3 iz CaO–TiO2 polazne smeše [5], ispitivanje mogućnosti mehanohemijske sinteze CaTiO3 od različitih po-
laznih komponenata [6]. Doprinos ispitivanju mogućnosti dobijanja kalcijum titanata dali su i mnogi drugi autori [7-10].
Dobijanje barijum bizmut titanata mehanohemijskim postupkom je takođe detaljno proučavano [11]. Takođe su
proučavani i kinetika dobijanja barijum titanata [12], uticaj grupisanja kristala na dobijanje tetragonalno-kubne
transformacije čestica BaTiO3 [13], izotermalno sinterovanje barijum cink titanata [14], kao i elektična svojstva barijum
titanata [15]. Sprovedena su i mnoga druga istraživanja koja se odnose na ovu tematiku, i to ispitivanje dielektričnih
svojstava barijum titanata sinterovanog iz tribofizički aktiviranih prahova i praćenje mehanizama sinterovanja [16-18],
ispitivanje evaluacije strukture dobijene intenzivnim mlevenjem sistema 2Bi2O3 i 3TiO2 [19]. Proučavani su materijali
dobijeni mehanohemijskim postupkom kao i veličine kristala i njihova piezoelektrična svojstva u funkciji od gustine
dobijenog materijala [20-26]. Dobijanje SrTiO3 i Sr2TiO4 u čvrstom stanju iz sistema SrCO3–TiO2 je prikazano u radu [27],
Autor za prepisku: Nataša Đorđević, Institut za tehnologiju nuklearnih i drugih mineralnih sirovina, Franše d’Eperea 86, Beograd
E-mail: [email protected]
Članak primljen: 2. aprila 2021; Članak prihvačen: 9. avgusta 2021; Članak publikovan: 22. avgusta 2021.
https://doi.org/10.2298/HEMIND210402022D

Hem. Ind. 75 (4) 213-225 (2021) N. G. ĐORĐEVIĆ et al.: UTICAJA AKTIVACIJE MgO-TiO2 NA SINTEZU MAGNEZIJUM- TITANATA
214
sinteza SrTiO3−xFx sa fotokatalitičkim svojstvima [28], mehanohemijska sinteza i fotokatalitički efekat SrTiO3 sa azotom
kao aditivom [29-31].
U toku mehaničke aktivacije čvrstih materijala dolazi do transformacije i akumulacije saopštene mehaničke energije
u obliku defekata kristalne rešetke što dovodi do porasta entalpije i entropije tretiranog sistema [32,33]. Prema svojim
termodinamičkim karakteristikama, reakcije čija je promena Gibsove energije ΔG < 0 imaju potencijal da se odigraju
spontano ili uz početni dodatak energije u cilju premošćavanja energetske barijere [34]. Od svih zemnoalkalnih metala,
magnezijum oksid ima najmanji potencijal za reakciju u čvrstoj fazi. Mehaničko aktiviranje polaznih komponenti u cilju
dobijanja magnezijum titanata ispitivali su mnogi autori [35-41].
Očekivani ishod svih pretpostavljenih mehanohemijskih reakcija neutralizacije između oksida zemnoalkalnih metala
i titanijum dioksida je sinteza odgovarajućih titanata. Poređenje rezultata sinteza postignutih mehanohemijskim
postupkom i ustanovljene razlike mogu se pripisati međusobnim razlikama između tih metala. Kako pripadaju istoj grupi
elemenata, međusobne elementarne razlike na nivou strukture osnovne čestice – atoma zemnoalkalnih metala utiču i
na razlike između njihovih jedinjenja, kao i ponašanje tih jedinjenja u hemijskim reakcijama neutralizacije. U tom smislu,
korisno je prikazati relevantne podatke koji opisuju ove razlike. Za hemijske reakcije između oksida zemnoalkalnih
metala i titanijum dioksida u Tabeli 1 su dati osnovni hemijsko – termodinamički podaci kao i odgovarajuće konstante
ravnoteže na temperaturi od 20 oC. Tabela 1. Termodinamički podaci za hemijske reakcije zemnoalkalnih metala i titanijum dioksida na temperaturi od 20 oC (ΔH˚r–entalpija reakcije, ΔS˚r – promena entropije reakcije, ΔG˚r – promena Gibsove slobodne energije reakcije; Kr – konstanta ravnoteže reakcije) [42]
Table 1. Thermodynamic parameters of chemical reactions between alkaline earth metals and titanium dioxide at 20 oC (ΔH˚r– enthalpy of reaction, ΔS˚r– entropy change, ΔG˚r– Gibbs free energy of reaction; Kr– equilibrium constant) [42]
Reakcija T / K ΔH˚r / kJ mol-1 ΔS˚r / J mol-1 ΔG˚r / kJ mol-1 K / dm3 mol-1
BaO + TiO2 = BaTiO3 293 -161,5 -12,69 -157,8 1,31x1028
SrO + TiO2 = SrTiO3 293 -135,6 3,02 -136,5 2,10x1024
CaO + TiO2 = CaTiO3 293 -80,7 5,28 -82,3 4,64x10¹⁴
MgO + TiO2 = MgTiO3 293 -26,6 -2,64 -25,8 3,94x10⁴
Na osnovu prikazanih termodinamičkih parametara, može se očekivati da će se sinteza magnezijum titanata, u
poređenju sa titanatima ostalih zemnoalkalnih metala, najteže odigrati iako postoji potencijal za spontano dobijanje
svih pomenutih titanata bez obzira na tehniku koja se primeni.
Cilj istraživanja prikazanih u ovom radu bio je pokušaj sinteze magnezijum titanata mahaničkom aktivacijom
stehiometrijske smeše magnezijum oksida i titanijum dioksida korišćenjem raspoložive opreme, visokoenergetskog
vibro mlina sa torzionim oprugama i prstenastim radnim elementima. Ideja je bila da se kinetika reakcije prati na osnovu
rendgenostrukturne analize i hemijske analize koja bi služila za određivanje stepena sinteze.
2. EKSPERIMENTALNI DEO
Za eksperimentalna ispitivanja u ovom radu upotrebljen je magnezijum oksid, MgO, kao bazni reaktant i titanijum
dioksid, TiO2, kao kiseli reaktant. Korišćeni magnezijum oksid je proizvodnje MERCK (Nemačka), CAS No. [1309-48-4],
kvaliteta pro analysi, a titanijum dioksid takođe proizvodnje MERCK (Nemačka), CAS No. [13463-67-7], kvaliteta pro analysi.
U cilju odvijanja mehanohemijske reakcije neutralizacije, izvršena je mehanička aktivacija sistema MgO-TiO2.
Jednačina (1) prikazuje hemijsku reakciju koja bi mogla da se odigra u mehanohemijskom reaktoru tokom mehaničke
aktivacije polaznih komponenti, dajući magnezijum titanat kao krajnji produkt
MgO(s) + TiO2(s) → MgO-TiO2 → MgTiO3(s) (1) (MgO-TiO2 Intermedijarno jedinjenje)
Mehanička aktivacija obavljena je u trajanju od 1000 min u visokoenergetskom vibro mlinu, tip MH954/3 (proizvođač
KHD Humboldt Wedag A.G., Nemačka), Slika 1.
Mlin je snabdeven ležištem sa horizontalno postavljenim zatvaračem. Cilindrična radna posuda od nerđajućeg čelika,
dubine 40 mm i unutrašnjeg prečnika 170 mm poseduje radne elemente u vidu dva slobodna koncentrična prstena,

N. G. ĐORĐEVIĆ ET AL.: UTICAJA AKTIVACIJE MGO-TIO2 NA SINTEZU MAGNEZIJUM- TITANATA Hem. Ind. 75 (4) 213-225 (2021)
215
takođe od nerđajućeg čelika i ukupne mase 3 kg. Ovi prstenovi prenose energiju udarom i trenjem na materijal koji se
tretira. Ispod tela mlina je pogonski mehanizam sa elastičnim vratilom, ekscentričnim zamajcem i torzionim oprugama,
koji stvara rezonantne vibracije radne posude. Radni elementi, čija je masa neuporedivo veća od mase uzorka, vrše
usitnjavanje i mehaničku aktivaciju materijala zahvaljujući vibracijama. Snaga motora je 0,8 kW. Optimalna količina
praha koji se mehanički aktivira je 50-150 g.
Slika 1. Visokoenergetski vibro mlin MH954/3 (KHD Humboldt Wedag A.G., Nemačka)
Figure 1. High-energy vibration mill, type MH954/3 (KHD Humboldt Wedag A.G., Germany)
Imajući u vidu optimalnu količinu reaktanata koji mogu da se aktiviraju, kao i njihov stehiometrijski odnos prema
pretpostavljenoj hemijskoj reakciji prikazanoj jednačinom (1), početne količine su iznosile 20,2 g MgO (0,5 mol) i 39,9 g
TiO2 (0,5 mol), odnosno ukupno 60,1 g.
U toku mehaničke aktivacije periodično su uzimani uzorci (po 1 g, nakon 60, 180, 330 i 1000 min) iz reakcionog
sistema i vršena je njihova rendgenostrukturna analiza, kao i analiza trenutnog hemijskog sastava sistema. Hemijska
analiza reaktanata i uzoraka iz reakcionog sistema tokom mehaničke reakcije vršena je metodom atomske apsorpcione
spektrofotometrije na atomskom adsorpcionom spektrofotometru (AAS) Analyst 300 (proizvođač ”Perkin Elmer”- SAD)
pri čemu je kao rastvarač korišćen 10 % rastvor sirćetne kiseline (99,5 % glacijalna sirćetna kiselina, Zorka Pharma,
Hemija – DOO, Srbija).
Rendgenostrukturna analiza reaktanata i uzoraka iz reakcionog sistema tokom mehaničke aktivacije vršena je na
PHILIPS PW-1700 automatizovanom difraktometru (proizvođač ”Philips”, Holandija) sa bakarnom cevi koji radi na 40 kV
i 35 mA. Uređaj je snabdeven grafitnim monohromatorom i proporcionalnim brojačem, napunjenim ksenonom.
Korišćen je ugao snimanja (2 ) od 4 do 15°.
Na osnovu rezultata hemijske analize moguće je izračunati stepen reakcije sinteze prema jednačini (2):
( )Ti
0
0,251 100
c bcS
c w
−= −
(2)
gde je c sadržaj magnezijuma u rastvoru, c0 - odvaga uzorka, - cTi sadržaj titanijuma u rastvoru, w - maseni udeo magnezi-
juma u polaznom sistemu MgO-TiO2 koji iznosi wMg=0,2025, b - faktor ekvivalencije učešća magnezijuma u pretpos-
tavljenom intermedijarnom jedinjenju stehiometrijskog sastava MgTiO3 koji za sistem MgO-TiO2 iznosi bMg = 0,5062.
Mehanohemijska aktivacija je u okviru eksperimentalne procedure obavljena jedanput, dok su uzorci za hemijsku
analizu uzimana po 2 uzorka za analizu na atomskom adsorpcionom spektrofotometru (AAS) Analyst 300 (proizvođač
”Perkin Elmer”- SAD) pri čemu je kao rastvarač korišćen 10 % rastvor sirćetne kiseline (99,5 % glacijalna sirćetna kiselina,
Zorka Pharma, Hemija – DOO., Srbija).

Hem. Ind. 75 (4) 213-225 (2021) N. G. ĐORĐEVIĆ et al.: UTICAJA AKTIVACIJE MgO-TiO2 NA SINTEZU MAGNEZIJUM- TITANATA
216
3. REZULTATI I DISKUSIJA
3. 1. Karakterizacija reaktanata
U Tabeli 2 data je hemijska karakterizacija magnezijum oksida. Na osnovu podataka prikazanih u Tabeli 2, može se
utvrditi da je sadržaj magnezijum oksida 97,0 %, da najveći udeo nečistoća potiče od karbonata (1,5 %), kao i da je
gubitak žarenjem 2,0 %.
Tabela 2. Hemijski sastav magnezijum oksida
Table 2. Chemical composition of magnesium oxide
Komponenta Sadržaj, % Komponenta Sadržaj, %
MgO (kompleksometrijski),minimalno 97,00 Kalcijum 0,0200
Supstance rastvorne u vodi, maksimalno 0,4 Bakar 0,0010
Supstance nerastvorne u HCl, maksimalno 0,005 Gvožđe 0,0050
Nečistoće, maksimalno Kalijum 0,0050
Karbonati 1,5000 Mangan 0,0005
Hloridi 0,0100 Natrijum 0,2500
Sulfati 0,0010 Olovo 0,0010
Ukupni azot 0,0020 Cink 0,0005
Barijum i stroncijum 0,0050 Gubitak žarenjem, maksimalno 2,00
Arsen 0,0001 Supstance koje taloži NH4OH, maksimalno 0,02
Rendgenostrukturna analiza magnezijum oksida prikazana je na Slici 2, dok su u Tabeli 3 date brojčane vrednosti položaja
difrakcionih maksimuma karakterističnih za magnezijum oksid. Difraktogram na slici 2 prikazuje karakteristične pikove
(odnosno difrakcione maksimume) za magnezijum oksid, a položaj difrakcionih maksimumia (vrednosti uglova) prikazani u
Tabeli 3 ukazuju da je u analiziranom uzorku, pored dominantnog sadržaja magnezijum oksida, prisutan i zanemarljiv procenat
nečistoća, što je potvrda rezultata hemijske analize.
2 / o Slika 2. Rendgenostrukturna analiza magnezijum oksida
Figure 2. X-ray diffraction analysis of magnesium oxide
U Tabeli 4 prikazan je hemijski sastav upotrebljenog titanijum dioksida. Prikazani rezultati pokazuju da je sadržaj
titanijum dioksida ≥99 %, sadržaj nečistoća rastvorljivih u vodi i hlorovodoničnoj kiselini ≤1 %, dok je gubitak žarenjem
na 105 i 800 oC maksimalno 0,5 %. Rendgenostrukturna analiza titanijum dioksida prikazana je na Slici 3, dok su u Tabeli 5 date vrednosti položaja
difrakcionih maksimuma karakterističnih za titanijum dioksid. Na Slici 3 jasno su definisani pikovi karakteristični za titanijum dioksid što je očekivano s obzirom da su korišćenje supstance p.a. kvaliteta.
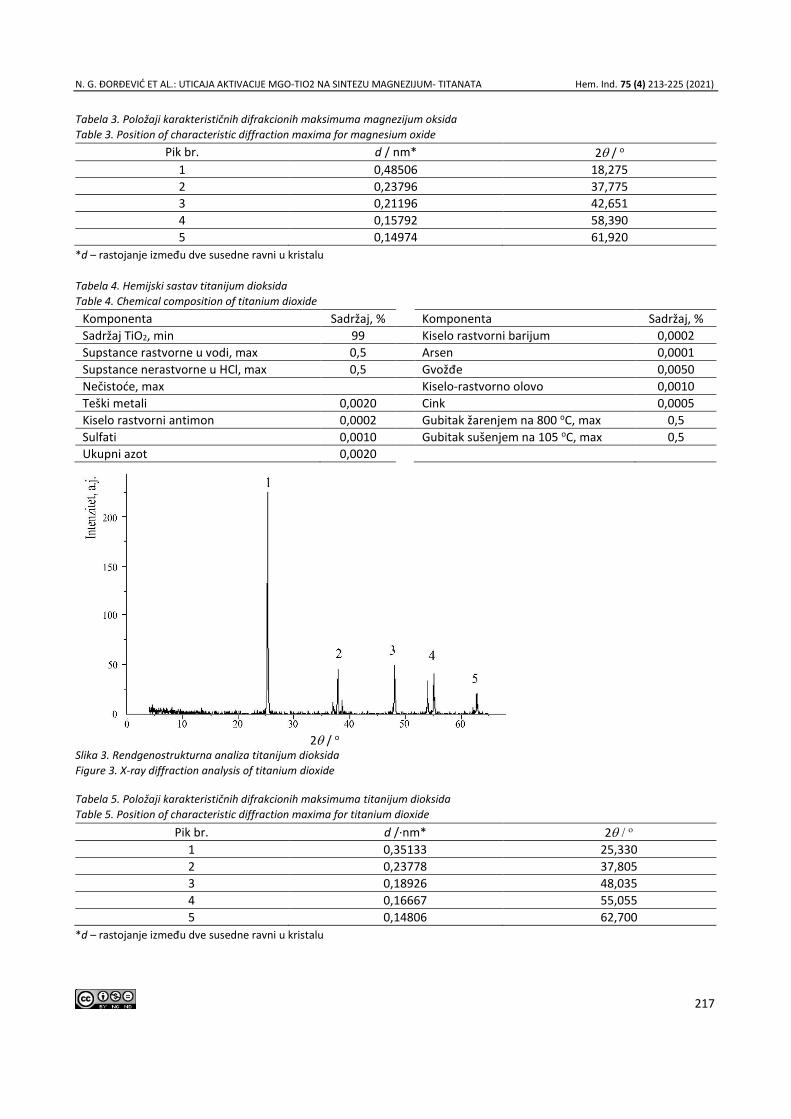
N. G. ĐORĐEVIĆ ET AL.: UTICAJA AKTIVACIJE MGO-TIO2 NA SINTEZU MAGNEZIJUM- TITANATA Hem. Ind. 75 (4) 213-225 (2021)
217
Tabela 3. Položaji karakterističnih difrakcionih maksimuma magnezijum oksida
Table 3. Position of characteristic diffraction maxima for magnesium oxide
Pik br. d / nm* 2 / o
1 0,48506 18,275
2 0,23796 37,775
3 0,21196 42,651
4 0,15792 58,390
5 0,14974 61,920
*d – rastojanje između dve susedne ravni u kristalu
Tabela 4. Hemijski sastav titanijum dioksida
Table 4. Chemical composition of titanium dioxide
Komponenta Sadržaj, % Komponenta Sadržaj, %
Sadržaj TiO2, min 99 Kiselo rastvorni barijum 0,0002
Supstance rastvorne u vodi, max 0,5 Arsen 0,0001
Supstance nerastvorne u HCl, max 0,5 Gvožđe 0,0050
Nečistoće, max Kiselo-rastvorno olovo 0,0010
Teški metali 0,0020 Cink 0,0005
Kiselo rastvorni antimon 0,0002 Gubitak žarenjem na 800 oC, max 0,5
Sulfati 0,0010 Gubitak sušenjem na 105 oC, max 0,5
Ukupni azot 0,0020
2 / o Slika 3. Rendgenostrukturna analiza titanijum dioksida
Figure 3. X-ray diffraction analysis of titanium dioxide
Tabela 5. Položaji karakterističnih difrakcionih maksimuma titanijum dioksida
Table 5. Position of characteristic diffraction maxima for titanium dioxide
Pik br. d /·nm* 2
1 0,35133 25,330
2 0,23778 37,805
3 0,18926 48,035
4 0,16667 55,055
5 0,14806 62,700
*d – rastojanje između dve susedne ravni u kristalu

Hem. Ind. 75 (4) 213-225 (2021) N. G. ĐORĐEVIĆ et al.: UTICAJA AKTIVACIJE MgO-TiO2 NA SINTEZU MAGNEZIJUM- TITANATA
218
Rezultati hemijske i rendgenostrukturne analize magnezijum oksida i titanijum dioksida, u prikazanim tabelama i
dijagramima odgovaraju zahtevima koje moraju da ispune hemikalije kvaliteta pro analysi i kao takve su odgovarajuće
komponente za reakciju koja se očekuje u eksperimentalnoj proceduri. Suština analiza bila je da se precizno kako
hemijski tako i rendgenostrukturno utvrdi sastav polaznih supstanci, kako bi se pratilo ponašanje reaktanata tokom
vremena aktivacije, kao i očekivani hemizam.
3. 2. Karakterizacija reakcionog sistema MgO-TiO2 tokom mehaničke aktivacije
Dinamika mehaničkog tretmana reakcionog sistema MgO-TiO2 praćena je rendgenostrukturnom analizom. Dobijeni
difraktogrami uzoraka reakcionog sistema nakon 60, 180, 330 i 1000 min mehaničke aktivacije uporedno su prikazani
na Slici 4, dok su vrednosti položaja karakterističnih difrakcionih maksimuma date u Tabeli 6.

N. G. ĐORĐEVIĆ ET AL.: UTICAJA AKTIVACIJE MGO-TIO2 NA SINTEZU MAGNEZIJUM- TITANATA Hem. Ind. 75 (4) 213-225 (2021)
219
2 / o Slika 4. Rendgenostrukturna analiza uzorka sistema MgO-TiO2 mehanički aktiviranog a) 60, b) 180, c) 330 i d) 1000 min
Figure 4. X-ray diffraction analysis of samples of the MgO-TiO2 system mechanically activated for a) 60, b) 180, c) 330 i d) 1000 min
Tabela 6. Položaji karakterističnih difrakcionih maksimuma uzorka sistema MgO-TiO2 posle 60, 180, 330 i 1000 min mehaničke aktivacije
Table 6. Position of characteristic diffraction maxima of the MgO-TiO2 system sample after 60, 180, 330, and 1000 min of mechanical activation
Vreme aktivacije, min Pik br. Supstanca d /·10-10 m* 2
60
1 TiO2 0,35133 25,33
2 TiO2 0,23651 37,85
3 MgO 0,21060 42,91
4 TiO2 0,18931 48,02
5 TiO2 0,16636 55,16
6 MgO 0,14794 62,75
Intenzitet preostalih 7 pikova je na nivou šuma.
180
1 TiO2 0,35093 25,360
2 TiO2 0,23766 37,825
3 MgO 0,21078 42,870
4 TiO2 0,18931 48,020
5 TiO2 0,16657 55,090
6 MgO 0,14910 62,215
Intenzitet preostalih 9 pikova je na nivou šuma.
330
1 TiO2 0,35133 25,303
2 TiO2 0,23808 37,755
3 MgO 0,21141 42,730
4 TiO2 0,18889 48,135
5 MgO 0,14826 62,605
Intenzitet preostalih 8 pikova je na nivou šuma.
1000
1 TiO2 0,35065 25,38
2 TiO2 0,23802 37,76
3 MgO 0,21060 42,91
4 TiO2 0,18876 48,17
5 MgO 0,14874 62,38
*d – rastojanje između dve susedne ravni u kristalu
Smanjenje intenziteta i širenje difrakcionih maksimuma koji se javljaju na difraktogramima aktiviranih reakcionih
smeša, Slika 4(a-d), ukazuju da dolazi do destrukcije materijala, unošenja defekata i nastanka velikih naprezanja unutar
kristalne rešetke.
Difraktogram reakcione smeše posle 60 min aktivacije, Slika 4a, već pokazuje prisustvo amorfne strukture pošto se
uočava smanjenje intenziteta karakterističnih pikova.
Sa produženjem vremena mehaničke aktivacije trend smanjenja intenziteta difrakcionih maksimuma se nastavlja, a
zapaža se i njihovo širenje, pri čemu su obe pojave najizraženije posle 1000 min aktivacije, Slike 4 b,c,d. Ove promene
izgleda difraktograma su najčešće posledica smanjenja veličine čestica i naprezanja rešetke.
Osnovni zaključak koji se može doneti analizom difraktograma na Slici 4 jeste da je mehaničkom aktivacijom sistema
MgO-TiO2 došlo do gotovo potpune amorfizacije reakcione smeše.
Jasno se raspoznaju maksimumi magnezijum oksida (d = 0,21060 i 0,14874 nm) kao i titanijum dioksida (d = 0,35065;
0,23802 i 0,18876 nm). Difrakcioni maksimumi magnezijum titanata nisu identifikovani.
Kako se može zaključiti, tokom ukupnog perioda mehaničke aktivacije analiziranog sistema uočavaju se samo
karakteristični pikovi na određenim talasnim dužinama čiji su se intenziteti smanjivali sa porastom vremena, ali nije
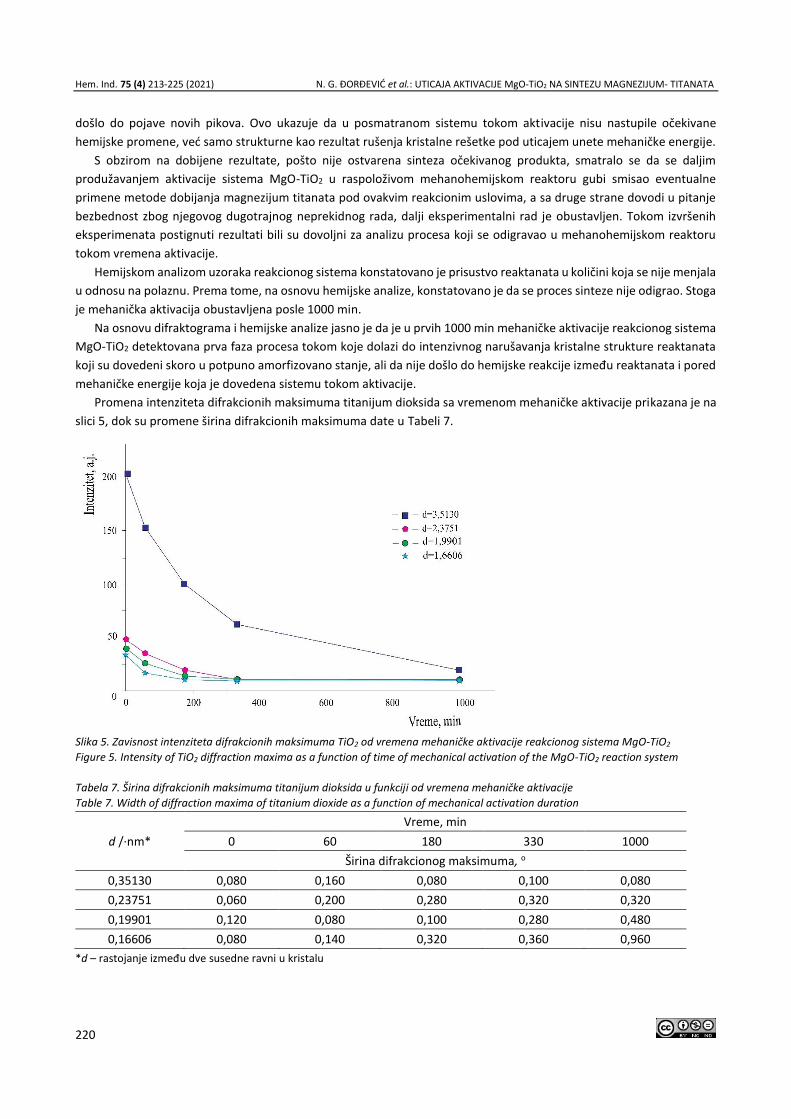
Hem. Ind. 75 (4) 213-225 (2021) N. G. ĐORĐEVIĆ et al.: UTICAJA AKTIVACIJE MgO-TiO2 NA SINTEZU MAGNEZIJUM- TITANATA
220
došlo do pojave novih pikova. Ovo ukazuje da u posmatranom sistemu tokom aktivacije nisu nastupile očekivane
hemijske promene, već samo strukturne kao rezultat rušenja kristalne rešetke pod uticajem unete mehaničke energije.
S obzirom na dobijene rezultate, pošto nije ostvarena sinteza očekivanog produkta, smatralo se da se daljim
produžavanjem aktivacije sistema MgO-TiO2 u raspoloživom mehanohemijskom reaktoru gubi smisao eventualne
primene metode dobijanja magnezijum titanata pod ovakvim reakcionim uslovima, a sa druge strane dovodi u pitanje
bezbednost zbog njegovog dugotrajnog neprekidnog rada, dalji eksperimentalni rad je obustavljen. Tokom izvršenih
eksperimenata postignuti rezultati bili su dovoljni za analizu procesa koji se odigravao u mehanohemijskom reaktoru
tokom vremena aktivacije.
Hemijskom analizom uzoraka reakcionog sistema konstatovano je prisustvo reaktanata u količini koja se nije menjala
u odnosu na polaznu. Prema tome, na osnovu hemijske analize, konstatovano je da se proces sinteze nije odigrao. Stoga
je mehanička aktivacija obustavljena posle 1000 min.
Na osnovu difraktograma i hemijske analize jasno je da je u prvih 1000 min mehaničke aktivacije reakcionog sistema
MgO-TiO2 detektovana prva faza procesa tokom koje dolazi do intenzivnog narušavanja kristalne strukture reaktanata
koji su dovedeni skoro u potpuno amorfizovano stanje, ali da nije došlo do hemijske reakcije između reaktanata i pored
mehaničke energije koja je dovedena sistemu tokom aktivacije.
Promena intenziteta difrakcionih maksimuma titanijum dioksida sa vremenom mehaničke aktivacije prikazana je na
slici 5, dok su promene širina difrakcionih maksimuma date u Tabeli 7.
Slika 5. Zavisnost intenziteta difrakcionih maksimuma TiO2 od vremena mehaničke aktivacije reakcionog sistema MgO-TiO2
Figure 5. Intensity of TiO2 diffraction maxima as a function of time of mechanical activation of the MgO-TiO2 reaction system
Tabela 7. Širina difrakcionih maksimuma titanijum dioksida u funkciji od vremena mehaničke aktivacije
Table 7. Width of diffraction maxima of titanium dioxide as a function of mechanical activation duration
d /·nm*
Vreme, min
0 60 180 330 1000
Širina difrakcionog maksimuma, o
0,35130 0,080 0,160 0,080 0,100 0,080
0,23751 0,060 0,200 0,280 0,320 0,320
0,19901 0,120 0,080 0,100 0,280 0,480
0,16606 0,080 0,140 0,320 0,360 0,960
*d – rastojanje između dve susedne ravni u kristalu
N. G. ĐORĐEVIĆ ET AL.: UTICAJA AKTIVACIJE MGO-TIO2 NA SINTEZU MAGNEZIJUM- TITANATA Hem. Ind. 75 (4) 213-225 (2021)
221
Na dijagramu Slike 5 uočljiv je pad intenziteta difrakcionih maksimuma gotovo do granica osetljivosti uređaja što je
indikacija narušavanja kristalne strukture. S obzirom da na difraktogramu uzorka izloženog mehaničkoj aktivaciji tokom
1000 min, slika 4d), nije identifikovan maksimum očekivanog produkta reakcije, može se pretpostaviti da je celokupna
reakciona masa, osim što je gotovo potpuno amorfizovana, takođe i nedefinisane hemijske strukture u pogledu
zastupljenosti čvrstih i stabilnih hemijskih veza. Sa dijagrama se može zaključiti da se maksimalna promena intenzitetа
pikova odigrala na samom početku aktivacije što je posledica narušavanja kristalne strukture polaznih komponenti.
Nakon 330 min aktivacije praktično nije došlo do bitnijih promena intenziteta pikova iz razloga što uložena mehanička
energija nije bila dovoljna da se premosti energetska barijera ka formiranju novog hemijskog jedinjenja- magnezijum
titanata i pored negativne vrednosti Gibsove energije i teorijske mogućnosti da se reakcija neutralizacije (1) odigra.
Analizom podataka iz Tabele 6, zaključuje se da širina difrakcionih maksimuma analiziranih uzoraka raste, što je
takođe pokazatelj opisanih procesa.
Upoređujući difraktograme magnezijum oksida (Slika 2) i titanijum dioksida (Slika 3) sa difraktogramima aktivirnog
reakcionog sistema (Slika 4), uočava se da su pikovi karakteristični za magnezijum oksid kao i titanijum dioksid prisutni
na difraktogramima aktiviranog reakcionog sistema, ali sa smanjenim intenzitetom, što ukazuje na proces amorfizacije
tokom mehaničke aktivacije.
Jasno je da se do prekida eksperimenta posle 1000 min mehaničke aktivacije odvijala prva faza, na difraktogramima
vidljiva kao faza razaranja kristalne strukture reaktanata MgO i TiO2 i njihovog prevođenja u amorfno stanje, ali očekivani
produkt- magnezijum titanat nije nastao.
Reakcije u čvrstom stanju značajno su kompleksnije od reakcija koje se odigravaju u gasovitom i tečnom stanju.
Pored termodinamičhih parametara reakcije za koju se pretpostavlja da će se odigrati, na primer tokom procesa
sinterovanja na tačno definisanoj teperaturi, višestruki parametri imaju uticaj na reakcije koje se očekuju usled
mehaničkog delovanja na polazne komponente u stehiometrijskom odnosu. Pored teorijske mogućnosti da se
pretpostavljena reakcija odigra (negativna Gibsova energija, što je slučaj u ovim eksperimentima, važnu ulogu ima i
uređaj u kome se vrši mehanička aktivacija. U ovom slučaju korišćen je vibro mlin sa dva prstena mase 3 kg, koji na
smešu prahova deluju silom trenja i udara, pa ne može da se govori o kontinualnom procesu. Uz to, sa povećanjem
vremena mehaničke aktivacije raste temperatura sistema, čime se takođe menjaju parametri koji utiču na sistem. Kako
u samom mlinu ne postoji oprema za praćenje sile kojom prstenovi deluju na zidove posude mlina, a time i na prahove,
niti termometar, kojim bi se pratio porast temperature u funkciji vremena aktivacije i odredio trenutak kada mlevenje
postaje temperaturno kontinualan proces, praktično je nemoguće na osnovu teorijskih parametara unapred utvrditi
hoće li se i u kom stepenu u datom uređaju odigrati neka reakcija. Stoga je neophodno empirijski utvrditi da li je u datom
reaktoru za određeno vreme aktivacije reakcija moguća. Iz tog razloga se i vrše periodična ispitivanja hemijskog sastava
u određenim fazama mehaničke aktivacije da bi se utvrdilo postojanje pretpostavljenih intermedijarnih jedinjenja.
Takođe se na osnovu hemijskog sastava određuje i trajanje mehaničke aktivacije, odnosno vreme potrebno da dođe do
mehanohemijske reakcije. Tokom tog ispitivanja, u trenutku kada hemijska i rendgenostrukturna analiza pokažu da je
očekivana reakcija završena i dobijen željeni produkt, mehanička aktivacija se završava.
Ključ za proučavanje i tumačenje kinetike mehanohemijskih reakcija je u uspostavljanju relacije između korisnog dela
saopštene mehaničke energije i brzine hemijske reakcije. Pre nego što započne reakcija u čvrstom stanju između dve
supstance koje se nalaze pod uticajem mehaničke energije, dolazi do rušenja kristalne strukture i pojave defekata u
komponentama smeše. I pored toga što je predata mehanička energija obema supstancama (MgO i TiO2) ista, obzirom
da se radi o različitim jedinjenjima, sa sigurnošću se može tvrditi da kinetika rušenja kristalne rešetke nije ista za oba
materijala. Stoga bi u cilju ispitivanja reakcije dobijanja magnezijum titanata bilo potrebno odvojeno pod istovetnim
uslovima, uključujući i vreme trajanja, izvršiti mehaničku aktivaciju svakog od polaznih oksida pojedinačno, da bi se
utvrdio mehanizam i kinetika uticaja aktivacije na svaku od komponenti. Takođe, obzirom da upotrebljenim vibro
mlinom snage 0,8 kW nije unesena dovoljna količina energije u sistem da bi tokom 1000 min aktivacije započela hemijska
reakcija, koja je teorijski moguća, trebalo bi izvršiti ispitivanje uticaja snage motora mlina na odvijanje reakcije. Ukoliko
bi se koristio mlin sa kuglama, jedan od parametara bi bio i odnos mase kuglica u odnosu na masu prahova na kojima se
vrši mehanička aktivacija.

Hem. Ind. 75 (4) 213-225 (2021) N. G. ĐORĐEVIĆ et al.: UTICAJA AKTIVACIJE MgO-TiO2 NA SINTEZU MAGNEZIJUM- TITANATA
222
Proizvodi mehaničke aktivacije u velikoj meri zavise od uslova mlevenja. S obzirom da tip mlina uz parametre
mlevenja značajno utiče na efikasnost i prirodu prenosa mehaničke energije na tretirani materijal, primena različitih
tipova mlinova ili varijacija parametara aktivacije može da rezultuje različitim tokovima mehanohemijskih reakcija. Stoga
je realno očekivati da će mehaničkom aktivacijom sistema MgO-TiO2 u nekom drugom tipu mlina doći do sinteze
magnezijum titanata. Magnezijum titanat je moguće dobiti mehanohemijskom metodom u planetarnom mlinu [43]. S
obzirom da fenomeni koji se dešavaju tokom mehaničke aktivacije nisu dovoljno proučeni, ne može se pouzdano
predvideti finalni produkt tretmana.
Na slici 6 prikazana je promena potencijalne energije reaktanata, aktiviranog kompleksa i produkta tokom odvijanja
hemijske reakcije.
Slika 6. Promena potencijalne energije reaktanata, aktiviranog kompleksa i produkta duž reakcione koordinate.
Figure 6. Potential energy of reactants, activated complex and the product along the reaction coordinate
Na slici 6 prikazan je dijagram promene potencijalne energije polaznih komponenti koje se aktiviraju, očekivanog
intermedijarnog jedinjenja i očekivanog produkta reakcije, magnezijum titanata. Ea1 je energija potrebna da polazne
komponente, usled unete mehaničke energije u sistem i narušene kristalne strukture međusobno počnu da reaguju i
stvaraju hemijsku vezu formiranjem intermedijarnog jedinjenja (MgO-TiO2) Daljim unosom energije u sistem (Ea2)
prevazišla bi se energetska barijera nakon čega bi bilo omogućeno neometano dobijanje konačnog proizvoda,
magnezijum titanata. Ukupna aktivaciona energija Ea čini zbir ove dve energije (Ea = Ea1 + Ea
2). Konačni produkt
pretpostavljene reakcije nalazi se na energetskom nivou koji predstavlja negativni zbir energije unete u sistem (Ea) i
promene Gibsove slobodne energije (ΔGr°).
Na osnovu dijagrama na Slici 6 vidi se da je razlika između potencijalnih energija reaktanata i produkta jednaka Gib-
bsovoj slobodnoj energiji reakcije (1) i iznosi, kako je navedeno u Tabeli 1, ΔGr° = -25,8 kJ mol-1. Međutim, sa aspekta
potencijalne energije reaktanata i aktiviranog kompleksa, vidi se da ako je odnos potencijalnih energija takav, kako je
prikazano na slici 6, odnosno ako je Ea1 < Ea
2, stepen odigravanja potencijalne reakcije svodi se na razliku u energijama
aktivacije između dve potencijalne reakcije (usitnjavanje polaznih oksida, dobijanje intermedijarnog jedinjenja
(MgO-TiO2)), gde je potrebno dodatno ulaganje energije da bi nastalo konačnog jedinjenje, magnezijum titanat.
Primenjeno na konkretnu diskusiju o mehanizmu mehanohemijske sinteze magnezijum titanata, zaključuje se da je
energija aktivacije prvog stupnja reakcije (1) manja od energije aktivacije drugog stupnja. Ta razlika utiče da je u
eksponencijalnoj relaciji konstanta brzine drugog stupnja manja od konstante brzine prvog stupnja reakcije, što bi
trebalo da rezultuje kinetičkim dijagramom reakcije prvog reda. Kako eksperimentom nije dobijeno pretpostavljeno
intermedijaro jedinjenje, zaključuje se da primenjeni uređaj snage 0,8 kW nije mogao da preda sistemu potrebnu
količinu energije Ea1 i da se ni prvi stupanj reakcije nije odigrao.

N. G. ĐORĐEVIĆ ET AL.: UTICAJA AKTIVACIJE MGO-TIO2 NA SINTEZU MAGNEZIJUM- TITANATA Hem. Ind. 75 (4) 213-225 (2021)
223
Imajući u vidu prikazane vrednosti slobodne Gibsove energije, prema kojima je sintezu titanata ostalih zemnoalkalnih
metala lakše ostvariti u odnosu na magnezijum titanat, dalja istraživanja će se izvršiti u vibro mlinu sa većom snagom
motora i istim parametrima težine prstenova, kao i u planetarnom mlinu, a u funkciji odnosa mase kuglica i mase unetog
materijala (MgO i TiO2) u vidu smeše prahova, kako bi mehanička energija koju sistemu predaje primenjeni tip mlina bila
dovoljna za prevazilaženje energetske barijere i za dobijanje magnezijum titanata.
4. ZAKLJUČAK
U ovom radu izvršen je pokušaj mehanohemijske sinteze magnezijum titanata u visokoenergetskom mlinu sa
torzionim oprugama i prstenastim radnim elementima. Teorijski, hemijska reakcija je moguća samo ako je Gibsova
slobodna energija te reakcije negativna, odnosno ako je energetski sadržaj produkata reakcije na nižem nivou od
energetskog sadržaja reaktanata. Na osnovu rezultata dobijenih u ovom istraživanju može se zaključiti da i pored
dovedene mehaničke energije u sistem, prisutna slobodna energija nije bila dovoljna da se odigra reakcija između MgO
i TiO2 i dobije magnezijum titanat kao produkt. Mehanička energija koja je predata reakcionom sistemu u mehano-
hemijskom aktivatoru dovela je do rušenja kristalne strukture i amorfizacije reaktanata, što se vidi na prikazanim
diftaktogramima, ali nije bila dovoljna za sintezu magnezijum titanata prema jednačini (1), pa bi u tom cilju bilo
neophodno koristiti energetski jači uređaj koji bi polaznim komponentama predao veći sadržaj energije, čime bi se
preskočila energetska barijera i omogućilo polaznim oksidima da uđu u hemijsku reakciju tokom mehaničke aktivacije.
Zahvalnica: Sredstva za realizaciju ovog istraživanja obezbedilo je Ministarstvo prosvete, nauke i tehnološkog razvoja
Republike Srbije (451-03-9/2021-14/200023, 451-03-9/2021-14/200026 i 451-03-9/2021-14/200131).
LITERATURA
[1] Tyliszczak B, Gaca K, Sobczak-Kupiec A, Dulian P. Mechanochemical synthesis and investigations of calcium titanate powders and their acrylic dispersions. J Eur Ceram Soc. 2014; 34(10): 2259-2264.
[2] Cherdchom S, Rattanaphan T, Chanadee T. Calcium Titanate from food waste: Combustion Synthesis, Sintering, Characterization, and Properties. Adv Mater Sci Eng. 2019; 9639016.
[3] Fauzi F, Habieb AM, Noviyanto A, Kusumaningrum R, Sukmarani G, Muhammad E, Widodo V, Amalia D, Aryanto D, Rochman N. The Effect of Mechanochemical on The Formation of Calcium Titanate (CaTiO3) Prepared by High Energy Milling. In: Proceedings of IOP Conference Series: Materials Science and Engineering, International Conference on Advanced Materials and Technology. Indonesia, Bogor, 2019, 924, pp. 8-9.
[4] Manafi S, Jafarian M. Synthesis of perovskite CaTiO3 nanopowders with different morphologies by mechanical alloying without heat treatment. Int J Phys Sci. 2013; 8(23): 1277-1283.
[5] Guomin M, Murakami Y, Shindo D, Saito F. Mechanochemical synthesis of CaTiO3 from a CaO–TiO2 mixture and its HR-TEM observation. Powder Technol. 1999; 105(1–3): 162-166.
[6] Branković G, Vukotić V, Branković Z, Varela J. Investigation on possibility of mechanochemical synthesis of CaTiO3 from different precursors. J Eur Ceram Soc. 2007; 27(2–3): 729-732.
[7] Palaniandy S, Jamil N. Influence of milling conditions on the mechanochemical synthesis of CaTiO3 nanoparticles. J Alloy Compd. 2009; 476(1–2): 894-902.
[8] Tyliszczak B, Gaca K, Sobczak-Kupiec A, Dulian P. Mechanochemical synthesis and investigations of calcium titanate powders and their acrylic dispersions. J Eur Ceram Soc. 2014; 34(10): 2259-2264.
[9] Wieczorek-Ciurowa K, Dulian P, Nosal A, Domagała J. Effects of reagents nature on mechanochemical synthesis of calcium titanate. J Therm Anal Calorim. 2010; 101(2): 471–477.
[10] Ralphs K, Hardacreand C, James S. Application of heterogeneous catalysts prepared by mechanochemical synthesis. Chem Soc Rev. 2013; 42: 7701-7718.
[11] Lazarević Z, Bobić J, Romčević N, Paunović N, Stojanović B. Study of Barium Bismuth Titanate Prepared by Mechanochemical Synthesis. Sci Sinter. 2009; 41: 329-335.
[12] Đorđević N, Obradović N, Filipović S. Kinetika mehanohemijske sinteze barijum-titanata, Tehnika. 2011; 66(3): 367-371.
[13] Li X, Shih W. Size Effects in Barium Titanate Particles and Clusters. J Am Ceram Soc. 1997; 80(11): 2844-2852.
[14] Obradović N, Filipović S, Pavlović V, Mitrić M, Marković S, Mitić V, Đorđević N, Ristić M. Isothermal sintering of barium-zinc-titanate ceramics. Ceram Int. 2011; 37(1): 21-27.
[15] Pavlović V, Nikolić M, Nikolić Z, Branković G, Živković Lj, Pavlović V, Ristić M. Microstructural evolution and electric properties of mechanically activated BaTiO3 ceramics. J Eur Ceram Soc. 2007; 27(2-3): 575-579.

Hem. Ind. 75 (4) 213-225 (2021) N. G. ĐORĐEVIĆ et al.: UTICAJA AKTIVACIJE MgO-TiO2 NA SINTEZU MAGNEZIJUM- TITANATA
224
[16] Stojanović B, Pavlović V, Pavlović VP, Đurić S, Marinković B, Ristić M. Dielectric properties of barium-titanate sintered from tribophysically activated powders. J Eur Ceram Soc. 1999; 19 (6-7): 1081-1083.
[17] Tkacova K. Mechanical activation of minerals. Amsterdam, New York, Elsevier; 1989.
[18] Yangyun S, Brook RJ. Mechanism of reactive sintering of aluminium nitride. Sci Sinter. 1985; 17: 35-47.
[19] Zdujic M, Poleti D, Jovalekic C, Karanovic L. The evolution of structure induced by intensive milling in the system 2Bi(2)O(3) center dot 3TiO(2). J Non-Cryst Solids. 2006; 352(28-29): 3058-3068.
[20] Bobić J, Vijatović M, Rojac T, Stojanović B. Characterization and properties of barium bismuth titanate. Process Appl Ceram. 2009; 3(1-2): 9–12.
[21] Stojanovic B, Paiva-Santos C, Cilense M, C. Valekic J, Lazarevic Z. Structure study of Bi4Ti3O12 produced via mechanochemically assisted synthesis. Mater Res Bull. 2008; 43: 1743–1753.
[22] Kudłacik-Kramarczyk S, Drabczyk A, Głąb M, Dulian P, Bogucki R, Miernik K, Sobczak-Kupiec A, Tyliszczak B. Mechanochemical Synthesis of BaTiO3 Powders and Evaluation of Their Acrylic Dispersions. Materials. 2020; 13(15): 3275.
[23] Buscaglia V, Randall C. Size and scaling effects in barium titanate. J Eur Ceram Soc. 2020; 40: 3744–3758.
[24] Barber P, Balasubramanian S, Anguchamy Y, Gong S, Wibowo A, Gao H, Ploehn H, Loye H. Polymer Composite and Nanocomposite Dielectric Materials for Pulse Power Energy Storage. Materials. 2009; 2:1697–1733.
[25] Wei X, Liu Y, Zhao D, Ge S. 3D printing of piezoelectric barium tinatate with high density from milled powders. J Eur Ceram Soc. 2020; 40(15): 5423-5430
[26] Ziegmann A, Schubert D. Influence of the particle size and the filing degree of barium titanate filled silicone elastomers used as potential dielectric elastomers on the mechanical properties and the crosslinking density. Mater Today Commun. 2018; 14: 90–98.
[27] Berbenni V, Mariniv A, Bruni G. Effect of Mechanical Activation on the Preparation of SrTiO3 and Sr2TiO4 Ceramics from the Solid State Systems SrCO3–TiO2. J Alloy Compd. 2001; 329(1–2): 230–238.
[28] Wang J, Yin S, Zhang Q, Saito F, Sato T. Mechanochemical synthesis of SrTiO3−xFx with high visible light photocatalytic activities for nitrogen monoxide destruction. J Mater Chem. 2003; 13: 2348-2352.
[29] Wang J, Yin S, Zhang Q, Saito F, Sato T. Mechanochemical Synthesis and Photocatalytic Activity of Nitrogen Doped SrTiO3. J Ceram Soc Jpn., 2004; 112(5): 1408-1410.
[30] Živojinović J, Pavlović V, Kosanović D, Marković S, Krstić J, Blagojević V, Pavlović V. The influence of mechanical activation on structural evolution of nanocrystalline SrTiO3 powders. J Alloy Compd. 2017; 695: 863-870.
[31] Wang TX, Liu SZ, Chen J. Molten salt synthesis of SrTiO3 nanocrystals using nanocrystalline TiO2 as a precursor. Powder Technol. 2011; 205: 289–291.
[32] Avvakumov EG. Mekhanicheskie metody aktivacii khimicheskih procesov, Moskva, SSSR, Akademii Nauk; 1986.
[33] Boldyrev VV. Mechanochemistry and mechanical activation of solids. Solid State Ionics, 1993; 63-65: 537-543.
[34] Glasstone S. Textbook of Physical Chemistry. Lancaster, PA Lancaster Press; 1967.
[35] Filipovic S, Obradovic N, Pavlović V, Markovic S, Mitrić M, Ristic M. Influence of Mechanical Activation on Microstructure and Crystal Structure of Sintered MgO-TiO2 System. Sci Sinter. 2010; 42(2): 143-151.
[36] Filipovic S, Obradovic N, Kosanovic D, Pavlovica V, Djordjevic A. Sintering of the mechanically activated MgO-TiO2 system. J Ceram Process Res. 2013; 14(1): 31-34.
[37] Nikzad L, Ghofrani S, Majidian H, Ebadzadeh T. Effect of Ball Milling on Reactive Microwave Sintering of MgO-TiO2 System. ACERP. 2016; 2(3): 25-28.
[38] Khalajabadi S, Rafiq M, Kadir A, Izman S, Bakhsheshi-Rad H, Farahany S. Effect of mechanical alloying on the phase evolution, microstructure and bio-corrosion properties of a Mg/HA/TiO2/MgO nanocomposite. Ceram Int. 2014; 40(10): 16743-16759.
[39] Bhuyan R, Sahoo P, Basanta K, Sarangi A. Structural and Thermal Study of Mg2TiO4 Nanoparticles Synthesized by Mechanical Alloying Method. Micro Nanosyst. 2020; 12(2): 87-91.
[40] Yang H, Zhihong L, Yumei Z. Effect of MgO–TiO2–SiO2 additions on in-situ anisotropic grains growth and mechanical properties of corundum abrasive using pseudo-boehmite as raw material. Ceram Int. 2020; 46 (2): 1934-1939.
[41] Khalajabadi S, Kadir M, Izman S, Yusop M. Facile fabrication of hydrophobic surfaces on mechanically alloyed-Mg/HA/TiO2/MgO bionanocomposites. Appl. Surf. Sci. 2015; 324: 380-392.
[42] Vidojković V. Proučavanje mehanizma i kinetike mehanohemijske sinteze neorganskih soli kod reakcija neutralizacije. Doktorska disertacija, Univerzitet u Beogradu; 2001.
[43] Filipović S, Obradović N, Pavlović V, Marković S, Mitrić M, Mitrović N. Sinteza magnezijum titanata mehanohemijskom metodom. Tehnika. 2014; 23 (5): 727-731.

N. G. ĐORĐEVIĆ ET AL.: UTICAJA AKTIVACIJE MGO-TIO2 NA SINTEZU MAGNEZIJUM- TITANATA Hem. Ind. 75 (4) 213-225 (2021)
225
ABSTRACT
Investigation of the impact of mechanical activation on synthesis of the MgO-TiO2 system
Nataša G. Đorđević1*, Milica M. Vlahović2, Sanja D. Martinović2, Slavica R. Mihajlović1, Nenad M. Vušović3 and
Miroslav D. Sokić1
1Institute for Technology of Nuclear and Other Mineral Raw Materials, Belgrade, Serbia 2University of Belgrade, Institute of Chemistry, Technology and Metallurgy, Belgrade, Serbia 3University in Belgrade, Technical Faculty in Bor, Bor, Serbia
(Technical paper)
In this study, a mixture of magnesium oxide and titanium dioxide was mechanically
activated in order to investigate the possibility of mechanochemical synthesis of
magnesium titanate. Mechanical activation was performed for 1000 min in a high-
energy vibro mill (type MH954/3, KHD Humboldt Wedag AG, Germany). The mill is
equipped with housing having a horizontally placed shutter. The cylindrical stainless
steel working vessel, with inner dimensions of 40 mm in height and 170 mm in
diameter, has working elements consisting of two free concentric stainless steel
rings with a total weight of 3 kg. The engine power is 0.8 kW. Respecting the optimal
amount of powder to be activated of 50-150 g and the stoichiometric ratio of the
reactants in the equation presenting the chemical reaction of magnesium titanate
synthesis, the starting amounts were 20.2 g (0.5 mol) of MgO and 39.9 g (0.5 mol)
TiO2. During the experiments, X-ray diffraction analysis of the samples taken from
the reaction system after 60, 180, 330, and 1000 min of mechanical activation was
performed. Atomic absorption spectrophotometry was used for chemical
composition analysis of samples taken at different activation times. Based on the X-
ray diffraction analysis results, it can be concluded that the greatest changes in the
system took place at the very beginning of the mechanical activation due to the
disturbance of the crystal structure of the initial components. X-ray diffraction
analysis of the sample after 1000 min of activation showed complete amorphization
of the mixture, but diffraction maxima characteristic for magnesium titanate were
not identified. Therefore, the mechanical activation experiments were stopped.
Evidently, the energy input was not sufficient to overcome the energy barrier to
form a new chemical compound - magnesium titanate. The failure to synthesize
magnesium titanate is explained by the low negative Gibbs energy value of
-25.8 kJ/mol (despite the theoretical possibility that the reaction will happen), as
well as by the amount of mechanical energy entered into the system during
activation which was insufficient to obtain the reaction product. Although the
synthesis of MgTiO3 was not achieved, significant results were obtained which
identify models for further investigations of the possibility of mechanochemical
reactions of alkaline earth metals and titanium dioxide.
Keywords: high energy vibrating mill; mag-
nesium titanate; amorphization; X-ray
structural analysis


227
Study of microstructure, hardness and thermal properties of Sn-Bi alloys
Kristina N. Božinović, Dragan M. Manasijević, Ljubiša T. Balanović, Milan D. Gorgievski,
Uroš S. Stamenković, Miljan S. Marković and Zoran D. Mladenović
Technical Faculty in Bor, Department of Metallurgical Engineering, University of Belgrade, Vojske Jugoslavije 12, 19210 Bor, Serbia
Abstract
Lead-free solders have become a main focus of the electronic industry in recent years, because of the high toxicity of lead. Alloys based on the Sn-Bi system figure as potential replacements for Sn-Pb alloys in soldering due to favorable properties and low cost. One of the main advantages of these alloys are low melting temperatures, while additional advantages include good compatibility with substrates, low process temperature, high reliability, and potential applications in conjunction with reduced graphene oxide nanosheets as thermal interface materials. In this paper, characterization of microstructural and thermal properties as well as hardness measurements of seven alloys of different Sn-Bi compositions are performed. Structural properties of the samples were analyzed using optical microscopy and scanning electron microscopy and energy dispersive X-ray spectroscopy (SEM-EDS). Thermal conductivity of the samples was investigated using the xenon-flash method, and phase transition temperatures were measured using the differential scanning calorimetry (DSC) analysis.
Keywords: structural properties; soldering; lead-free solders; thermal conductivity.
ORIGINAL SCIENTIFIC PAPER
UDC: 620.17:669.017.12
(546.811+546.87)
Hem. Ind. 75 (4) 227-239 (2021)
Available on-line at the Journal web address: http://www.ache.org.rs/HI/
1. INTRODUCTION
For a long time, lead-tin alloy was broadly used in electronic industry because of its favorable physical and
mechanical characteristics (low melting point, good wettability on different substrates, high strength of joints), and well-
studied and optimized production [1]. Because of the high toxicity of lead, this alloy was abandoned, which prompted
the electronics industry to seek for new solutions and lead-free solders became one of the main interests. A variety of
systems have been proposed such as Sn-Ag, Sn-Cu, Sn-Bi, Sn-Zn, Sn-Au, Sn-Ag-Cu (SAC), Sn-Bi-Zn, Sn-Ag-Cu-Bi, etc. [2-
5]. Commonly used in wave and reflow soldering processes, many of these lead-free solders melt at much higher
temperatures than the conventional Sn-Pb eutectic solder (183°C). Higher melting temperatures cause damage to high-
temperature-sensitive components and pose a major challenge to the electronic industry [4-5]. Alloys based on the Sn-
Bi system were proposed as one of the best candidates in replacing Sn-Pb alloys in soldering due to their low melting
temperatures (eutectic point: 139°C), good mechanical properties and cost-efficiency [1,5-8]. Yet, Sn-Bi solder alloys
have also disadvantages, such as precipitation of Bi in the supersaturated Sn matrix during aging, and coarsening of the
microstructure in the case of Bi-rich phases [9,10]. Therefore, a considerable number of investigations have been
devoted to examining microstructure and mechanical properties of Sn-Bi alloys with addition of alloying elements such
as Ni, Cu, Zn, Ag [5,6,9-14]. These systems with addition of other components also, have been particularly researched
because of their potential application as thermal interface materials (TIM). The increasing demand for higher processing
speeds, and smaller and thinner products had led the electronic industry to develop high performance devices, leaving
a thermal management as a main challenge. In microelectronic packaging, TIM acts as a tunnel for the heat transfer
from the device to the heat sink. Simultaneously, it provides a mechanical connection. The efficiency of the thermal
management system is largely limited by the thermal conductivity of the TIM. Sn-Bi alloys reinforced with carbon
Corresponding author: Kristina N. Božinović, Technical Faculty in Bor, Department of Metallurgical Engineering, University of Belgrade, Vojske Jugoslavije 12, 19210 Bor, Serbia; tel. +381 61 613 12 95
E-mail: [email protected]
Paper received: 19 January 2021; Paper accepted: 09 July 2021; Paper published: 30 July, 2021
https://doi.org/10.2298/HEMIND210119021B

Hem. Ind. 75 (4) 227-239 (2021) K. N. BOŽINOVIĆ et al.: PROPERTIES OF Sn-Bi ALLOYS
228
nanotubes, reduced graphene oxide nanosheets, and other supplements have become very attractive as TIMs, because
of their relatively low process temperatures, high reliability, and good compatibility with substrates [15-18].
In recent years, research of Sn-Bi system properties has been mainly focused on microstructure [9,19-24],
mechanical properties [9,12,13,20-23], wettability [25,26], thermal characteristics [20,27], and interfacial reactions
between the molten solder and the substrate [24,28], considering primarily the Sn-Bi eutectic alloy. Very little to none
attention was given to the thermal conductivity [20,29] and hardness measurements. Therefore, this work focused on
microstructure characterization, hardness measurements, and thermal properties investigations as a contribution to
more complete knowledge of the mentioned system. These investigations included determination of thermal
diffusivities and thermal conductivities of seven Sn-Bi alloys with different compositions.
2. EXPERIMENTAL
The metals used for the preparation of selected samples were bismuth and tin of 99.9 % purity (Alfa Aesar, United
States). The investigated alloys with bismuth molar fractions of 0.1; 0.2; 0.4; 0.5; 0.6; 0.8 and 0.9 were prepared by
melting weighted masses of pure metals in alumina crucibles under inert argon atmosphere at 400°C. The investigated
compositions are given in Table 1.
Table 1. Molar and mass compositions of investigated Sn-Bi alloys
x Content, mas.%
Sample Bi Sn Bi Sn
Alloy 1 0.1 0.9 16.36 83.64
Alloy 2 0.2 0.8 30.56 69.44
Alloy 3 0.4 0.6 53.99 46.01
Alloy 4 0.5 0.5 63.77 36.23
Alloy 5 0.6 0.4 72.53 27.47
Alloy 6 0.8 0.2 87.56 12.44
Alloy 7 0.9 0.1 94.06 5.97
After solidification of alloy ingots, they were further homogenized for 60 min at 120 oC and cut into two parts. A
smaller part of the sample was used for differential scanning calorimetry (DSC) analysis, and the remaining part was
pressed by a hydraulic press (Mohr-Federhaff-Losenhausen, Germany) to obtain samples of the same dimensions in
form of a tablet 12.7 mm in diameter and about 2 mm thick. The pressing force was 7000 N.
Annealing was performed after pressing in order to remove internal stresses created during the pressing. The
annealing was carried out at 100 oC, in a closed chamber furnace, in a nitrogen-protected atmosphere, for 6 h.
Pressed and annealed samples were then used for investigations of thermal conductivity and diffusivity, structural
analyses, and hardness measurements.
The samples were prepared for the microstructural investigation via three steps: grinding, polishing and structure
development. In the structure development step, different etching agents were used, depending on the composition
(5 % alcoholic solution of hydrochloric acid – 5 % HCl in C2H5OH; A solution of ferric chloride in water - FeCl3 + HCl in
H2O; concentrated nitric acid - conc. HNO3; 8 % hydrochloric acid solution in alcohol – 8 % HCl in C2H5OH). All chemicals
used as etching agents were GR graded and produced by Dispochem.
Investigation of microstructural properties was performed by using light optical microscopy (LOM, Carl Zeiss Jena
Epy Type 2 microscope, Zeiss, Germany) as well as by scanning electron microscopy and energy dispersive X-ray
spectroscopy (SEM-EDS, VEGA 3, TESCAN, USA). Phase transition temperatures were measured by using the DSC analysis
(SDT-Q600 Simultaneous TGA/DSC, TA Instruments, Germany), and thermal conductivities of the investigated alloys
were determined by using the xenon-flash method on TA Discovery Xenon Flash (DXF) 500 instrument (TA Instruments,
Germany). The experimental procedure is explained in detail in the previous paper [30].

K. N. BOŽINOVIĆ et al.: PROPERTIES OF SN-BI ALLOYS Hem. Ind. 75 (4) 227-239 (2021)
229
The investigation of hardness was also carried out using Brinell’s method (HPO 250, WPM Leipzig, Germany) with
the applied force of 50 N. The measurements were performed at three different points of the sample surface, and the
mean value was calculated.
Thermal analysis was conducted on the DSC/DTA/TGA simultaneous device TA SDT Q600 (TA Instruments, Germany).
The specimens with an approximate weight of 40 mg were heated to 350 oC under inert argon atmosphere, at a constant
rate of 5 oC/min. The onset temperature of the first DSC peak in the heating process was considered as the temperature
of the eutectic reaction, and the peak temperature of the second thermal effect on heating was selected as the liquidus
temperature.
3. RESULTS AND DISCUSSION
3. 1. Results of LOM and SEM-EDS analysis
The samples were prepared via three steps: grinding, polishing and structure development and afterwards examined
by using the optical microscope (Fig. 1).
Fig. 1. Optical micrographs of chosen samples: (a) Alloy 2 magnification 200×; (b) Alloy 2 magnification 500×; (c) Alloy 3 magnification 200×; (d) Alloy 3 magnification 500×; (e); Alloy 7 magnification 200×; (f) Alloy 7 magnification 500×

Hem. Ind. 75 (4) 227-239 (2021) K. N. BOŽINOVIĆ et al.: PROPERTIES OF Sn-Bi ALLOYS
230
Existence of two phases can be distinguished in the presented results as well as by the SEM-EDS analysis (Fig. 2). In
Figure 1 darker areas correspond to the phase richer in tin and brighter to the phase richer in bismuth. However, in
Figure 1c and d the eutectic mixture present in the microstructure can be observed. SEM-EDS analysis was used to
analyze the phase morphology, to identify the coexisting phases, and to determine sample compositions (both overall
and phase compositions).
For the alloys analyzed by using SEM (Fig. 2), co-existing phases in the microstructure were confirmed by the EDS
point analysis. In the obtained SEM micrographs presented in Figures 3, 4 and 5 the darker colour signifies the phase
richer in the lighter metal tin, and the brighter colour, on the other hand, corresponds to the phase richer in the heavier
metal bismuth.
In this case, the existence of two phases is explained by the presence of a solid solution based on bismuth and a solid
solution based on tin, which was confirmed by the EDS analysis.
Fig. 2. SEM micrographs of examined samples - mixture of light (Bi) and dark (Sn) phases: a) Alloy 2 magnification 500×; (b) Alloy 2 magnification 3000×; (c) Alloy 3 magnification 500×; (d) Alloy 3 magnification 3000×; (e) Alloy 6 magnification 500×; (f) Alloy 6 magnification 3000×
We performed two types of the EDS analysis: 1) testing the overall composition of the observed surface and 2)
examining the composition at individual points or spectrums on the surface.
Numerical values obtained by both types of EDS analysis, shown as atomic percentages of investigated components,
are shown in Tables 2, 3 and 4, for each sample individually. Figure 3 shows microstructure of the Sn-rich sample, the
alloy 2 (Bi0.2Sn0.8) subjected to the SEM-EDS analysis where Figure 3a shows the surface at which the overall
composition was determined while Figure 3b shows particular points at which individual spectrums were obtained.
As it is shown in Figure 3b and in Table 2, darker phase represents the phase rich in tin solid solution (spectra 3 and
4), and lighter phase represents the phase rich in bismuth solid solution (spectra 1 and 2). In dark regions Sn-rich
dendrites with Bi precipitates inside can be seen. A good agreement between the overall composition of the investigated
surface and the nominal composition of the alloy 2 is obtained.

K. N. BOŽINOVIĆ et al.: PROPERTIES OF SN-BI ALLOYS Hem. Ind. 75 (4) 227-239 (2021)
231
Fig. 3. SEM-EDS micrographs of the alloy 2 (Bi0.2Sn0.8): (a) determination of the overall composition; (b) determination of composition based on spectrums obtained at four different spots .
Table 2. Results of EDS spectrum analyses for the alloy 2 (Bi0.2Sn0.8)
Nominal composition of alloys, at.%
Overall composition of the observed surface, at.%
Identified phase
Individual point spectrum
Content, at.%
Sn Bi
Bi Sn Bi Sn (Bi) Spectrum 1 2.17 97.83
Spectrum 2 3.40 96.60
20.00 80.00 19.82 80.18 (Sn) Spectrum 3 96.48 3.52
Spectrum 4 90.09 9.91
Fig. 4 represents the results of the SEM-EDS analysis for the near-eutectic sample, alloy 3 (Bi0.4Sn0.6) where the
overall microstructure and details of the eutectic microstructure under higher magnification are shown.
Table 3 shows good agreement between the chemical composition of the examined surface and the nominal alloy
composition. The Bi–Sn eutectic has an irregular lamellar structure, also termed a complex regular microstructure in
which two phases are arranged in alternating not-flat plates [20]. This eutectic microstructure arrangement is also
recognized as a “Chinese script” eutectic structure.
Figure 5 representing results of the EDS analysis for the Bi-rich alloy 6 (Bi0.8Sn0.2), shows the microstructure under
low magnification (Fig. 5a) and high magnification with four different points for the analysis of the present phases (Fig.
5b).
As it is shown in Figure 5 and Table 4, the alloy 6 consists of bright, coarse dendrites of the Bi-rich solid solution and
darker, interdendritic (Sn)+(Bi) eutectic regions. A good agreement between the chemical composition of the examined
surface and the nominal alloy composition is obtained.

Hem. Ind. 75 (4) 227-239 (2021) K. N. BOŽINOVIĆ et al.: PROPERTIES OF Sn-Bi ALLOYS
232
Fig. 4. SEM-EDS micrographs of the alloy 3 (Bi0.4Sn0.6): (a) determination of the overall composition; (b) determination of the composition of the eutectic microstructure
Table 3. Results of the EDS spectrum analysis for the alloy 3 (Bi0.4Sn0.6) showing the overall and the composition of the eutectic ((Sn)+(Bi)) mixture
Nominal composition of alloys, at%
Overall composition of the observed surface, at.%
Identified phase
Individual point spectrum
Content, at.%
Sn Bi
Bi Sn Bi Sn (Sn)+(Bi) eutectic
Spectrum 1 60.72 39.28 40.00 60.00 39.14 60.86
Fig. 5. SEM-EDS micrographs of the alloy 6 (Bi0.8Sn0.2): (a) determination of the overall composition; (b) determination of composition based on spectrums obtained at four different spots

K. N. BOŽINOVIĆ et al.: PROPERTIES OF SN-BI ALLOYS Hem. Ind. 75 (4) 227-239 (2021)
233
Table 4. Results of EDS spectrum analyses for the alloy 6 (Bi0.8Sn0.2)
Nominal composition of alloys, at.%
Overall composition of the observed surface, at.%
Identified phase
Individual point spectrum
Content, at.%
Sn Bi
Bi Sn Bi Sn (Bi) Spectrum 1 2.56 97.44
Spectrum 2 2.58 97.42
80.00 20.00 78.58 21.42 (Sn)+(Bi) eutectic
Spectrum 3 27.82 72.18
Spectrum 4 46.43 53.57
The overall chemical compositions of the all prepared samples were checked by the EDS method and it was found
that differences between the nominal and the experimentally determined compositions of alloys were negligible (less
than 1 at.%).
3. 2. Hardness measurements
Hardness of the investigated alloys was determined by using the Brinell test method with the applied force of 50 N
(Table 5). A decrease in hardness can be observed with addition of bismuth so that the largest hardness value was
measured for the alloy 1. Similar results were observed in some previous studies [31].
Table 5. Hardness determined by using the Brinell test method at the force of 50N
Sample Hardness, HB
Mean value Standard deviation
Alloy 1 23.7 0.1
Alloy 2 22.4 0.4
Alloy 3 21.2 0.6
Alloy 4 20.0 0.4
Alloy 5 17.9 0.4
Alloy 6 18.0 0.4
Alloy 7 17.0 1.2
Pure Bi 10.7 0.2
Pure Sn 9.0 0.5
3. 3. DSC analysis
Melting behavior of the alloys was investigated by using differential scanning calorimetry (DSC) and results are given in
Table 6 along with DSC thermograms in Figures 6-8, showing identified phase transition temperatures for the hypoeutectic
alloy 2 (Bi0.2Sn0.8), near-eutectic alloy 3 (Bi0.4Sn0.6) and the hypereutectic alloy 6 (Bi0.8Sn0.2), respectively.
Fig. 6. DSC heating curve for the alloy 2
Fig. 7. DSC heating curve for the alloy 3.

Hem. Ind. 75 (4) 227-239 (2021) K. N. BOŽINOVIĆ et al.: PROPERTIES OF Sn-Bi ALLOYS
234
Fig. 8. DSC heating curve for the alloy 6
Table 6. Phase transitions temperatures for examined alloy compositions obtained by the DSC analysis
Sample Phase transition temperature, C
Eutectic reaction Liquidus
Alloy 1 137.00 210.34
Alloy 2 138.80 185.00
Alloy 3 140.80 /
Alloy 4 139.73 171.11
Alloy 5 139.67 195.47
Alloy 6 138.82 226.27
Alloy 7 138.19 249.92
The obtained experimental results were compared to the results of thermodynamic calculations and good
agreement was noticed. By using the COST 531 lead-free solder thermodynamic database [32] and the PANDAT software
[33], a phase diagram for the Bi-Sn system was calculated (Fig. 9). Experimentally obtained results were inserted, where
every square represents a temperature obtained by the DSC analysis, for a specific composition in the Sn-Bi system.
Sn xBi Bi Figure 9. Calculated phase diagram of the Sn-Bi system by using the optimized thermodynamic parameters [32,34] and experimental results obtained in the present work (symbols)

K. N. BOŽINOVIĆ et al.: PROPERTIES OF SN-BI ALLOYS Hem. Ind. 75 (4) 227-239 (2021)
235
Over the years, there were many uncertainties concerning the solvus surfaces of Bi and Sn in the Sn-Bi system. The
uncertainties were mostly related to the Sn solvus surface, where the bismuth fraction went up to more than 10 at.%
of bismuth in tin. In recent years, the solubility was calculated to be around 6.2 at.% [8]. In the present case, we
confirmed that the solubility of Bi in tin was less than 10 at.%, and based on the calculated phase diagram using Pandat
software [33], the solubility is around 6.5 at.%, which is in a good agreement with the proposed literature data.
3. 4. Thermal conductivity measurements
Thermal diffusivity and thermal conductivity were determined for every investigated Sn-Bi alloy composition by
using the xenon-flash method [35]. Thermal conductivity of the investigated samples was determined by using the
following fundamental relation (1):
pC = (1)
where is the thermal conductivity, is thermal diffusivity, is density, and Cp is specific heat capacity. Thermal
diffusivity was directly measured. Values of the specific heat capacity for the studied alloys were calculated by using the
COST 531 thermodynamic database [32]. Alloys densities were determined by using the buoyancy method based on the
Archimedes' principle. The results of conducted analyses are given in Table 7. The total uncertainty for the determined
thermal conductivity is estimated to be ±8 % [30].
Table 7. Thermal diffusivities, specific heat capacities and thermal conductivities of the Bi-Sn alloys at 25, 50 and 100 oC.
Sample t / °C α / 10- 4 m2 s-1
Cp / J g-1 K-1 / W m-1 K-1
Mean value Standard deviation Mean value Standard deviation
Alloy 1
25 0.257 7.789 0.210 40.525 2.432
50 0.253 7.594 0.213 40.337 2.420
100 0.215 2.944 0.220 35.508 2.130
Alloy 2
25 0.172 9.274 0.195 26.161 1.570
50 0.169 3.559 0.198 26.162 1.570
100 0.148 2.082 0.204 23.597 1.416
Alloy 3
25 0.143 8.813 0.170 20.439 1.226
50 0.143 2.887 0.173 20.683 1.241
100 0.126 2.160 0.177 18.682 1.121
Alloy 4
25 0.125 7.416 0.160 19.764 1.186
50 0.124 1.732 0.162 17.404 1.044
100 0.110 2.887 0.166 15.852 0.951
Alloy 5
25 0.087 7.874 0.151 11.719 0.703
50 0.089 8.832 0.153 12.065 0.724
100 0.082 2.887 0.156 11.328 0.680
Alloy 6
25 0.057 1.000 0.135 7.231 0.434
50 0.059 5.447 0.136 7.501 0.450
100 0.057 1.732 0.139 7.484 0.449
Alloy 7
25 0.050 0.577 0.128 6.132 0.368
50 0.051 1.732 0.129 6.341 0.380
100 0.052 1.633 0.132 6.564 0.394
The obtained results show that the thermal diffusivity and thermal conductivity of the investigated Bi-Sn alloys
gradually decrease with increasing the Bi content due to bismuth being one of the metals with the lowest thermal
conductivity [36]. Figure 10 shows the dependence of the thermal conductivity on the alloy composition at 25 oC. The
literature value of thermal conductivity for the commercial Bi58Sn42 (mas.%) solder alloy [37] is labeled in Figure 10
and used for comparison with the results obtained in the present study. A reasonable agreement can be observed. The
specific heat capacity of the Sn-Bi alloys monotonically decreases with the increase in the Bi content (Fig. 11). It can be
noticed that there is an excellent agreement of the calculated specific heat capacity in the present research with the
value reported for the Bi58Sn42 (mas.%) solder alloy in literature [37].

Hem. Ind. 75 (4) 227-239 (2021) K. N. BOŽINOVIĆ et al.: PROPERTIES OF Sn-Bi ALLOYS
236
xBi Fig. 10. Thermal conductivity of the Bi-Sn alloys at 25 °C as a function of alloy composition. Thermal conductivity values for pure Sn and Bi are from the ref. [38] while the red symbol shows the literature value for the commercial Bi58Sn42 (mas.%) solder alloy [37]
xBi Fig. 11. Specific heat capacity of the Bi-Sn alloys at 25 °C as a function of alloy composition. Specific heat capacity values for pure Sn and Bi are from the ref. [38], while the red symbol shows the literature value for the commercial Bi58Sn42 (mas.%) solder alloy [37]
4. CONCLUSION
In this work, seven Sn-Bi alloys with bismuth molar fractions in the range from 0.1 - 0.9 were investigated regarding
microstructure, hardness and thermal properties. Microstructural analyses performed by LOM and SEM- EDS have
shown the existence of Sn-rich and Bi-rich solid solutions along with a complex regular eutectic microstructure

K. N. BOŽINOVIĆ et al.: PROPERTIES OF SN-BI ALLOYS Hem. Ind. 75 (4) 227-239 (2021)
237
containing a mixture of (Sn) and (Bi) solution phases. Measured hardness values of the investigated Sn-Bi alloys were
considerably higher than those of pure constitutive metals, Sn and Bi.
Using the optimized thermodynamic data from literature, a Sn-Bi phase diagram has been constructed. Furthermore,
the phase transition temperatures, obtained by the DSC analysis, were compared to those in the phase diagram, and a
good agreement was observed. Values of thermal diffusivity and thermal conductivity decreased with increasing the Bi
content. The specific heat capacity also decreased with the increase in the Bi content and slightly increased with the
increase in temperature. This work, focused on the investigation of thermal properties, hardness measurements and
microstructure characterization of Sn-Bi alloys with different composition, provides a more detailed and attentive
contribution to the general knowledge of this system.
Acknowledgements: The research presented in this paper was done with the financial support of the Ministry of Education, Science and Technological Development of the Republic of Serbia, within the funding of the scientific research work at the University of Belgrade, Technical Faculty in Bor, according to the contract under the registration number 451-03-9/2021-14/200131.
REFERENCES
[1] Frongia F, Pilloni M, Scano A, Ardu A, Cannas C, Musinu A, Borzone G, Delsante S, Novakovic R, Ennas G, Ennas. Synthesis and melting behaviour of Bi, Sn and Sn–Bi nanostructured alloy. J. Alloys Compd. 2015; 623: 7-14. https://doi.org/10.1016/j.jallcom.2014.08.122
[2] Ren G, Wilding I, Collins M. Alloying influences on low melt temperature SnZn and SnBi solder alloys for electronic interconnections. J. Alloys Compd. 2016; 665: 251-260. https://doi.org/10.1016/j.jallcom.2016.01.006
[3] Zhang X. P, Yu C. B, Zhang Y. P, Shrestha S, Dorn L. Processing treatment of a lead-free Sn–Ag–Cu–Bi solder by rapid laser-beam reflowing and the creep property of its soldered connection. J. Mater. Process. Technol. 2007; 192: 539-542. https://doi.org/10.1016/j.jmatprotec.2007.04.072
[4] Kanlayasiri K, Ariga T. Physical properties of Sn58Bi–xNi lead-free solder and its interfacial reaction with copper substrate. Mater. Des. 2015; 86: 371-378. https://doi.org/10.1016/j.matdes.2015.07.108
[5] Sun H, Li Q, Chan Y. A study of Ag additive methods by comparing mechanical properties between Sn57. 6Bi0. 4Ag and 0.4 wt% nano-Ag-doped Sn58Bi BGA solder joints. J. Mater. Sci.: Mater. Electron. 2014; 25: 4380-4390. https://doi.org/10.1007/s10854-014-2177-7
[6] Silva B, Garcia A, Spinelli J. Complex eutectic growth and Bi precipitation in ternary Sn-Bi-Cu and Sn-Bi-Ag alloys. J. Alloys Compd. 2017; 691: 600-605. https://doi.org/10.1016/j.jallcom.2016.09.003
[7] Abtew M, Selvaduray G. Lead-Free Solders in Microelectronics. Mater. Sci. Eng. 2000; 27: 95-141. https://doi.org/10.1016/S0927-796X(00)00010-3
[8] Braga M. H, Vizdal J, Kroupa A, Ferreira J, Soares D, Malheiros L. F. The experimental study of the Bi–Sn, Bi–Zn and Bi–Sn–Zn systems. Calphad. 2007; 31: 468–478. https://doi.org/10.1016/j.calphad.2007.04.004
[9] Mokhtari O, Nishikawa H. Correlation between microstructure and mechanical properties of Sn–Bi–X solders. Mater. Sci. Eng. 2016; 651: 831-839. https://doi.org/10.1016/j.msea.2015.11.038
[10] Zhao J, Qi L, Wang X, Wang L. Influence of Bi on microstructures evolution and mechanical properties in Sn–Ag–Cu lead-free solder. J. Alloys Compd. 2004; 375: 196-201. https://doi.org/10.1016/j.jallcom.2003.12.005
[11] Li J, Mannan S, Clode M, Whalley D, Hutt D. Interfacial reactions between molten Sn–Bi–X solders and Cu substrates for liquid solder interconnects. Acta Mater. 2006; 54: 2907-2922. https://doi.org/10.1016/j.actamat.2006.02.030
[12] Shen J, Pu Y, Yin H, Luo D, Chen J. Effects of minor Cu and Zn additions on the thermal, microstructure and tensile properties of Sn–Bi-based solder alloys. J. Alloys Compd. 2014; 614: 63-70. https://doi.org/10.1016/j.jallcom.2014.06.015
[13] Shalaby R. Effect of silver and indium addition on mechanical properties and indentation creep behavior of rapidly solidified Bi–Sn based lead-free solder alloys. Mater. Sci. Eng., A. 2013; 560: 86-95. https://doi.org/10.1016/j.msea.2012.09.038
[14] Miao H, Duh J. Microstructure evolution in Sn–Bi and Sn–Bi–Cu solder joints under thermal aging. Mater. Chem. Phys.. 2013; 71: 255-271. https://doi.org/10.1016/S0254-0584(01)00298-X
[15] Peng Y, Deng K. Fabrication of reduced graphene oxide nanosheets reinforced Sn–Bi nanocomposites by electro-chemical deposition. Compos. Part A Appl. Sci. Manuf. 2015; 73: 55–62. https://doi.org/10.1016/j.compositesa.2015.03.006
[16] Billah M, Chen Q. Thermal conductivity of Ni-coated MWCNT reinforced 70Sn-30Bi alloy. Compos. B. Eng. 2017; 129: 162-168. https://doi.org/10.1016/j.compositesb.2017.07.071
[17] Wang J, Wei H, He P, Lin T, Lu F. Microstructure and mechanical properties of tin-bismuth solder reinforced by aluminum borate whiskers. J. Electron. Mater. 2015; 44: 3872-3879. https://doi.org/10.1007/s11664-015-3896-0
[18] Peng Y, Deng K. Study on the mechanical properties of the novel Sn–Bi/Graphene nanocomposite by finite element simulation. J. Alloys Compd. 2015; 625: 44-51. https://doi.org/10.1016/j.jallcom.2014.11.110

Hem. Ind. 75 (4) 227-239 (2021) K. N. BOŽINOVIĆ et al.: PROPERTIES OF Sn-Bi ALLOYS
238
[19] Lai Z, Ye D. Microstructure and fracture behavior of non eutectic Sn–Bi solder alloys. J. Mater. Sci.: Mater. Electron.2016; 27: 3182-3192. https://doi.org/10.1007/s10854-015-4143-4
[20] Silva B, Reinhart G, Nguyen-Thi H, Mangelinck-Noël N, Garcia A, Spinelli J. Microstructural development and mechanical properties of a near-eutectic directionally solidified Sn–Bi solder alloy. Mater. Charact. 2015; 107: 43-53. https://doi.org/10.1016/j.matchar.2015.06.026
[21] Gao L, Wang J, Lin T, He P, Lu F. Improvement of microstructure and mechanical properties of Sn-58Bi alloy with La2O3. In: 14th International Conference on Electronic Packaging Technology. Dalian, China, 2013, pp. 193-195.
[22] Osório W, Peixoto L, Garcia L, Mangelinck-Noël N, Garcia A. Microstructure and mechanical properties of Sn–Bi, Sn–Ag and Sn–Zn lead-free solder alloys. J. Alloys Compd. 2013; 572: 97-106. https://doi.org/10.1016/j.jallcom.2013.03.234
[23] Guo Q, Zhao Z, Shen C. Comparison study on microstructure and mechanical properties of Sn-10Bi and Sn-Ag-Cu solder alloys and joints. Microelectron Reliab. 2017; 78: 72-79.
[24] Wang Q, Cheng X, Li Y, Yu G, Liu Z. Microstructures and Thermal Properties of Sn–Bi–Zn–Ga Alloys as Heat Transfer and Heat Storage Materials. J. Wuhan Univ. Technol. Mater. Sci. Ed. 2019; 34: 676-683. https://doi.org/10.1007/s11595-019-2103-1
[25] Wang F, Huang Y, ZhangZ, Yan C. Interfacial reaction and mechanical properties of Sn-Bi solder joints. Mater. 2017; 10: 920-936. https://doi.org/10.3390/ma10080920
[26] Hua F, Zequn M, Glazer J. Eutectic Sn-Bi as an alternative to Pb-free solders. In: Proceedings of 48th Electronic Components and Technology Conference. Seattle, Washington, 1998, pp. 277-283.
[27] Dong W, Shi Y, Xia Z, Lei Y, Guo F. Effects of trace amounts of rare earth additions on microstructure and properties of Sn-Bi-based solder alloy. J. Electron. Mater. 2008; 37: 982-991. https://doi.org/10.1007/s11664-008-0458-8
[28] Morando C, Fornaro O, Garbellini O, Palacio H. Thermal properties of Sn-based solder alloys. J. Mater. Sci.: Mater. Electron. 2014; 25: 3440-3447. https://doi.org/10.1007/s10854-014-2036-6
[29] Hu X, Li Y, Min Z. Interfacial reaction and growth behavior of IMCs layer between Sn–58Bi solders and a Cu substrate. J. Mater. Sci.: Mater. Electron. 2013; 24: 2027-2034 https://doi.org/10.1007/s10854-012-1052-7
[30] Manasijević D, Balanović Lj, Ćosović V, Minić D, Premović M, Gorgievski M, Stamenković U, Talijan N. Thermal characterization of the In–Sn–Zn eutectic alloy. Metall. Mater. Eng. 2019; 25: 325-334. https://doi.org/10.30544/456
[31] Marković B, Živković D, Manasijević D, Talijan N, Sokić M, Ćosović V. Phase Equilibria Calculation and Investigation of Hardness and Electrical Conductivity for Alloys in Selected Sections of Bi-Cu-Ni System. J. powder metall. min. 2012; 2:104 https://doi.org/10.4172/2168-9806.1000104
[32] Kroupa A, Dinsdale A, Watson A, Vrestal J, Vízdal J, Zemanova A. The development of the COST 531 lead-free solders thermodynamic database. JOM. 2007; 59: 20-25. https://doi.org/10.1007/s11837-007-0084-6
[33] Cao W, Chen S, Zhang F, Wu K, Yang Y, Chang Y, Schmid-Fetzer R, Oates W. PANDAT Software with PanEngine, PanOptimizer and PanPrecipitation for Multi-Component Phase Diagram Calculation and Materials Property Simulation. Calphad. 2009; 33: 328–342. https://doi.org/10.1016/j.calphad.2008.08.004
[34] Vízdal J, Braga M, Kroupa A, Richter K, Soares D, Malheiros L, Ferreira J. Thermodynamic assessment of the Bi–Sn–Zn System. Calphad. 2007; 31: 438-448. https://doi.org/10.1016/j.calphad.2007.05.002
[35] Parker W, Jenkins R, Butler C, Abbot G. Flash Method of Determining Thermal Diffusivity, Heat Capacity, and Thermal Conductivity. J. Appl. Phys. 1961; 32: 1679-84. https://doi.org/10.1063/1.1728417
[36] Engineering ToolBox, (2005). Thermal Conductivity of Metals, Metallic Elements and Alloys. [online] Available at: https://www.engineeringtoolbox.com/thermal-conductivity-metals-d_858.html. Accessed January 11, 2021.
[37] Indium Corp. Indalloy® 281 Bi-Sn Solder Alloy. http://www.matweb.com/search/datasheet.aspx?matguid=967a4cd7871b46fa9128a29c303cf8be. Accessed January 11, 2021.
[38] ASM Handbook Volume 2. Properties and Selection: Nonferrous Alloys and Special-Purpose Materials. ASM International; 1990.

K. N. BOŽINOVIĆ et al.: PROPERTIES OF SN-BI ALLOYS Hem. Ind. 75 (4) 227-239 (2021)
239
SAŽETAK
Ispitivanje mikrostrukture, tvrdoće i termijskih karakteristika legura u sistemu Sn-Bi
Kristina N. Božinović, Dragan M. Manasijević, Ljubiša T. Balanović, Milan D. Gorgievski, Uroš S. Stamenković,
Miljan S. Marković i Zoran D. Mladenović
Tehnički fakiltet u Boru, Odsek za metalurško inženjerstvo, Univerzitet u Beogradu, Vojske Jugoslavije 12, 19210 Bor, Srbija
(Naučni rad)
Zbog velike toksičnosti olova, bezolovni lemovi postali su glavni fokus elektronske
industrije poslednjih godina. Zbog svojih povoljnih svojstava i niske cene, legure iz
sistema Sn-Bi predstavljaju potencijalnu zamenu za legure Sn-Pb u lemljenju. Jedna
od glavnih prednosti legura iz sistema Sn-Bi su niske temperature topljenja. Legure
iz ovog sistema su takođe veoma atraktivne zbog dobre kompatibilnosti sa
podlogama, niske temperature procesa, visoke pouzdanosti i potencijalne primene
u vidu materijala termičkog sučelja. U ovom radu je urađena karakterizacija
mikrostrukturnih i termijskih karakteristika, kao i merenje tvrdoće sedam Sn-Bi
legura različitog sastava. Strukturna svojstva uzoraka analizirana su optičkom
mikroskopijom i skenirajućom elektronskom mikroskopijom sa energetski
disperzivnom spektrometrijom (SEM-EDS). Toplotna provodljivost uzoraka je
ispitivana ksenon-fleš metodom (engl. xenon-flash method), a temperature faznih
transformacija merene su diferencijalnom skenirajučom kalorimetrijom (engl.
differential scanning calorimetry, DSC).
Ključne reči: strukturna svojstva; lemljenje;
bezolovne lemne legure; toplotna provod-
ljivost

241
Experimental investigation of a one-level eight-channel cyclone-separator incorporating quarter-rings
Aleksandras Chlebnikovas
Research Institute of Environmental Protection, Institute of Mechanical Science, Vilnius Gediminas Technical University, Vilnius, Lithuania
Abstract
The main aim of this investigation was an experimental analysis of the air cleaning efficiency in a mock-up next-generation air cleaning device – one-level 8-channel industrial cyclone-separator with quarter-rings – while changing parameters of the inner structure and the assessment of the effects of dispersion of particulate matter. Therefore, the research was carried out in two stages: the first stage covered the analysis of the efficiency of the multi-channel cyclone with particulate matter of <20 and <50 μm. During the second stage, a cascade impactor was used to measure the particle collection efficiency in the multi-channel cyclone by fractions: PM1, PM2.5 and PM10. Results of the tests with using the cascade impactor were compared to show changes in the PM composition before and after the multi-channel cyclone-separator. According to the obtained experimental data, the one-level 8-channel cyclone-separator collects 70 to 80 % of PM up to 10 μm in size, 45 to 60 % of PM up to 2.5 μm in size and 21 to 25 % of PM up to 1 μm in size.
Keywords: multi-channel cyclone-separator; particulate matter; air treatment; channel; cascade impactor.
TECHNICAL PAPER
UDC: 621.928.93: 614.44-032.1
Hem. Ind. 75 (4) 241-251 (2021)
Available on-line at the Journal web address: http://www.ache.org.rs/HI/
1. INTRODUCTION
Industrial progress is closely related to environmental protection objectives with one of the most important being
treatment of air pollution. Electrostatic and sleeve filters are the most commonly applied devices in world practice due
to high efficiency in removing particulate matter (PM) from the air. However, they are expensive and rather difficult to
maintain [1–4]. Centrifugal filter is a kind of industrial equipment used for gas (air)-PM separation in thermal power
plants, fluidized bed combustion processes, control of air pollution as well as for sorting/sieving materials [5].
Advantages of this filter type include collection and fractional efficiency and low pressure drop [6].
Air treatment facilities are under ongoing development aimed at cleaning the air from increasingly complex chemical
compounds and finer PM, with improved cleaning efficiency and reduced operational costs. The term particulate matter
(PM) refers to diverse tiny particles found, for example, in exhaust emissions and technological process emissions. It is
widely recognized now that fine PM has extremely severe effects on human health. These particles affect lungs and may
have adverse effects on humans of various ages, but primarily on people diagnosed already with lung and heart diseases
[7,8]. It should be also noted that airborne PM can pass through the skin or eye mucous tissues, but most of PM enter
the respiratory system [9]. The smaller is the diameter of the particle, the deeper it settles in the respiratory system. In
addition to the respiratory system, PM affects the cardiovascular system causing various heart diseases. Moreover,
deposition of these pollutants in the lungs creates an additional load on the heart as it tries to compensate for the
reduced oxygen content. Combustion products containing carcinogen benzo[a]pyrene may cause cancer [10]. Likewise,
exposure to PM has been found to be associated with lower body resistance to infection. Pneumoconiosis, a common
and serious lung disease, is caused by inhaling polluted air containing free silica, or SiO2 particles. Pneumoconiosis
remains a severe global public health issue due to lack of PM prevention in the workplace [11]. Free silicon dioxides
Corresponding author: Aleksandras Chlebnikovas, Research Institute of Environmental Protection, Institute of Mechanical Science, Vilnius Gediminas Technical University, Vilnius, Lithuania
E-mail: [email protected]; Tel./Fax: +370 52 74 4726
Paper received: 7 March 2021; Paper accepted: 18 August 2021; Paper published: 31 August, 2021
https://doi.org/10.2298/HEMIND210307024C

Hem. Ind. 75 (4) 241-251 (2021) A. CHLEBNIKOVAS: ONE-LEVEL EIGHT-CHANNEL CYCLONE-SEPARATOR
242
(sand, quartz) not only affect the lung tissue locally, but also have adverse effects on the entire human body causing
functional disorders in the cardiovascular system, central nervous system, etc. Silicosis is a common disease suffered by
people working in dusty conditions [12].
Selection of gas treatment equipment should consider a number of factors such as physical/ chemical characteristics
of polluted gas and characteristics and contents of gaseous pollutants and PM. Complex pollution of dusted gases
requires the use of multistage treatment systems, including dry and wet cleaning devices, which increases capital and
operating costs [17, 18]. Apparatus for complex purification of off gases operates in the regime of developed turbulence
and is a promising tool for solving this problem [13,14].
Cyclones have been so far some of the most popular devices used for removing PM from air. The reason is a simple
structure, low cost and easy operation of these devices. Cyclones are recommended for gas pre-treatment, while the
secondary treatment phase usually involves other air treatment devices [15–17] collecting particles smaller than 20 μm.
Multi-stage air treatment systems, however, are more complex and expensive [18]. Analysis of PM separation principles
shows that for intensification of the dust collection process in gasPM systems, the use of centrifugal and vortex inter-
actions in fluid flows are the most effective. PM is affected by inertial and centrifugal forces, which significantly exceed the
force of gravity. Devices with a regular movable nozzle are an example of vortex interactions of fluid flows. Packing bodies
are mounted on flexible strings at fixed steps in vertical and radial directions in the contact zone [14]. Wet-based cyclone
design is less implemented due to production of mud or sludge with small particle size (less than 50 μm) and high mass
concentration. The conventional hydrocyclone has a poor separation effect in gases with high concentrations of fine
particles [19].
Cyclones are incomparable in terms of the price and simplicity of their structure and operation. Due to the specific
structure without any movable parts or filtering surfaces that would require regular maintenance, resulting in
comparatively small aerodynamic resistance and high efficiency, cyclones are likely to remain competitive in the modern
market of air cleaning systems for a long time [20].
Operation of a usual cyclone is based on the widespread principle of separating PM by centrifugal forces created by
the turbulent airflow within the equipment shell. The efficiency of such cyclones ranges between 75 and 85 %, for
particles larger than 20 μm in size. However, this is not sufficient in terms of the objectives laid down in the EU Directive
2008/50/EC on ambient air quality and cleaner air for Europe [21–25].
On the other hand, multi-channel cyclones can remove very small particles down to 2 μm in size from contaminated
airflows. These devices present a possible alternative to more expensive air treatment technologies that are currently
in use. In addition, application of a multi-channel cyclone-separator for air cleaning is possible in environments with
high temperatures and humidity [26,27].
One of the problems in calculation of the efficiency of a cyclone is the effect of flow dynamic parameters. The flow,
which is turbulent in the cyclone body, may be laminar at the entrance. Laminar flow operating parameters have a
greater influence on the cyclone efficiency than those of turbulent flow. In small cyclones, it is extremely difficult to
predict the effect of flow regime on efficiency and pressure losses compared to the effects of geometrical parameters.
It is even more complicated to identify parameters and evaluate a two-phase flow movement in a multi-channel cyclone,
as flow dynamics is turbulent and involves such aspects as a swirling movement and backflow circular areas [28,29].
Closed-vortex-flow theory has so far not been able to identify features of a number of flow fields. In addition,
assessment based on the turbulence isotropy assumption cannot be adapted to quickly swirling flows [30].
The purpose of this research was an experimental analysis of the air cleaning efficiency in a mock-up next-generation
air cleaning device, a one-level 8-channel industrial cyclone with quarter-rings. The aim was to vary the parameters of
the inner structure as well as to assess the effects of PM dispersion on the cleaning efficiency. Therefore, the research
was carried out in two stages: the first stage focused on the efficiency analysis of the multi-channel cyclone-separator
with PM of <20 and <50 μm in size. During the second stage, a cascade impactor was used to measure the particle
collection efficiency in the multi-channel cyclone-separator by fractions: PM1, PM2.5 and PM10.

A. CHLEBNIKOVAS: ONE-LEVEL EIGHT-CHANNEL CYCLONE-SEPARATOR Hem. Ind. 75 (4) 241-251 (2021)
243
2. RESEARCH METHODS
The mock-ups of one-level, two-level and three-level next-generation multi-channel cyclones have been made at the
Research Institute of Environmental Protection of Vilnius Gediminas Technical University (VilniusTech) (Fig. 1) [31,32].
The contaminated air 1 enters the cyclone and passes through channels 3 where particulate matter is collected and
then deposited in the collection hopper 4. The purified air 2 exits the cyclone. The use of two-level or three-level
cyclones is reasonable in cases of cleaning larger quantities of contaminated air. The novelty of the mock-ups of the
multi-channel cyclone-separator provides the opportunity to clean larger quantities of contaminated air by using a
smaller cross-section of the cyclone. For this purpose, the number of cyclone levels is increased while the cross-section
of the separation chamber remains the same.
Multi-channel cyclones work by centrifugal forces with the additional filtration effect (Fig. 2). The two-phase airflow
tangentially passes through the inlet 1 and enters the first channel of the cyclone 8 which is restrained by the peripheral
wall and the first quarter-ring 6. Moving gradually in the radial direction, the flow is cleaned from PM by centrifugal
force. The flow proceeding to the following channels encounters the quarter-ring wall and is distributed into two flows:
peripheral and transitional. The peripheral flow passes to repeated filtration in the cyclone, while the transitional flow
goes to the following channel towards the axis of the device and the outlet of the cyclone. In this way, the airflow is
distributed evenly in channels with different curves and is filtered through the spaces between the quarter-rings.
Turbulent flow is dependent on the fluid velocity, where the turbulent intensity influences the effect of centrifugation
while the additional filtration effect occurs in the flow distribution zone. The overall effect of the forces is precipitation
of PM at the bottom of the multi-channel cyclone and the particles settle into a conical settlement hopper. Having
passed through all six channels of the cyclone, cleaned air flows out of the system through the outlet 4. The dusty air is
filtered in the active zone of each channel space. It is a difficult task to investigate dependencies of aerodynamic and
separation efficiency parameters, as the flow is influenced by many other parameters (specific geometry, distribution
of feedback flows into channels (peripheral and transitional), emission and properties of particulate matter) in addition
to its three-dimensional nature [11].
Figure 1. Basic diagram of a one-level multi-channel cyclone-separator: 1– contaminated air, 2 – purified air, 3 –channels of the cyclone, 4 – dust collection hopper
Figure 2. Basic diagram of the 8-channel cyclone-separator: 1 – dusty air flow inlet, 1.1-8.3 – sampling points, 2 – inlet, 3 – cyclone separation chamber, 4 – tre-ated airflow outlet, 5 – segmental ring slots, 6 – curvilinear quarter-rings with a 5° opening angle of plates, 7 – opened plates of quarter-rings, 8 – cyclone channels
Experimental tests were carried out to determine the overall air cleaning efficiency and the efficiency of PM removal
by fractions using a cascade impactor system.
The basic diagram of the experimental stand is illustrated in Figure 3. Experimental tests for airflow velocities and
pressures were conducted within a system of air ducts with sampling points positioned along a straight section of the
steady gas flow so to avoid airflow obstructions (valves, elbows, fans, etc.) and in 6 mm gaps made inside the structure
of the cyclone, and in the cyclone lid.

Hem. Ind. 75 (4) 241-251 (2021) A. CHLEBNIKOVAS: ONE-LEVEL EIGHT-CHANNEL CYCLONE-SEPARATOR
244
Figure 3. Basic diagram of the experimental stand: 1 – multi-channel cyclone-separator, 2, 9 – isokinetic combined probe of the cascade impactor, 3, 10 – velocity measurement and concentration measurement by using the gravity method, 4 – vacuum pump, 5 – collected PM tank, 6, 16 – supporting structure, 7 – aspirator, 8 – drying tower with the moisture trap, 11 – pressure measurement by a differential pressure gauge DSM-1, 12 – portable computer, 13 – fan control unit, 14 – PM inlet, 15 – centrifugal fan.
To perform the experimental tests, a pre-measurement procedure for airflow velocities and pressures consisted of
the following steps: connecting the fan, setting the appropriate airflow velocity, setting the lever of the control unit to
the appropriate position, connecting measuring devices.
Airflow pressure in the air ducts was measured before the tangential inlet and behind the cyclone by using a
differential pressure gauge DSM–1 (JSC Teltonika, Lithuania, range of measurements: 0–20.000 kPa; deviation ±5 Pa);
flow velocity was measured by using the instrument TESTO–400 (Testo SE & Co. KGaA, Germany, range of velocity
measurements: 1–30 m s-1, deviation ±0.05 m s-1); aerodynamic resistance was measured by using a Pitot-Prandtl tube
(range of velocity measurements: 5−30 m s-1, deviation ±0.05 m s-1).
The airflow within the cyclone-separators is ensured by the 7.5 kW fan system (MBRU 450 T2, CASALS Ventilacion
air industrial SLU, Spain, 7.5 kW; rated capacity – 7.5 m³ s-1). Airflow velocities within the device are analyzed as a
function of different airflow rates produced by the fan. Air velocities are measured at three points in each channel of
the multi-channel cyclone-separator: at the inlet, in the middle and at the end of the channel. To achieve the maximum
accuracy, measurements at each point are taken: 2 cm from the top of the channel, in the middle of the channel and
2 cm from the bottom of the channel.
Airflow velocities and aerodynamic resistance were measured three times in one-level, two-level and three-level multi-
channel cyclonic system in order to avoid systemic errors and to reduce the error of the mean of the three results obtained.
During the experiment first stage, air cleaning efficiency is measured by using the gravity method. During the first expe-
rimental stage, PM of two sizes (sieved up to 20 µm and up to 50 µm) was used. The tests involved granite, glass, wood
ash and wood particulate matter at the mean inlet concentrations of 250, 270, 260 and 235 mg m-3, respectively. The mean
size of particulate matter sieved up to 50 µm was equal to: granite – 13.7 µm, glass – 10 µm, wood ash – 14.9 µm and
wood – 16 µm. The mean size of particulate matter sieved up to 20 µm was equal to: granite – 8.9 µm, glass – 7.6 µm,
wood ash – 10.8 µm and wood – 11.0 µm. The particles are blown in the direction of the flow into the system air duct
behind the fan. The appropriate velocity and flow rate of the air to be treated are set in the control unit prior to
introducing PM.
Concentration of PM in the air ducts is measured in straight sections with steady gas flow so that to avoid flow
obstructions (valves, elbows, fans, etc.): the measurement (sampling) point is preceded by a part of the straight duct 5-6
duct diameters in length and followed by the straight duct 3-4 diameters in length. The PM concentrations are measured
three times in the system in order to avoid systemic errors and to reduce the error of the mean of the three results
obtained. Locations of the sampling points in the experimental stands of one-level, two-level and three-level cyclone-
separators are presented in Figures 2 and 3. During the second experimental stage, PM of smaller sizes (sieved up to 20 µm)
was used, aerodynamic parameters (gas flowrate) and PM composition were the same as for the first stage.
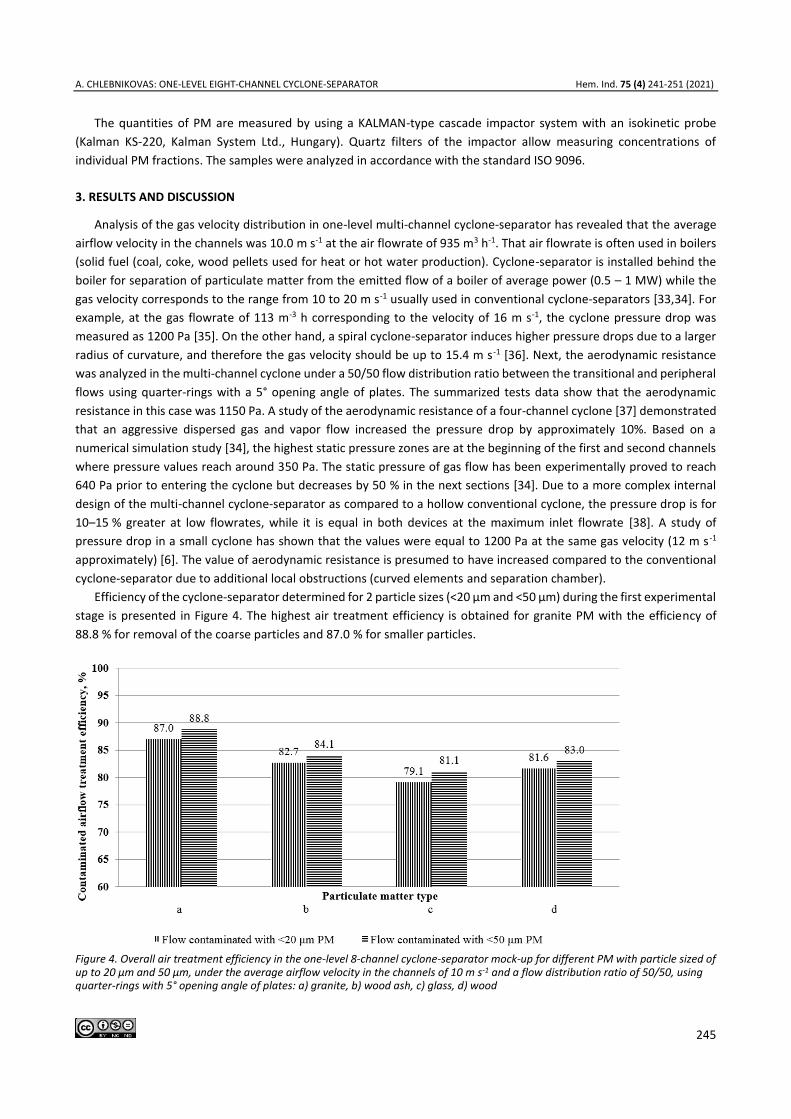
A. CHLEBNIKOVAS: ONE-LEVEL EIGHT-CHANNEL CYCLONE-SEPARATOR Hem. Ind. 75 (4) 241-251 (2021)
245
The quantities of PM are measured by using a KALMAN-type cascade impactor system with an isokinetic probe
(Kalman KS-220, Kalman System Ltd., Hungary). Quartz filters of the impactor allow measuring concentrations of
individual PM fractions. The samples were analyzed in accordance with the standard ISO 9096.
3. RESULTS AND DISCUSSION
Analysis of the gas velocity distribution in one-level multi-channel cyclone-separator has revealed that the average
airflow velocity in the channels was 10.0 m s-1 at the air flowrate of 935 m3 h-1. That air flowrate is often used in boilers
(solid fuel (coal, coke, wood pellets used for heat or hot water production). Cyclone-separator is installed behind the
boiler for separation of particulate matter from the emitted flow of a boiler of average power (0.5 – 1 MW) while the
gas velocity corresponds to the range from 10 to 20 m s-1 usually used in conventional cyclone-separators [33,34]. For
example, at the gas flowrate of 113 m-3 h corresponding to the velocity of 16 m s-1, the cyclone pressure drop was
measured as 1200 Pa [35]. On the other hand, a spiral cyclone-separator induces higher pressure drops due to a larger
radius of curvature, and therefore the gas velocity should be up to 15.4 m s -1 [36]. Next, the aerodynamic resistance
was analyzed in the multi-channel cyclone under a 50/50 flow distribution ratio between the transitional and peripheral
flows using quarter-rings with a 5° opening angle of plates. The summarized tests data show that the aerodynamic
resistance in this case was 1150 Pa. A study of the aerodynamic resistance of a four-channel cyclone [37] demonstrated
that an aggressive dispersed gas and vapor flow increased the pressure drop by approximately 10%. Based on a
numerical simulation study [34], the highest static pressure zones are at the beginning of the first and second channels
where pressure values reach around 350 Pa. The static pressure of gas flow has been experimentally proved to reach
640 Pa prior to entering the cyclone but decreases by 50 % in the next sections [34]. Due to a more complex internal
design of the multi-channel cyclone-separator as compared to a hollow conventional cyclone, the pressure drop is for
10–15 % greater at low flowrates, while it is equal in both devices at the maximum inlet flowrate [38]. A study of
pressure drop in a small cyclone has shown that the values were equal to 1200 Pa at the same gas velocity (12 m s -1
approximately) [6]. The value of aerodynamic resistance is presumed to have increased compared to the conventional
cyclone-separator due to additional local obstructions (curved elements and separation chamber).
Efficiency of the cyclone-separator determined for 2 particle sizes (<20 μm and <50 μm) during the first experimental
stage is presented in Figure 4. The highest air treatment efficiency is obtained for granite PM with the efficiency of
88.8 % for removal of the coarse particles and 87.0 % for smaller particles.
Figure 4. Overall air treatment efficiency in the one-level 8-channel cyclone-separator mock-up for different PM with particle sized of up to 20 μm and 50 μm, under the average airflow velocity in the channels of 10 m s-1 and a flow distribution ratio of 50/50, using quarter-rings with 5° opening angle of plates: a) granite, b) wood ash, c) glass, d) wood

Hem. Ind. 75 (4) 241-251 (2021) A. CHLEBNIKOVAS: ONE-LEVEL EIGHT-CHANNEL CYCLONE-SEPARATOR
246
Granite PM has the highest specific gravity as compared to the other investigated materials. The obtained overall air
treatment efficiency was 9–11 % higher than the results reported for a dust collector of a cyclonic-vortex dry-type plant
at an optimal velocity of 5 m s-1 [14]. In a previous research study [39] the optimal velocity for a conventional cyclone
design with multi inlet guide channels is reported to be 8.8 m s-1. The separation efficiency for particles of up to 2 μm in
size was 71.2 % and for smaller particles up to 1 μm in size was 54.6 % [39]. In the present study, the air treatment
efficiencies for wood ash PM were lower by 4.7 and 4.3% for larger (up to 50 µm) and smaller (up to 20 µm) particles,
respectively, as compared to those obtained for granite PM.
It can be also presumed that the greater efficiency in collecting granite PM is obtained due to higher levels of particle
agglomeration and autohesion. This leads to more intensive cohesion (autohesion) of granite PM and settlement into
the cyclone hopper as compared to wood ash PM. These phenomena are highly affected by the humidity of gas which
can decrease the separation level [37].It is also presumed that the difference in the efficiency of collecting PM of
different particle sizes is insignificant. Therefore, it can be concluded that filtration is efficient at a 50/50 distribution
ratio between the transitional and peripheral flows, with particular effects on small particles of up to 20 μm in size.
Further tests with wood PM demonstrated 83.0 and 81.6 % treatment efficiency for PM <50 and <20 μm, respectively.
Deposition of wood PM is influenced by the irregular shape, surface structure and cohesion (autohesion) of the particles.
Difference in the efficiency of collecting wood ash PM and wood PM is only 1.1 %. Wood PM has a low specific gravity
and is therefore the most difficult to be settled by centrifugation. However, tests with wood PM have shown that the
particles get electrostatically charged the most intensively as compared to the other PM. The charged particles shrink,
become heavier and thus easier to settle in. Tests with glass PM demonstrated lower treatment efficiencies as compared
to those of the other PM being 81.1 and 79.1 % for particles of up to 50 and 20 μm, respectively, which is 7.7 and 7.9 %
lower as compared to granite particles, respectively. Removal of glass PM from air is presumably impeded by
comparatively low particle aggregation. It is assumed that glass particles are not so sticky as wood or wood ash particles,
so that the agglomeration is lower resulting in a lower treatment efficiency in the cyclone-separator.
During the second experimental stage, the cascade impactor system was used to analyze the efficiency of the multi-
channel cyclone mock-up for removing fine particles of <1, <2.5 and <10 μm in size of different material types (Fig. 5).
Figure 5. Relationship between air treatment efficiency (Y axis) and PM type and size: a) granite; b) glass; c) wood ash; d) wood
The efficiency of removing granite PM of up to 10 μm was 77.4 %, representing the highest value among other
obtained values similarly as in the cases of larger particles. The pre-cyclone fraction of granite PM10 was 56.4 %, while

A. CHLEBNIKOVAS: ONE-LEVEL EIGHT-CHANNEL CYCLONE-SEPARATOR Hem. Ind. 75 (4) 241-251 (2021)
247
after exiting the cyclone, this percentage decreased by approx. 4.4-fold to 12.8 %. The efficiency of removing finer
particles of up to 2.5 μm in size was lower by approx. 1.4-fold compared to that for PM10 amounting to 56 %. Based on
the pre-cyclone distribution of PM, it can be concluded that collection of granite PM2.5 is by approx. 1.8-fold lower as
compared to that of PM10. The treatment efficiency for ultra-fine particles of up to 1 μm in size was 24.2 % representing
the sharpest decrease in efficiency. As compared to the removal efficiencies of PM10 and PM2.5 μm, the removal
efficiency of PM1 is lower by 3.2- and 2.3-fold, respectively. The PM1 fraction in the inlet gas was lower than those of
PM10 and PM2.5 amounting to 9.4 % and decreasing to 7.1 % after exiting the cyclone. It can be presumed that due to
the low concentration, the finer particles failed to agglomerate and thus were more difficult to collect than larger
particles. While moving together with the other particles, PM2.5 and PM10 are likely to be additionally influenced by
autohesion: the particles are bonded together and settle down under a greater force of gravity acting on the aggregates.
Similar removal efficiency trends were found for all the other PM types being the highest for PM10 and the lowest
for PM1. Also, in all cases the initial fraction of the largest particles was the highest, while that of the smallest particles
was the lowest. The obtained efficiency of removing wood ash PM and wood PM is more or less the same. Similarly,
research on fly ash particles (density of 1989.7 kg m-3) from a coal-fired boiler in a power plant showed separation
efficiencies in a cyclone of 62 % for PM10 and 11 % for PM1 [35]. The average difference in removal efficiency between
granite PM and wood ash/wood PM is approx. 7 %. The poorest results have been obtained in the case of removing
ultra-fine particles of up to 1 μm in size. For removal of submicron particles higher-efficiency devices can be used such
as venturi scrubbers, baghouse filters and electrostatic precipitators. In an interesting attempt to improve cyclone
efficiency an electric field-assisted cyclone was designed, which achieved high removal efficiencies of ultra-fine particles
up to 0.3 m in size [40].
The analysis of the influence of PM size on the air treatment efficiency shows that the multi-channel cyclone collects
up to 80 % of PM10. This is seen as good efficiency. However, the collecting efficiency for small particles is significantly
lower, i.e. up to 60 % for PM2.5 and up to 25 % for PM1. These values are not high. Yet, it is important to note that other
cheap alternative technologies capable of collecting fine and ultra-fine particles do not exist. The air treatment efficiency
of the multi-channel cyclone could be improved by increasing the number of cyclonic levels.
An improved design of a cyclone-separator with secondary inlets and a more complicated design is presented in
literature. Results in that study obtained based on the numerical modeling predicted the effectiveness of trapping PM10
of 72 %, which was on average 1.7-fold higher than that predicted for PM2.5 amounting to 41.3 %. These results were
confirmed, experimentally, reaching average trapping efficiencies of 46.9 and 78 % for particulate matter of 2.5 μm and
10 μm in diameter, respectively [34].
Generally, a strong correlation is observed between the particle collection efficiency and the size distribution (Fig 6),
as already demonstrated in work of Majoral and co-workers [41].
Figure 6. Dependence of air treatment efficiency (Y axis) on PM dispersion (X axis)

Hem. Ind. 75 (4) 241-251 (2021) A. CHLEBNIKOVAS: ONE-LEVEL EIGHT-CHANNEL CYCLONE-SEPARATOR
248
Although a good collection efficiency of small PM was achieved by the 8-channel cyclone mock-up it is important to
note that the post-cyclone size distribution of PM is different. This should be considered with regards to the air
treatment efficiency. The results of tests with the cascade impactor were compared to show changes in the PM
distribution before and after the multi-channel cyclone (Figs. 7-10).
a) b)
Figure 7. Granite PM distribution before (a) and after (b) in one-level 8-channel cyclone-separator mock-up
a) b)
Figure 8. Wood ash PM distribution before (a) and after (b) in one-level 8-channel cyclone-separator mock-up
a) b)
Figure 9. Wood PM distribution before (a) and after (b) in one-level 8-channel cyclone-separator mock-up
a) b)
Figure 10. Glass PM distribution before (a) and after (b) in one-level 8-channel cyclone-separator mock-up

A. CHLEBNIKOVAS: ONE-LEVEL EIGHT-CHANNEL CYCLONE-SEPARATOR Hem. Ind. 75 (4) 241-251 (2021)
249
As it is known, air treatment is more efficient in collecting larger particles. Therefore, the percentage of small PM
fractions is higher after the treatment. For example, the overall decrease in fractions of PM ranging from 10 to 20 μm
in size was in the range 16-21 %, while the fractions of finer PM increased for: 5-9 % for PM 2.5-10 μm in size, 6-10 %
for PM 1-2.5 μm in size and 2-5 % for PM1. These results point to future development of air treatment technologies
capable of more efficient collection of fine and especially ultra-fine PM.
4. CONCLUSION
Based on the results obtained in this investigation, the following conclusions were drawn.
One-level 8-channel cyclone-separator collects 70 to 80 % of PM up to 10 μm in size, 45 to 60 % of PM up to 2.5 μm
in size and 21 to 25 % of PM up to 1 μm in size.
Experimental studies have shown that the aerodynamic resistance of gas flow reaches 1150 Pa at the gas flow rate
of up to 950 m3 h-1. A chain of eight sequentially arranged cyclone-separator channels, local obstructions and additional
intense mixing and turbulence in the inlet and outlet are the main zones of the pressure drop.
The highest efficiency was achieved in removing high-density granite PM of fine dispersion. The analysis of PM of up
to 20 μm in size showed 77.4 % efficiency under a 50/50 flow distribution ratio between the transitional and peripheral
flows when the average air velocity was 10 m s-1.
At the same conditions the treatment efficiency for medium-density PM (glass) of up 20 μm in size was 67.8 % those
for wood ash and wood PM were 70.3 and 70.4 %, respectively.
The separation efficiency of PM up to 2.5 μm in size strongly decreased as the particle density is lower. It could be
assumed that the increase in the number of levels in the multi-channel cyclone-separator will improve the air treatment
efficiency. However, this solution requires the increased gas flow rate and energy needs due to the increased
aerodynamic resistance.
Overall, the multi-channel cyclone-separator was shown to be efficient in removing particulate matter down to
20 μm in size from air. To clean smaller particles, it is reasonable to use other air treatment technologies.
REFERENCES
[1] Kirsanovs V, Blumberga D, Veidenbergs I, Rochas C, Vigants E, Vigants G. Experimental investigation of downdraft gasifier at various conditions. Energy Procedia. 2017; 128: 332-338 https://doi.org/10.1016/j.egypro.2017.08.321.
[2] Choi HY, Park YG, Ha MY. Numerical simulation of the wavy collecting plate effects on the performance of an electrostatic precipitator. Powder Technol. 2021; 382: 232-243 https://doi.org/10.1016/j.powtec.2020.12.070.
[3] Lee GH, Hwang SY, Cheon TW, Kim HJ, Han B, Yook SJ. Optimization of pipe-and-spike discharge electrode shape for improving electrostatic precipitator collection efficiency. Powder Technol. 2021; 379: 241-250 https://doi.org/10.1016/j.powtec.2020.10.044.
[4] Zhang X, Bo T. The effectiveness of electrostatic haze removal scheme and the optimization of electrostatic precipitator based on the charged properties of airborne haze particles: Experiment and simulation. J Clean Prod. 2021; 288: 125096 https://doi.org/10.1016/j.jclepro.2020.125096.
[5] Gao Z, Wang J, Liu Z, Wei Y, Wang J, Mao Y. Effects of different inlet structures on the flow field of cyclone separators. Powder Technol. 2020; 372: 519-531 https://doi.org/10.1016/j.powtec.2020.06.014.
[6] Fatahian E, Fatahian H, Hosseini E, Ahmadi G. A low-cost solution for the collection of fine particles in square cyclone: A numerical analysis. Powder Technol. 2021; 387: 454-465 https://doi.org/10.1016/j.powtec.2021.04.048.
[7] Joo YS, Kim J, Lee J, Chung I-J. Understanding the link between exposure to fine particulate matter and internalizing problem behaviors among children in South Korea: Indirect effects through maternal depression and child abuse. Health Place. 2021; 68: 102531 https://doi.org/10.1016/j.healthplace.2021.102531.
[8] Cheng J, Ho HC, Webster C, Su H, Pan H, Zheng H, Xu Z. Lower-than-standard particulate matter air pollution reduced life expectancy in Hong Kong: a time-series analysis of 8.5 million years of life lost. Chemosphere. 2021; 272: 129926 https://doi.org/10.1016/j.chemosphere.2021.129926.
[9] Sharma J, Parsai K, Raghuwanshi P, Ali SA, Tiwari V, Bhargava A, Mishra PK. Emerging role of mitochondria in airborne particulate matter-induced immunotoxicity. Environ Pollut. 2021; 270: 116242 https://doi.org/10.1016/j.envpol.2020.116242.
[10] Magee BH, Forsberg ND. Testing the validity of a proposed dermal cancer slope factor for Benzo[a]pyrene. Regul Toxicol Pharmacol. 2021; 120: 104852 https://doi.org/10.1016/j.yrtph.2020.104852.

Hem. Ind. 75 (4) 241-251 (2021) A. CHLEBNIKOVAS: ONE-LEVEL EIGHT-CHANNEL CYCLONE-SEPARATOR
250
[11] Qi X-M, Luo Y, Song M-Y, Liu Y, Shu T, Liu Y, Pang J-L, Wang J, Wang C. Pneumoconiosis: current status and future prospects. Chin Med J (Engl). 2021; 134(8) https://doi.org/10.1097/CM9.0000000000001461.
[12] Liu L. China’s dusty lung crisis: Rural-urban health inequity as social and spatial injustice. Soc Sci Med. 2019; 233: 218-228 https://doi.org/10.1016/j.socscimed.2019.05.033.
[13] Wu X, Wu K, Zhang Y, Hong Q, Zheng C, Gao X, Cen K. Comparative life cycle assessment and economic analysis of typical flue-gas cleaning processes of coal-fired power plants in China. J Clean Prod. 2017; 142: 3236-3242 https://doi.org/10.1016/j.jclepro.2016.10.146.
[14] Torsky A, Volnenko A, Plyatsuk L, Hurets L, Zhumadullayev D, Abzhabparov А. Study of dust collection effectiveness in cyclonic-vortex action apparatus. Technol Audit Prod Reserv. 2021; 1: 21-25 https://doi.org/10.15587/2706-5448.2021.225328.
[15] Shastri R, Brar LS. Numerical investigations of the flow-field inside cyclone separators with different cylinder-to-cone ratios using large-eddy simulation. Sep Purif Technol. 2020; 249: 117149 https://doi.org/10.1080/02726351.2021.1905123.
[16] Oliveira RAF, Guerra VG, Lopes GC. Improvement of collection efficiency in a cyclone separator using water nozzles: A numerical study. Chem Eng Process - Process Intensif. 2019; 145: 107667 https://doi.org/10.1016/j.cep.2019.107667.
[17] Sati V, Kaushik S, Kshetri R, Panwar K, Pandey R. Comparison of a Classical Cyclone Separator and Protruding Surface Cyclone Separator using CFD Software. IOP Conf Ser Mater Sci Eng. 2020; 802: 12008 https://doi.org/10.1088/1757-899X/802/1/012008.
[18] Honda A, Okuda T, Nagao M, Miyasaka N, Tanaka M, Takano H. PM2.5 collected using cyclonic separation causes stronger biological responses than that collected using a conventional filtration method. Environ Res. November 2020: 110490 https://doi.org/10.1016/j.envres.2020.110490.
[19] Zhang Y, Yang M, Jiang L, Wang H, Xu J, Yang J. High Concentration Fine Particle Separation Performance in Hydrocyclones. Minerals. 2021; 11: 307 https://doi.org/10.3390/min11030307.
[20] Ma L, Ingham DB, Wen X. Numerical modelling of the fluid and particle penetration through small sampling cyclones. J Aerosol Sci. 2000; 31(9): 1097-1119 https://doi.org/10.1016/S0021-8502(00)00016-1.
[21] Seposo X, Arcilla ALA, De Guzman JGN, Dizon EMS, Figuracion ANR, Morales CMM, Tugonon PKA, Apostol GLC. Ambient air quality and the risk for Chronic Obstructive Pulmonary Disease among Metro Manila Development Authority traffic enforcers in Metro Manila: An exploratory study. Chronic Dis Transl Med. February 2021 https://doi.org/10.1016/j.cdtm.2021.01.002.
[22] Guo W, Chen L, Fan Y, Liu M, Jiang F. Effect of Ambient Air Quality on Subjective Well-Being among Chinese Working Adults. J Clean Prod. February 2021: 126509 https://doi.org/10.1016/j.jclepro.2021.126509.
[23] Thomas J, Jainet PJ, Sudheer KP. Ambient air quality of a less industrialized region of India (Kerala) during the COVID-19 lockdown. Anthropocene. 2020; 32: 100270 https://doi.org/10.1016/j.ancene.2020.100270.
[24] Singh S. Ambient air quality examination of a cement industry: A case study. Mater Today Proc. 2020; 37: 3635-3638 https://doi.org/10.1016/j.matpr.2020.09.782
[25] Garg A, Kumar A, Gupta NC. Comprehensive study on impact assessment of lockdown on overall ambient air quality amid COVID-19 in Delhi and its NCR, India. J Hazard Mater Lett. 2021; 2: 100010 https://doi.org/10.1016/j.hazl.2020.100010.
[26] Li Y, Qin G, Xiong Z, Ji YF, Fan L. The effect of particle humidity on separation efficiency for an axial cyclone separator. Adv Powder Technol. 2019; 30(4): 724-731 https://doi.org/10.1016/j.apt.2019.01.002.
[27] Wang J, Duan X, Wang S, Wen J, Tu J. Experimental and numerical investigation on the separation of hydrophilic fine particles using heterogeneous condensation preconditioning technique in gas cyclones. Sep Purif Technol. 2021; 259: 118126 https://doi.org/10.1016/j.seppur.2020.118126.
[28] Li W, Hu Z, Pei Z, Li S, Chan PW. A discussion on influences of turbulent diffusivity and surface drag parameterizations using a linear model of the tropical cyclone boundary layer wind field. Atmos Res. 2020; 237: 104847 https://doi.org/10.1016/j.atmosres.2020.104847.
[29] Parvaz F, Hosseini SH, Elsayed K, Ahmadi G. Influence of the dipleg shape on the performance of gas cyclones. Sep Purif Technol. 2020; 233: 116000 https://doi.org/10.1016/j.seppur.2019.116000.
[30] Thorn R. Reengineering the cyclone separator. Met Finish. 1998; 96(8): 30 https://doi.org/10.1016/s0026-0576(98)80589-8.
[31] Baltrėnas P, Chlebnikovas A. Investigation into the Aerodynamic Parameters of the Recently Designed Two-Level Cylindrical Multi-Channel Cyclone-Separator. Sep Sci Technol. 2015; 50(8) https://doi.org/10.1080/01496395.2014.967774.
[32] Baltrėnas P, Chlebnikovas A. Cylindrical multi-level multi-channel cyclone-filter. European Patent. 2019: 1-15.
[33] El Ashry Y, Abdelrazek AM, Elshorbagy KA. Numerical and experimental study on the effect of solid particle sphericity on cyclone pressure drop. Sep Sci Technol. 2018; 53(15): 2500-2516 https://doi.org/10.1080/01496395.2018.1458878.
[34] Baltrėnas P, Crivellini A, Leonavičienė T, Chlebnikovas A. Investigation on particulate matter and gas motion processes in the advanced multi-channel cyclone-separator with secondary gas inlets. Environ Eng Res. 2022; 27(1): 200550 https://doi.org/10.4491/eer.2020.550.
[35] Wang C, Zhang Y, Dong K, Wang B, Li S, Xin R, Jiang Y. Enhanced collection of fine particles in a cyclone using ultrasonic vapor with surfactants. Adv Powder Technol. 2020; 31(6): 2207-2214 https://doi.org/10.1016/j.apt.2020.03.015.
[36] Vaitiekūnas, P., Petraitis, E., Venslovas, A., & Chlebnikovas A. Air stream velocity modelling in multichannel spiral cyclone separator. J Environ Eng Landsc Manag. 2014; 22(3): 183-193 https://doi.org/10.3846/16486897.2014.931283.

A. CHLEBNIKOVAS: ONE-LEVEL EIGHT-CHANNEL CYCLONE-SEPARATOR Hem. Ind. 75 (4) 241-251 (2021)
251
[37] Baltrėnas P, Chlebnikovas A. The investigation of the structure and operation of a multi-channel cyclone, separating fine solid particles from an aggressive dispersed gas and vapour flow. Powder Technol. 2018; 333: 327-338 https://doi.org/10.1016/j.powtec.2018.04.043.
[38] Shaw B, Faulkner W. Efficiency and pressure drop of cyclones across a range of inlet velocities. Appl Eng Agric. 2006; 22 https://doi.org/10.13031/2013.20191.
[39] Nassaj OR, Toghraie D, Afrand M. Effects of multi inlet guide channels on the performance of a cyclone separator. Powder Technol. 2019; 356: 353-372 https://doi.org/10.1016/j.powtec.2019.08.038.
[40] Jeon H, Park S. Separation of fine particles with electrostatically enhanced cyclone. Sep Sci Technol. 2020; 55(3): 575-582 https://doi.org/10.1080/01496395.2019.1567553.
[41] Furuuchi M, Kanaoka C, Shimizu Y. Separation Characteristics of a Supersonic Virtual Impactor.; 2004 https://doi.org/10.11491/apcche.2004.0.36.0.
SAŽETAK
Eksperimentalno istraživanje jednostepenog osmokanalnog industrijskog ciklonskog separatora
Aleksandras Chlebnikovas
Environmental Protection Institute, Institute of Mechanical Science, Vilnius Gediminas Technical University, Vilnius, Lithuania
(Stručni rad)
Glavni cilj ovog istraživanja je eksperimentalna analiza efikasnosti prečišćavanja vaz-
duha u prototipu uređaja nove generacije - jednostepenom osmokanalnom industrij-
skom ciklonskom separatoru - uz promenu parametara unutrašnje strukture i određi-
vanje efekata disperzije čestica. Stoga je istraživanje sprovedeno u dve faze: prva je
obuhvatala analizu efikasnosti višekanalnog ciklona sa česticama <20 i <50 μm. Tokom
druge faze, kaskadni impaktor je korišćen za određivanje efikasnosti izdvajanja čestica
u višekanalnom ciklonu po frakcijama: PM1, PM2.5 i PM10. Upoređeni su rezultati
ispitivanja sa kaskadnim impaktorom kako bi se pokazale promene u sastavu čestica
pre i posle primene višekanalnog ciklonskog separatora. Prema dobijenim
eksperimentalnim podacima, osmokanalni ciklonski separator na jednom nivou
sakuplja 70 do 80 % čestica veličine do 10 mikrona, 45 do 60 % čestica veličine do 2,5
mikrona i 21 do 25 % čestica veličine do 1 mikrona.
Ključne reči: višekanalni ciklonski separator;
čestice; tretman vazduha; kanal; kaskadni
impaktor.


253
MC2021 ended successfully: The limits of the measurable - exciting developments and latest trends in light and electron microscopy CONFERENCE REPORT
Kerstin Aldenhoff
Science journalist, Dresden, Germany
From dancing atoms to fundamental questions about the limits of the measurable - after five exciting conference days on current developments and latest trends in light and electron microscopy, the Microscopy Conference MC2021 (https://www.microscopy-conference.de/) came to a successful close. Microscopy societies from 11 countries - Austria, Croatia, Czech Republic, Germany, Hungary, Italy, Serbia, Slovakia, Slovenia and Switzerland -, organised the digital Joint Meeting of Dreiländertagung and Multinational Congress on Microscopy. Led by the congress presidents Johannes Bernardi, Michael Stöger-Pollach and Stefan Löffler, Vienna University of Technology, MC2021 offered a comprehensive scientific exchange with a diverse program.
New research results were presented in eight thematic sessions on life sciences, materials science, and instrumentation and methods by experts from all fields. As the only major electron microscopy meeting in Europe this year, MC2021 offered especially for the so-called "early-stage researchers" (ESRs) best opportunities for an international scientific exchange to develop, network and gain new insights. A large number of younger researchers took the opportunity to present their work with exciting talks.
Keywords: life sciences; materials science; instrumentation and methods.
BOOK AND EVENT REVIEW
UDC: 005.745:543.456:537.533.35
Hem. Ind. 75 (4) 253-256 (2021)
Available on-line at the Journal web address: http://www.ache.org.rs/HI/
INTERDISCIPLINARITY AND EXCELLENT QUALITY OF THE MC2021
Special emphasis was placed on applications and developments of various microscopy techniques in the field of light
and electron microscopy, which have made incredible progress in the last 20 years and have become indispensable in
countless areas of research. Johannes Bernardi emphasised the high value of the new spectacular improvements and
findings in these techniques. "The creativity of science opens new doors to better understand life, but also inorganic
matter," said Michael Stöger-Pollach. The combination of the fields of life sciences, materials sciences and methods
technology formed the major common focus. Stefan Löffler referred to the broad interdisciplinary set-up of MC2021
with excellent quality in all areas, which could not have been achieved otherwise.
The presentations showed that the trends of breakthrough improvements in electron microscopy in the field of
imaging and analytics, as well as progressive automation, continued. It was clear that development of even more
efficient and faster detectors and measurement methods also continues, and further advances are taking place in terms
of method development in electron beam phase manipulation and the flexibility of available electron energies.
NEW DEVELOPMENTS IN LIFE SCIENCES AND MATERIALS SCIENCE
In the field of life sciences, the focus was on new developments in cryo-microscopy and in correlative techniques
that combine different measurement methods on different size scales to better understand living nature with the help
of this special technology. A wide range of interesting content was covered - from sample preparation and aspects of
basic research to diagnostic and therapeutic applications in medicine and biotechnology.
In the field of materials science, the focus was not only on material-related topics but also on a wide variety of
analytical methods. In the presentations it became clear how much "in-situ" and "in-operando" applications have gained
Corresponding author: Kerstin Aldenhoff, Science journalist, Dresden, Germany
E-mail: [email protected]
Hem. Ind. 75 (4) 253-256 (2021) K. ALDENHOFF: MICROSCOPY CONFERENCE MC2021
254
in importance. For example, gas or liquid cell imaging and spectroscopic techniques have been shown to enable the
investigation of chemical reactions and processes in near real time.
MC2021 The Congress presidents, Johannes Bernardi, Michael Stöger-Pollach and Stefan Löffler (Foto CONVENTUS)
Another focus was on investigations using a wide variety of analytical techniques, as well as micro- and nano-mechanical methods to study structure-property relationships in new functional materials. Sessions on energy storage, catalysts and semiconductors, and the study of metals and ceramics were well attended.
ELECTRON MICROSCOPY IN MEDICAL RESEARCH
Presentations on cryo-microscopy capabilities and applications of machine learning and automation highlighted the
essential role that high-resolution electron microscopy plays in medical research. Fascinating applications of high-
resolution light microscopy were also presented in this area by labelling proteins genetically or marking them with dyes
and tracking them in the organism. With regard to the fight against the coronavirus, it was fascinating to learn what an
essential contribution high-resolution electron microscopy could make to the success of vaccine development. Thereby,
understanding the complex structure of the viral envelope was crucial.
New developments in nanoscience were another conference focus. In addition to interesting presentations on the
generation and investigation of nanostructures that can be produced by chemical processes or specifically by means of
focused ion beams, research on 2D materials with special electrical properties, e.g., anisotropic dielectric properties,
was presented.
DISCUSSION ON THE EU PROJECT "HORIZON EUROPE”
A special highlight was the high-level panel discussion on the EU project "Horizon Europe", in which new research
infrastructures were presented. Internationally renowned experts shed light on the new opportunities offered by the
European Union's planned research framework program to address global challenges for electron microscopy. Based on
the analysis of previous projects, the question on how the electron microscopy community in Europe can organise broad
access to its know-how was discussed. In this way, it will continue to play a crucial role in issues such as climate change
adaptation, healthy oceans, climate-neutral cities, healthy nutrition and the fight against cancer.

K. ALDENHOFF: MICROSCOPY CONFERENCE MC2021 Hem. Ind. 75 (4) 253-256 (2021)
255
HIGH-PROFILE PLENARY SPEAKERS AND AWARD CEREMONIES
Conference highlights were exciting presentations on important current topics. Renowned plenary speakers such as
Sandra van Aert (University of Antwerp), Sarah Haigh (University of Manchester), Stefan Raunser (MPI Dortmund),
Andreas Rosenauer (University of Bremen), Holger Stark (MPI Göttingen) and Marc Willinger (ETH Zurich) were able to
inspire the participants with a broad range of topics in excellent presentations - from dancing atoms to fundamental
questions about where the limits of the measurable lies.
A special highlight was the award of the internationally renowned Ernst Ruska Prize, awarded every two years, to
Julia Mahamid (EMBL, Heidelberg) and to David A. Muller (Cornell University, USA), honoring the two scientists for their
outstanding achievements in the field of electron microscopy. Joachim Mayer (RWTH Aachen and ER-C Jülich) was
honored with the "Harald Rose Distinguished Lecture" award.
OUTLOOK 2023
Following the diverse exchange between young colleagues, experienced scientists and companies, the conference
leaders were convinced that with MC2021 the successful series of joint conferences could be continued even during the
pandemic. The next insights into the exciting properties of the world of atoms and molecules can be expected at the
MC2023 Annual Meeting in Darmstadt from February 26 to March 2, 2023.

256
MC 2021 je uspešno završen: Granice merljivog - uzbudljiv razvoj i najnoviji trendovi u svetlosnoj i elektronskoj mikroskopiji
Kerstin Aldenhoff
Naučni novinar, Dresden, Nemačka
Izvod
Nakon pet uzbudljivih konferencijskih dana o razvoju i najnovijim trendovima u svetlosnoj i elektronskoj
mikroskopiji, obuhvatajući teme od atoma “koji plešu” do fundamentalnih pitanja o granicama
merljivog, konferencija o mikroskopiji MC2021 (https://www.microscopy-conference.de/) uspešno je
završena. Društva za mikroskopiju iz 11 zemalja - Austrije, Hrvatske, Češke, Nemačke, Mađarske, Italije,
Srbije, Slovačke, Slovenije i Švajcarske organizovala su digitalni združeni sastanak: Dreilandertagung
(Konferencija tri zemlje) i Multinacionalni kongres o mikroskopiji. Predsednici kongresa bili su Johanes
Bernardi, Majkl Stoger-Polak i Stefan Lofler sa Tehnološkog univerziteta u Beču. MC2021 je ponudio
sveobuhvatnu razmenu naučnih informacija kroz raznovrsni program. Stručnjaci iz različitih oblasti
predstavili su nove rezultate istraživanja u okviru osam tematskih sesija o prirodnim naukama, nauci o
materijalima i razvoju opreme i metoda. Kao jedini veliki sastanak na temu elektronske mikroskopije u
Evropi ove godine, MC2021 je bio posebno važan za istraživače na početku karijere, takozvane ""Early-
Stage Researchers (ESRs)", nudeći najbolje mogućnosti za međunarodnu razmenu naučnih informacija
u cilju razvoja, umrežavanja i sticanja novih saznanja. Veliki broj mlađih istraživača iskoristio je priliku da
predstavi svoja istraživanje kroz usmene prezentacije.
Ključne reči: prirodne nauke; nauka o materijalima; instrumenti i metode
PRIKAZ KNJIGA I DOGAĐAJA
UDK:005.745:543.456:537.533.35
Hem. Ind. 75 (4) 253-256 (2021)
Na temu


![Over 18 (75-minute version) [Transcript]](https://img.dokumen.tips/doc/110x75/6318740fcf65c6358f01fd1f/over-18-75-minute-version-transcript.jpg)